Embed Size (px)
Citation preview

Proceedings of the 22nd Southern African Transport Conference (SATC2003) 14 � 16th July 2003ISBN Number: 0-958-46096-5 Pretoria, South AfricaProceedings produced by: Document Transformation Technologies Conference Organised by: Conference Planners
TRAFFIC CALMING ON HIGHER ORDER ROADS: A CASESTUDY
Labuschagne, F.J.J.1 and Kruger, T.J.2
1Transportek, CSIR, P.O. Box 395, Pretoria, 00012Mouchel Consulting Ltd, West Hall, Parvis Road, Surrey UK KT14 6EZ.
E-mail: [email protected] and [email protected]
ABSTRACT
The use of the more commonly used traffic calming measures, such as speed humps and mini-circles, has mostly been restricted to Class 4 and 5 streets. Inappropriate high speeds and driverbehaviour, which cannot fully be addressed by law enforcement, do however also often occur onhigher order roads. Application of traffic calming measures suitable to higher order urban roads oreven rural roads is not addressed in existing guideline documents, and research and investigationinto this issue is required.
The case of Tafelberg Road in Middelburg, Mpumalanga has offered the opportunity to investigateand implement traffic calming on a higher order road. The two-lane road is constructed to very highstandards, almost completely straight over more than 2 kilometres, with pavement width in excessof 11 metres and wide verges. Tafelberg Road has multiple functions in the road network - it has athrough traffic function, connecting regional roads, while also serving as an access road for anadjacent residential area. The road also carries relative high volumes of heavy vehicle traffic. Highspeeds and perceived high noise levels lead to numerous complaints from the public.
This paper describes the traffic study that was done to quantify problem areas, including speed,volumes and noise measurements and the methodology used to identify and refine measures toaddress the problem and an after study that was done, and its results.
The implemented solutions consisted of introducing median islands, road signs and a series ofchicanes. A design speed of 80km/h was applied to all elements. The measures were aimed atreducing the sense of openness created by the road environment, which encouraged high speeds.The principal objective was to reduce speed and effect constant speeds, i.e. not to encourage speedchange cycles, which are often associated with conventional traffic calming measures, and whichcould be a source of increased noise levels.
Preliminary results indicate that the project was highly successful in reducing speed, speeddifferential and noise levels, without noticeably inhibiting mobility.
1. INTRODUCTION
CSIR, Transportek has been appointed by the City Engineer of Middelburg to conduct a trafficassessment of Tafelberg Road, to recommend measures to address specific problem areas beingexperienced on the road and, subsequently, to design such measures and determine its effectiveness.
The primary problems were high speeds on the road and high traffic noise levels.

Tafelberg Road forms a link between Roads P30-1, in the west and P154-3 (R555) in the east,passing on the southern side of the Aerorand residential area, as shown on Figure 1 - Location Plan.The two-lane road is constructed to very high standards, almost completely straight over more than2 kilometres, with pavement width in excess of 11 metres and with wide verges.
Problem areas reported include:! A relatively recent increase in traffic volumes, coinciding with, and resultant from the extension
of Tafelberg Road to the west to form a link between Roads P30-1 (Fontein Street Extension)and P154-3 (R555, Kerk Street Extension, �the Witbank Road�) and tolling of the N4 Freeway;
! High speed on the road;! A large percentage of heavy vehicles using the road;! High noise levels emanating from the road;! Accidents occurring on the road.
2. METHODOLOGY AND SURVEYS
Data gathering for the investigation stage of the study included:! Automatic traffic counts, recording volumes, speed, and headways and classifying vehicles,
during the week of 11 March 2002. Results of a similar survey during February 2001 were alsoavailable;
! Turning movement counts, by class of vehicle, at the intersections of Tafelberg Road withRoads P30-1 and P154-3 for twelve-hour periods during the same week in March 2002;
! A noise survey, recording noise emanating from the road;! Visual inspection of the road section, including recording of a video of the road section travelled
in both directions, and all relevant details;! Obtaining design plans of western section of the road and measuring the cross section and
longitudinal section of the �old� section.
It was concluded that the root causes of the perceived problems on Tafelberg Road can be related tothe role of the road in the network and the design standards that were used:! Tafelberg Road fulfils a dual function. It acts as a collector/access for Aerorand, classified as a
Class 4 Road in terms of the Guidelines for the Provision of Engineering Services andAmenities in Residential Townships. The road also fulfils an Arterial function (Class 2 Road) asa connector between roads P154-3(R555) and P31-1.
! The generous pavement width, long straight section, and wide open verges correspond to a highdesign speed and give drivers a sense of a high order road, encouraging higher speeds.
There appears to be no feasible approach to reduce traffic volumes and/or heavy vehicle volumes onthe road section, as there are no alternative routes that could fulfil its function in the network
In considering measures to address the identified problem areas it was clear that �conventional�traffic calming, e.g. circles, speed bumps, raised intersections, would not be applicable to the roadsection under consideration, as, amongst others:! Guidelines indicate that such measures should be restricted to Class 5 roads only;! Such measures are not effective in reducing speeds of both light and heavy vehicles;! It will be contra-productive, especially in terms of noise levels, to reduce speed drastically and
have vehicles accelerating again.
Based on the observations and much consideration, it was concluded that the traffic calmingmeasures should be aimed at reducing the sense of openness created by the high design standards,without creating a road where changes in speed through acceleration and deceleration cycles areencouraged. The aim was thus to reduce speeds and maintain constant speed.

This was done by:! Introducing median islands at both ends of the road section to form �gateways�;! Creating chicanes at spacings of approximately 300 metres. The designs of these were for a
design speed of 80 km/h, with tapers of no less than 1:15 and 4 metre wide lanes;! Painting right turn lanes at four T-intersections on the road. These are approximately midway
between chicanes;! Introducing a speed limit of 70 km/h;! Installing warning signs and information signs at the ends of the road section.
The median islands and chicanes were first packed out without installation and tested by drivingthrough them at various speeds by the researchers. Simultaneously continuous electronic speedobservations were recorded.
MIDDELBURG
(FONTEIN STREET)T
O N
4 &
BE
TH
AL
TO
N4
MIDDELBURG
(KERK STREET)
MHLUZI
WITBANK
P145-3 (R555)
FUTURE ROAD
P30-1
KILO STREET
TAFELBERG ROAD
LOCALITY PLAN - FIG. 1
When the design was considered appropriate, the islands were constructed and signs and paintedmarkings completed.
During October 2002, electronic counts and speed observations were made and another noisesurvey undertaken.
3. GEOMETRIC FEATURES OF THE ROAD SECTION
The whole section of Tafelberg Road was a two-lane single carriageway road. The paved widthbetween barrier kerbs of the road is 11,81 m, with painted shoulder lines, and varying shoulderwidth of 1,3 to 1,6 metres. The lane widths varied accordingly between 4,25 and 4,64 metres. Theverges are wide, approximately 12 m on the southern side, and 8,7 m on the side of the residentialarea. On the northern side small trees, lampposts and occasional road signs are found on the verge.The building line on the northern side was estimated at 5m.
Three local access streets serving the Aerorand Residential area intersects with Tafelberg Road atT-intersection spaced 400 to 500 metres apart.

Approximately 100m east from the intersection with P154-3, Tafelberg Road has a 370m longcurve to the left with radius 300m. The super-elevation on the curve is approximately 3%, whichcorresponds with the required superelevation for speeds of less than 60 km/h. At the south-westerncorner of the Aerorand residential area, there is a horizontal kink of 2,5° in the road. Past Aerorandthe road is straight over a distance of nearly 2,5 km.
With the intersection of P154-3 as Chainage 0, Table 1, shows the vertical characteristics.Chainages and distances are approximate, as the information had to be collated from varioussurveys and cadastral information, where some minor discrepancies were found. Except for thesuper-elevation of the horizontal curve, all design features of the road correspond to a design speedin excess of 100 km/h.
Table 1. Vertical alignment.
Gradient Length of constantgradient
Chainage atBVC
Length of VerticalCurve K-value
-1,47% 205m 205m 390m 130
-4,48% 511m 1 106m 300m 40
+2,98% 162m 1 572m 110m 108
+1,51% 778m 2 460m 382m 135
-1,29%
4. TRAFFIC VOLUMES
The automatic counts indicated Average Daily Traffic volumes in a weekday of approximately3 100 vehicles per day, with high percentage medium and heavy vehicles, ranging between 12%and 25%, depending on the time of day. Figure 2 shows traffic pattern of Tuesday 12 March 2002,which was considered a typical weekday.
Figure 2. Total traffic by direction � Weekday.

Heavy vehicle traffic appears to be fairly constant during a weekday between 06:30 and 19:00.There are some heavy vehicle traffic (roughly 20 to 30 vehicles per hour using the road between19:00 and 21:00.
The Sunday pattern was also analysed for application in the analysis of noise levels, discussedbelow. The traffic pattern for Sunday 17 March 2002 is shown on Figure 3.
Figure 3. Total traffic by direction � Sunday.
Traffic volumes on a Sunday are, as expected, much lower than on a weekday, fairly constantduring the day with a peak of approximately 100 vehicles/hour. Heavy vehicle traffic is relativelyhigh on the Sunday, ranging between 7% and 19% of total traffic volumes.
In no case were the volumes such that it noticeably influenced speed, i.e. operations could beconsidered as free flowing.
The volumes observed in October 2002 showed a change from those recorded in March, withweekday volumes down and weekend volumes higher. No explanation for this can readily beoffered. Given the relative low traffic volumes under consideration it can likely be ascribed tonormal variation.
The turning movement counts indicated that the primary origin-destinations of passenger vehiclesare:! P154-3 (R555) direction Witbank and the N4,! to and from the Mhluzi area,! Fontein Street to and from the central part of Middelburg,! Kilo Street to and from east.
The primary origin-destination pairs for heavy vehicles are:! P154-3 (R555) direction Witbank and the N4,! Kilo Street to and from the east.
5. NOISE MEASUREMENTS
Noise measurements were taken on Wednesday 13 March 2002, between 07:30 and 10:30 at threelocations along the road section.

These were calibrated with actual traffic volumes, percentage heavy vehicles and speeds actuallyrecorded during the same period. From this a model was constructed to estimate noise levels for anytime during a weekday and a Sunday using the procedure described by Code SABS 0210:1996, fortraffic volumes and speeds actually recorded.
The measurements were taken at a distance of 12m from the centreline of the road, on the northernside. The noise levels were adjusted to reflect an estimated noise level at the building line, 5 metersbeyond the road reserve boundary, without considering screening effects. The screening effect ofexisting boundary walls were also adjusted for, assuming a continuous 1,8m high garden wall onthe property boundary, to emulate levels as perceived by residents whose properties front on theroad. Almost all of the residences fronting on Tafelberg Road have such walls on the boundary.
Code SABS 0103:1994 provides typical rating levels of ambient noise for six types of districts.None of these districts can be directly applied to Aerorand and Tafelberg Road, but it wasconsidered that a combination of two of the district types could be applicable, namely:
District b): Suburban district with little road traffic;District d): Urban district with some workshops, with business premises, and with main roads.
To incorporate the three factors which vary by time of day, namely traffic volumes, percentageheavy vehicles and speed, the weekday was divided into nine time regimes where these variablescan be considered similar during that period, e.g. 00:00 to 06:00, 06:00 to 07:00, etc. SimilarlySunday was divided into eight regimes.
Noise measurements were again taken at exactly the same positions in October 2002 and a newprediction model constructed. The new measurements resulted in much the same prediction modelobtained before. The results of the noise measurements are discussed in Section 8 below.
6. SPEED CHARACTERISTICS BEFORE TRAFFIC CALMING
Traffic speeds during the week in March 2002, when the surveys were undertaken, were affected byvarious activities on the road. These activities included placing of new loops for the automaticcounting station, personnel present on the road conducting the inspection and counts, visibility ofthe sound detection devices (the microphones had to be placed at a fixed distance from the road andwhere screening effects of walls does not have an effect, so it was not possible to hide theequipment) and speed checking by the Traffic Department. Speed observation taken during thisweek was not considered representative of a �normal� day.
Speed data from an electronic count by the Town Engineer�s Department from February 2001 werealso available. This was taken to reflect a �normal� situation, for before the traffic calming wasimplemented. The speed data recorded during this period is summarised in a frequency distributiondiagram shown on Figure 4. As can be seen the speeds were in general unacceptably high, with highaverages, high 85th percentile speeds, and disconcertingly numbers of very high speeds observed.
To illustrate the effect of the visible presence on the road the frequency distribution for a weekdayin March 2002 is shown on Figure 5. It is clear that speeds were noticeably lower than on a�normal� day represented by the observations made in February 2001.
To further illustrate this point speed data from 13 and 15 March 2002, for the time 09:00 to 11:00are shown on Figure 6. This was the period when the noise surveys were made on 13 March. Asshown, the speeds, while the noise surveys were in progress, were 5 to 15 km/h lower than duringthe same time on another day in the same week.
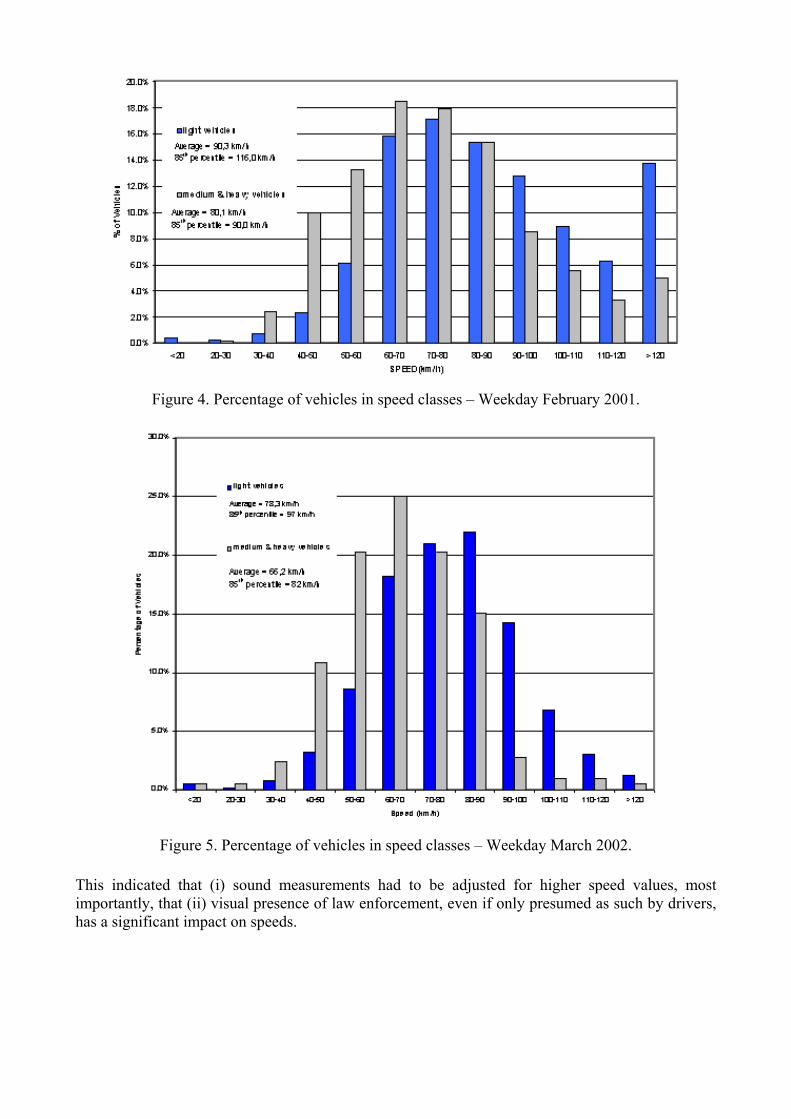
Figure 4. Percentage of vehicles in speed classes � Weekday February 2001.
Figure 5. Percentage of vehicles in speed classes � Weekday March 2002.
This indicated that (i) sound measurements had to be adjusted for higher speed values, mostimportantly, that (ii) visual presence of law enforcement, even if only presumed as such by drivers,has a significant impact on speeds.

Figure 6. Comparison of speeds: 09H00 to 11H00, 13 and 15 March 2002.
Figure 7.

7. DESIGN FEATURES OF THE TRAFFIC CALMING MEASURES
The median islands and chicanes were designed consistent with a 80 km/h design speed. Tapers ofno less than 1:15 were used and lane widths of 4 metres or wider were maintained. Paintedshoulders of no less than 0,5 metres were used. The typical designs of the median islands andchicanes are shown on Figure 7.
8. SPEED, NOISE AND VOLUME OBSERVATIONS AFTER THE INTRODUCTION OFTHE TRAFFIC CALMING MEASURES
Table 2 below summarises the characteristics of vehicle speeds as observed on weekdays inFebruary 2001, March 2002 and October 2002.
Table 2. Comparison of speed observations before and after the traffic calming.
February 2001 March 2002 October 2002
Average Speed (km/h) 85,1 76,8 61,6
85th Percentile Speed (km/h) 113,0 95,0 75,8
Standard Deviation of Speed (km/h) 26,0 18,4 17,9
It is clear that the desired effect of reducing speed has been achieved. This is also clear whenFigure 8 is compared to Figure 4. It would, nevertheless, still be desirous to have the speeds, whichhas an 85th percentile above the speed limit, even lower.
Figure 8. Percentage of vehicles in speed classes � Weekday October 2002.
Table 3 below shows the estimated noise levels through a weekday and a Sunday , based on thespeed characteristics observed in February 2001, March 2002 and October 2002 and also shows thevalues for Districts b) and d) from SABS 0103,1994.

Table 3. Noise values before and after the traffic calming and SABS guidelines.
The decreases in noise levels reflected by the numbers expressed in decibels level A (dBA) may notappear to be significant. It should however be considered that these are on a logarithmic scale. Adecrease of noise level by 1,5 dBA (e.g. from 49,5 to 48,0 dBA or 52,6 to 51,1 dBA) reflects adecrease of more than 40% in actual noise intensity.
SABS 0103: 1994: the Code of Practice for the measurement and rating of environmental noisewith respect to annoyance and to speech communication provides a Table 2 (an extract is givenbelow) with typical ambient noise levels for six types of districts. Under normal conditions of trafficand human activity, and in the absence of abnormal extraneous noise sources like a nearby airportor railway line, the indicated ambient noise levels would be expected for each specified period,when evaluated over the full period.
Taking cognisance of Tafelberg Road, the values given for district type (d would be expected in theadjacent residential properties (without any specific traffic noise screening). In the completeabsence of a road like Tafelberg Road, where only local residential traffic would be experienced inthe area, the values for district type (b would be expected.
Time of Day Noise level; adjusted for building line and 1,8m gardenwall (dBA)
SABS 0103for District b
(dBA)
SABS 0103for District d
(dBA)Weekday February 2001 March 2002 October 2002
00:00 - 06:00 49,1 48,1 47,3 40 50
06:00 - 07:00 55,4 54,6 54,0 50 60
07:00 - 08:00 55,4 54,8 54,2 50 60
08:00 - 09:00 55,1 53,9 53,1 50 60
09:00 - 16:00 52,6 51,9 51,1 50 60
16:00 - 17:00 55,0 54,4 53,7 50 60
17:00 - 18:00 52,6 53,1 52,8 50 60
18:00 - 20:00 52,3 52,4 51,4 45 55
20:00 - 00:00 49,5 48,5 48,0 45 55
Sunday February 2001 March 2002 October 2002
00:00 - 06:00 44,5 43,2 42,7 40 50
06:00 - 08:00 49,3 49,1 49,1 45 55
08:00 - 11:00 49,3 48,6 48,9 45 55
11:00 - 16:00 49,7 49,1 49,0 45 55
16:00 - 18:00 50,3 49,9 50,1 45 55
18:00 - 20:00 48,3 47,8 48,0 45 55
20:00 - 22:00 47,1 47,0 46,8 45 55
22:00 - 00:00 43,6 43,5 43,1 45 55

7. ACCIDENT DATA
Some accident data were available. Accident frequency and variation in type were such that it wasnot possible to relate accidents to any specific character of the road. In general, it can be stated thatspeed reduction and measures to capture driver attention (e.g. channelisation) work positivelytowards reducing accident frequency and specifically severity.
8. VISUAL INSPECTION
The following were observed during site inspections in October 2002 and March 2003.! There was some slight damage to almost all traffic signs mostly apparently being hit by
overhangs of heavy vehicles. The signs damaged were mostly on the median islands at theeastern end, where median is on a curve.
! The signs on the centre islands and chicane islands in the middle portion had the less damage,except for the island signs at the low point in the road section, presumably where speeds are thehighest.
! There were no damage, and very little tyre marks, on the kerbing forming the chicane andmedian kerbing, indicating that the design standards are appropriate.
! Some signs appeared to be damaged but closer inspection showed that these were installedskew!
! The kerbstones were painted red and white instead of the preferred black and white.! In some cases old paint markings were painted over with black instead of being scratched off.
This can be expected to cause future problems.! Where old paint lines were scoured out, the debris was not removed completely, but left on the
surface, partly obscuring painted islands.
Extract from SABS 0103:1994, Table 2: Typical rating levels for outdoor ambient noise indistricts, in dBA relative to 20 x 10-8 pascal
Type of district Day-time Evenings,Weekends
Night-time
a) Rural districts 45 dBA 40 dBA 35 dBA
b) Suburban districts with little road traffic 50 dBA 45 dBA 40 dBA
c) Urban districts 55 dBA 50 dBA 45 dBA
d) Urban districts with some workshops, with businessproperties, and with main roads
60 dBA 55 dBA 50 dBA
e) Central business districts 65 dBA 60dBA 55 dBA
f) Industrial districts 70 dBA 65 dBA 60 dBA
NOTES
1. Day-time: 06:00 to 18:00
Evening: 18:00 t0 24:00
Night-time: 12:00 to 18:00
Weekends: Saturday 12:00 to 18:00
Sunday 06:00 to 18:00
2. If the measurement time interval is considerably shorter than the reference timeintervals, significant deviations from the values given in the table may result.

The conclusion is that this type of traffic calming, as all types of traffic calming, requiresextraordinary attention to design and standard of implementation, as well as more than the regularmaintenance of signs and markings.
9. CONCLUSIONS
It is concluded that the measures implemented were successful to reduce speeds, encourage relativeconstant speeds and �removing� excessively high speeds. This positively reflected on reducingnoise levels.
The amount of damage to signs is disconcerting. Consideration may be given to using smaller signsand increasing widths of painted shoulders, which will require narrower lanes e.g. 3,5 metres wide.
Average and 85th percentile speeds are, however, still higher than would be desired.
The effect of visible enforcement, even if only perceived as such by drivers has been clearlyillustrated. It is also recommended that speed checking be increased and automatic, continuous andvisible speed checking, which has been effective in several places in the country and internationally,be seriously considered.
The known concept, namely that traffic calming measures require meticulous attention to detail indesign, attention to correct implementation, and more extensive maintenance efforts than othersigns and markings, was clearly illustrated.
10. ACKNOWLEDGEMENTS
The contributions of the following persons are gratefully acknowledged:Dr SC van As (Traffic Engineering Consultant), Mr OC Schulze (Design and drawings),Mr J Rossouw (Acoustic specialist), Mr W Austin, Mr J Knoetze and Ms A Lawerence (MiddelburgMunicipality).