Embed Size (px)
Citation preview

Traffic Accidents a Product of Socio-Psychological ConditionsAuthor(s): Harold RossSource: Social Forces, Vol. 18, No. 4 (May, 1940), pp. 569-576Published by: Oxford University PressStable URL: http://www.jstor.org/stable/2570635 .
Accessed: 17/06/2014 06:18
Your use of the JSTOR archive indicates your acceptance of the Terms & Conditions of Use, available at .http://www.jstor.org/page/info/about/policies/terms.jsp
.JSTOR is a not-for-profit service that helps scholars, researchers, and students discover, use, and build upon a wide range ofcontent in a trusted digital archive. We use information technology and tools to increase productivity and facilitate new formsof scholarship. For more information about JSTOR, please contact [email protected].
.
Oxford University Press is collaborating with JSTOR to digitize, preserve and extend access to Social Forces.
http://www.jstor.org
This content downloaded from 185.2.32.110 on Tue, 17 Jun 2014 06:18:10 AMAll use subject to JSTOR Terms and Conditions

GOVERNMENT, POLITICS, CITIZENSHIP 569
TRAFFIC ACCIDENTS A PRODUCT OF SOCIO-PSYCHOLOGICAL CONDITIONS
HAROLD ROSS
Michigan State College and Michigan State Police
T HE pronounced cultural effects of the increased mobility produced by the motor vehicle have been
analyzed in detail by social scientists. McKenzie has pointed out the develop- ment of regions. Independent towns and villages and also rural territory have become a part of this enlarged city comn- plex.1 Formerly isolated villages are becoming urbanized by the acceptance of city traits. Mobility of residence has increased so rapidly that some social scientists consider the problem of trailer- reared children.
That social scientists have considered these effects of mobility first is natural. However the motor vehicle has produced another effect, the traffic accident. That it is an important one is obvious from the fact that in I937 motor vehicle accidents caused 39,500 deaths, I,360,000 injuries, and an economic loss of $I,700,000, ooo.oo.2 That it is a subject for social scientists is not so obvious. In this paper evidence will be presented to show that basically the traffic accidentproblem is not a physical or educational one in the sense that defective brakes and people not knowing to stop at stop signs are a cause of accidents. Instead facts will be presented to show that accidents are a result of attitudes and behavior patterns, and consequently are a socio-psychological problem. This is not to deny that de- fective brakes, improper lights, and a host of other factors cause accidents. How-
ever it will be shown that these obvious physical factors cause only a small per- centage of collisions and that most accidents can be attributed to socio- psychological factors.
The first public reaction to traffic accidents has been a mass of legislation and consequent official action. As a
TABLE I
UNITED STATES MOTOR VEHICLE DEATHS,
I9Z3-I937*
RATE PER
YEAR NUMBER OF MOTOR VEHICLE 10,000 DEATHS REGISTRATION MOTOR
VEHICLES
192.3 I8,394 I5,2.00,000 I2S. I
I92.4 I9, 380 I7,800,000 IO. 9 192.5 2.I, 877 2.0I,00,000 IO. 9
I92.6 23,43 I 2.2. IOO, OO io. 6
I 92.7 2.5,796 23,2.00,000 II.I
I92.8 2.7,996 2.4,600,ooo II.4 I 92.9 3 I, 2.I5 2.6,700,000 II.7
I930 32.,92-9 2.6,6oo,ooo I2S.4
I93I 33,675 25,900,000 I3.0 1932. 29, 45 I 4,I00,000 I 2. 2.
I933 3 I 363 2.3,8oo,000 13.2.
I934 36, IOI 2.5,I00,000 I4.4
I935 36,369 2.62.0oo,ooo I3.9
I936 38,089 2.82oo0ooo I3-s
I937 39,500 2.7,700,000 I3.3
* Accident Facts-I938 Edition, National Safety Council, Inc., p. 70.
result in most states the driver, the motor vehicle, and the use of the highway, are closely regulated. Just what the annual traffic toll would have been without these safety measures can only be guessed- but it is certain that it would be far greater that it is today. Nevertheless, despite these efforts, the accident record has maintained its high level as Table i
shows.
1 R. D. McKenzie, The Metropolitan Community,
p. 6. 2 Accident Facts-x938 Edition, National Safety
Council, Inc.
This content downloaded from 185.2.32.110 on Tue, 17 Jun 2014 06:18:10 AMAll use subject to JSTOR Terms and Conditions

570 SOCIAL FORCES
The significant index is the death rate per IO,OOO motor vehicles. The correla- tion between motor vehicle registration and the death rate is + .93, almost perfect. This means that the death rate has in- creased with auto registration. This is borne out by the facts that the annual average death rate for the years I923-
I937 is I2.3 per IO,OOO motor vehicles, and that for all the years since I933, the rate has been above that average.
These figures in no way minimize the efforts of those working in the traffic
field, but merely emphasize the magni- tude of the problem. In traffic safety work, stress continues to be placed on the physical causes of accidents because such causes are more easily comprehended and regulated. If the accident causes are traced back to the attitudes and the be- havior patterns of the motor vehicle operators, the problem assumes far greater proportions because obviously it is much more difficult to correct an attitude than a road defect.
Of course which approach to the prob- lem will give the solution can only be determined by an analysis of the types
and causes of accidents. This analysis must be based on an examination of acci- dent reports. Many cities and states have thousands of such reports. That these records are not ioo percent accurate this writer knows well enough, but they are the best records available. Records from seven Michigan cities on 58,55o traffic accidents will be used to determine the frequency of the various causes of acci- dents. These causes will be classified and considered in this order: (i) defects in the motor vehicle; (2) defects in the
highway; (3) defective drivers-(a)
physical defects, (b) accident-prone drivers; (4) the average driver.
A fair example of an accident caused by a motor vehicle defect would be the case of a driver failing to make a curve due to defective steering apparatus and conse- quently crashing into a tree. Also de- fective equipment may be a contributory cause of accidents. The frequency with which accidents of these types occur can be determined by the frequency with which automobiles involved in accidents are reported to be in a defective condition.
TABLE 2.
CONDITION OF VEHICLES INVOLVED IN TRAFFIC ACCIDENTS FOR SEVEN MICHIGAN CITIES DURING I938*
CITY TOTAL DEFECTIVE IMPROPER DEFECTIVE OTHER NO NOT VEEICLES BRAKES LIGHTS STEERING DEFECTS DEFECTS STATED
0 2.
I282 Jackson. .... 634 5 ? 12. 5 3 3 8 Kalamazoo. ..... 379 7 2. I 4 330 35 Grand Rapids .................... I9, 567 62 zo 6 9 I9,468 2.
Flint.1. .. . . .. .. . . .. . . . . .. .. I4,o56 54 22 6 8 I3,943 2.3
Highland Park ................... 966 i8 I 4 I 873 69 Battle Creek....... 358 6 I O 3 309 39 Detroit. 75, ii8 I,793 73 86 35I 67, 589 5,2.2.6
Totals.0.. III78 1,945 II9 105 3 88 I03,045 5,476
Percentages .................... 100 1.75 0.1I 0.09 0.35 92.77 4-93
* These data obtained directly from the city sunmaries. In this and other tables, the information was not perfectly comparable in all cases.
This content downloaded from 185.2.32.110 on Tue, 17 Jun 2014 06:18:10 AMAll use subject to JSTOR Terms and Conditions
GOVERNMENT, POLITICS, CITIZENSHIP
Information on this point can be obtained from summaries of accident records.
The sample of II1,078 vehicles involved in accidents, as shown in Table z, indi- cates that about z.5 percent were defective. This is in substantial agreement with the National Safety Council summary for I937 which was compiled from 30 state summaries of fatal accidents and I9 state summaries of nonfatal accidents.
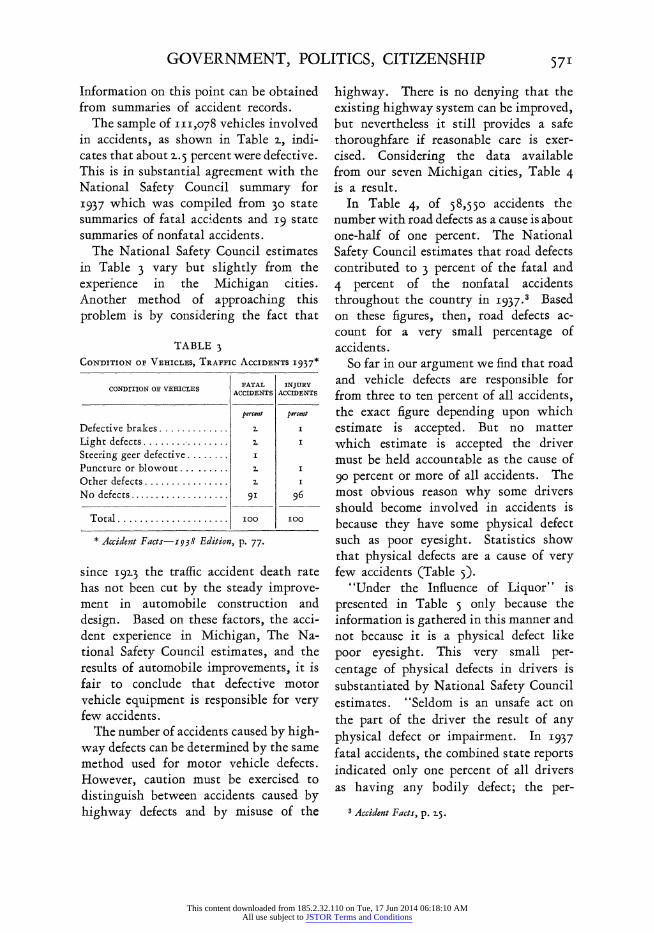
The National Safety Council estimates in Table 3 vary but slightly from the experience in the Michigan cities. Another method of approaching this problem is by considering the fact that
TABLE 3 CONDITION OF VEHICLES, TRAFFIC ACCIDENTS I937*
CONDITION OF VEHICLES FATAL INJURY ACCIDENTS ACCIDENTS
percent percent
Defective brakes. k Light defects.X.
Steering geer defective. I
Puncture or blowout. 2 I
Other defects.2. I
No defects.9I 96
Total. . i00 .0I
* Accident Facts-I 938 Edition, p. 77.
since i92.3 the traffic accident death rate has not been cut by the steady improve- ment in automobile construction and design. Based on these factors, the acci- dent experience in Michigan, The Na- tional Safety Council estimates, and the results of automobile improvements, it is fair to conclude that defective motor vehicle equipment is responsible for very few accidents.
The number of accidents caused by high- way defects can be determined by the same method used for motor vehicle defects. However, caution must be exercised to distinguish between accidents caused by highway defects and by misuse of the
highway. There is no denying that the existing highway system can be improved, but nevertheless it still provides a safe thoroughfare if reasonable care is exer- cised. Considering the data available from our seven Michigan cities, Table 4 is a result.
In Table 4, of 58,53o accidents the number with road defects as a cause is about one-half of one percent. The National Safety Council estimates that road defects contributed to 3 percent of the fatal and 4 percent of the nonfatal accidents throughout the country in I937.3 Based on these figures, then, road defects ac- count for a very small percentage of accidents.
So far in our argument we find that road and vehicle defects are responsible for from three to ten percent of all accidents, the exact figure depending upon which estimate is accepted. But no mnatter which estimate is accepted the driver must be held accountable as the cause of go percent or more of all accidents. The most obvious reason why some drivers should become involved in accidents is because they have some physical defect such as poor eyesight. Statistics show that physical defects are a cause of very few accidents (Table 5).
"Under the Influence of Liquor" is presented in Table 5 only because the information is gathered in this manner and not because it is a physical defect like poor eyesight. This very small per- centage of physical defects in drivers is substantiated by National Safety Council estimates. "Seldom is an unsafe act on the part of the driver the result of any physical defect or impairment. In I937
fatal accidents, the combined state reports indicated only one percent of all drivers as having any bodily defect; the per-
3 Accident Facts, p. 2.5.
This content downloaded from 185.2.32.110 on Tue, 17 Jun 2014 06:18:10 AMAll use subject to JSTOR Terms and Conditions

572 SOCIAL FORCES
centage was even less for nonfatal acci- dents."4
Besides the drivers suffering from physi- cal defects, there are the so-called acci- dent-prone drivers. Drivers who become involved in two, three, or more accidents
are labeled accident-prone drivers. The cause of this accident-proneness may be physical, mental or emotional, but in any case it results in many accidents. Now it may be that most accidents are caused by a handful of accident-prone
drivers. If so the problem resolves itself to devising methods of identifying these drivers and banning them from the high- way.
Possibly the best study of accident- prone drivers was made in Connecticut.5
The Connecticut Department of Motor Vehicles estimates that it receives acci- dent reports on all fatal and personal injury accidents, and about half of the property damage accidents. Consequently
TABLE 4 CONDITION OF THE ROAD IN TRAFFIC ACCIDENTS FOR SEVEN MICHIGAN CITIES DURING 1938
TOTAL ROAD OHSTRUC- OTHER NO NOT CITY ACCIDENTS UNDER TION NOT DEFECTS DEFECTS STATED REFAIR LIGHTED
Jackson.357 3 0 0 354 0 Kalamazoo .2.............. ............ ...........2.53 I O 0 2.52. o Grand Rapids.....I10,023 32- I 3 9,987 0 Flint.... 7. 110 I 0 I 7, I08 0
Highland Park.. 647 3 0 2. 639 3 Battle Creek... 2I 5 2. 0 0 2.I2 I
Detroit...... 39,945 IOO 6 10 39,694 135
Totals. 58,55o I42. 7 i6 58,246 I39
Percentages.10 0 .2.4 0. OI 0.03 99.48 0 . 24
TABLE S
PHYSICAL CONDITION oF DRIVERS INVOLVED IN TRAFFIC ACCIDENTS FOR SEVEN MICHIGAN CITIES DURING
1938
TOTAL UNER PHYSICAL OTHER NO NOT DRIVERS OFLUOR DEFECT DEFECT DEFECT STATED OF LIQUOR
Jackson.......... 634 34 5 0 540 55 Kalamazoo......... 379 I7 0 3 336 2.3 Grand Rapids.... i9,567 I77 7 7 I9,31I 65 Flint. I4,0,56 409 I4 0 I3,595 38
HIighland Park... 966 123 3 0 788 52.
Battle Creek... 358 30 I 0 2.83 44 Detroit..... 75,II8 6,612. .II9 I38 58,452. 9,787
Totals.1, I 0II,78 7,402. I59 I48 93,305 IO,064
Percentages. IOO 6.67 0-I4 O.I3 84.00 9.o6
4 Ibid., p. 2.4.
5The factual material on accident-prone drivers is from Accident-Prone Drivers, U. S. Bureau of Public Roads, I938.
This content downloaded from 185.2.32.110 on Tue, 17 Jun 2014 06:18:10 AMAll use subject to JSTOR Terms and Conditions

GOVERNMENT, POLITICS, CITIZENSHIP 573
the accident records of drivers are reason- ably complete. The six-year period I93 I-
36 was taken for investigation. A ran- dom sanmple of 2.9,53i drivers whose driving records were complete for the period was selected, and the distribution of accidents among those drivers was analyzed. Table 6 was the result.
TABLE 6
DISTRIBUTION OF ACCIDENTS AMONG 2-9,53I
CONNECTICUT DRIVERS DURING I93 I-36*
NUMBER OF DRIVE1RS NUMBER OF ACTUAL MINUS ACCIDENTS THE MINUS
PER DEIVER Actual Expected by TEE EXPECTED chance
o 2-3, 88I 2-3 2-34 +647
I 4,503 5,572- -I,o69
2- 936 668 68
3 i60 53 I07
4 33 4 2-9
5 I4 '
4 6 3 3 7 I I
Total .. 9,531 2 9,53I
* Accident-Prone Drivers, U. S. Bureau of Public Roads, I938, p. 4.
The Connecticut investigators conclude:
If these same 7,o82- accidents had been distributed among the 2-9,53i drivers by chance without regard to the identities or histories of the individuals, the distribution would have been as given in the column headed 'Expected by chance'. On comparing this distribution with the way the accidents actually fell as shown in the second column of the table, it is seen that there are more drivers who had no accident at all than can be attributed to chance, fewer drivers who had one accident, and more who had two, three, or four accidents. It is evident that there must be some- thing in the characteristics of some of the drivers who had no accident or only one that makes them less susceptible to traffic accidents, and that there must be some reason that causes some of the accident repeaters found in this experience to be more than ordinarily susceptible to accidents.
The important and highly significant fact revealed by this investigation is that the number of drivers who had two or more accidents and especially of those who had numerous accidents, was very much
greater than can be accounted for by pure chance or luck alone. In other words, there is an accident- prone group, who, for various reasons, have more than their fair share of accidents. Their excess of accidents cannot be explained by chance but definitely must be attributed to predisposing characteristics of the individuals or of the conditions under which they do their driving.6
This study establishes statistically that there is an accident-prone group of drivers. Our problem is to determine what percentage of all accidents are caused by this group. This can be de- termined from the data in Table 6, but there are several factors about the table that must be kept in mind.
i. "The term 'accident' as used in this report means driver accident; that is, if the same accident was reported by the two or more drivers who were involved in it, each driver is charged with one acci- dent." ' In other words, A parks his car legally and then B smashes into it. Both A and B get credited for one accident each. Thus in this Connecticut study drivers involved in accidents but guilty of no improper driving were considered with the "guilty" drivers with no dis- tinction made.
z. Also many of the accidents con- sidered were very minor. Calculations based on National Safety Council 1937
figures indicate that for each fatal acci- dent, there were about 78 personal injury and 170 property damage accidents. Based on these ratios, it is obvious that most of the accidents considered in the Connecti- cut study were property damage accidents. Therefore the investigation included many accidents which were not serious enough to stamp an individual as an accident- prone driver.
3. No attention was paid to the fact that all motor vehicle operators do not
6 Ibid., pp. 4 antd 5 7 Ibid., p. 115
This content downloaded from 185.2.32.110 on Tue, 17 Jun 2014 06:18:10 AMAll use subject to JSTOR Terms and Conditions

574 SOCIAL FORCES
drive the same number of miles. A truck driver may drive two or three times as much as other drivers and due to his greater exposure would naturally be involved in more accidents.
Bearing these considerations in mind how shall an accident-prone driver be defined? Inasmuch as the Connecticut investigation includes drivers who com- mitted no improper driving and as many minor accidents are included, a driver will be considered accident-prone if he has been involved in more than two accidents in the six year period. Thus z ii of the 29,53i drivers are accident-prone and they were involved in 707 of the 7,082
TABLE 7 APPROXIMATE PERCENTAGE DISTRIBUTION OF
ACCIDENT CAUSES
CAUSES PERCENT
Defects in motor vehicles..... 2_
Defects in highway. * Driver's physical defects.... T. I
Accident-prone drivers . . 7.5
Total."... II 5
accidents. After deducting the 57 drivers and the 175 accidents that are attributable to chance, there remain I54 accident-prone drivers involved in 533 accidents. Thus of the 7,o82. accidents, 533 or 7.5 percent were caused by accident-prone drivers. Re- moving the accident-prone driver from the highway then, is not the solution to the problem.
The results thus far of our study may be summarized in Table 7.
Of course the percentages are approxi- mations, but nevertheless they do es- tablish the fact that basically the accident problem is a problem of the normal driver with average physical fitness operating a safe motor vehicle on a highway which is free from defects. The real cause of
accidents is the driving behavior of aver- age motorists. The specific driving habits that cause accidents are given in Table 8.
To ascertain what factors determine driving habits and consequently these driving violations is a socio-psychological problem. It is possible to distinguish two:
i. Knowledge and Driving Skill. Knowl- edge and skill are closely related. The driver not only must know that he is supposed to stop at stop streets, but also he must have the skill to do so. If this knowledge-skill factor is the predomi- nant cause, the problem is an educational one. Teach the driving public the high- way regulations and instruct them in the control of the motor vehicle.
m. Attitude. The driver knows that he should, and could if he would, stop at the stop sign, but simply does not because he doesn't care to. The American people are notorious for their disregard of mores and law, a consequence of pioneer and lais- sez-faire individualism. Besides this un- conscious recklessness, there is also a negligent attitude. This negligence is based on the fact that driving is done so much, it is done with as little care as walking or breathing, and consequently far from the mind is the realization that an error in driving may have disastrous consequences. A typical accident of this type was the one in which a young man was eating popcorn while driving home from a carnival. As he enjoyed his pop- corn, he failed to make a turn, hit a tree, and was injured.
However, in most accidents the dis- tinction between the skill and the atti- tude factors is not so exact and clean cut. Nevertheless an attempt at distinction, then evaluation, of these causes must be made. If lack of knowledge and skill is the preponderant cause, then the solu- tion of the problem lies along instruc-
This content downloaded from 185.2.32.110 on Tue, 17 Jun 2014 06:18:10 AMAll use subject to JSTOR Terms and Conditions

GOVERNMENT, POLITICS, CITIZENSHIP 575
tional lines. Driving ability can be learned as easily as reading and writing ability. However, if the attitude factor is the major one, then the problem is more difficult, for proper attitudes cannot be taught as readily as spelling or gram- mar, since social attitudes are primarily a result of a person's conditioning during infancy.
To determine the relative frequencies of these two factors is no easy task.
"Excessive Speed" may be a result of a mistake in judgment or of reckless negligence. However, such offenses as disregarding stop signs, disregarding red and green signals, improper turning, driv- ing through safety zones, or driving on the wrong side of the road are reflections of attitudes, for obviously all drivers know that they are supposed to drive on the right side of the road, stop at stop signs, etc.
Inasmuch as the reporting of these
causes of accidents is subject to great error, no attempt will be made at enu- meration. However, the problem can be approached from another angle. In- vestigators have discovered that the younger driver, on the average, ranks highest on written and driving tests, and yet has the worst accident record.
In io samples studied from Massachusetts and Connecticut, the drivers under 2i years of age had between I.24 and 2.io times as many fatal accidents
as they would have had if accident liability were independent of age. The age group 2i to 25 had between I.29 and i.65 times as many fatal accidents as they were entitled to have. Their showing in non-fatal personal injury accidents and in accidents that involved property damage only is also bad.8
Such evidence indicates that the atti- tude outweighs the skill factor in most instances. This view is in harmony with the results of studying thousands of accident case histories, for the detailed
TABLE 8
DRIVING VIOLATIONS OF PERSONS INVOLVED IN ACCIDENTS FOR SEVEN MICHIGAN CITIES IN I938
CITIES
DRIVING VIOLATIONS TOTAL PERCENT-
JksnKala- Grand Fln Highland Battle AGEoj Jackson mazoo Rapids Flint
Park Crcck Dctroit
I. Excessive speed ............ 31I 13 I,005 380 2.8 2.9 6), 245 7,74I 6.97 2. Did not have right of way. . 2175 I4 2.,l2l2I 2.,077 35 I9 3,07I 7727I. 6.94
3. Cutting in . . 8 I 475 579 6 4 4,76I 5,834 5.2*5
4. On wrong side road .3 II 5I3 445 13 I9 2I,903 3,9I7 3-53 S- Drove through safety zone.. 2. 46 48 0.04
6. Improper passing 78 78 0.07
7. Failed to signal ............. 3 2 939 I99 4 I 2.2.72. 3, 42.0 3.o8 8. Wide right turn 2 462. 2. 6 9721 I,444 I.30
9. Cut corner on left turn 2...... 2 5 459 I5 6 4 2, 554 3,045 2.74
IO. Turn from wrong lane I30 IO 1 I. 127 I 14II. I1.7
II. Disregarded stop sign. 45 571 174 49 I1 1,037 I,997 i.8o
1I. Disregarded signal .4 5 5o8 i2.5 62. II I,309 12,024 I.82.
I3. Improper turn 32. 552. 584 0-53
I4. Other improper driving. .. .. I5 2.0 1,982 3,468 8i 49 9,7I7 I6, 332. I4.70
I5. No improper driving . 246 2.63 7,9I4 6,383 12.5 2OI 32.,2.II 47, 343 42.62.
I6. Not stated.2. 2.4 I,388 I 533 I 61I98 8,I47 7-34
I7. Total ..................... 634 379 I9,567 I4,056 966 358 75,II8 III,078 IOO.OO
8 Ibid., pp. II-I..
This content downloaded from 185.2.32.110 on Tue, 17 Jun 2014 06:18:10 AMAll use subject to JSTOR Terms and Conditions

576 SOCIAL FORCES
descriptions indicate clearly the part of negligence, recklessness, inattention, and other antisocial attitudes.
The writer recognizes that the case has not been conclusively demonstrated but the existing evidence makes very plausible the belief that attitudes are the predomi- nant cause of accidents. This conclusion is significant for several fields. For soci- ologists and social-psychologists it demon- strates that the temper of behavior pat- terns is reflected in driving behavior. This is additional proof of the unitary aspect of personality.
Although this problem has socio-psy- chological roots, it is dubious whether the social sciences at present can offer much toward remedying the problem. To give psychiatric examinations to all applicants for driving licenses, so that those applicants with antisocial behavior patterns may be denied a license is not feasible at present. However, some work has been started in Detroit with the acci- dent-prone driver. Of course this is done after the damage has been committed, but it is a beginning.
For men working in the traffic field, this conclusion indicates that the problem is far greater than seeing that all cars have good lights and that all curves are plainly marked. It is the so-called human ele- mnent, not the physical equipment of travel that needs attention. Obviously highway and traffic engineers are not the ones to mold attitudes. However, they can construct highways which would give these attitudes fewer opportunities to result in accidents. Although engineers do not talk in terms of attitudes, this is precisely what is being done when they construct new divided, intersectionless highways. Obviously if the two oppos-
ing lanes of traffic are divided in boule- vard fashion, motorists must stay on their side of the road. If intersections are eliminated, there are fewer opportunities for drivers to disregard stop signs and signals. These are a few obvious methods whereby highway engineering is certainly curtailing accident opportunities. Such an approach is very costly.
Other methods of attacking the problem promise to be equally expensive. Strin- gent police enforcement of traffic laws rests upon punishment for its efficiency. It is dubious whether punishment in itself is a deterrent. A far greater deterrent is the certainty of punishment, and the expense of watching every hill and curve on the millions of miles of thoroughfares is prohibitive.
A third approach is through educational channels, and it has been demonstrated that lack of knowledge and skill is not.
the problem. However, instructional techniques can be employed to instill in all drivers an awareness of the problem, but, nevertheless, the decision whether to be careful still rests with the driver, and it has been shown in the case of young drivers that they do not make the social decision.
Visualized in these terms the traffic accident problem is tremendous in scope. Inasmuch as attitudes are basic to an individual and not easily amenable to change, the problem has no easy correc- tive. The techniques now employed at- tempt to eliminate accidents by eliminat- ing accident opportunities and by making the motor vehicle operator aware of acci- dent conditions. These are attempts to hold in check the attitude cause without removing the attitude. That is the prob- lem of the social scientists.
This content downloaded from 185.2.32.110 on Tue, 17 Jun 2014 06:18:10 AMAll use subject to JSTOR Terms and Conditions