Embed Size (px)
Citation preview
Traffic visibility and control with sFlowOpen vSwitch 2014 Fall Conference
Peter PhaalInMon Corp.November 2014
Why monitor performance?
“If you can’t measure it, you can’t improve it”Lord Kelvin
Time
Capacity
Demand
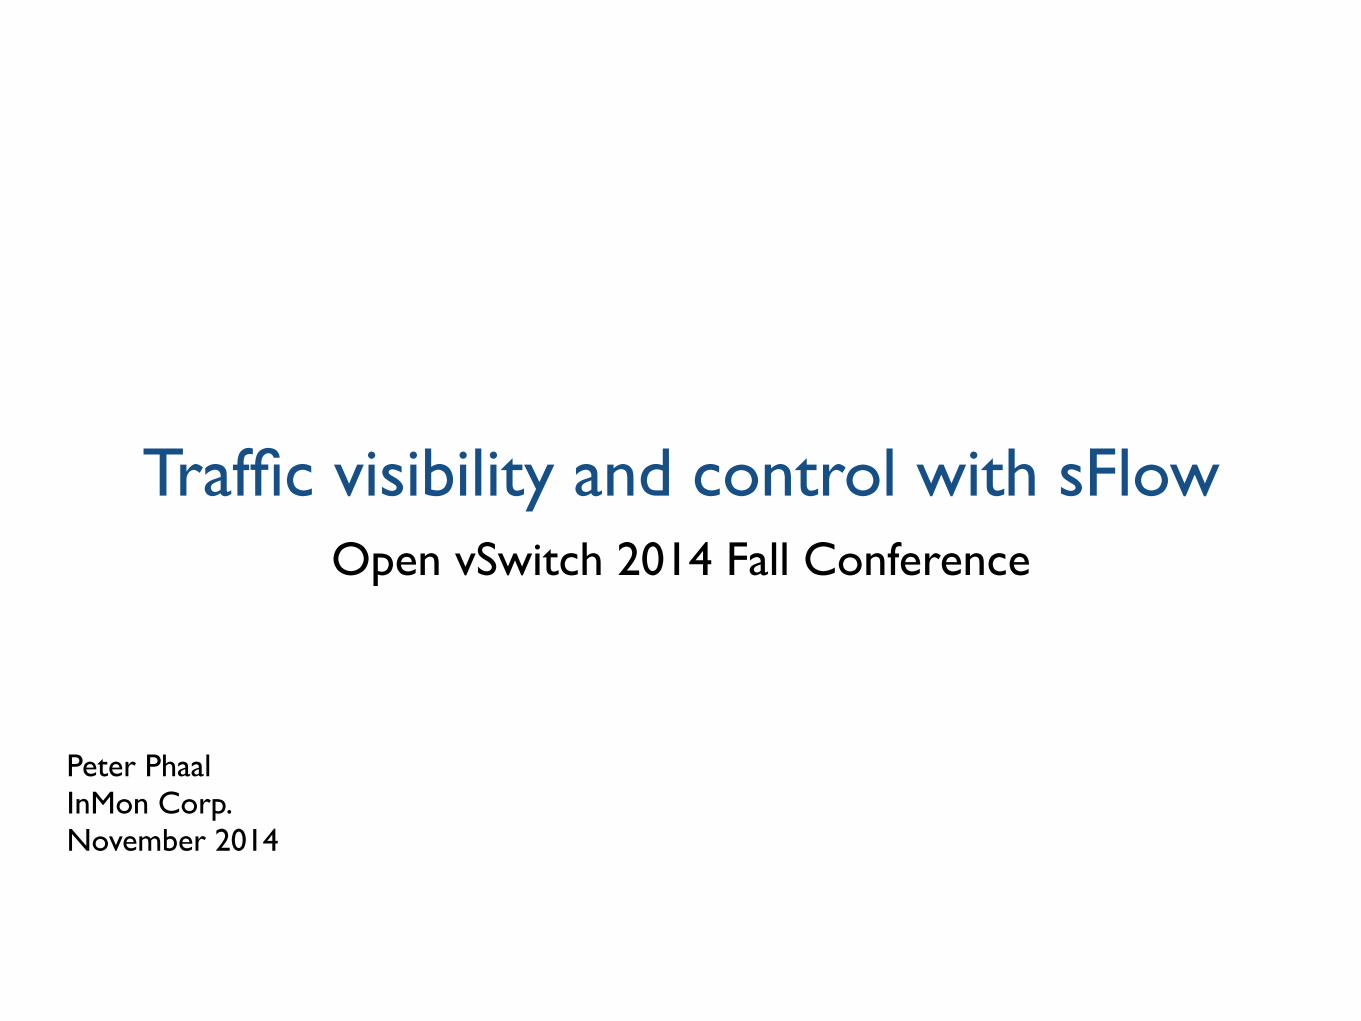
Static provisioning
$ Unused capacity
$$$ Service failure
$$ Unused capacity
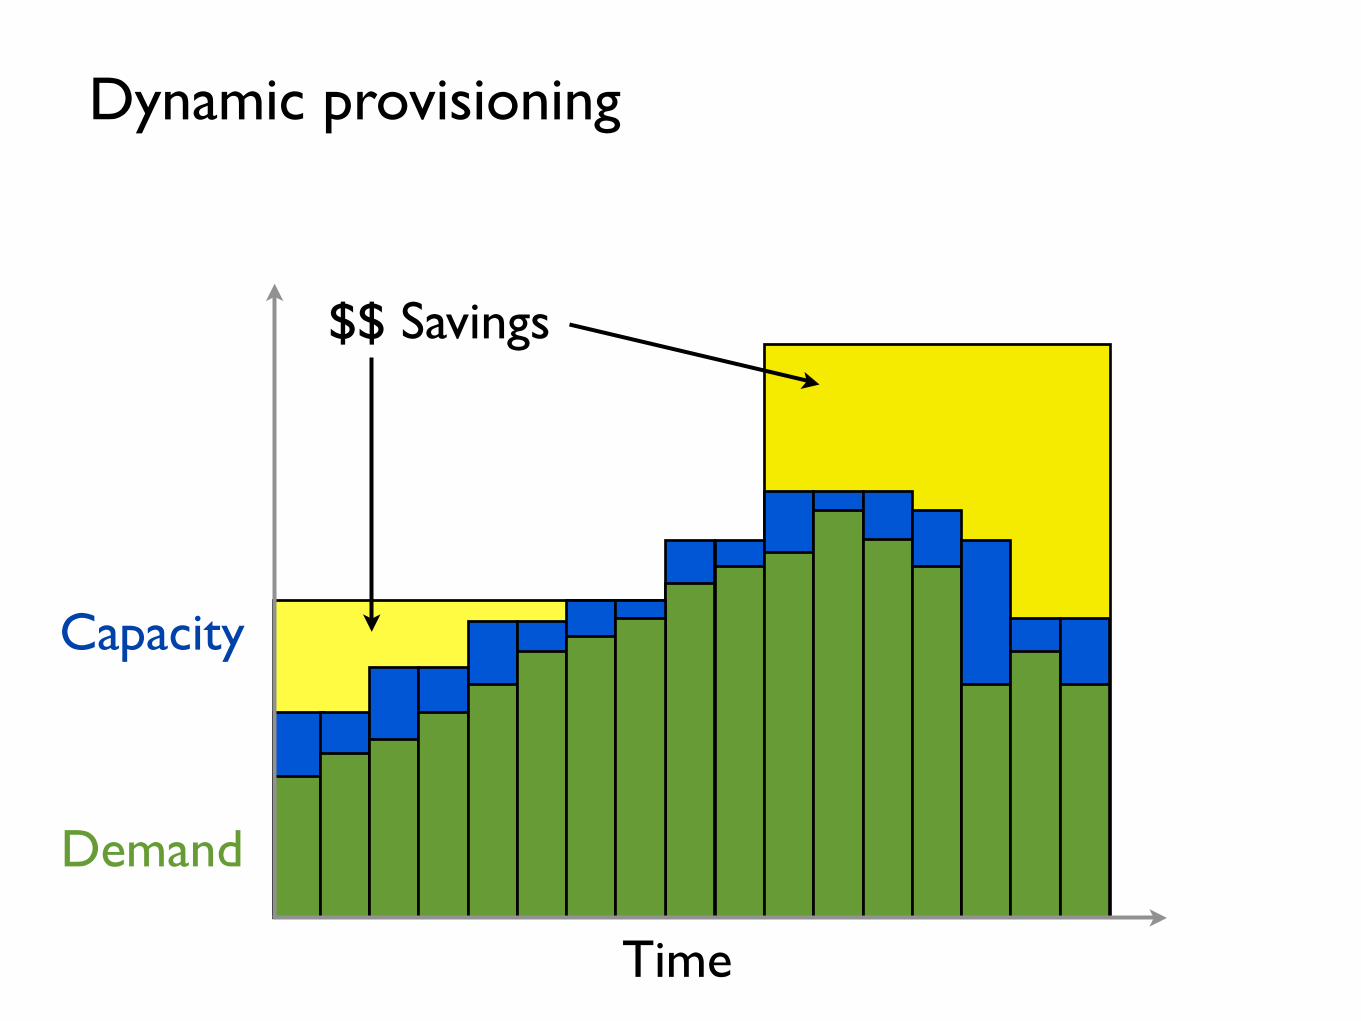
$$ Savings
Time
Capacity
Demand
Dynamic provisioning
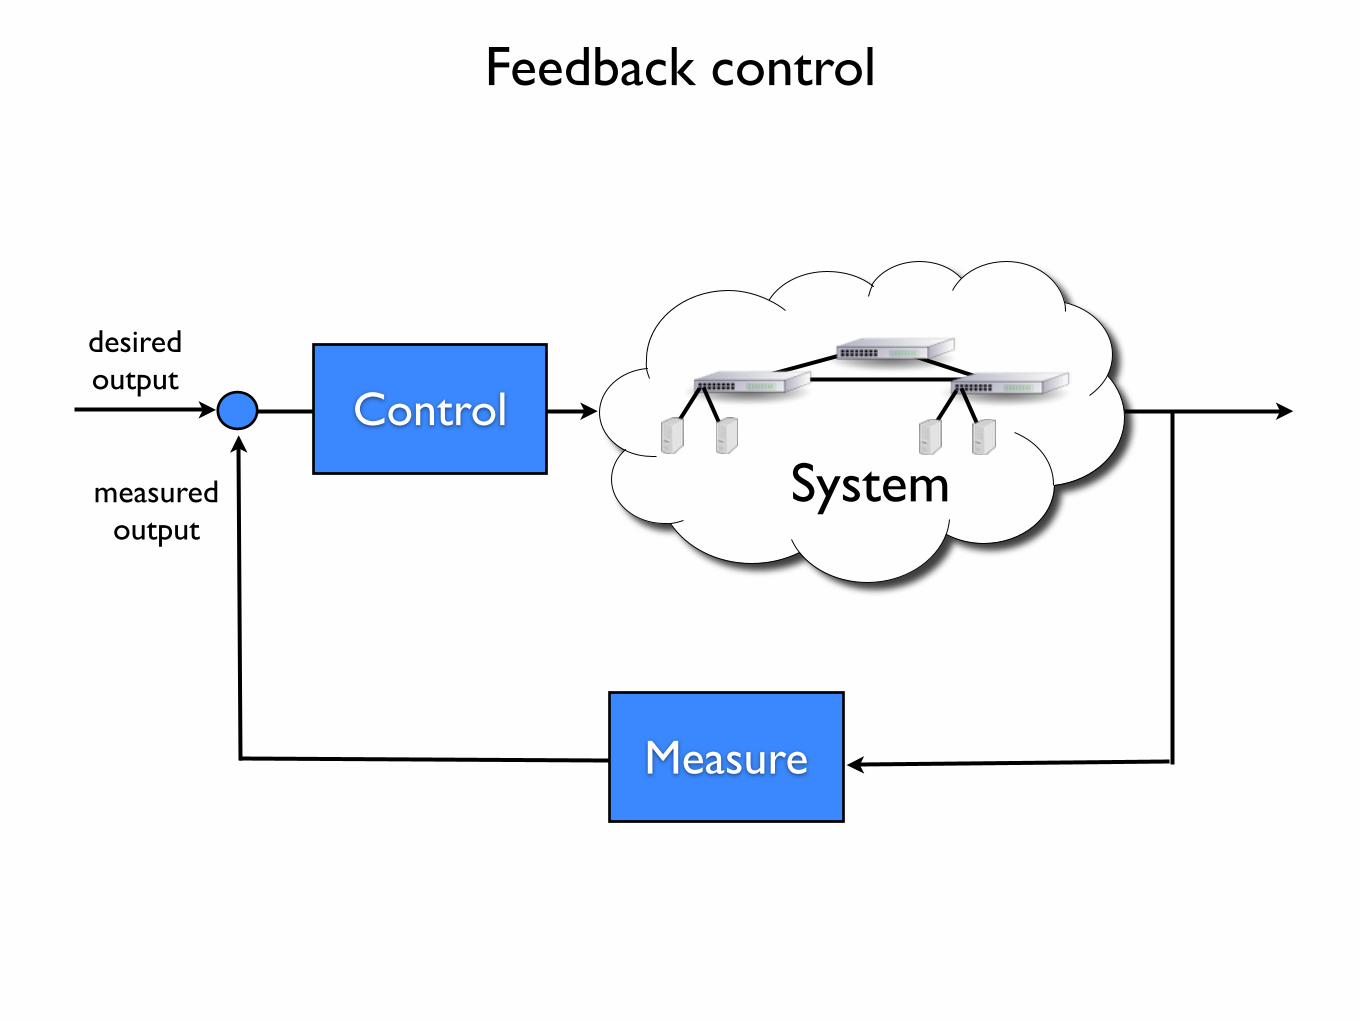
Feedback control
Measure
Control
System
desired output
measured output
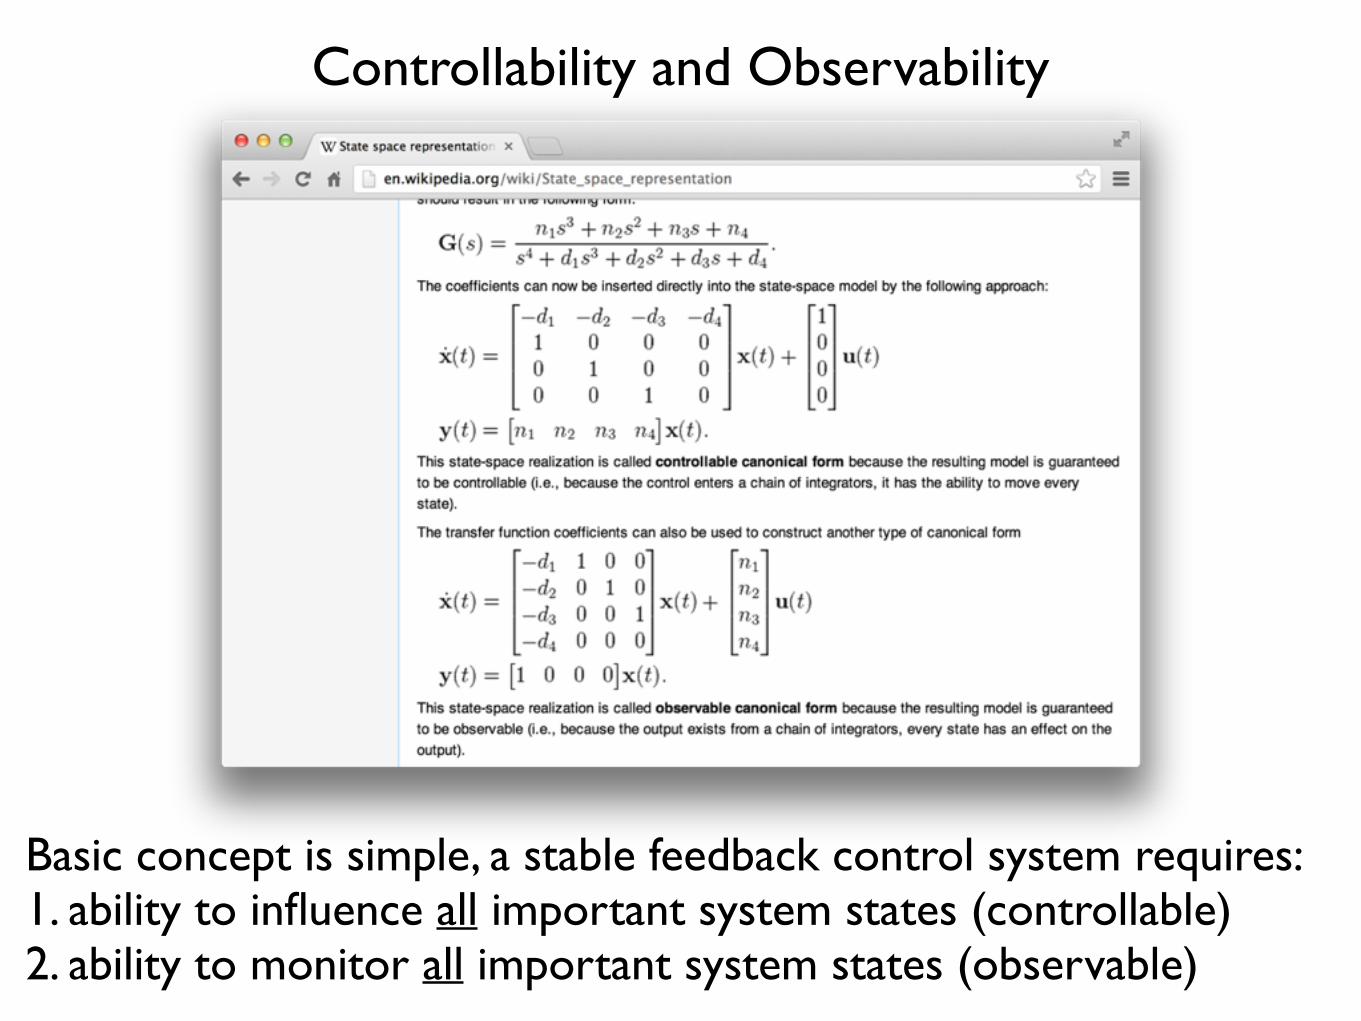
Controllability and Observability
Basic concept is simple, a stable feedback control system requires:1. ability to influence all important system states (controllable)2. ability to monitor all important system states (observable)
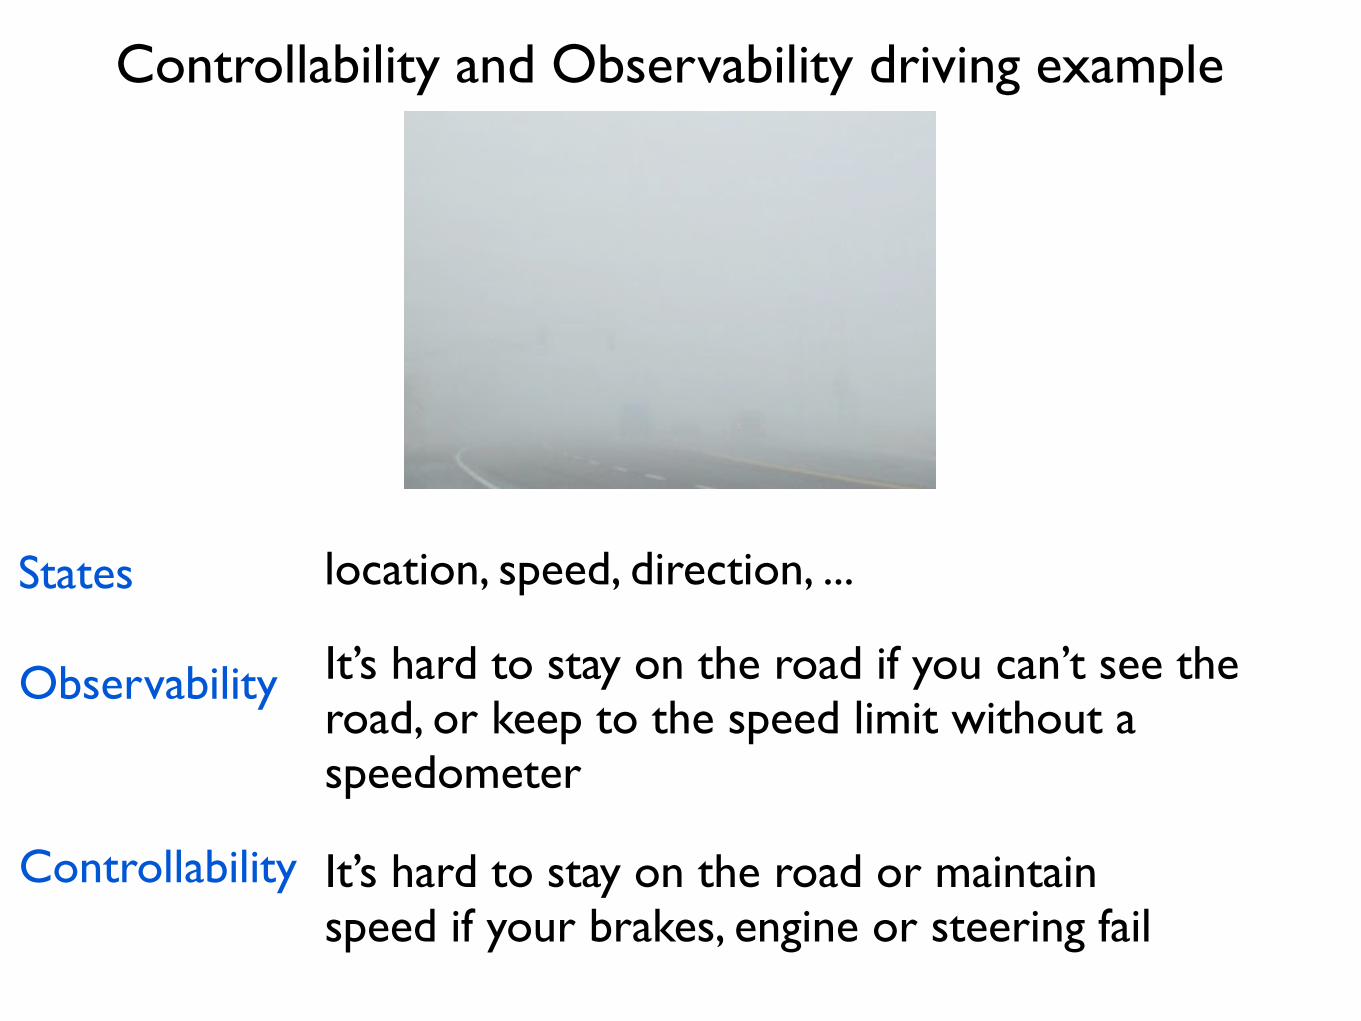
It’s hard to stay on the road if you can’t see the road, or keep to the speed limit without a speedometer
It’s hard to stay on the road or maintain speed if your brakes, engine or steering fail
Controllability and Observability driving example
Observability
Controllability
States location, speed, direction, ...
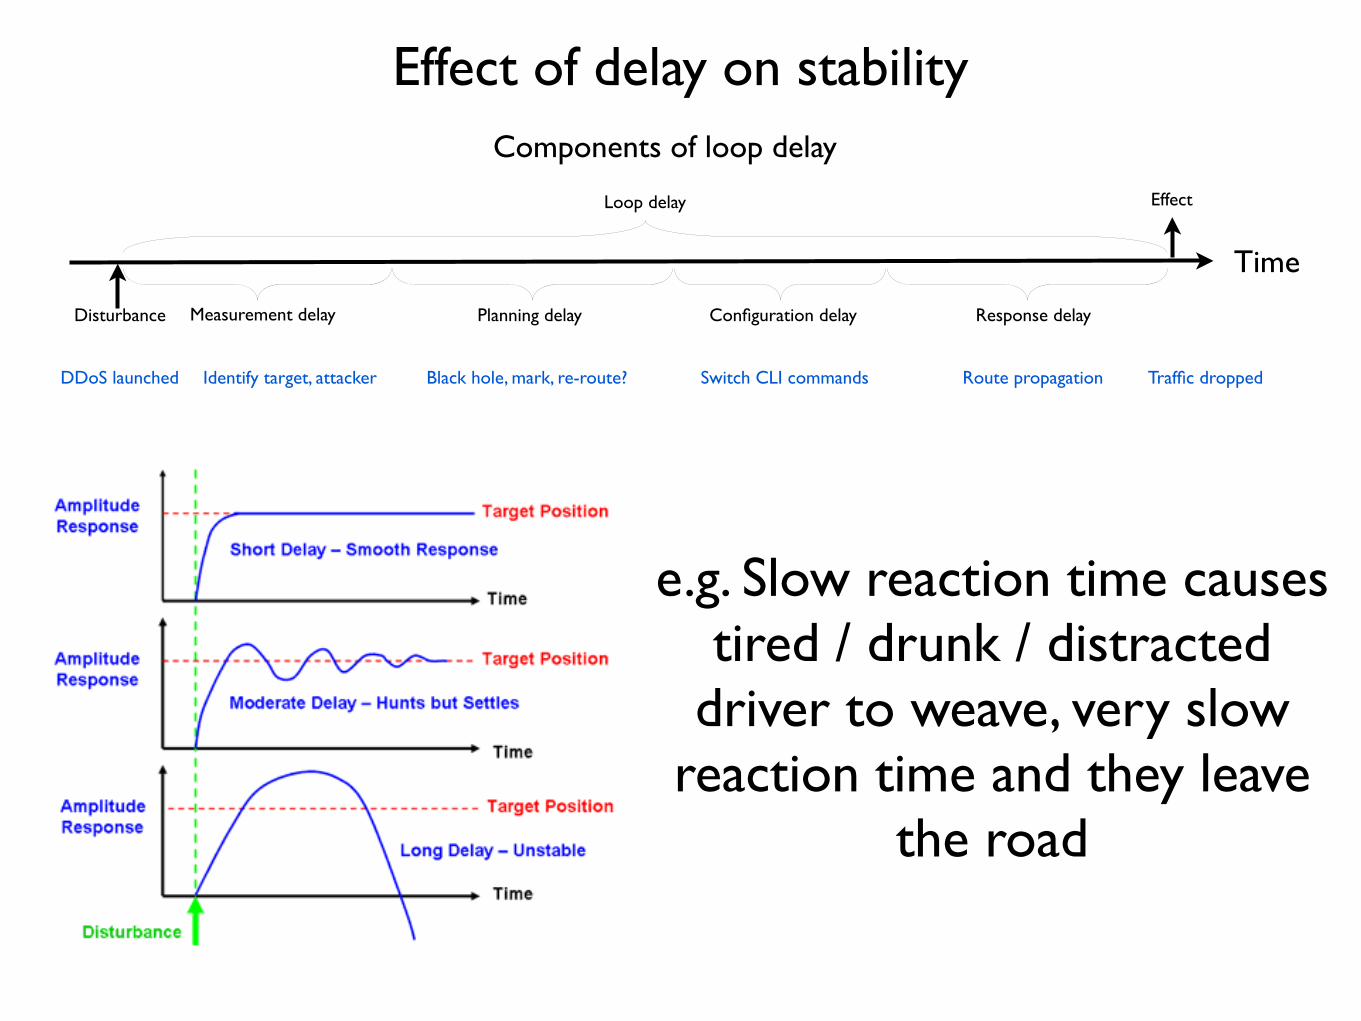
Effect of delay on stability
Measurement delay Planning delay
Time
Configuration delayDisturbance Response delay
EffectLoop delay
DDoS launched Identify target, attacker Black hole, mark, re-route? Switch CLI commands Route propagation Traffic dropped
Components of loop delay
e.g. Slow reaction time causes tired / drunk / distracted
driver to weave, very slow reaction time and they leave
the road
What is sFlow?
“In God we trust. All others bring data.”Dr. Edwards Deming
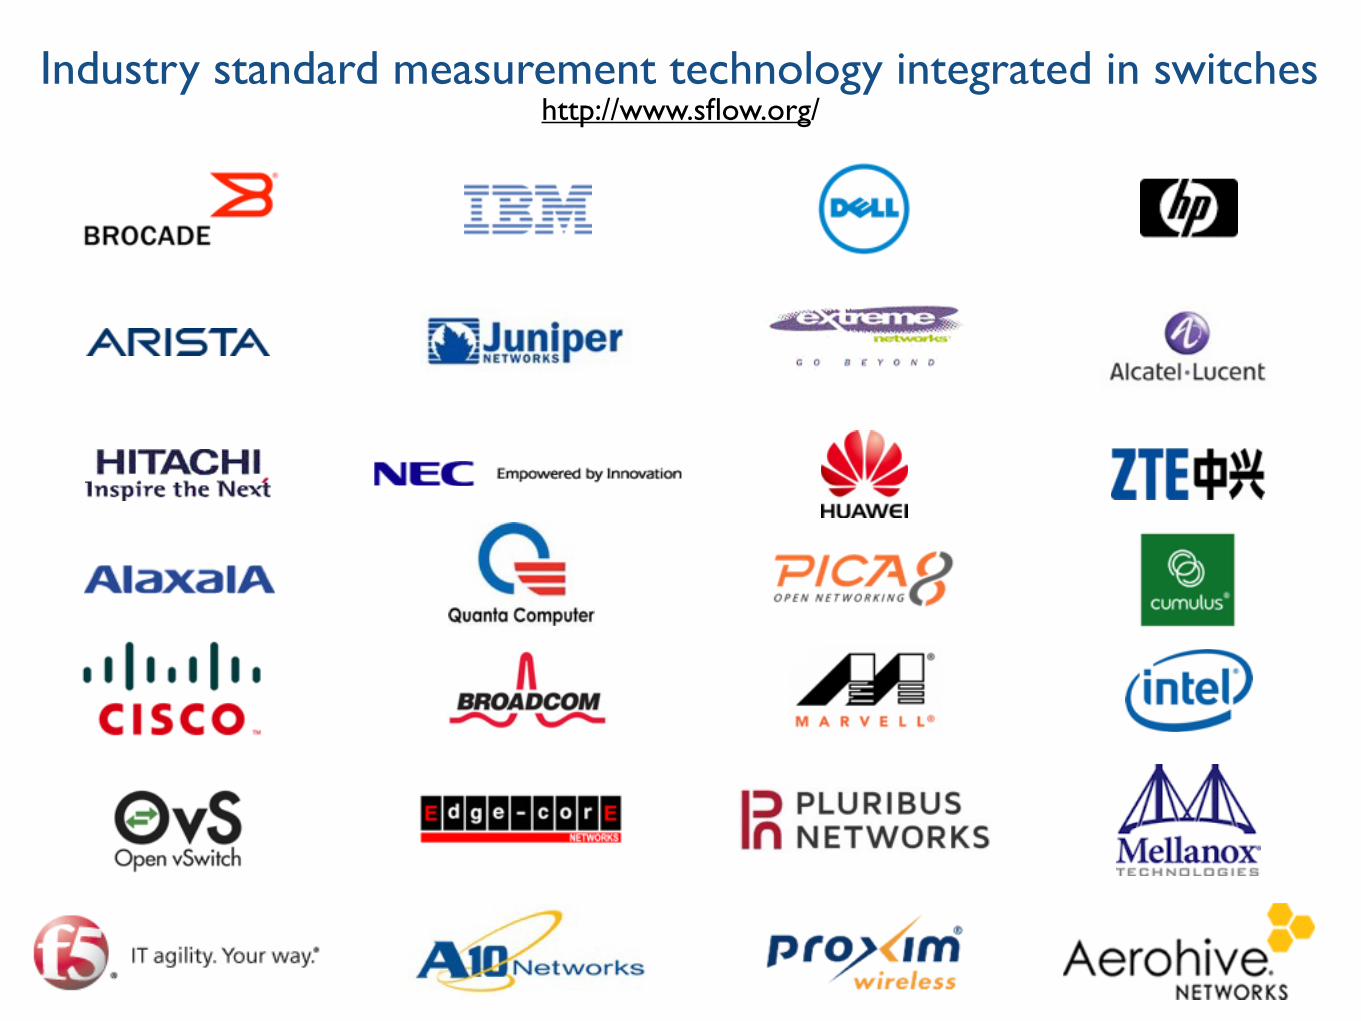
Industry standard measurement technology integrated in switcheshttp://www.sflow.org/
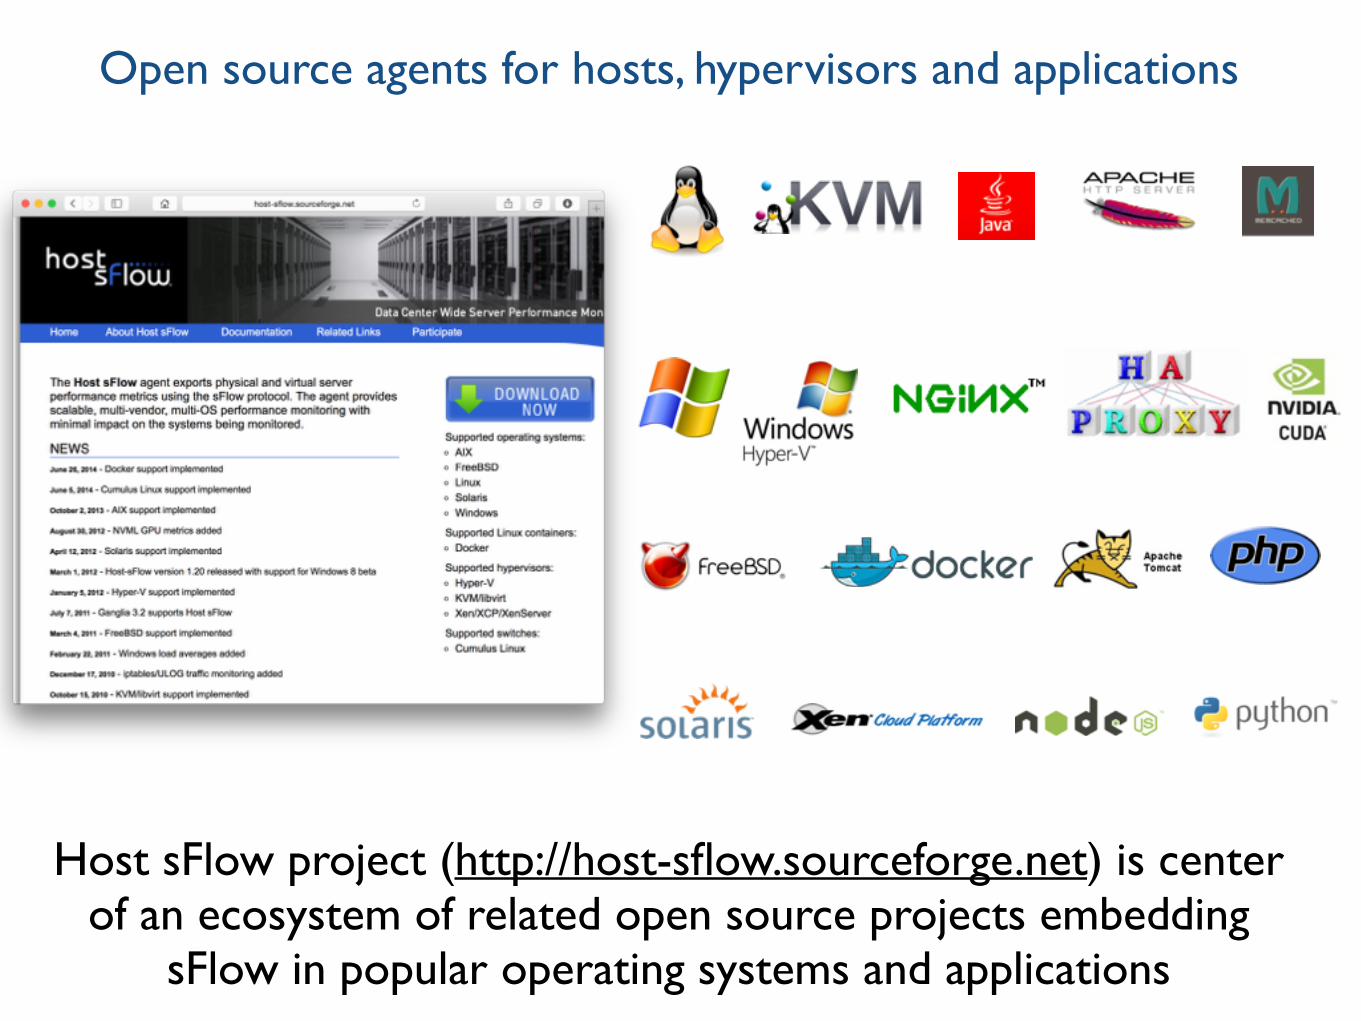
Open source agents for hosts, hypervisors and applications
Host sFlow project (http://host-sflow.sourceforge.net) is center of an ecosystem of related open source projects embedding
sFlow in popular operating systems and applications
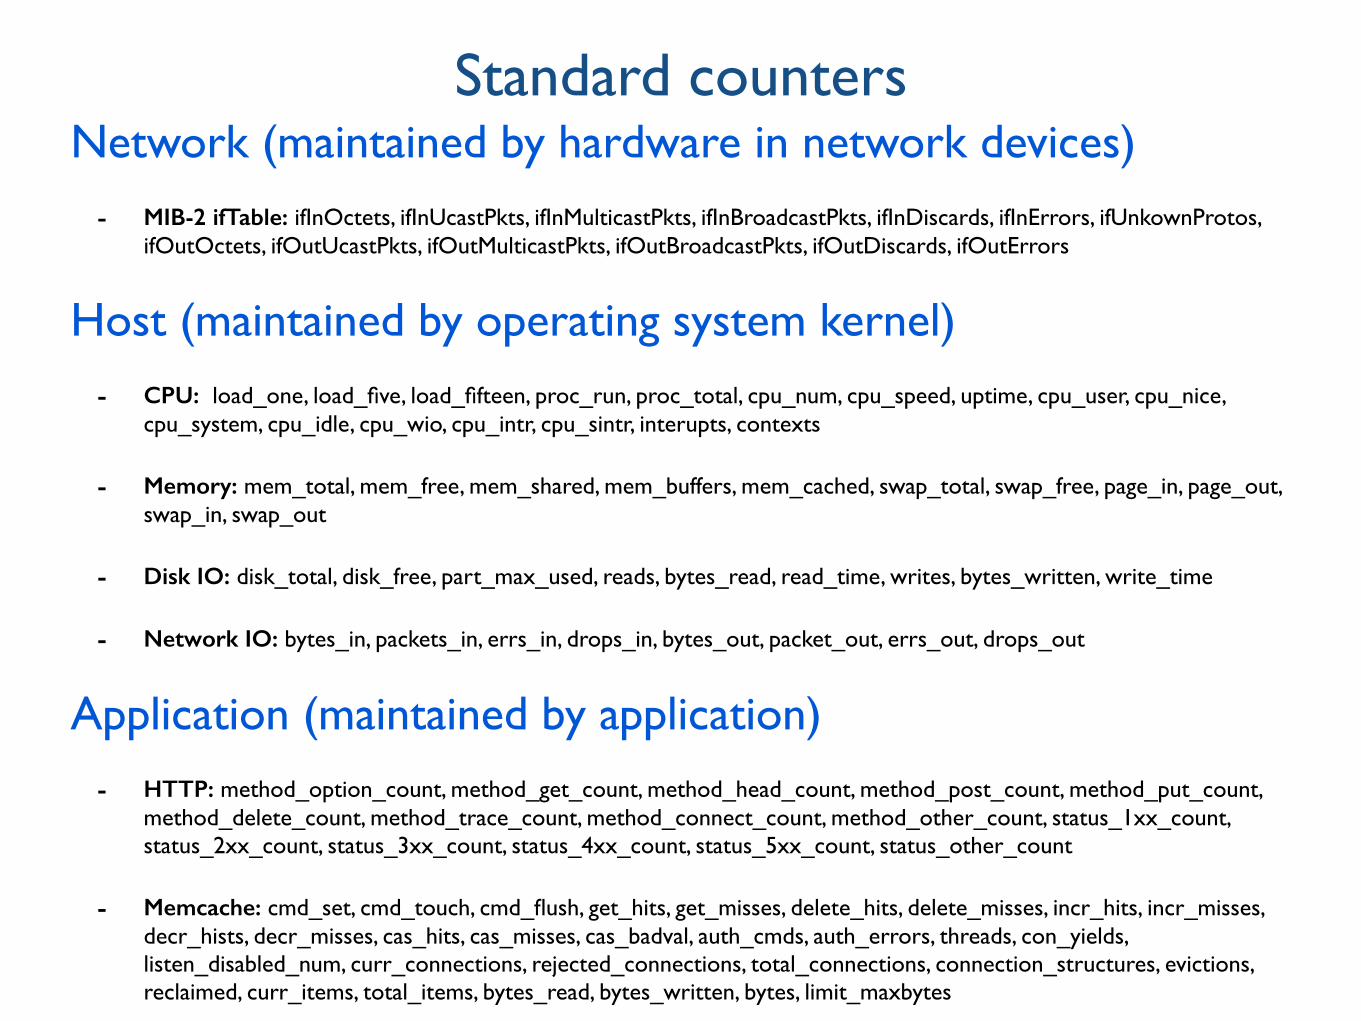
Network (maintained by hardware in network devices)
- MIB-2 ifTable: ifInOctets, ifInUcastPkts, ifInMulticastPkts, ifInBroadcastPkts, ifInDiscards, ifInErrors, ifUnkownProtos, ifOutOctets, ifOutUcastPkts, ifOutMulticastPkts, ifOutBroadcastPkts, ifOutDiscards, ifOutErrors
Host (maintained by operating system kernel)
- CPU: load_one, load_five, load_fifteen, proc_run, proc_total, cpu_num, cpu_speed, uptime, cpu_user, cpu_nice, cpu_system, cpu_idle, cpu_wio, cpu_intr, cpu_sintr, interupts, contexts
- Memory: mem_total, mem_free, mem_shared, mem_buffers, mem_cached, swap_total, swap_free, page_in, page_out, swap_in, swap_out
- Disk IO: disk_total, disk_free, part_max_used, reads, bytes_read, read_time, writes, bytes_written, write_time
- Network IO: bytes_in, packets_in, errs_in, drops_in, bytes_out, packet_out, errs_out, drops_out
Application (maintained by application)
- HTTP: method_option_count, method_get_count, method_head_count, method_post_count, method_put_count, method_delete_count, method_trace_count, method_connect_count, method_other_count, status_1xx_count, status_2xx_count, status_3xx_count, status_4xx_count, status_5xx_count, status_other_count
- Memcache: cmd_set, cmd_touch, cmd_flush, get_hits, get_misses, delete_hits, delete_misses, incr_hits, incr_misses, decr_hists, decr_misses, cas_hits, cas_misses, cas_badval, auth_cmds, auth_errors, threads, con_yields, listen_disabled_num, curr_connections, rejected_connections, total_connections, connection_structures, evictions, reclaimed, curr_items, total_items, bytes_read, bytes_written, bytes, limit_maxbytes
Standard counters
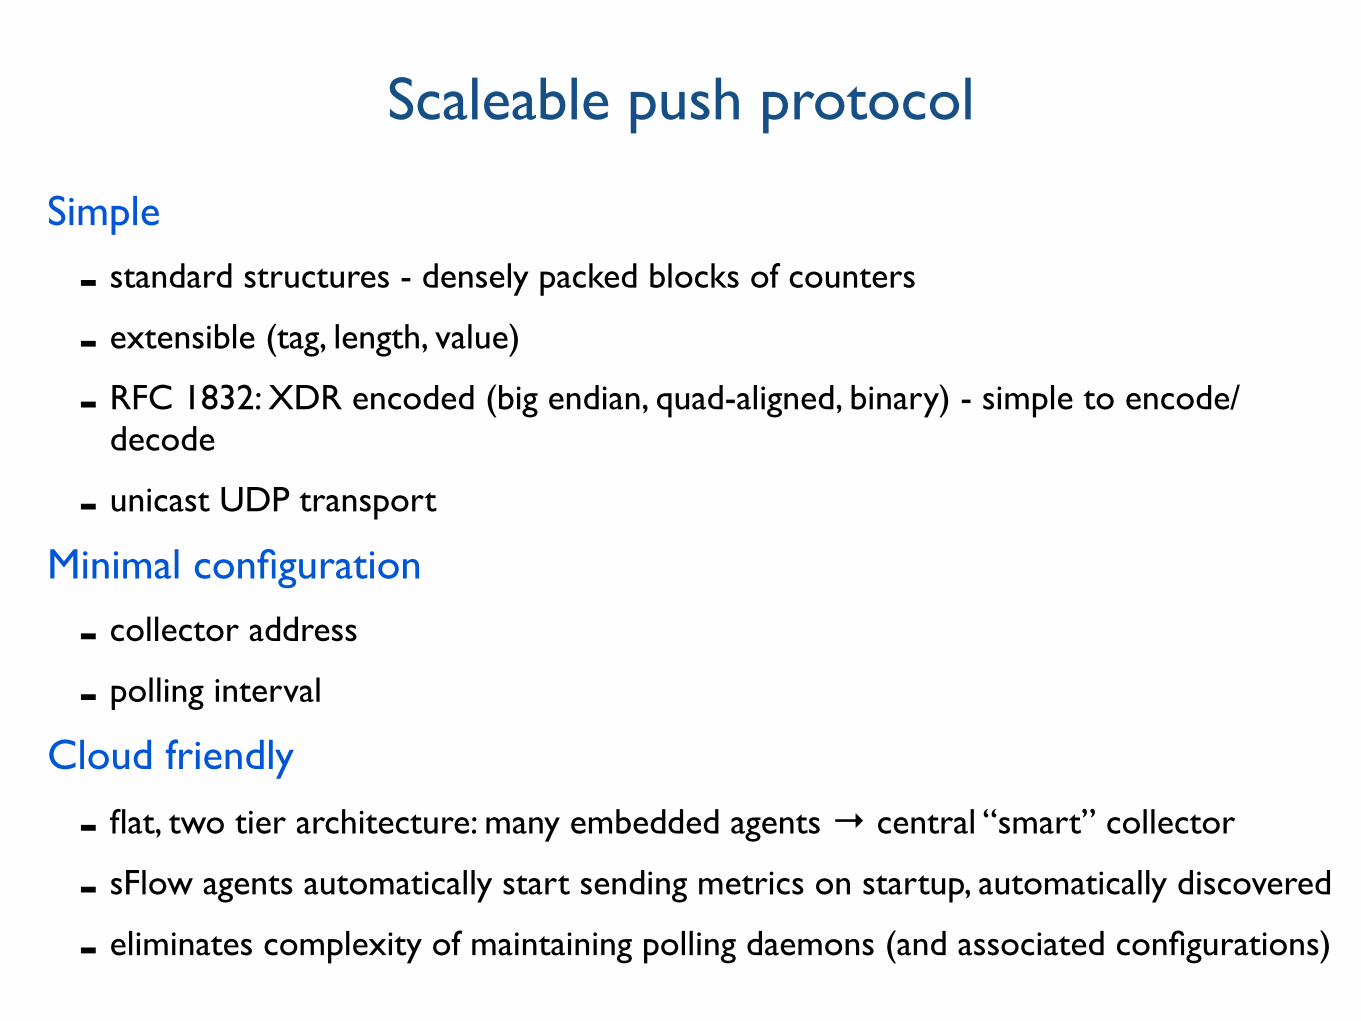
Simple
- standard structures - densely packed blocks of counters
- extensible (tag, length, value)
- RFC 1832: XDR encoded (big endian, quad-aligned, binary) - simple to encode/decode
- unicast UDP transport
Minimal configuration
- collector address
- polling interval
Cloud friendly
- flat, two tier architecture: many embedded agents → central “smart” collector
- sFlow agents automatically start sending metrics on startup, automatically discovered
- eliminates complexity of maintaining polling daemons (and associated configurations)
Scaleable push protocol
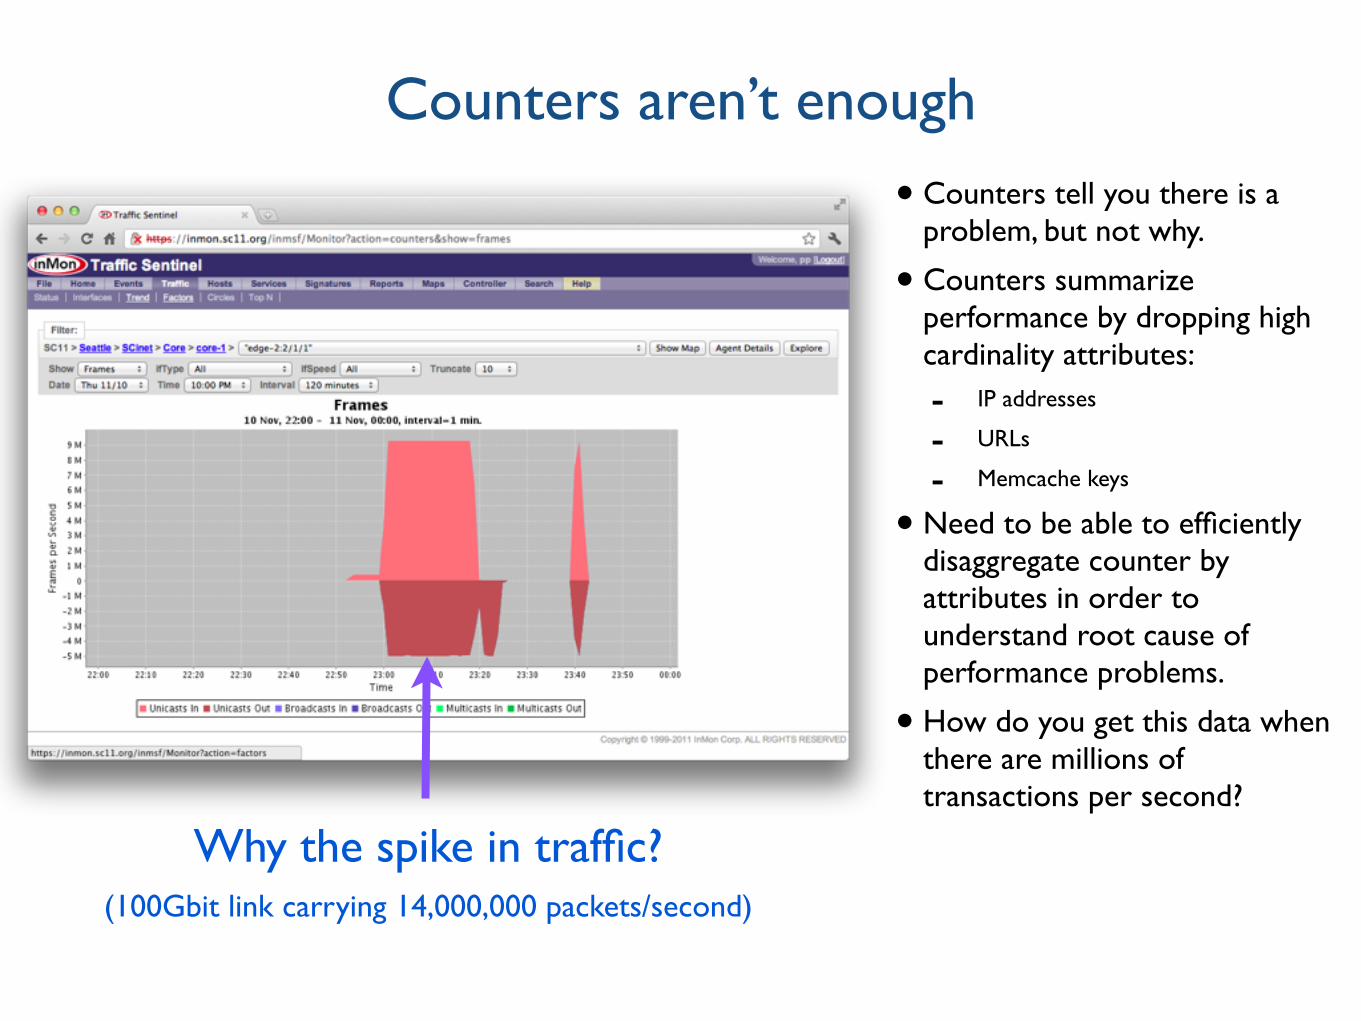
• Counters tell you there is a problem, but not why.
• Counters summarize performance by dropping high cardinality attributes:
- IP addresses
- URLs
- Memcache keys
• Need to be able to efficiently disaggregate counter by attributes in order to understand root cause of performance problems.
• How do you get this data when there are millions of transactions per second?
Counters aren’t enough
Why the spike in traffic?(100Gbit link carrying 14,000,000 packets/second)
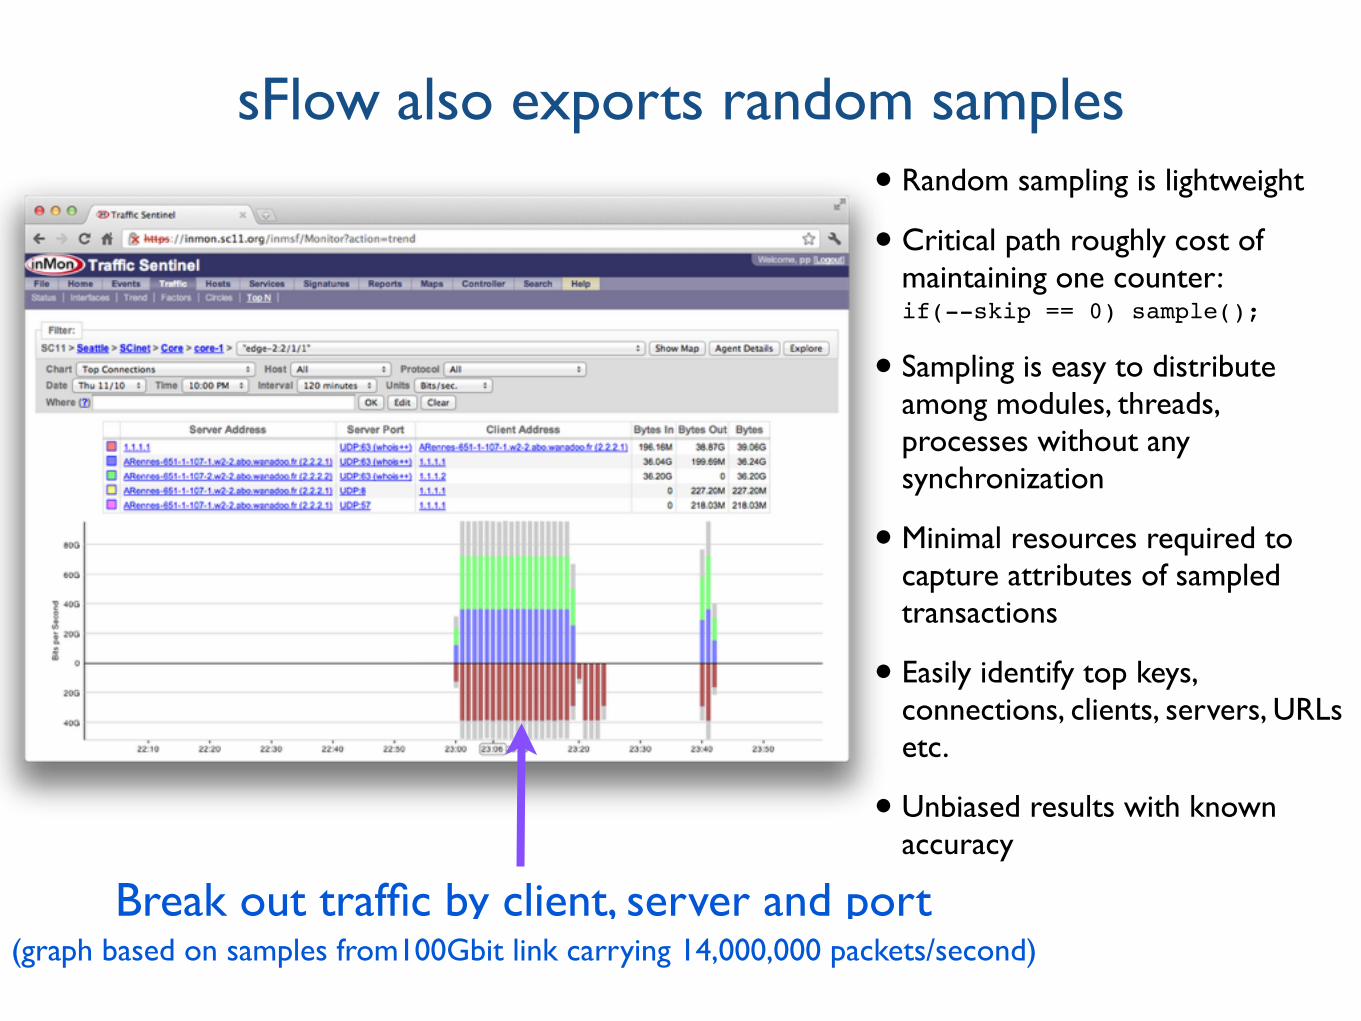
• Random sampling is lightweight
• Critical path roughly cost of maintaining one counter: if(--skip == 0) sample();
• Sampling is easy to distribute among modules, threads, processes without any synchronization
• Minimal resources required to capture attributes of sampled transactions
• Easily identify top keys, connections, clients, servers, URLs etc.
• Unbiased results with known accuracy
Break out traffic by client, server and port (graph based on samples from100Gbit link carrying 14,000,000 packets/second)
sFlow also exports random samples
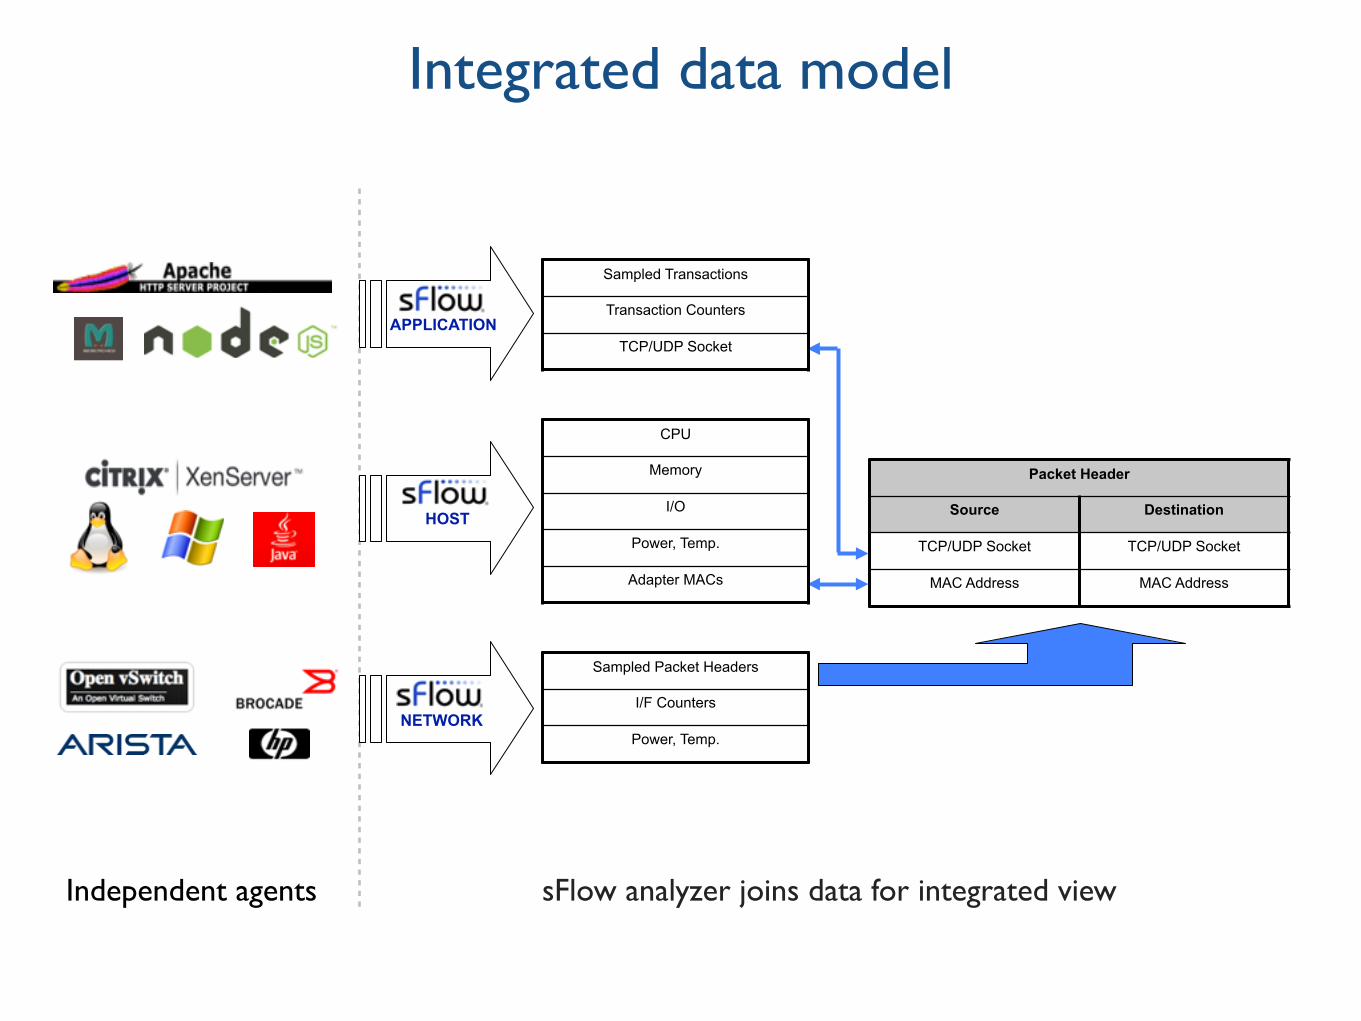
Integrated data model
Packet Header
Source Destination
TCP/UDP Socket TCP/UDP Socket
MAC Address MAC Address
Sampled Packet Headers
I/F Counters
Power, Temp.NETWORK
HOST
CPU
Memory
I/O
Power, Temp.
Adapter MACs
APPLICATION
Sampled Transactions
Transaction Counters
TCP/UDP Socket
Independent agents sFlow analyzer joins data for integrated view
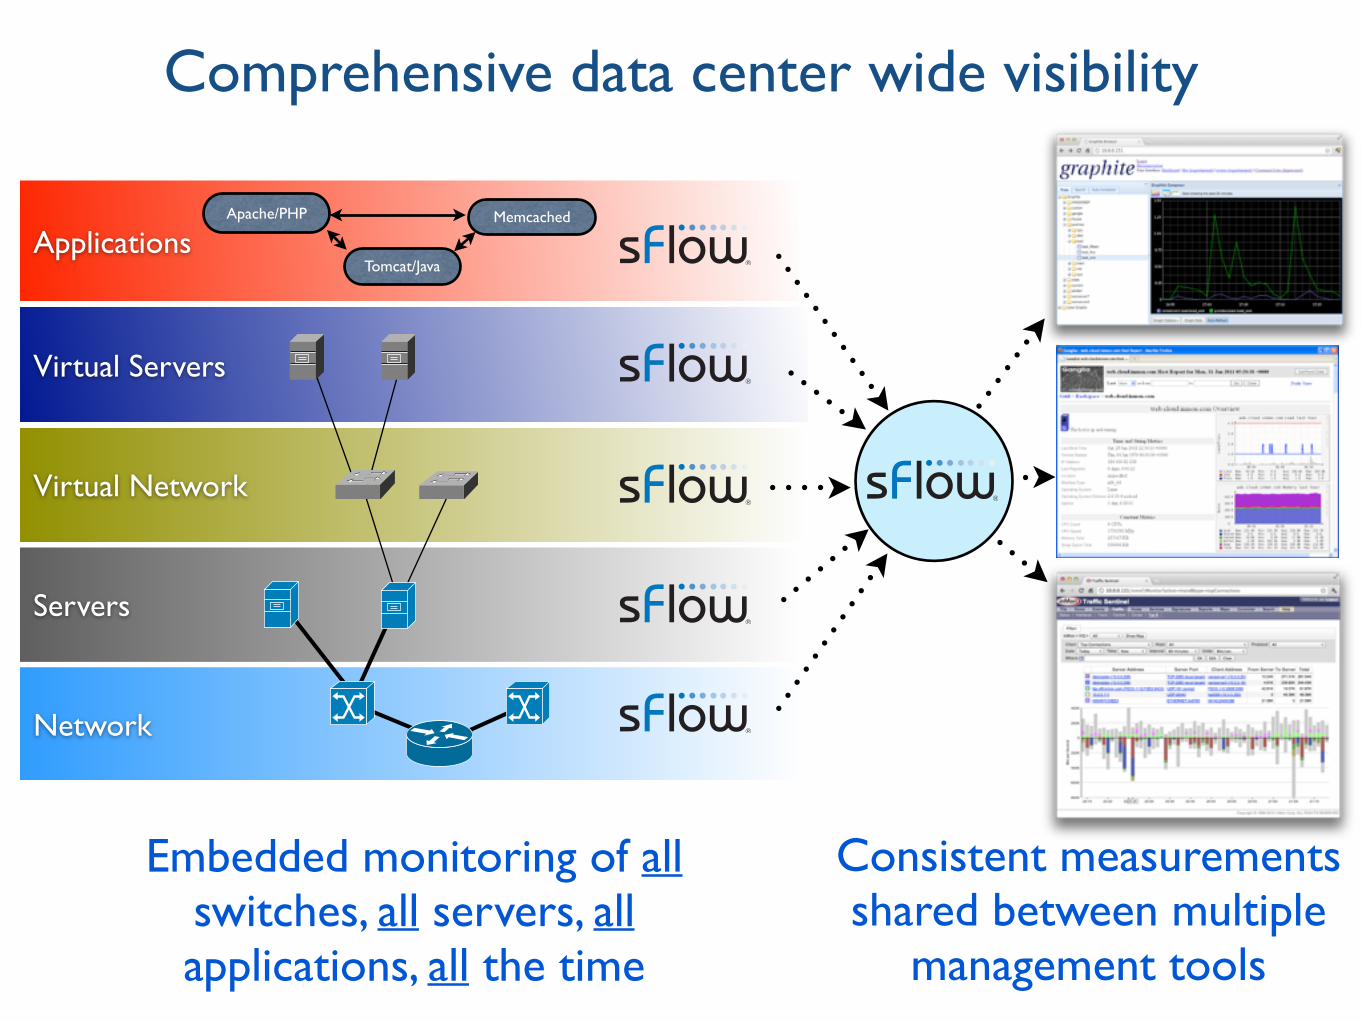
Embedded monitoring of all switches, all
Virtual Servers
ApplicationsApache/PHP
Tomcat/Java
Memcached
Virtual Network
Servers
Network
Embedded monitoring of all switches, all servers, all applications, all the time
Consistent measurements shared between multiple
management tools
Comprehensive data center wide visibility
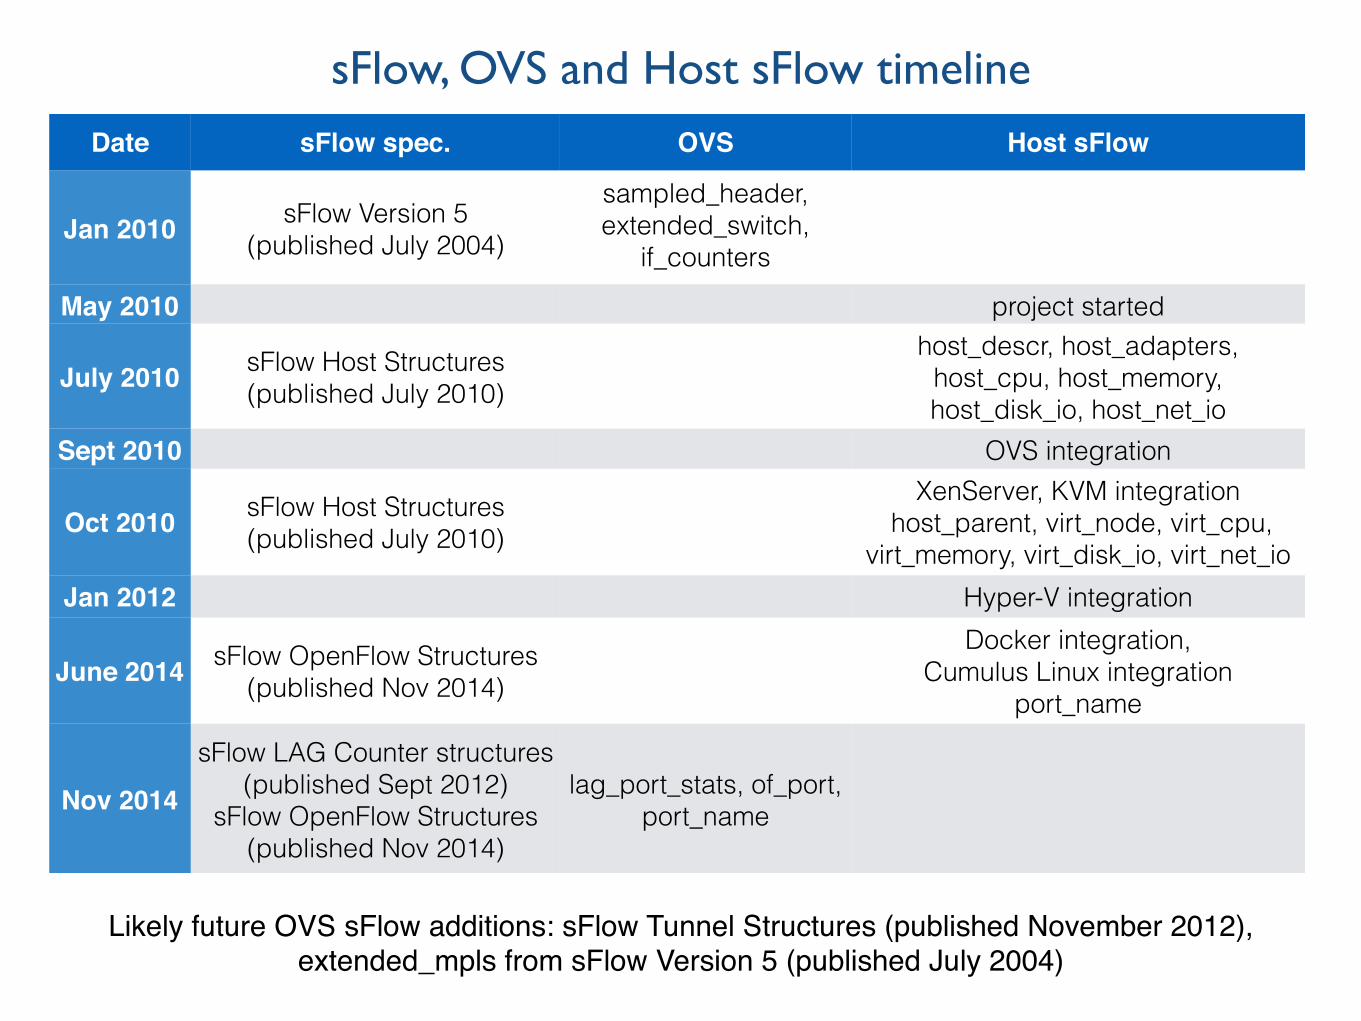
Date sFlow spec. OVS Host sFlow
Jan 2010 sFlow Version 5(published July 2004)
sampled_header, extended_switch,
if_counters
May 2010 project started
July 2010 sFlow Host Structures (published July 2010)
host_descr, host_adapters, host_cpu, host_memory, host_disk_io, host_net_io
Sept 2010 OVS integration
Oct 2010 sFlow Host Structures (published July 2010)
XenServer, KVM integration host_parent, virt_node, virt_cpu,
virt_memory, virt_disk_io, virt_net_io Jan 2012 Hyper-V integration
June 2014 sFlow OpenFlow Structures(published Nov 2014)
Docker integration, Cumulus Linux integration
port_name
Nov 2014
sFlow LAG Counter structures (published Sept 2012)
sFlow OpenFlow Structures (published Nov 2014)
lag_port_stats, of_port, port_name
Likely future OVS sFlow additions: sFlow Tunnel Structures (published November 2012), extended_mpls from sFlow Version 5 (published July 2004)
sFlow, OVS and Host sFlow timeline
Software Defined Networking
“You can’t control what you can’t measure”Tom DeMarco
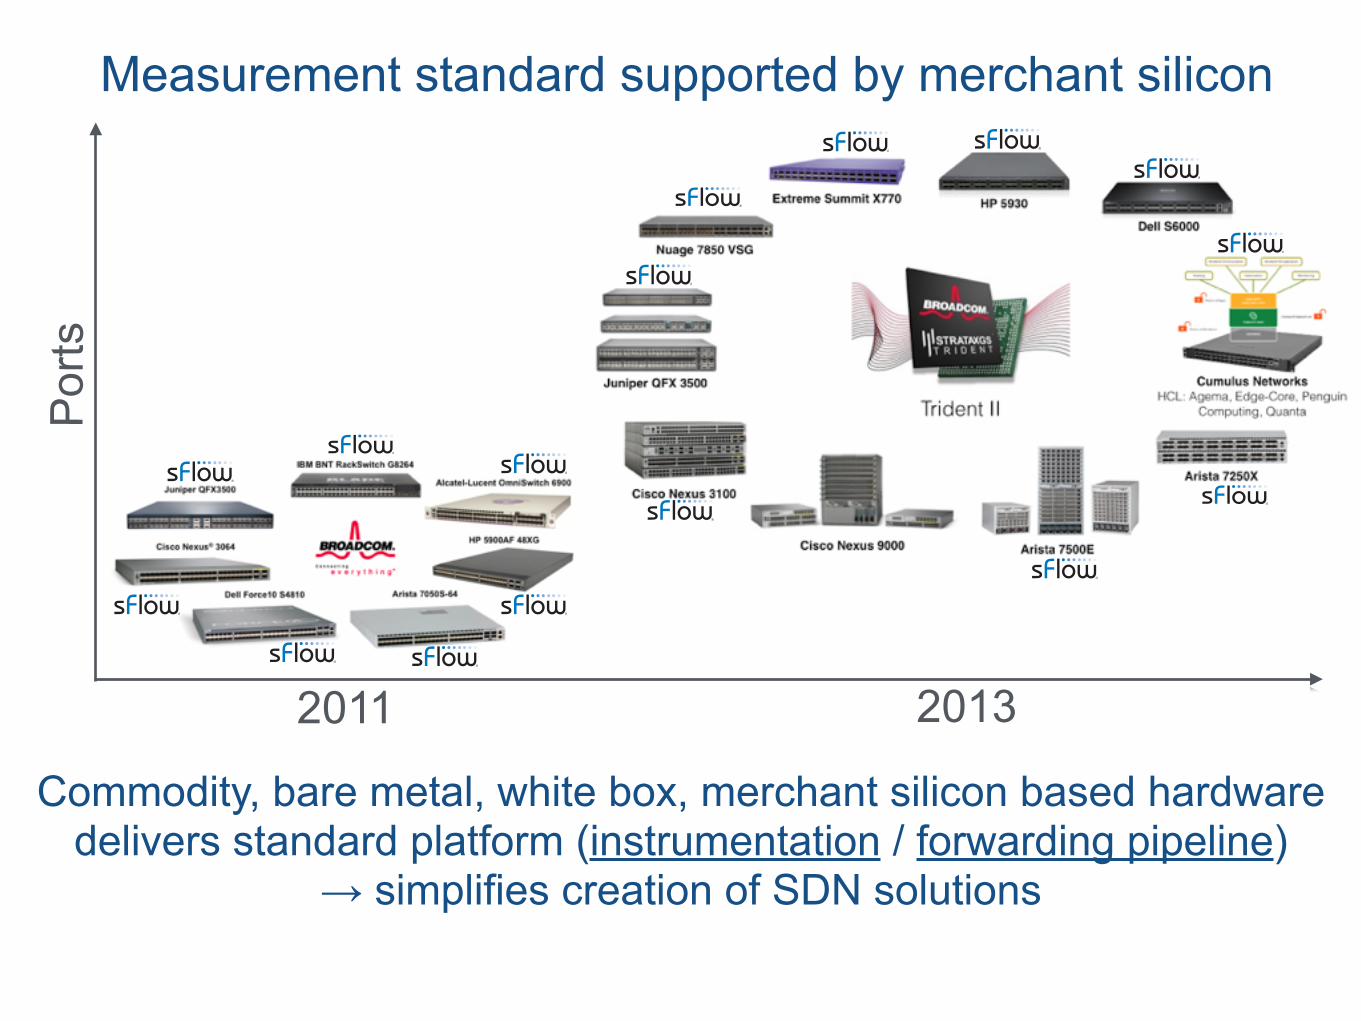
Measurement standard supported by merchant silicon
20132011
Por
ts
Commodity, bare metal, white box, merchant silicon based hardware delivers standard platform (instrumentation / forwarding pipeline)
→ simplifies creation of SDN solutions
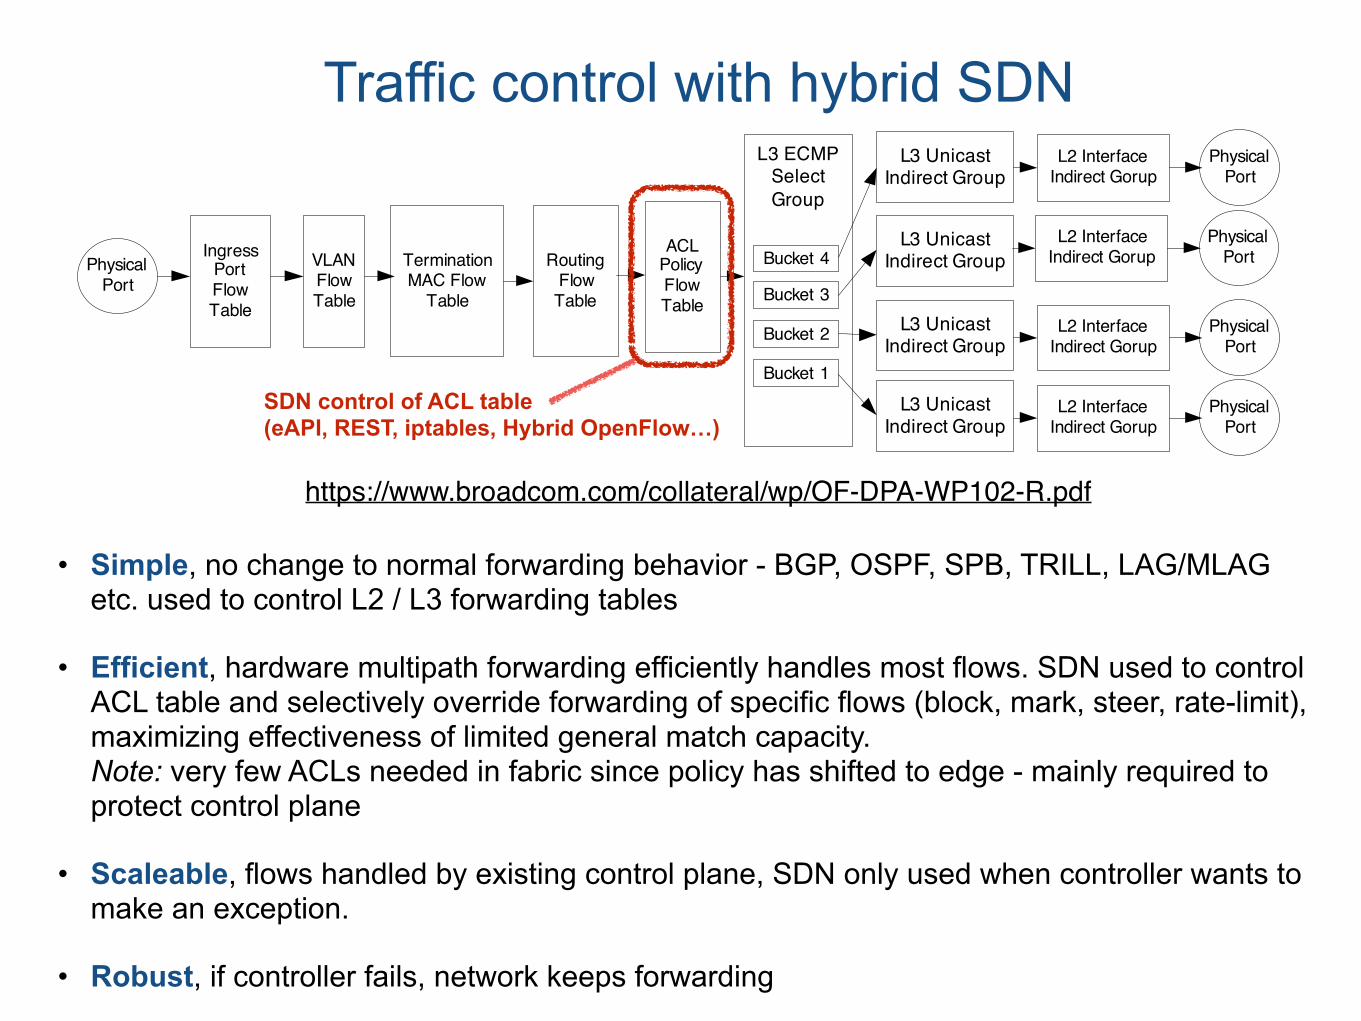
• Simple, no change to normal forwarding behavior - BGP, OSPF, SPB, TRILL, LAG/MLAG etc. used to control L2 / L3 forwarding tables
• Efficient, hardware multipath forwarding efficiently handles most flows. SDN used to control ACL table and selectively override forwarding of specific flows (block, mark, steer, rate-limit), maximizing effectiveness of limited general match capacity.Note: very few ACLs needed in fabric since policy has shifted to edge - mainly required to protect control plane
• Scaleable, flows handled by existing control plane, SDN only used when controller wants to make an exception.
• Robust, if controller fails, network keeps forwarding
Traffic control with hybrid SDN
WHITE PAPER: Engineered Elephant Flows in Large Scale CLOS Networks
OF-DPA-WP102-R 6
Using OpenFlow 1.3.1 to Build ECMP Networks OpenFlow v1.0 uses only a single flow table with packet editing and forwarding actions in an action list. With OpenFlow v1.0 wildcard, flow entries can be used to forward packets as macro flows, with little or no controller intervention. But for OpenFlow v1.0 to support multipath load balancing, the controller needs to reactively place each flow independently as a separate micro flow. As a result, large numbers of flow entries are required, as well as significantly more transactions with the controller. Since OpenFlow v1.0 implementations on commodity switches can only utilize a TCAM for load balancing, the total number of flows required can easily exceed what the relatively low cost switches provide.
OpenFlow v1.3.1 by contrast uses multiple flow tables, but more significantly, provides the group table that can be used to leverage the multipath hashing capabilities in switch hardware. The OpenFlow v1.3.1 “select” group type is designed to map directly to hardware ECMP group tables. As a result, most forwarding can be handled using macro flows with significantly fewer entries in the flow table. In addition, multiple tables can be used to minimize the “cross-product explosion” effect of using a single table. With OpenFlow Data Plane Abstraction (OF-DPA), an OpenFlow v1.3.1 Controller could set up the routes and ECMP group forwarding for all of the infrastructure switches. In particular, it can be used to populate the routing tables and select groups for multipath. In this scenario, the controller uses LLDP to map the topology and detect link failures. The controller also polls switches for port statistics and keeps track of the overall health of the network.
The OF-DPA flow tables and group tables that would be used for this application are shown in Figure 3. These are programmed from an OpenFlow Controller using standard OpenFlow 1.3.1 protocol messages. The VLAN Flow table is used to allow particular VLANs on a port or to assign a VLAN to untagged packets. The Termination MAC Flow table is used to recognize the router MAC. Forwarding rules are installed in the Routing Flow table after the output groups are defined. The L2 Interface group entries define the tagging policy for egress member ports, the L3 Unicast group entries provide the packet editing actions for the next hop header, and the L3 ECMP group entry selects an output member based on hardware hashing.
FIGURE 3: OF-DPA Programming Pipeline for ECMP
One of the advantages of using OF-DPA is that it can install customized ECMP select groups. For example, rather than being limited to the fixed N-way ECMP groupings that would be installed by a distributed routing protocol, the OpenFlow Controller can use OF-DPA to install finer grained groups with buckets for different sets of ECMP members, e.g., it can assign groups to flows. It can also customize the select groups to realized different weights for different members.
VLAN Flow Table
Termination MAC Flow
Table
ACL Policy Flow Table
Routing Flow Table
Ingress Port Flow Table
L3 ECMP Select Group
Bucket 1
Bucket 2
Bucket 3
Bucket 4
L3 Unicast Indirect Group
L3 Unicast Indirect Group
L3 Unicast Indirect Group
L3 Unicast Indirect Group
L2 Interface Indirect Gorup
Physical Port
L2 Interface Indirect Gorup
Physical Port
L2 Interface Indirect Gorup
Physical Port
L2 Interface Indirect Gorup
Physical Port
Physical Port
SDN control of ACL table (eAPI, REST, iptables, Hybrid OpenFlow…)
https://www.broadcom.com/collateral/wp/OF-DPA-WP102-R.pdf
Cumulus Linux
Cumulus LinuxCumulus Linux
Cumulus Linux
ECMP Fabric
Hypervisor
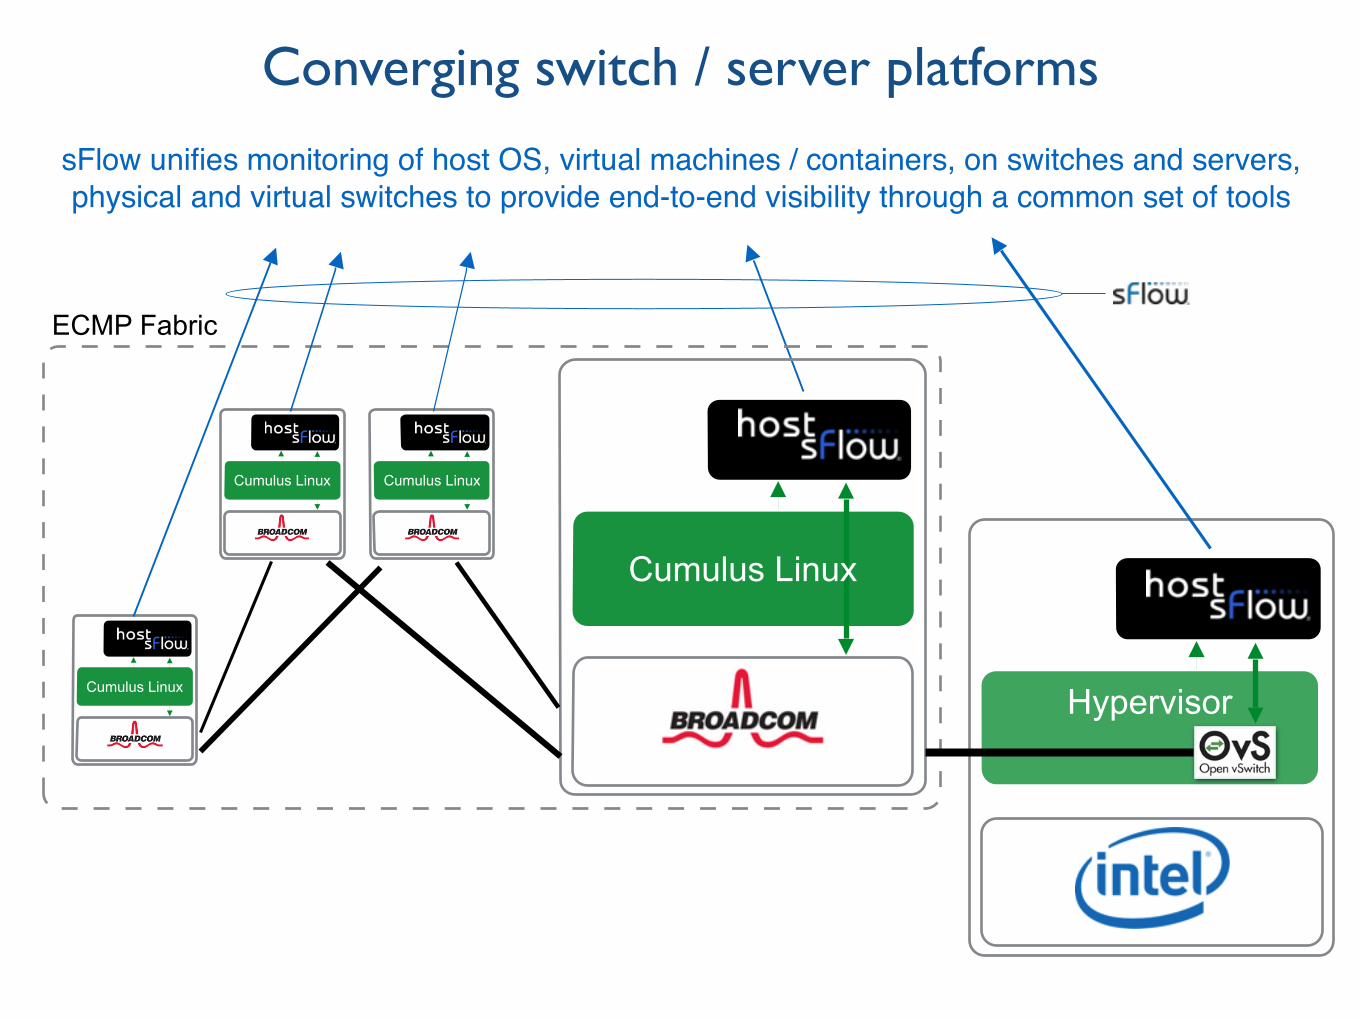
Converging switch / server platforms
sFlow unifies monitoring of host OS, virtual machines / containers, on switches and servers, physical and virtual switches to provide end-to-end visibility through a common set of tools
Cumulus Linux
Cumulus LinuxCumulus Linux
Cumulus Linux
ECMP Fabric
Hypervisor
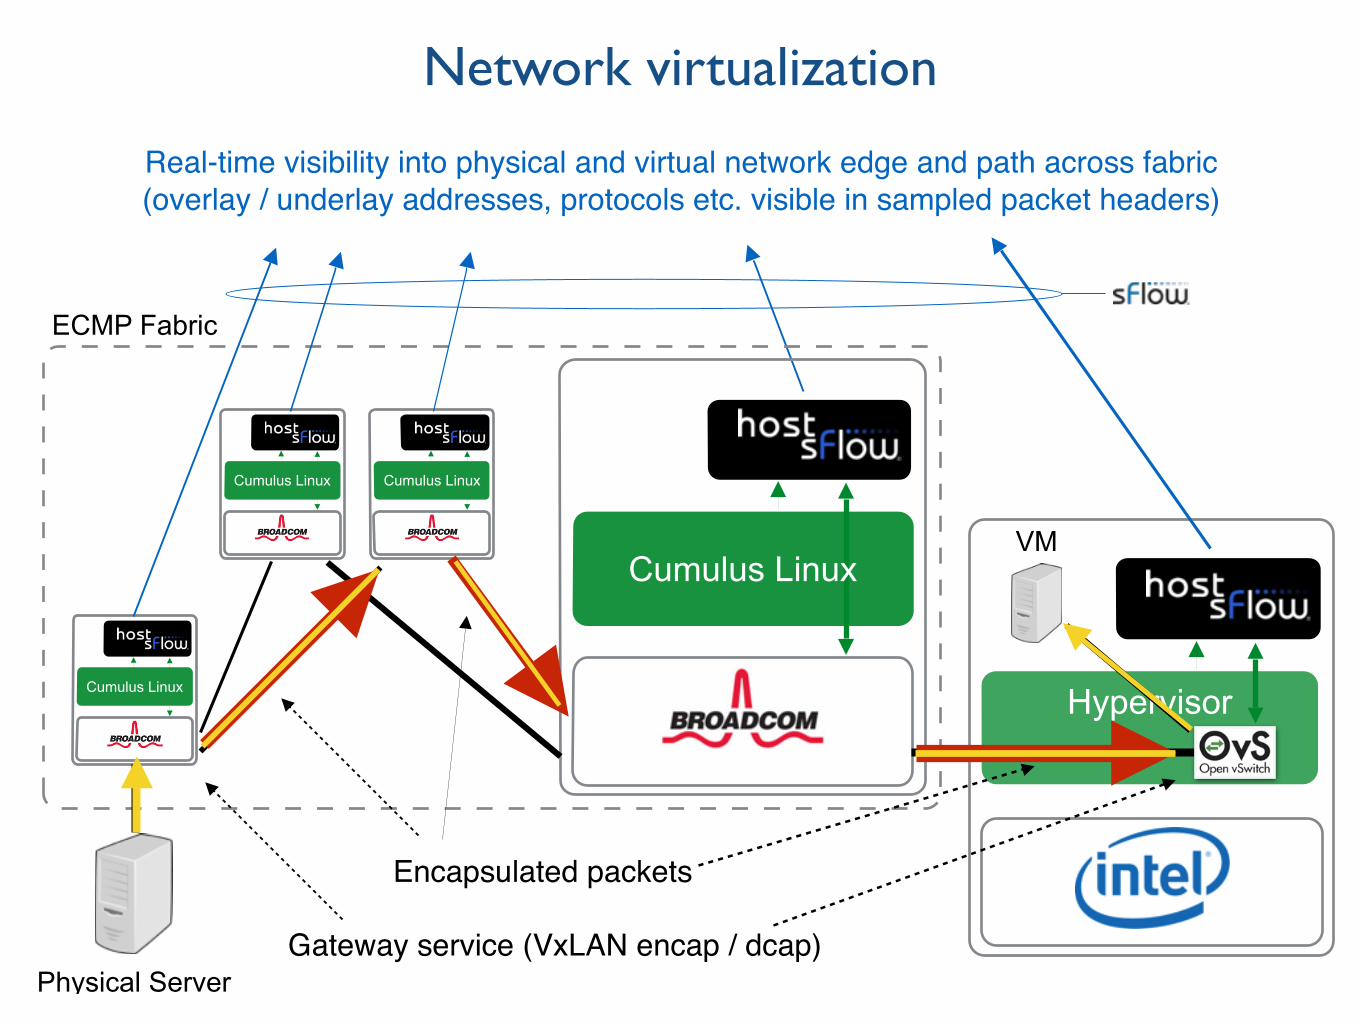
Network virtualization
Real-time visibility into physical and virtual network edge and path across fabric(overlay / underlay addresses, protocols etc. visible in sampled packet headers)
Physical ServerGateway service (VxLAN encap / dcap)
Encapsulated packets
VM
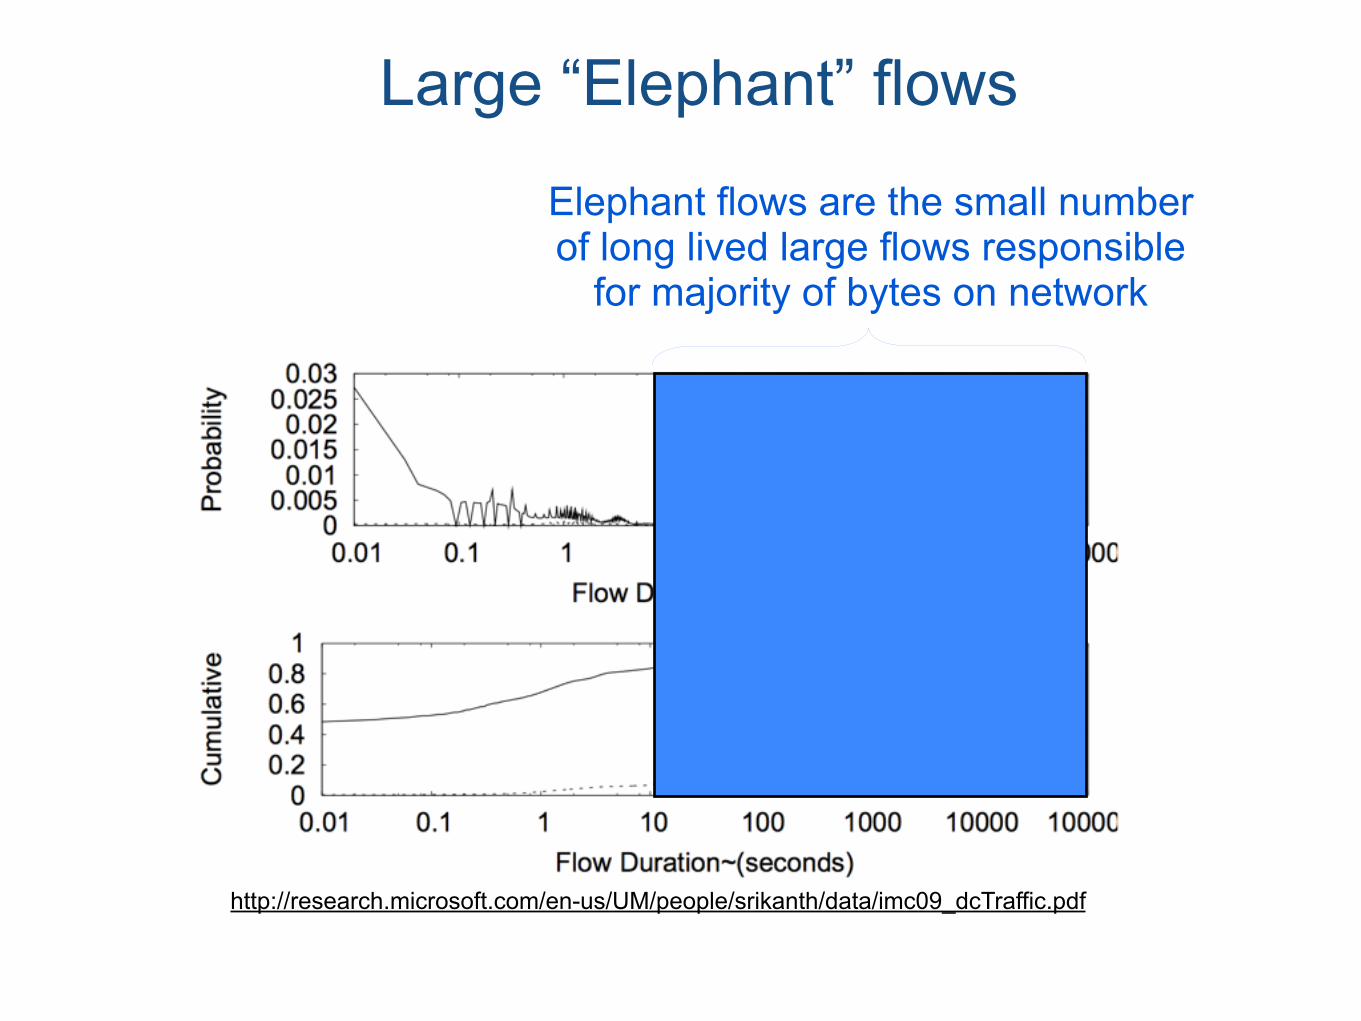
Large “Elephant” flows
http://research.microsoft.com/en-us/UM/people/srikanth/data/imc09_dcTraffic.pdf
Elephant flows are the small number of long lived large flows responsible
for majority of bytes on network
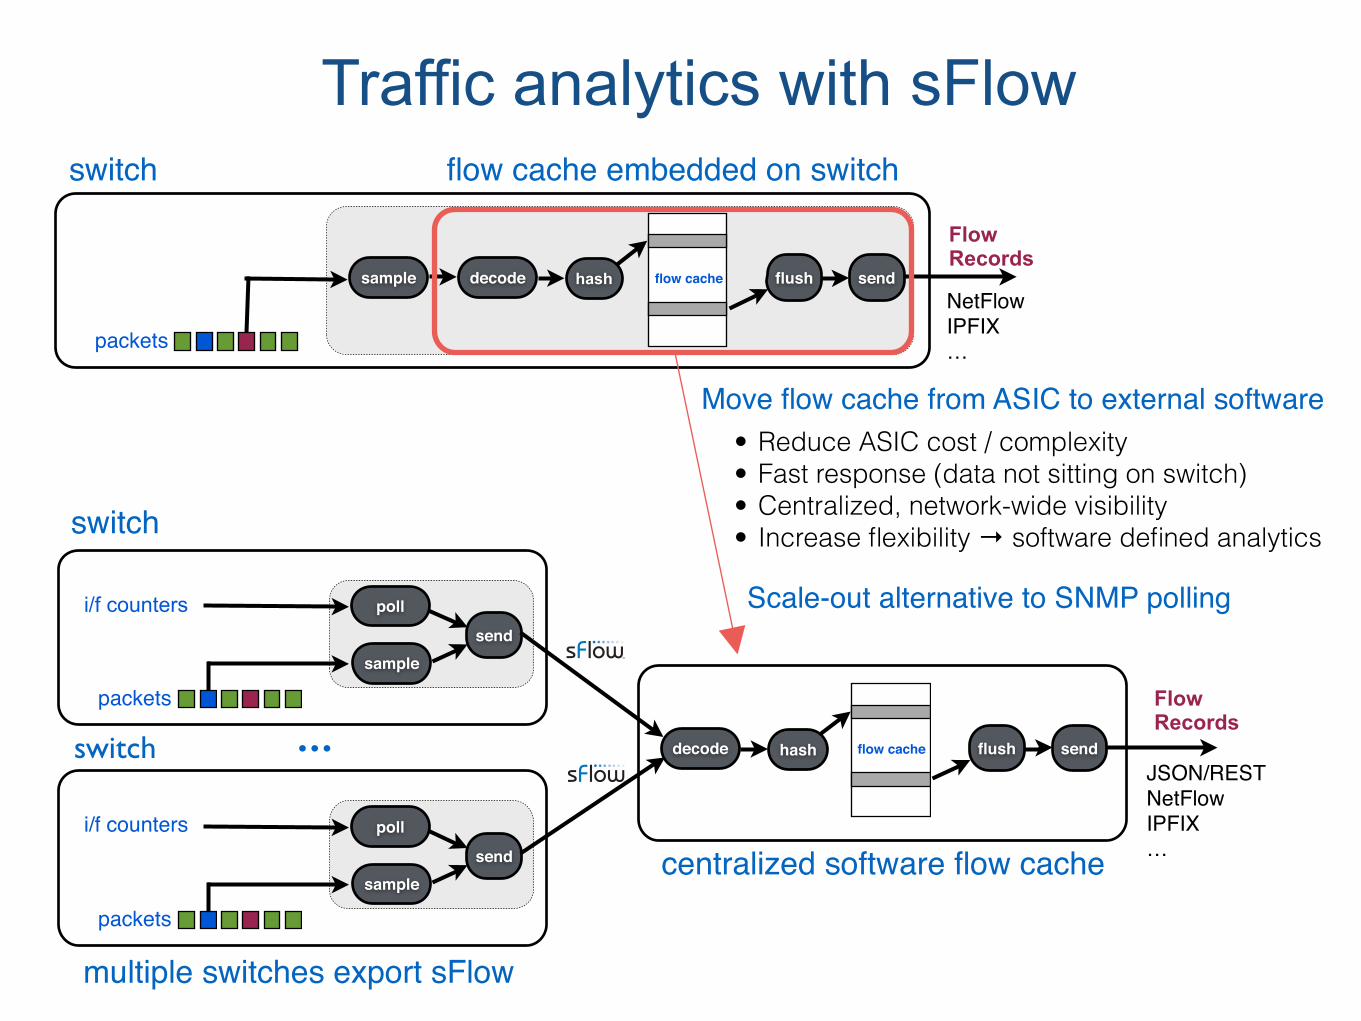
packets
decode hash sendflow cache flushsample
Flow Records
flow cache embedded on switchswitch
NetFlowIPFIX…
decode hash sendflow cache flush
Flow Records
packets
send
polli/f counters
sample
multiple switches export sFlowpackets
send
polli/f counters
sample
...
centralized software flow cache
switch
switchJSON/RESTNetFlowIPFIX…
• Reduce ASIC cost / complexity • Fast response (data not sitting on switch) • Centralized, network-wide visibility • Increase flexibility → software defined analytics
Move flow cache from ASIC to external software
Scale-out alternative to SNMP polling
Traffic analytics with sFlow
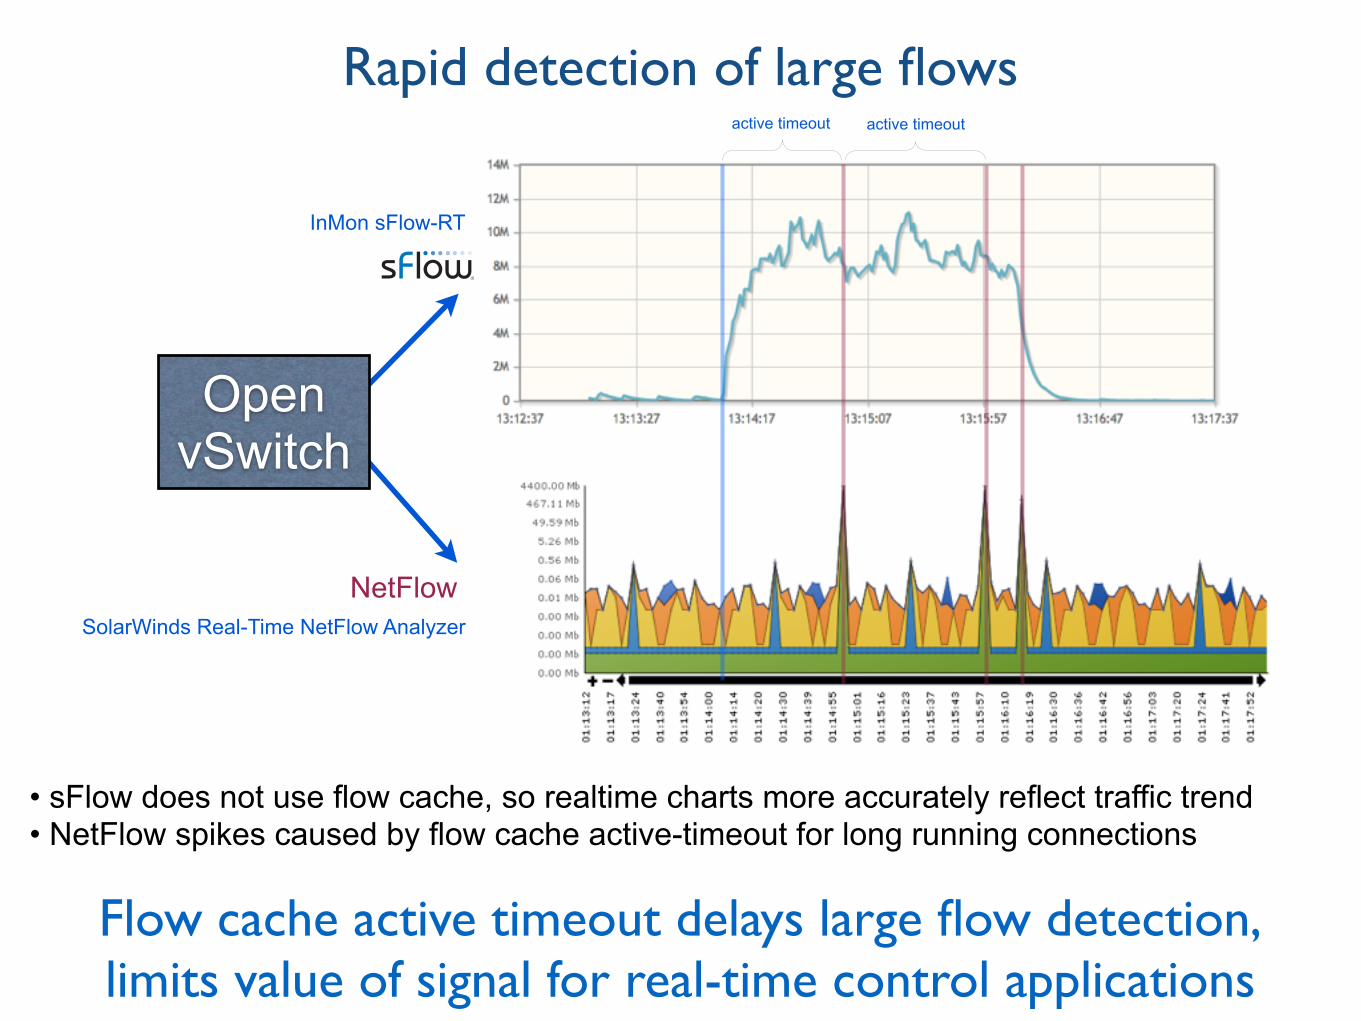
InMon sFlow-RT
active timeout active timeout
NetFlow
Open vSwitch
SolarWinds Real-Time NetFlow Analyzer
• sFlow does not use flow cache, so realtime charts more accurately reflect traffic trend • NetFlow spikes caused by flow cache active-timeout for long running connections
Rapid detection of large flows
Flow cache active timeout delays large flow detection,limits value of signal for real-time control applications
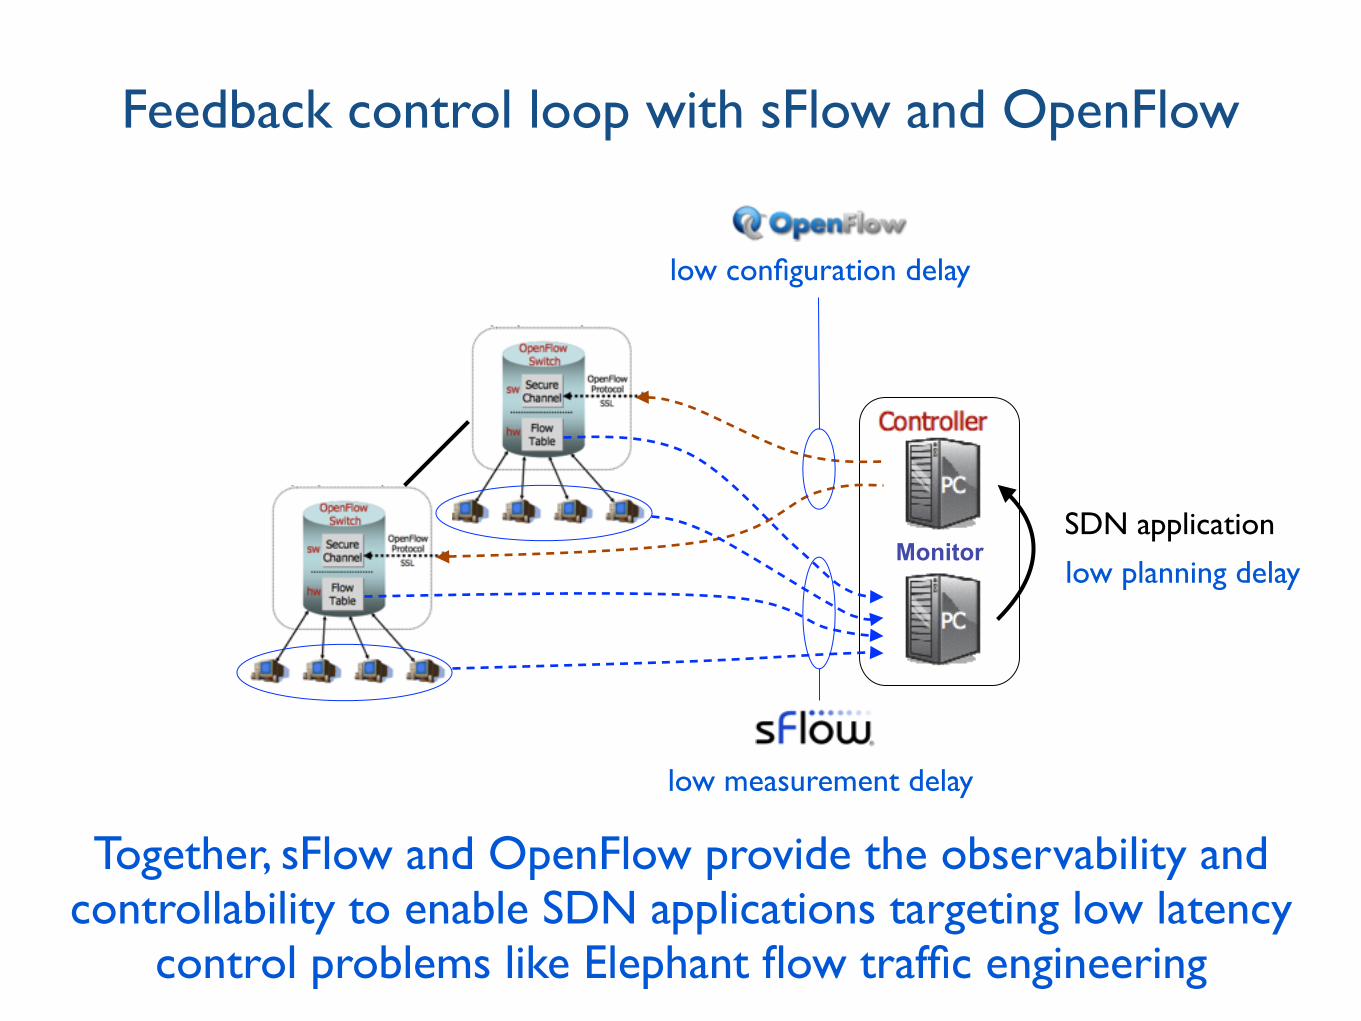
Monitor
Feedback control loop with sFlow and OpenFlow
low configuration delay
low measurement delay
Together, sFlow and OpenFlow provide the observability and controllability to enable SDN applications targeting low latency
control problems like Elephant flow traffic engineering
low planning delay
SDN application
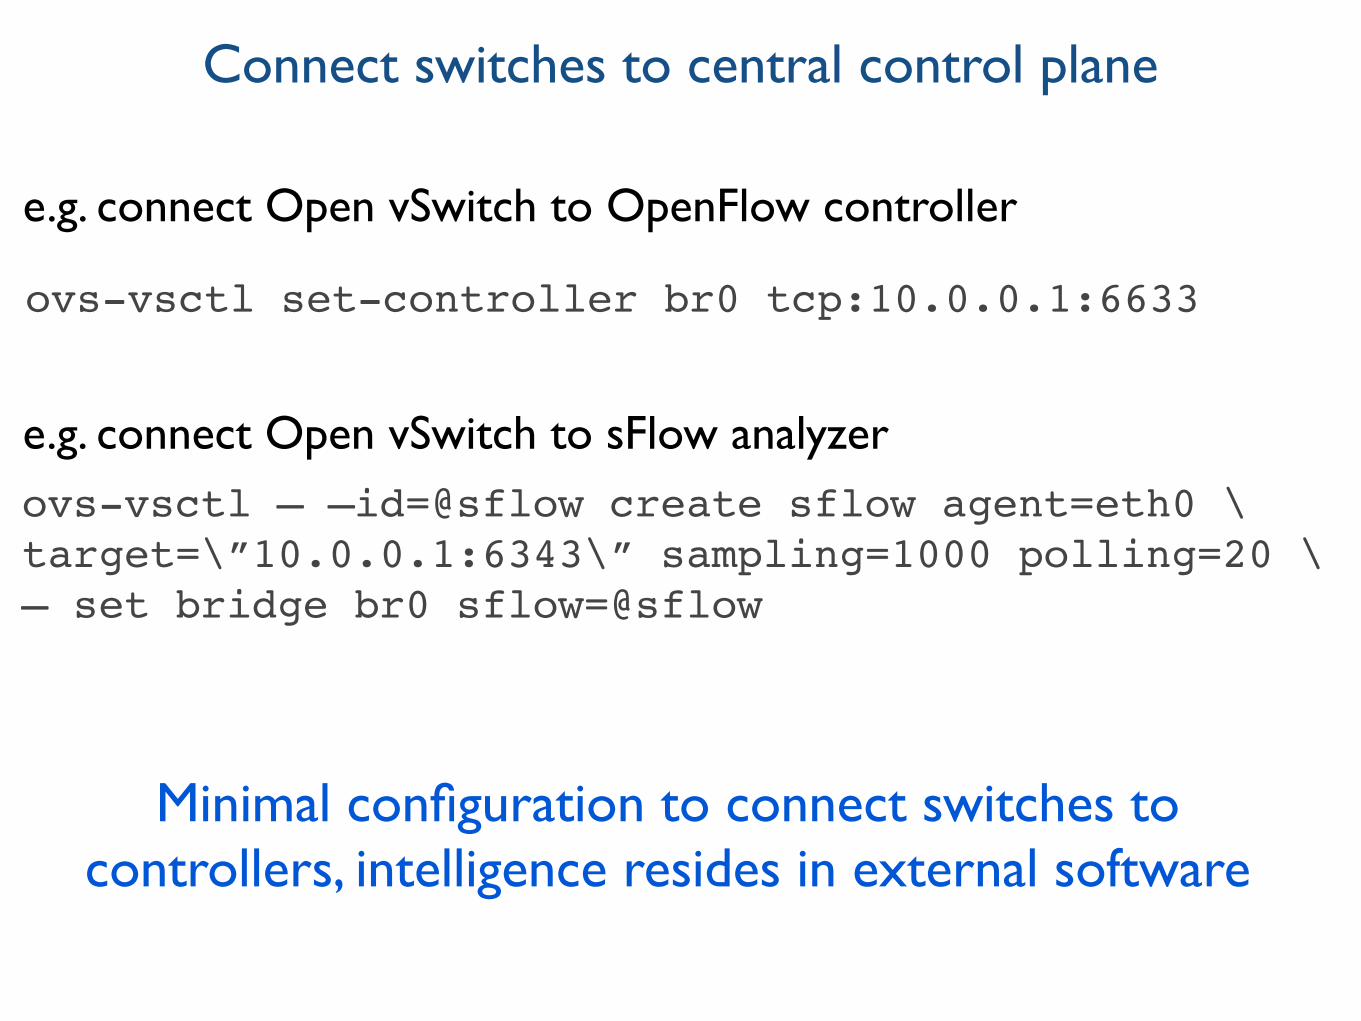
ovs-vsctl set-controller br0 tcp:10.0.0.1:6633
ovs-vsctl — –id=@sflow create sflow agent=eth0 \target=\”10.0.0.1:6343\” sampling=1000 polling=20 \— set bridge br0 sflow=@sflow
Connect switches to central control plane
e.g. connect Open vSwitch to OpenFlow controller
e.g. connect Open vSwitch to sFlow analyzer
Minimal configuration to connect switches to controllers, intelligence resides in external software
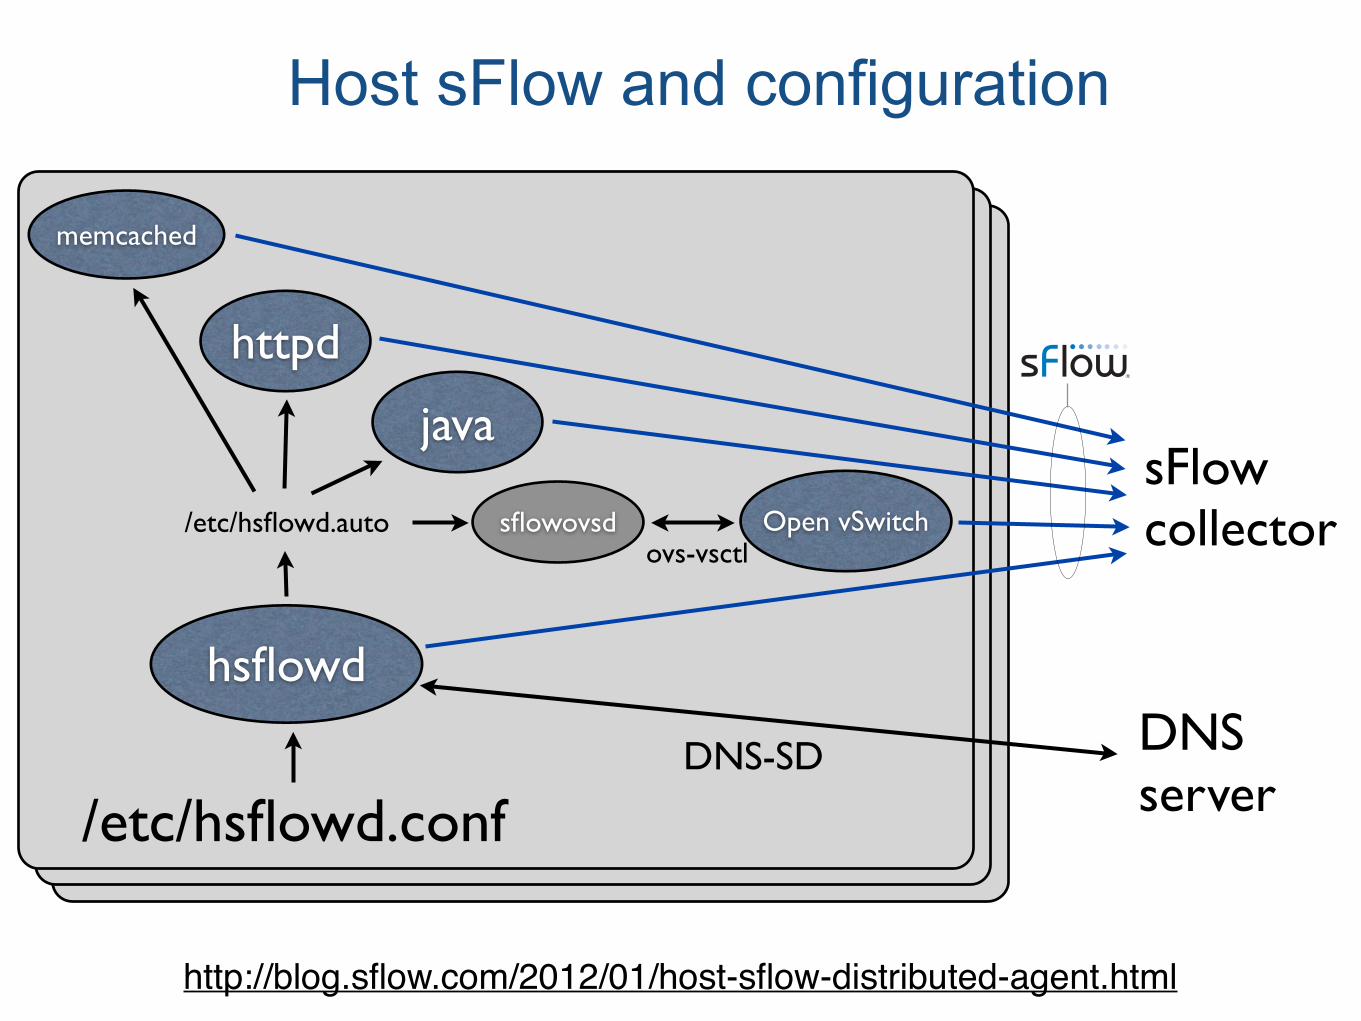
hsflowd
/etc/hsflowd.conf
/etc/hsflowd.auto sflowovsd Open vSwitchovs-vsctl
java
httpd
memcached
DNS-SD DNSserver
sFlowcollector
Host sFlow and configuration
http://blog.sflow.com/2012/01/host-sflow-distributed-agent.html
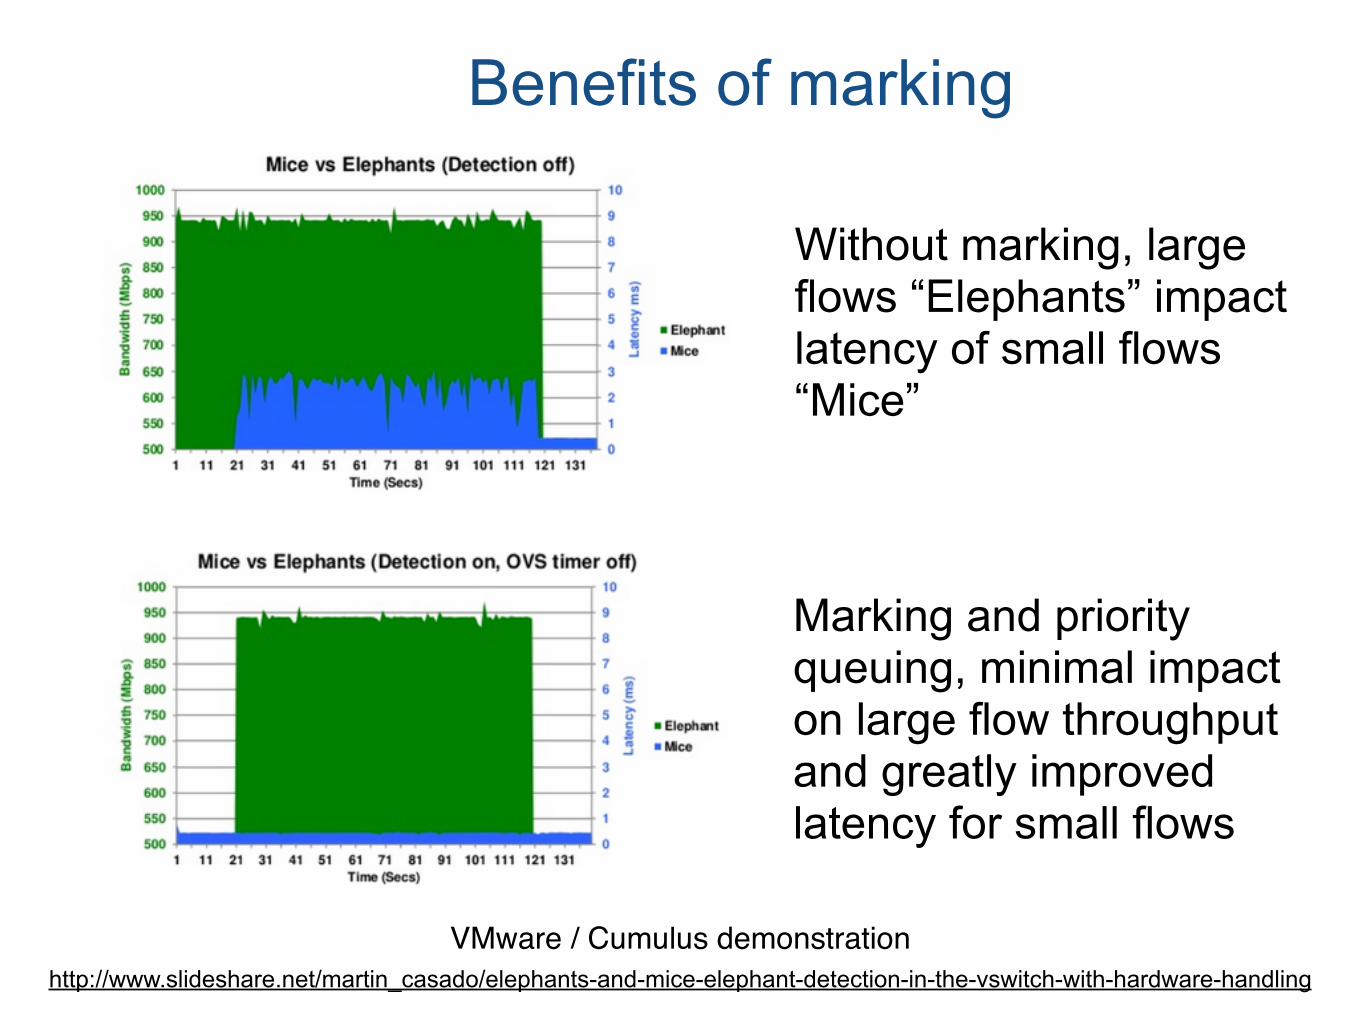
Benefits of marking
Without marking, large flows “Elephants” impact latency of small flows “Mice”
Marking and priority queuing, minimal impact on large flow throughput and greatly improved latency for small flows
http://www.slideshare.net/martin_casado/elephants-and-mice-elephant-detection-in-the-vswitch-with-hardware-handlingVMware / Cumulus demonstration
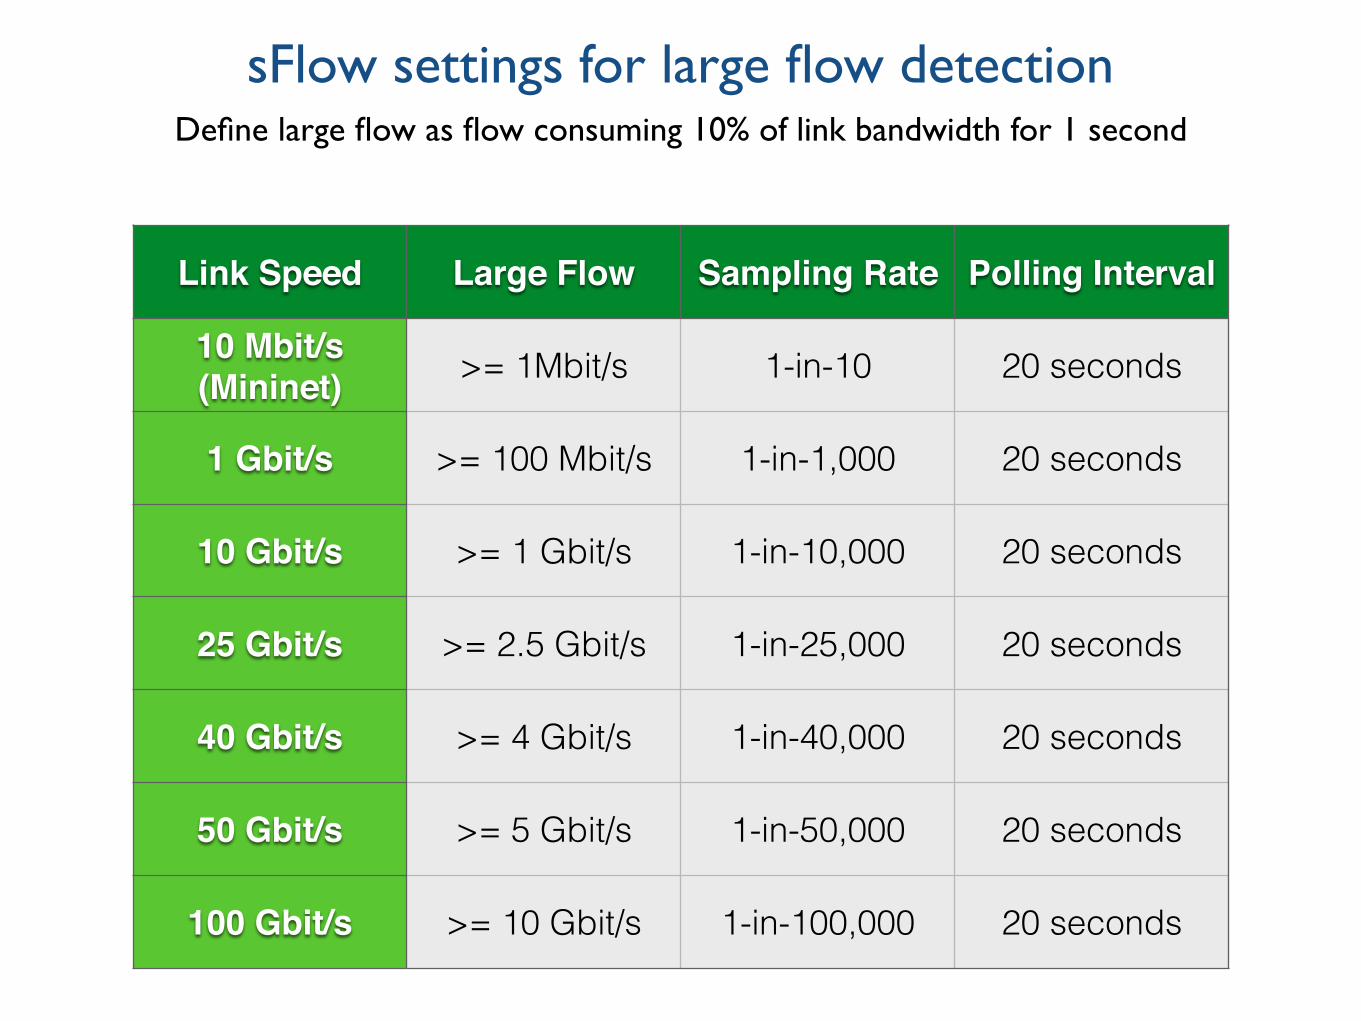
Link Speed Large Flow Sampling Rate Polling Interval
10 Mbit/s (Mininet) >= 1Mbit/s 1-in-10 20 seconds
1 Gbit/s >= 100 Mbit/s 1-in-1,000 20 seconds
10 Gbit/s >= 1 Gbit/s 1-in-10,000 20 seconds
25 Gbit/s >= 2.5 Gbit/s 1-in-25,000 20 seconds
40 Gbit/s >= 4 Gbit/s 1-in-40,000 20 seconds
50 Gbit/s >= 5 Gbit/s 1-in-50,000 20 seconds
100 Gbit/s >= 10 Gbit/s 1-in-100,000 20 seconds
sFlow settings for large flow detectionDefine large flow as flow consuming 10% of link bandwidth for 1 second
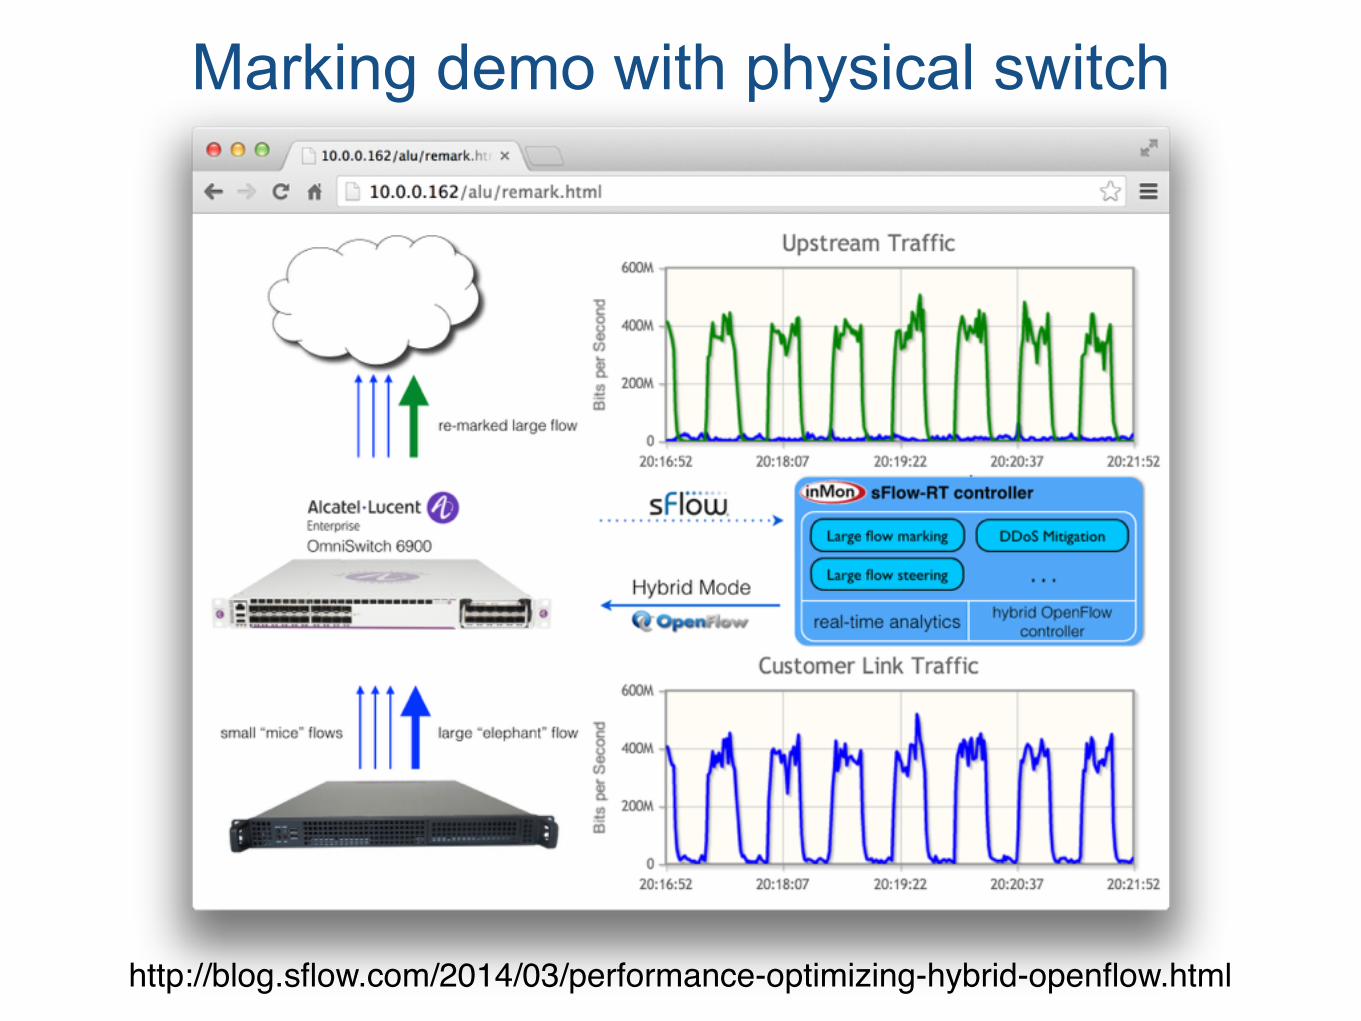
Marking demo with physical switch
http://blog.sflow.com/2014/03/performance-optimizing-hybrid-openflow.html
10.0.0.1 10.0.0.2 10.0.0.3
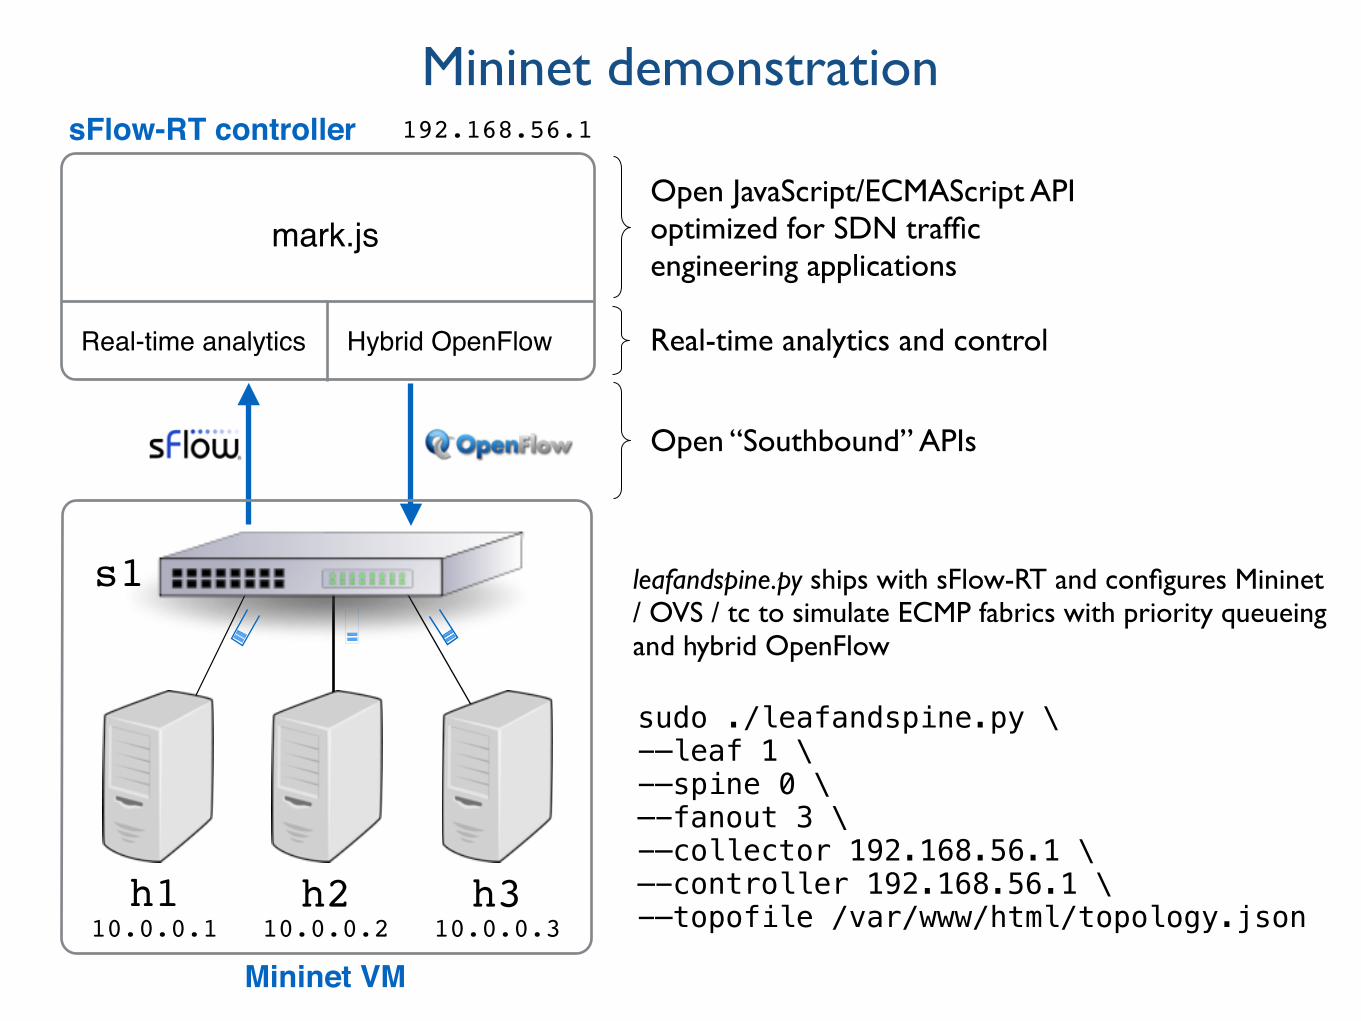
Mininet demonstration
s1
h1 h2 h3
Mininet VM
sFlow-RT controller
mark.js
Real-time analytics Hybrid OpenFlow
Open “Southbound” APIs
Real-time analytics and control
Open JavaScript/ECMAScript API optimized for SDN traffic engineering applications
sudo ./leafandspine.py \ -—leaf 1 \ -—spine 0 \ —-fanout 3 \ -—collector 192.168.56.1 \ —-controller 192.168.56.1 \ -—topofile /var/www/html/topology.json
leafandspine.py ships with sFlow-RT and configures Mininet / OVS / tc to simulate ECMP fabrics with priority queueing and hybrid OpenFlow
192.168.56.1
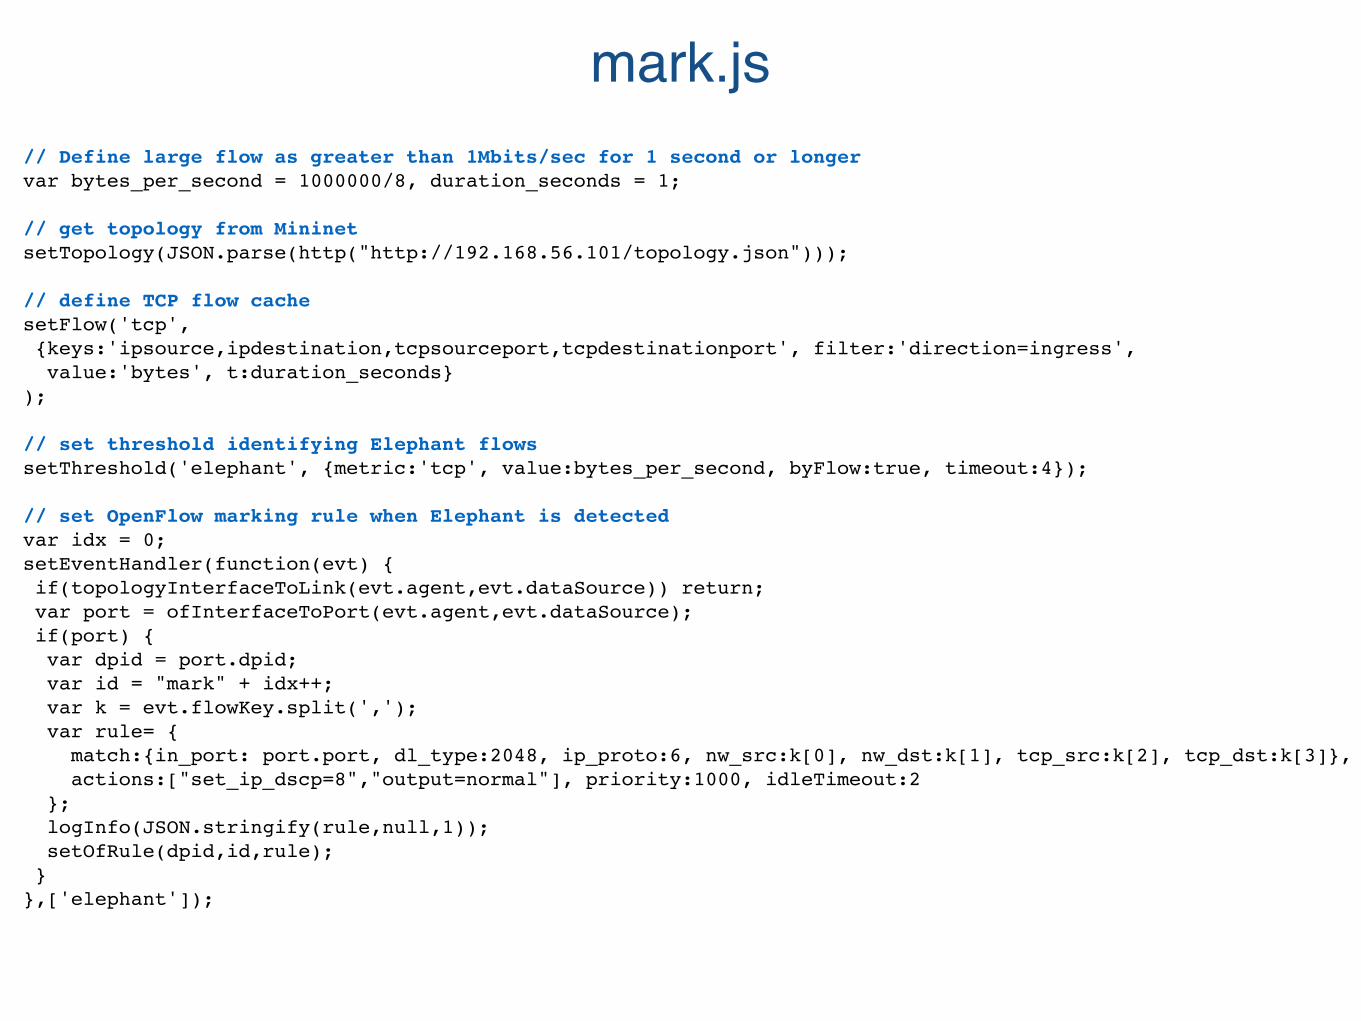
// Define large flow as greater than 1Mbits/sec for 1 second or longervar bytes_per_second = 1000000/8, duration_seconds = 1;
// get topology from MininetsetTopology(JSON.parse(http("http://192.168.56.101/topology.json")));
// define TCP flow cachesetFlow('tcp', {keys:'ipsource,ipdestination,tcpsourceport,tcpdestinationport', filter:'direction=ingress', value:'bytes', t:duration_seconds});
// set threshold identifying Elephant flowssetThreshold('elephant', {metric:'tcp', value:bytes_per_second, byFlow:true, timeout:4});
// set OpenFlow marking rule when Elephant is detectedvar idx = 0;setEventHandler(function(evt) { if(topologyInterfaceToLink(evt.agent,evt.dataSource)) return; var port = ofInterfaceToPort(evt.agent,evt.dataSource); if(port) { var dpid = port.dpid; var id = "mark" + idx++; var k = evt.flowKey.split(','); var rule= { match:{in_port: port.port, dl_type:2048, ip_proto:6, nw_src:k[0], nw_dst:k[1], tcp_src:k[2], tcp_dst:k[3]}, actions:["set_ip_dscp=8","output=normal"], priority:1000, idleTimeout:2 }; logInfo(JSON.stringify(rule,null,1)); setOfRule(dpid,id,rule); }},['elephant']);
mark.js
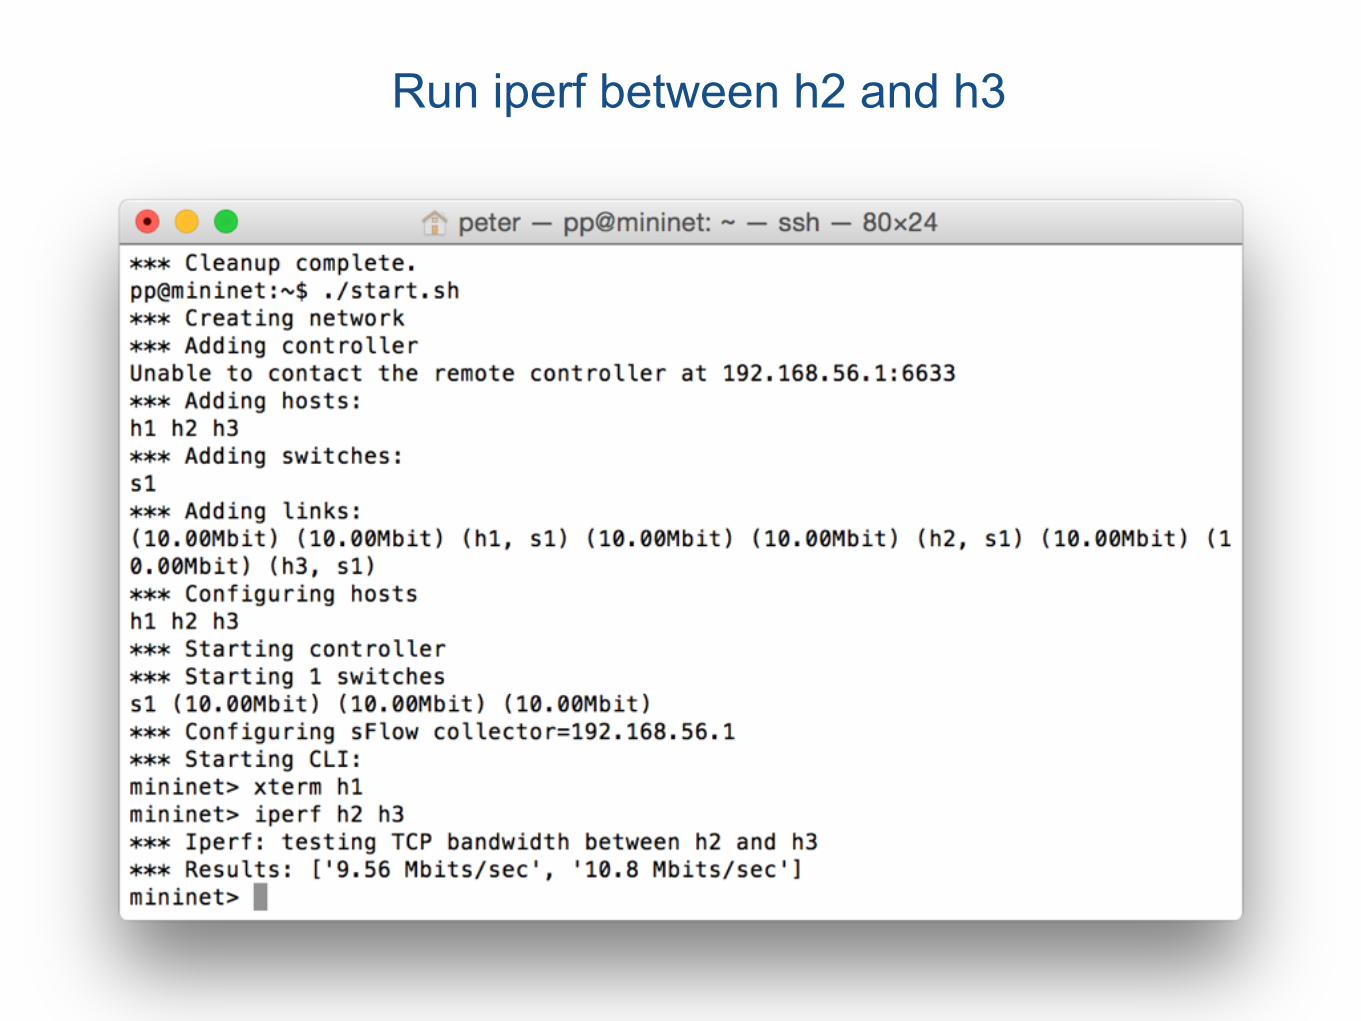
Run iperf between h2 and h3
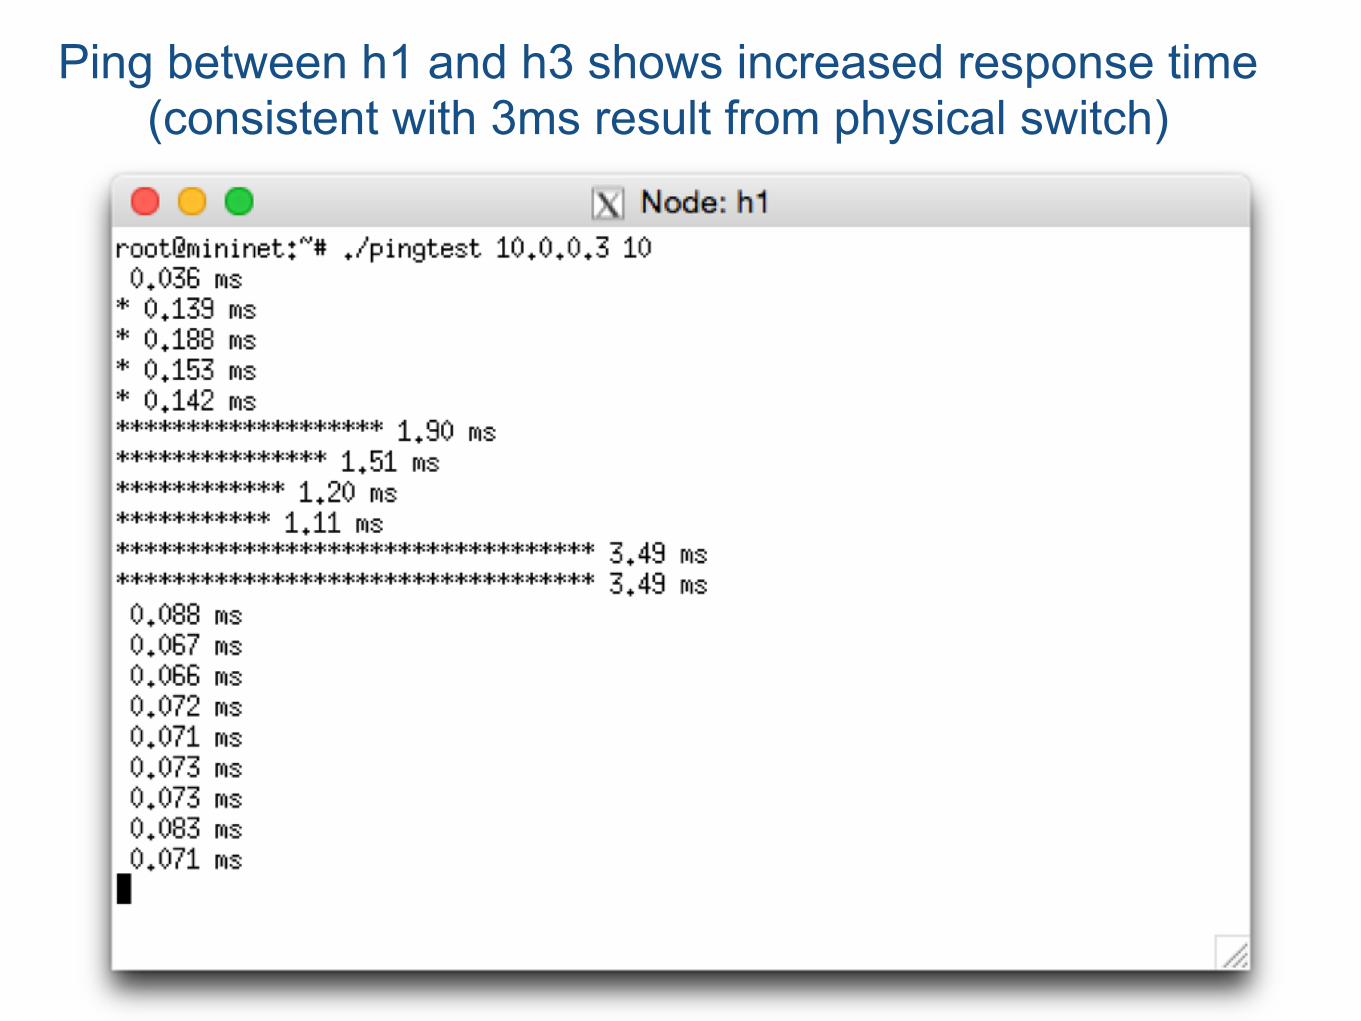
Ping between h1 and h3 shows increased response time (consistent with 3ms result from physical switch)
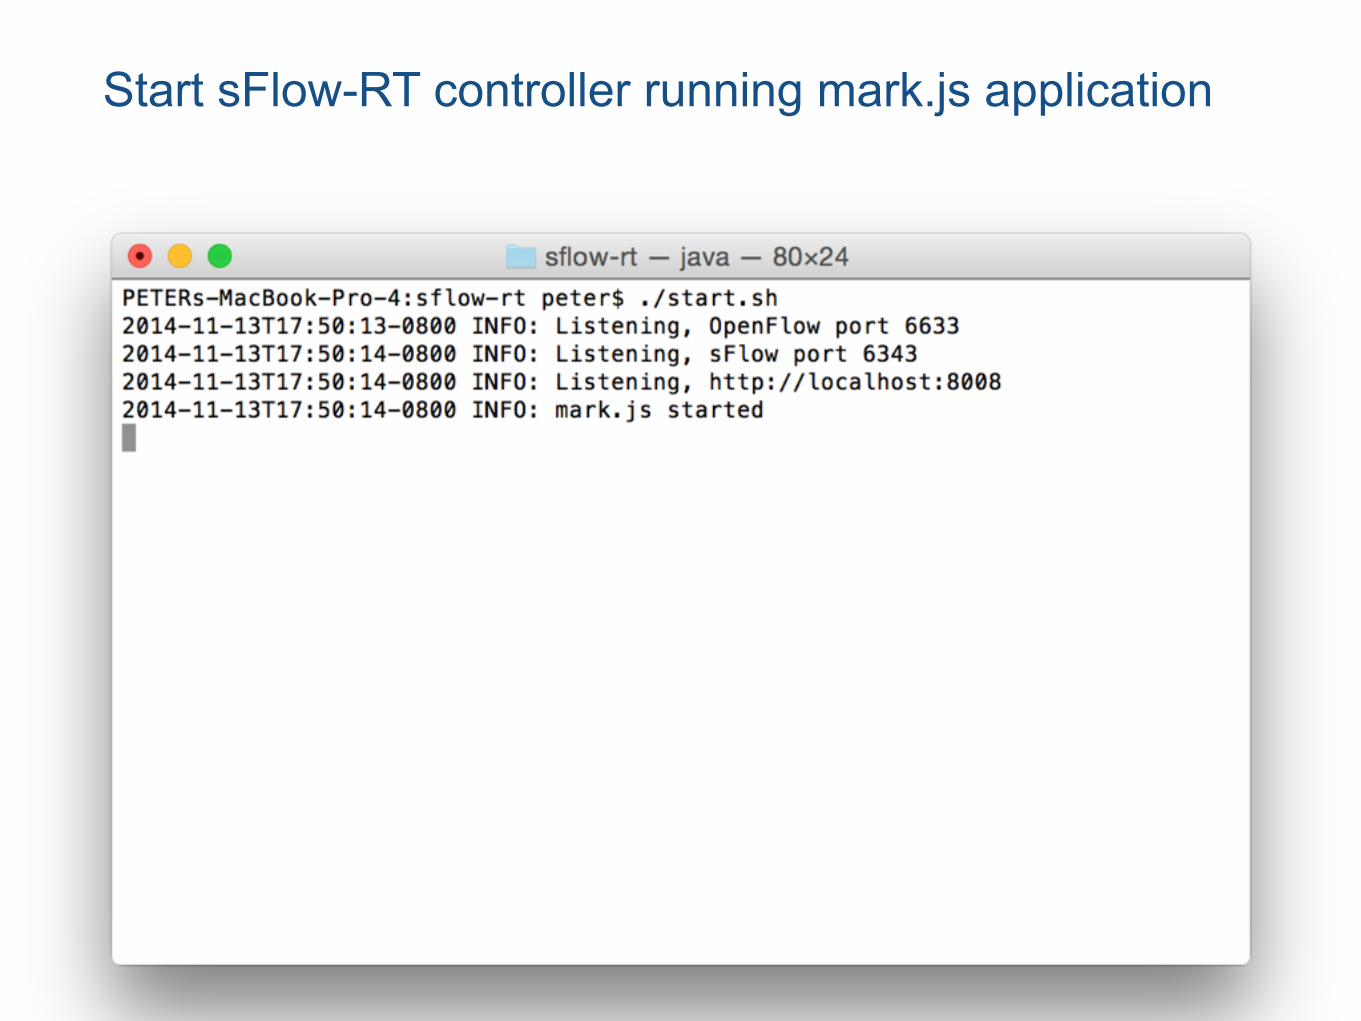
Start sFlow-RT controller running mark.js application
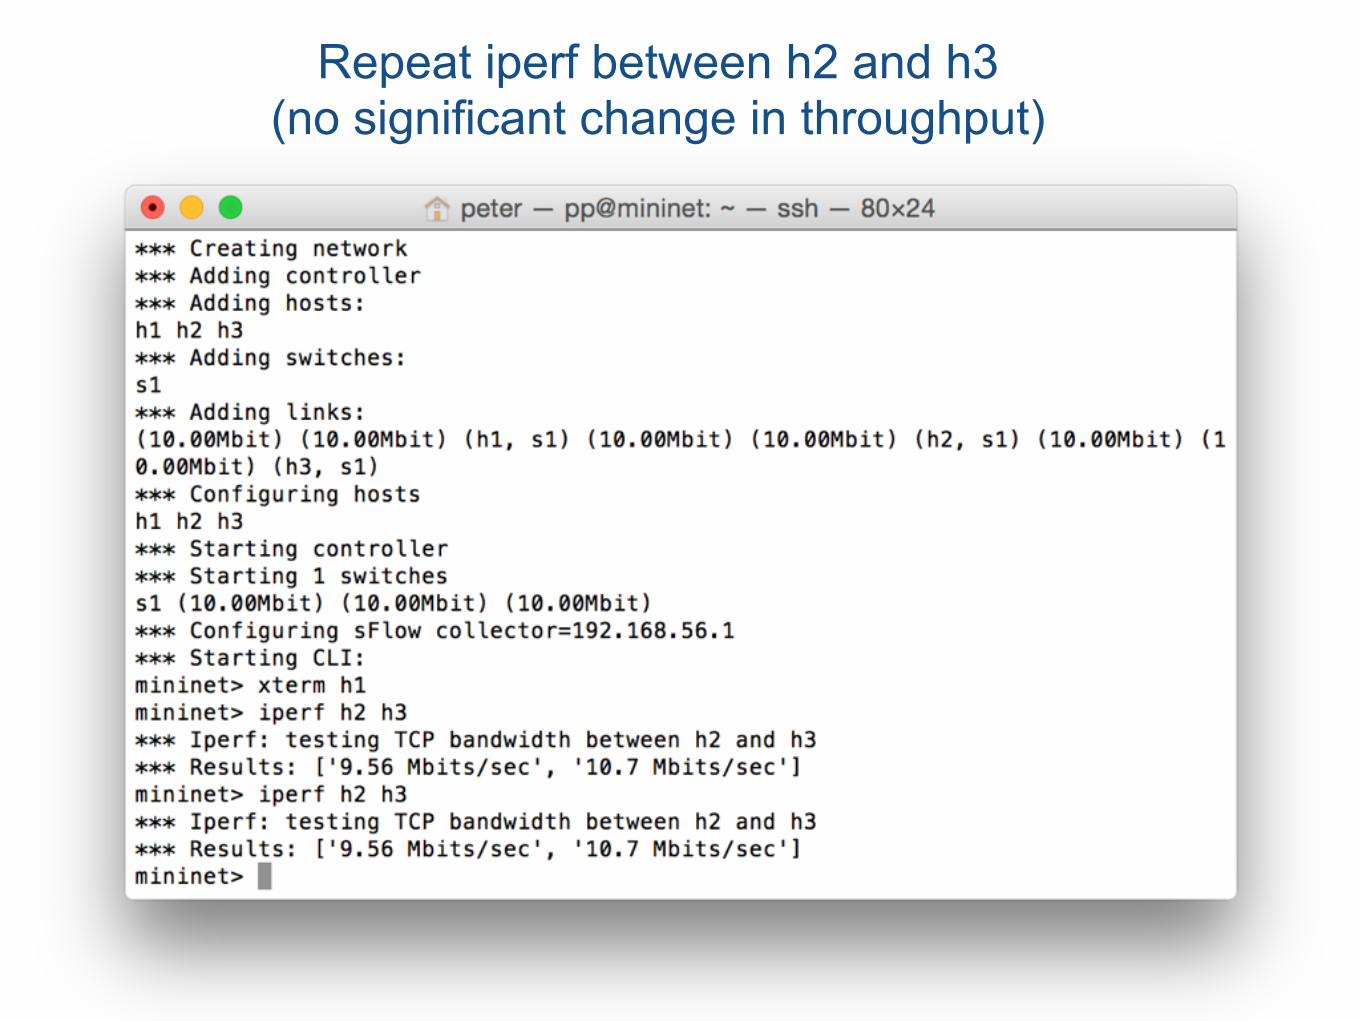
Repeat iperf between h2 and h3 (no significant change in throughput)
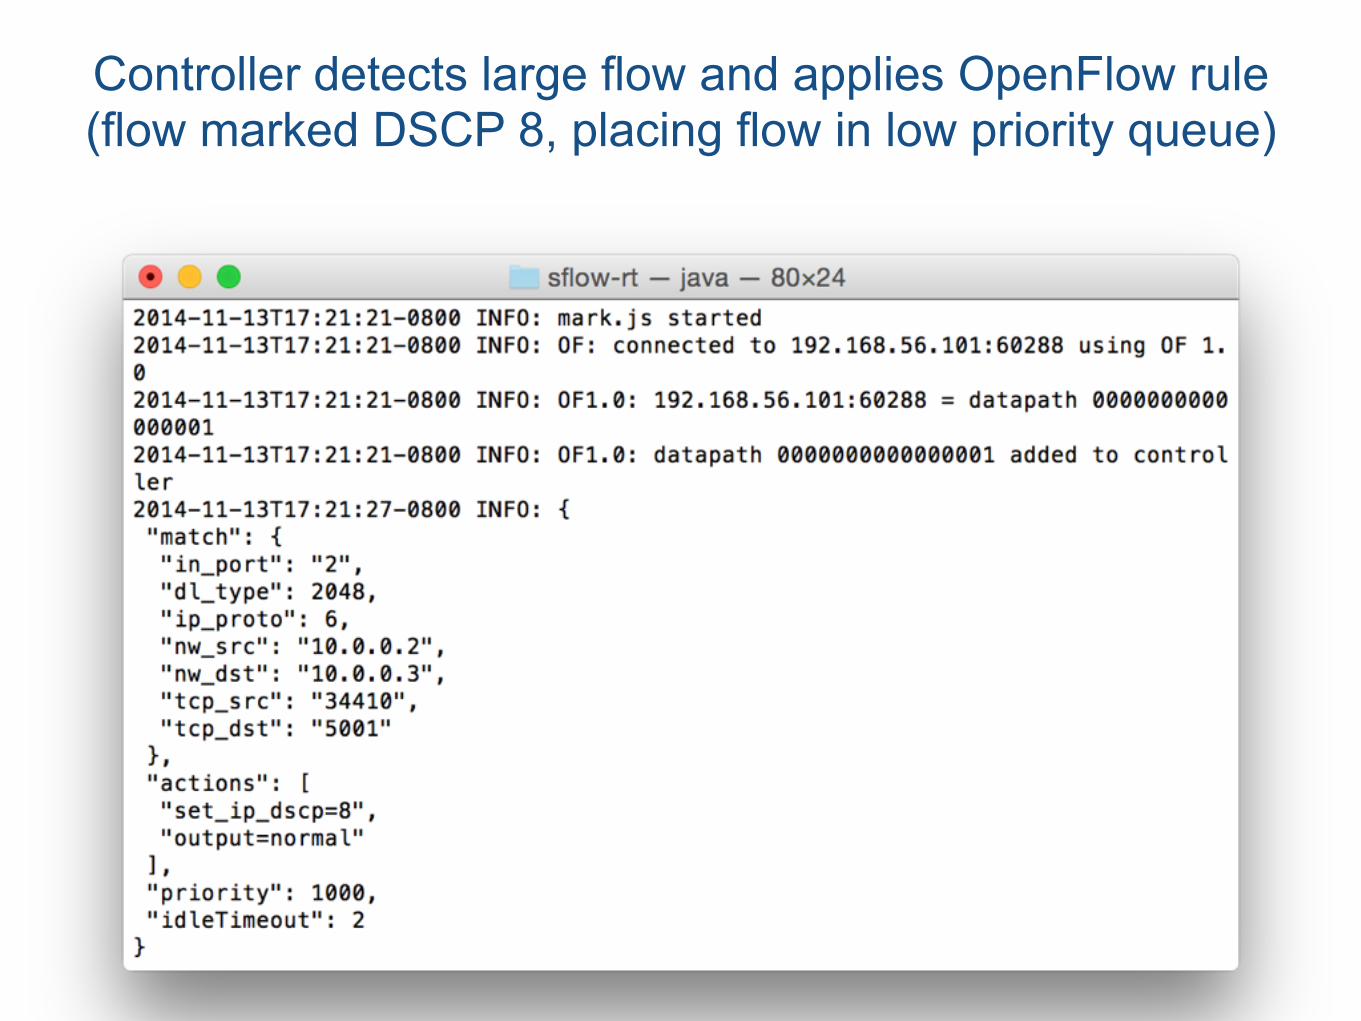
Controller detects large flow and applies OpenFlow rule (flow marked DSCP 8, placing flow in low priority queue)
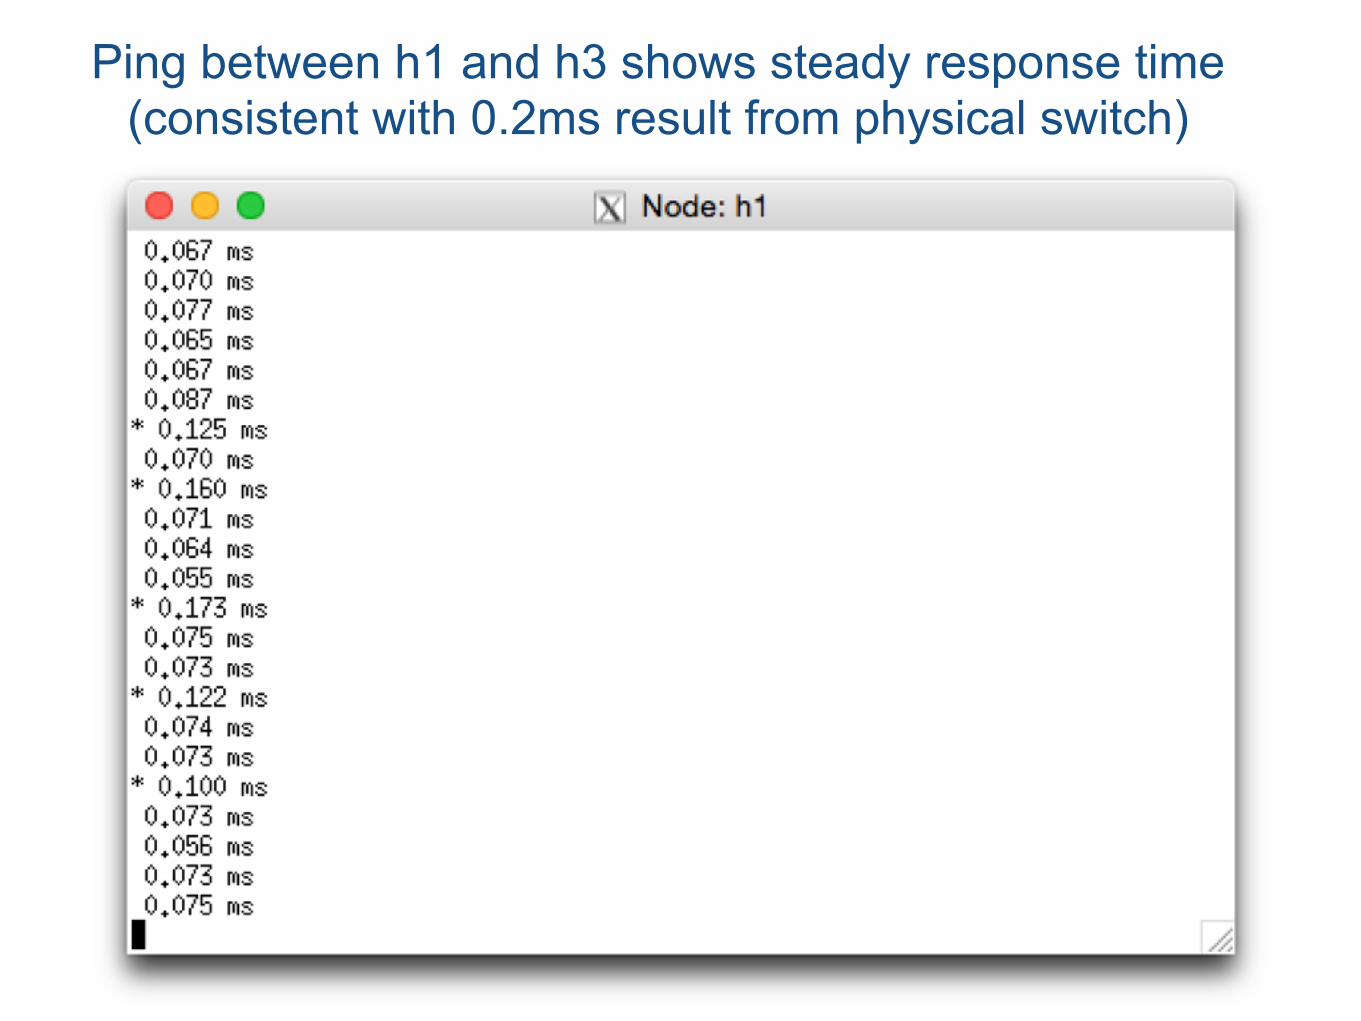
Ping between h1 and h3 shows steady response time (consistent with 0.2ms result from physical switch)
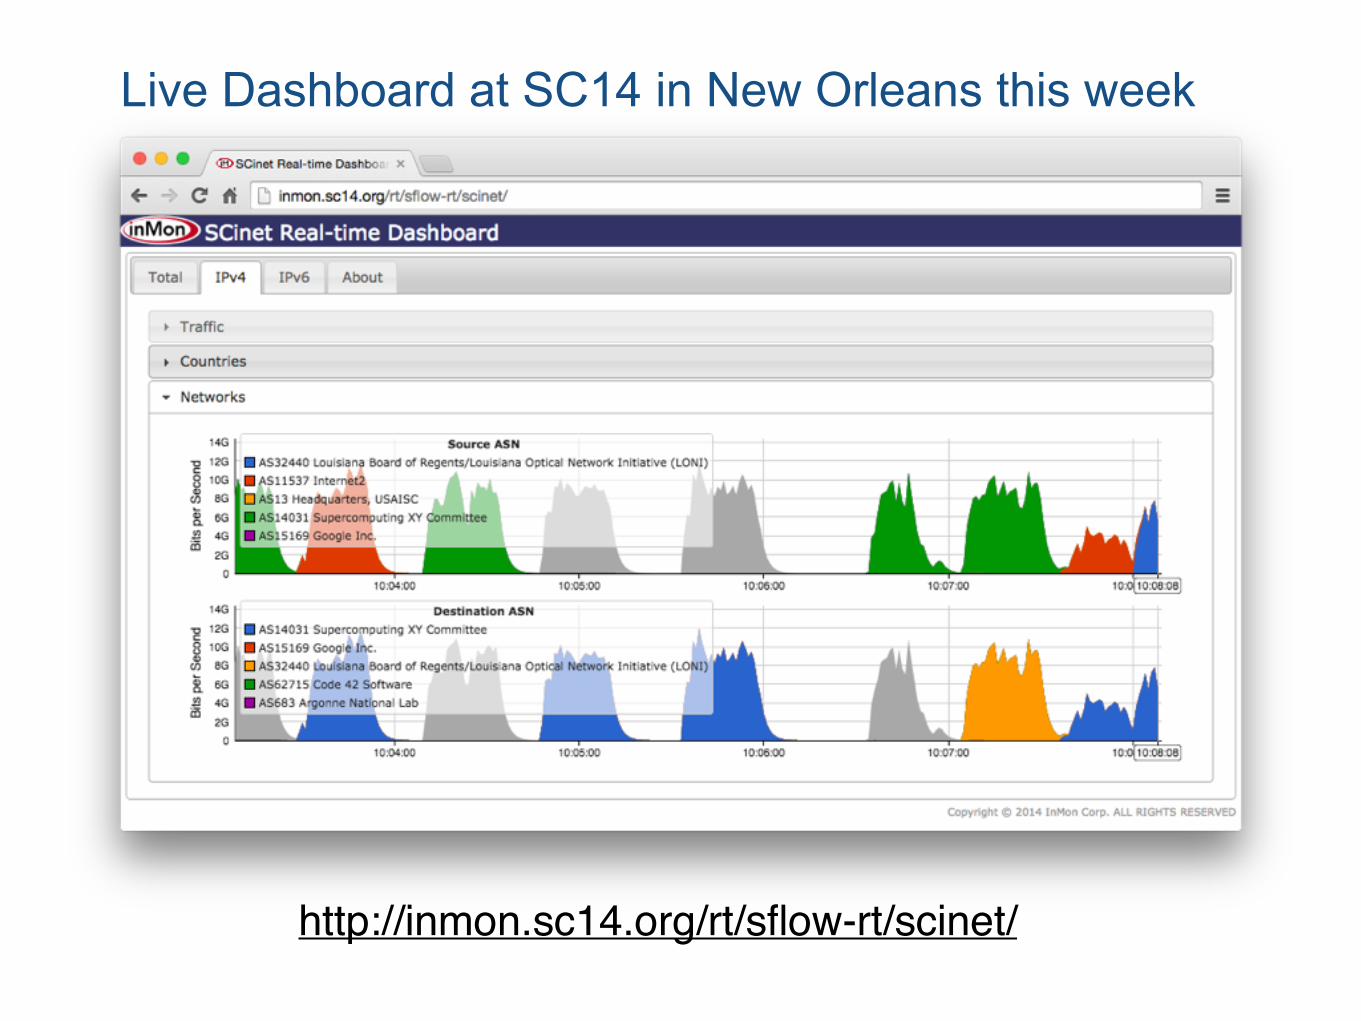
Live Dashboard at SC14 in New Orleans this week
http://inmon.sc14.org/rt/sflow-rt/scinet/

Questions?