Embed Size (px)
Citation preview
Traffic Simulator for Multibeam SatelliteCommunication Systems
Hayder Al-Hraishawi, Eva Lagunas, and Symeon ChatzinotasInterdisciplinary Centre for Security, Reliability and Trust (SnT), University of Luxembourg.
emails: {hayder.al-hraishawi, eva.lagunas, symeon.chatzinotas}@uni.lu
Abstract—Assume that a multibeam satellite communicationsystem is designed from scratch to serve a particular area withmaximal resource utilization and to satisfactorily accommodatethe expected traffic demand. The main design challenge hereis setting optimal system parameters such as number of servingbeams, beam directions and sizes, and transmit power. This paperaims at developing a tool, multibeam satellite traffic simulator,that helps addressing these fundamental challenges, and moreimportantly, provides an understanding to the spatial-temporaltraffic pattern of satellite networks in large-scale environments.Specifically, traffic demand distribution is investigated by pro-cessing credible datasets included three major input categoriesof information: (i) population distribution for broadband FixedSatellite Services (FSS), (ii) aeronautical satellite communica-tions, and (iii) vessel distribution for maritime services. Thistraffic simulator combines this three-dimensional informationin addition to time, locations of terminals, and traffic demand.Moreover, realistic satellite beam patterns have been consideredin this work, and thus, an algorithm has been proposed to delimitthe coverage boundaries of each satellite beam, and then computethe heterogeneous traffic demand at the footprint of each beam.Furthermore, another algorithm has been developed to capturethe inherent attributes of satellite channels and the effects ofmultibeam interference. Data-driven modeling for satellite trafficis crucial nowadays to design innovative communication systems,e.g., precoding and beam hopping, and to devise efficient resourcemanagement algorithms.
Index Terms—Aeronautical data traffic, maritime data traffic,multibeam satellites, satellite communications, traffic modeling.
I. INTRODUCTION
Satellite systems, supported by their ability to cover widegeographic regions using a minimum amount of infrastructureon the ground, are extremely appealing to satisfy data demandubiquity and deliver the data rates that will be requestedin the future [1]. Currently the field of satellite commu-nications is witnessing a renewed and significant attentionin the global telecommunications market. Many emergingbroadband services have recently developed for future satellitecommunication systems, thanks to the newly technologies thatempower one satellite to manage hundreds of narrower beamswith smaller coverage. These new features increase the diver-sification of satellite services and lead to an escalating needfor satellite systems [2]. Although this is a growing challengefrom the traffic volume perspective, we still have a minimalunderstanding about the traffic characteristics experienced bysatellite systems. Such lack of knowledge prevents an efficientsystem design and leads to a poor resource utilization [3].
Ubiquity of satellite systems can provide services to theunserved or underserved users in different geographical re-
gions including rural/inaccessible places and urban/suburbanareas that are suffering from a lack of terrestrial infrastructureor radio resources [4]. Therefore, the need for having trafficmodels tailored to a wide-range of satellite traffic types andcharacteristics has become essential. Besides, understandingtraffic patterns in the large-scale environments is extremelyvaluable for both satellite operators and service providers.Traffic pattern modeling is not only necessary for developingnetwork capacity management mechanisms but it also canbe utilized in designing flexible satellite systems to adaptthe spatially-heterogeneous data traffic demands, which is acrucial requirement in broadband satellite applications [5].
Furthermore, satellite communication systems have a sig-nificant potential to integrate with 5G and beyond ecosystemsto provide reliable and flexible wireless services in vast areas[6]. Specifically, in satellite communications for 5G (SAT5G)project within the initiative of 5G-infrastructure Public PrivatePartnership (5G PPP) [7], satellite communication proposes tocontribute as an additional channel for carrying traffic over the5G backhaul. In this setting, steering traffic load through eitherthe satellite or the terrestrial backhauls is a thought-provokingprocess, especially for context-aware policies or mechanisms,where a wide variety of contexts such as type of traffic, trafficload, and location of sources has to be taken into considerationin this integration [8]. This anticipated requirement motivatesdeveloping a satellite traffic simulator tool in this work thatwill be beneficial for performance optimality.
Generally, most of the traffic analysis and evaluation effortsfocus on cellular networks due to the availability of high-quality traffic measurement tools that are accurately represent-ing the statistical characteristics of actual traffic sources. Forinstance, mobile traffic patterns of thousands of cellular towersin an urban environment have been modeled in [9] by usingdatasets collected from local commercial mobile operatorsin Shanghai city in China. Other studies have used cellularnetwork traces for characterizing and modeling cellular datatraffic patterns. For example, internet traffic dynamics in largecellular networks have been studied and modeled in [10].Similarly, mobile phone data and application traces have beenutilized in [11] to investigate the urban land-use based ondata traffic pattern and volume. These analyses provide acomprehensive understanding of mobile data traffic patternsof large-scale networks along with urban ecology. Thus, trafficmodeling is an indispensable step to achieve efficient networkdesign and capacity planning [12].
arX
iv:2
007.
0714
8v1
[ee
ss.S
P] 1
4 Ju
l 202
0
Nevertheless the satellite traffic simulator significant role inaddressing key network design and dimensioning challenges,there are only few prior related research on traffic analysis[13], [14], which both are investigating Low Earth Orbit (LEO)and Intermediate Circular Orbit (ICO) satellite networks. Tothe best of our knowledge, traffic modeling for GeostationaryEarth Orbit (GEO) satellites has not been investigated yetin the open literature. Such traffic characterization imposescomplicated challenges because the type of users who accessGEO satellites are varying from a low traffic single homeuser to very high traffic Internet backbone nodes. Beyond this,different from the terrestrial networks where the base-stationsare deployed in highly populated areas, satellites deploymenthas a geography-centric topology, where satellite resources areaccessible to all users whether inside or outside the terrestrialnetwork coverage. Thus, satellite traffic sources diversify fromtypical users include stationary users or fixed-point services toairborne and maritime platforms (airplanes, ships, etc.) [6].
Additionally, analyzing the traffic logs that collected bysatellite operator is prohibitively challenging for two reasons.First, the traffic experienced by thousands of satellite ter-minals deployed over wide areas to ensure availability andconnectivity is complicated and hard to analyze because of theredundancy and conflict logs in the collected datasets. Thus, asystem with ability to clean and handle the data of large-scaletraffic has to be carefully designed in order to categorize trafficpatterns embedded in the thousands of terminals. Second,satellite data demand is affected by many factors, such as timeand positions, etc. These factors and more may compound witheach other and further complicate the analysis.
This paper fills the aforementioned gap of modeling GEOsatellite traffic in the literature by developing a satellite trafficsimulator with channel characterization for various broadbandservices. Specifically, traffic demand distribution is investi-gated by processing credible datasets included three majorinput categories of information: (i) population distributionfor broadband Fixed Satellite Services (FSS), (ii) aeronauti-cal satellite communications, and (iii) vessel distribution formaritime services. This work is aiming at developing a toolthat combines these three dimensional datasets with somepractical measurements to the coverage of multibeam satellitesystems in order to extract the time domain characteristics ofthe geographical traffic patterns. The ultimate purpose of oursatellite traffic simulator is to create a proving ground that canbe used as input for resource management algorithms and toevaluate the innovative solutions seeking to improve satellitelink utilization, performance and user experience.Contributions: The main technical contribution of this workcan be summarized as follows:• Develop a traffic simulator tool for satellite services based
on reliable datasets that reflect the heterogeneous spatial-temporal traffic distributions over coverage of actualsatellite beam patterns.
• Propose a traffic identifying algorithm that defines satel-lite beam borders from coverage measurements and asso-ciates every user terminal with its serving beam. Thus, the
Input Datasets
AeronauticalDataset
MaritimeDataset
PopulationDataset
PreprocessingUnit
Input BeamPattern
TrafficModeling
LinkBudgeting
TrafficMatrix
ChannelMatrix
Ouputs
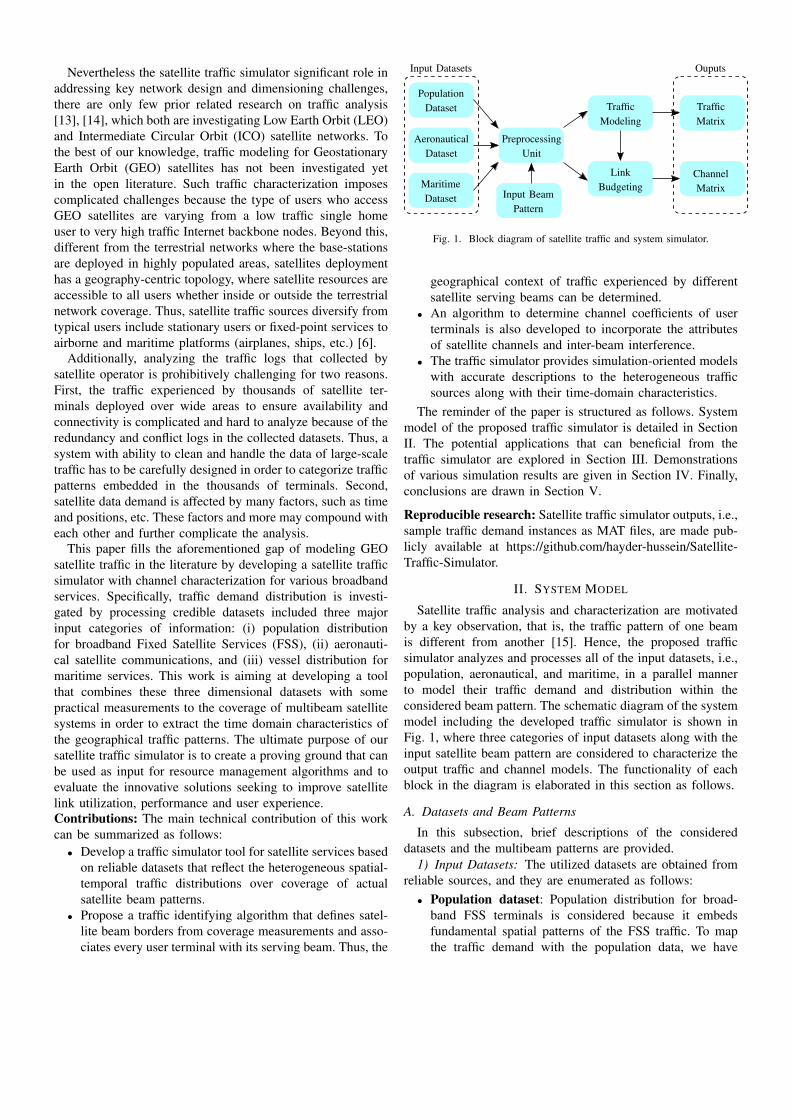
Fig. 1. Block diagram of satellite traffic and system simulator.
geographical context of traffic experienced by differentsatellite serving beams can be determined.
• An algorithm to determine channel coefficients of userterminals is also developed to incorporate the attributesof satellite channels and inter-beam interference.
• The traffic simulator provides simulation-oriented modelswith accurate descriptions to the heterogeneous trafficsources along with their time-domain characteristics.
The reminder of the paper is structured as follows. Systemmodel of the proposed traffic simulator is detailed in SectionII. The potential applications that can beneficial from thetraffic simulator are explored in Section III. Demonstrationsof various simulation results are given in Section IV. Finally,conclusions are drawn in Section V.
Reproducible research: Satellite traffic simulator outputs, i.e.,sample traffic demand instances as MAT files, are made pub-licly available at https://github.com/hayder-hussein/Satellite-Traffic-Simulator.
II. SYSTEM MODEL
Satellite traffic analysis and characterization are motivatedby a key observation, that is, the traffic pattern of one beamis different from another [15]. Hence, the proposed trafficsimulator analyzes and processes all of the input datasets, i.e.,population, aeronautical, and maritime, in a parallel mannerto model their traffic demand and distribution within theconsidered beam pattern. The schematic diagram of the systemmodel including the developed traffic simulator is shown inFig. 1, where three categories of input datasets along with theinput satellite beam pattern are considered to characterize theoutput traffic and channel models. The functionality of eachblock in the diagram is elaborated in this section as follows.
A. Datasets and Beam Patterns
In this subsection, brief descriptions of the considereddatasets and the multibeam patterns are provided.
1) Input Datasets: The utilized datasets are obtained fromreliable sources, and they are enumerated as follows:• Population dataset: Population distribution for broad-
band FSS terminals is considered because it embedsfundamental spatial patterns of the FSS traffic. To mapthe traffic demand with the population data, we have
downloaded the population data from NASA Socioeco-nomic Data and Applications Center (SEDAC) populationdensity database [16].
• Aeronautical dataset: The actual traffic variations inaeronautical communications is considered to study howthe number of flights can affect the geographical trafficdensity at different time instants, and thus, the aero-nautical spatial-temporal traffic distribution is accuratelyreflected in the simulator. To this end, the aeronauticaldata is extracted from anonymized and unfiltered flight-tracking source [17].
• Maritime dataset: The demand of satellite connectiv-ity using communications on vessels is also changingremarkably with time and location. Therefore, vesseldistribution for maritime is measured and evaluated by adataset obtained from vessel traffic services (VTS), whichincludes ship positions and marine traffic that detected byglobal automatic identification system (AIS) [18].
2) Input Satellite Beam Pattern: In multibeam satellitesystems, several spot beams are produced to cover a specificgeographical region on Earth, and to ensure continuity, thecoverage of adjacent beams are partially overlapped in verysimilar way to the overlay structure of cellular networks. Thebeam coverage patterns vary with different satellite systemsand network structures, and beam gain for each satelliteantenna-user pair depends on the antenna pattern and userposition. The investigated multibeam coverage pattern in thiswork is given in a matrix format that represents the satellitebeam gain at each measured point as well as the phase rota-tions induced by the signal propagation. Specifically, a satellitebeam pattern can be defined as P ∈ R(µ,4,η), where µ accountsfor the number of representative points corresponding to thesample locations where the antenna radiation pattern is given,and η represents the number of beams. In P, each measuredpoint is provided in the following form p(lat, long, γ, θ), whichare latitude, longitude, channel gain in dB, channel phase,respectively.
B. Preprocessing Unit
The collected datasets need to be preprocessed becauseof the redundant and conflict traffic logs as well as theincomplete location information. Therefore, the preprocessingunit in the traffic simulator, shown in Fig. 1, is responsiblefor eliminating these defective logs, tackling the problemof missing information, and then extracting users’ positionsin order to utilize them in categorizing user terminals totheir serving beams according to their geographical longitudesand latitudes. Additionally, the limited FSS usage in largeurban areas is also taken into consideration due to the easeaccessibility to alternative broadband technologies that offeredin such regions. Since the traffic simulator is modeling thedaily traffic demands on an hourly basis, the traces collectedfrom aeronautical dataset are preprocessed by eliminating theredundant occurrences of the flights during an hour. Similarly,to capture the temporal maritime traffic demand, we analysistraces from maritime dataset and consider the position of the
first occurrence of each ship during each hour within thecovered area. This allows a reasonable estimate of currentdemand and the expected demand within an hour. Moreover,for analyzing and modeling traffic demand per beam, the inputbeam pattern has to be preprocessed in order to preciselydelimit the coverage of each beam. Channel gains (γ) can beutilized to define beam borders as simple overlapped polygonsby applying a geometric triangulation algorithm that will befurther explained in the next subsection.
C. Per-beam Traffic Modeling
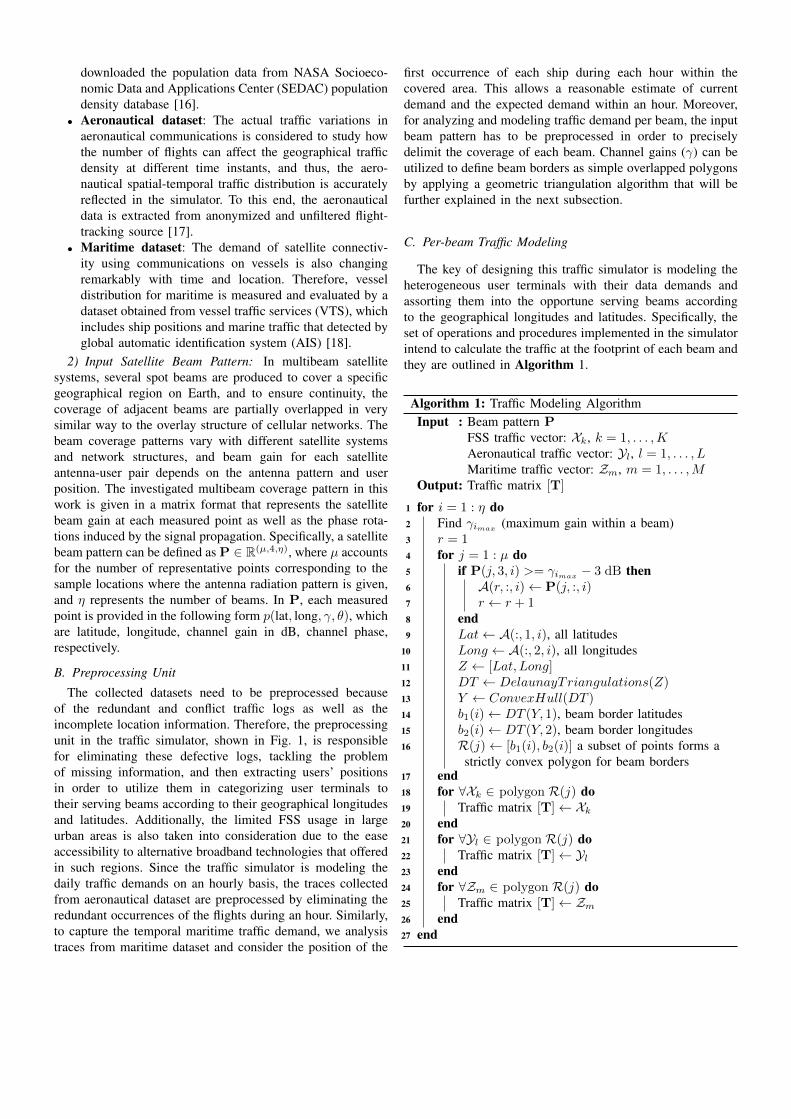
The key of designing this traffic simulator is modeling theheterogeneous user terminals with their data demands andassorting them into the opportune serving beams accordingto the geographical longitudes and latitudes. Specifically, theset of operations and procedures implemented in the simulatorintend to calculate the traffic at the footprint of each beam andthey are outlined in Algorithm 1.
Algorithm 1: Traffic Modeling AlgorithmInput : Beam pattern P
FSS traffic vector: Xk, k = 1, . . . ,KAeronautical traffic vector: Yl, l = 1, . . . , LMaritime traffic vector: Zm, m = 1, . . . ,M
Output: Traffic matrix [T]
1 for i = 1 : η do2 Find γimax (maximum gain within a beam)3 r = 14 for j = 1 : µ do5 if P(j, 3, i) >= γimax − 3 dB then6 A(r, :, i)← P(j, :, i)7 r ← r + 18 end9 Lat← A(:, 1, i), all latitudes
10 Long ← A(:, 2, i), all longitudes11 Z ← [Lat, Long]12 DT ← DelaunayTriangulations(Z)13 Y ← ConvexHull(DT )14 b1(i)← DT (Y, 1), beam border latitudes15 b2(i)← DT (Y, 2), beam border longitudes16 R(j)← [b1(i), b2(i)] a subset of points forms a
strictly convex polygon for beam borders17 end18 for ∀Xk ∈ polygon R(j) do19 Traffic matrix [T]← Xk20 end21 for ∀Yl ∈ polygon R(j) do22 Traffic matrix [T]← Yl23 end24 for ∀Zm ∈ polygon R(j) do25 Traffic matrix [T]← Zm26 end27 end
The inputs to this algorithm are the satellite beam pattern, asearlier described, and the traffic vectors of FSS, aeronautical,and maritime after preprocessing their respective datasets. Tobegin with, this algorithm defines the coverage of each satellitebeam through determining its borders. Footprints of beamsare basically formed by a given value of the signal poweron earth that must be exceeded. The signal power decreasesaccording to the antenna characteristics when user terminalmoves out of the main lobe center of the beam antenna.Thus, the antenna pattern with considering the view anglesdetermines the beam’s boundaries, which is usually a gaindecrease of 3 dB [19]. The complete coverage of the beampattern must be arranged in such a way that the whole footprintis filled with cells. Therefore, triangulations of a point set canbe considered a useful tool in this context to delimit beamcoverage. In particular, there is an interesting relationshipbetween convex hulls and Delaunay triangulations, where agiven set P of points in the Euclidean space Em of dimensionm can lift these points onto a paraboloid in the space Em+1
of dimension m+1, and that the Delaunay triangulation of Pis the projection of the downward-facing sides of the convexhull of the set of lifted points [20]. As a simple example,consider a point p = (x, y) in the plane E2 is lifted to thepoint l(p) = (X,Y, Z) on the paraboloid in E3, where X = x,Y = y, and Z = x2+y2. Applying similar steps for all pointsin the beam pattern, we can determine sets of points representlatitudes b1(i) and longitudes b2(i) of beam borders.
Next, the traffic simulator algorithm associates every hetero-geneous traffic input to its serving satellite beam by locatingthat user inside or on edge of the obtained polygonal region ofthe beam borders R(j). The three types of population-basedtraffic, aeronautical-based traffic, and maritime-based trafficare identified in a parallel manner to show the combinationresults in the traffic model in addition to their respectivecontribution in each beam. For the population-based traffic,intuitively, the FSS traffic demand is proportional to populationdensity, and thus, population distribution with a variable down-scaling factor is adjusted to map the traffic demand of FSSusers. Similarly, the proposed algorithm collects any aeronau-tical and maritime point lies on or inside the determined beamcoverage, and then represents them in the outputs.
One of the outputs of the satellite traffic simulator is atraffic matrix T that contains all the identified user terminalsin Algorithm 1 along with their useful information, i.e., userindex, beam index, location (latitude and longitude), demandtype, and traffic demand, formulated altogether in a matrixform as shown in (1).
T =
User Beam Lat Long Type Demand
u1 bi φ1 ψ1 1 xu1
u2 bi φ2 ψ2 2 xu2
......
......
......
uN bη φN ψN 3 xuN
, (1)
where N ≤ (K + L+M) represents the total number of theidentified users. In (1), each row of the traffic matrix represents
a user un that belongs to bi beam and located on latitude φnand longitude ψn, The tuple {1, 2, 3} accounts for the traffictype and corresponds to FSS, aeronautical, and maritime,respectively, and it is represented in the fourth column. Finally,the traffic demand of each user is given in Mpbs on the fifthcolumn and denoted as xun .
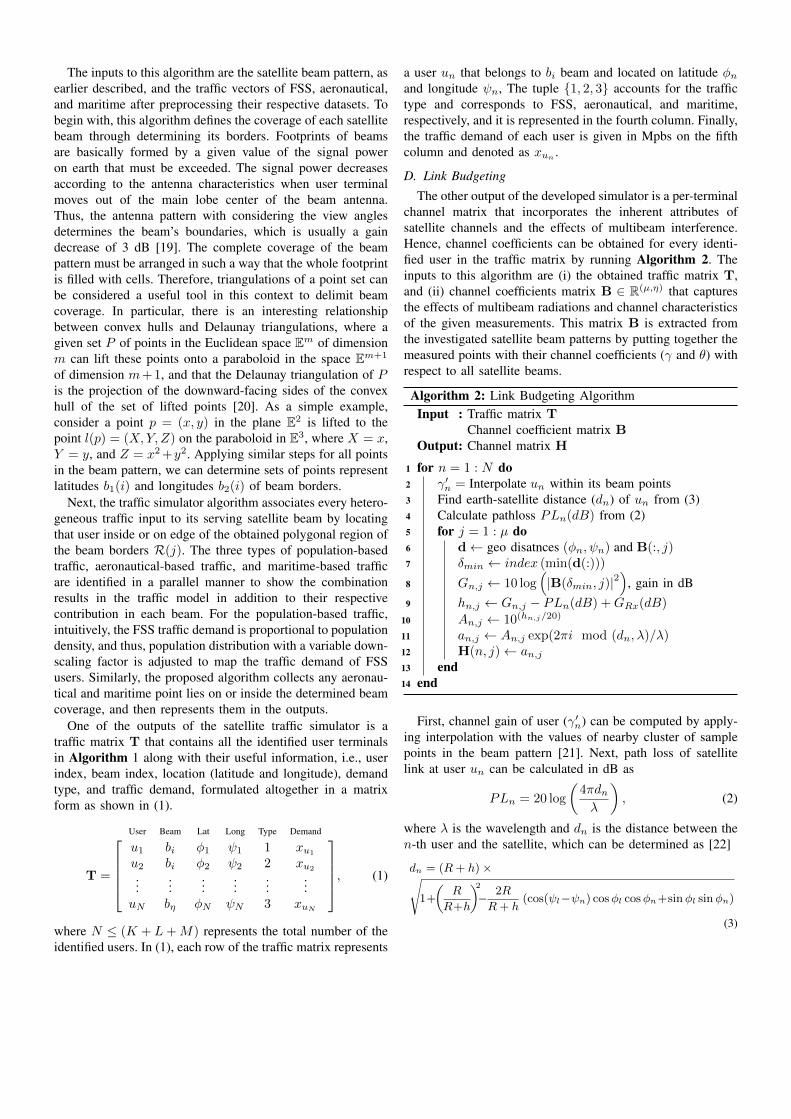
D. Link Budgeting
The other output of the developed simulator is a per-terminalchannel matrix that incorporates the inherent attributes ofsatellite channels and the effects of multibeam interference.Hence, channel coefficients can be obtained for every identi-fied user in the traffic matrix by running Algorithm 2. Theinputs to this algorithm are (i) the obtained traffic matrix T,and (ii) channel coefficients matrix B ∈ R(µ,η) that capturesthe effects of multibeam radiations and channel characteristicsof the given measurements. This matrix B is extracted fromthe investigated satellite beam patterns by putting together themeasured points with their channel coefficients (γ and θ) withrespect to all satellite beams.
Algorithm 2: Link Budgeting AlgorithmInput : Traffic matrix T
Channel coefficient matrix BOutput: Channel matrix H
1 for n = 1 : N do2 γ′n = Interpolate un within its beam points3 Find earth-satellite distance (dn) of un from (3)4 Calculate pathloss PLn(dB) from (2)5 for j = 1 : µ do6 d← geo disatnces (φn, ψn) and B(:, j)7 δmin ← index (min(d(:)))
8 Gn,j ← 10 log(|B(δmin, j)|2
), gain in dB
9 hn,j ← Gn,j − PLn(dB) +GRx(dB)10 An,j ← 10(hn,j/20)
11 an,j ← An,j exp(2πi mod (dn, λ)/λ)12 H(n, j)← an,j13 end14 end
First, channel gain of user (γ′n) can be computed by apply-ing interpolation with the values of nearby cluster of samplepoints in the beam pattern [21]. Next, path loss of satellitelink at user un can be calculated in dB as
PLn = 20 log
(4πdnλ
), (2)
where λ is the wavelength and dn is the distance between then-th user and the satellite, which can be determined as [22]
dn = (R+ h)×√1+
(R
R+h
)2− 2R
R+ h(cos(ψl−ψn) cosφl cosφn+sinφl sinφn)
(3)
where R is the effective radius of Earth, h is satellite altitude,and φl and ψl are satellite latitude and longitude, respectively.To model the impacts of multibeam satellite radiations, chan-nel complex coefficients are calculated for each user withrespect to all beams by evaluating the effect of the nearestsample points in each beam to the considered user (un). Thedistances between users and sample points are calculated byusing the spherical law of cosines. Then, path loss is calculatedas elaborated in Algorithm 2, where GRx is the receiverantenna gain.
The output resulting from the developed link budgetingalgorithm, and consequently from the traffic simulator, is achannel matrix H, that is defined in (4). This is a complexmatrix represents the channel gain and phase for each userin the traffic matrix. This matrix aggregates all the receivedsignals at every identified user including the desired signalsplus the interference generated from all other beams.
H =
b1 b2 ··· bη
u1 a1,1 a1,2 · · · a1,ηu2 a2,1 a2,2 · · · a2,η...
......
. . ....
uN aN,1 aN,2 · · · aN,η
(4)
where an,j is a complex number represents gain and phase ofthe j-th beam signal at the n-th user.
III. POTENTIAL DIRECTIONS TO EMPLOY THE TRAFFICSIMULATOR
Beyond the essential role that traffic simulator can play indesigning and dimensioning newly unreleased satellites, it canalso be utilized in developing some emerging technologies thatwill enhance satellite communication competencies, which areincluding but not limited to the following list:
• Beam Hopping: To optimally adapt the inconsistenttraffic demands over time and geographical locations,beam hopping concept has been studied to allow satellitesystems share their resources among multiple beams, andthus, offer higher usable throughput. Specifically, insteadof static illumination for all serving beams, the satellitecycles in time through a set of coverages according to aschedule derived from the traffic demands. As a result, ata certain moment, only one coverage of the set is activewith full power and bandwidth [23].
• Flexible Precoding In the forward link of multibeamsatellite systems, precoding techniques can effectivelyalleviate co-channel interference when aggressive fre-quency reuse is applied. However, satellite beams aregenerally affected by an uneven service demands, as thereare some hot spots that required more carrier resourcesto avoid congestion. The flexibility of allocating satelliteresources based on demand enables new solutions thatcan cope with the problem of co-channel interferenceintroduced by the higher frequency reuse in hot spot
areas, where the traffic simulator can play a vital rolein providing insights about traffic behaviors [15].
• Carrier Aggregation: Carrier aggregation in cellular net-works has achieved a considerable enhancement in per-formance through maximizing spectrum utilization andsatisfying high throughput demands. Thus, an interestingnext step would be integrating carrier aggregation intosatellite architectures in synergy to harness the multi-plexing gain and achieve higher peak data rate. Trafficdistribution awareness in such systems leads to developefficient load balancing and flexible carrier allocationalgorithms targeting a proportionally fair user demandsatisfaction [24], [25].
• Network Functions Virtualization (NFV): In network-ing domain, NVF as a prominent technology has the po-tential to dramatically redefine the substance of networkinfrastructure, NFV refers to the virtualization of networkfunctions carried out by specialized hardware devices andtheir transformation into software-based appliances. NVFintroduces some outstanding benefits such as sharing ofresources among different NFs and users, and up- anddown-scaling of resources assigned to each function. Net-work virtualization has extended to encompass satellitesystems to obtain the advantages of fast set-up time aswell as resource elasticity. Thus, according to the trafficsimulator outputs of customer density and demand, thesatellite virtual network might request to scale up or downthe resources assigned to each entity [26].
IV. SIMULATION RESULTS
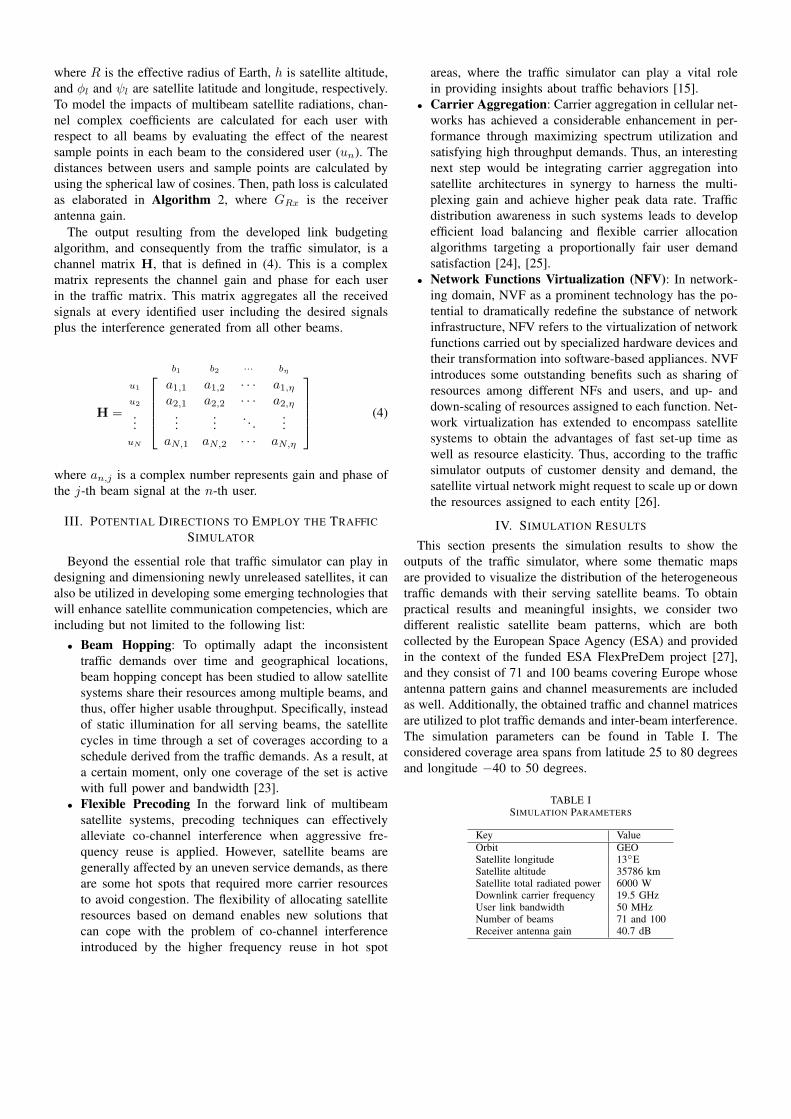
This section presents the simulation results to show theoutputs of the traffic simulator, where some thematic mapsare provided to visualize the distribution of the heterogeneoustraffic demands with their serving satellite beams. To obtainpractical results and meaningful insights, we consider twodifferent realistic satellite beam patterns, which are bothcollected by the European Space Agency (ESA) and providedin the context of the funded ESA FlexPreDem project [27],and they consist of 71 and 100 beams covering Europe whoseantenna pattern gains and channel measurements are includedas well. Additionally, the obtained traffic and channel matricesare utilized to plot traffic demands and inter-beam interference.The simulation parameters can be found in Table I. Theconsidered coverage area spans from latitude 25 to 80 degreesand longitude −40 to 50 degrees.
TABLE ISIMULATION PARAMETERS
Key ValueOrbit GEOSatellite longitude 13◦ESatellite altitude 35786 kmSatellite total radiated power 6000 WDownlink carrier frequency 19.5 GHzUser link bandwidth 50 MHzNumber of beams 71 and 100Receiver antenna gain 40.7 dB
0 1 2 3 4 5 6 7 8 9 10 11 12 13 14 15 16 17 18 19 20 21 22 23
Time (hour)
0
0.2
0.4
0.6
0.8
1
Ae
ron
au
tica
l T
raff
ic
0 1 2 3 4 5 6 7 8 9 10 11 12 13 14 15 16 17 18 19 20 21 22 23
Time (hour)
0
0.2
0.4
0.6
0.8
1M
aritim
e T
raff
ic
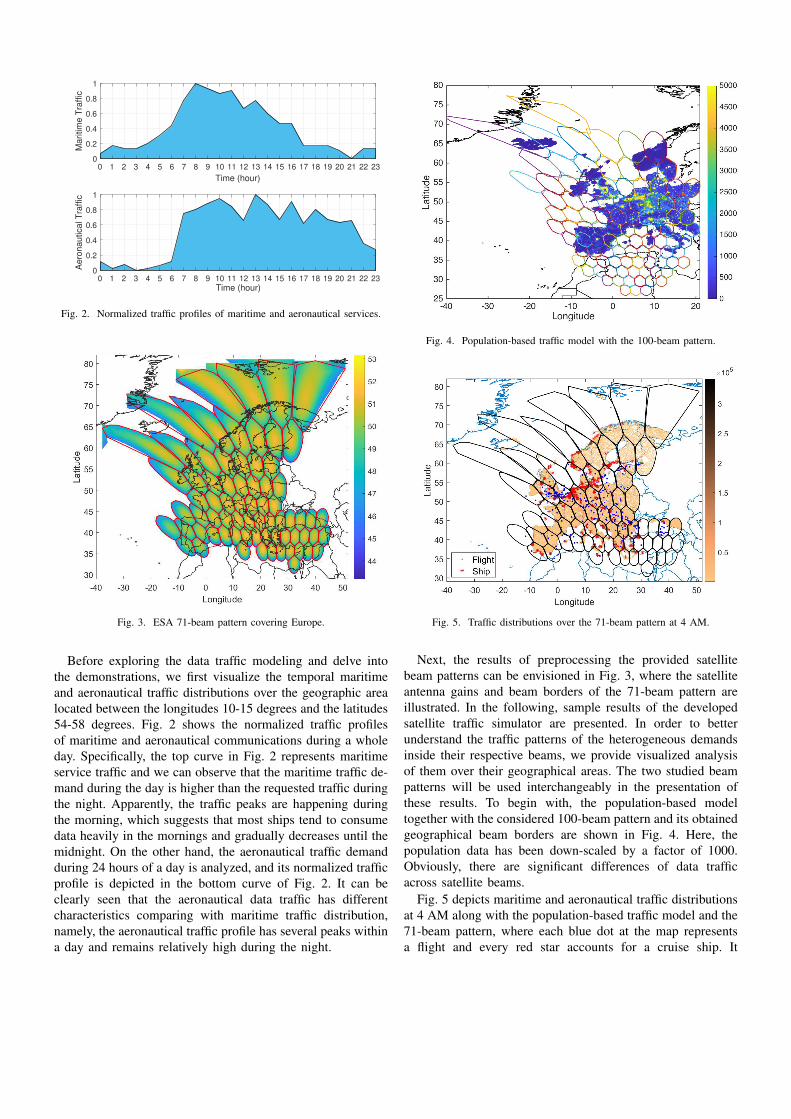
Fig. 2. Normalized traffic profiles of maritime and aeronautical services.
Fig. 3. ESA 71-beam pattern covering Europe.
Before exploring the data traffic modeling and delve intothe demonstrations, we first visualize the temporal maritimeand aeronautical traffic distributions over the geographic arealocated between the longitudes 10-15 degrees and the latitudes54-58 degrees. Fig. 2 shows the normalized traffic profilesof maritime and aeronautical communications during a wholeday. Specifically, the top curve in Fig. 2 represents maritimeservice traffic and we can observe that the maritime traffic de-mand during the day is higher than the requested traffic duringthe night. Apparently, the traffic peaks are happening duringthe morning, which suggests that most ships tend to consumedata heavily in the mornings and gradually decreases until themidnight. On the other hand, the aeronautical traffic demandduring 24 hours of a day is analyzed, and its normalized trafficprofile is depicted in the bottom curve of Fig. 2. It can beclearly seen that the aeronautical data traffic has differentcharacteristics comparing with maritime traffic distribution,namely, the aeronautical traffic profile has several peaks withina day and remains relatively high during the night.
Fig. 4. Population-based traffic model with the 100-beam pattern.
Fig. 5. Traffic distributions over the 71-beam pattern at 4 AM.
Next, the results of preprocessing the provided satellitebeam patterns can be envisioned in Fig. 3, where the satelliteantenna gains and beam borders of the 71-beam pattern areillustrated. In the following, sample results of the developedsatellite traffic simulator are presented. In order to betterunderstand the traffic patterns of the heterogeneous demandsinside their respective beams, we provide visualized analysisof them over their geographical areas. The two studied beampatterns will be used interchangeably in the presentation ofthese results. To begin with, the population-based modeltogether with the considered 100-beam pattern and its obtainedgeographical beam borders are shown in Fig. 4. Here, thepopulation data has been down-scaled by a factor of 1000.Obviously, there are significant differences of data trafficacross satellite beams.
Fig. 5 depicts maritime and aeronautical traffic distributionsat 4 AM along with the population-based traffic model and the71-beam pattern, where each blue dot at the map representsa flight and every red star accounts for a cruise ship. It
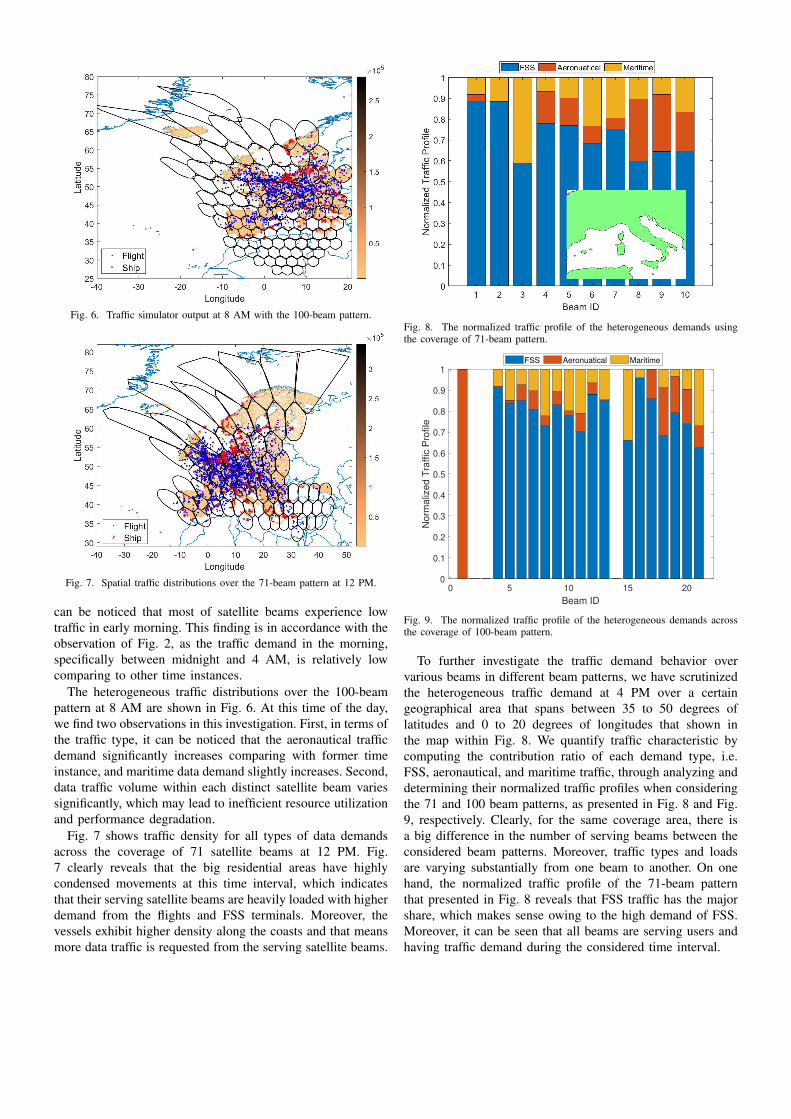
Fig. 6. Traffic simulator output at 8 AM with the 100-beam pattern.
Fig. 7. Spatial traffic distributions over the 71-beam pattern at 12 PM.
can be noticed that most of satellite beams experience lowtraffic in early morning. This finding is in accordance with theobservation of Fig. 2, as the traffic demand in the morning,specifically between midnight and 4 AM, is relatively lowcomparing to other time instances.
The heterogeneous traffic distributions over the 100-beampattern at 8 AM are shown in Fig. 6. At this time of the day,we find two observations in this investigation. First, in terms ofthe traffic type, it can be noticed that the aeronautical trafficdemand significantly increases comparing with former timeinstance, and maritime data demand slightly increases. Second,data traffic volume within each distinct satellite beam variessignificantly, which may lead to inefficient resource utilizationand performance degradation.
Fig. 7 shows traffic density for all types of data demandsacross the coverage of 71 satellite beams at 12 PM. Fig.7 clearly reveals that the big residential areas have highlycondensed movements at this time interval, which indicatesthat their serving satellite beams are heavily loaded with higherdemand from the flights and FSS terminals. Moreover, thevessels exhibit higher density along the coasts and that meansmore data traffic is requested from the serving satellite beams.
Fig. 8. The normalized traffic profile of the heterogeneous demands usingthe coverage of 71-beam pattern.
0 5 10 15 20
Beam ID
0
0.1
0.2
0.3
0.4
0.5
0.6
0.7
0.8
0.9
1
Norm
alized T
raffic
Pro
file
FSS Aeronuatical Maritime
Fig. 9. The normalized traffic profile of the heterogeneous demands acrossthe coverage of 100-beam pattern.
To further investigate the traffic demand behavior overvarious beams in different beam patterns, we have scrutinizedthe heterogeneous traffic demand at 4 PM over a certaingeographical area that spans between 35 to 50 degrees oflatitudes and 0 to 20 degrees of longitudes that shown inthe map within Fig. 8. We quantify traffic characteristic bycomputing the contribution ratio of each demand type, i.e.FSS, aeronautical, and maritime traffic, through analyzing anddetermining their normalized traffic profiles when consideringthe 71 and 100 beam patterns, as presented in Fig. 8 and Fig.9, respectively. Clearly, for the same coverage area, there isa big difference in the number of serving beams between theconsidered beam patterns. Moreover, traffic types and loadsare varying substantially from one beam to another. On onehand, the normalized traffic profile of the 71-beam patternthat presented in Fig. 8 reveals that FSS traffic has the majorshare, which makes sense owing to the high demand of FSS.Moreover, it can be seen that all beams are serving users andhaving traffic demand during the considered time interval.
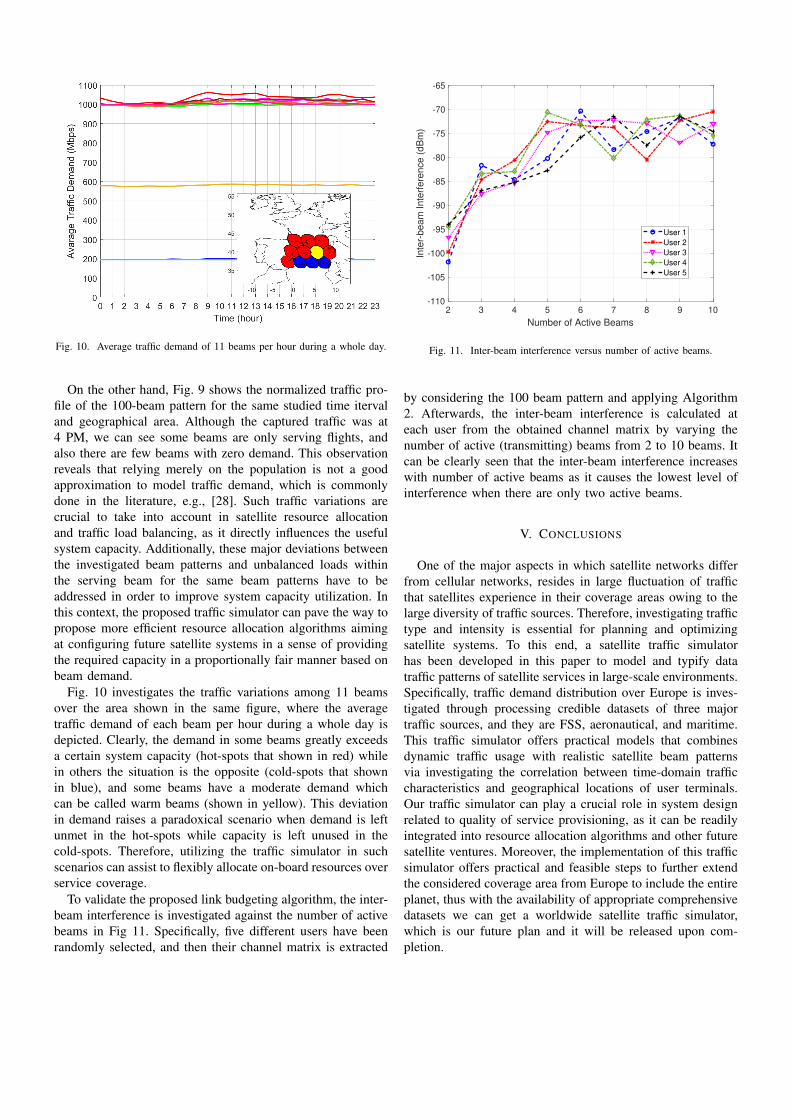
Fig. 10. Average traffic demand of 11 beams per hour during a whole day.
On the other hand, Fig. 9 shows the normalized traffic pro-file of the 100-beam pattern for the same studied time itervaland geographical area. Although the captured traffic was at4 PM, we can see some beams are only serving flights, andalso there are few beams with zero demand. This observationreveals that relying merely on the population is not a goodapproximation to model traffic demand, which is commonlydone in the literature, e.g., [28]. Such traffic variations arecrucial to take into account in satellite resource allocationand traffic load balancing, as it directly influences the usefulsystem capacity. Additionally, these major deviations betweenthe investigated beam patterns and unbalanced loads withinthe serving beam for the same beam patterns have to beaddressed in order to improve system capacity utilization. Inthis context, the proposed traffic simulator can pave the way topropose more efficient resource allocation algorithms aimingat configuring future satellite systems in a sense of providingthe required capacity in a proportionally fair manner based onbeam demand.
Fig. 10 investigates the traffic variations among 11 beamsover the area shown in the same figure, where the averagetraffic demand of each beam per hour during a whole day isdepicted. Clearly, the demand in some beams greatly exceedsa certain system capacity (hot-spots that shown in red) whilein others the situation is the opposite (cold-spots that shownin blue), and some beams have a moderate demand whichcan be called warm beams (shown in yellow). This deviationin demand raises a paradoxical scenario when demand is leftunmet in the hot-spots while capacity is left unused in thecold-spots. Therefore, utilizing the traffic simulator in suchscenarios can assist to flexibly allocate on-board resources overservice coverage.
To validate the proposed link budgeting algorithm, the inter-beam interference is investigated against the number of activebeams in Fig 11. Specifically, five different users have beenrandomly selected, and then their channel matrix is extracted
2 3 4 5 6 7 8 9 10
Number of Active Beams
-110
-105
-100
-95
-90
-85
-80
-75
-70
-65
Inte
r-b
ea
m I
nte
rfe
ren
ce
(d
Bm
)
User 1
User 2
User 3
User 4
User 5
Fig. 11. Inter-beam interference versus number of active beams.
by considering the 100 beam pattern and applying Algorithm2. Afterwards, the inter-beam interference is calculated ateach user from the obtained channel matrix by varying thenumber of active (transmitting) beams from 2 to 10 beams. Itcan be clearly seen that the inter-beam interference increaseswith number of active beams as it causes the lowest level ofinterference when there are only two active beams.
V. CONCLUSIONS
One of the major aspects in which satellite networks differfrom cellular networks, resides in large fluctuation of trafficthat satellites experience in their coverage areas owing to thelarge diversity of traffic sources. Therefore, investigating traffictype and intensity is essential for planning and optimizingsatellite systems. To this end, a satellite traffic simulatorhas been developed in this paper to model and typify datatraffic patterns of satellite services in large-scale environments.Specifically, traffic demand distribution over Europe is inves-tigated through processing credible datasets of three majortraffic sources, and they are FSS, aeronautical, and maritime.This traffic simulator offers practical models that combinesdynamic traffic usage with realistic satellite beam patternsvia investigating the correlation between time-domain trafficcharacteristics and geographical locations of user terminals.Our traffic simulator can play a crucial role in system designrelated to quality of service provisioning, as it can be readilyintegrated into resource allocation algorithms and other futuresatellite ventures. Moreover, the implementation of this trafficsimulator offers practical and feasible steps to further extendthe considered coverage area from Europe to include the entireplanet, thus with the availability of appropriate comprehensivedatasets we can get a worldwide satellite traffic simulator,which is our future plan and it will be released upon com-pletion.
ACKNOWLEDGEMENT
This work is financially supported in part by LuxembourgNational Research Fund (FNR) under the projects FlexSAT(C19/IS/13696663) and IPBG INSTRUCT.
REFERENCES
[1] A. I. Perez-Neira, M. A. Vazquez, M. R. B. Shankar, S. Maleki,and S. Chatzinotas, “Signal processing for high-throughput satellites:Challenges in new interference-limited scenarios,” IEEE Signal Process.Mag., vol. 36, no. 4, pp. 112–131, Jul. 2019.
[2] Y. Guan, F. Geng, and J. H. Saleh, “Review of high throughputsatellites: Market disruptions, affordability-throughput map, and the costper bit/second decision tree,” IEEE Aerosp. Electron. Syst. Mag., vol. 34,no. 5, pp. 64–80, May 2019.
[3] G. Ma, Z. Wang, M. Zhang, J. Ye, M. Chen, and W. Zhu, “Understandingperformance of edge content caching for mobile video streaming,” IEEEJ. Sel. Areas Commun., vol. 35, no. 5, pp. 1076–1089, May 2017.
[4] S. K. Sharma, S. Chatzinotas, and P. Arapoglou, Satellite Communica-tions in the 5G Era. Institution of Engineering and Technology, 2018.
[5] A. J. Roumeliotis, C. I. Kourogiorgas, and A. D. Panagopoulos, “Optimaldynamic capacity allocation for high throughput satellite communica-tions systems,” IEEE Wireless Commun. Lett., vol. 8, no. 2, pp. 596–599,Apr. 2019.
[6] B. Di, L. Song, Y. Li, and H. V. Poor, “Ultra-Dense LEO: Integration ofsatellite access networks into 5G and beyond,” IEEE Wireless Commun.,vol. 26, no. 2, pp. 62–69, Apr. 2019.
[7] EU 5GPP SAT5G Project, “Satellite and Terrestrial Network for 5G,”European Commission, Tech. Rep., 2017, http://sat5g-project.eu/.
[8] A. Guidotti, A. Vanelli-Coralli, M. Conti, S. Andrenacci, S. Chatzinotas,N. Maturo, B. Evans, A. Awoseyila, A. Ugolini, T. Foggi, L. Gaudio,N. Alagha, and S. Cioni, “Architectures and key technical challenges for5G systems incorporating satellites,” IEEE Trans. Veh. Technol., vol. 68,no. 3, pp. 2624–2639, Mar. 2019.
[9] F. Xu, Y. Li, H. Wang, P. Zhang, and D. Jin, “Understanding mobiletraffic patterns of large scale cellular towers in urban environment,”IEEE/ACM Trans. Netw., vol. 25, no. 2, pp. 1147–1161, Apr. 2017.
[10] M. Z. Shafiq, L. Ji, A. X. Liu, and J. Wang, “Characterizing andmodeling internet traffic dynamics of cellular devices,” SIGMETRICSPerform. Eval. Rev., vol. 39, no. 1, p. 265276, Jun. 2011.
[11] T. Pei, S. Sobolevsky, C. Ratti, S.-L. Shaw, T. Li, and C. Zhou, “A newinsight into land use classification based on aggregated mobile phonedata,” Int. J. Geogr. Inf. Sci., vol. 28, no. 9, p. 19882007, Sep. 2014.
[12] J. Du, C. Jiang, H. Zhang, Y. Ren, and M. Guizani, “Auction design andanalysis for SDN-based traffic offloading in hybrid satellite-terrestrialnetworks,” IEEE J. Sel. Areas Commun., vol. 36, no. 10, pp. 2202–2217,Oct. 2018.
[13] D. Connors, B. Ryu, and S. Dao, “Modeling and simulation of broadbandsatellite networks .i. medium access control for QoS provisioning,” IEEECommun. Mag., vol. 37, no. 3, pp. 72–79, March 1999.
[14] C. Jin, X. He, and X. Ding, “Traffic analysis of LEO satellite internet ofthings,” in 15th Int. Wireless Commun. Mobile Comput. Conf. (IWCMC),June 2019, pp. 67–71.
[15] G. Taricco and A. Ginesi, “Precoding for flexible high throughputsatellites: Hot-spot scenario,” IEEE Trans. Broadcast., vol. 65, no. 1,pp. 65–72, Mar. 2019.
[16] “NASA, Socioeconomic data and applications center (SEDAC),” http://sedac.ciesin.columbia.edu.
[17] “ADS-B Exchange - World’s largest co-op of unfiltered flight data,”https://www.adsbexchange.com/data/.
[18] “AIS-Ship tracking of marine traffic,” https://www.vesselfinder.com/.
[19] E. Lutz, M. Werner, and A. Jahn, Satellite Systems for Personal andBroadband Communications. Springer Berlin Heidelberg, 2012.
[20] J. H. Gallier, “Notes on convex sets, polytopes, polyhedra, combinatorialtopology, voronoi diagrams and delaunay triangulations,” University ofPennsylvania, Philadelphia, PA 19104, USA, Tech. Rep., Nov. 2013.
[21] “Link budget calculations for a satellite link with an electronicallysteerable antenna terminal,” Kymeta Corporation, Tech. Rep., Jun. 2019.
[22] W. Jiang and P. Zong, “Analysis and validation of a new path lossmodel for LEO satellite communication systems,” in 2nd Int. Conf. onComputer Engineering and Technology, vol. 2, Apr. 2010, pp. 523–527.
[23] L. Lei, E. Lagunas, Y. Yuan, M. Kibria, S. Chatzinotas, and B. Ottersten,“Deep learning for beam hopping in multibeam satellite systems,” inIEEE Veh. Technol. Conf. (VTC Spring), May 2020.
[24] M. Kibria, E. Lagunas, N. Maturo, D. Spano, H. Al-Hraishawi, andS. Chatzinotas, “Carrier aggregation in multi-beam high throughputsatellite systems,” in IEEE Global Commun. Conf., Dec. 2019.
[25] H. Al-Hraishawi, N. Maturo, E. Lagunas, and S. Chatzinotas, “Percep-tive packet scheduling for carrier aggregation in satellite communicationsystems,” in IEEE Int. Commun. Conf. (ICC), Jun. 2020.
[26] L. Bertaux, S. Medjiah, P. Berthou, S. Abdellatif, A. Hakiri, P. Gelard,F. Planchou, and M. Bruyere, “Software defined networking and virtual-ization for broadband satellite networks,” IEEE Commun. Mag., vol. 53,no. 3, pp. 54–60, Mar. 2015.
[27] European Space Agency (ESA), “FlexPreDem - Demonstrator of pre-coding techniques for flexible broadband systems,” https://artes.esa.int/projects/flexpredem, 2018–2020.
[28] E. Lagunas, S. K. Sharma, S. Maleki, S. Chatzinotas, and B. Ottersten,“Resource allocation for cognitive satellite communications with incum-bent terrestrial networks,” IEEE Trans. on Cogn. Commun. Netw., vol. 1,no. 3, pp. 305–317, Sep. 2015.