Embed Size (px)
Citation preview

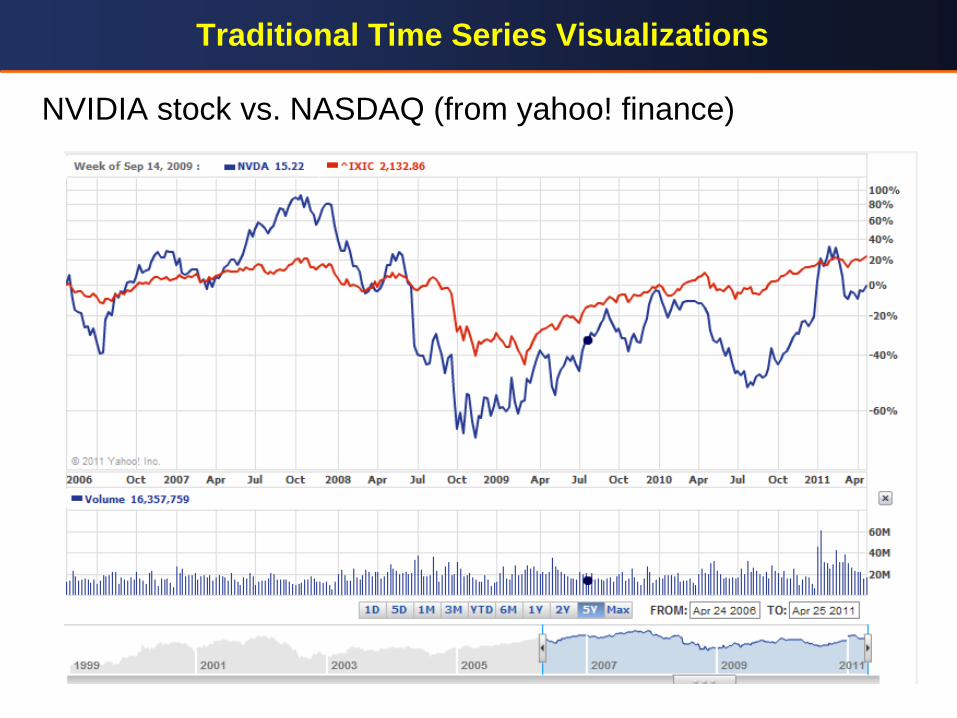
Traditional Time Series Visualizations
NVIDIA stock vs. NASDAQ (from yahoo! finance)
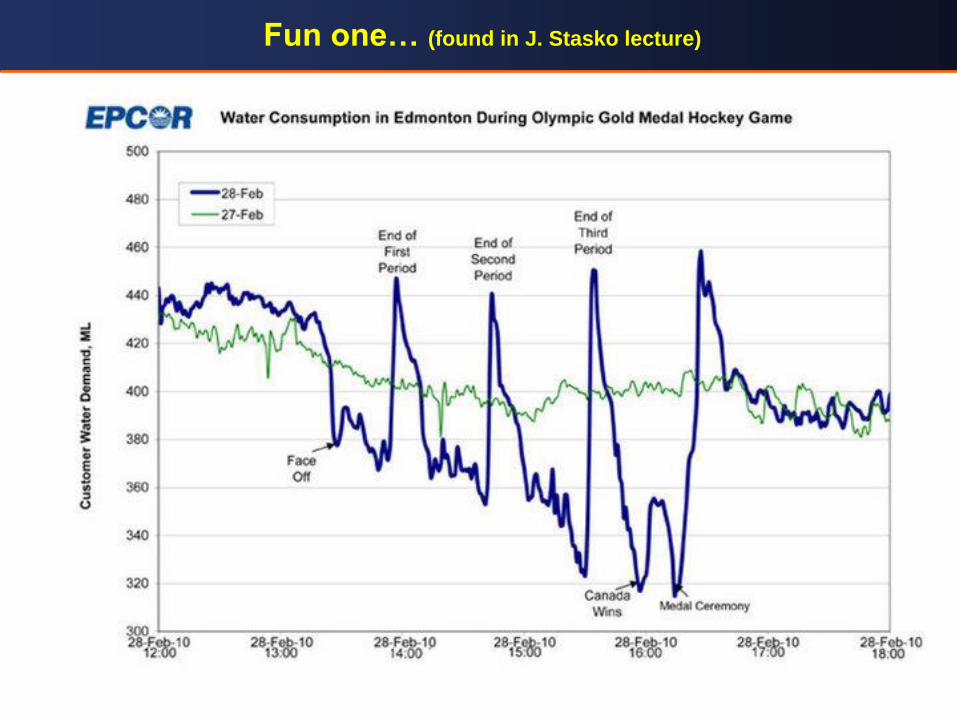
Fun one… (found in J. Stasko lecture)
Next…
A few good visualization metaphors for time
• there are quite a few of them…

ThemeRiver (Havre et al., 2002 )
River widens or narrows to depict changes in the collective strength of selected themes in the underlying documents. Individual themes are
represented as colored "currents" flowing within the river.
Example shown here: newspaper themes around the Cuban Missile crisis

Stream Graphs
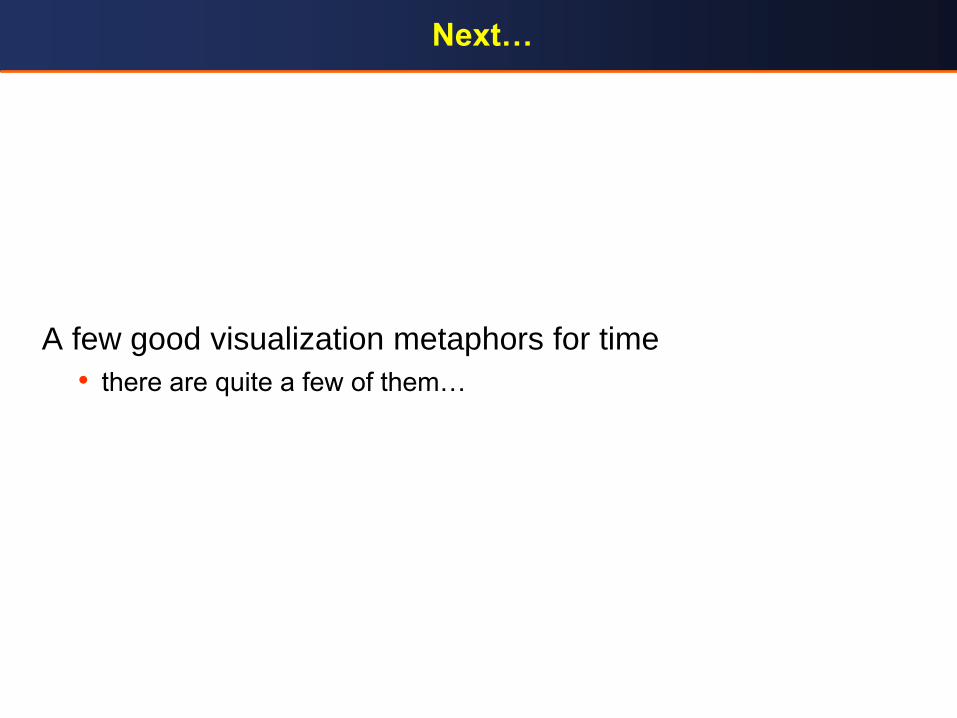
Stacked Area Charts
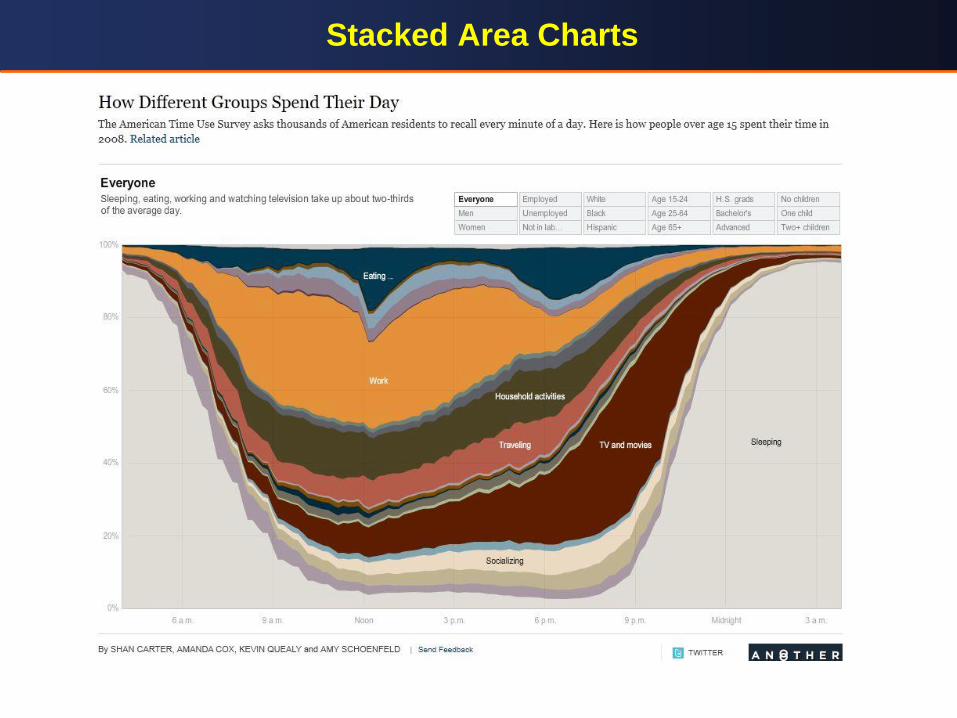
Question
Can you tell me who is who?
• I tell you all the names there are and the age of each person
• can you assign them? (hint: use the Name Voyager)
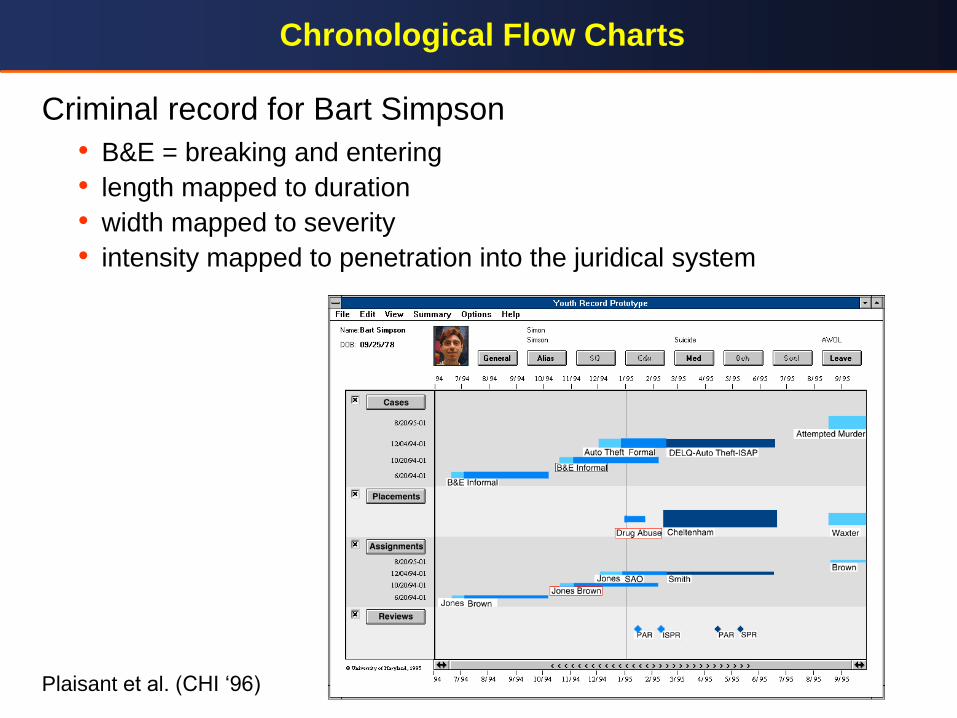
Chronological Flow Charts
Criminal record for Bart Simpson
• B&E = breaking and entering
• length mapped to duration
• width mapped to severity
• intensity mapped to penetration into the juridical system
Plaisant et al. (CHI „96)
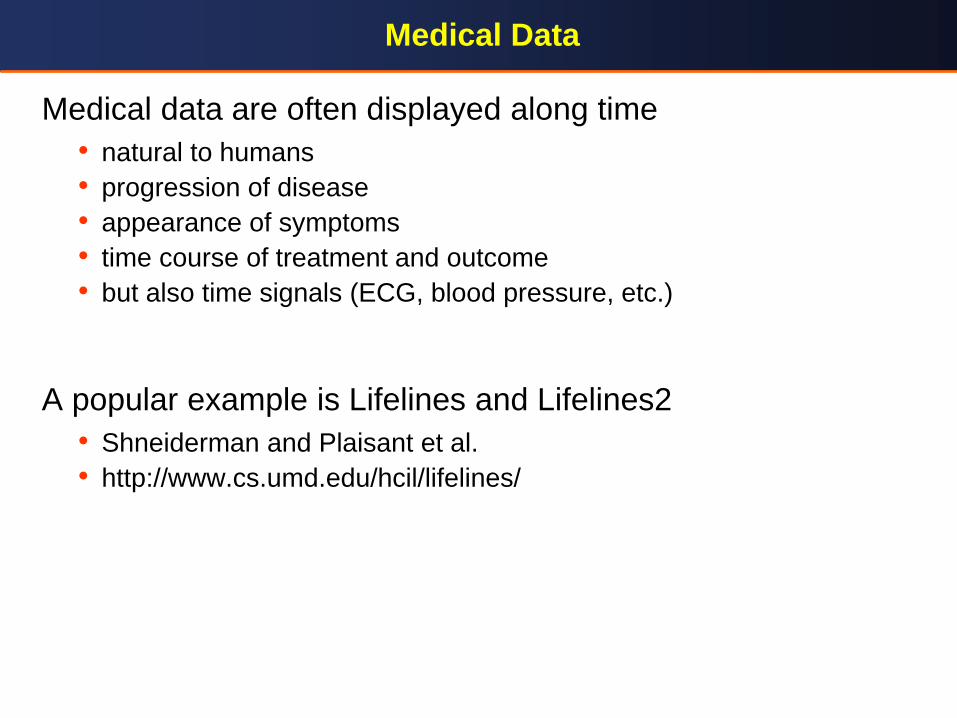
Medical Data
Medical data are often displayed along time
• natural to humans
• progression of disease
• appearance of symptoms
• time course of treatment and outcome
• but also time signals (ECG, blood pressure, etc.)
A popular example is Lifelines and Lifelines2
• Shneiderman and Plaisant et al.
• http://www.cs.umd.edu/hcil/lifelines/
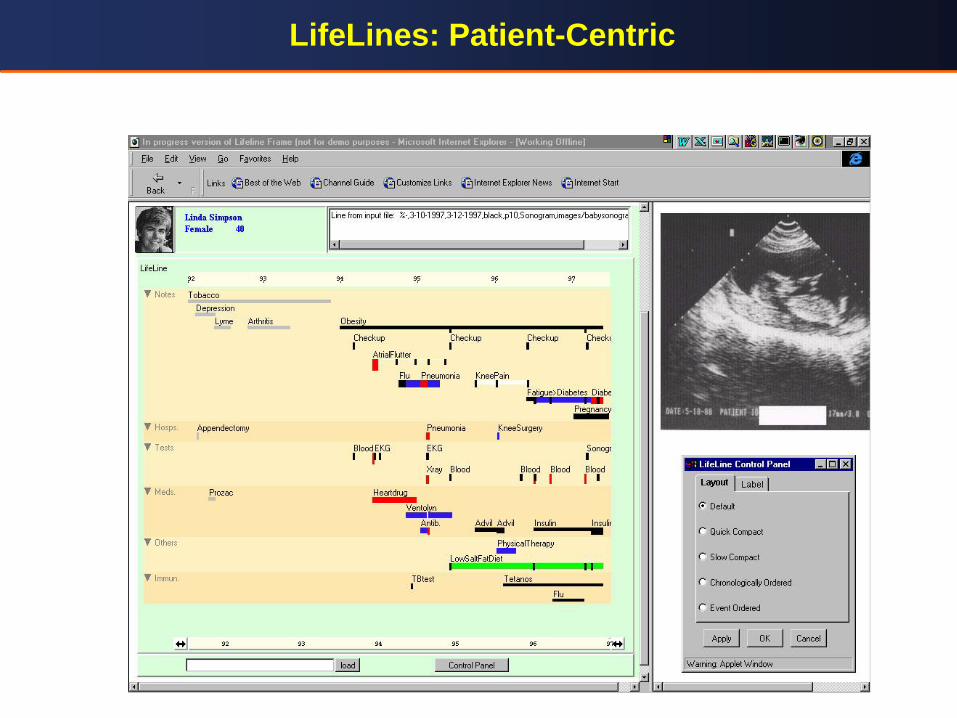
LifeLines: Patient-Centric

LifeLines2: Pattern-Centric
Goals:
• bring out temporal categorical patterns across multiple records
• categorical event data such as complaints, diagnoses, treatments
• play important roles in health providers decision making
Features
• allows users to manipulate multiple records simultaneously
• understand relative temporal relationships across records
• 3 operators: align, rank, filter
• temporal summaries allow multiple groups of records to be compared
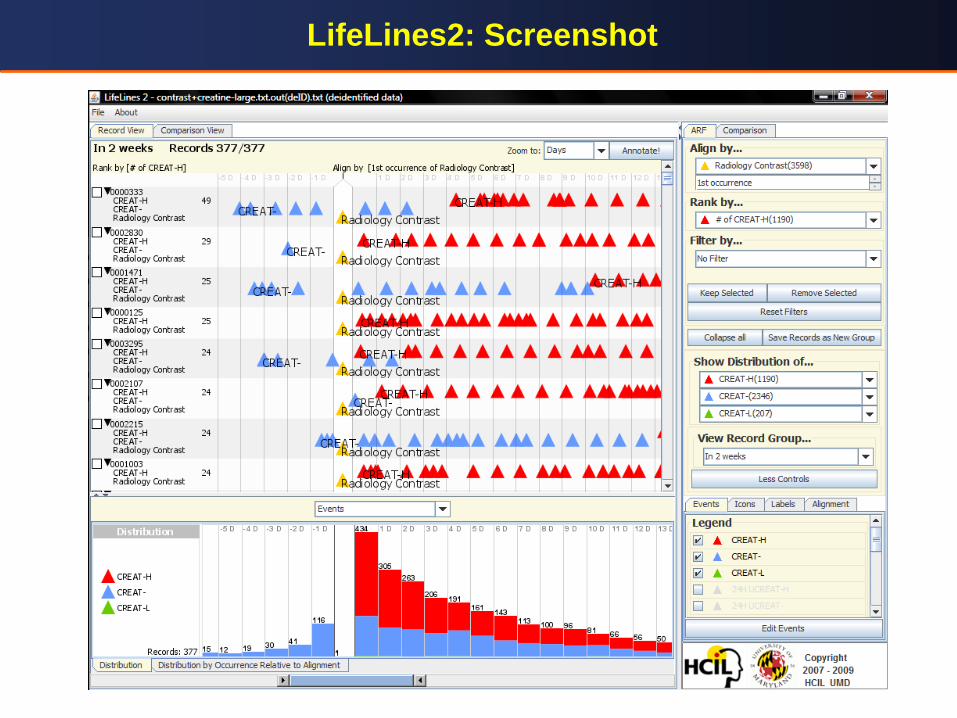
LifeLines2: Screenshot

Multi-Scale and Abstractions (Aigner at al., IEEE TVCG, 2008)
Deal with different levels of detail
• illustrative abstraction
• overview + detail
• used here for medical data

Cyclic Patterns
Time data are often cyclic
• spiral displays are good to bring out cyclic patterns
• one period per loop (for example, a year)
sunshine pattern
linear layout radial layout
Weber et al., 2001

Cyclic Patterns
May have to play around to discover the cycles
from J. Stasko, lecture notes
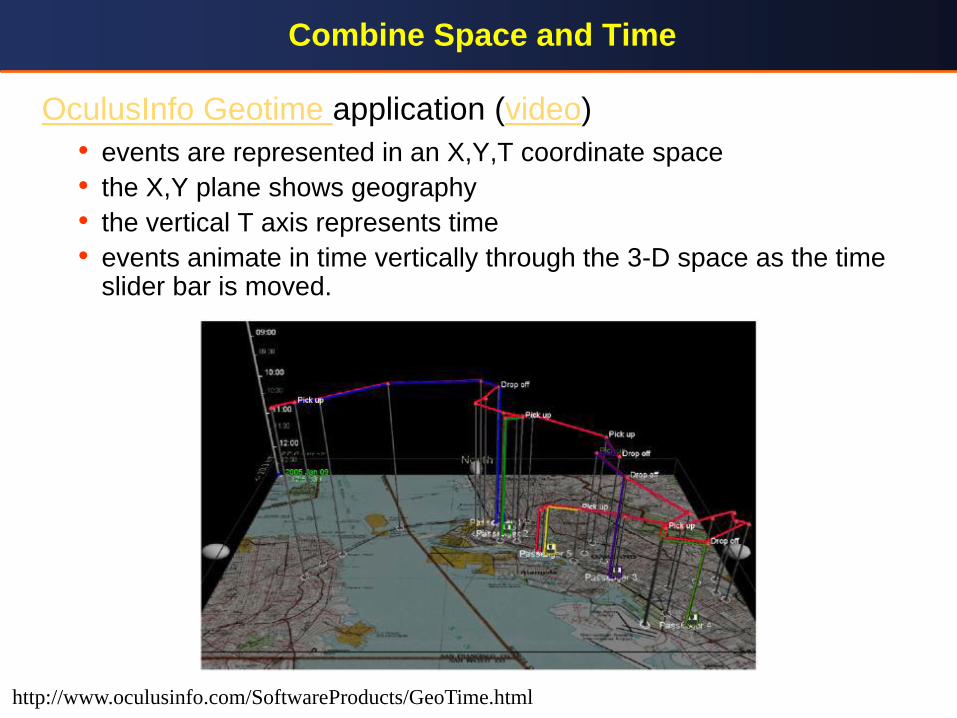
Combine Space and Time
OculusInfo Geotime application (video)
• events are represented in an X,Y,T coordinate space
• the X,Y plane shows geography
• the vertical T axis represents time
• events animate in time vertically through the 3-D space as the time slider bar is moved.
http://www.oculusinfo.com/SoftwareProducts/GeoTime.html
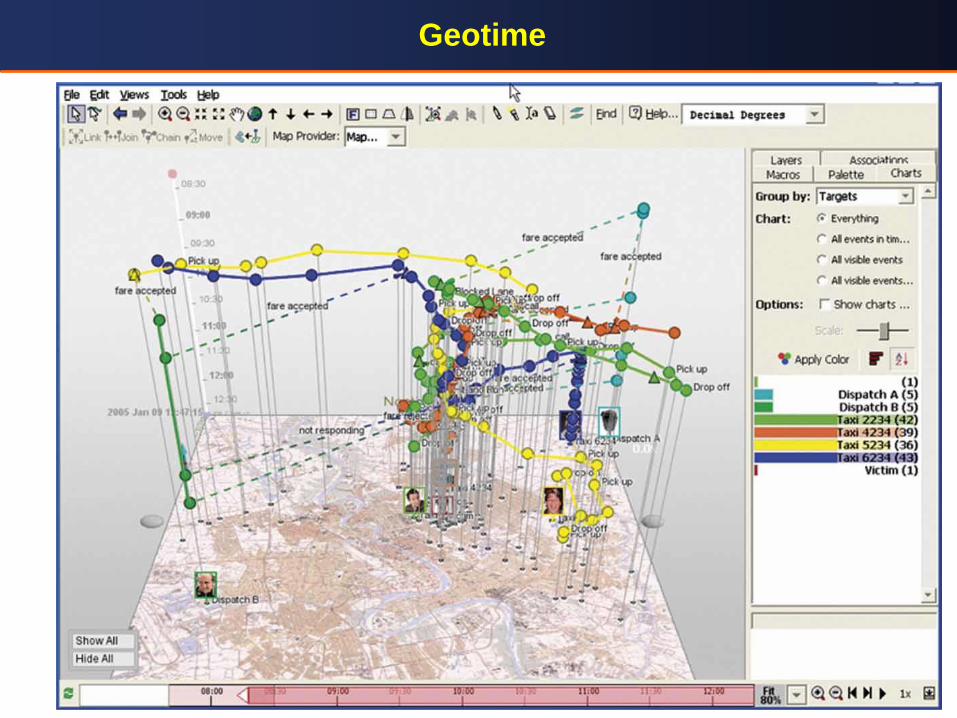
Geotime

Interaction
As complexity increases, interaction capabilities are key
• show more context of what else was going on at that time
• likely have to abstract some of the information
• allow several different levels of detail at once
• allow drill-down for details
• use dashboard design with many linked information displays
Example: Computer system management
• LiveRAC system (McLachlan et al.)
• next two slides

LiveRAC
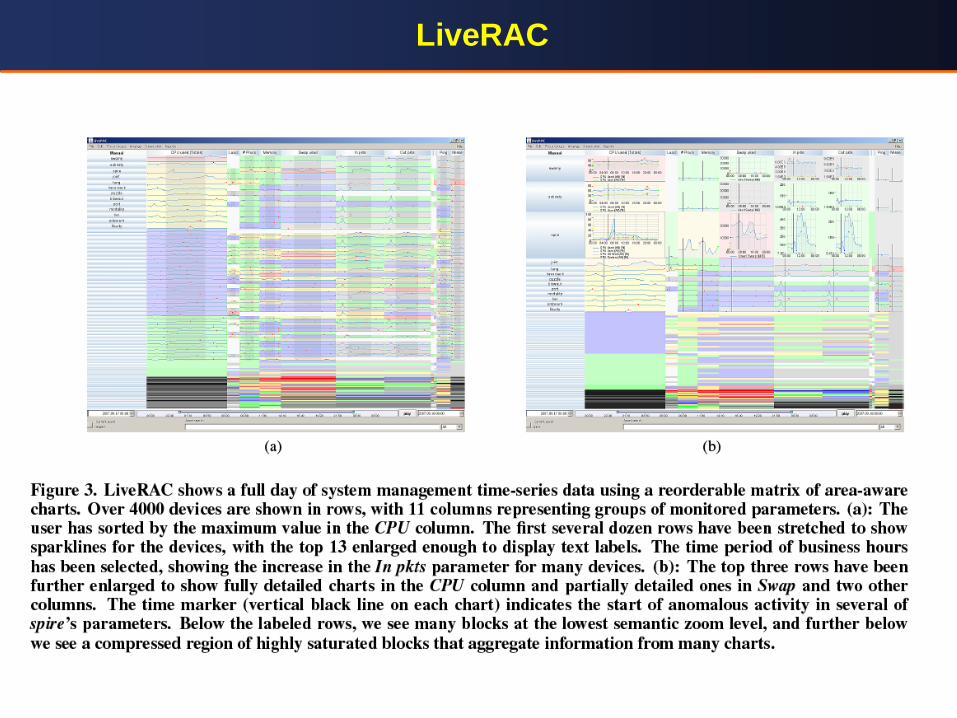
LiveRAC

Next – Streaming Data
Time series data with no end…
Types of Streaming data
Transaction streams
• credit card, point-of-sale transaction
• at a supermarket, or online purchase of an item
Web click-streams
Social streams
• online social networks such as Twitter
• speed and volume of the stream typically scale super-linearly with the number of actors
Network streams
• communication networks contain large volumes of traffic streams
• often mined for intrusions, outliers, or other unusual activity

Challenges (1)
One-pass constraint
• data is generated continuously and rapidly
• it is assumed that the data can be processed only once
• archival for future processing is not possible
• prevents use of iterative mining or model building algorithms that require multiple passes over the data
Concept drift, concept evolution, feature evolution
• data may evolve over time
• various statistical properties, such as correlations between attributes, correlations between attributes and class labels, and cluster distributions may change over time

Concept Drift
Negative instance
Positive instance
A data chunk
Current hyperplane
Previous hyperplane
Instances victim of concept-drift
Latifur Khan, et al. IBM
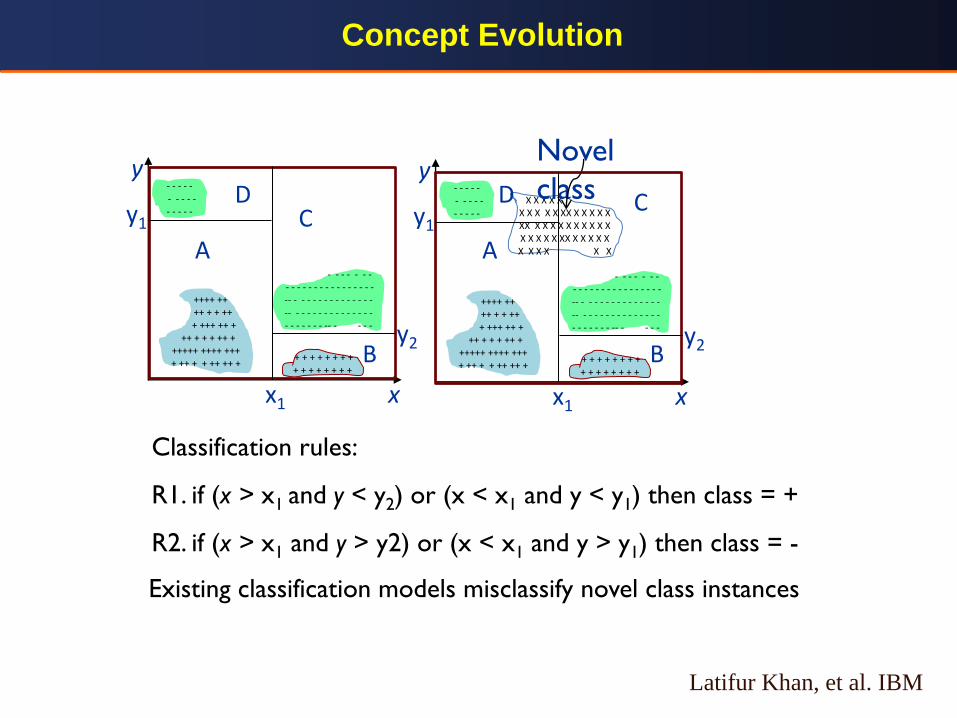
Concept Evolution
X X X X X X X X X X XX X X X X X XX X X X X X X X X X X X X X X X XX X X X X X X X X X X X
Novel
class y
x1
y1
y2
x
++++ ++
++ + + ++ + +++ ++ + ++ + + + ++ +
+++++ ++++ +++ + ++ + + ++ ++ +
- - - - -
- - - - - - - - - -
+ + + + + + + + + + + + + + + +
- - - - - - - - - - - - - - - - - - - - - - - -- - - - - - - - - - - - - - - -- - - - - - - - - - - - - - - - - - - - - - -- - - - -
Classification rules:
R1. if (x > x1 and y < y2) or (x < x1 and y < y1) then class = +
R2. if (x > x1 and y > y2) or (x < x1 and y > y1) then class = -
Existing classification models misclassify novel class instances
A C
D
B
y
x1
y1
y2
x
++++ ++
++ + + ++ + +++ ++ + ++ + + + ++ +
+++++ ++++ +++ + ++ + + ++ ++ +
- - - - -
- - - - - - - - - -
+ + + + + + + + + + + + + + + +
- - - - - - - - - - - - - - - - - - - - - - - -- - - - - - - - - - - - - - - -- - - - - - - - - - - - - - - - - - - - - - -- - - - -
A
C D
B
Latifur Khan, et al. IBM

CluStream Clustering
The concept drift in an evolving data stream changes the clusters significantly over time
• need a clustering algorithm that can deal with this
• CluStream is such an algorithm
CluStream‟s online microclustering clustering stage
• processes the stream in real time to continuously maintain summarized but detailed (micro-)cluster statistics of the stream
CluStream‟s offline macroclustering stage
• further summarizes these detailed clusters
• provides the user with a more concise understanding of the clusters over different time horizons and levels of temporal granularity.

Microclustering Algorithm
There are k microclusters
• a new data point either needs to be absorbed by a microcluster, or it needs to be put in a cluster of its own
Algorithm
• determine distance of the new data point to all current microcluster centroids
• assign the point to the closest cluster and update the statistics
• if the point does not fall within the maximum boundary of any microcluster create a new microcluster
• to create this new microcluster, the number of other microclusters must be reduced by 1 to free memory availability
• achieve this by either deleting an old microcluster or merging two of the older clusters
• decide by examining the staleness (using the time stamp statistics) of the different clusters, and the number of points in them
• determine whether one of them is “sufficiently” stale to merit removal
• if no microcluster is stale, then a merging of the two microclusters is initiated
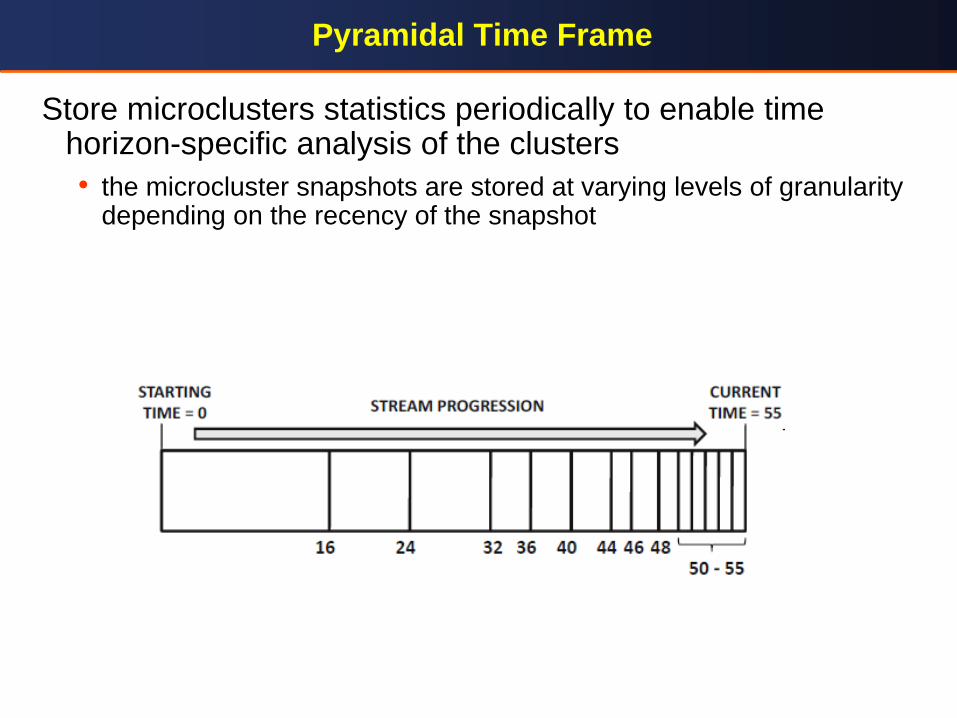
Pyramidal Time Frame
Store microclusters statistics periodically to enable time horizon-specific analysis of the clusters
• the microcluster snapshots are stored at varying levels of granularity depending on the recency of the snapshot

Other Stream Mining Issues
Streaming outlier (anomaly) detection
• use time windows and k-nearest neighbor scores
• new concepts or trends can manifest themselves as outliers in the onset
Streaming classifiers
• the Hoeffding tree is constructed incrementally by growing the tree simultaneously with stream arrival.