Embed Size (px)
Citation preview

Traditional Hazard Analysis
1

Agenda
• Today– Intro to Hazard Analysis– Traditional Qualitative Methods
• FMEA• FTA• ETA• HAZOP
– Strengths / Limitations
• Next: Traditional Quantitative Methods– FMECA– FTA– PRA– Strengths / Limitations
2
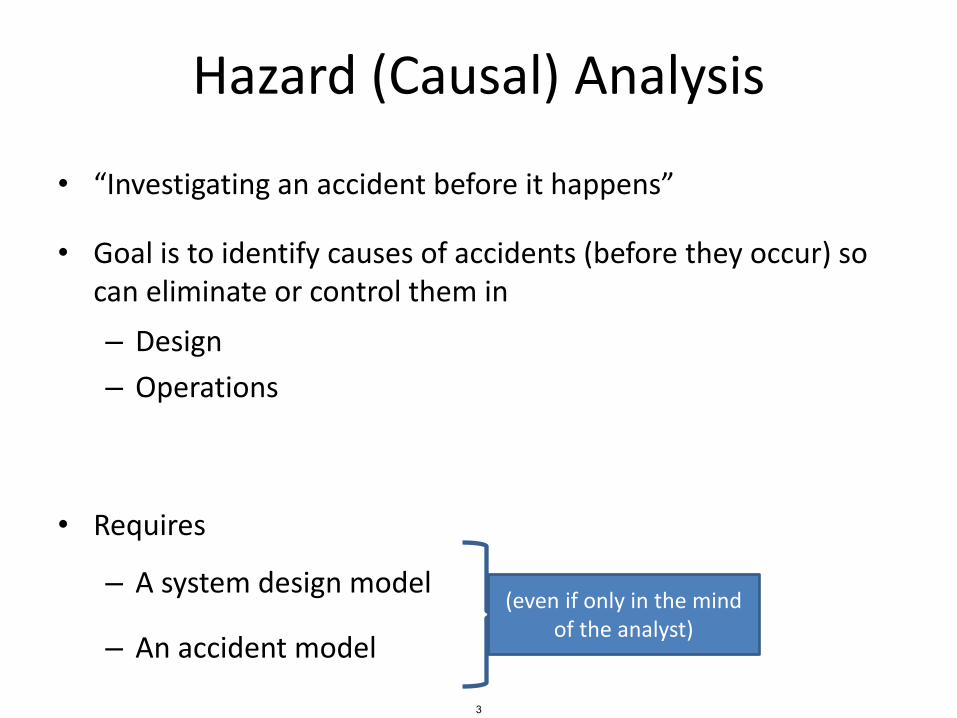
Hazard (Causal) Analysis
• “Investigating an accident before it happens”
• Goal is to identify causes of accidents (before they occur) so can eliminate or control them in
– Design
– Operations
• Requires
– A system design model
– An accident model
(even if only in the mind of the analyst)
3

Physical System Design Model (simplified)
Pressurized Metal Tank Valve control inputValve control input
Water Supply
Drain
4
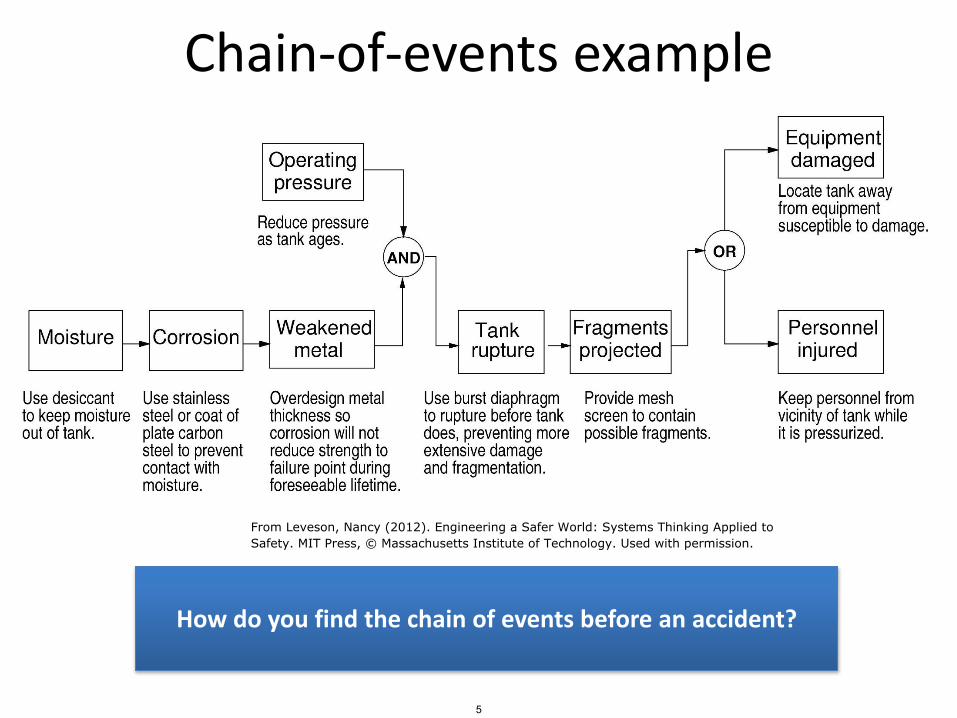
Chain-of-events example
From Leveson, Nancy (2012). Engineering a Safer World: Systems Thinking Applied toSafety. MIT Press, © Massachusetts Institute of Technology. Used with permission.
How do you find the chain of events before an accident?
5

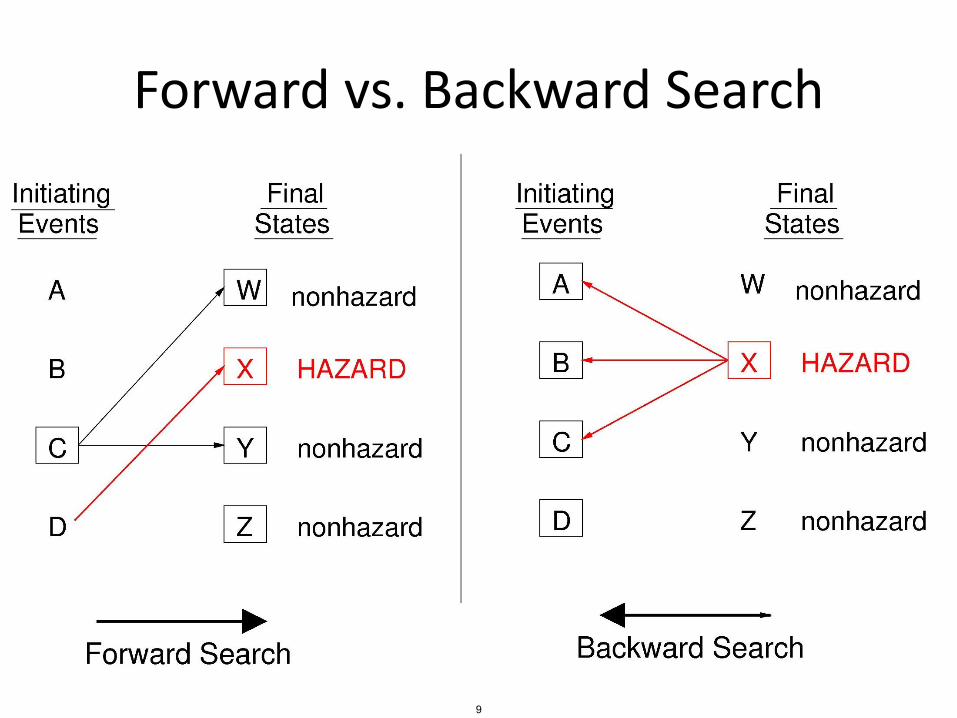
Forward vs. Backward Search
© Copyright Nancy Leveson, Aug. 20066

Input Output
Forward search?
7
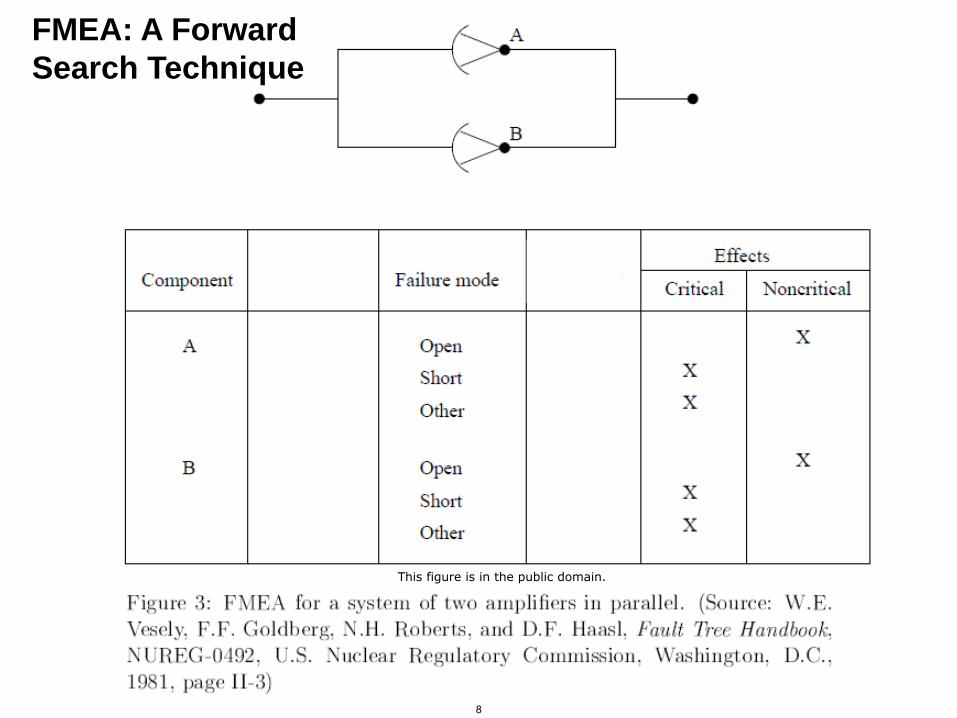
FMEA: A Forward
Search Technique
This figure is in the public domain.
8
Forward vs. Backward Search
© Copyright Nancy Leveson, Aug. 20069
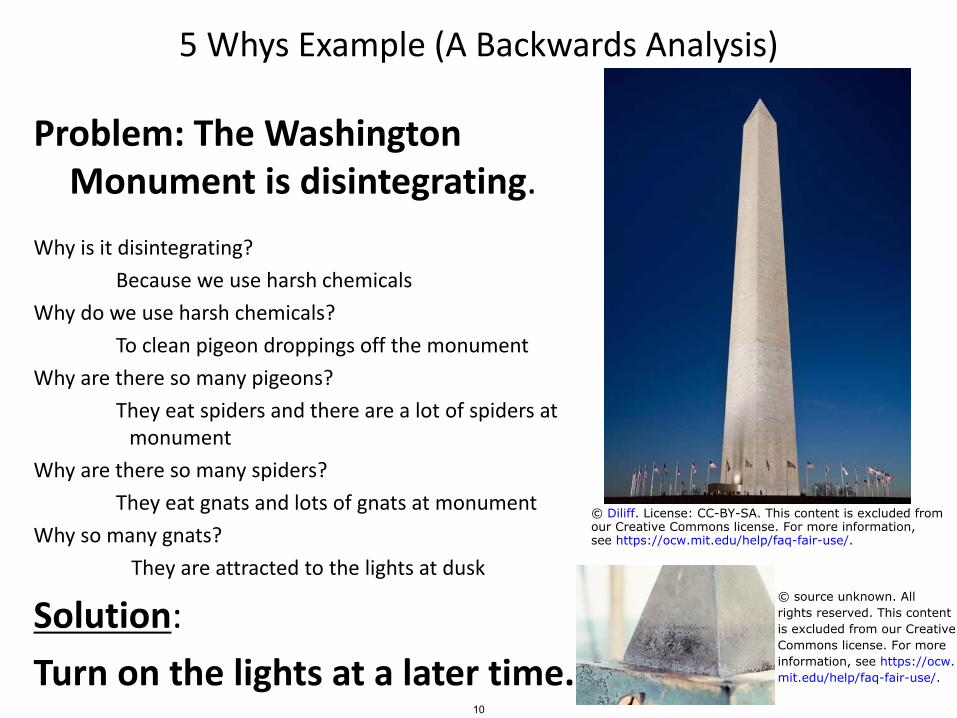
5 Whys Example (A Backwards Analysis)
Problem: The Washington Monument is disintegrating.
Why is it disintegrating?
Because we use harsh chemicals
Why do we use harsh chemicals?
To clean pigeon droppings off the monument
Why are there so many pigeons?
They eat spiders and there are a lot of spiders at monument
Why are there so many spiders?
They eat gnats and lots of gnats at monument
Why so many gnats?
They are attracted to the lights at dusk
Solution:
Turn on the lights at a later time.
© Diliff. License: CC-BY-SA. This content is excluded fromour Creative Commons license. For more information,see https://ocw.mit.edu/help/faq-fair-use/.
© source unknown. Allrights reserved. This contentis excluded from our CreativeCommons license. For moreinformation, see https://ocw.mit.edu/help/faq-fair-use/.
10
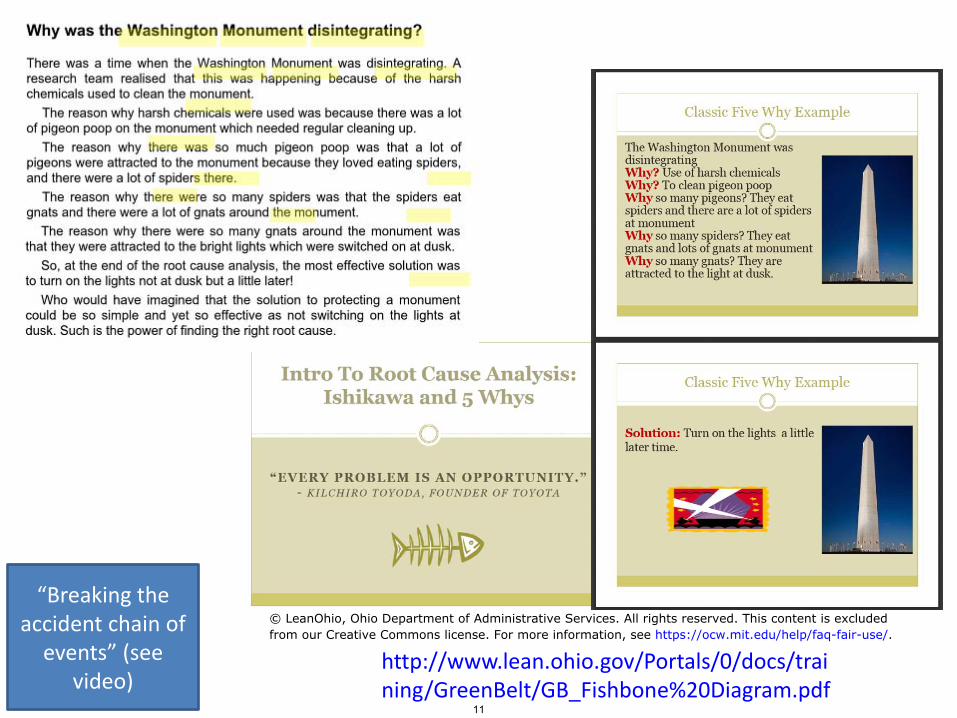
http://www.lean.ohio.gov/Portals/0/docs/training/GreenBelt/GB_Fishbone%20Diagram.pdf
“Breaking the accident chain of
events” (see video)
11
© LeanOhio, Ohio Department of Administrative Services. All rights reserved. This content is excludedfrom our Creative Commons license. For more information, see https://ocw.mit.edu/help/faq-fair-use/.
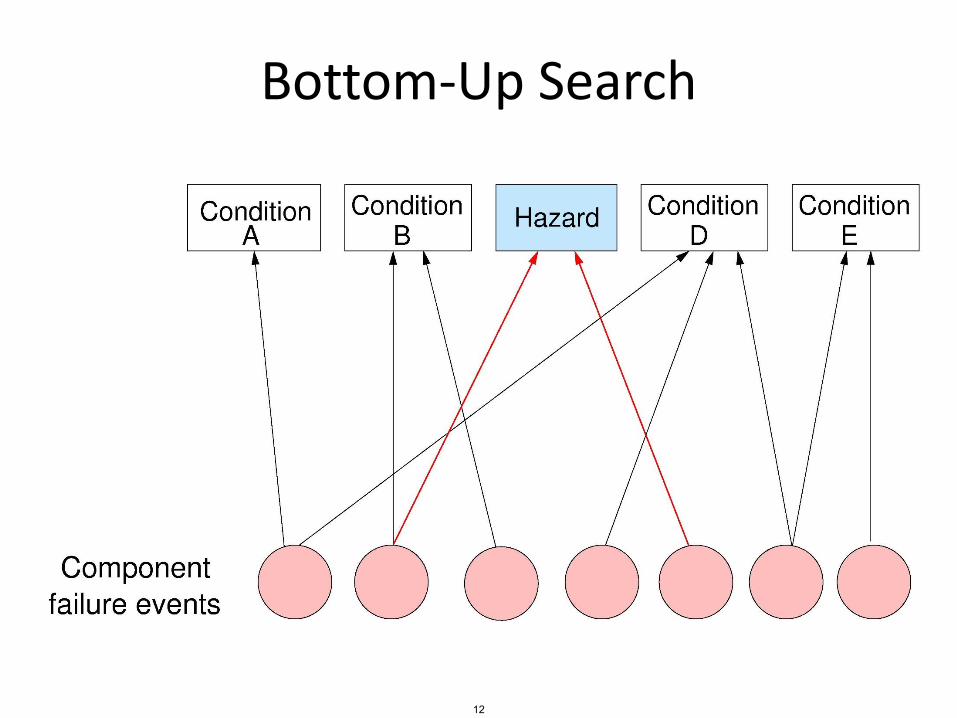
Bottom-Up Search
12
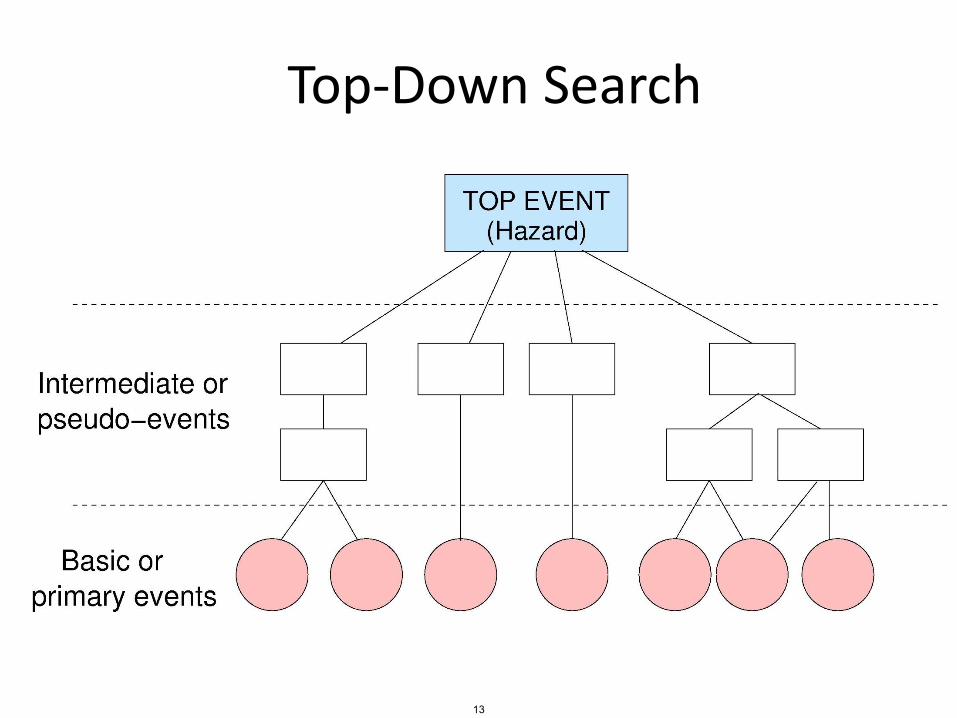
Top-Down Search
13
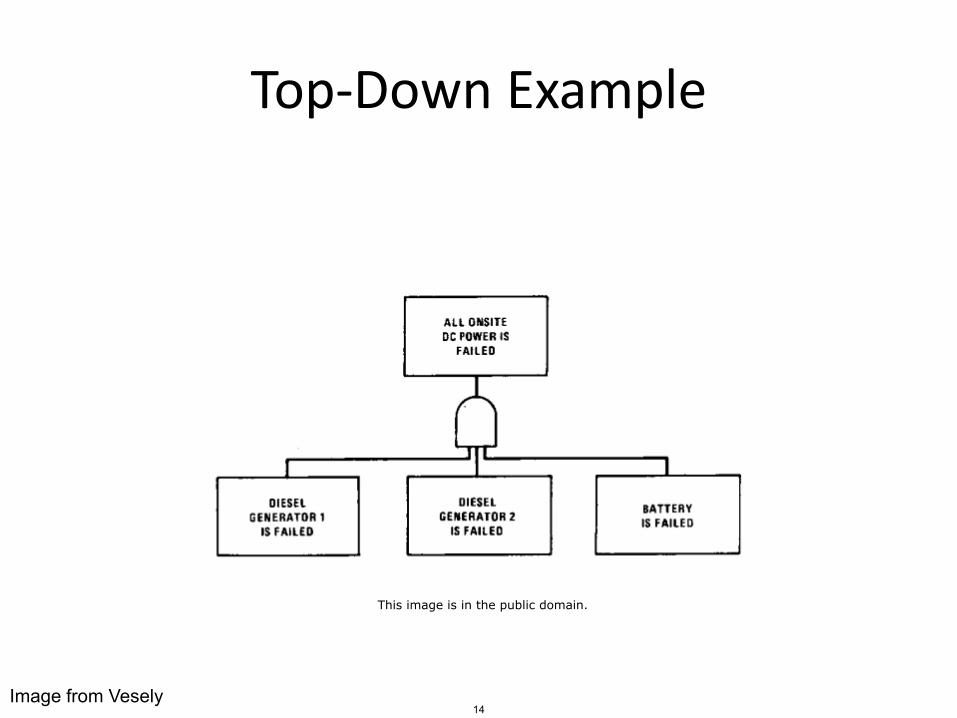
Top-Down Example
Image from Vesely
This image is in the public domain.
14
Traditional Qualitative Methods
FMEA (Failure Modes and Effects Analysis)
15

FMEA: Failure Modes and Effects Analysis
• 1949: MIL-P-1629
• Forward search technique
– Initiating event: component failure
– Goal: identify effect of each failure
Courtesy of John Thomas. Used with permission.
16
General FMEA Process
1. Identify individual components
2. Identify failure modes
3. Identify failure mechanisms (causes)
4. Identify failure effects
17
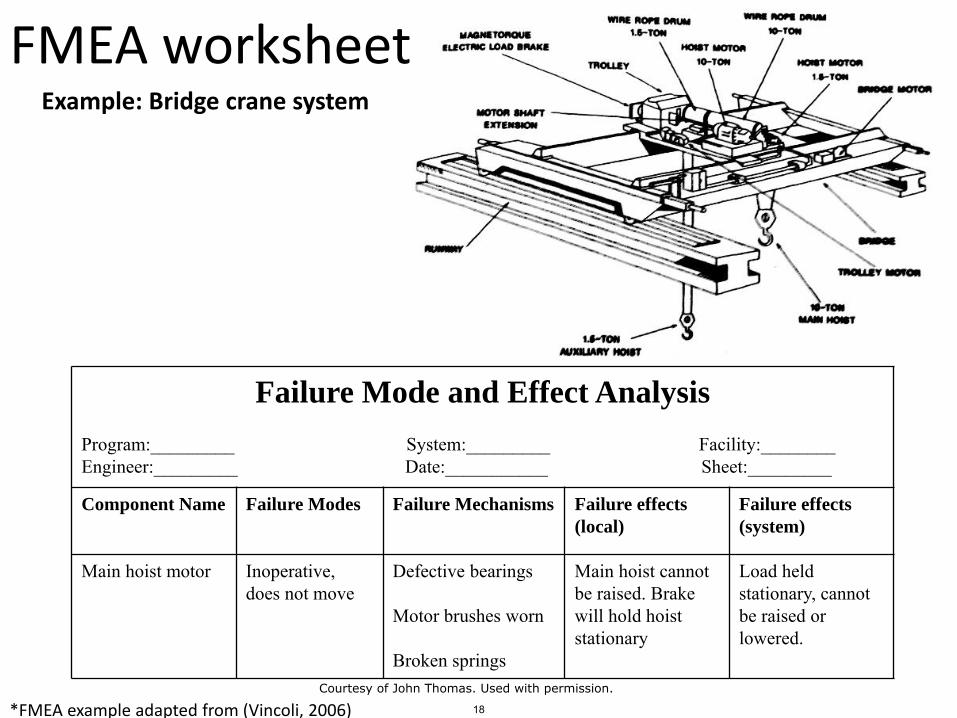
Failure Mode and Effect Analysis
Program:_________ System:_________ Facility:________Engineer:_________ Date:___________ Sheet:_________
Component Name Failure Modes Failure Mechanisms Failure effects
(local)
Failure effects
(system)
Main hoist motor Inoperative, does not move
Defective bearings
Motor brushes worn
Broken springs
Main hoist cannot be raised. Brake will hold hoiststationary
Load held stationary, cannot be raised or lowered.
FMEA worksheet
*FMEA example adapted from (Vincoli, 2006)
Example: Bridge crane system
Courtesy of John Thomas. Used with permission.
18
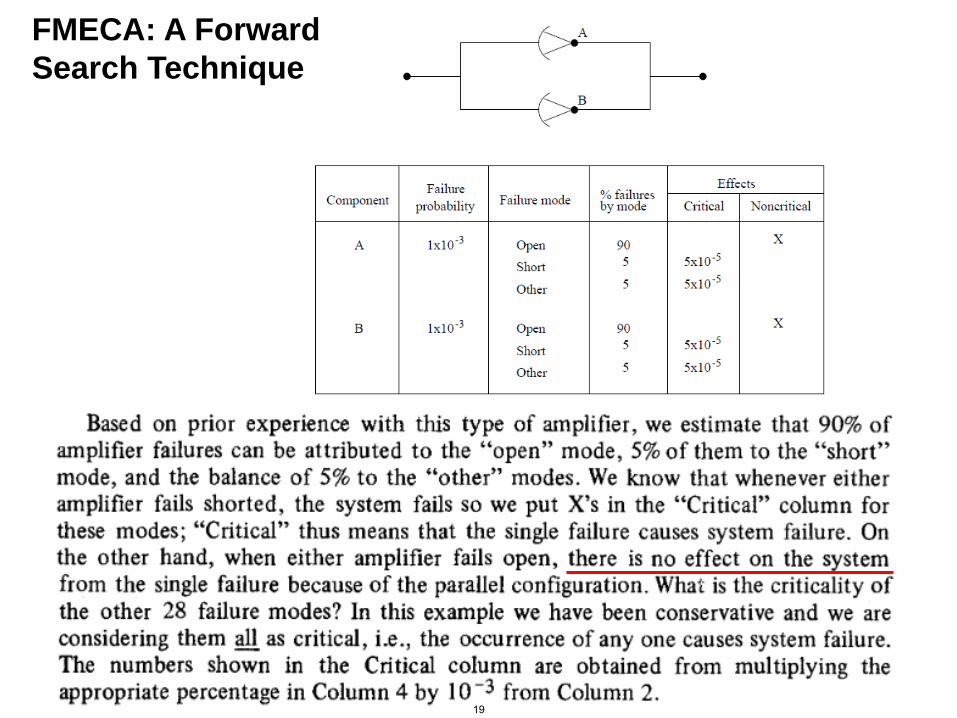
FMECA: A Forward
Search Technique
19

Failure Mode and Effect Analysis
Program:_________ System:_________ Facility:________Engineer:_________ Date:___________ Sheet:_________
Component Name Failure Modes Failure
Mechanisms
Failure effects
(local)
Failure effects
(system)
Main Hoist Motor Inoperative, does not move
Defective bearings
Loss of power
Broken springs
Main hoist cannot be raised. Brake will hold hoiststationary
Load held stationary, cannot be raised or lowered.
FMEA uses an accident model
*FMEA example adapted from (Vincoli, 2006)
Defective bearings
Causes Inoperative hoist motor
Causes Main hoist frozen
Causes Main load held stationary
FMEA method:
Accident model:Accident model: Chain-of-events
20
Courtesy of John Thomas. Used with permission.
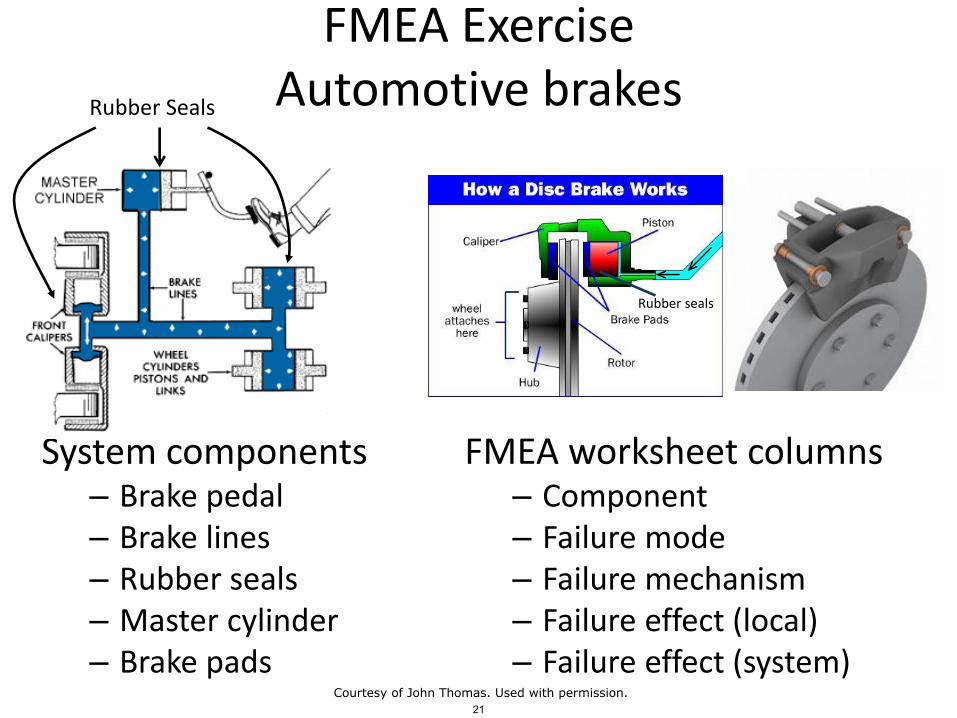
FMEA ExerciseAutomotive brakes
System components– Brake pedal– Brake lines– Rubber seals– Master cylinder– Brake pads
Rubber seals
FMEA worksheet columns– Component– Failure mode– Failure mechanism– Failure effect (local)– Failure effect (system)
Rubber Seals
21Courtesy of John Thomas. Used with permission.
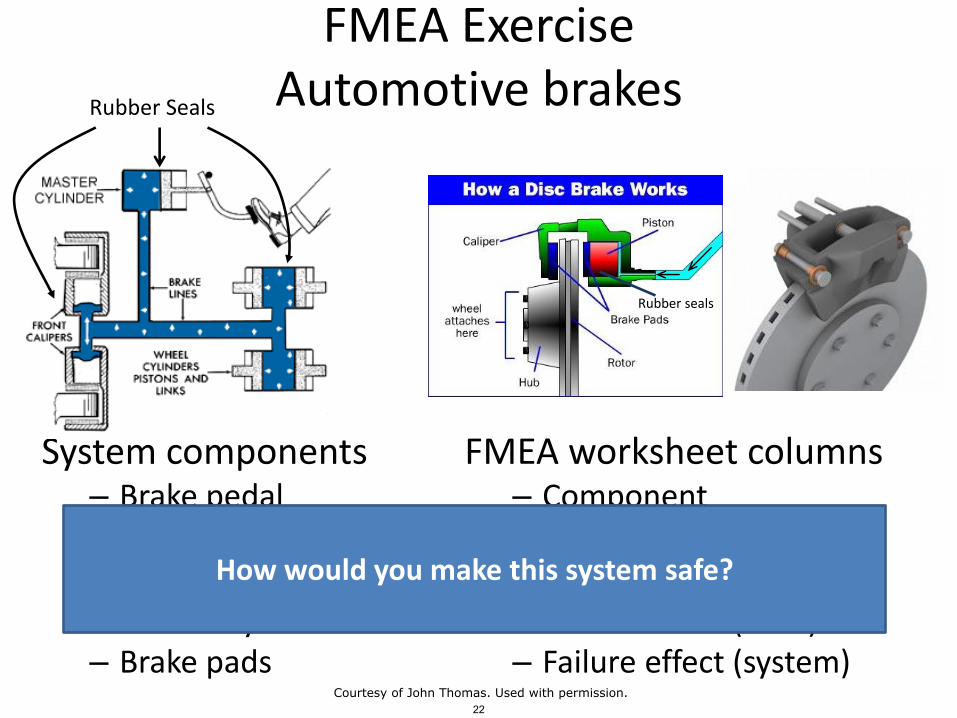
FMEA ExerciseAutomotive brakes
System components– Brake pedal– Brake lines– Rubber seals– Master cylinder– Brake pads
Rubber seals
FMEA worksheet columns– Component– Failure mode– Failure mechanism– Failure effect (local)– Failure effect (system)
Rubber Seals
How would you make this system safe?
22Courtesy of John Thomas. Used with permission.
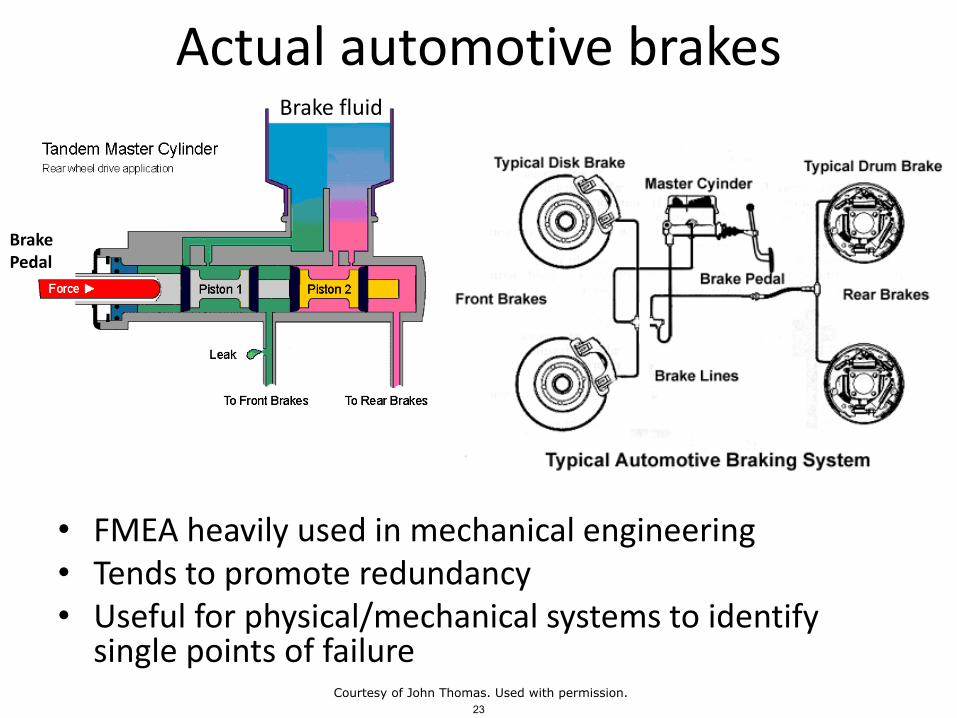
Actual automotive brakes
• FMEA heavily used in mechanical engineering• Tends to promote redundancy• Useful for physical/mechanical systems to identify
single points of failure
BrakePedal
Brake fluid
23Courtesy of John Thomas. Used with permission.
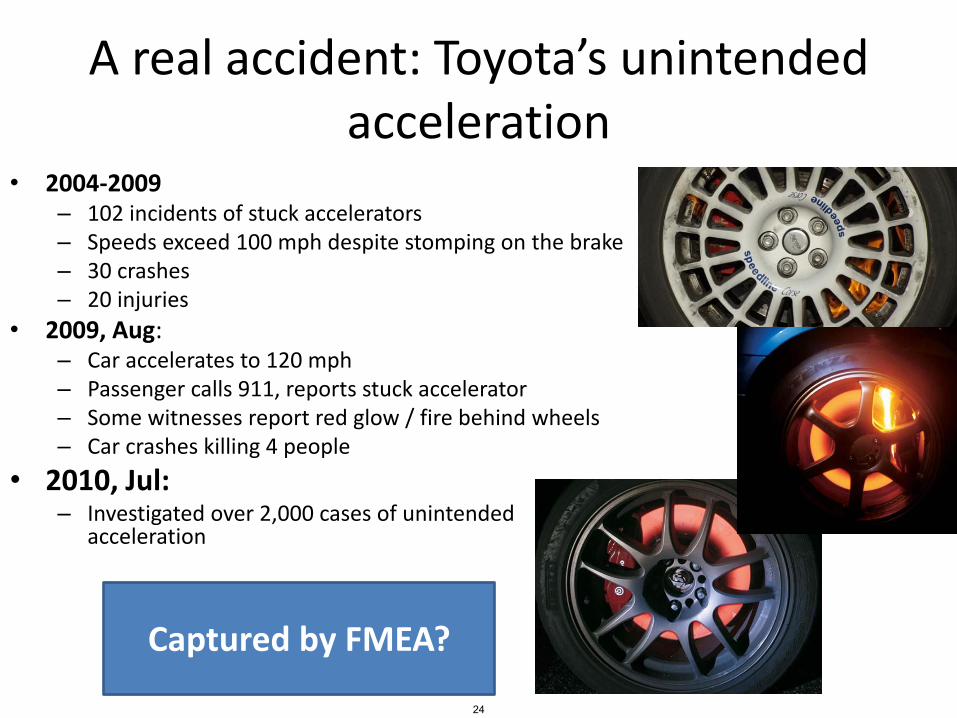
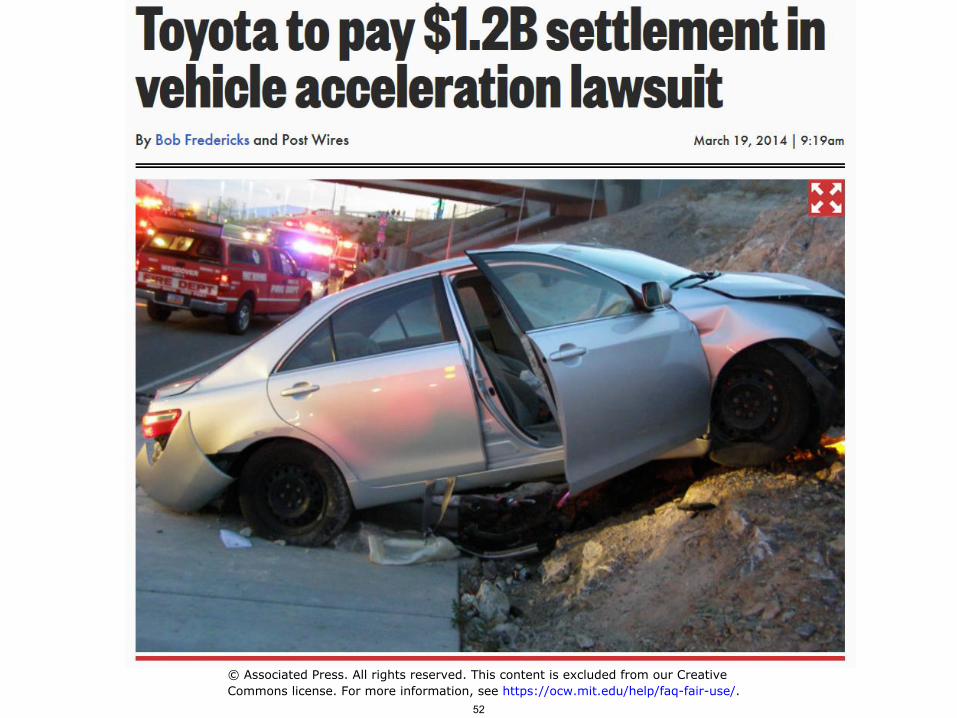
A real accident: Toyota’s unintended acceleration
• 2004-2009– 102 incidents of stuck accelerators– Speeds exceed 100 mph despite stomping on the brake – 30 crashes– 20 injuries
• 2009, Aug:– Car accelerates to 120 mph– Passenger calls 911, reports stuck accelerator– Some witnesses report red glow / fire behind wheels– Car crashes killing 4 people
• 2010, Jul:– Investigated over 2,000 cases of unintended
acceleration
Captured by FMEA?
24
Failure discussion
• Component Failure
Vs.
• Design problem
Vs.
• Requirements problem
25
FMEA Limitations• Component failure incidents only
– Unsafe interactions? Design issues? Requirements issues?
• Single component failures only– Multiple failure combinations not considered
• Requires detailed system design– Limits how early analysis can be applied
• Works best on hardware/mechanical components– Human operators? (Driver? Pilot?)– Software failure?– Organizational factors (management pressure? culture?)
• Inefficient, analyzes unimportant + important failures– Can result in 1,000s of pages of worksheets
• Tends to encourage redundancy– Often leads to inefficient solutions
• Failure modes must already be known– Best for standard parts with few and well-known failure modes
26
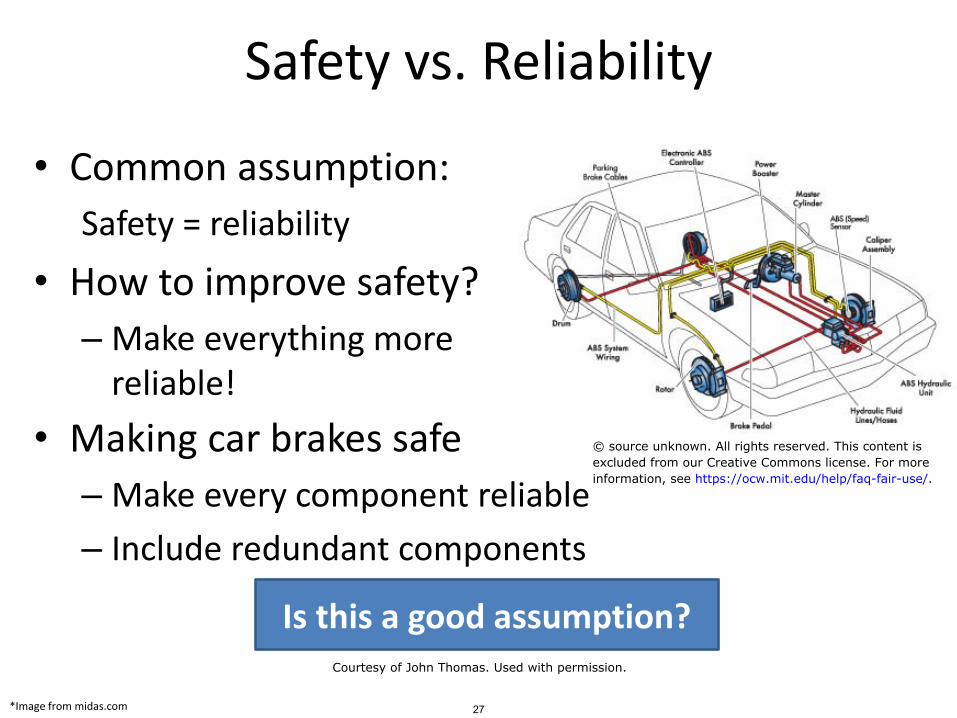
Safety vs. Reliability
• Common assumption:
Safety = reliability
• How to improve safety?
– Make everything more reliable!
*Image from midas.com
• Making car brakes safe
– Make every component reliable
– Include redundant components
Is this a good assumption?
27
© source unknown. All rights reserved. This content isexcluded from our Creative Commons license. For moreinformation, see https://ocw.mit.edu/help/faq-fair-use/.
Courtesy of John Thomas. Used with permission.

Safety vs. reliability
Reliability Failures
Safety Incidents
Component property
System property
28
Courtesy of John Thomas. Used with permission.
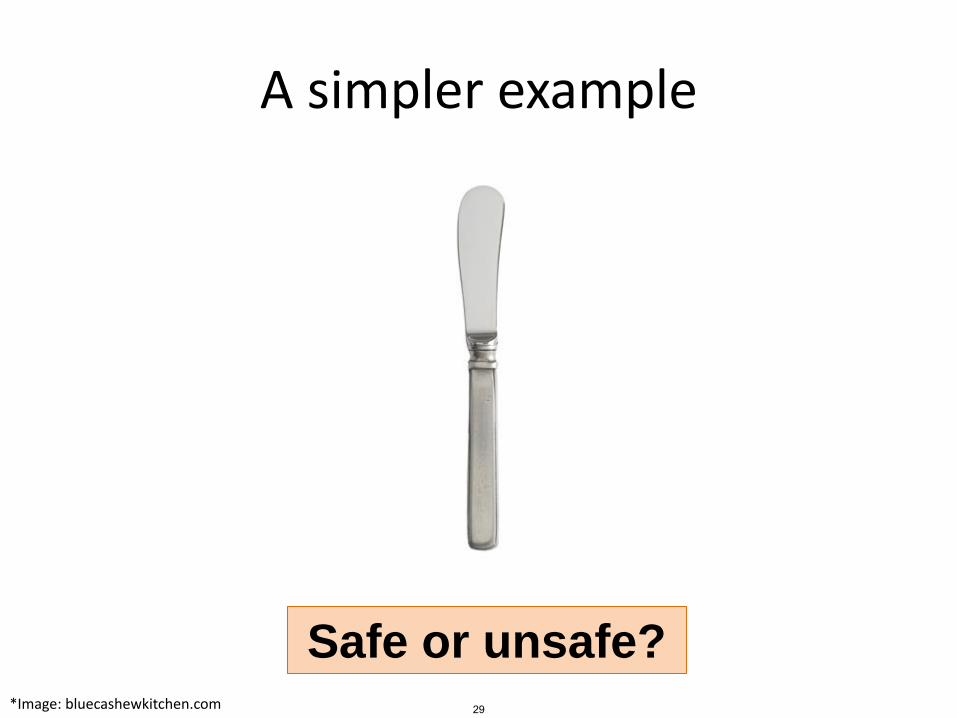
A simpler example
Safe or unsafe?*Image: bluecashewkitchen.com 29
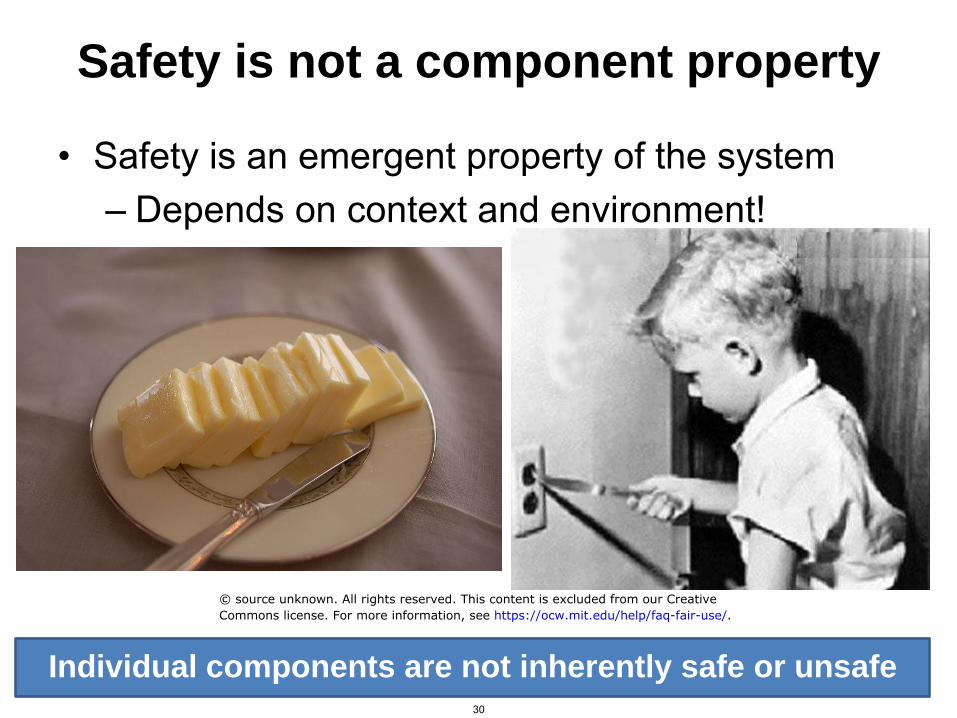
Safety is not a component property
• Safety is an emergent property of the system– Depends on context and environment!
Individual components are not inherently safe or unsafe30
© source unknown. All rights reserved. This content is excluded from our CreativeCommons license. For more information, see https://ocw.mit.edu/help/faq-fair-use/.

Safety vs. Reliability
Unsafe Unreliable scenarios scenarios
31
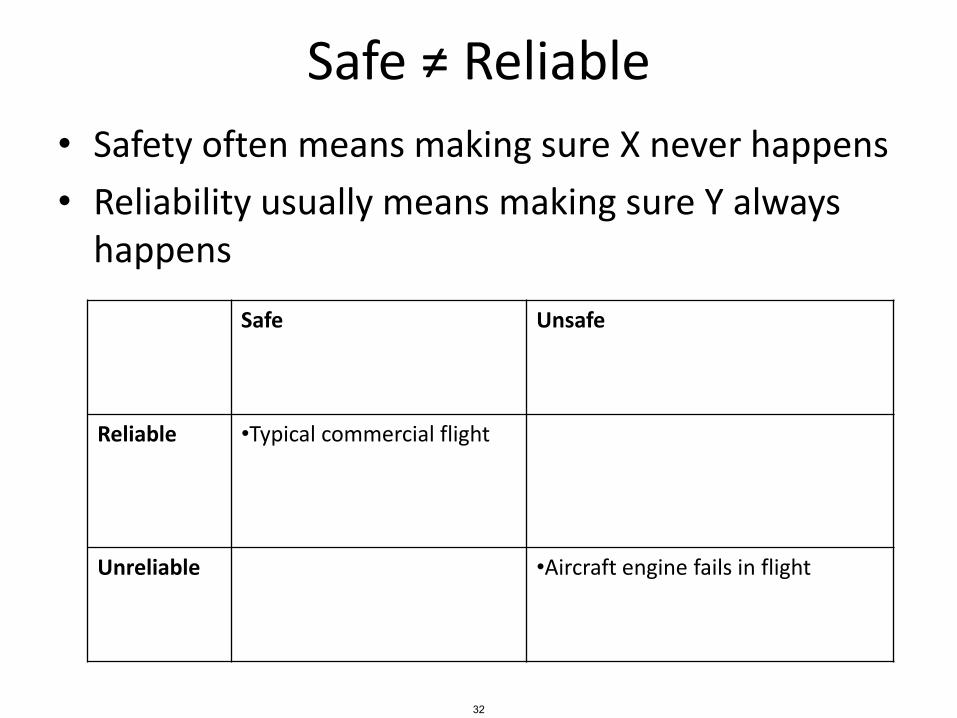
Safe ≠ Reliable
• Safety often means making sure X never happens
• Reliability usually means making sure Y always happens
Safe Unsafe
Reliable •Typical commercial flight
Unreliable •Aircraft engine fails in flight
32
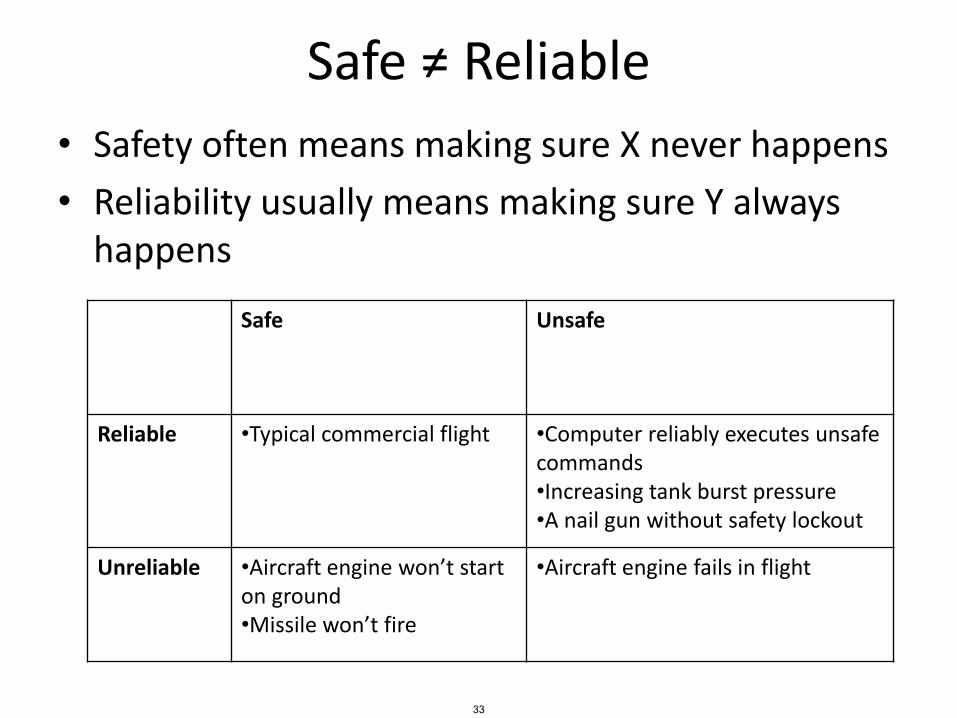
Safe ≠ Reliable
• Safety often means making sure X never happens
• Reliability usually means making sure Y always happens
Safe Unsafe
Reliable •Typical commercial flight •Computer reliably executes unsafe commands•Increasing tank burst pressure•A nail gun without safety lockout
Unreliable •Aircraft engine won’t start on ground•Missile won’t fire
•Aircraft engine fails in flight
33
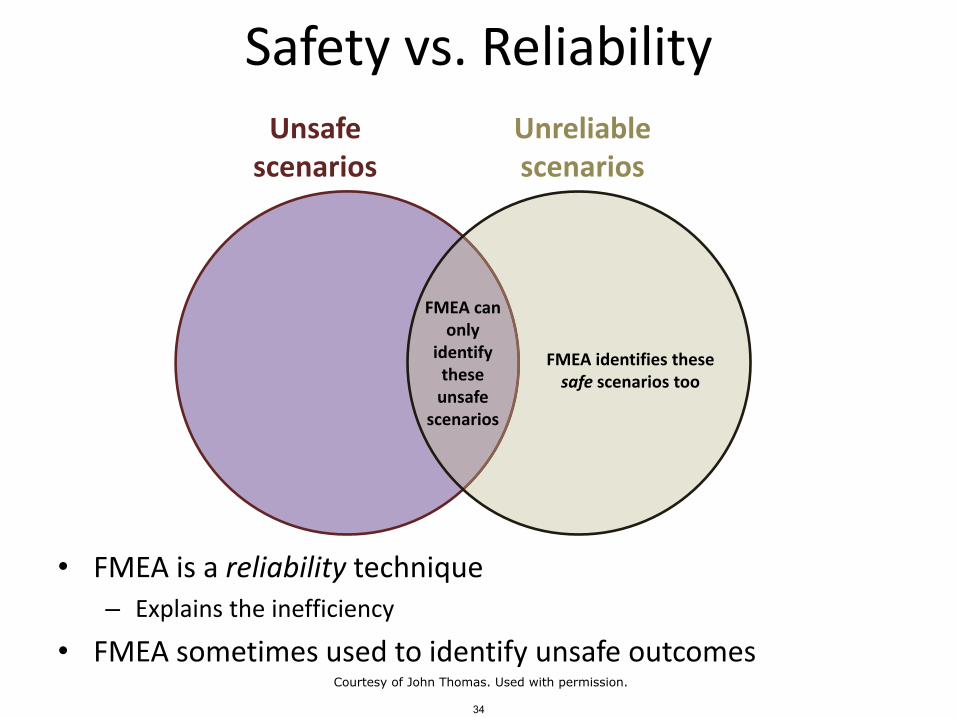
Safety vs. Reliability
• FMEA is a reliability technique– Explains the inefficiency
• FMEA sometimes used to identify unsafe outcomes
Unsafe Unreliable scenarios scenarios
FMEA can only
identify FMEA identifies these these safe scenarios too
unsafe scenarios
34
Courtesy of John Thomas. Used with permission.
Failure Modes, Mechanisms, Effects
• Examples and definitions of "Failure modes,mechanisms, effects"
35
FTAFault Tree Analysis
36
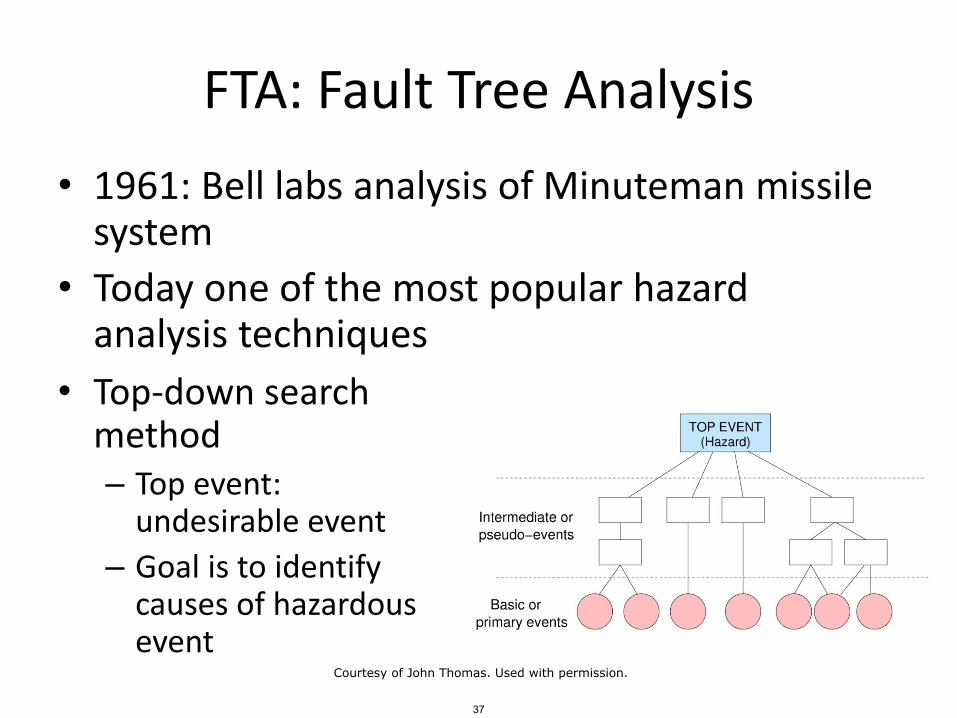
FTA: Fault Tree Analysis
• Top-down search method– Top event:
undesirable event
– Goal is to identify causes of hazardous event
• 1961: Bell labs analysis of Minuteman missile system
• Today one of the most popular hazard analysis techniques
37
Courtesy of John Thomas. Used with permission.
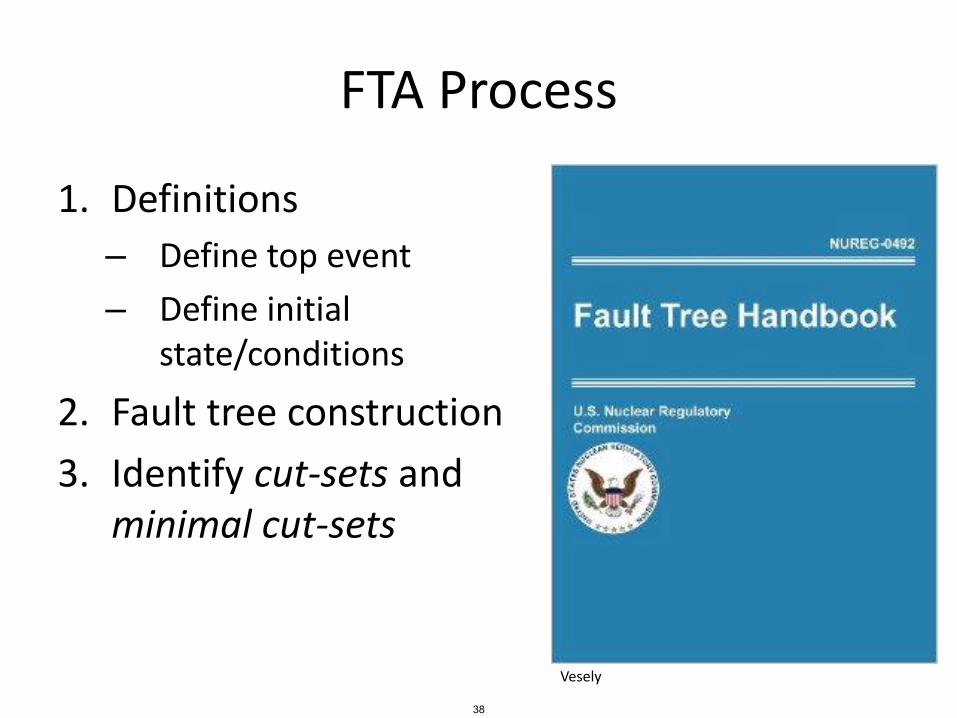
FTA Process
1. Definitions
– Define top event
– Define initial state/conditions
2. Fault tree construction
3. Identify cut-sets and minimal cut-sets
Vesely
38
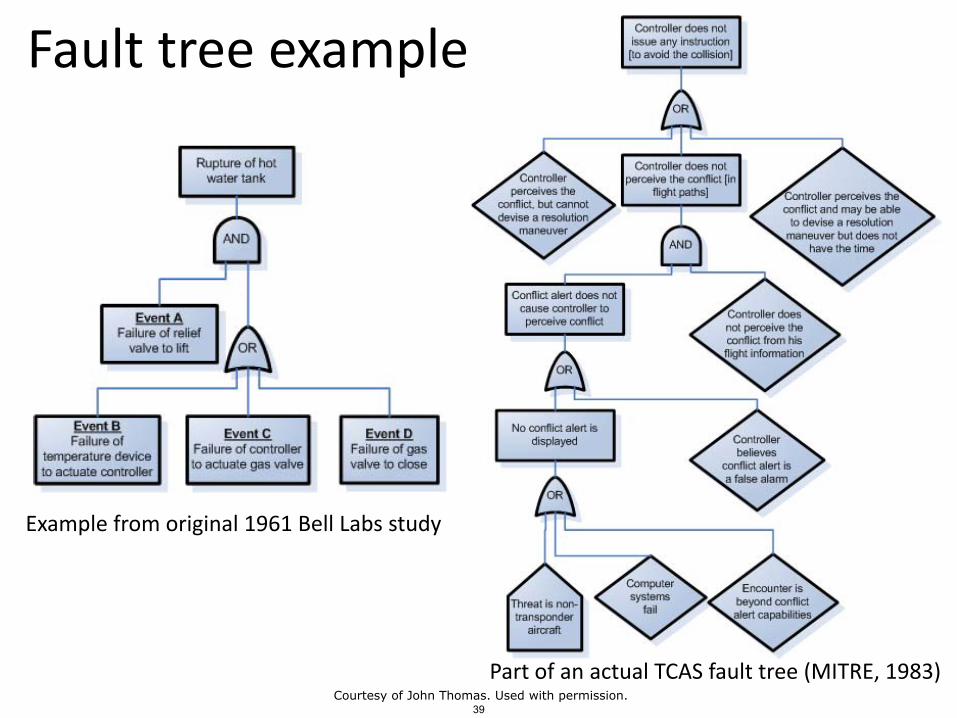
Fault tree examples
Example from original 1961 Bell Labs study
Part of an actual TCAS fault tree (MITRE, 1983)
39Courtesy of John Thomas. Used with permission.

Fault tree symbols
From NUREG-0492 (Vesely, 1981)40
This image is in the public domain.
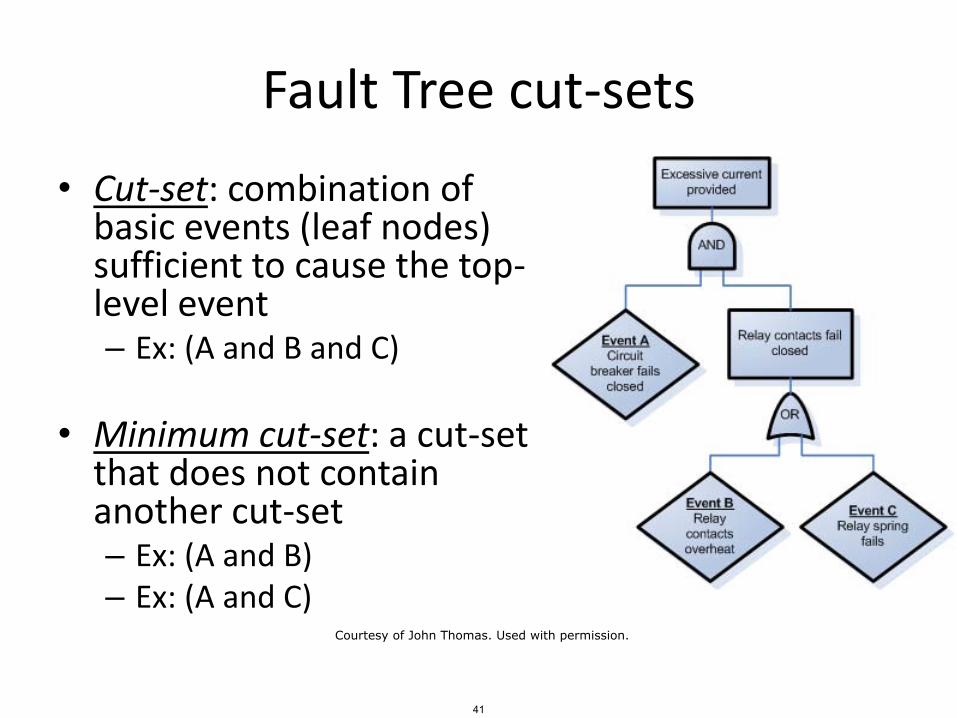
Fault Tree cut-sets
• Cut-set: combination of basic events (leaf nodes) sufficient to cause the top-level event– Ex: (A and B and C)
• Minimum cut-set: a cut-set that does not contain another cut-set– Ex: (A and B)– Ex: (A and C)
41
Courtesy of John Thomas. Used with permission.
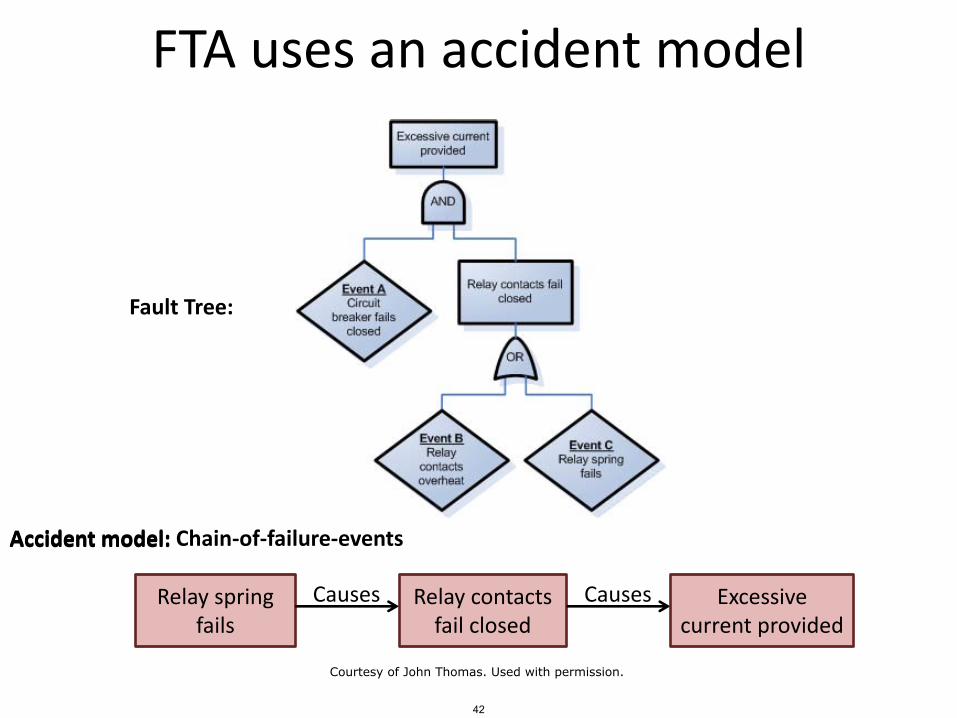
FTA uses an accident model
Relay spring fails
Causes Relay contacts fail closed
Causes Excessive current provided
Fault Tree:
Accident model:Accident model: Chain-of-failure-events
42
Courtesy of John Thomas. Used with permission.
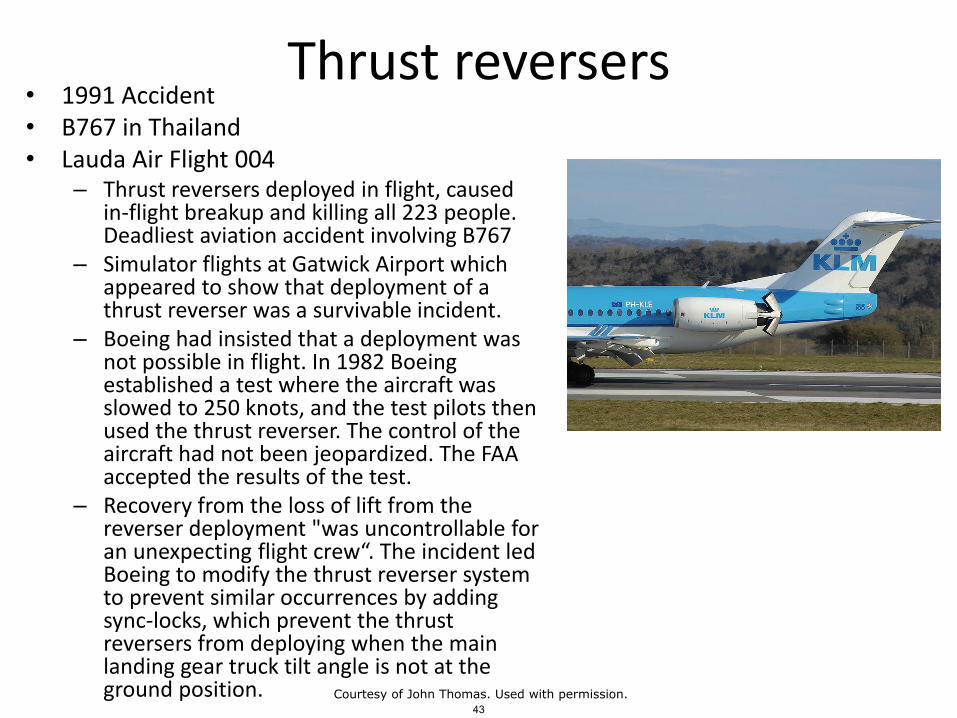
Thrust reversers• 1991 Accident• B767 in Thailand• Lauda Air Flight 004
– Thrust reversers deployed in flight, caused in-flight breakup and killing all 223 people. Deadliest aviation accident involving B767
– Simulator flights at Gatwick Airport which appeared to show that deployment of a thrust reverser was a survivable incident.
– Boeing had insisted that a deployment was not possible in flight. In 1982 Boeing established a test where the aircraft was slowed to 250 knots, and the test pilots then used the thrust reverser. The control of the aircraft had not been jeopardized. The FAA accepted the results of the test.
– Recovery from the loss of lift from the reverser deployment "was uncontrollable for an unexpecting flight crew“. The incident led Boeing to modify the thrust reverser system to prevent similar occurrences by adding sync-locks, which prevent the thrust reversers from deploying when the main landing gear truck tilt angle is not at the ground position.
43Courtesy of John Thomas. Used with permission.

FTA example
• Aircraft reverse thrust– Engines– Engine reverse thrust panels– Computer
• Open reverse thrust panels after touchdown
• Fault handling: use 2/3 voting. (Open reverse thrust panels if 2/3 wheel weight sensors AND 2/3 wheel speed sensors indicate landing)
– Wheel weight sensors (x3)– Wheel speed sensors (x3)
Create a fault tree for the top-level event:Reverse thrusters don’t operate on landing.
Image from: http://en.wikipedia.org/wiki/File:Klm_f100_ph-kle_arp.jpg 44
Courtesy of John Thomas. Used with permission.

Warsaw
• Warsaw• Crosswind landing (one
wheel first)• Wheels hydroplaned• Thrust reverser would not
deploy– Pilots could not override and
manually deploy
• Thrust reverser logic– Must be 6.3 tons on each
main landing gear strut– Wheel must be spinning at
least 72 knots
45
Courtesy of John Thomas. Used with permission.
FTA Strengths
• Captures combinations of failures
• More efficient than FMEA
– Analyzes only failures relevant to top-level event
• Provides graphical format to help in understanding the system and the analysis
• Analyst has to think about the system in great detail during tree construction
• Finding minimum cut sets provides insight into weak points of complex systems
46Courtesy of John Thomas. Used with permission.
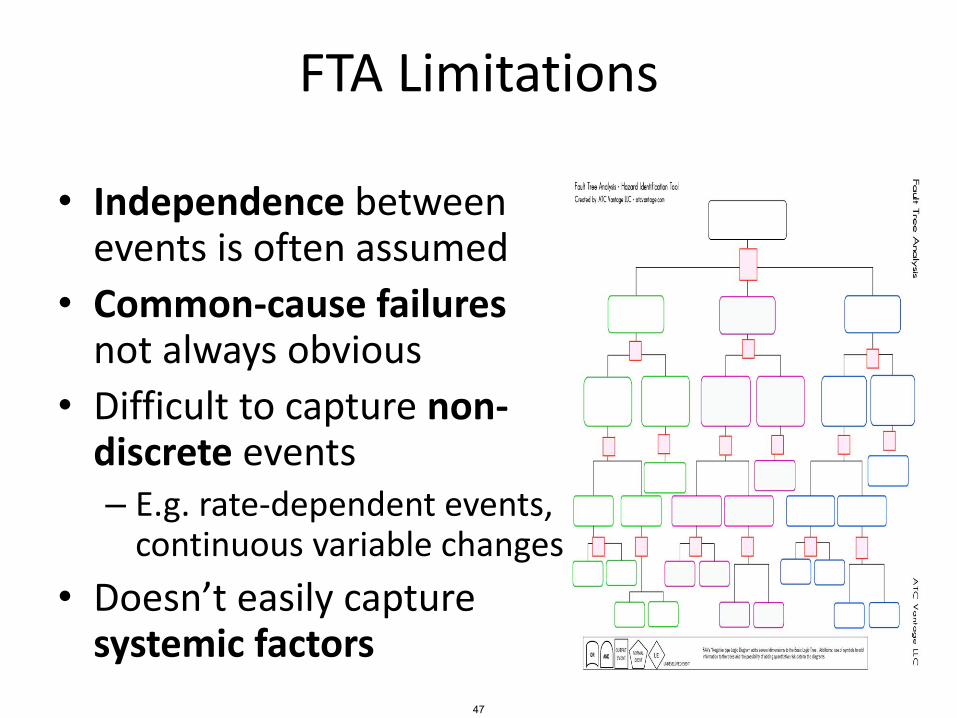
FTA Limitations
• Independence between events is often assumed
• Common-cause failures not always obvious
• Difficult to capture non-discrete events– E.g. rate-dependent events,
continuous variable changes
• Doesn’t easily capture systemic factors
47
FTA Limitations (cont)
• Difficult to capture delays and other temporal factors
• Transitions between states or operational phases not represented
• Can be labor intensive
– In some cases, over 2,500 pages of fault trees
• Can become very complex very quickly, can be difficult to review
48
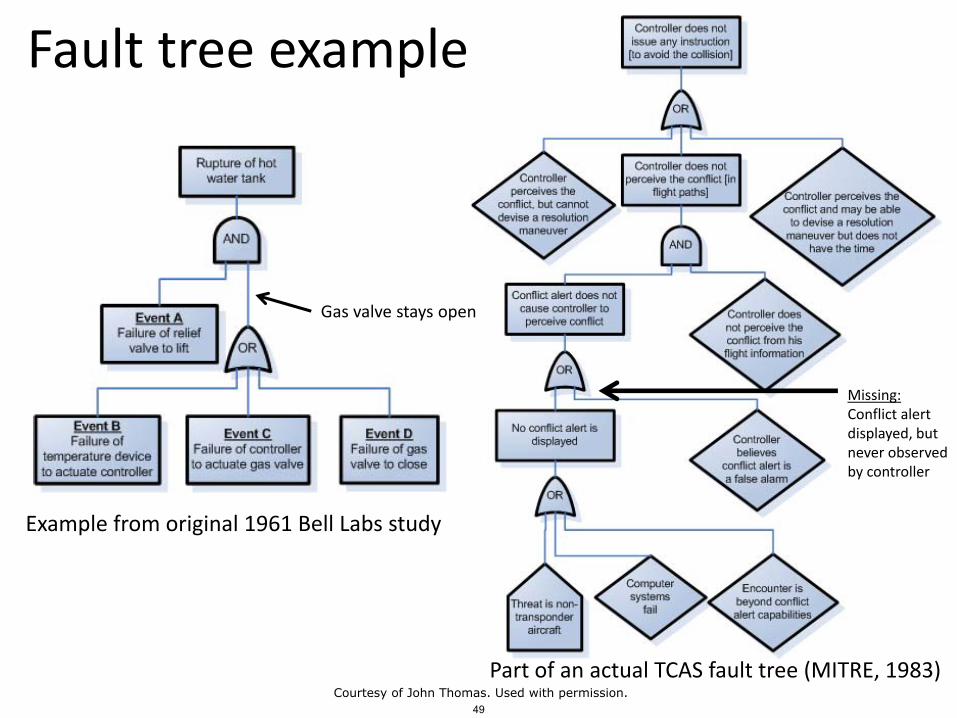
Fault tree examples
Example from original 1961 Bell Labs study
Part of an actual TCAS fault tree (MITRE, 1983)
Gas valve stays open
Missing:Conflict alert displayed, but never observed by controller
49Courtesy of John Thomas. Used with permission.
Vesely FTA Handbook
• Considered by many to be the textbook definition of fault trees
50
Failure-based methods
• Tend to treat safety as a component property
• Use divide-and-conquer strategies
• Reductionism
Reasonable?
51
52
© Associated Press. All rights reserved. This content is excluded from our CreativeCommons license. For more information, see https://ocw.mit.edu/help/faq-fair-use/.
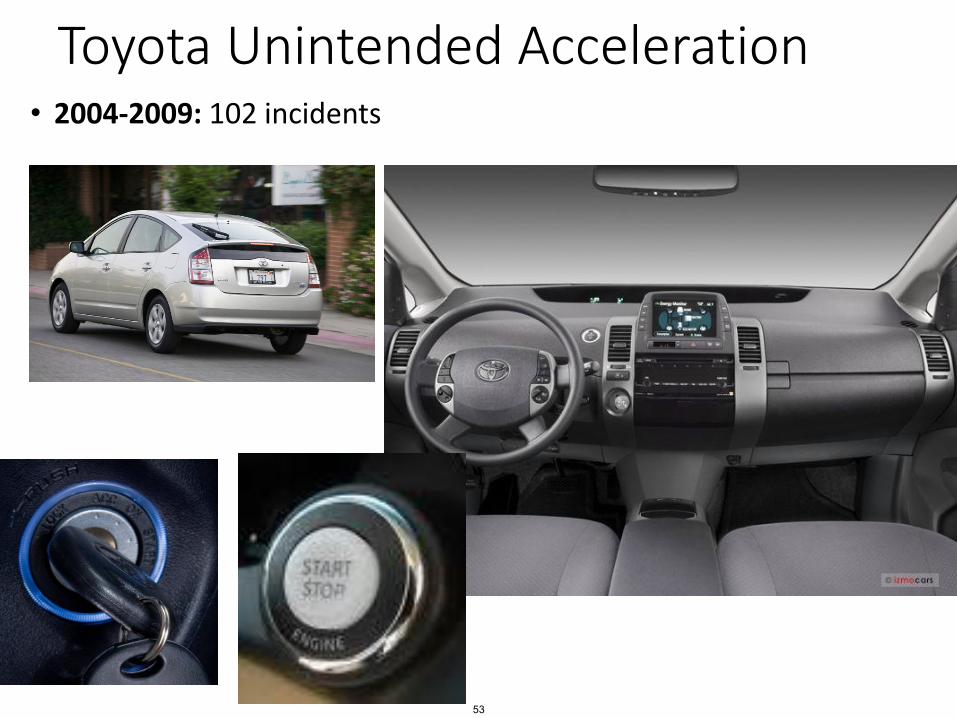
Toyota Unintended Acceleration• 2004-2009: 102 incidents
53

Toyota Unintended Acceleration
• 2004: Push-button ignition
• 2004-2009• 102 incidents of uncontrolled acceleration• Speeds exceed 100 mph despite stomping on
the brake • 30 crashes• 20 injuries
• Today• Software fixes for pushbutton ignition, pedals
http://www.reuters.com/article/2010/07/14/us-toyota-idUSTRE66D0FR20100714http://www.statesman.com/business/u-s-toyota-cite-driver-error-in-many-803504.html
Pushbutton was reliable!Software was reliable!
54
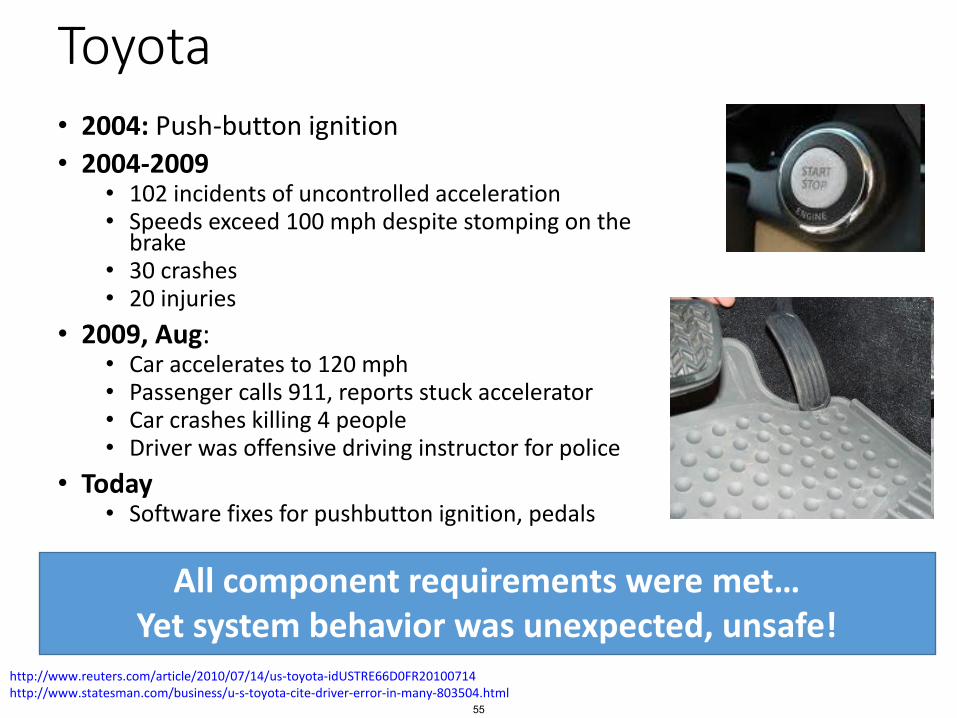
Toyota• 2004: Push-button ignition
• 2004-2009• 102 incidents of uncontrolled acceleration• Speeds exceed 100 mph despite stomping on the
brake • 30 crashes• 20 injuries
• 2009, Aug:• Car accelerates to 120 mph• Passenger calls 911, reports stuck accelerator• Car crashes killing 4 people• Driver was offensive driving instructor for police
• Today• Software fixes for pushbutton ignition, pedals
http://www.reuters.com/article/2010/07/14/us-toyota-idUSTRE66D0FR20100714http://www.statesman.com/business/u-s-toyota-cite-driver-error-in-many-803504.html
All component requirements were met…Yet system behavior was unexpected, unsafe!
55
Systems-Theoretic Approaches
• Focus of next class
• Need to identify and prevent failures, but also:• Go beyond the failures
• Why weren’t the failures detected and mitigated?• By operators
• By engineers
• Prevent issues that don’t involve failures
• Human-computer interaction issues
• Software-induced operator error
• Etc.
56
Courtesy of John Thomas. Used with permission.
Event Tree Analysis
57
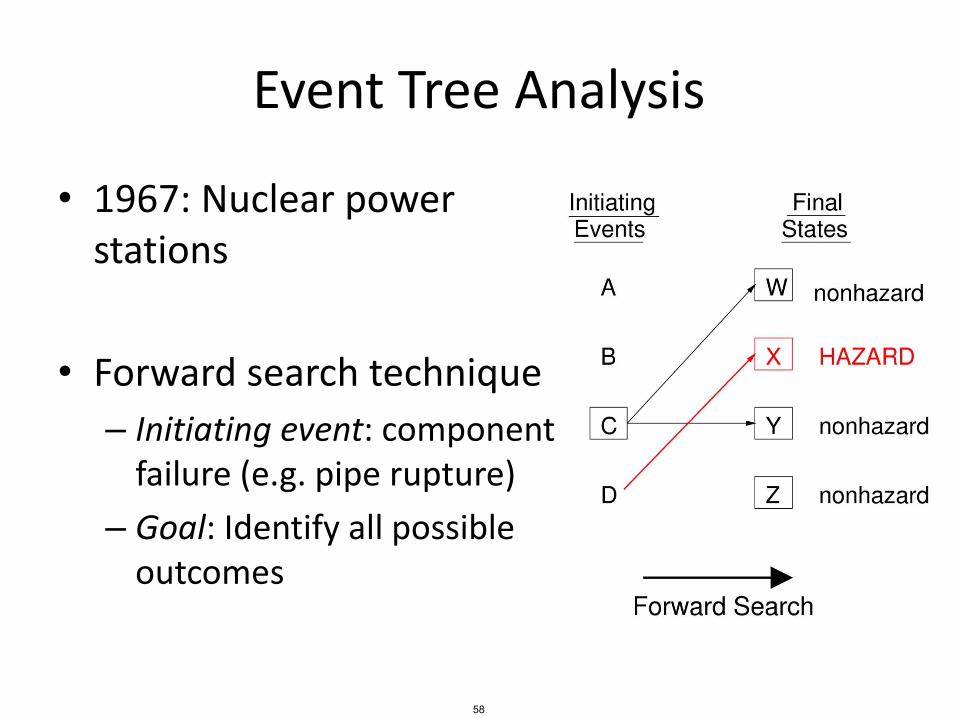
Event Tree Analysis
• 1967: Nuclear power stations
• Forward search technique
– Initiating event: component failure (e.g. pipe rupture)
– Goal: Identify all possible outcomes
58
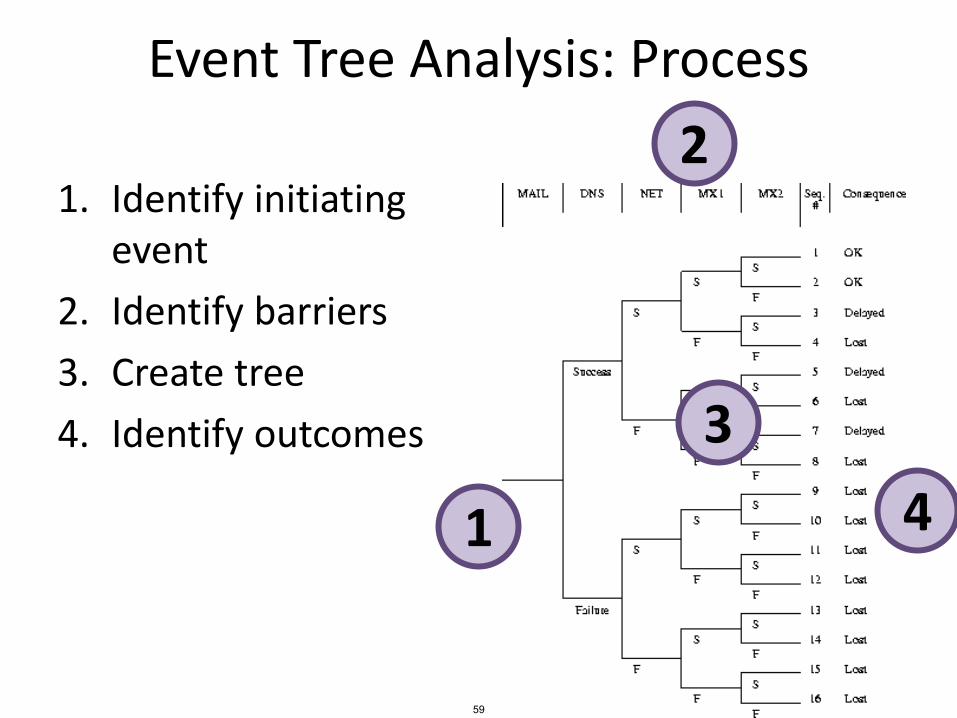
Event Tree Analysis: Process
1. Identify initiating event
2. Identify barriers
3. Create tree
4. Identify outcomes
1
2
3
4
59

Event Tree Example
Small release
No accident
No release
Moderate release
No release
Majorrelease
60
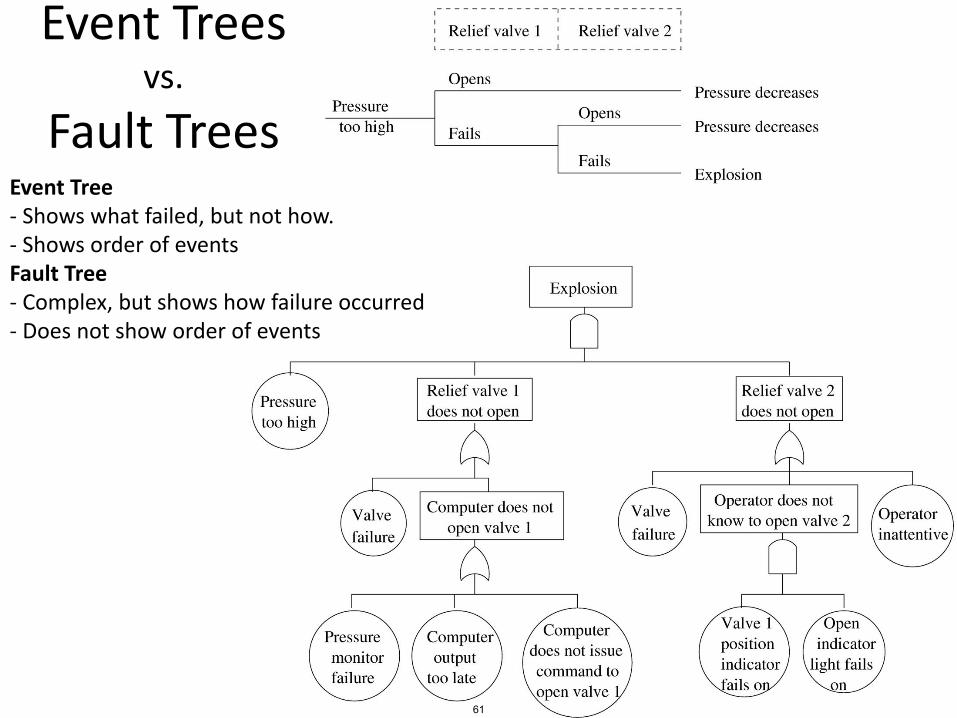
Event Treesvs.
Fault TreesEvent Tree- Shows what failed, but not how. - Shows order of eventsFault Tree- Complex, but shows how failure occurred - Does not show order of events
61
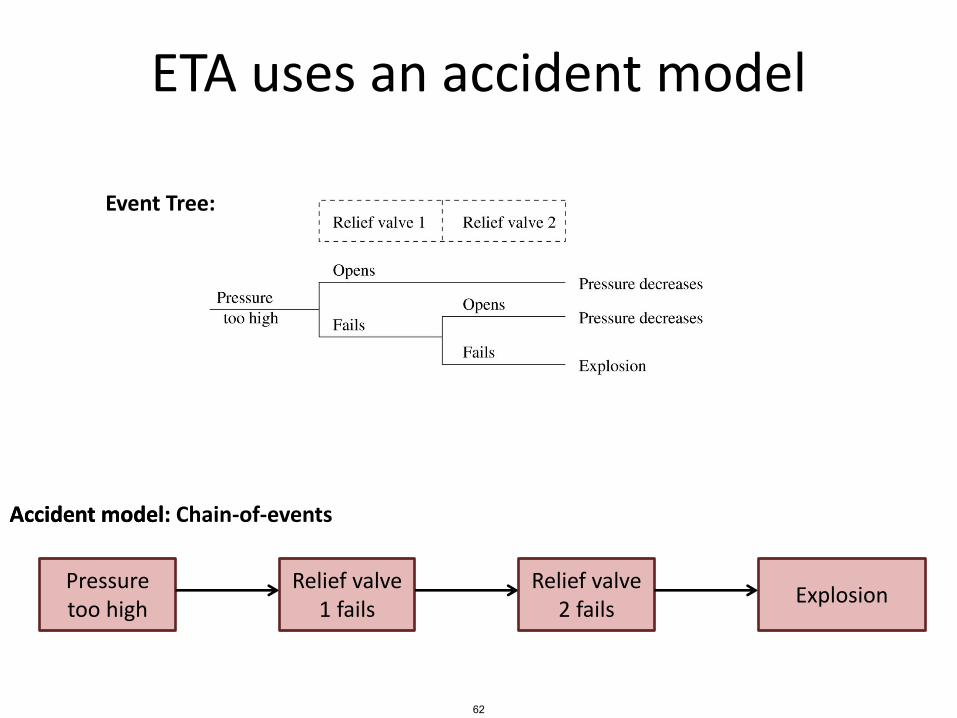
ETA uses an accident model
Pressure too high
Relief valve 1 fails
Relief valve 2 fails
Explosion
Event Tree:
Accident model:Accident model: Chain-of-events
62
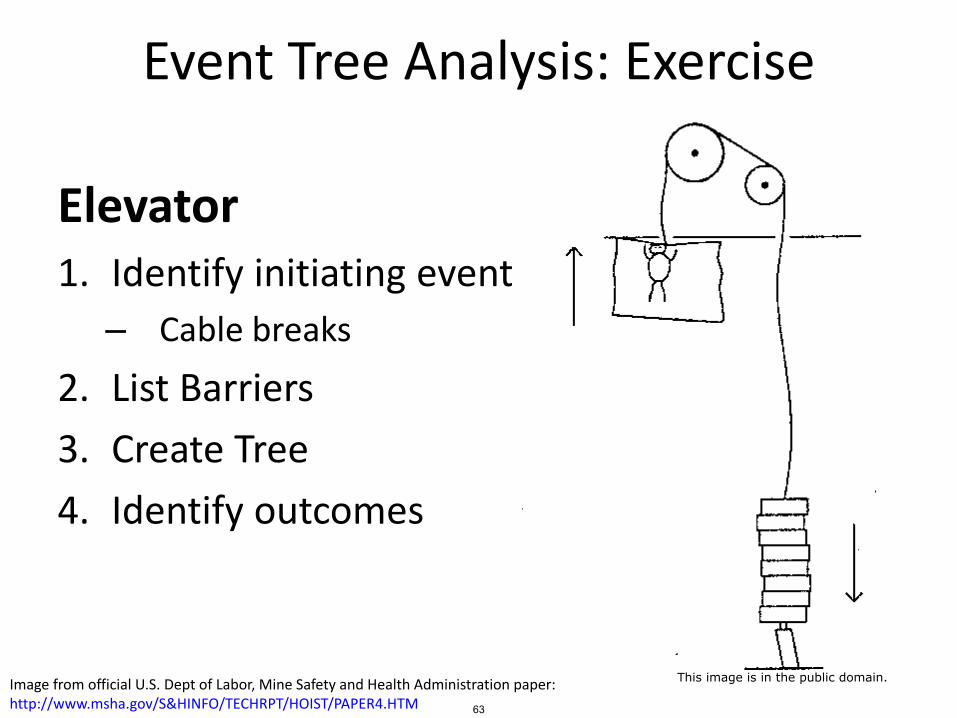
Event Tree Analysis: Exercise
Elevator1. Identify initiating event
– Cable breaks
2. List Barriers
3. Create Tree
4. Identify outcomes
Image from official U.S. Dept of Labor, Mine Safety and Health Administration paper:http://www.msha.gov/S&HINFO/TECHRPT/HOIST/PAPER4.HTM 63
This image is in the public domain.

Event Tree Analysis: Exercise
What are the barriers?
64
© HowStuffWorks. All rights reserved. This content is excluded from our CreativeCommons license. For more information, see https://ocw.mit.edu/help/faq-fair-use/.

Event Tree Analysis: Strengths
• Handles ordering of events better than fault trees
• Most practical when events can be ordered in time (chronology of events is stable)
• Most practical when events are independent of each other.
• Designed for use with protection systems(barriers)
65
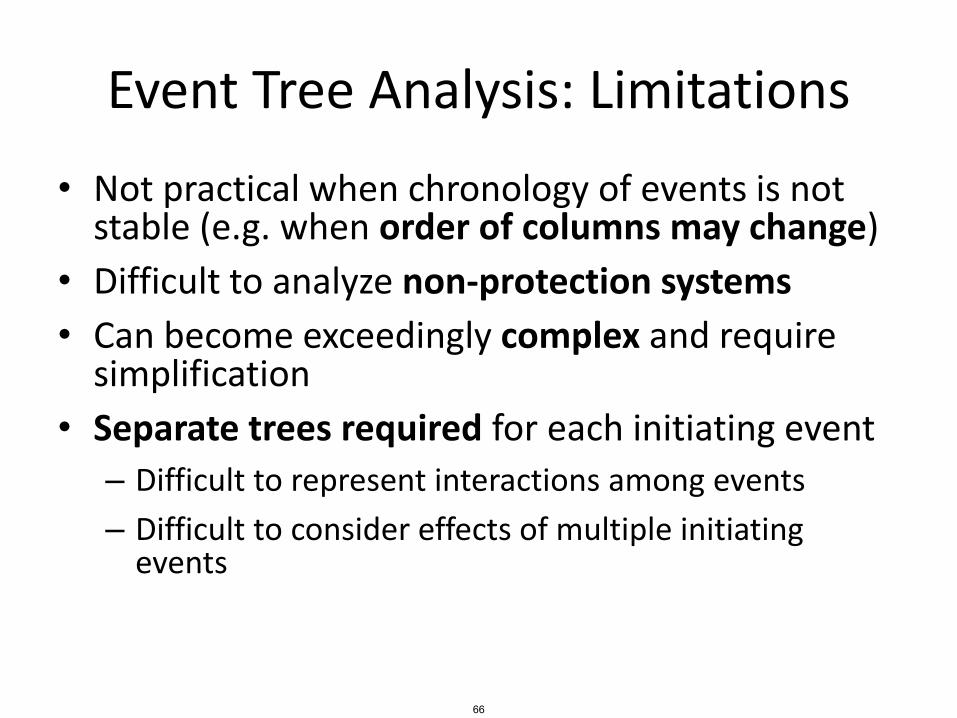
Event Tree Analysis: Limitations
• Not practical when chronology of events is not stable (e.g. when order of columns may change)
• Difficult to analyze non-protection systems
• Can become exceedingly complex and require simplification
• Separate trees required for each initiating event
– Difficult to represent interactions among events
– Difficult to consider effects of multiple initiating events
66
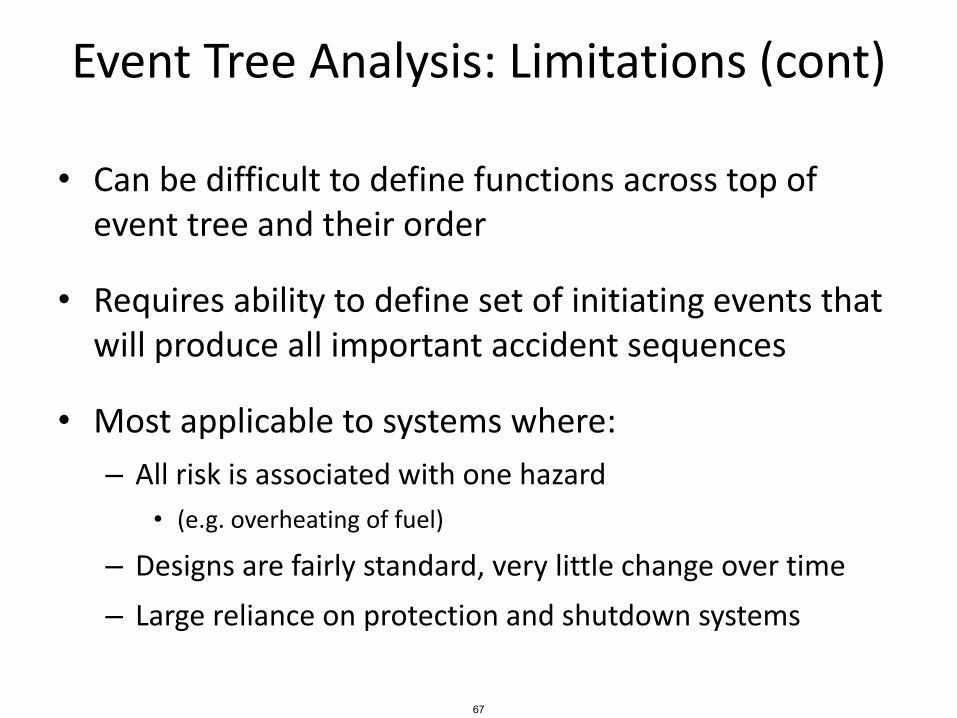
Event Tree Analysis: Limitations (cont)
• Can be difficult to define functions across top of event tree and their order
• Requires ability to define set of initiating events that will produce all important accident sequences
• Most applicable to systems where:
– All risk is associated with one hazard
• (e.g. overheating of fuel)
– Designs are fairly standard, very little change over time
– Large reliance on protection and shutdown systems
67

HAZOPHazard and Operability Analysis
68
HAZOP: Hazards and Operability Analysis
• Developed by Imperial Chemical Industries in early 1960s
• Not only for safety, but efficient operations
Accident model:• Chain of failure events (that
involve deviations from design/operating intentions)
69
An image of a chemical plant is removeddue to copyright restrictions.
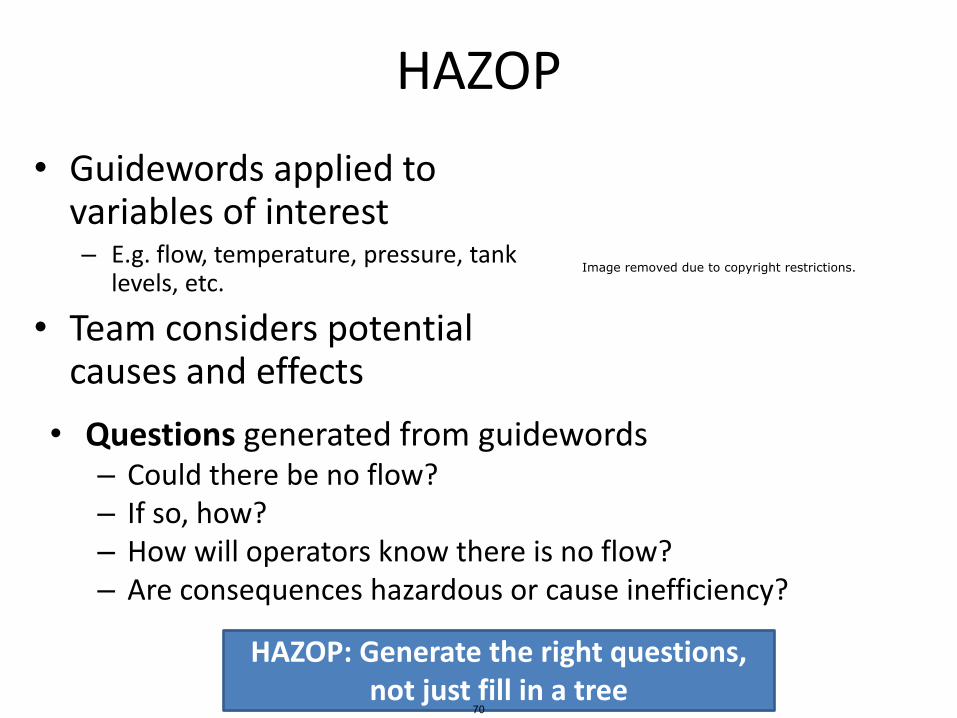
HAZOP
• Guidewords applied to variables of interest– E.g. flow, temperature, pressure, tank
levels, etc.
• Team considers potential causes and effects
• Questions generated from guidewords– Could there be no flow?– If so, how?– How will operators know there is no flow?– Are consequences hazardous or cause inefficiency?
HAZOP: Generate the right questions,not just fill in a tree
70
Image removed due to copyright restrictions.
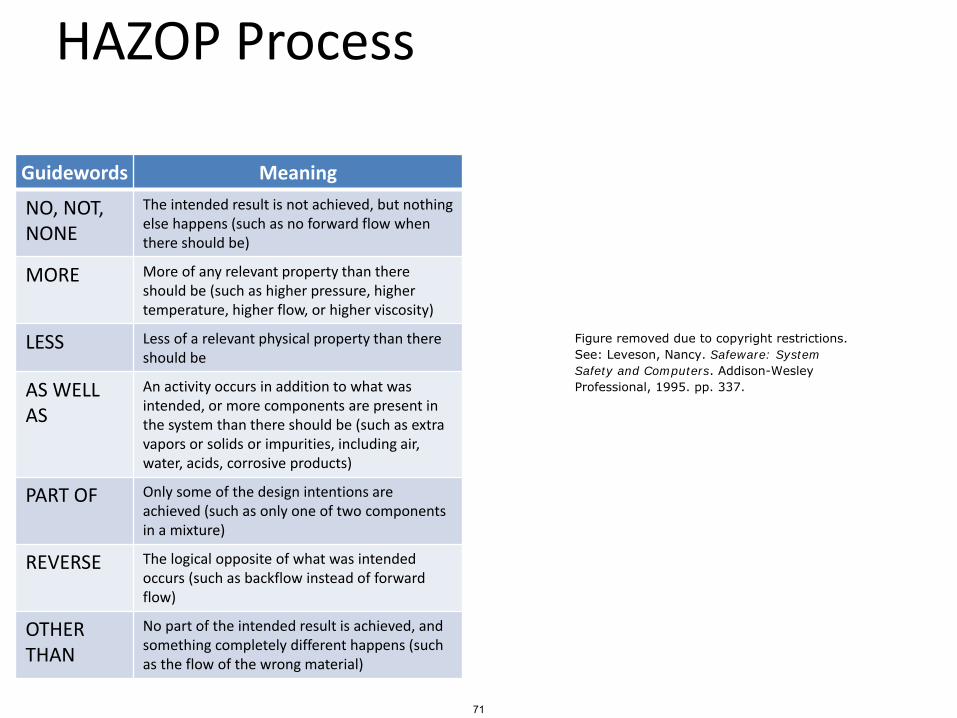
HAZOP Process
Guidewords Meaning
NO, NOT, NONE
The intended result is not achieved, but nothing else happens (such as no forward flow when there should be)
MORE More of any relevant property than there should be (such as higher pressure, higher temperature, higher flow, or higher viscosity)
LESS Less of a relevant physical property than there should be
AS WELL AS
An activity occurs in addition to what was intended, or more components are present in the system than there should be (such as extra vapors or solids or impurities, including air, water, acids, corrosive products)
PART OF Only some of the design intentions are achieved (such as only one of two components in a mixture)
REVERSE The logical opposite of what was intended occurs (such as backflow instead of forward flow)
OTHER THAN
No part of the intended result is achieved, and something completely different happens (such as the flow of the wrong material)
71
Figure removed due to copyright restrictions.See: Leveson, Nancy. Safeware: SystemSafety and Computers. Addison-WesleyProfessional, 1995. pp. 337.

HAZOP Strengths
• Easy to apply– A simple method that can uncover complex
accidents
• Applicable to new designs and new design features
• Performed by diverse study team, facilitator– Method defines team composition, roles
– Encourages cross-fertilization of different disciplines
72
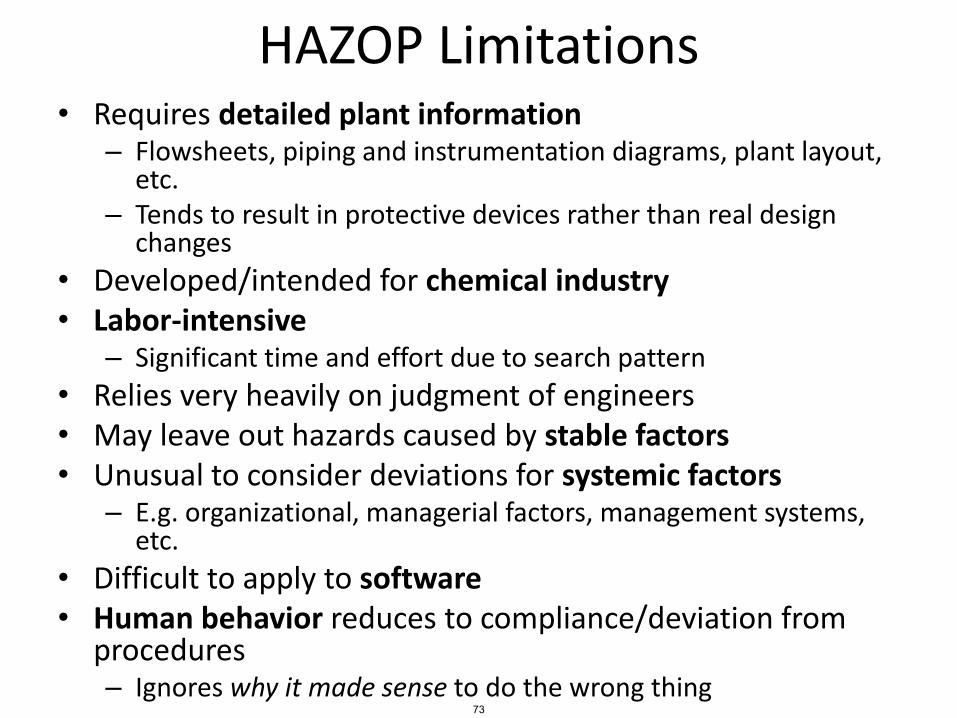
HAZOP Limitations• Requires detailed plant information
– Flowsheets, piping and instrumentation diagrams, plant layout, etc.
– Tends to result in protective devices rather than real design changes
• Developed/intended for chemical industry• Labor-intensive
– Significant time and effort due to search pattern
• Relies very heavily on judgment of engineers• May leave out hazards caused by stable factors• Unusual to consider deviations for systemic factors
– E.g. organizational, managerial factors, management systems, etc.
• Difficult to apply to software• Human behavior reduces to compliance/deviation from
procedures– Ignores why it made sense to do the wrong thing
73

Summary• Well-established methods• Time-tested, work well for the problems they were
designed to solve• Strengths include
– Ease of use– Graphical representation– Ability to analyze many failures and failure combinations– Application to well-understood mechanical or physical systems
• Limitations include– Inability to consider accidents without failures– Difficulty incorporating systemic factors like managerial
pressures, complex human behavior, and design/requirements flaws
• Other methods may be better suited to deal with the challenges introduced with complex systems
74
Quantitative Hazard Analysis
75
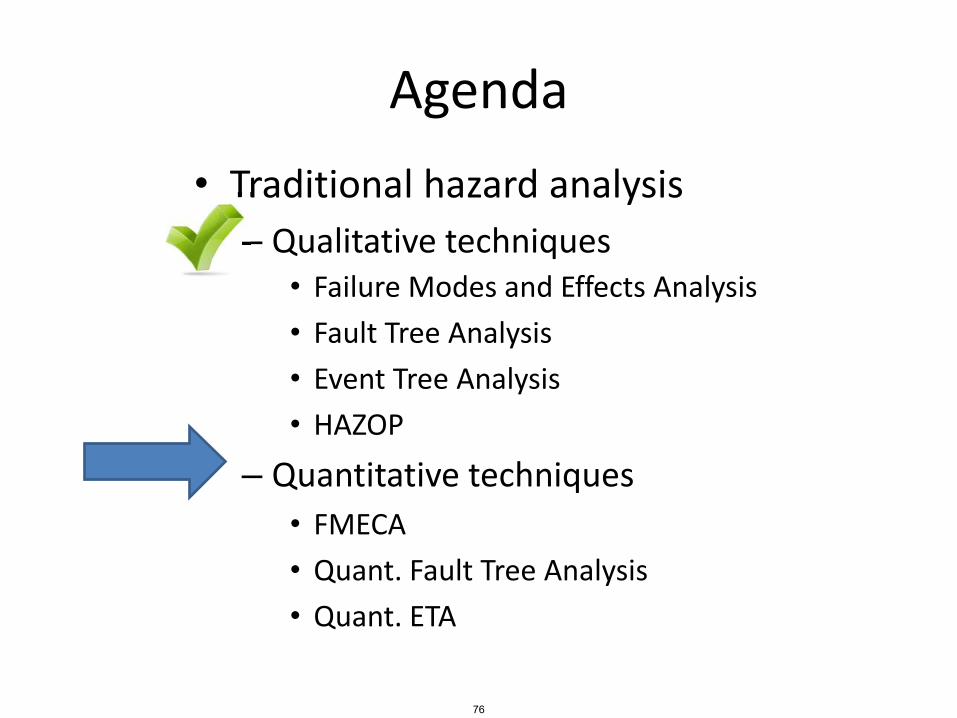
Agenda
• Traditional hazard analysis
– Qualitative techniques• Failure Modes and Effects Analysis
• Fault Tree Analysis
• Event Tree Analysis
• HAZOP
– Quantitative techniques
• FMECA
• Quant. Fault Tree Analysis
• Quant. ETA
Traditional hazard analysis
–
76
Quantitative analysis
• How do you include numbers and math?
– What do you quantify?
• Tends to focus on two parameters
– Severity
– Probability
77
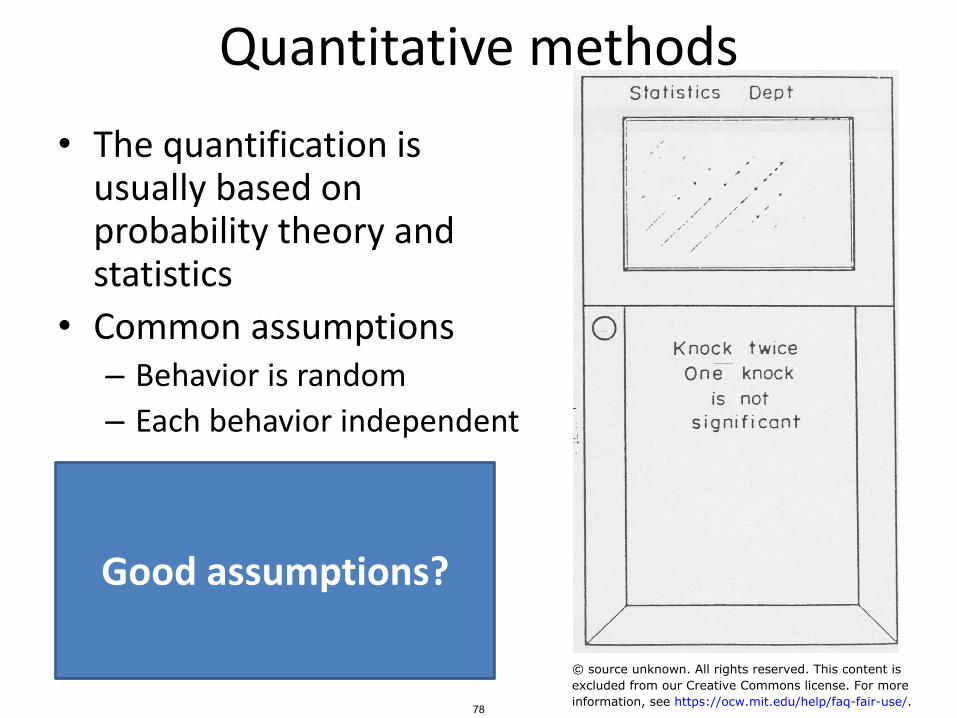
Quantitative methods
• The quantification is usually based on probability theory and statistics
• Common assumptions– Behavior is random
– Each behavior independent
Good assumptions?
78
© source unknown. All rights reserved. This content isexcluded from our Creative Commons license. For moreinformation, see https://ocw.mit.edu/help/faq-fair-use/.
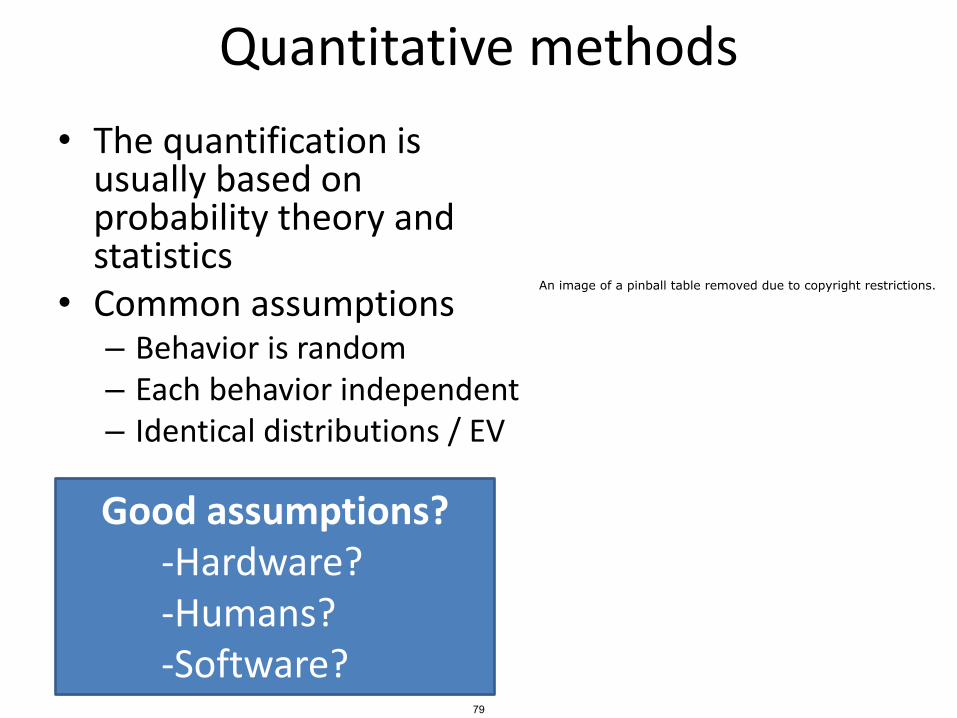
Quantitative methods
Good assumptions?-Hardware?-Humans?-Software?
• The quantification is usually based on probability theory and statistics
• Common assumptions– Behavior is random– Each behavior independent– Identical distributions / EV
79
An image of a pinball table removed due to copyright restrictions.
Risk
• Common idea:
– Some combination of severity and likelihood
• How would you combine severity and likelihood mathematically?
– Risk = f(Severity, Likelihood)
– What is f ?
80
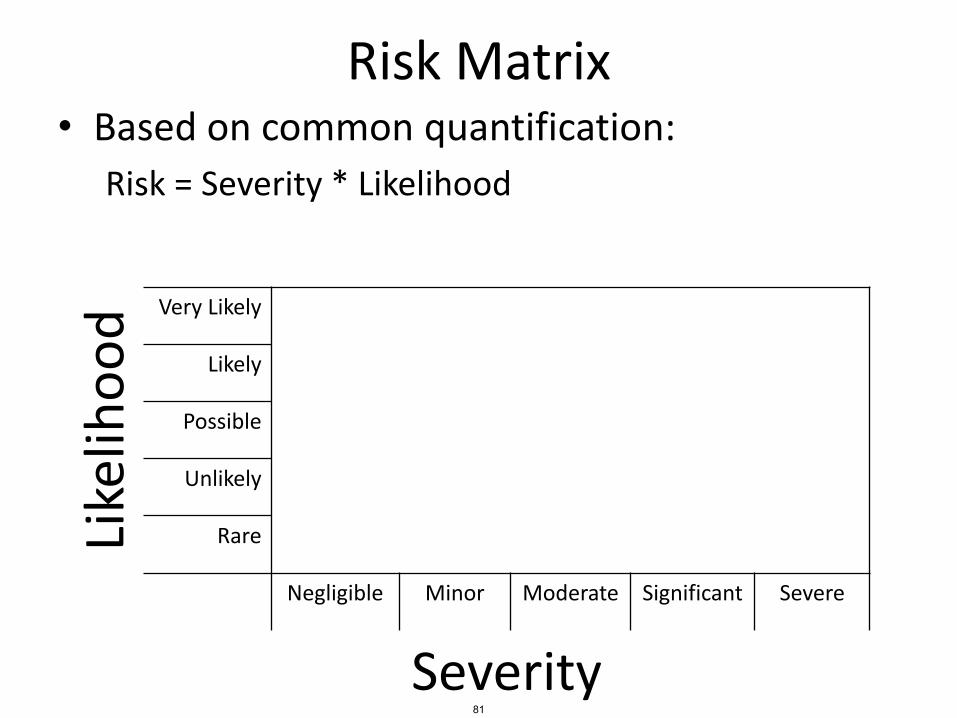
Risk Matrix• Based on common quantification:
Risk = Severity * Likelihood
Like
liho
od Very Likely
Likely
Possible
Unlikely
Rare
Negligible Minor Moderate Significant Severe
Severity81
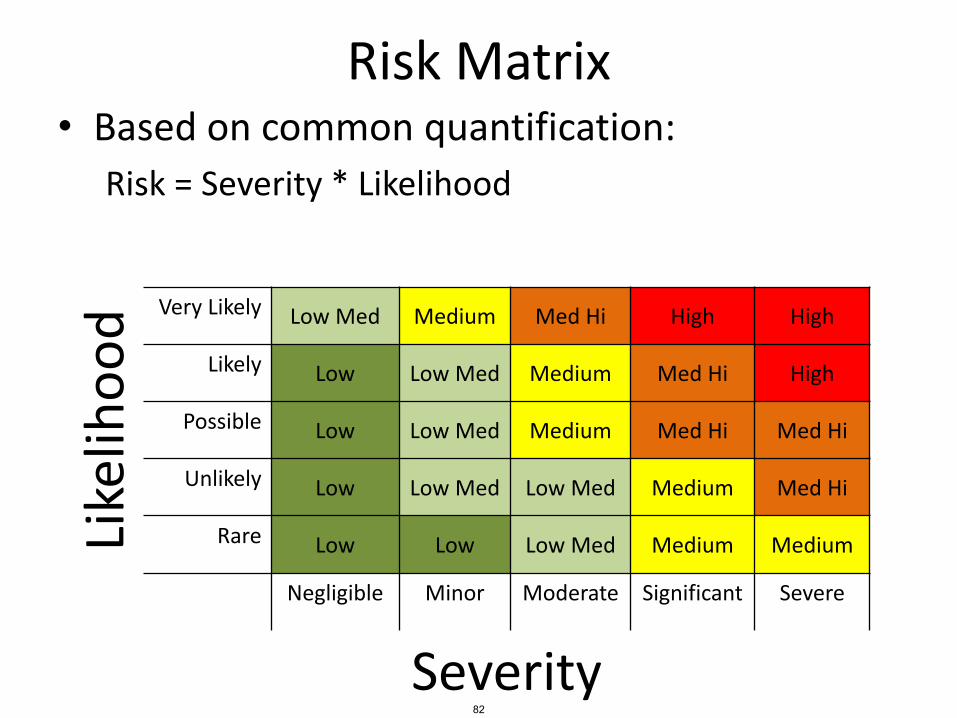
Risk Matrix• Based on common quantification:
Risk = Severity * Likelihood
Like
liho
od Very Likely Low Med Medium Med Hi High High
Likely Low Low Med Medium Med Hi High
Possible Low Low Med Medium Med Hi Med Hi
Unlikely Low Low Med Low Med Medium Med Hi
Rare Low Low Low Med Medium Medium
Negligible Minor Moderate Significant Severe
Severity82

Automotive Severity Levels
• Level 0: No injuries
• Level 1: Light to moderate injuries
• Level 2: Severe to life-threatening injuries (survival probable)
• Level 3: Life-threatening to fatal injuries (survival uncertain)
From ISO26262 83

Aviation Severity Levels• Level 1: Catastrophic
– Failure may cause crash.– Failure conditions prevent continued safe flight and landing
• Level 2: Severe– Failure has negative impact on safety, may cause serious or fatal
injuries– Large reduction in functional capabilities
• Level 3: Major– Failure is significant, but less impact than severe– Significant reduction in functional capabilities
• Level 4: Minor– Failure is noticeable, but less impact than Major– Slight reduction in safety margins; more workload or inconvenience
• Level 5: No effect on safety
From ARP4671, DO-178B 84
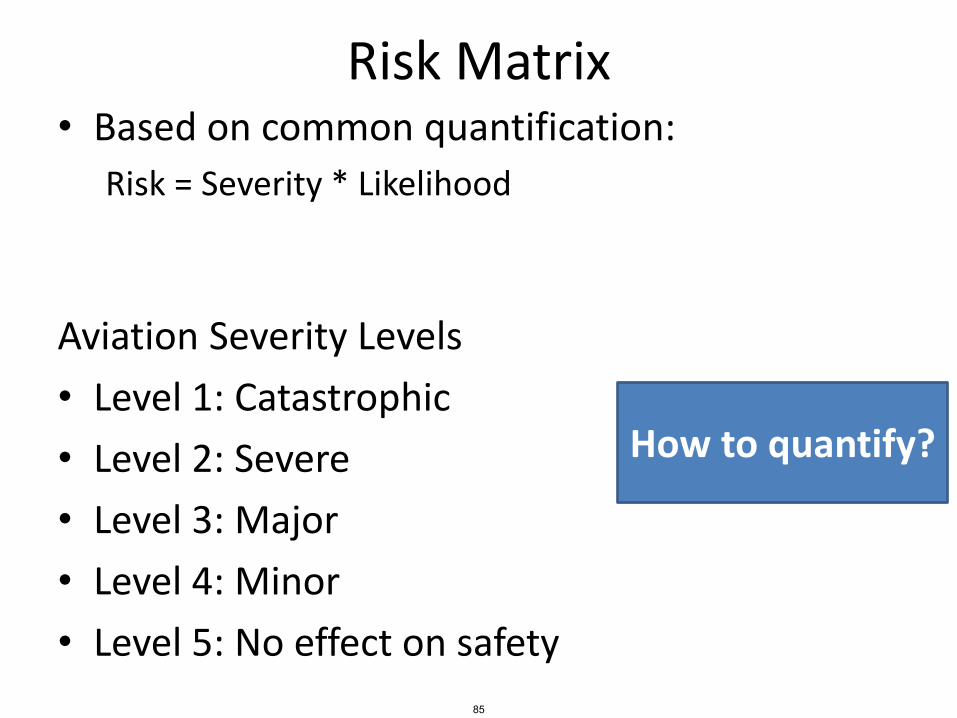
Risk Matrix• Based on common quantification:
Risk = Severity * Likelihood
Aviation Severity Levels
• Level 1: Catastrophic
• Level 2: Severe
• Level 3: Major
• Level 4: Minor
• Level 5: No effect on safety
How to quantify?
85
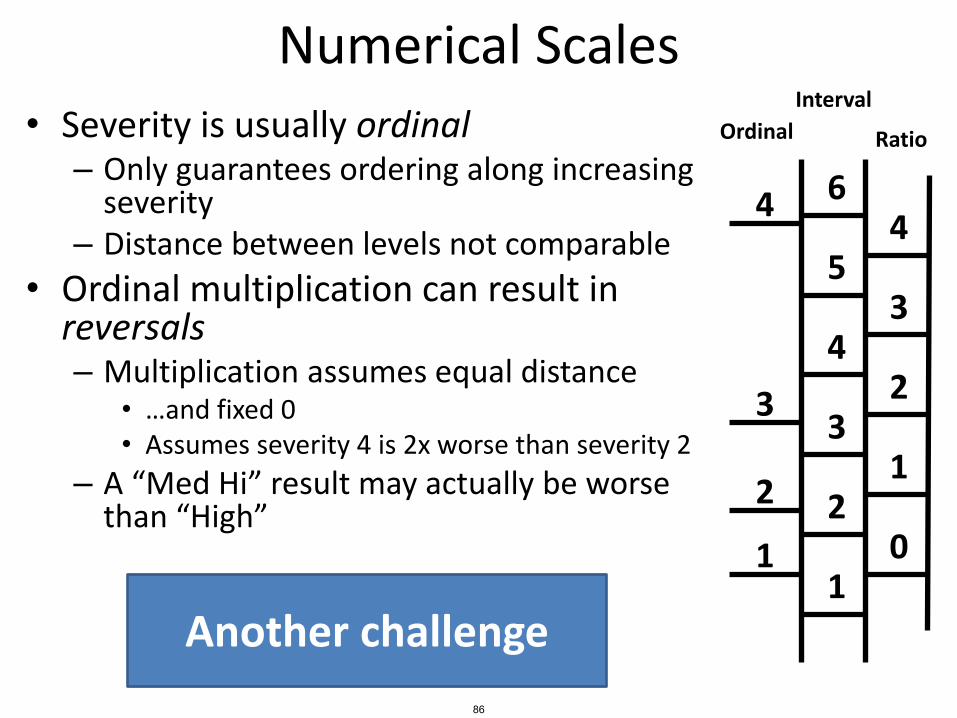
Numerical Scales
• Severity is usually ordinal– Only guarantees ordering along increasing
severity– Distance between levels not comparable
• Ordinal multiplication can result in reversals– Multiplication assumes equal distance
• …and fixed 0• Assumes severity 4 is 2x worse than severity 2
– A “Med Hi” result may actually be worse than “High”
Another challenge
1
2
3
4
Ordinal
1
2
3
4
5
6
Interval
0
1
2
3
4
Ratio
86

Reversal Example
• Event A
– Likelihood = 20%
• Event B
– Likelihood = 10%
• Event C
– Likelihood = 3%
Calculate risk
Ordinal
4
3
2
1
Ratio
4
3
2
1
0
5
6
7
85
A
B
C
87
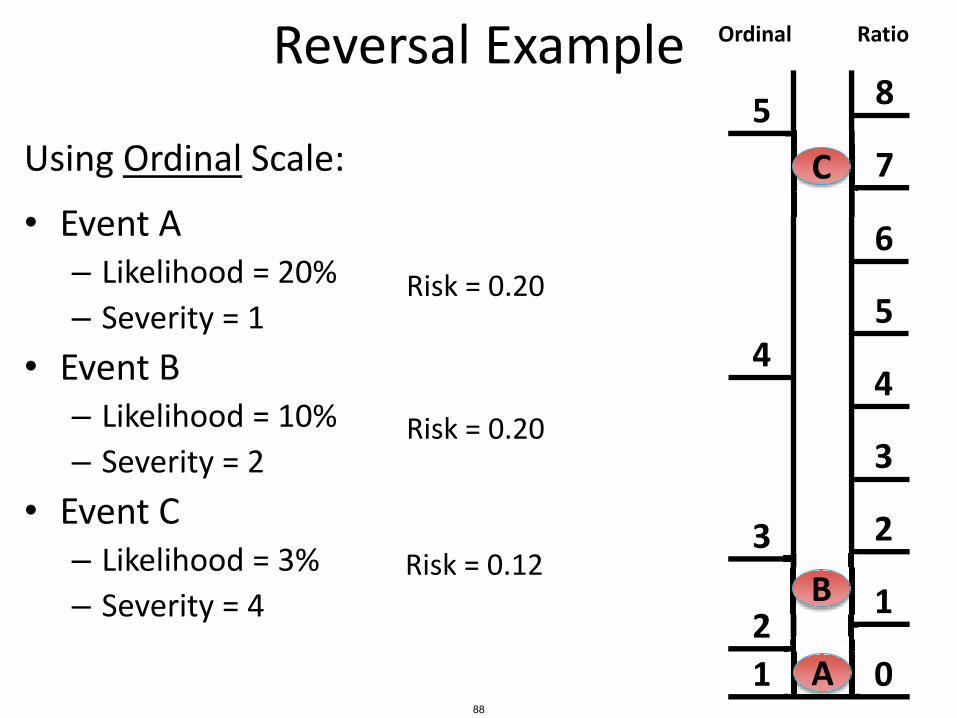
Reversal Example
Using Ordinal Scale:
• Event A– Likelihood = 20%
– Severity = 1
• Event B– Likelihood = 10%
– Severity = 2
• Event C– Likelihood = 3%
– Severity = 4
Ordinal
4
3
2
1
Ratio
4
3
2
1
0
5
6
7
85
C
Risk = 0.20
Risk = 0.20
Risk = 0.12 B
A88

Reversal Example
Using Ratio Scale:
• Event A– Likelihood = 20%
– Severity = 0
• Event B– Likelihood = 10%
– Severity = 1
• Event C– Likelihood = 3%
– Severity = 7
Ordinal
4
3
2
1
Ratio
4
3
2
1
0
5
6
7
85
C
Risk = 0.00
B
Risk = 0.10
Risk = 0.21
A89

Reversal Example Ordinal
4
3
2
1
Ratio
4
3
2
1
0
5
6
7
85
C
B
A
Risk (usingordinal scale)
Risk (usingratio scale)
Event A 0.20 0.00
Event B 0.20 0.10
Event C 0.12 0.21
90

Risk Matrix• Based on common idea:
Risk = Severity * Likelihood
Like
liho
od Very Likely Low Med Medium Med Hi High High
Likely Low Low Med Medium Med Hi High
Possible Low Low Med Medium Med Hi Med Hi
Unlikely Low Low Med Low Med Medium Med Hi
Rare Low Low Low Med Medium Medium
Negligible Minor Moderate Significant Severe
Severity
Uses expected values (averages)
91
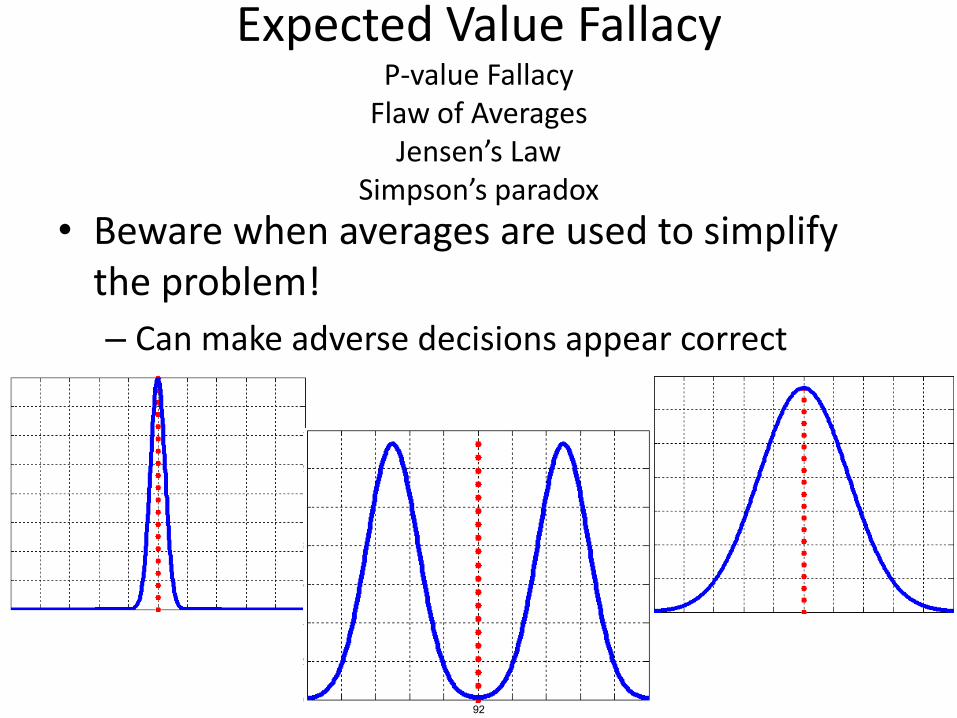
Expected Value FallacyP-value Fallacy
Flaw of AveragesJensen’s Law
Simpson’s paradox
• Beware when averages are used to simplify the problem!
– Can make adverse decisions appear correct
92

Another Example Hazard Level Matrix
93
© Addison-Wesley Professional. All rights reserved. This content is excluded from our CreativeCommons license. For more information, see https://ocw.mit.edu/help/faq-fair-use/.

Hazard Level: A combination of severity (worst potential damage in case of an accident) and likelihood of occurrence of the hazard.
Risk: The hazard level combined with the likelihood of the hazard leading to an accident plus exposure (or duration) of the hazard.
Safeware p179. © Copyright Nancy Leveson
RISK
HAZARD LEVEL
Hazardseverity
Likelihood ofhazard occurring
HazardExposure
Likelihood of hazardLeading to an accident
Safety: Freedom from accidents or losses.
94
© Addison-Wesley Professional. All rights reserved. This content is excluded from our CreativeCommons license. For more information, see https://ocw.mit.edu/help/faq-fair-use/.

Hazard Level Assessment
• Combination of Severity and Likelihood• Difficult for complex, human/computer controlled
systems• Challenging to determine likelihood for these
systems– Software behaves exactly the same way every time
• Not random
– Humans adapt, and can change behavior over time• Adaptation is not random• Different humans behave differently• Not I.I.D (independent and identically distributed)
– Modern systems almost always involve new designs and new technology
• Historical data may be irrelevant
• Severity is usually adequate to determine effort to spend on eliminating or mitigating hazard.
High
Med Hi
Medium
Low Med
Low
Hazard Level orRisk Level:
95

FMECAFailure Modes Effects and Criticality Analysis
96
FMECA
• Same as FMEA, but with “criticality” information
• Criticality
– Can be ordinal severity values
– Can be likelihood probabilities
– An expression of concern over the effects of failure in the system*
*Vincoli, 2006, Basic Guide to System Safety 97
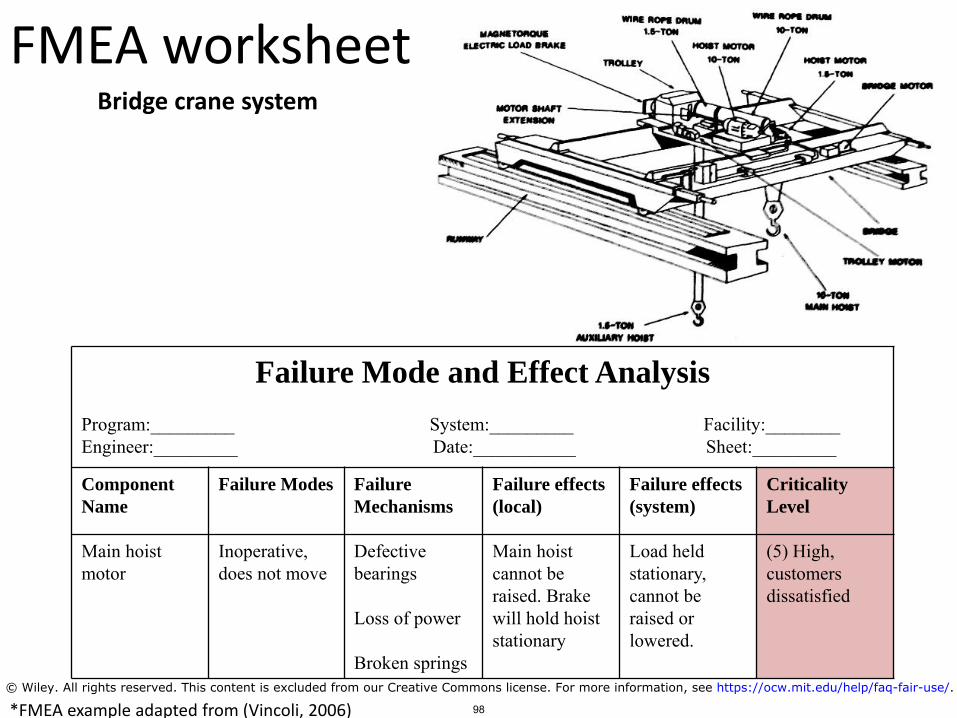
Failure Mode and Effect Analysis
Program:_________ System:_________ Facility:________Engineer:_________ Date:___________ Sheet:_________
Component
Name
Failure Modes Failure
Mechanisms
Failure effects
(local)
Failure effects
(system)
Criticality
Level
Main hoist motor
Inoperative, does not move
Defective bearings
Loss of power
Broken springs
Main hoist cannot be raised. Brake will hold hoiststationary
Load held stationary, cannot be raised or lowered.
(5) High, customers dissatisfied
FMEA worksheet
*FMEA example adapted from (Vincoli, 2006)
Bridge crane system
98
© Wiley. All rights reserved. This content is excluded from our Creative Commons license. For more information, see https://ocw.mit.edu/help/faq-fair-use/.
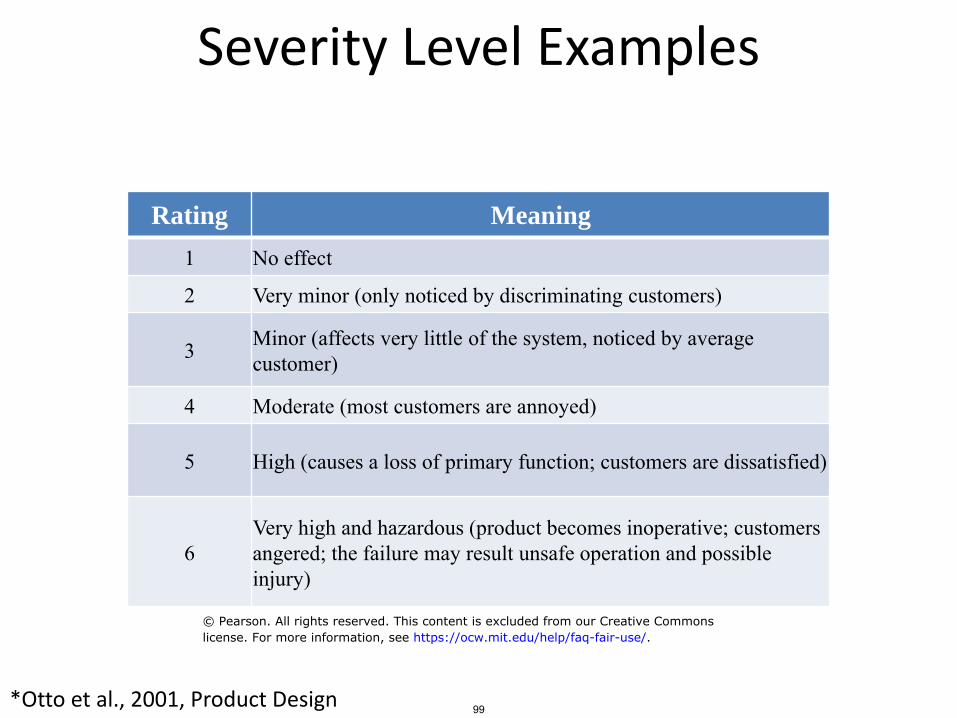
Severity Level Examples
Rating Meaning
1 No effect
2 Very minor (only noticed by discriminating customers)
3 Minor (affects very little of the system, noticed by average customer)
4 Moderate (most customers are annoyed)
5 High (causes a loss of primary function; customers are dissatisfied)
6Very high and hazardous (product becomes inoperative; customers angered; the failure may result unsafe operation and possible injury)
*Otto et al., 2001, Product Design 99
© Pearson. All rights reserved. This content is excluded from our Creative Commonslicense. For more information, see https://ocw.mit.edu/help/faq-fair-use/.
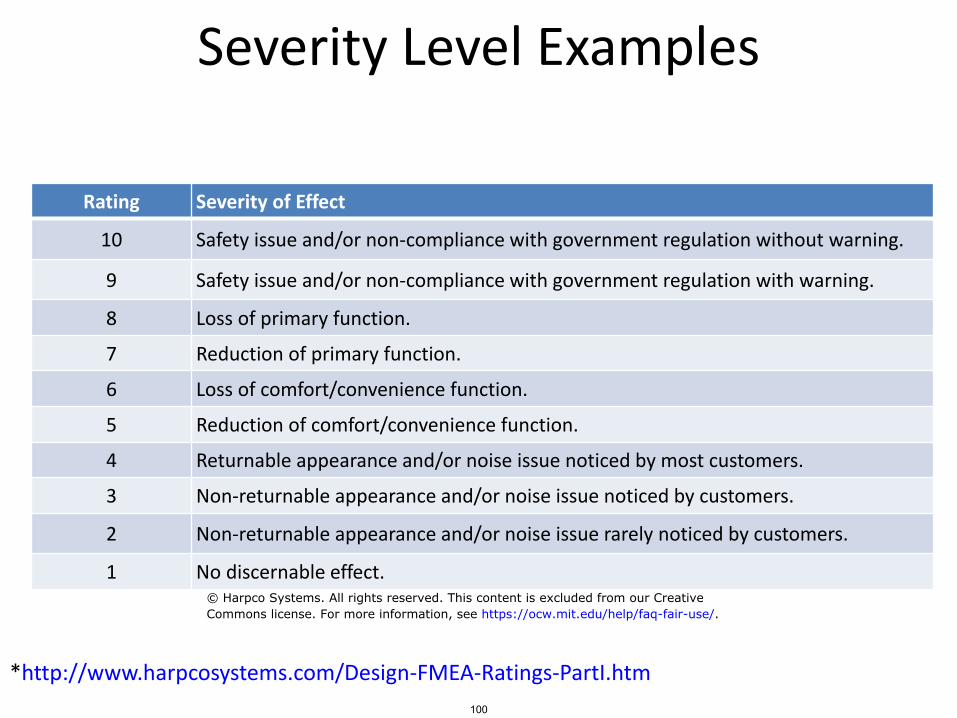
Severity Level Examples
Rating Severity of Effect
10 Safety issue and/or non-compliance with government regulation without warning.
9 Safety issue and/or non-compliance with government regulation with warning.
8 Loss of primary function.
7 Reduction of primary function.
6 Loss of comfort/convenience function.
5 Reduction of comfort/convenience function.
4 Returnable appearance and/or noise issue noticed by most customers.
3 Non-returnable appearance and/or noise issue noticed by customers.
2 Non-returnable appearance and/or noise issue rarely noticed by customers.
1 No discernable effect.
*http://www.harpcosystems.com/Design-FMEA-Ratings-PartI.htm
100
© Harpco Systems. All rights reserved. This content is excluded from our CreativeCommons license. For more information, see https://ocw.mit.edu/help/faq-fair-use/.
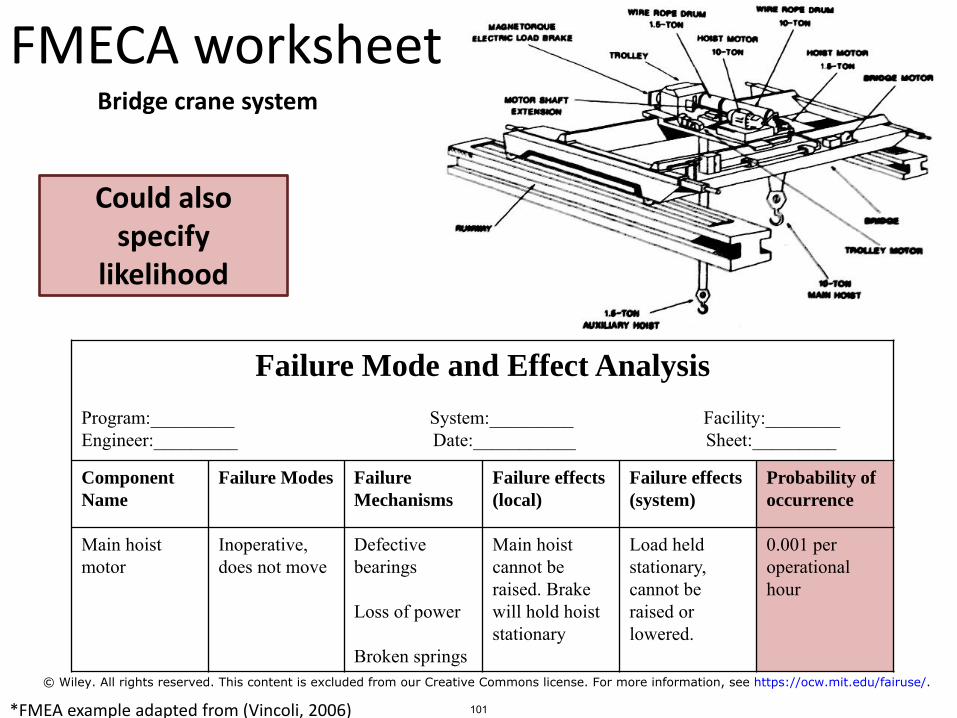
Failure Mode and Effect Analysis
Program:_________ System:_________ Facility:________Engineer:_________ Date:___________ Sheet:_________
Component
Name
Failure Modes Failure
Mechanisms
Failure effects
(local)
Failure effects
(system)
Probability of
occurrence
Main hoist motor
Inoperative, does not move
Defective bearings
Loss of power
Broken springs
Main hoist cannot be raised. Brake will hold hoiststationary
Load held stationary, cannot be raised or lowered.
0.001 per operational hour
FMECA worksheet
*FMEA example adapted from (Vincoli, 2006)
Bridge crane system
Could also specify
likelihood
101
© Wiley. All rights reserved. This content is excluded from our Creative Commons license. For more information, see https://ocw.mit.edu/fairuse/.

FMECA Exercise: Actual automotive brakes
BrakePedal
Brake fluid
FMEA worksheet columns– Component– Failure mode– Failure mechanism– Failure effect (local)– Failure effect (system)– Criticality (Severity)
Severity Levels1. No effect2. Minor, not noticed by average
customer3. Major, loss of primary function4. Catastrophic, injury/death
102Courtesy of John Thomas. Used with permission.

Quantitative ETA
103
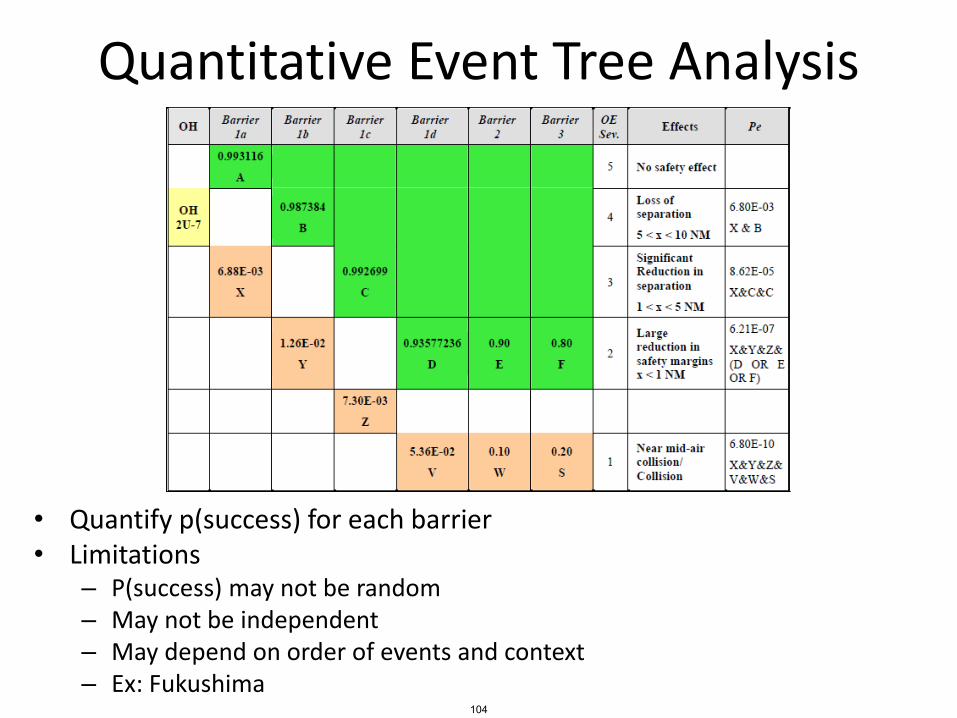
Quantitative Event Tree Analysis
• Quantify p(success) for each barrier• Limitations
– P(success) may not be random– May not be independent– May depend on order of events and context– Ex: Fukushima
104
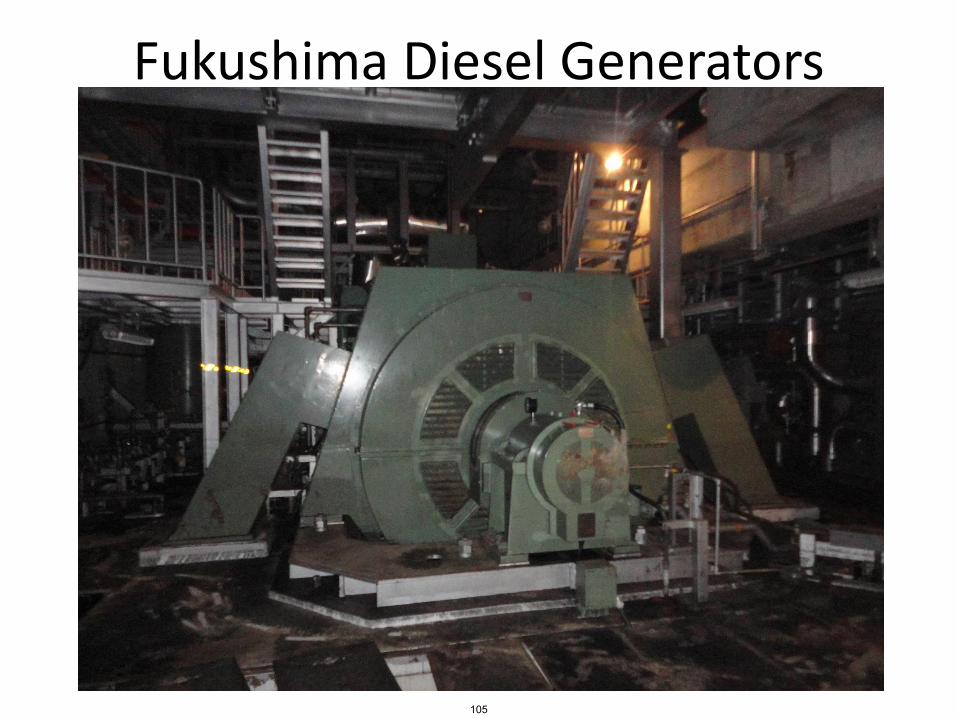
Fukushima Diesel Generators
105
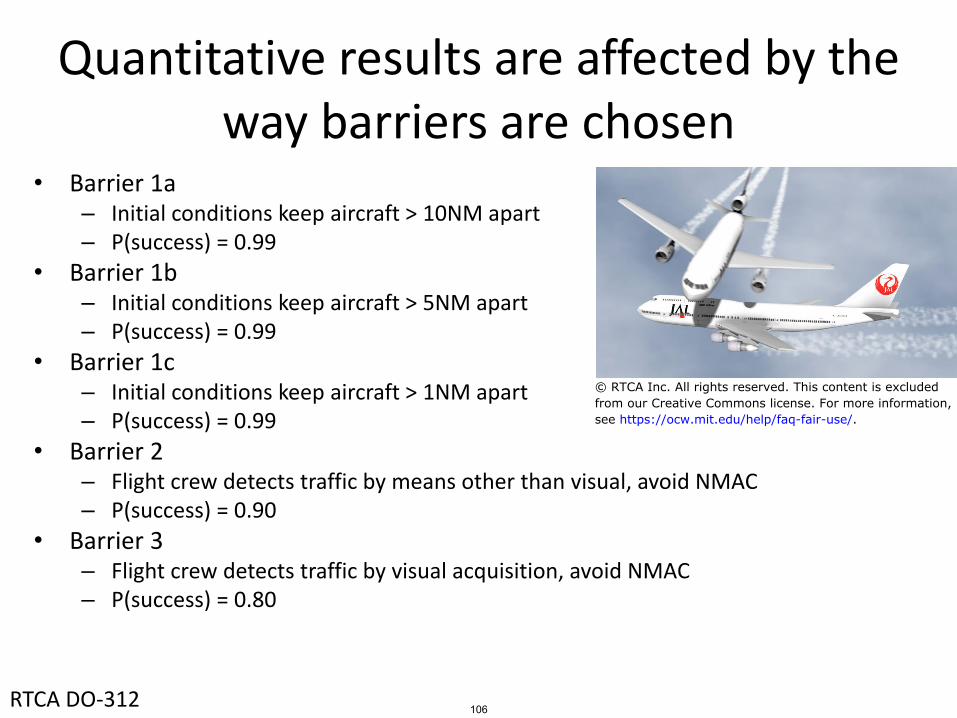
Quantitative results are affected by the way barriers are chosen
• Barrier 1a– Initial conditions keep aircraft > 10NM apart– P(success) = 0.99
• Barrier 1b– Initial conditions keep aircraft > 5NM apart– P(success) = 0.99
• Barrier 1c– Initial conditions keep aircraft > 1NM apart– P(success) = 0.99
• Barrier 2– Flight crew detects traffic by means other than visual, avoid NMAC– P(success) = 0.90
• Barrier 3– Flight crew detects traffic by visual acquisition, avoid NMAC– P(success) = 0.80
RTCA DO-312 106
© RTCA Inc. All rights reserved. This content is excludedfrom our Creative Commons license. For more information,see https://ocw.mit.edu/help/faq-fair-use/.

Quantitative FTA
107
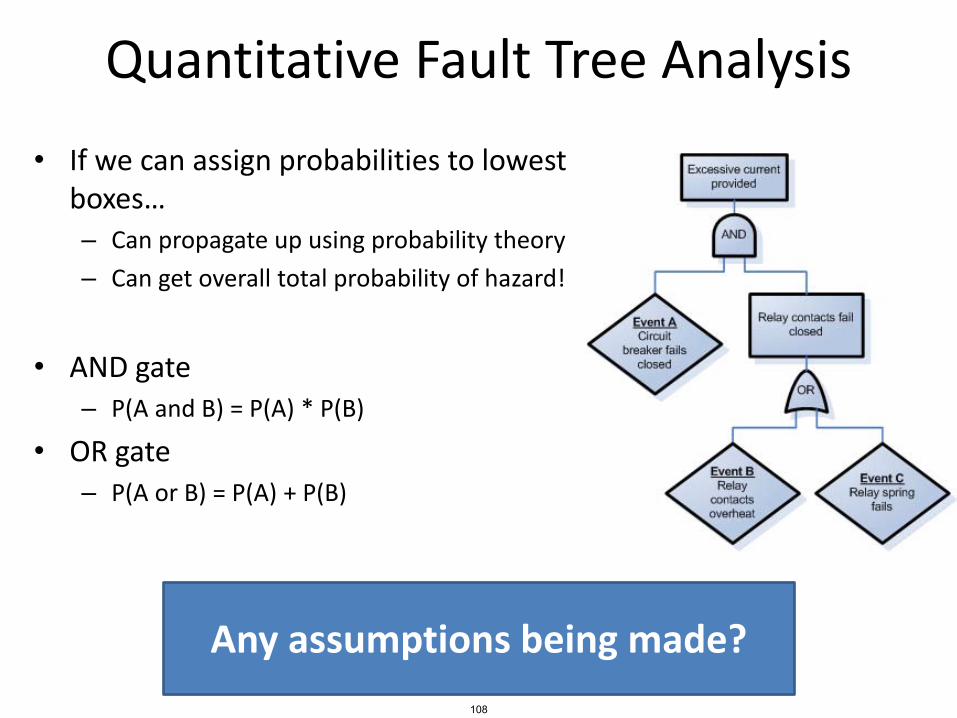
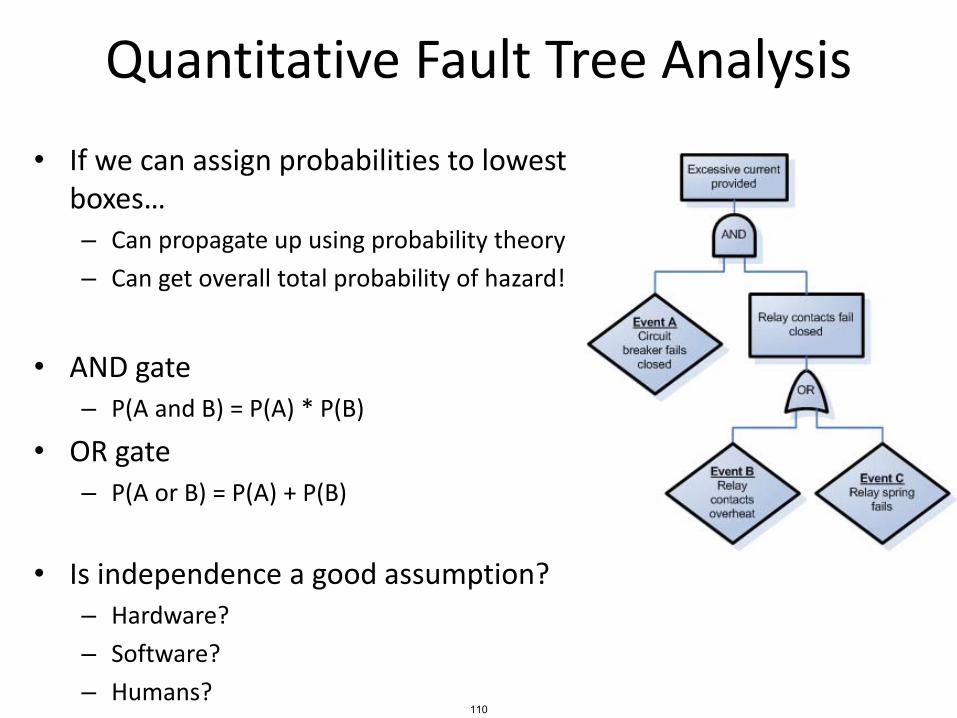
Quantitative Fault Tree Analysis
• If we can assign probabilities to lowest boxes…– Can propagate up using probability theory
– Can get overall total probability of hazard!
• AND gate– P(A and B) = P(A) * P(B)
• OR gate– P(A or B) = P(A) + P(B)
Any assumptions being made?
108

Quantitative Fault Tree Analysis
• If we can assign probabilities to lowest boxes…– Can propagate up using probability theory
– Can get overall total probability of hazard!
• AND gate– P(A and B) = P(A) * P(B)
• OR gate– P(A or B) = P(A) + P(B)
Only if events A,B are independent!
109
Quantitative Fault Tree Analysis
• If we can assign probabilities to lowest boxes…– Can propagate up using probability theory
– Can get overall total probability of hazard!
• AND gate– P(A and B) = P(A) * P(B)
• OR gate– P(A or B) = P(A) + P(B)
• Is independence a good assumption?– Hardware?
– Software?
– Humans?110
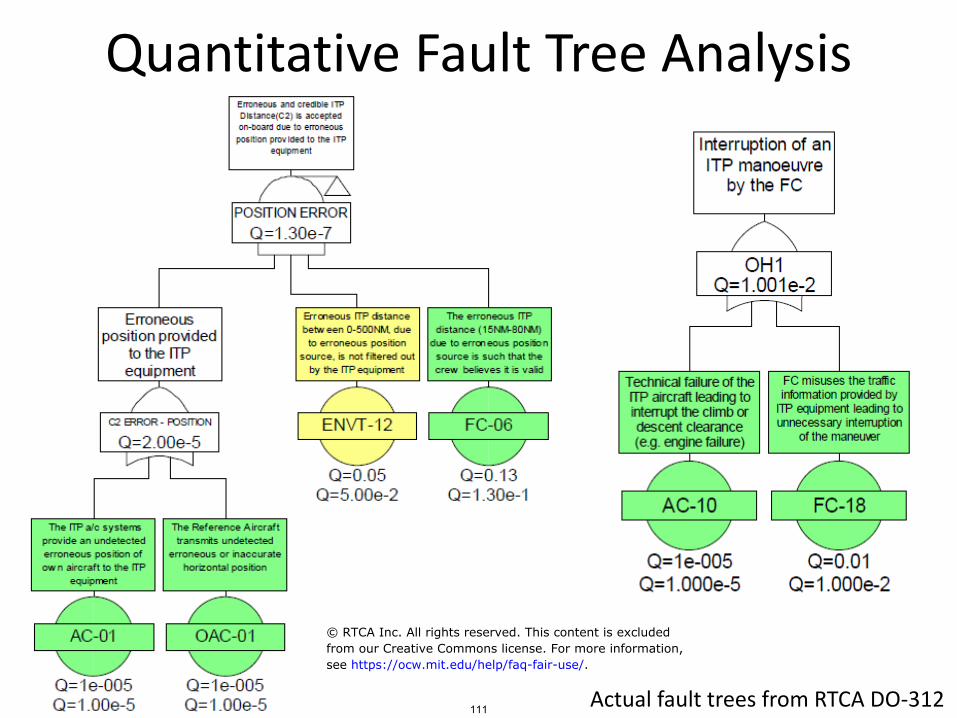
Quantitative Fault Tree Analysis
Actual fault trees from RTCA DO-312111
© RTCA Inc. All rights reserved. This content is excludedfrom our Creative Commons license. For more information,see https://ocw.mit.edu/help/faq-fair-use/.
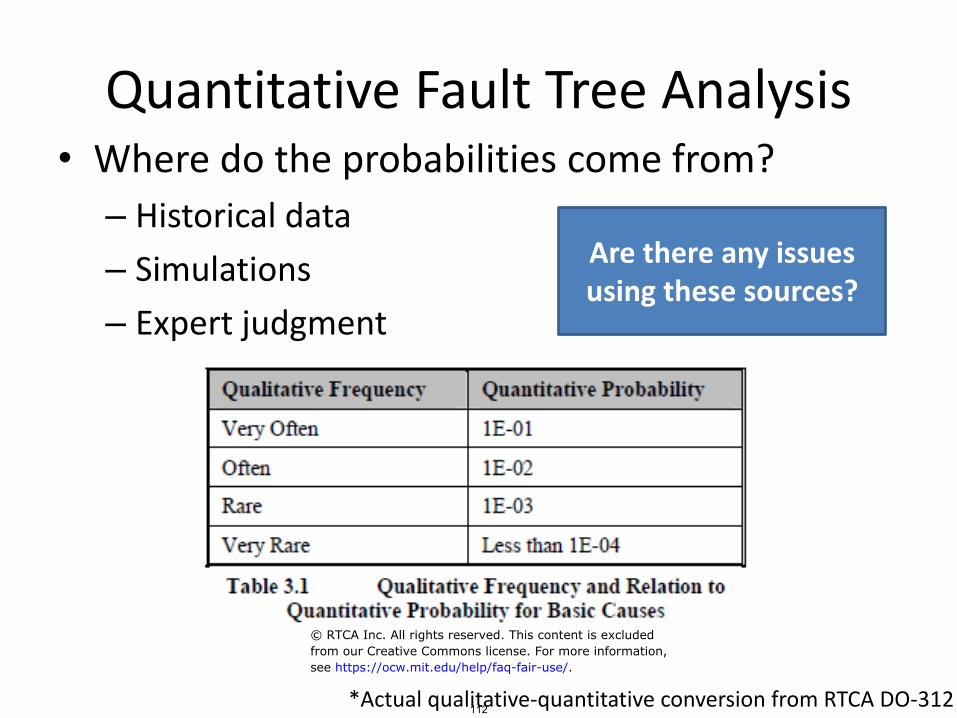
Quantitative Fault Tree Analysis• Where do the probabilities come from?
– Historical data
– Simulations
– Expert judgment
Are there any issues using these sources?
*Actual qualitative-quantitative conversion from RTCA DO-312112
© RTCA Inc. All rights reserved. This content is excludedfrom our Creative Commons license. For more information,see https://ocw.mit.edu/help/faq-fair-use/.
Risk Assessment and Preliminary Hazard Analysis (PHA)
113

Preliminary Hazard Analysis
114
© Wiley. All rights reserved. This content is excluded from our Creative Commons license. For more information, see https://ocw.mit.edu/fairuse/.
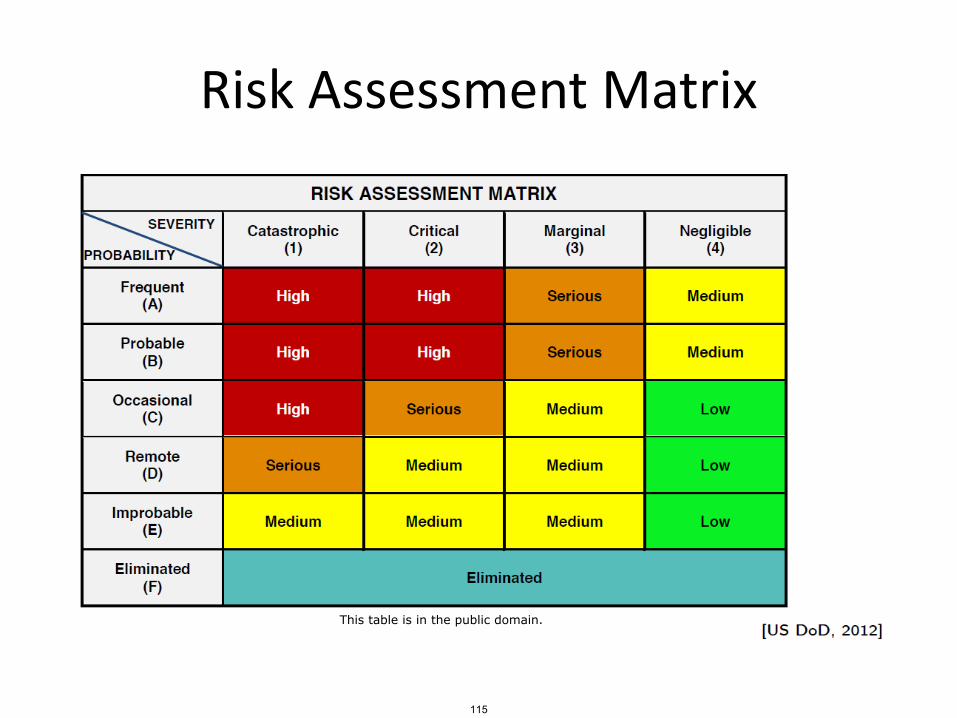
Risk Assessment Matrix
115
This table is in the public domain.
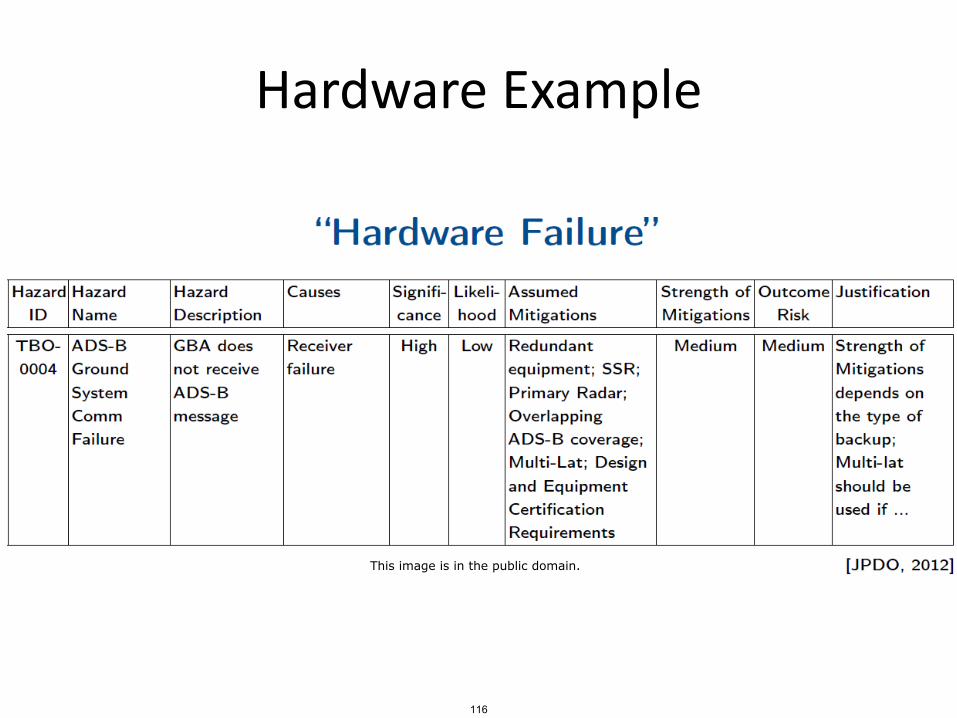
Hardware Example
116
This image is in the public domain.

Software Example
117
This image is in the public domain.
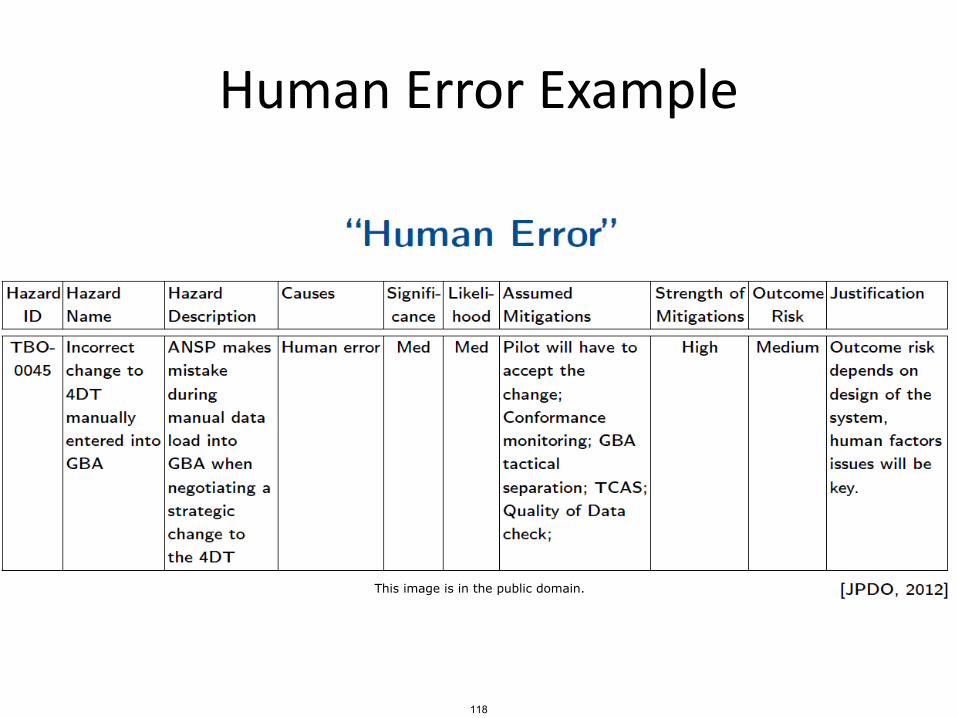
Human Error Example
118
This image is in the public domain.
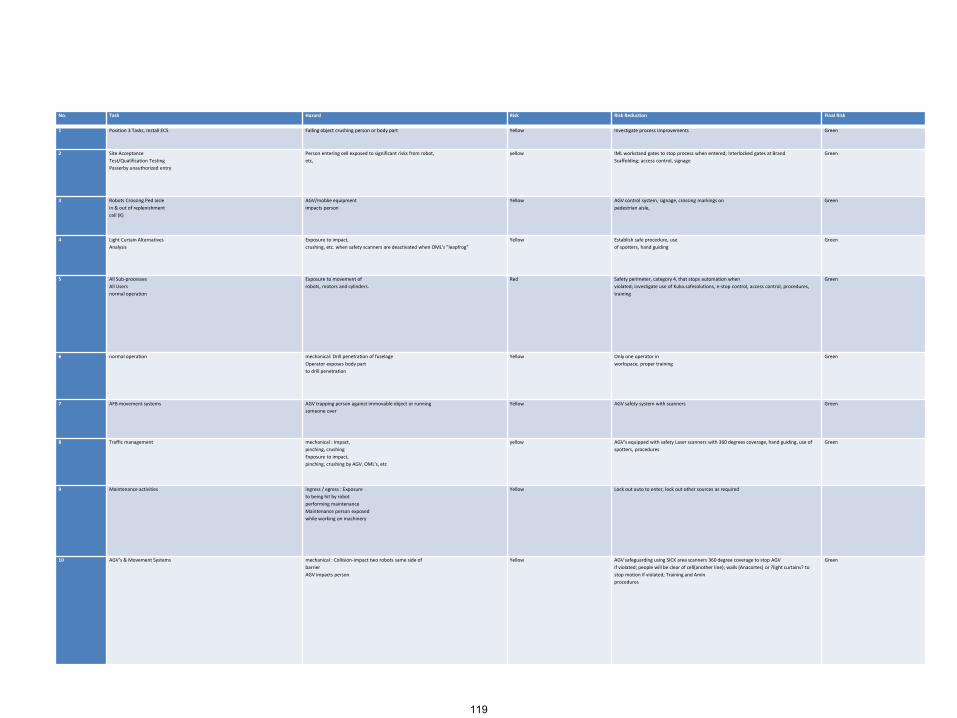
No. Task Hazard Risk Risk Reduction Final Risk
1 Position 3 Tasks, Install ECS Falling object crushing person or body part Yellow Investigate process improvements Green
2 Site Acceptance
Test/Qualification Testing
Passerby unauthorized entry
Person entering cell exposed to significant risks from robot,
etc,
yellow IML workstand gates to stop process when entered; Interlocked gates at Brand
Scaffolding; access control, signage
Green
3 Robots Crossing Ped aisle
in & out of replenishment
cell (K)
AGV/moblie equipment
impacts person
Yellow AGV control system, signage, crossing markings on
pedestrian aisle,
Green
4 Light Curtain Alternatives
Analysis
Exposure to impact,
crushing, etc. when safety scanners are deactivated when OML's "leapfrog"
Yellow Establish safe procedure, use
of spotters, hand guiding
Green
5 All Sub-processes
All Users
normal operation
Exposure to movement of
robots, motors and cylinders.
Red Safety perimeter, category 4, that stops automation when
violated; investigate use of Kuka.safesolutions, e-stop control, access control, procedures,
training
Green
6 normal operation mechanical: Drill penetration of fuselage
Operator exposes body part
to drill penetration
Yellow Only one operator in
workspace, proper training
Green
7 AFB movement systems AGV trapping person against immovable object or running
someone over
Yellow AGV safety system with scanners Green
8 Traffic management mechanical : Impact,
pinching, crushing
Exposure to impact,
pinching, crushing by AGV, OML's, etc
yellow AGV's equipped with safety Laser scanners with 360 degrees coverage, hand guiding, use of
spotters, procedures
Green
9 Maintenance activities ingress / egress : Exposure
to being hit by robot
performing maintenance
Maintenance person exposed
while working on machinery
Yellow Lock out auto to enter, lock out other sources as required
10 AGV’s & Movement Systems mechanical : Collision-impact two robots same side of
barrier
AGV impacts person
Yellow AGV safeguarding using SICK area scanners 360 degree coverage to stop AGV
if violated; people will be clear of cell(another line); walls (Anacortes) or ?light curtains? to
stop motion if violated; Training and Amin
procedures
Green
119
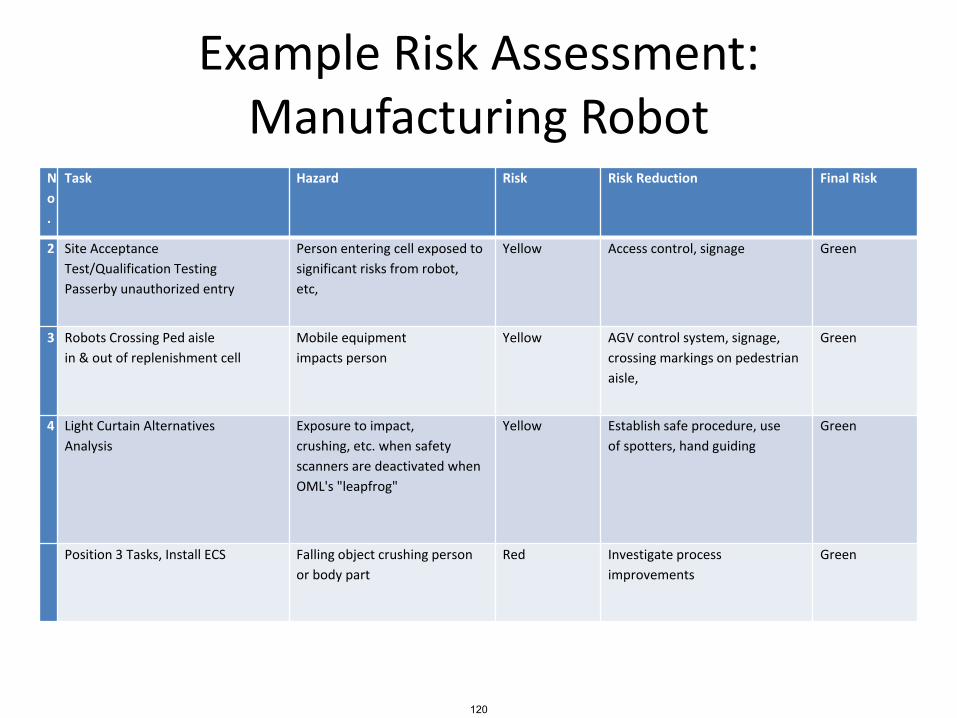
Example Risk Assessment: Manufacturing Robot
N
o
.
Task Hazard Risk Risk Reduction Final Risk
2 Site Acceptance
Test/Qualification Testing
Passerby unauthorized entry
Person entering cell exposed to
significant risks from robot,
etc,
Yellow Access control, signage Green
3 Robots Crossing Ped aisle
in & out of replenishment cell
Mobile equipment
impacts person
Yellow AGV control system, signage,
crossing markings on pedestrian
aisle,
Green
4 Light Curtain Alternatives
Analysis
Exposure to impact,
crushing, etc. when safety
scanners are deactivated when
OML's "leapfrog"
Yellow Establish safe procedure, use
of spotters, hand guiding
Green
Position 3 Tasks, Install ECS Falling object crushing person
or body part
Red Investigate process
improvements
Green
120

UH-60MU SAR Hazard Classification
UH-60MU SAR marginal hazards
• Loss of altitude indication in DVE
• Loss of heading indication in DVE
• Loss of airspeed indication in DVE
• Loss of aircraft health information
• Loss of external communications
• Loss of internal communications
STPA Unsafe Control ActionThe Flight Crew does not provide collective control input necessary for level flight, resulting in controlled flight into terrain
Scenario 1: The Flight Crew has a flawed process model and believes they are providing sufficient control input to maintain level flight. This flawed process model could result from:
a)The altitude indicator and attitude indicator are malfunctioning during IFR flight and the pilots are unable to maintain level flight
b)The Flight Crew believes the aircraft is trimmed in level flight when it is not
c)The Flight Crew has excessive workload due to other tasks and cannot control the aircraft
d)The Flight Crew has degraded visual conditions and cannot perceive slow rates of descent that result in a continuous descent
e)The Flight Crew does not perceive rising terrain and trims the aircraft for level flight that results in controlled flight into terrain
UH-60MU SAR identifies various hazards as marginal that actually could lead to a
catastrophic accident
121
This content is in the public domain.
Current State of the Art: PRA• Risk and Risk Assessment
– Little data validating PRA or methods for calculating it
– Other problems• May be significant divergence between modeled system
and as-built and as-operated system• Interactions between social and technical part of system
may invalidate technical assumptions underlying analysis• Effectiveness of mitigation measures may change over time
– Why are likelihood estimates inaccurate in practice?• Important factors left out (operator error, flawed decision
making, software) because don’t have probability estimates
• Non-stochastic factors involved in events• Heuristic biases
122
Heuristic Biases• Confirmation bias (tend to deny uncertainty and vulnerability)
– People look for evidence that supports their hypothesis
– Reject evidence that does not
• Construct simple causal scenarios
– If none comes to mind, assume impossible
• Tend to identify simple, dramatic events rather than events that are chronic or cumulative
• Incomplete search for causes
– Once one cause identified and not compelling, then stop search
• Defensive avoidance
– Downgrade accuracy or don’t take seriously
– Avoid topic that is stressful or conflicts with other goals
123
Controlling Heuristic Biases
• Cannot eliminate completely but can reduce
• Use structured method for assessing and managing “risk”
– Following a structured process and rules to follow can diminish power of biases and encourage more thorough search
– Concentrate on causal mechanisms vs. likelihood
– Require action or procedures (to avoid defensive avoidance)
• Use worst case analysis (vs. “design basis accident”)
• “Prove” unsafe rather than “safe” – Hazard analysis vs. safety case
124
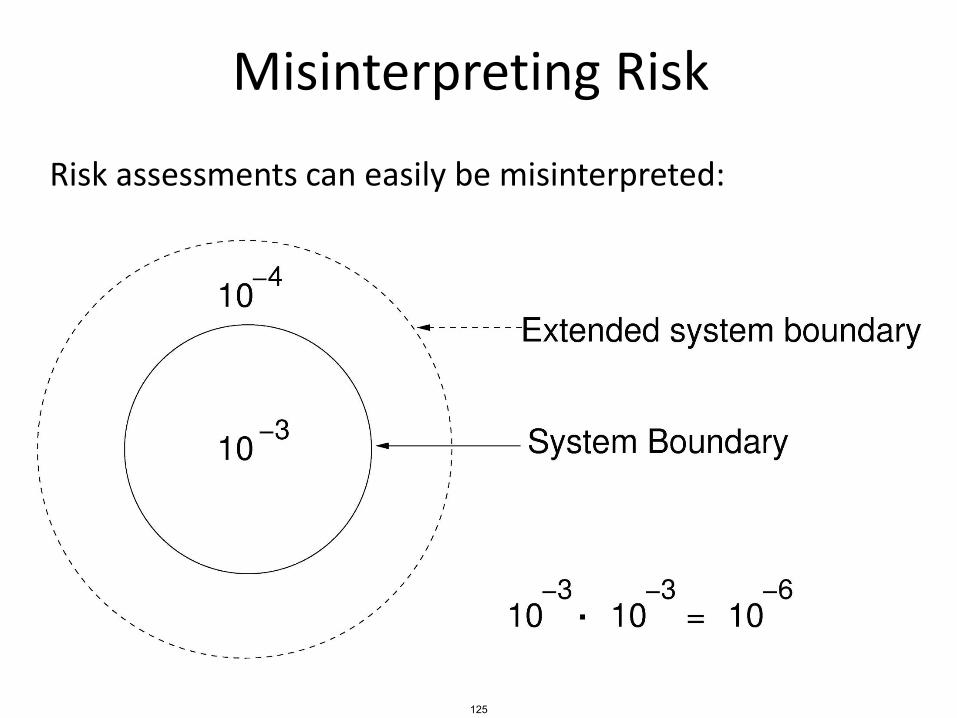
Misinterpreting Risk
Risk assessments can easily be misinterpreted:
125
Cost Benefit Analysis
126
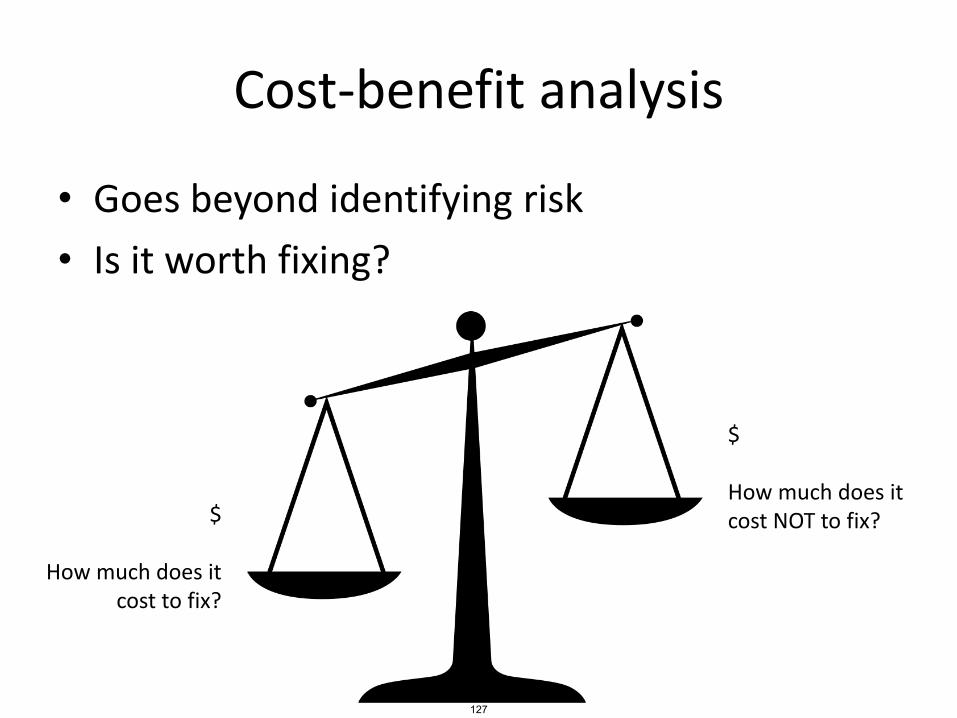
Cost-benefit analysis
• Goes beyond identifying risk
• Is it worth fixing?
$
How much does it $ cost NOT to fix?
How much does it cost to fix?
127
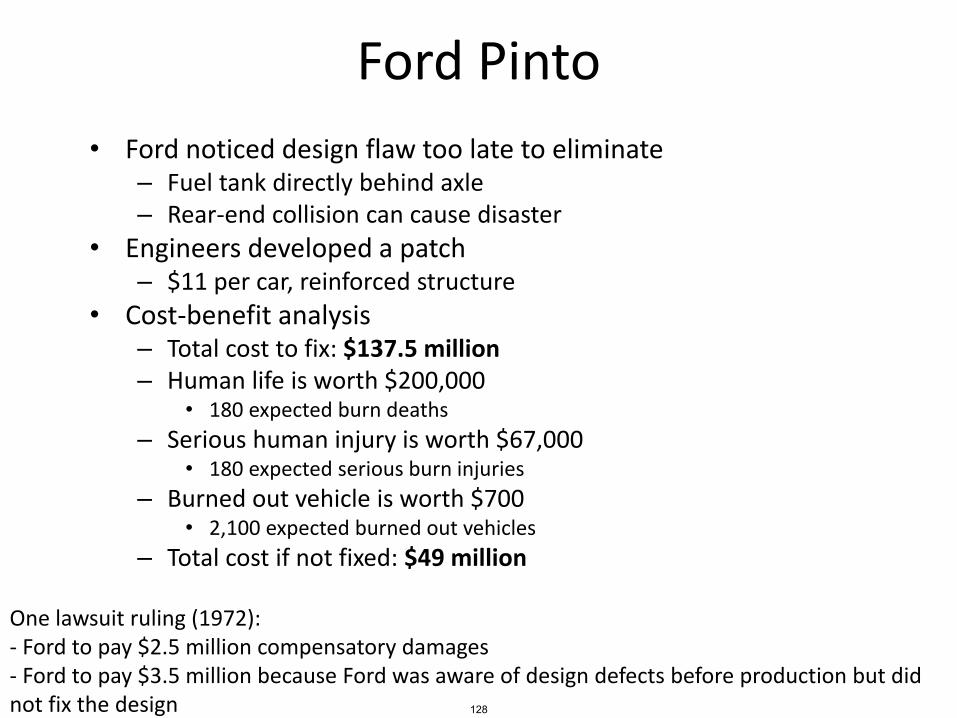
Ford Pinto
• Ford noticed design flaw too late to eliminate– Fuel tank directly behind axle– Rear-end collision can cause disaster
• Engineers developed a patch– $11 per car, reinforced structure
• Cost-benefit analysis– Total cost to fix: $137.5 million– Human life is worth $200,000
• 180 expected burn deaths
– Serious human injury is worth $67,000• 180 expected serious burn injuries
– Burned out vehicle is worth $700• 2,100 expected burned out vehicles
– Total cost if not fixed: $49 million
One lawsuit ruling (1972):- Ford to pay $2.5 million compensatory damages- Ford to pay $3.5 million because Ford was aware of design defects before production but did not fix the design 128
Ford Pinto
• Cost of human life was based on National Highway Traffic Safety Administration regulations– $200,725 per life
• Fuel tank location was commonplace at that time in American cars
• California supreme court had tolerated and encouraged manufacturers to trade off safety for cost
• NHTSA recorded 27 Pinto rear-impact fires– Lower than average for compact cars at the time
129
General Motors• 13 deaths, 130 reported incidents• Design flaws
– Ignition switches easily switch to “off” position• Bumps, vehicle collision, heavy keychain, etc.
– Keys have wide slot, increased torque– Airbags and other safety systems immediately disabled when key is off
• Cost-benefit analysis– GM aware of problem for over a decade– Developed a fix, costs $0.57 per car– Recommended no further action because there was “no acceptable
business case”• Tooling cost and piece price was too high
• CEO response– That is very disturbing if true– This is not how GM does business– If there is a safety issue we take action. We do not look at the cost
associated with it.
130
General Motors• Systemic factors
– Wrote service bulletin to fix key slot, but kept it private
– Knew in 2001 that ignition switches did not meet specification
• 4-10 vs. 15-25
– Updated part in 2006
• Kept old part number, confusion
• Still didn’t meet specification (10-15 vs. 15-25)
131
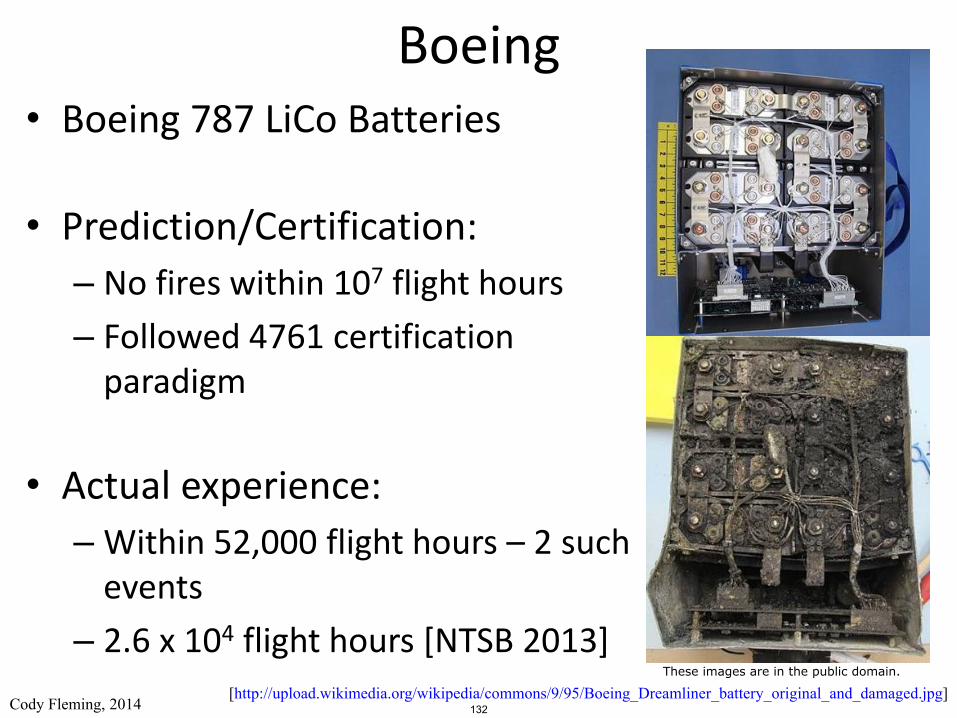
Boeing• Boeing 787 LiCo Batteries
• Prediction/Certification:
– No fires within 107 flight hours
– Followed 4761 certification paradigm
• Actual experience:
– Within 52,000 flight hours – 2 such events
– 2.6 x 10⁴ flight hours [NTSB 2013][http://upload.wikimedia.org/wikipedia/commons/9/95/Boeing_Dreamliner_battery_original_and_damaged.jpg]
Cody Fleming, 2014 132
These images are in the public domain.
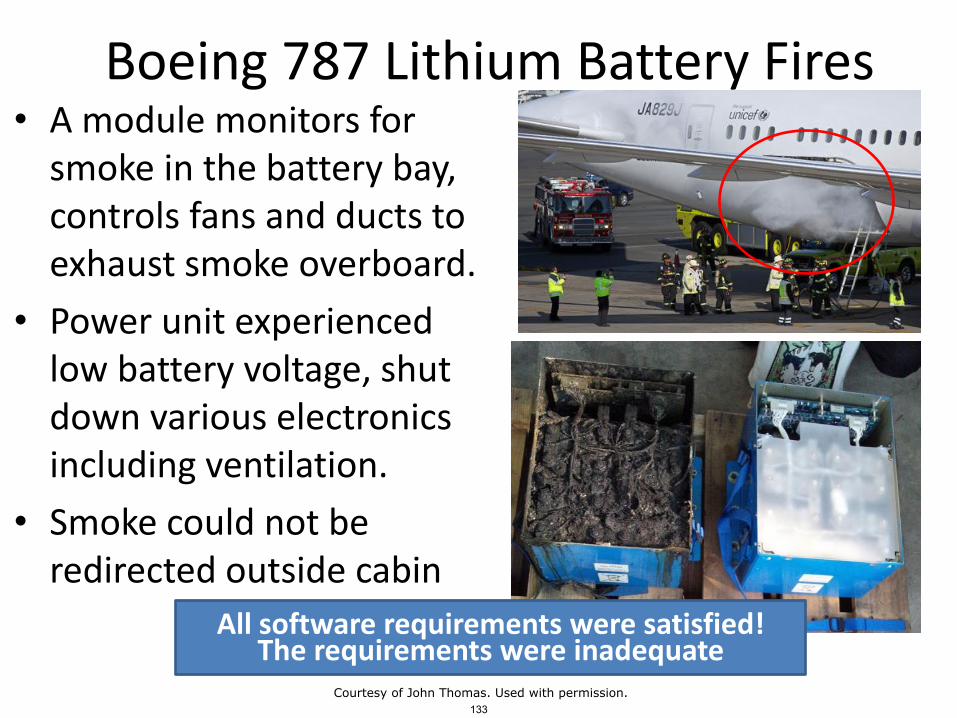
Boeing 787 Lithium Battery Fires• A module monitors for
smoke in the battery bay, controls fans and ducts to exhaust smoke overboard.
• Power unit experienced low battery voltage, shut down various electronics including ventilation.
• Smoke could not be redirected outside cabin
All software requirements were satisfied!The requirements were inadequate
133Courtesy of John Thomas. Used with permission.

Lord Kelvin quote
• “I often say that when you can measure what you are speaking about, and express it in numbers, you know something about it; but when you cannot measure it, when you cannot express it in numbers, your knowledge is of a meagre and unsatisfactory kind; it may be the beginning of knowledge, but you have scarcely in your thoughts advanced to the state of Science, whatever the matter may be.“– [PLA, vol. 1, "Electrical Units of Measurement",
1883-05-03]
134
A response
• "In truth, a good case could be made that if your knowledge is meagre and unsatisfactory, the last thing in the world you should do is make measurements; the chance is negligible that you will measure the right things accidentally.“
– George Miller (a psychologist)
135

MIT OpenCourseWarehttps://ocw.mit.edu
16.63J / ESD.03J System SafetySpring 2016
For information about citing these materials or our Terms of Use, visit: https://ocw.mit.edu/terms.


![Hazard Analysis (FMEA & STPA) - Indico [Home]indico.ictp.it/event/a13209/session/2/contribution/21/material/... · Hazard Analysis (FMEA & STPA) Todd Pawlicki, ... First, answer some](https://img.pdfslide.us/doc/110x75/5af7f1dc7f8b9a190c91d309/hazard-analysis-fmea-stpa-indico-home-analysis-fmea-stpa-todd-pawlicki.jpg)