Embed Size (px)
Citation preview
Ryegrass Fluorescence Testing
Traditional and Genetic Methods
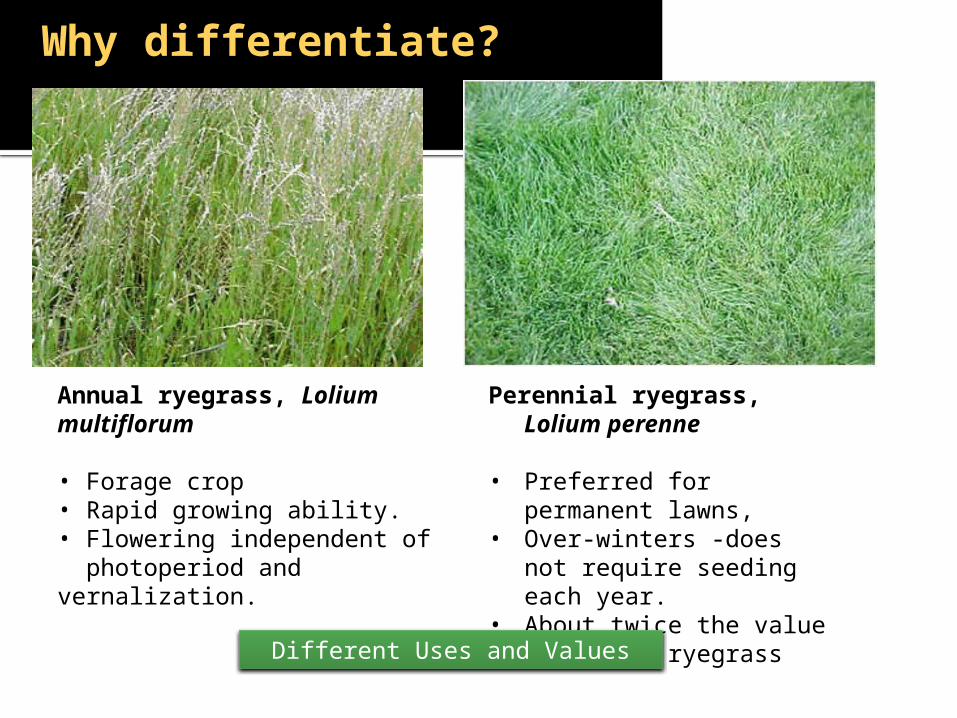
Annual ryegrass, Lolium multiflorum
• Forage crop • Rapid growing ability.• Flowering independent of photoperiod and vernalization.
Why differentiate?
Perennial ryegrass, Lolium perenne
• Preferred for permanent lawns,• Over-winters -does not require
seeding each year.• About twice the value of annual
ryegrass
Different Uses and Values
Traditional MethodSeedling Root Fluorescence
Distinguish Lolium multiflorum and Lolium perenne
Idea: Annual ryegrass roots fluoresce under UV light. (1930’s)
Needs=filter paper+UV light Seedlings with fluorescent roots
recorded and removed at first count (7d) and final count (14d)
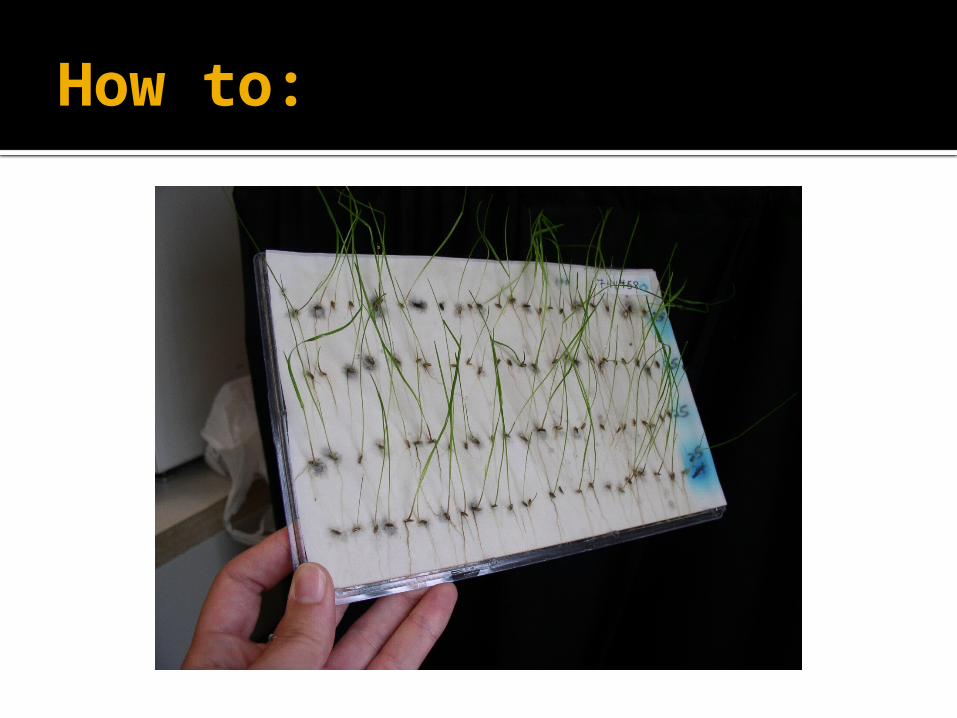
How to:
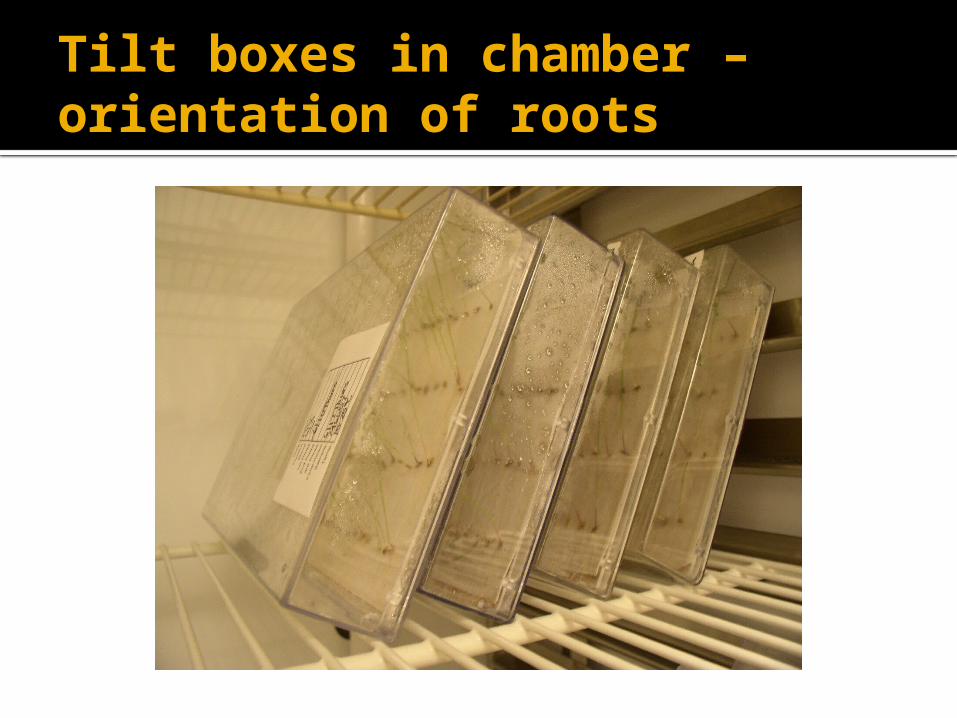
Tilt boxes in chamber –orientation of roots
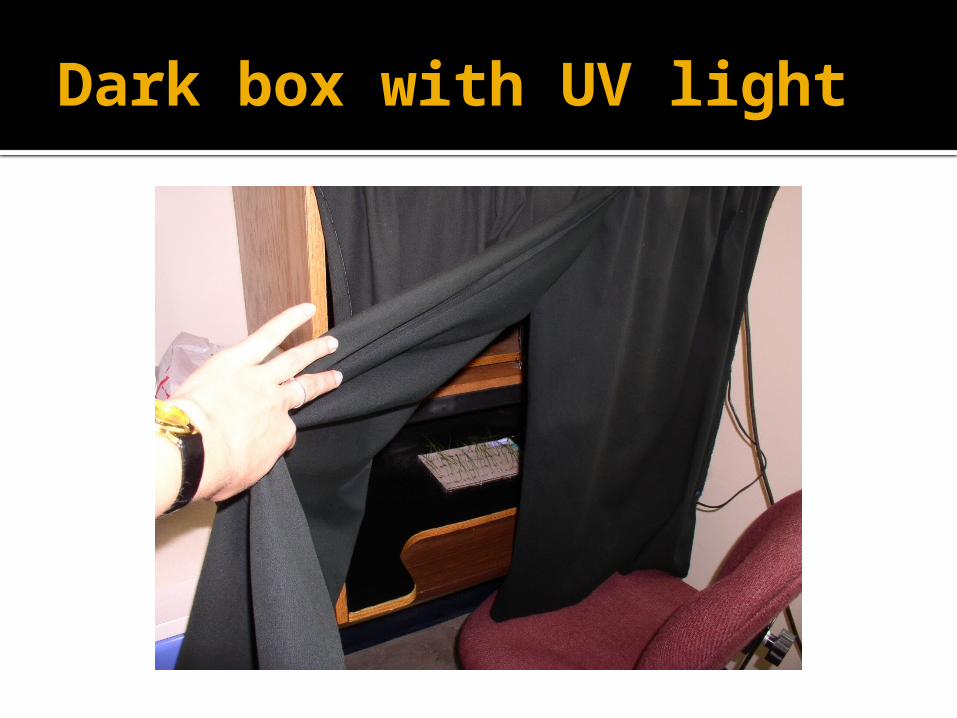
Dark box with UV light
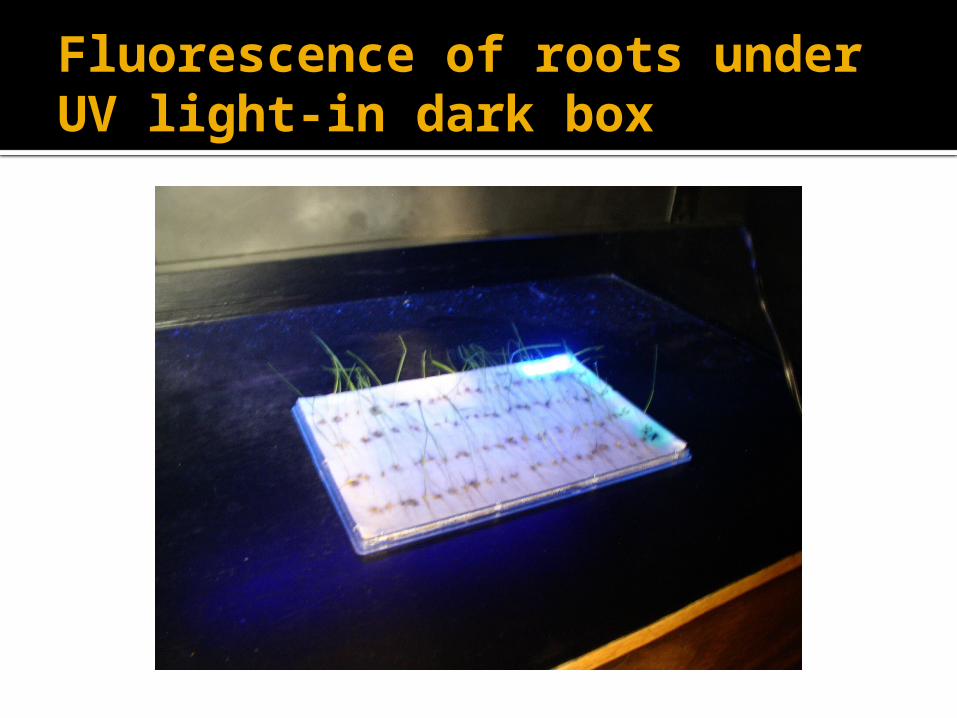
Fluorescence of roots under UV light-in dark box
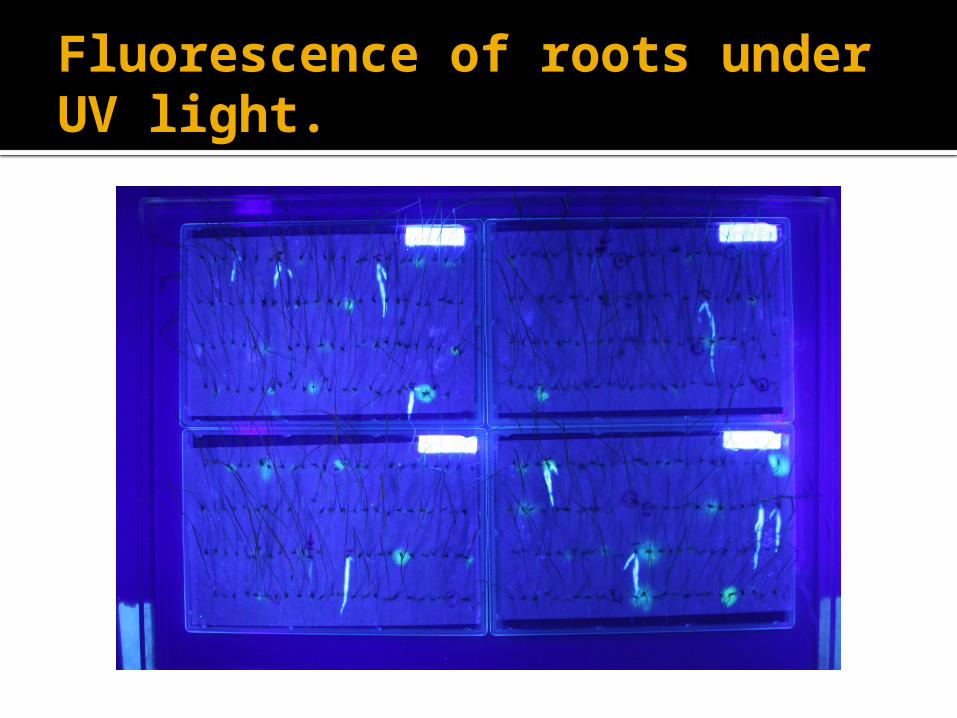
Fluorescence of roots under UV light.
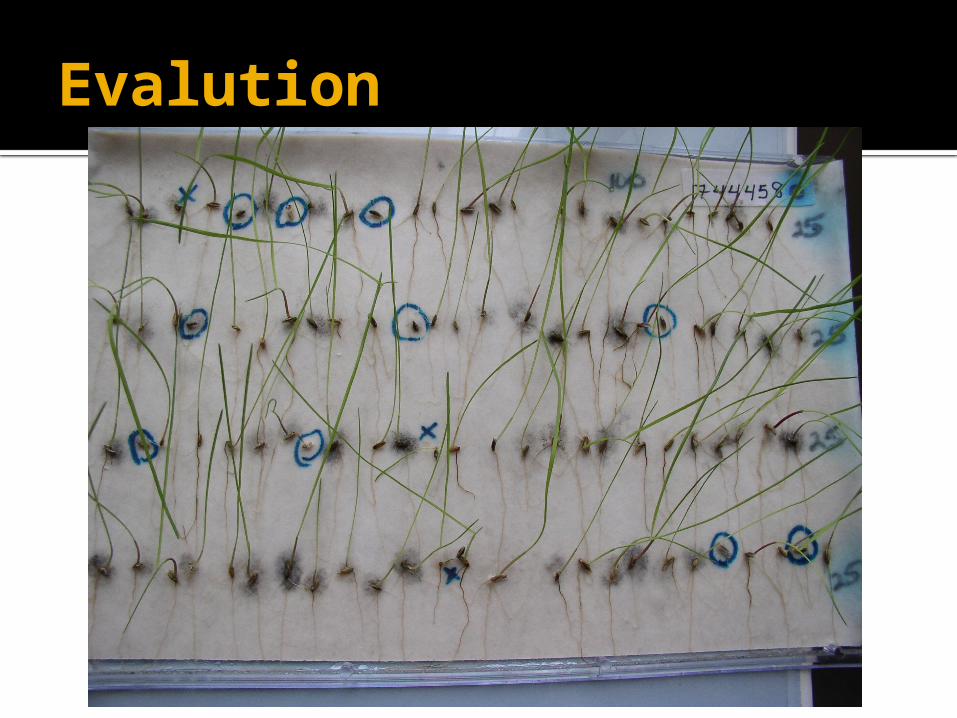
Evalution
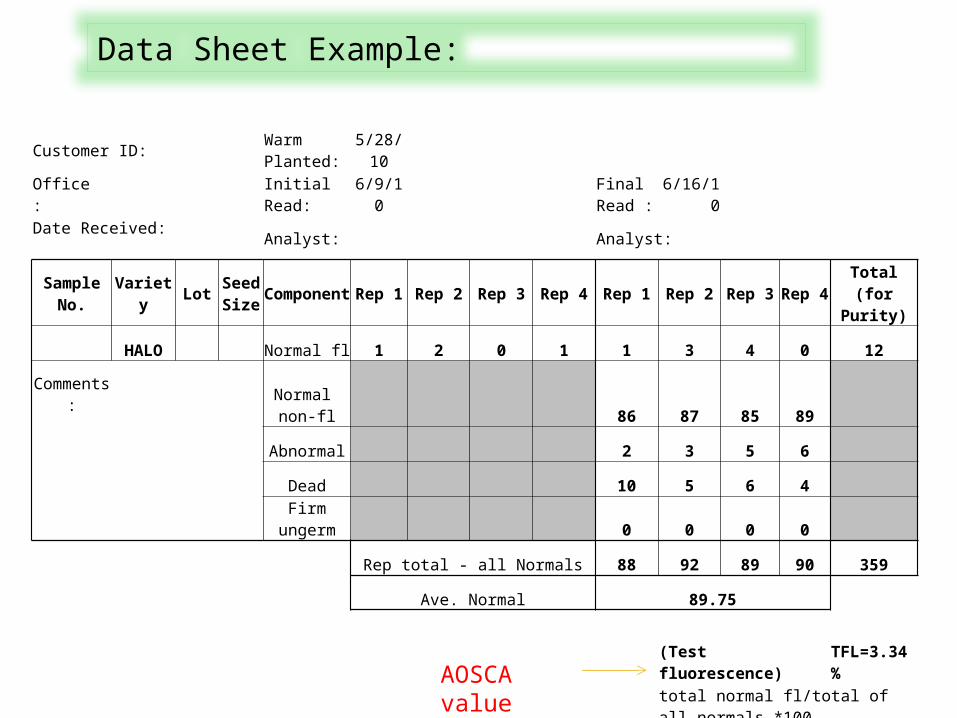
Customer ID: Warm Planted:
5/28/10
Office: Initial Read: 6/9/10Final Read :
6/16/10
Date Received: Analyst: Analyst:
SampleNo.
Variety LotSeedSize
Component
Rep 1 Rep 2 Rep 3 Rep 4 Rep 1 Rep 2 Rep 3 Rep 4Total (for Purity)
HALO Normal fl 1 2 0 1 1 3 4 0 12
Comments:
Normal non-fl 86 87 85 89
Abnormal 2 3 5 6
Dead 10 5 6 4
Firm
ungerm 0 0 0 0
Rep total - all Normals 88 92 89 90 359
Ave. Normal 89.75
(Test fluorescence) TFL=3.34%
total normal fl/total of all normals *100
(Varietal fluorescence) VFL=2.87%
Data Sheet Example:
AOSCA value
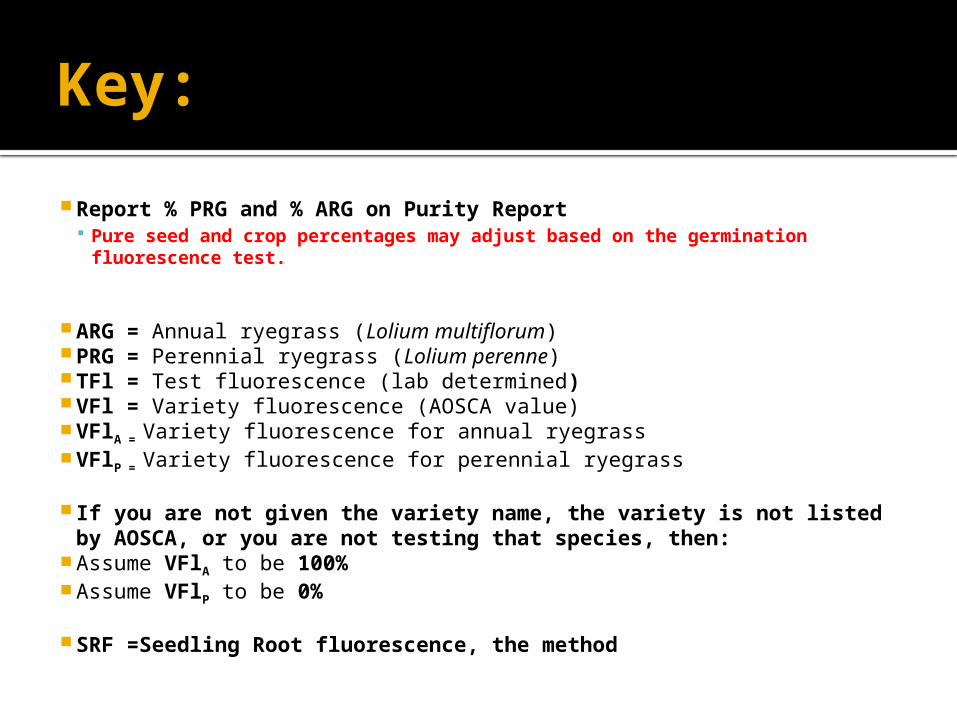
Key:
Report % PRG and % ARG on Purity Report Pure seed and crop percentages may adjust based on the germination
fluorescence test.
ARG = Annual ryegrass (Lolium multiflorum) PRG = Perennial ryegrass (Lolium perenne) TFl = Test fluorescence (lab determined) VFl = Variety fluorescence (AOSCA value) VFlA = Variety fluorescence for annual ryegrass VFlP = Variety fluorescence for perennial ryegrass
If you are not given the variety name, the variety is not listed by AOSCA, or you are not testing that species, then:
Assume VFlA to be 100% Assume VFlP to be 0%
SRF =Seedling Root fluorescence, the method
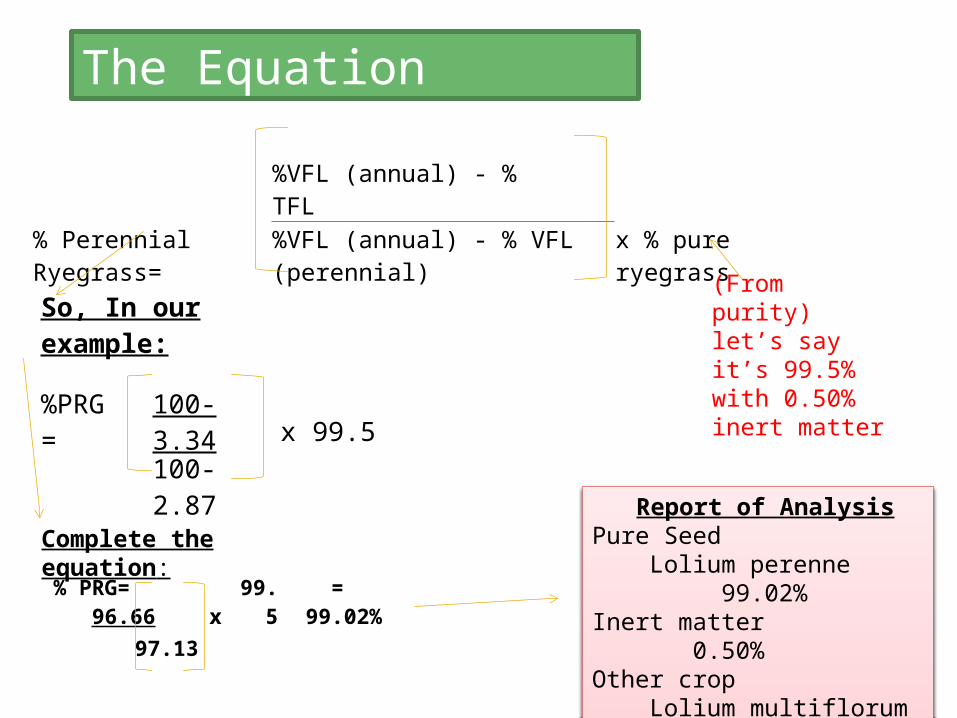
%VFL (annual) - % TFL% Perennial Ryegrass= %VFL (annual) - % VFL (perennial) x % pure ryegrass
The Equation
So, In our example:
%PRG= 100-3.34 x 99.5
100-2.87
% PRG= 96.66 x 99.5 = 99.02%97.13
(From purity) let’s say it’s 99.5% with 0.50% inert matter
Complete the equation:
Report of AnalysisPure Seed Lolium perenne 99.02%Inert matter 0.50%Other crop Lolium multiflorum 0.48%Weed Seed 0.00%
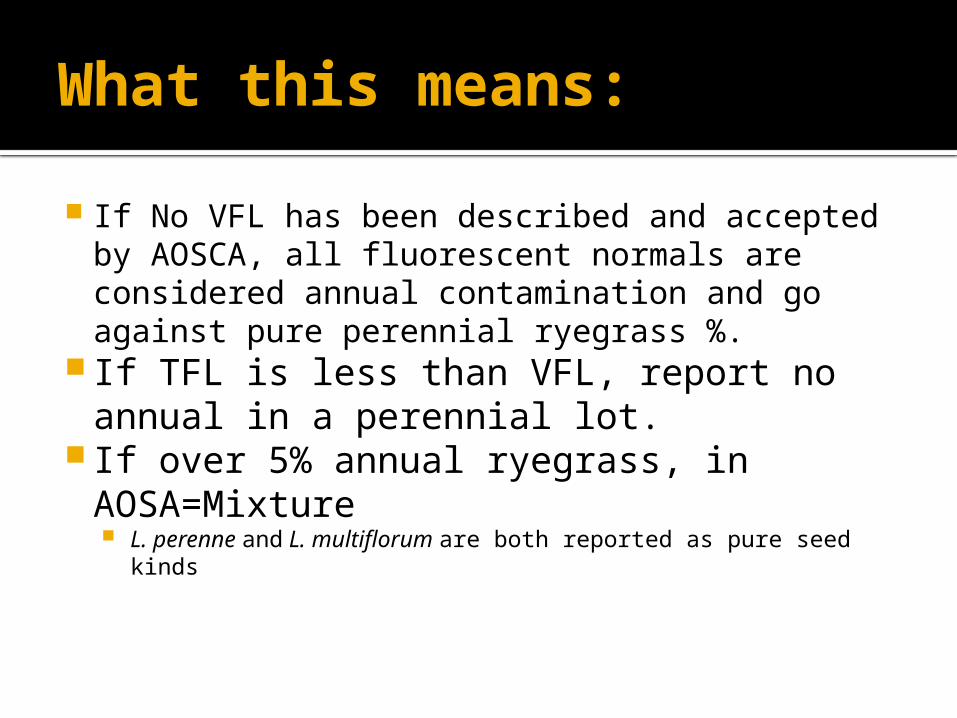
What this means:
If No VFL has been described and accepted by AOSCA, all fluorescent normals are considered annual contamination and go against pure perennial ryegrass %.
If TFL is less than VFL, report no annual in a perennial lot.
If over 5% annual ryegrass, in AOSA=Mixture L. perenne and L. multiflorum are both reported as pure seed
kinds
Perennial Ryegrass
Referee 2009
Seedling Root Fluorescence Test
Motivation
Determine the uniformity of test results from lab to lab
Review method as described in Cultivar Purity Handbook
Goal: To help clarify the method and foster
uniformity▪ Lifting vs non-lifting of roots▪ Intensity of Fluorescence
Referee Setup
Capture Environmental Differences Production Environment Lab Environment-Variation of up to 6% in TFL
over a period of less than one year (Sharon
Davidson) Referee Study:
Seven samples-varying in annuality and production area.
Prechill vs. No Prechill Completed within one month Cultivar Purity Handbook (version 2008)
Current provisions-Cultivar Purity Handbook (Version 2008)
All fluorescent root traces should be counted regardless of the intensity of fluorescence.
Non-fluorescent seedlings should not be lifted to observe fluorescence.
Fluorescence for abnormal seedlings should not be recorded.
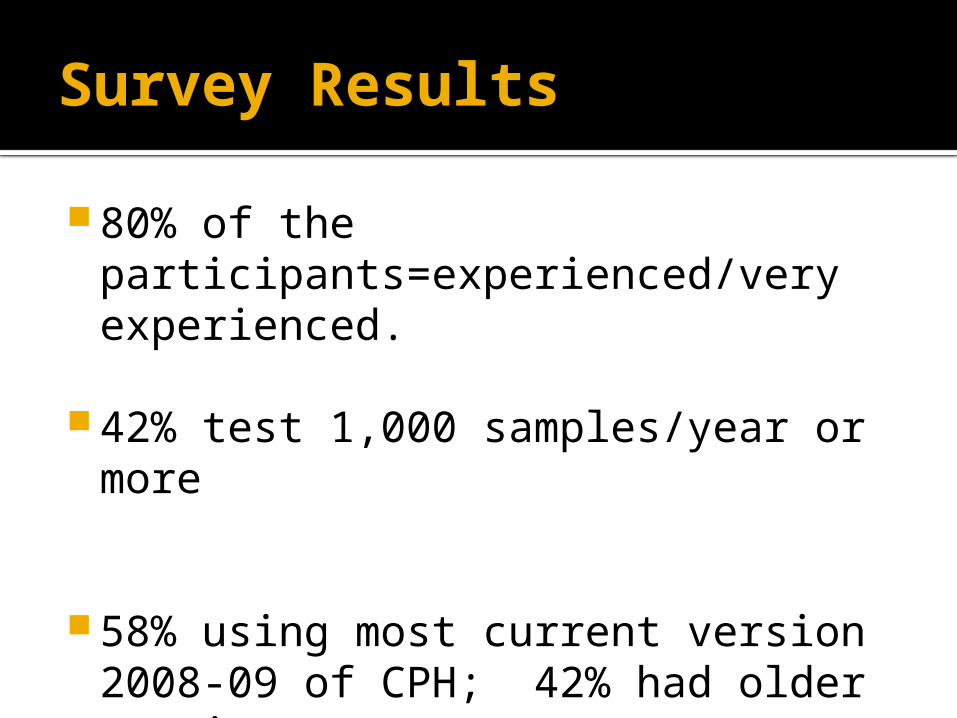
Survey Results
80% of the participants=experienced/very experienced.
42% test 1,000 samples/year or more
58% using most current version 2008-09 of CPH; 42% had older versions
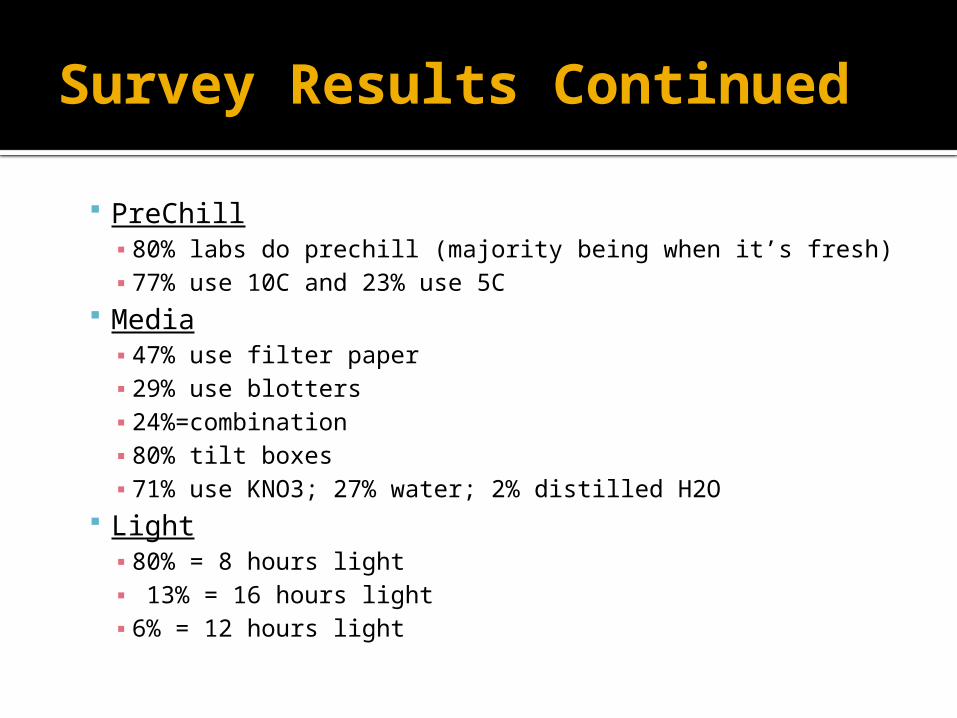
Survey Results Continued
PreChill▪ 80% labs do prechill (majority being when it’s fresh)▪ 77% use 10C and 23% use 5C
Media▪ 47% use filter paper▪ 29% use blotters▪ 24%=combination▪ 80% tilt boxes▪ 71% use KNO3; 27% water; 2% distilled H2O
Light▪ 80% = 8 hours light▪ 13% = 16 hours light▪ 6% = 12 hours light
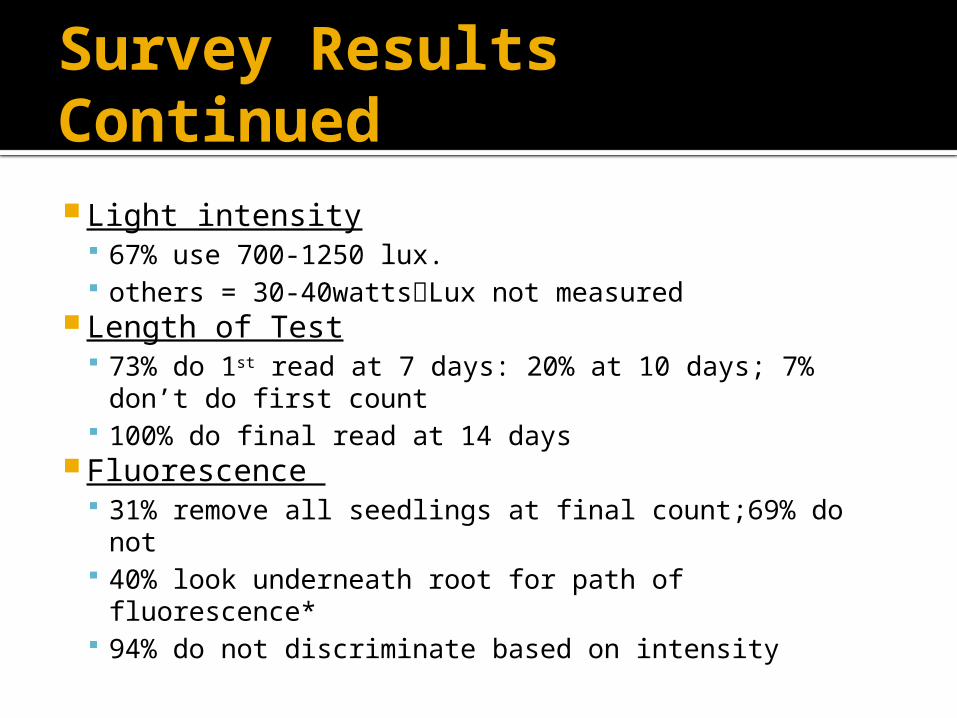
Survey Results Continued Light intensity
67% use 700-1250 lux. others = 30-40wattsLux not measured
Length of Test 73% do 1st read at 7 days: 20% at 10 days; 7%
don’t do first count 100% do final read at 14 days
Fluorescence 31% remove all seedlings at final count;69% do not 40% look underneath root for path of fluorescence* 94% do not discriminate based on intensity
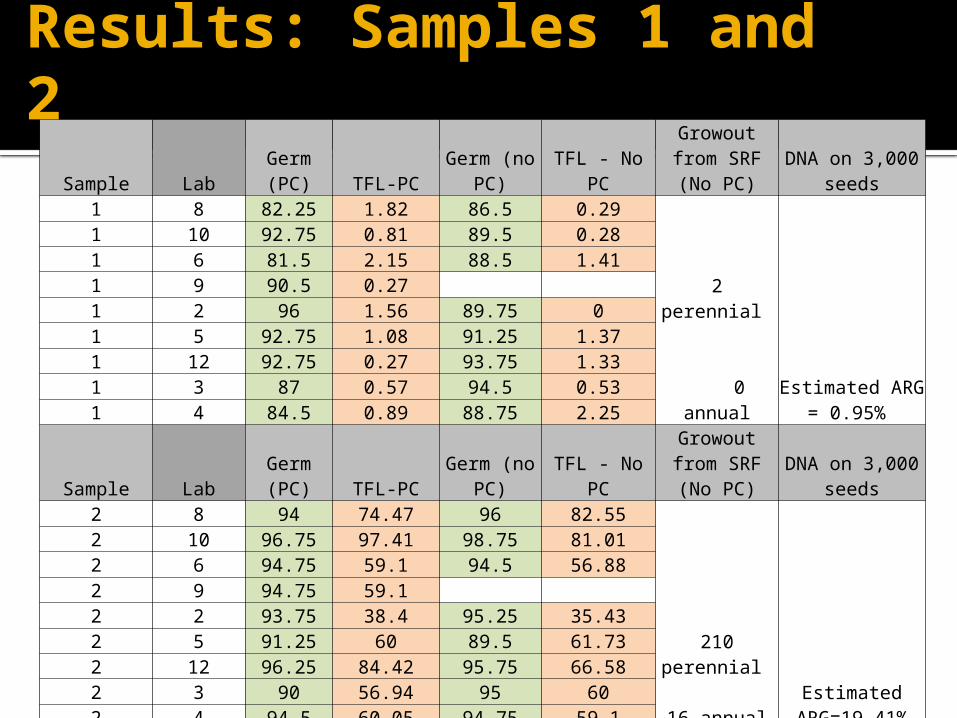
Sample Lab Germ (PC) TFL-PC Germ (no PC) TFL - No PCGrowout from
SRF (No PC)DNA on 3,000
seeds1 8 82.25 1.82 86.5 0.29
2 perennial
0 annualEstimated ARG =
0.95%
1 10 92.75 0.81 89.5 0.281 6 81.5 2.15 88.5 1.411 9 90.5 0.27 1 2 96 1.56 89.75 01 5 92.75 1.08 91.25 1.371 12 92.75 0.27 93.75 1.331 3 87 0.57 94.5 0.531 4 84.5 0.89 88.75 2.25
Sample Lab Germ (PC) TFL-PC Germ (no PC) TFL - No PCGrowout from
SRF (No PC)DNA on 3,000
seeds2 8 94 74.47 96 82.55
210 perennial
16 annualEstimated
ARG=19.41%
2 10 96.75 97.41 98.75 81.012 6 94.75 59.1 94.5 56.882 9 94.75 59.1 2 2 93.75 38.4 95.25 35.432 5 91.25 60 89.5 61.732 12 96.25 84.42 95.75 66.582 3 90 56.94 95 602 4 94.5 60.05 94.75 59.1
Results: Samples 1 and 2
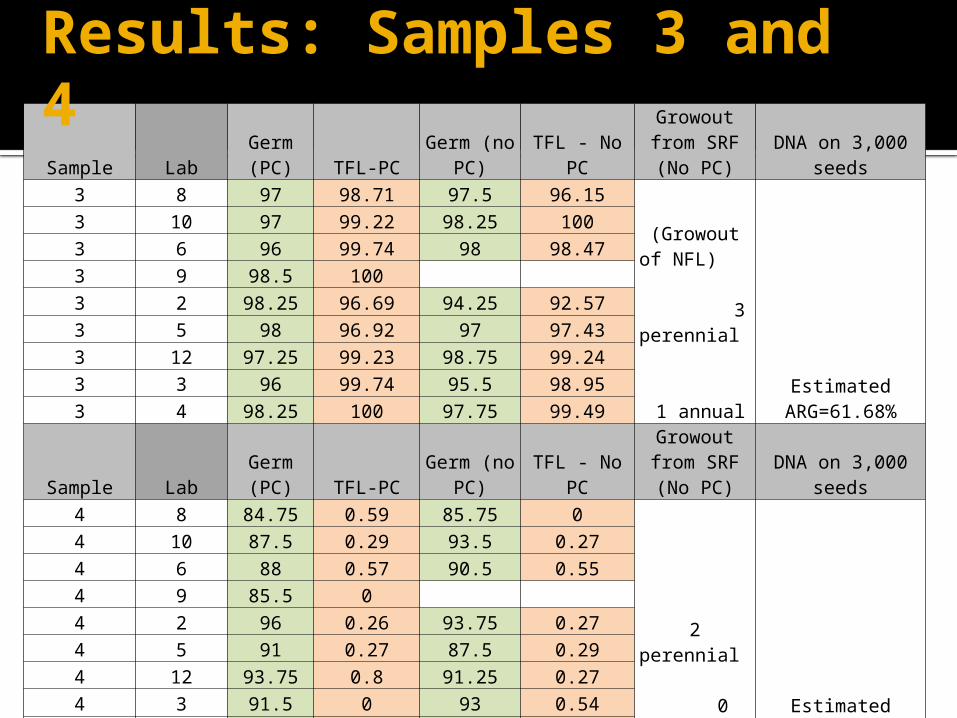
Sample Lab Germ (PC) TFL-PCGerm (no
PC) TFL - No PCGrowout from
SRF (No PC) DNA on 3,000 seeds3 8 97 98.71 97.5 96.15
(Growout of NFL) 3 perennial
1 annual
Estimated ARG=61.68%
3 10 97 99.22 98.25 1003 6 96 99.74 98 98.473 9 98.5 100 3 2 98.25 96.69 94.25 92.573 5 98 96.92 97 97.433 12 97.25 99.23 98.75 99.243 3 96 99.74 95.5 98.953 4 98.25 100 97.75 99.49
Sample Lab Germ (PC) TFL-PCGerm (no
PC) TFL - No PCGrowout from
SRF (No PC) DNA on 3,000 seeds4 8 84.75 0.59 85.75 0
2 perennial 0 annual Estimated ARG=0.14%
4 10 87.5 0.29 93.5 0.274 6 88 0.57 90.5 0.554 9 85.5 0 4 2 96 0.26 93.75 0.274 5 91 0.27 87.5 0.294 12 93.75 0.8 91.25 0.274 3 91.5 0 93 0.544 4 89.5 0.56 88.75 0.85
Results: Samples 3 and 4
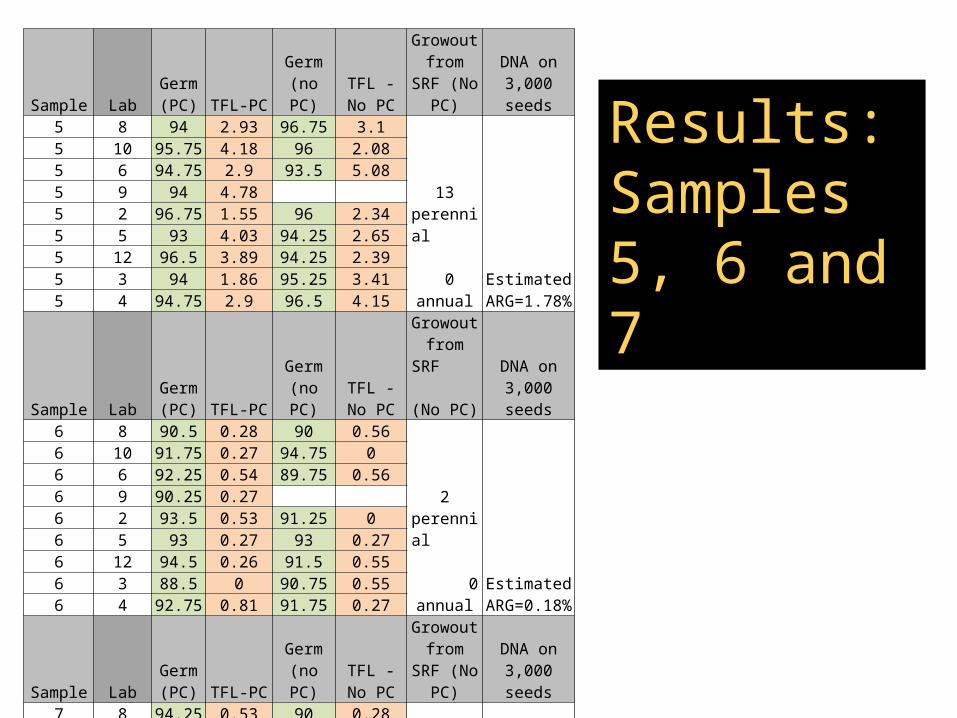
Sample LabGerm (PC) TFL-PC
Germ (no PC)
TFL - No PC
Growout from SRF (No PC)
DNA on 3,000 seeds
5 8 94 2.93 96.75 3.1
13 perennial
0 annual
Estimated ARG=1.78%
5 10 95.75 4.18 96 2.085 6 94.75 2.9 93.5 5.085 9 94 4.78 5 2 96.75 1.55 96 2.345 5 93 4.03 94.25 2.655 12 96.5 3.89 94.25 2.395 3 94 1.86 95.25 3.415 4 94.75 2.9 96.5 4.15
Sample LabGerm (PC) TFL-PC
Germ (no PC)
TFL - No PC
Growout from SRF (No PC)
DNA on 3,000 seeds
6 8 90.5 0.28 90 0.56
2 perennial 0 annual
Estimated ARG=0.18%
6 10 91.75 0.27 94.75 06 6 92.25 0.54 89.75 0.566 9 90.25 0.27 6 2 93.5 0.53 91.25 06 5 93 0.27 93 0.276 12 94.5 0.26 91.5 0.556 3 88.5 0 90.75 0.556 4 92.75 0.81 91.75 0.27
Sample LabGerm (PC) TFL-PC
Germ (no PC)
TFL - No PC
Growout from SRF (No PC)
DNA on 3,000 seeds
7 8 94.25 0.53 90 0.28
No growout
Estimated ARG=0.13%
7 10 92.75 0 97 07 6 90.25 0 91.5 0.277 9 91 0.27 7 2 93 0 91.75 0.277 5 89.25 0 92.25 0.817 12 93.25 0 90.75 0.287 3 89.25 0 89.75 07 4 90.25 0.28 92.75 0
Results: Samples 5, 6 and 7
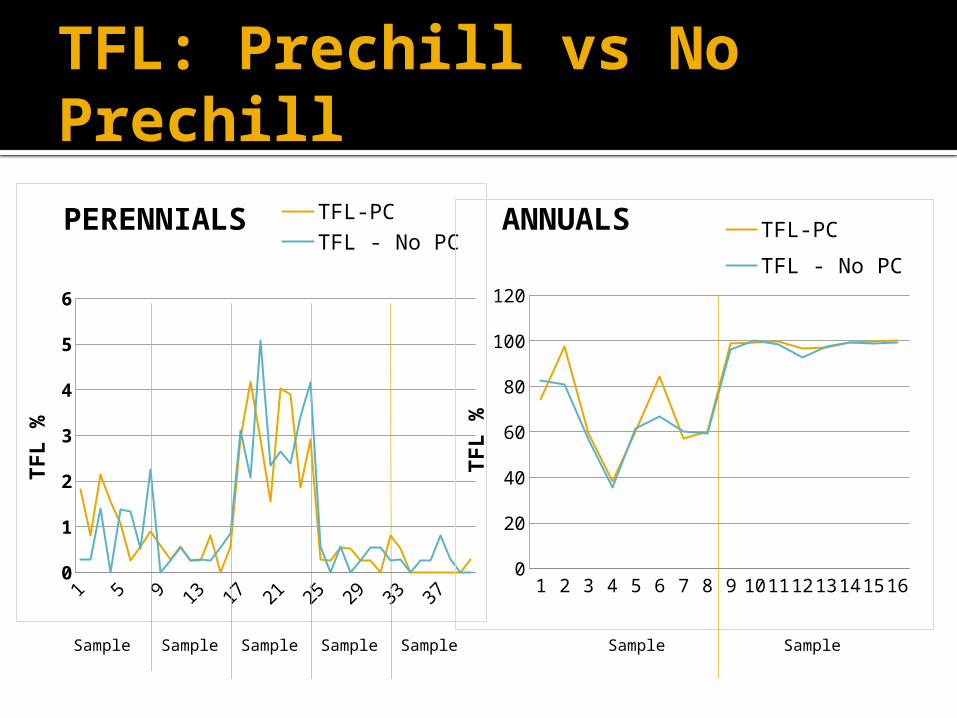
TFL: Prechill vs No Prechill
PERENNIALS ANNUALS
1 5 9 13 17 21 25 29 33 370
1
2
3
4
5
6
TFL-PCTFL - No PC
TFL %
1 3 5 7 9 11 13 150
20
40
60
80
100
120
TFL-PC
TFL - No PC
TFL %
SampleSample Sample Sample Sample Sample Sample
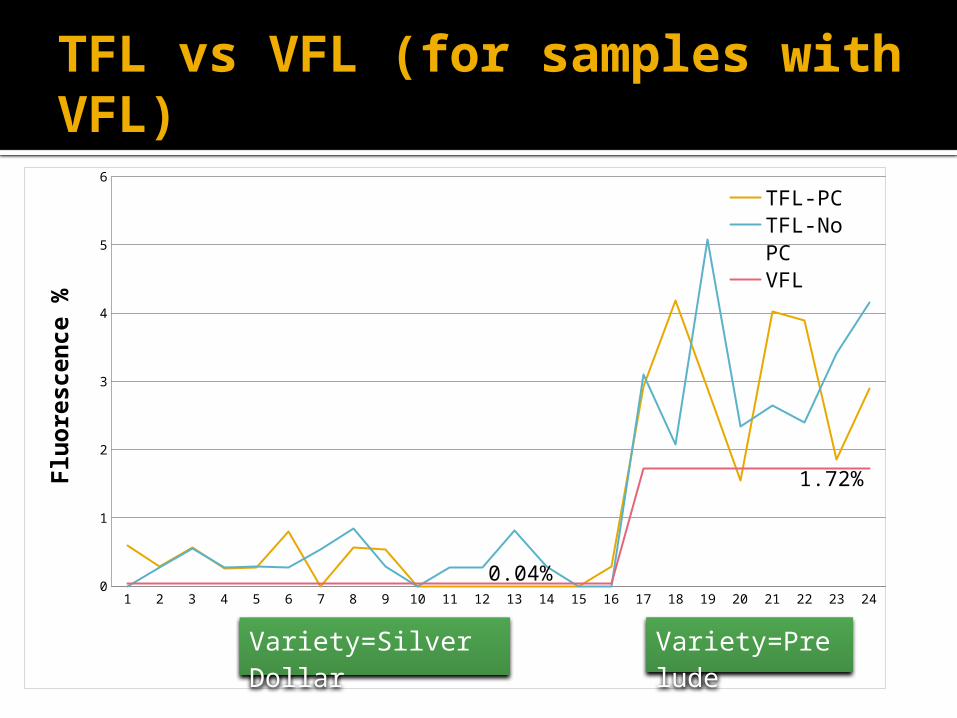
TFL vs VFL (for samples with VFL)
1 2 3 4 5 6 7 8 9 10 11 12 13 14 15 16 17 18 19 20 21 22 23 240
1
2
3
4
5
6
TFL-PCTFL-No PCVFL
Flu
ore
scen
ce %
Variety=Silver Dollar
Variety=Prelude
1.72%
0.04%
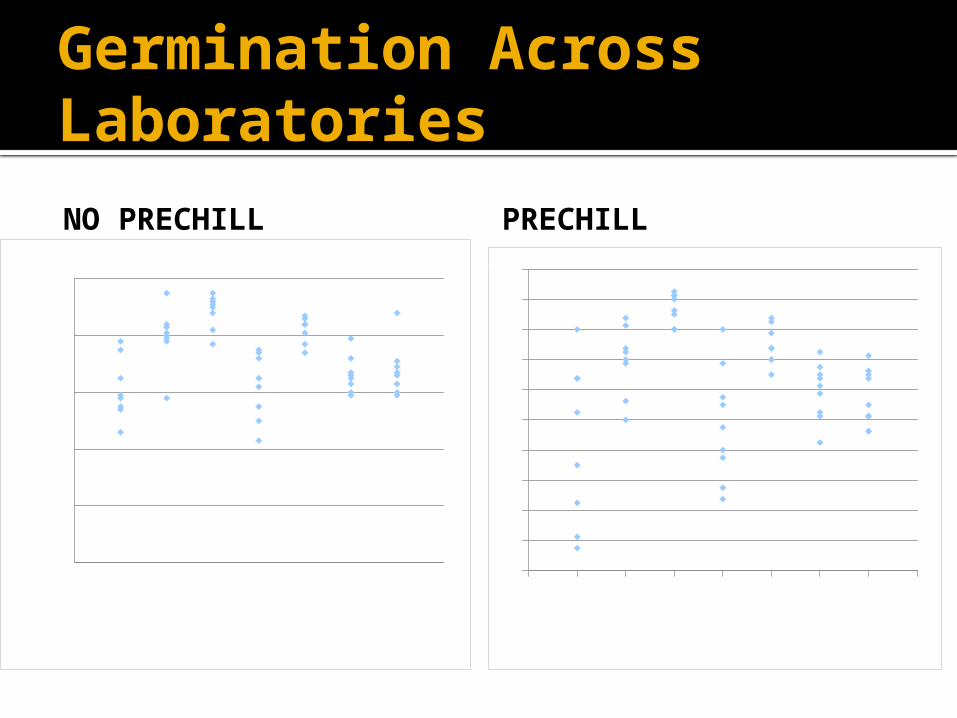
Germination Across Laboratories
NO PRECHILL PRECHILL
0 1 2 3 4 5 6 7 875
80
85
90
95
100
Sample0 1 2 3 4 5 6 7 8
80
82
84
86
88
90
92
94
96
98
100
Sample
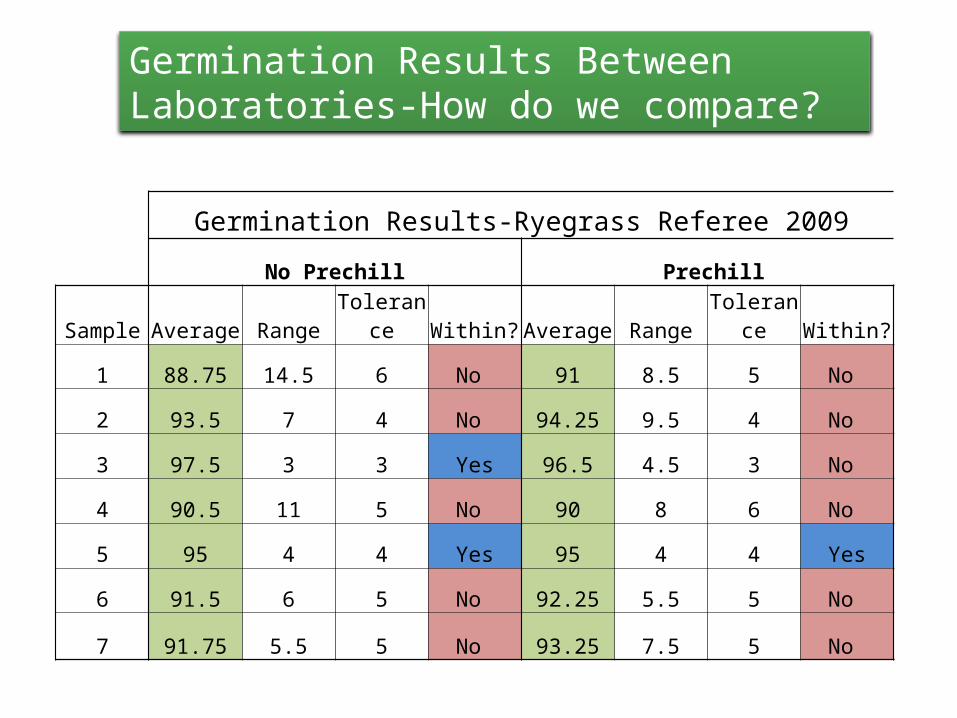
Germination Results-Ryegrass Referee 2009
No Prechill Prechill
Sample Average Range Tolerance Within? Average Range Tolerance Within?
1 88.75 14.5 6 No 91 8.5 5 No
2 93.5 7 4 No 94.25 9.5 4 No
3 97.5 3 3 Yes 96.5 4.5 3 No
4 90.5 11 5 No 90 8 6 No
5 95 4 4 Yes 95 4 4 Yes
6 91.5 6 5 No 92.25 5.5 5 No
7 91.75 5.5 5 No 93.25 7.5 5 No
Germination Results Between Laboratories-How do we compare?
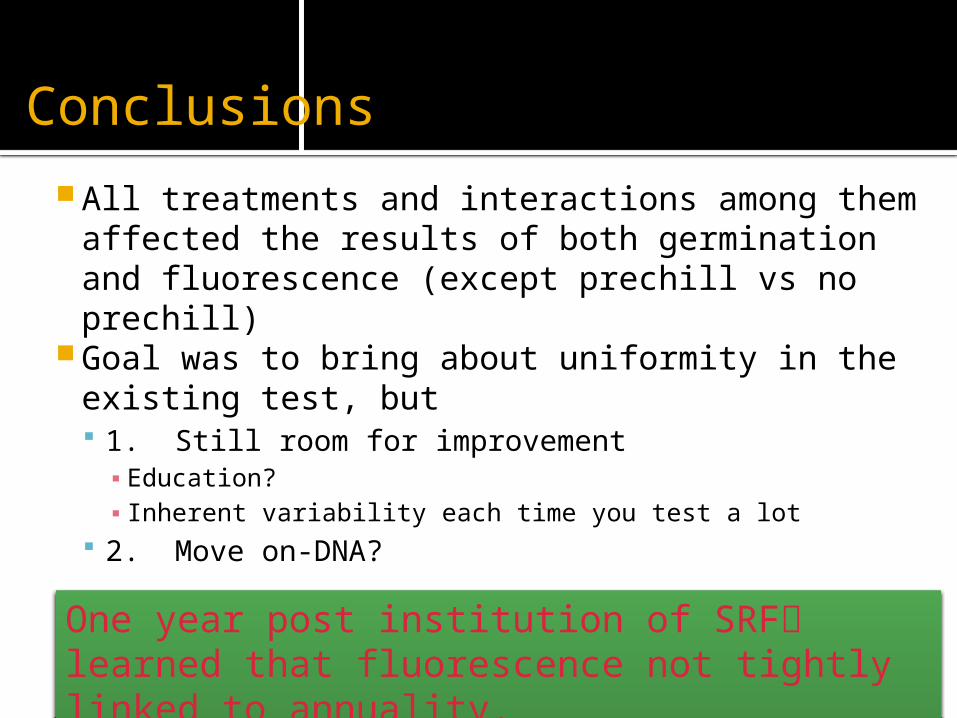
Referee Conclusions
All treatments and interactions among them affected the results of both germination and fluorescence (except prechill vs no prechill)
Goal was to bring about uniformity in the existing test, but 1. Still room for improvement
▪ Education?▪ Inherent variability each time you test a lot
2. Move on-DNA?
One year post institution of SRF learned that fluorescence not tightly linked to annuality.
Ryegrass Testing-Genetic Testing Methods
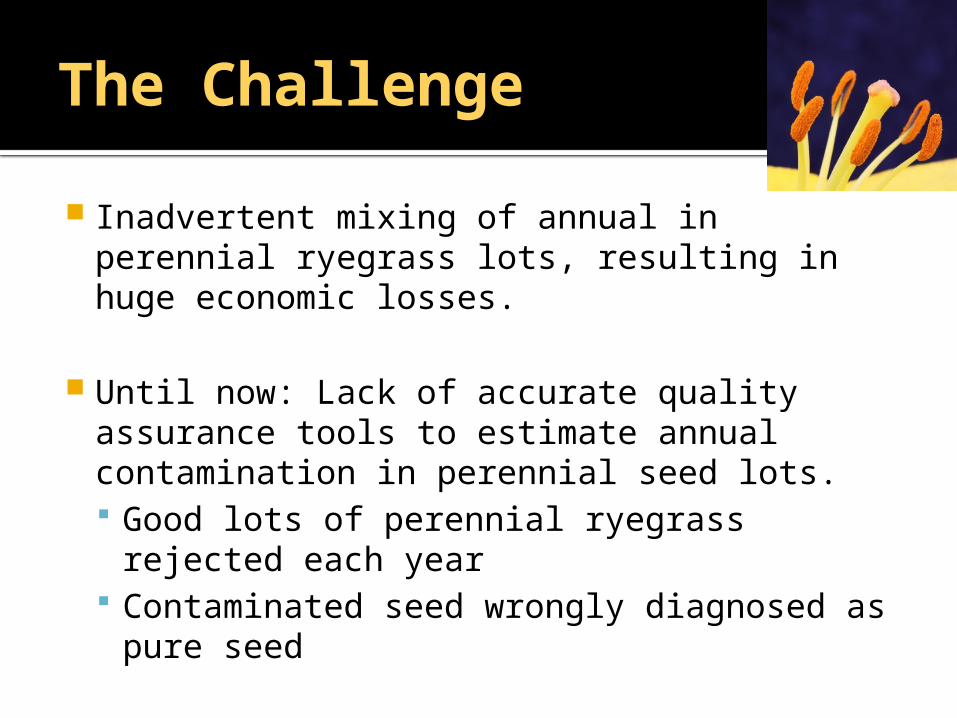
The Challenge
Inadvertent mixing of annual in perennial ryegrass lots, resulting in huge economic losses.
Until now: Lack of accurate quality assurance tools to estimate annual contamination in perennial seed lots. Good lots of perennial ryegrass rejected each year Contaminated seed wrongly diagnosed as pure seed
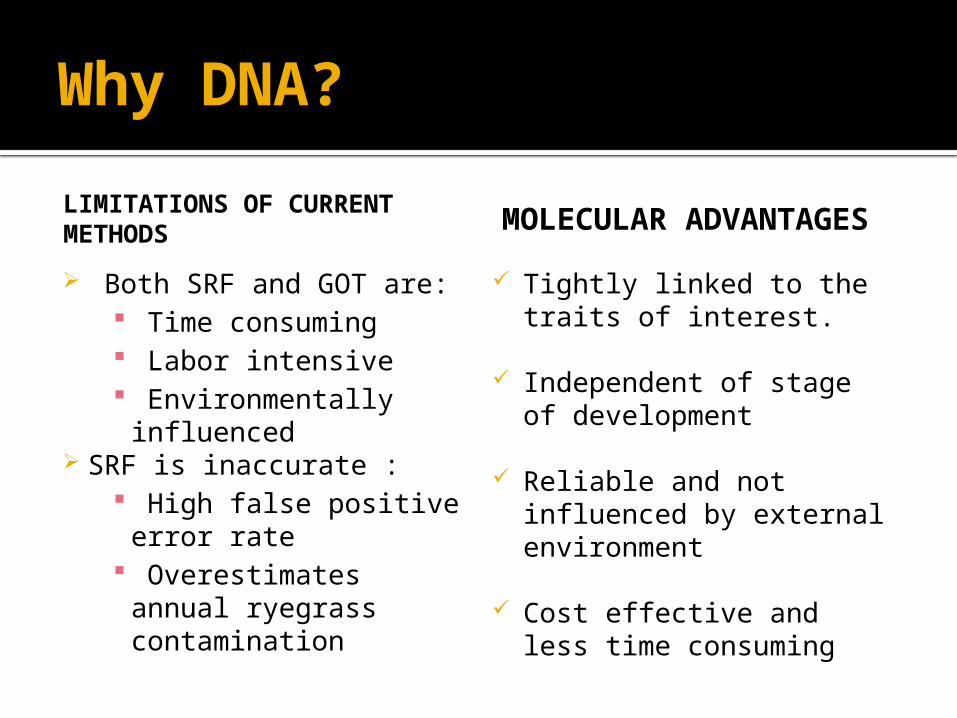
Why DNA?
LIMITATIONS OF CURRENT METHODS
Both SRF and GOT are: Time consuming Labor intensive Environmentally
influenced SRF is inaccurate :
High false positive error rate
Overestimates annual ryegrass contamination
MOLECULAR ADVANTAGES
Tightly linked to the traits of interest.
Independent of stage of development
Reliable and not influenced by external environment
Cost effective and less time consuming
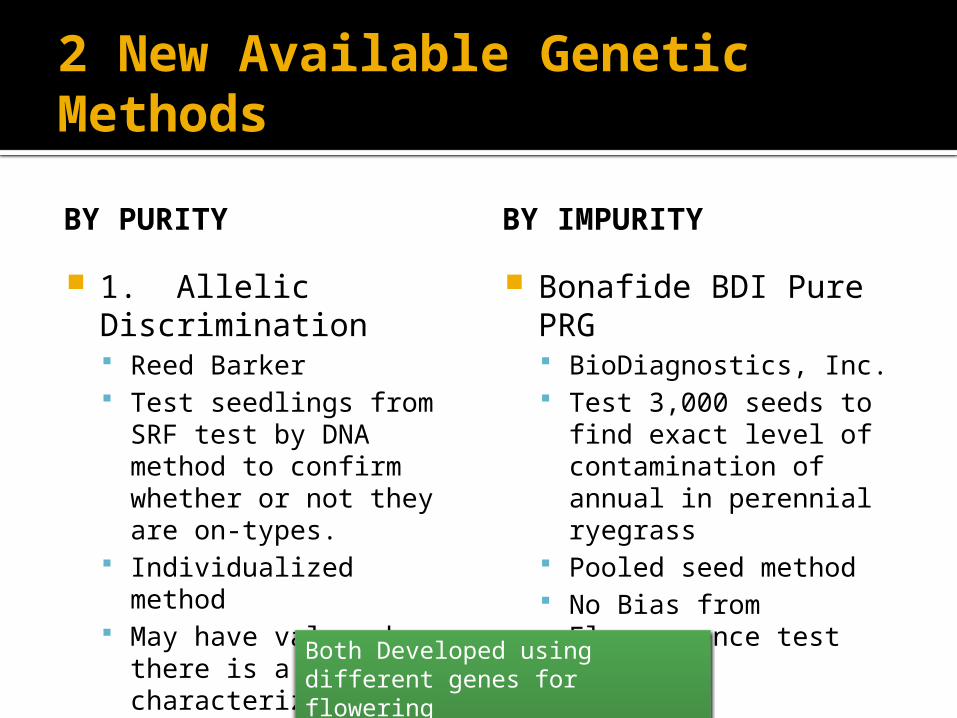
2 New Available Genetic Methods
BY PURITY
1. Allelic Discrimination Reed Barker Test seedlings from SRF
test by DNA method to confirm whether or not they are on-types.
Individualized method May have value when
there is a need for characterizing individual seedlings to type
BY IMPURITY
Bonafide BDI Pure PRG BioDiagnostics, Inc. Test 3,000 seeds to find
exact level of contamination of annual in perennial ryegrass
Pooled seed method No Bias from
Fluorescence test
Both Developed using different genes for flowering
Bonafide BDI-Pure PRG
Currently, this test is offered by BioDiagnostics, Inc.
Goal- to license method to other labs. To ensure accuracy and uniformity in
testing, Oregon State Seed Lab will partner BDI to validate all labs providing this service in the future.
Start up costs will limit the number of labs offering the test until there is more demand in the marketplace.
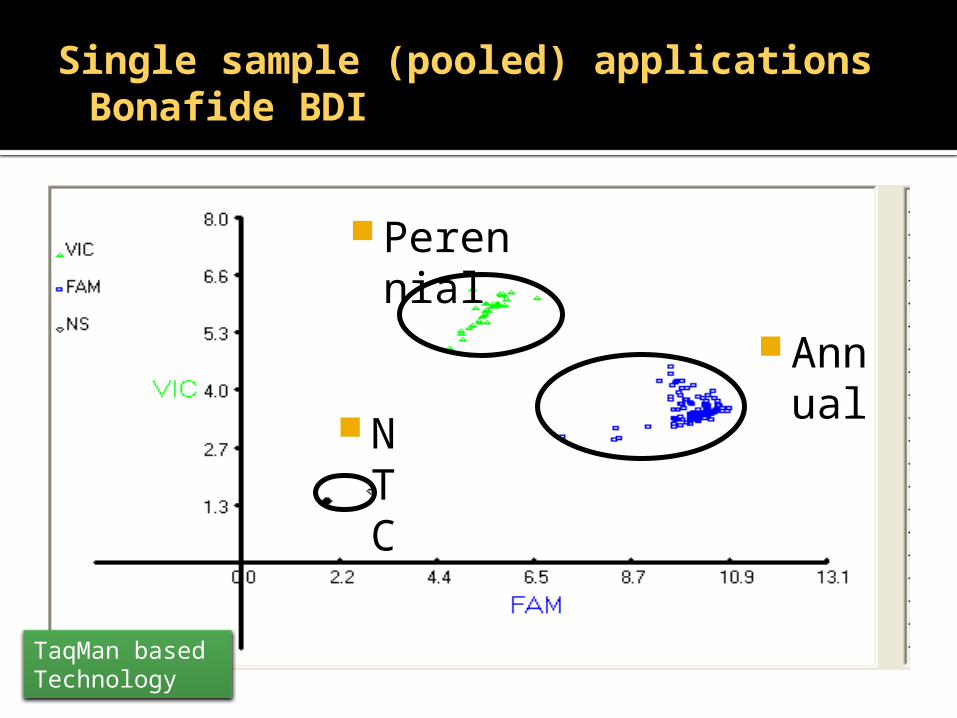
Single sample (pooled) applications Bonafide BDI
Perennial
Annual N
TC
TaqMan based Technology
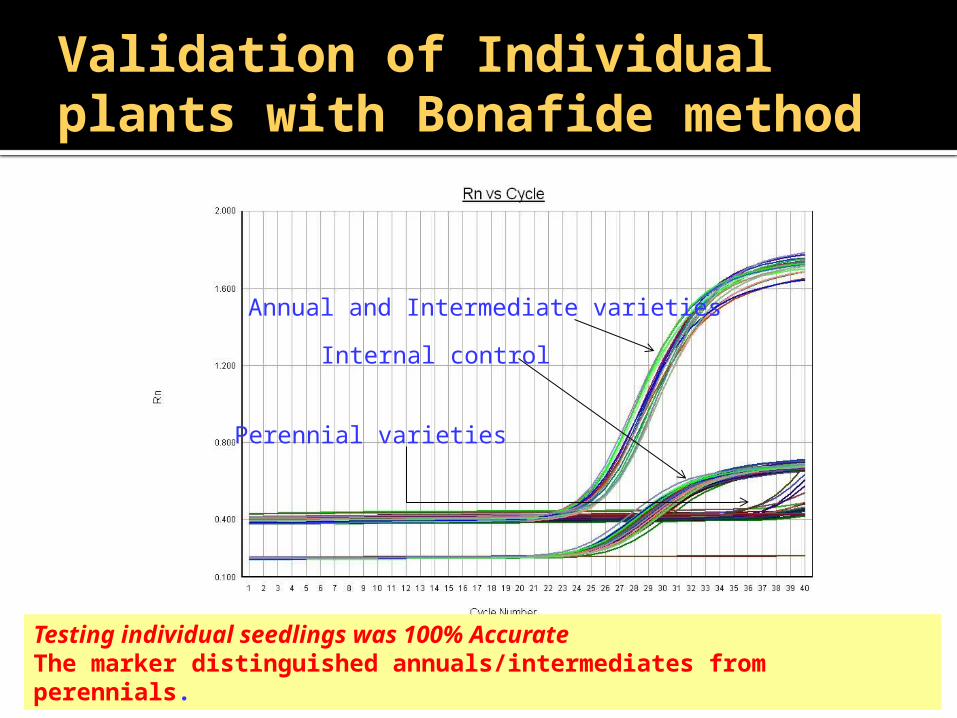
Validation of Individual plants with Bonafide method
Annual and Intermediate varieties
Internal control
Perennial varieties
Testing individual seedlings was 100% AccurateThe marker distinguished annuals/intermediates from perennials.
How? DNA for Producing Pure PRG
What is the benefit to producers? Rapid, accurate assessment of quality
(as opposed to an inaccurate, variable SRF test) Use this test to produce a premium product
Start with a clean seed source using DNA test Take advantage cold winters that eliminate
annual contamination Replace a commodity with a premium product Demand a premium price Enhance profitability by creating a niche in the
marketplace
Conclusions The SRF test originally designed to detect annual ryegrasscontamination is no longer a reliable indicator of annual
types.
Bonafide BDI™ – Pure PRG™ is highly sensitive, rapid,accurate and cost effective (≈$70/sample) procedure for
detecting annualryegrass contamination in perennial ryegrass.
The ability of this test to detect contamination in both pooled
and individual seedlings makes it an attractive tool for bothryegrass growers and ryegrass breeders.
Meeting legal requirements keeps fluorescence test in use.
In the worksGetting DNA methods into Cultivar Purity Handbook for use on tags and reports-gathering and using collection of valuable information

Thank you!
Questions?