Embed Size (px)
Citation preview
Swing with the MarketsTrading the Measured Move (ABCD)
Arthur MarcusJuly 17, 2018
Disclaimer: Neither TradersMeetup.net nor any of its hosts, organizers, guests, presenters or other such representatives is, in such capacities, a licensed financial adviser, registered investment adviser, registered broker-dealer nor FINRA | SIPC | NFA-member firm. TradersMeetup.net and Arthur Marcus do not provide investment or financial advice or make investment recommendations. TradersMeetup.net is not in the business of transacting trades, nor does TradersMeetup.net agree to direct your brokerage accounts or give trading advice tailored to your particular situation. Nothing contained in our content constitutes a solicitation, recommendation, promotion, or endorsement of any particular security, other investment product, transaction or investment.
Trading Futures, Options on Futures, and retail off-exchange foreign currency transactions involves substantial risk of loss and is not suitable for all investors. You should carefully consider whether trading is suitable for you in light of your circumstances, knowledge, and financial resources. You may lose all or more of your initial investment. Opinions, market data, and recommendations are subject to change at any time.
PAST PERFORMANCE IS NOT NECESSARILY INDICATIVE OF FUTURE RESULTS.
Disclaimer
Tonight’s Presentation● My Background
● Building a Successful Trading Strategy
● The “Trading Triangle” – three key elements of successful trading
● How Price Action Leads to The Measured Move
● The Measured Move
● How the Measured Move defines specific entries, targets and stop losses
● Cycles
● Swinging with the markets – Multiple Time Frames
● TQ - The Trust Quotient - Probability, Risk, Consistency
Background● Full-time professional trader for 18 years
● How I Came To Trading
● My First Trade
● Use technical analysis and price action to trade both futures and stocks
● Developed a proprietary system for analyzing and trading the financial markets
● System based on a well-known pattern called the Measured Move (the ABCD pattern)
Building A Successful Trading Strategy
An Edge95% Failure
What Strategy

An Edge or A Strategy
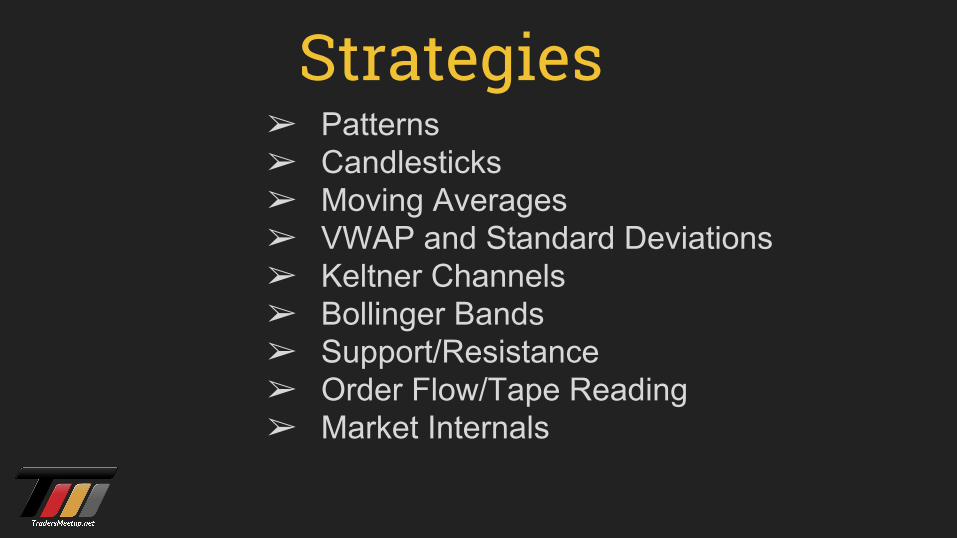
Strategies➢ Patterns➢ Candlesticks➢ Moving Averages➢ VWAP and Standard Deviations➢ Keltner Channels➢ Bollinger Bands➢ Support/Resistance➢ Order Flow/Tape Reading➢ Market Internals

10,000 HoursWrite it Down
Dancing, Cursing or PrayingSolitary
Westside LA Lonely Hearts Club
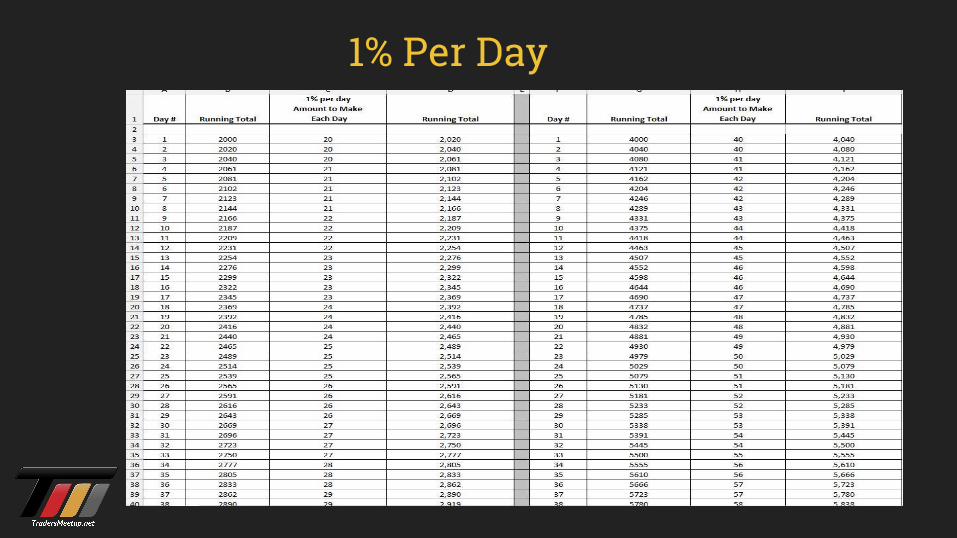
1% Per Day
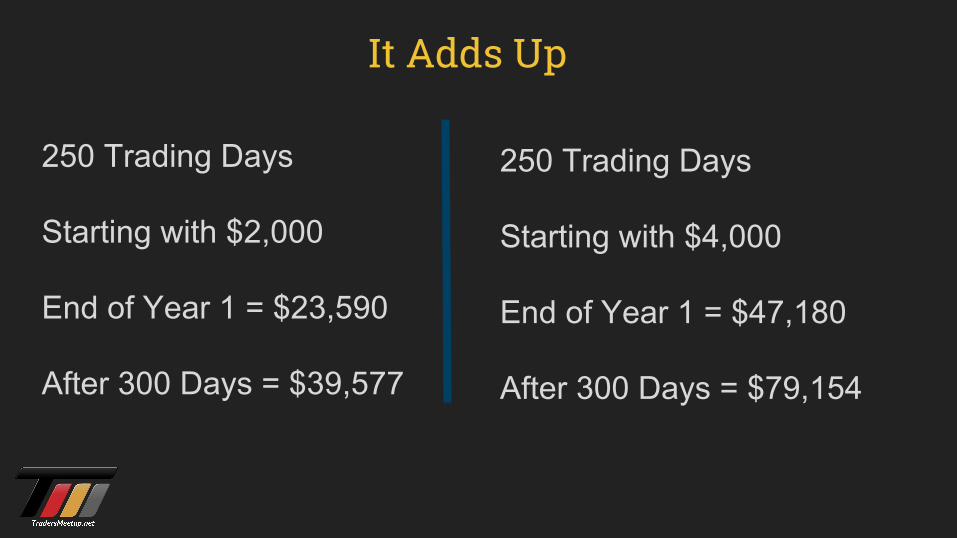
It Adds Up
250 Trading Days
Starting with $2,000
End of Year 1 = $23,590
After 300 Days = $39,577
250 Trading Days
Starting with $4,000
End of Year 1 = $47,180
After 300 Days = $79,154
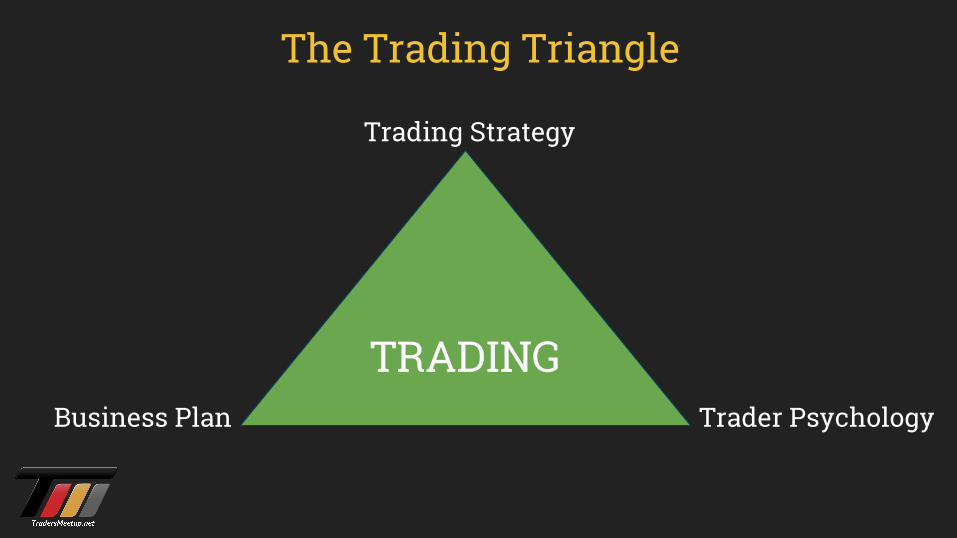
The Trading Triangle
TRADINGBusiness Plan
Trading Strategy
Trader Psychology
Trading is a Business
Trading is a business, just like Target or Tiffany’s, where you buy and sell inventory.
If the inventory doesn’t sell, you get rid of it, sometimes at a loss.
Then you find new inventory that will create more profit.
A written business plan
To be competitive:● A clearly defined plan
● The discipline to trade that plan
A written business plan (cont).
A business plan prepares traders to make decisions about what to trade and how to trade.
● Identify and capitalize on trading strengths● Eliminate trading weaknesses
The business plan should also include:
● A trading journal or● A spreadsheet describing each trade
Risk Control
Non Professional trader asks:
“How much can I make?”
Professional trader asks:
“How much can I lose?”
Define Risk
● Factor loss into the trading plan.
● Define risk to make unemotional, informed and strategic decisions in the heat of battle.
● Use stops based on the market structure and the charts.
Price Action
● Price action is a way to find order in the random movement of price.
● Swings (high and low), tests of support and resistance are examples of price action.
Price Action
Higher Highs and Higher Lows
Lower Lows and Lower Highs
Probabilities
What do you expect to happen?
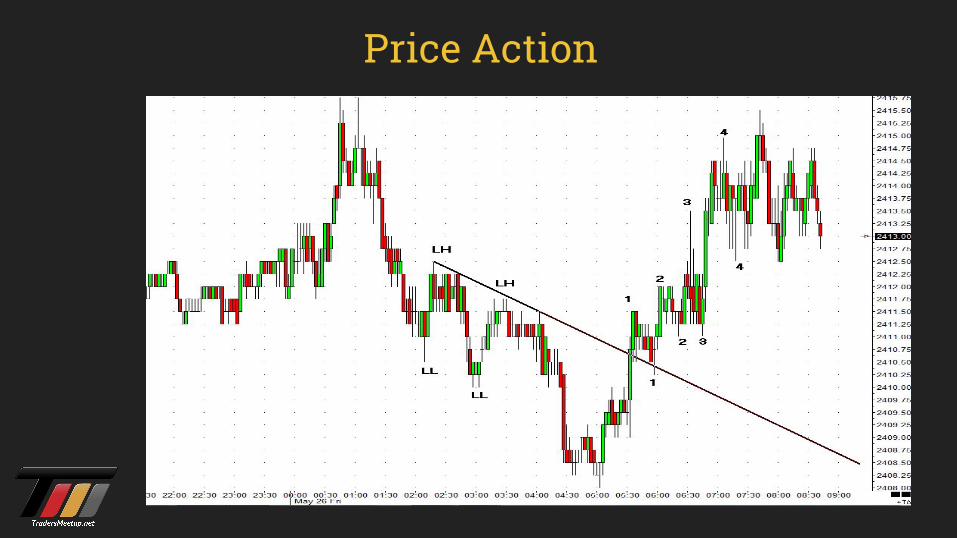
Price Action
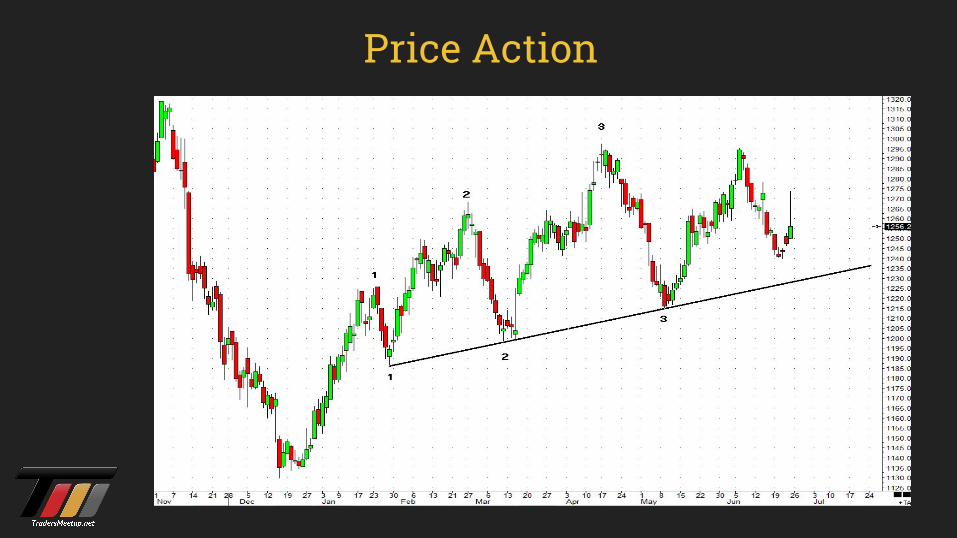
Price Action
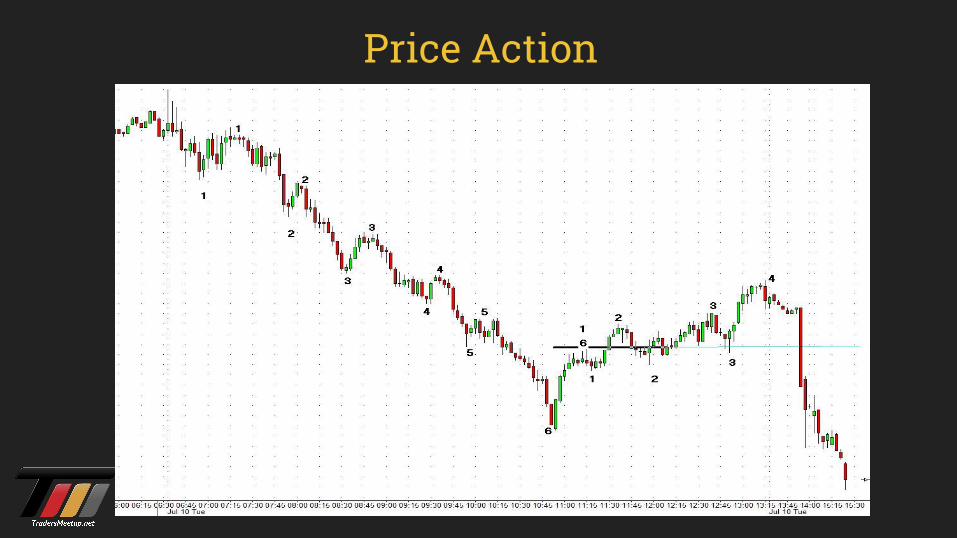
Price Action
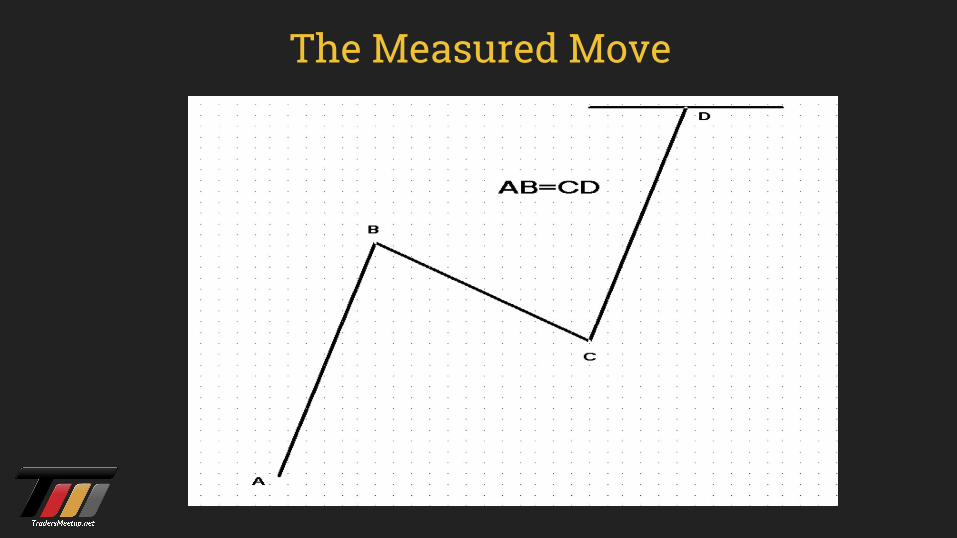
The Measured Move
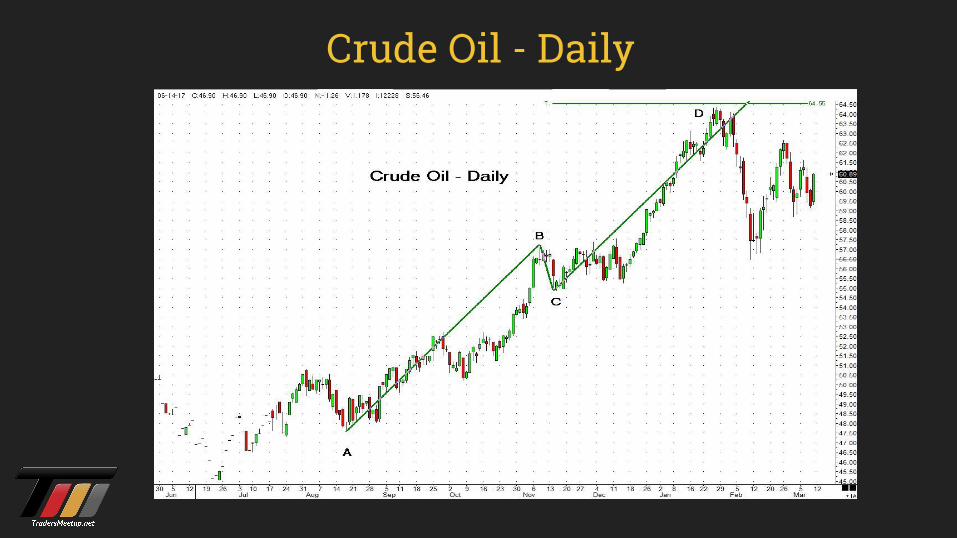
Crude Oil - Daily
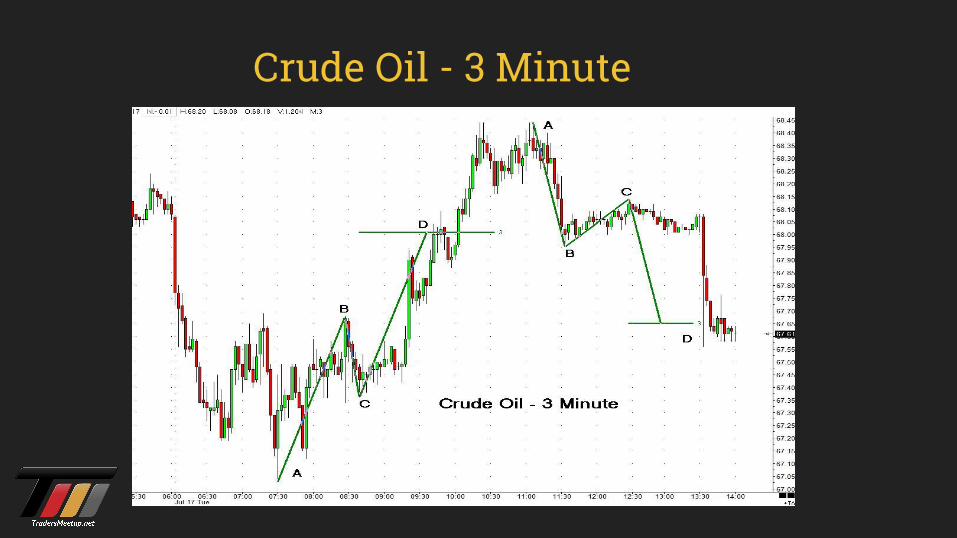
Crude Oil - 3 Minute
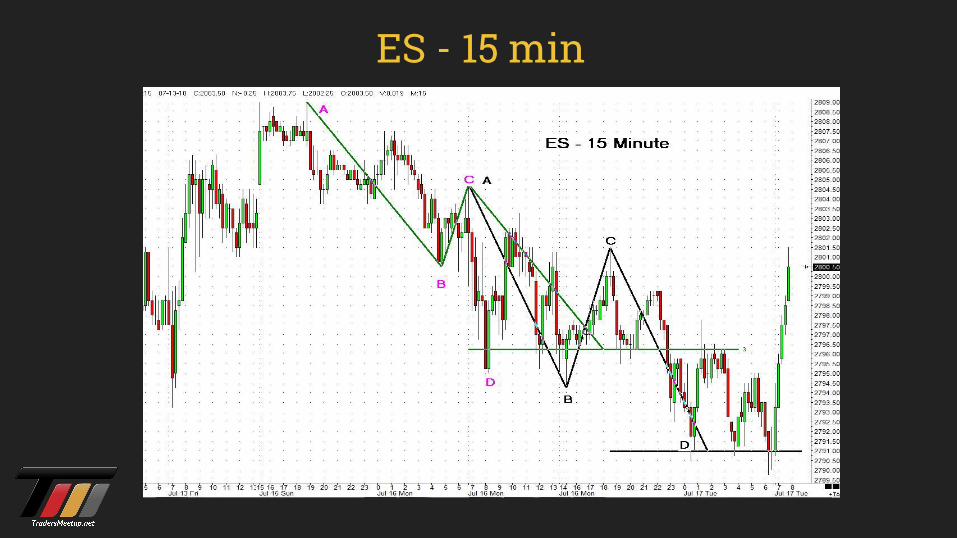
ES - 15 min
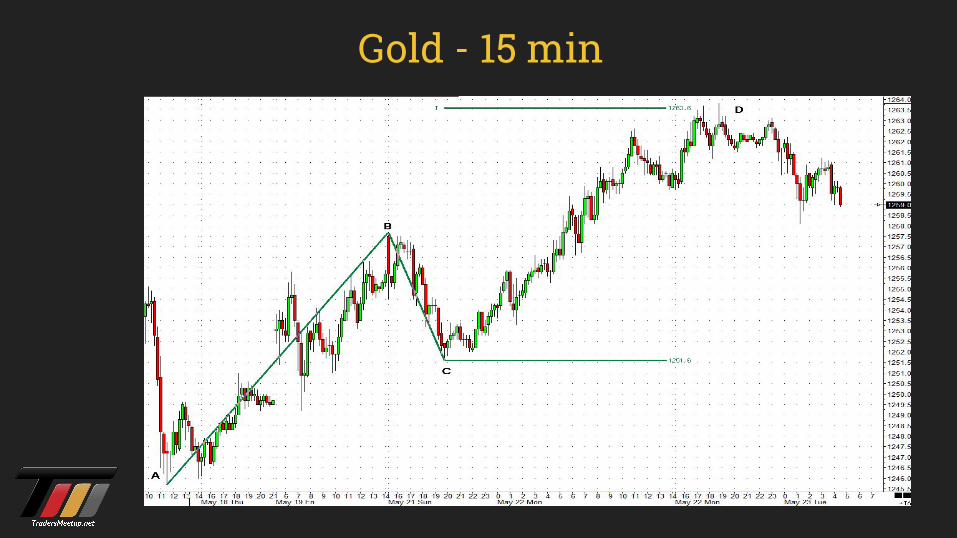
Gold - 15 min
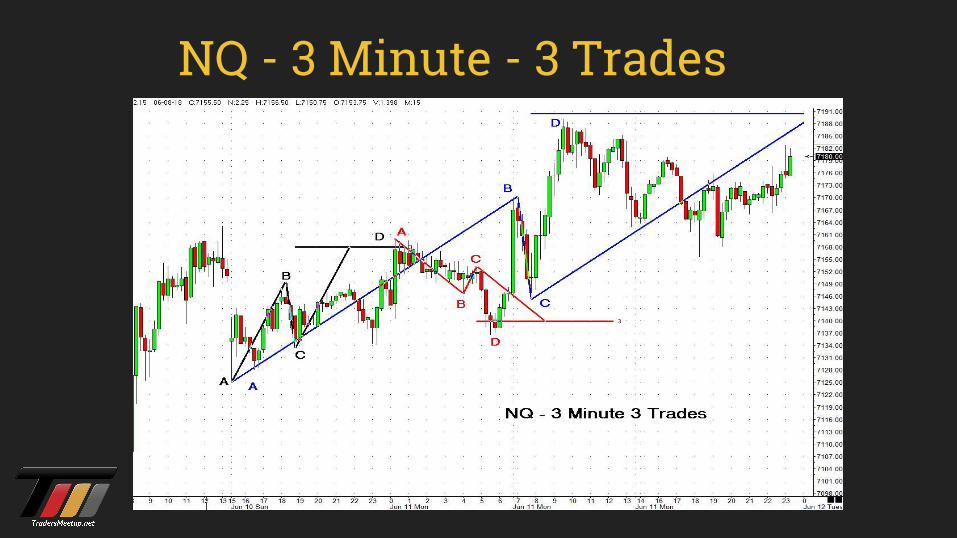
NQ - 3 Minute - 3 Trades
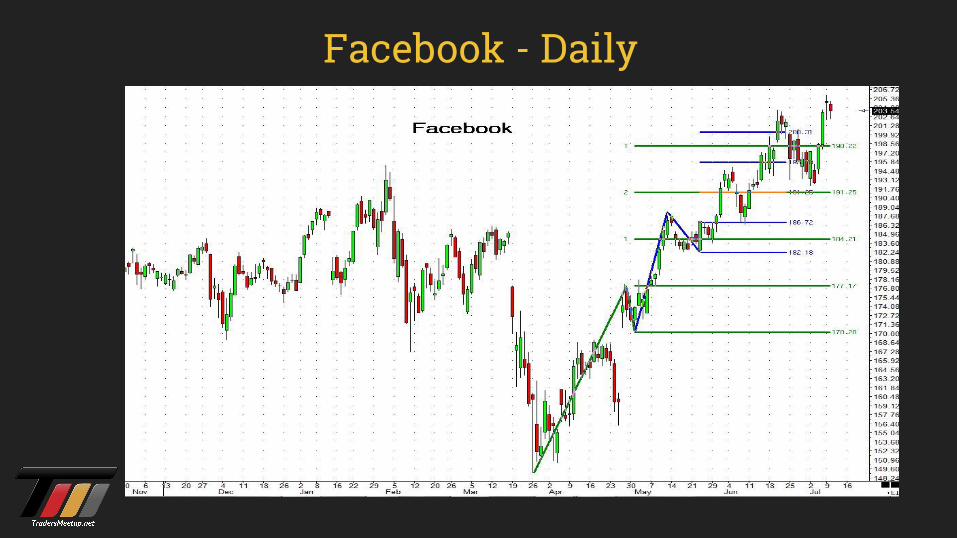
Facebook - Daily
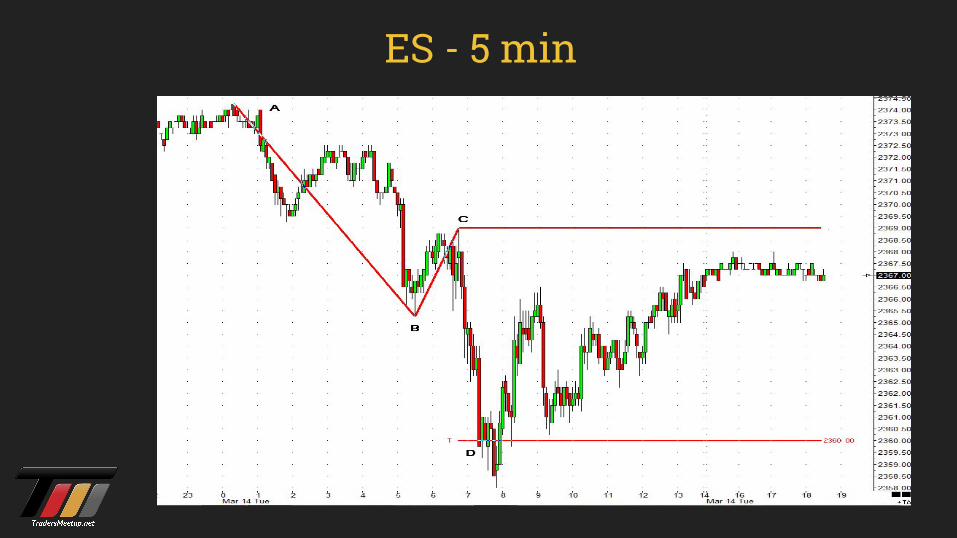
ES - 5 min
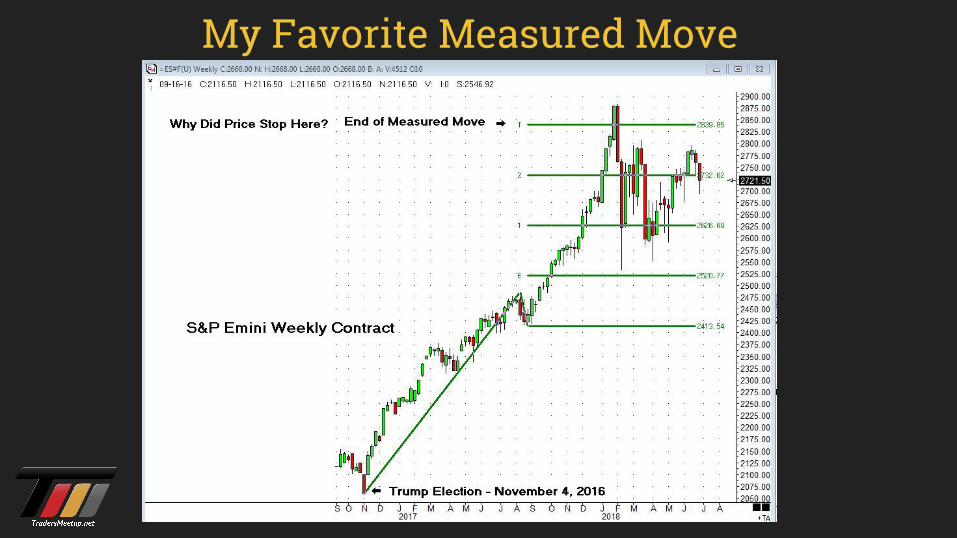
My Favorite Measured Move
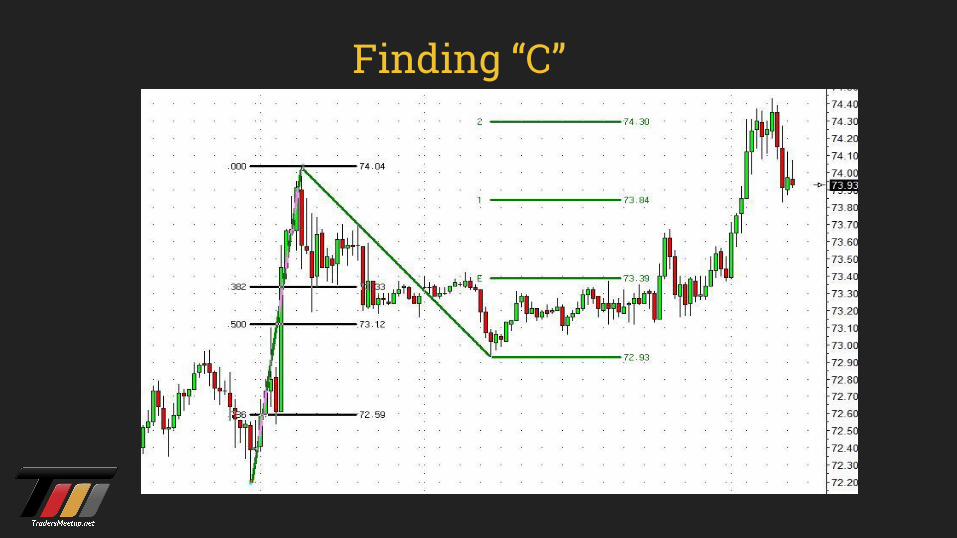
Finding “C”
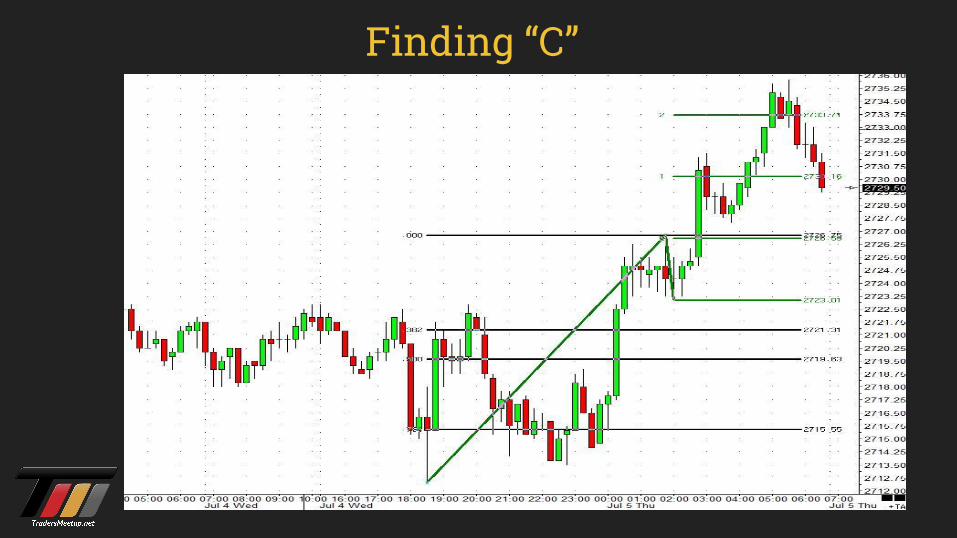
Finding “C”
The Basics
Entry PriceStop LossTargets
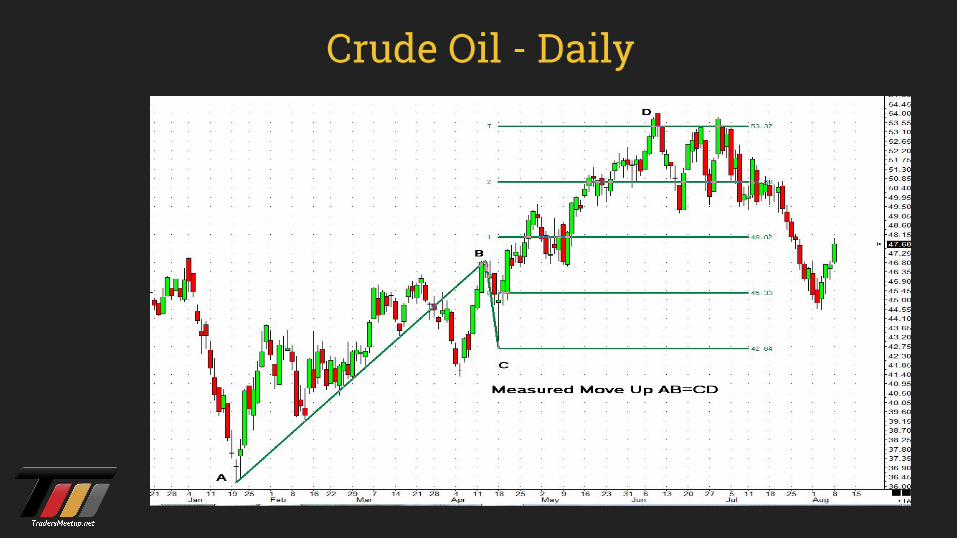
Crude Oil - Daily
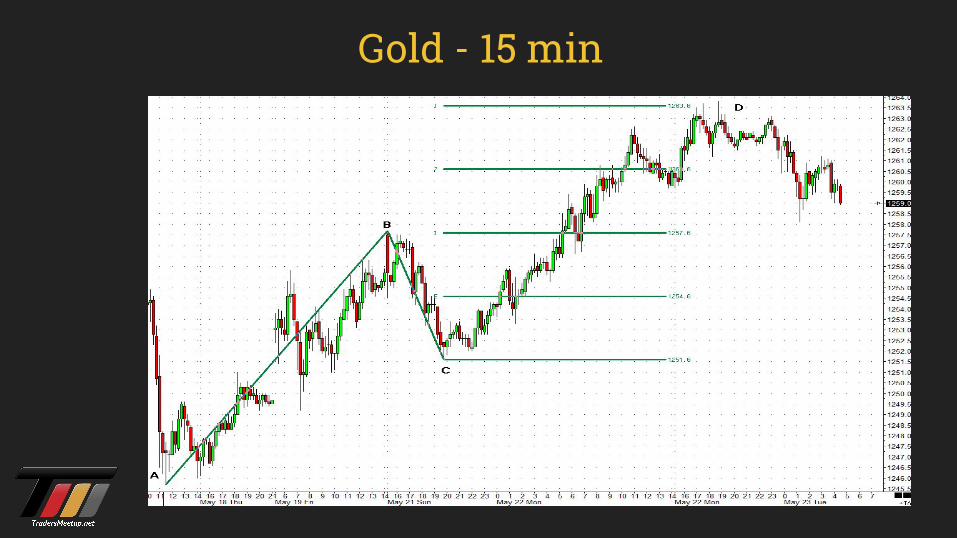
Gold - 15 min
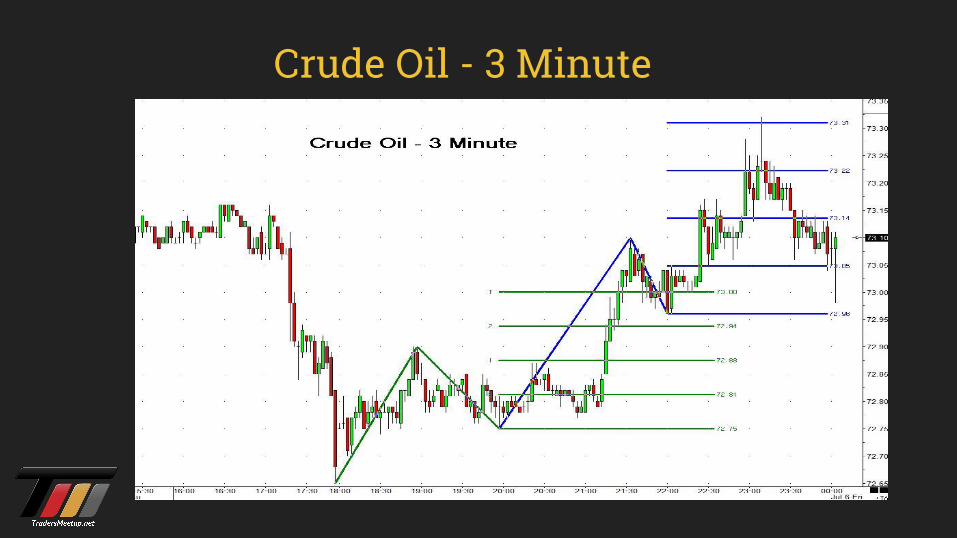
Crude Oil - 3 Minute
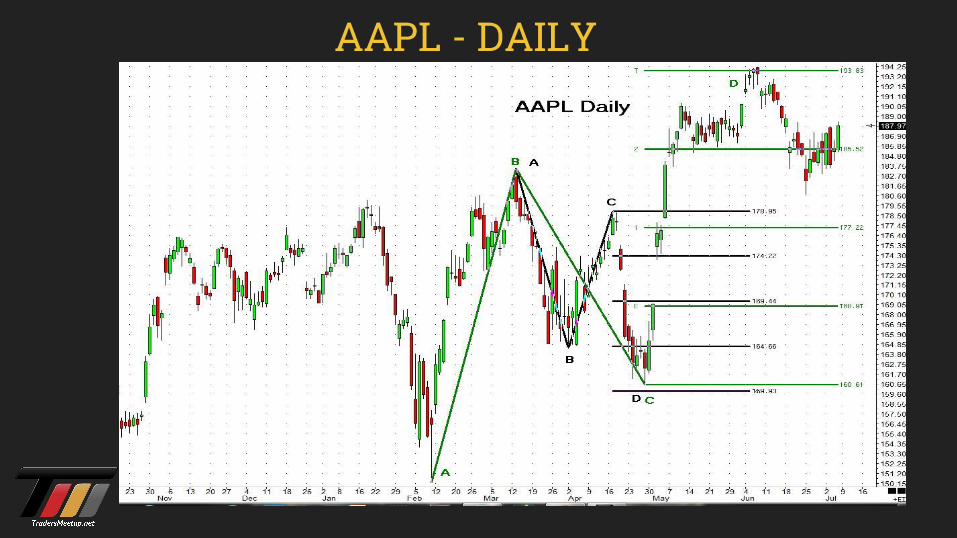
AAPL - DAILY
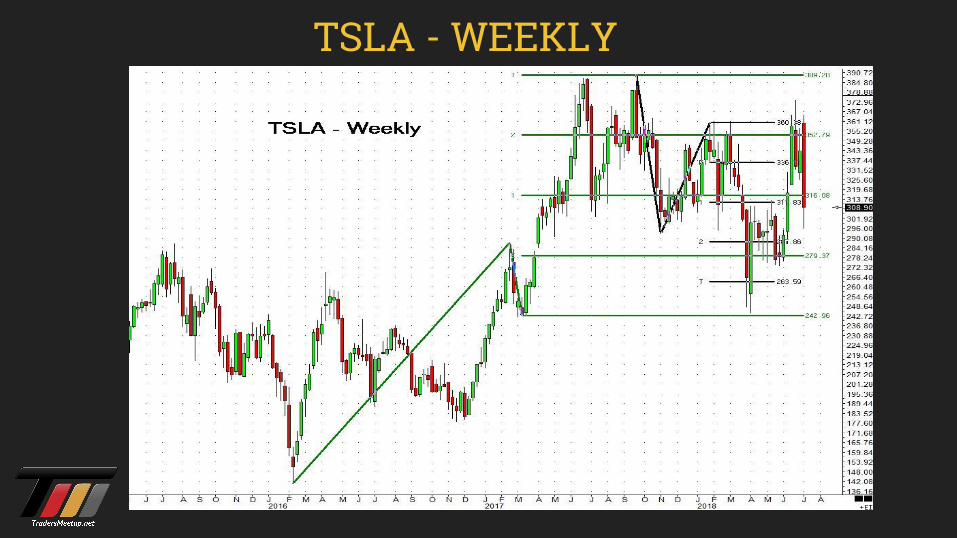
TSLA - WEEKLY
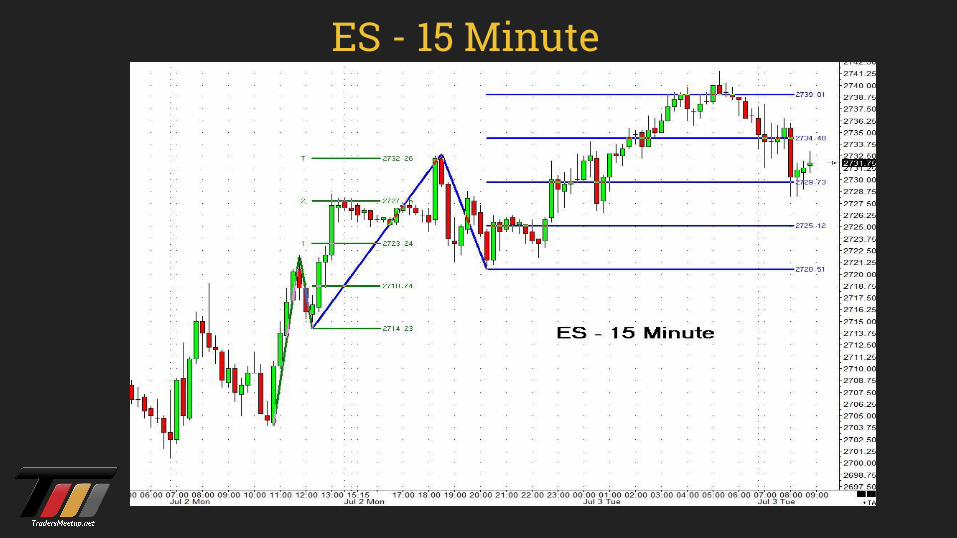
ES - 15 Minute
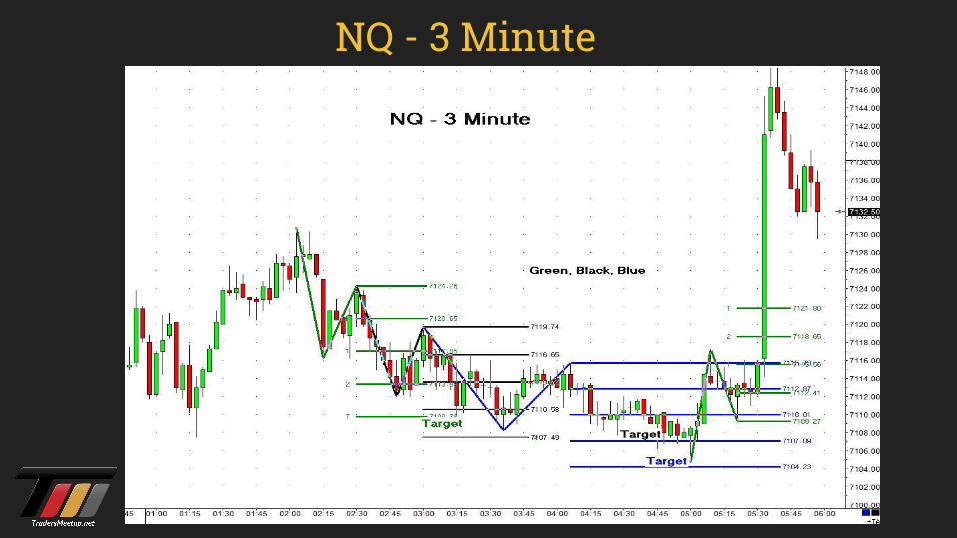
NQ - 3 Minute
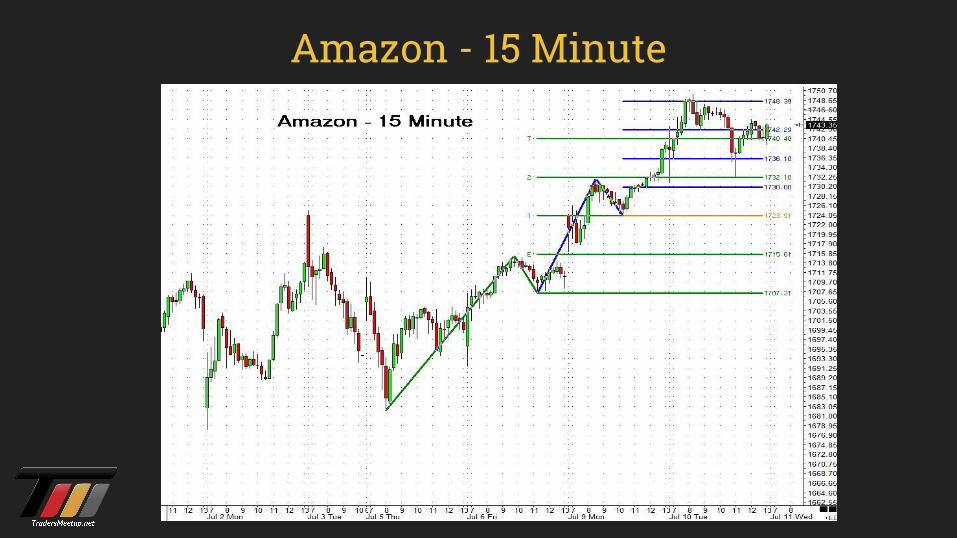
Amazon - 15 Minute
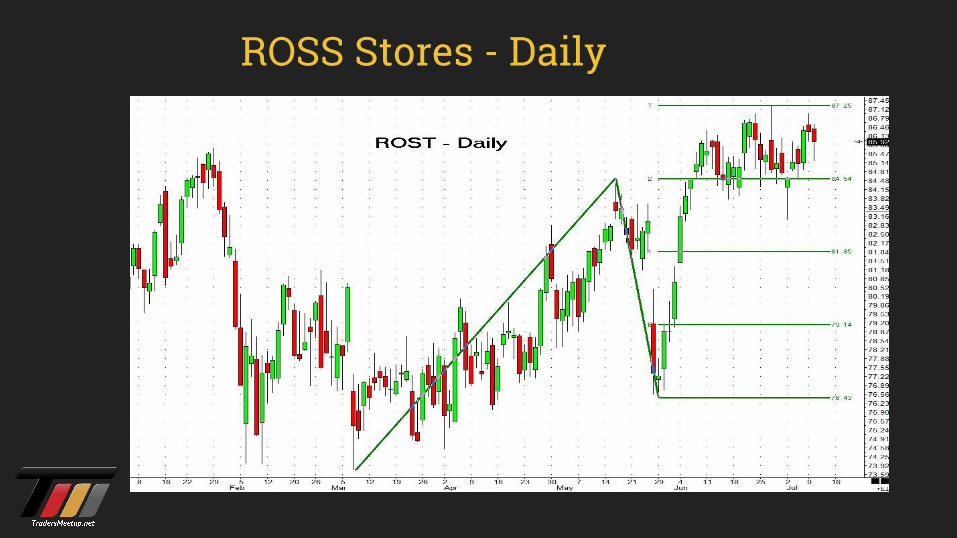
ROSS Stores - Daily
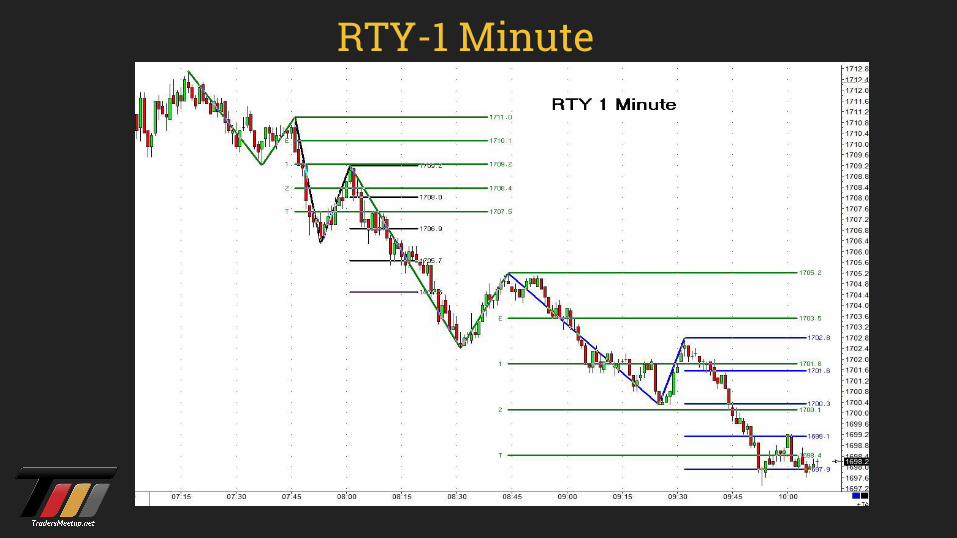
RTY-1 Minute
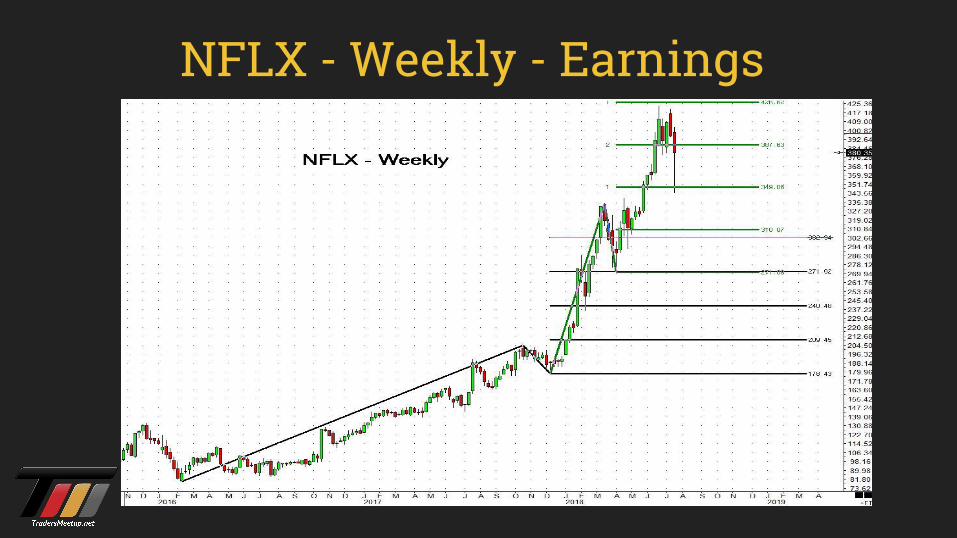
NFLX - Weekly - Earnings
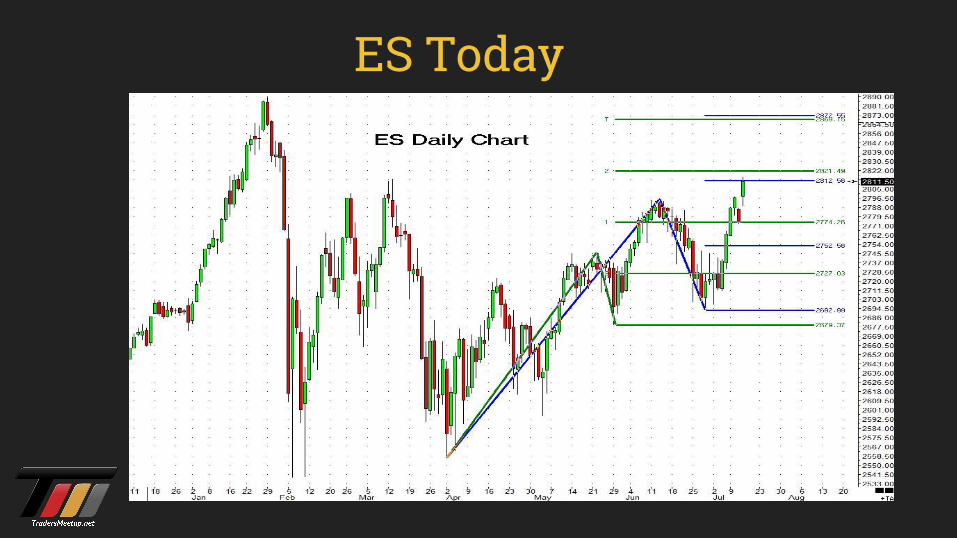
ES Today
CyclesHelps to determine “when” to enter or exit a trade
Lows (not Highs) are used to define cycle length
Cycle lows project future cycle Lows
A Low can be a Higher Low
Translation
Translation defines:
where the market will peak in its cycle.
Right Translation
The peak occurs during an up-trending market.
Price generally peaks in the latter part of the
cycle.
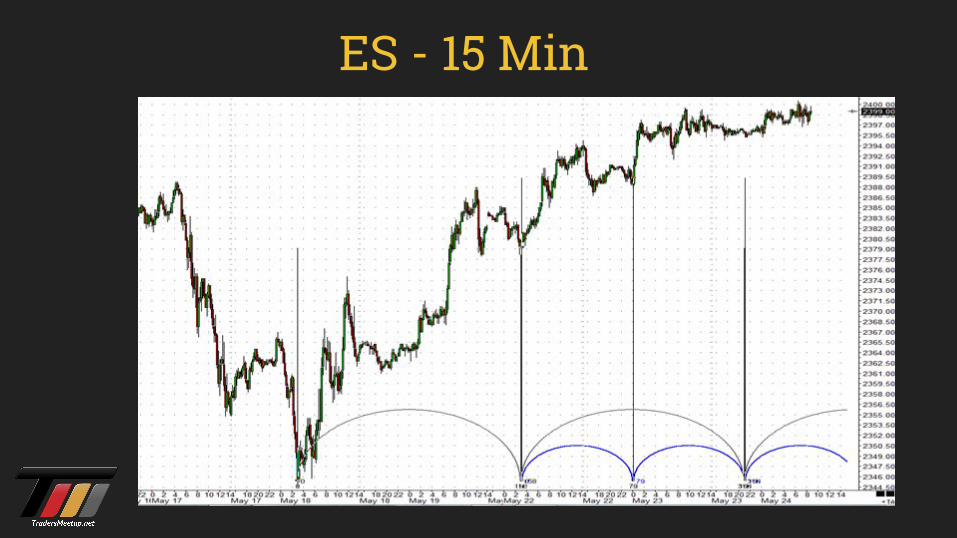
ES - 15 Min
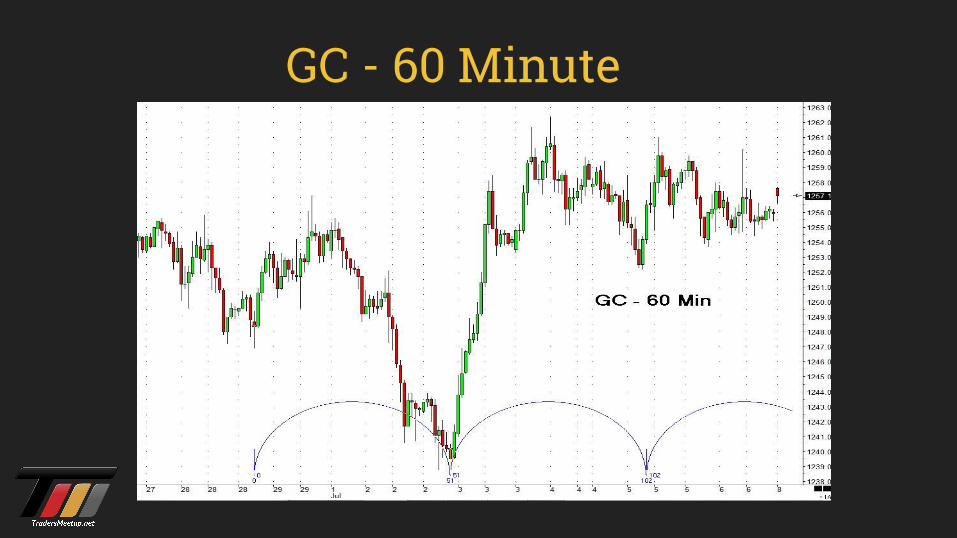
GC - 60 Minute
Left Translation
The peak occurs during a down-trending market.
Price generally peaks earlier or in the first few
bars of the cycle.
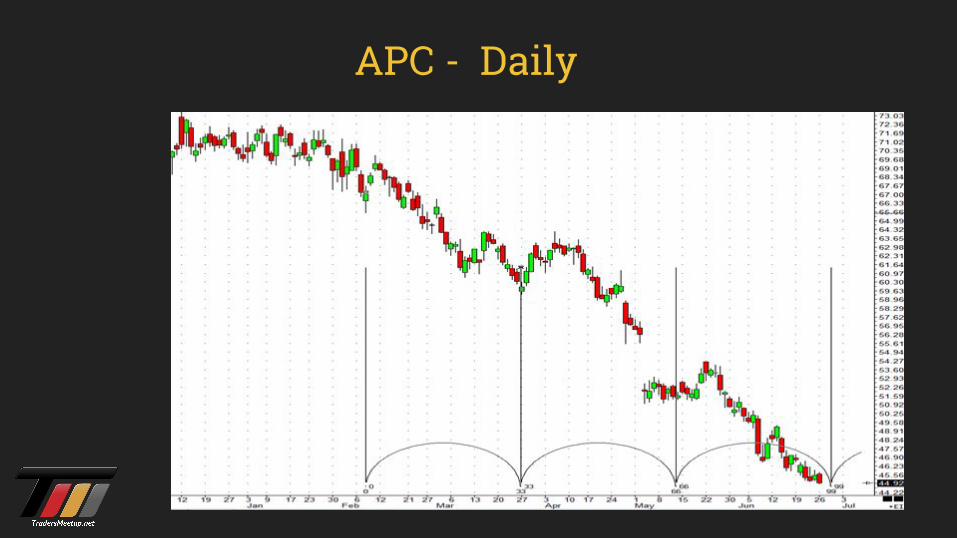
APC - Daily
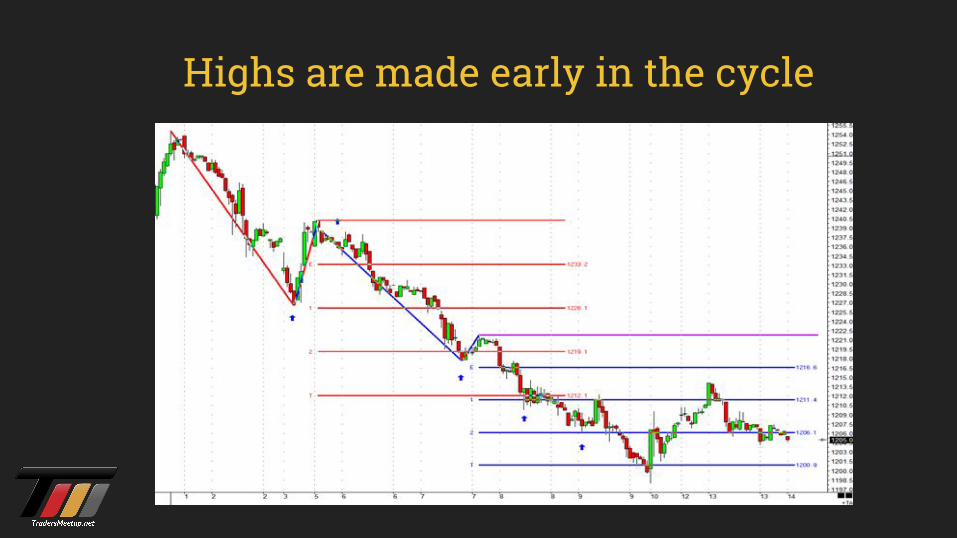
Highs are made early in the cycle
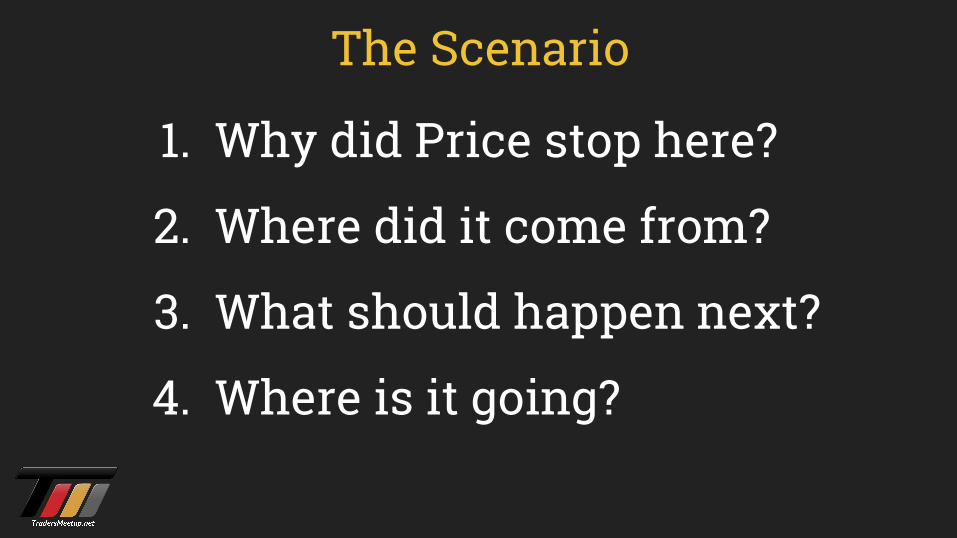
The Scenario
1. Why did Price stop here?
2. Where did it come from?
3. What should happen next?
4. Where is it going?
Swing with the Markets
Multiple Time Frames
What’s above? What’s below?
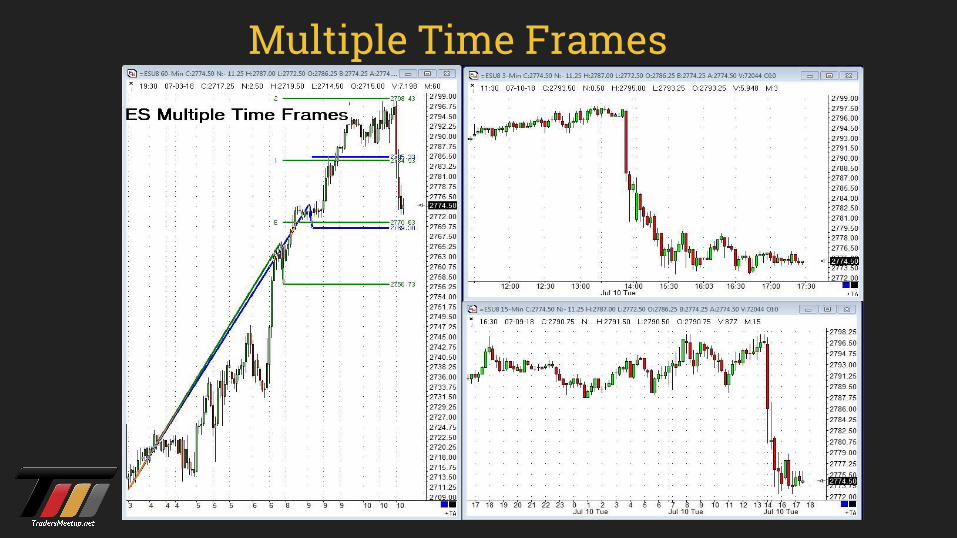
Multiple Time Frames
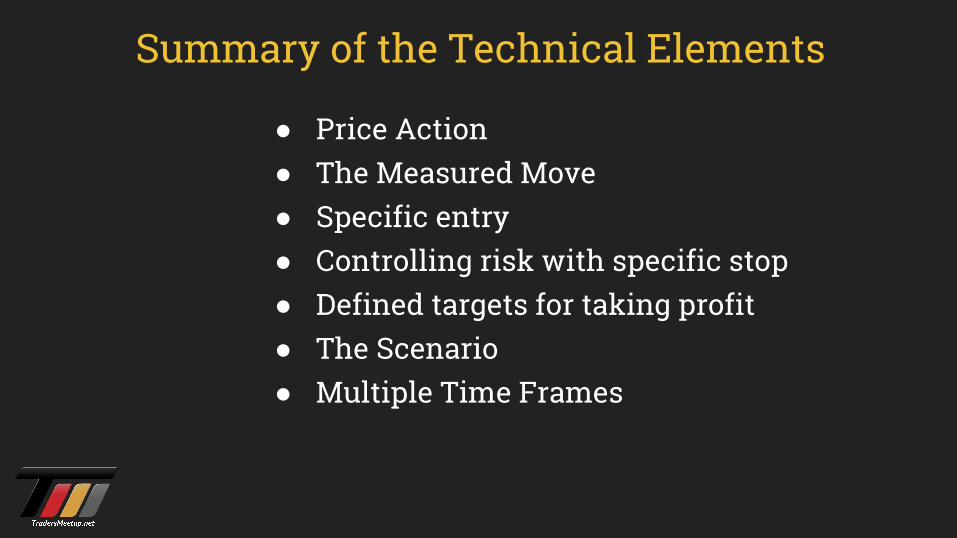
Summary of the Technical Elements
● Price Action● The Measured Move● Specific entry● Controlling risk with specific stop● Defined targets for taking profit● The Scenario● Multiple Time Frames
Just like an Intelligence Quotient (IQ), traders have a Trust Quotient (TQ).
● Have a trading plan● Follow the trading plan● Increase the Trust Quotient
TQ leads to confidence and confidence leads to success.
The Trust Quotient (TQ)

You have to know yourself to be a successful trader.
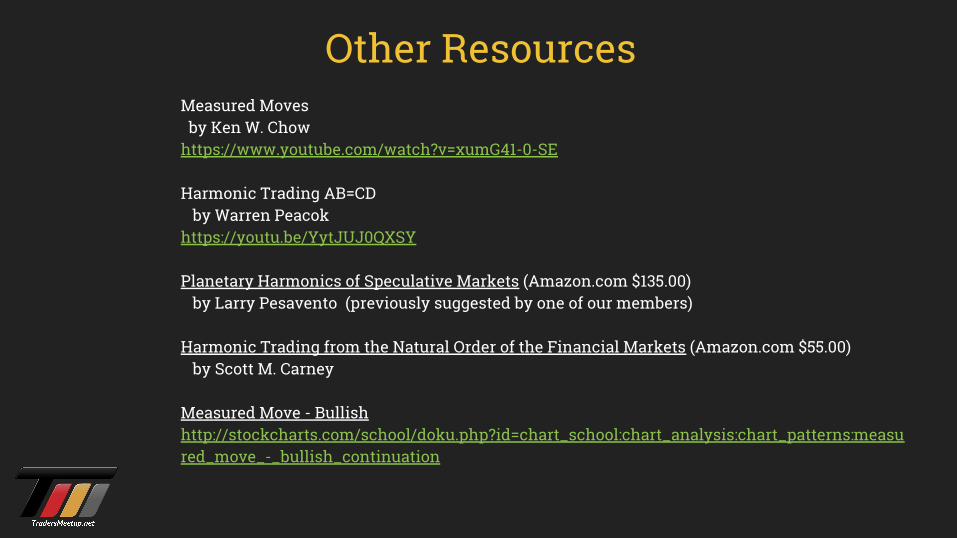
Other ResourcesMeasured Moves by Ken W. Chowhttps://www.youtube.com/watch?v=xumG41-0-SE
Harmonic Trading AB=CD by Warren Peacok https://youtu.be/YytJUJ0QXSY
Planetary Harmonics of Speculative Markets (Amazon.com $135.00) by Larry Pesavento (previously suggested by one of our members)
Harmonic Trading from the Natural Order of the Financial Markets (Amazon.com $55.00) by Scott M. Carney
Measured Move - Bullishhttp://stockcharts.com/school/doku.php?id=chart_school:chart_analysis:chart_patterns:measured_move_-_bullish_continuation