Embed Size (px)
Citation preview
HIGHLIGHTS (12-month period Nov-Oct 2017/18)
London’s luxury hotels convert 4.9% growth in RevPAR into a 3.7% rise in GOPPAR.
Regional UK hotels record RevPAR growth of 2.1%, but rising costs weaken GOPPAR growth.
Pace of growth in payroll costs softens despite payroll rising by 3.5% in London and 1.6% in regional UK.
RESEARCH
UK HOTEL TRADING PERFORMANCEREVIEW 2018

32
UK HOTEL TRADING PERFORMANCE REVIEW RESEARCH
FOREWORD
Knight Frank is pleased to launch its second detailed annual review of Trading Performance in the UK Hotel sector.
In partnership with HotStats, we have once again produced a unique and comprehensive analysis of the UK’s hotels trading performance, which focuses on a detailed review of hotel revenue, cost, and profitability using consolidated monthly data, to analyse historical and year-to-date performance. We have used a range of datasets, with a particular focus on hotel class, distinguishing between London and Regional UK, and from which an in depth analysis has been carried out and key hotel metrics applied in order to review trends, draw conclusions and provide an insight into future hotel trading performance. In addition, we have undertaken further analysis of the regional UK hotel market, differentiating between the Top 20 regional towns/cities (based on an annual average three-year TRevPAR performance), other major secondary towns/cities and a UK regional market which excludes the Top 20 and secondary city hotel markets.
Our sample of hotels, totalling some 111,500 rooms, is geographically spread across England, Scotland, Wales and Northern Ireland. London comprises the greatest concentration of hotels in our sample (36%), representing approximately 26% of London’s hotel bedroom supply. In addition, our sample focuses predominantly on the branded upper midscale, upscale, upper upscale and luxury
PHILIPPA GOLDSTEIN Hotel Analyst
Source: HotStats, Knight Frank Research
ROLLING 12 MONTHS NOV-OCT 2017/18
hotel sectors and represents approximately 29% of the branded UK hotel market.
Despite slower growth in 2018 compared to the previous year, the resilience of the UK hotel sector is evident, given that in excess of 15,000 new rooms opened in 2017 and a further 15,000 new rooms have either opened or expected to open in 2018. The stronger global economy and the competitive value of the pound have continued to provide a boost to inbound tourism and combined with a strong UK leisure market which gathered momentum during the summer months, positive growth in RevPAR performance as at October YTD, has been achieved, particularly so in London. Nevertheless, caution remains as the impact on business investment from ongoing economic and political uncertainty, relating to the outcome of the Brexit negotiations, is having a profound bearing on trading, altering a hotel’s market segmentation, which in turn impacts upon lower revenue growth and potentially greater departmental costs.
Looking ahead to 2019, the headwinds of rising payroll costs are set to continue following the government’s announcement of further increases to the National Minimum Wage and a rise in the minimum pension contributions. Deal or no-deal, the challenging trading environment is expected to continue. At a time of slower growth in trading performance, the need to have a well-defined set of market segments, combined with strong insight into the distribution channels of each segment and control of all cost centres, will become essential components in safe guarding and maximising profitability.
Lond
on
Wal
es
Scot
land
Sout
h Ea
st
Nort
h W
est
Wes
t Mid
land
s
East
of E
ngla
nd
Sout
h W
est
East
Mid
land
s
York
s &
Hum
ber
Nort
h Ea
st
72.0%
70%
74.0%
76.0%
78.0%
80.0%
82.0%
84.0%
25
50
75
100
125
150
175
200
225
ADR
/ Rev
PAR
/ TRe
vPAR
Occu
panc
y
Occupancy
RevPARADRTRevPAR
Source: HotStats, Knight Frank Research
FIGURE 2
Key performance indicators by UK region Rolling 12 Months, Nov-Oct 2017/18
LONDON
1.4%
£195
TRevPAR
-0.6%
£85
GOPPAR
1.5%
£139
RevPAR
26%
4.0%
PAYROLL %(of total revenue)
UK REGIONAL
0.9%
£113
TRevPAR
1.0%
£37
GOPPAR
1.7%
£66
RevPAR
1.4%
1.4%
PAYROLL %(of total revenue)
TOP REGIONAL CITIES
1.6%
£116
TRevPAR
1.7%
£43
GOPPAR
2.8%
£77
RevPAR
2.1%
27%
PAYROLL %(of total revenue)
SECONDRY UK REGIONAL CITIES
0.7%
£85
TRevPAR
-0.4%
£27
GOPPAR
1.2%
£56
RevPAR
2.1%
30%
PAYROLL %(of total revenue)
LONDON
2.5%
£197
TRevPAR
1.2%
£86
GOPPAR
2.8%
£141
RevPAR
3.9%
26%
PAYROLL %(of total revenue)
UK REGIONAL
1.1%
£113
TRevPAR
1.1%
£37
GOPPAR
1.9%
£67
RevPAR
1.4%
31%
PAYROLL %(of total revenue)
TOP 20 UK REGIONAL CITIES
1.6%
£117
TRevPAR
1.4%
£43
GOPPAR
2.7%
£77
RevPAR
2.2%
27%
PAYROLL %(of total revenue)
SECONDARY UK REGIONAL CITIES
0.9%
£86
TRevPAR
-0.5%
£27
GOPPAR
1.6%
£56
RevPAR
2.2%
30%
PAYROLL %(of total revenue)
LONDON UK REGIONAL
6.9% 4.9% 5.8% 4.7%
£134 £185 £84 24%
5.1% 3.3% 3.4% 3.3%
£65 £111 £36 31%
RevPAR TRevPAR GOPPAR PAYROLL %(of total revenue)
RevPAR TRevPAR GOPPAR PAYROLL %(of total revenue)
Residence Inn Aberdeen (Opened November 2017)
Source: Knight Frank Research
FIGURE 1
Regional share of the sample Number of hotels rooms by region
London | 36.1%
South East | 12.0%
Scotland | 11.3%
North West | 9.2%
West Midlands | 6.7%
East of England | 6.4%
Yorkshire &The Humber | 4.7%
East Midlands | 4.5%
South West | 4.3%
North East | 2.2%
Wales | 2.5%
West Yorkshire | 0.1%

54
UK HOTEL TRADING PERFORMANCE REVIEW RESEARCH
2018 FORECAST
LONDON REGIONAL UK REGIONAL UK – TOP20 CITIES (TREVPAR)
2018 FORECAST
OCCUPANCY
ADR
REVPAR
LONDON REGIONAL UK
OCCUPANCY
ADR
REVPAR
REGIONAL UK - TOP20 CITIES (TREVPAR)
OCCUPANCY
ADR
REVPAR
2019 FORECAST
+1.5%
-0.5%
+0.9%
LONDON
£173.20
81.5%
£141
REGIONAL UK
+1.5%
+0.3%
+1.9%
£89
76.8%
£99
REGIONAL UK - TOP20 CITIES (TREVPAR)
OCCUPANCY
ADR
REVPAR
OCCUPANCY
ADR
REVPAR
OCCUPANCY
ADR
REVPAR
OCCUPANCY
ADR
REVPAR
OCCUPANCY
ADR
REVPAR
OCCUPANCY
ADR
REVPAR
1.8%
+0.4%
+2.3%
£99
81.0%
£80
+1.8%
82.8%
+3.9%
£142
+1.7%
£
£172
££
+2.0%
£
£88
££
+0.8%
76.8%
+3.0%
£67
+0.8%
80.9%
+1.0%
82.0%
+0.5%
76.5%
+0.4%
80.6%
+4.5%
£79
+2.3%
£140
+2.5%
£67
+4.0%
£79
+1.0%
US 171
£
£
££
+1.9%
US 88
£
£
££
+3.4%
US 97
£
£
££
LONDON REGIONAL UK REGIONAL UK – TOP20 CITIES (TREVPAR)
+0.2%
83.0%
+2.4%
£146
+0.0%
76.8%
+2.5%
£69
+0.3%
81.2%
+4.1%
£82
2019 FORECAST
+3.5%
£
£98
££
+2.2%
£
£176
££
+2.5%
£
£90
££
+3.8%
£
£101
££
TOPLINE PERFORMANCE INDICATORSKnight Frank’s forecast for year-end 2018 RevPAR records growth of 3.9% in London and 3.0% in regional UK, which underscores the resilience of the UK hotel market. That said, the ongoing uncertain trading environment combined with high levels of new supply have tempered growth levels across the UK.
Occupancy, average room rate & RevPARThe UK hotel market has enjoyed an improving trading environment during 2018, as the rate of growth in top line trading performance, which slowed in Q4 2017, continued into 2018. RevPAR growth in the regions has been considerably more balanced, returning to positive growth, albeit it low, since the spring. The London market which experienced marginal or no growth for the first six months of 2018, came to life at the start of the hot UK Summer.
With rising costs, both London and regional UK hoteliers have shown a reluctance to reduce room rates, as such modest levels of growth in ADR have been achieved of 1.6% and 1.8% respectively for October YTD. Events such as the biennial Farnborough Airshow have contributed to the stability of the London hotel market. London has outpaced provincial markets with a 3.8% rise in RevPAR YTD, due to occupancy rising by 1.8%, compared to regional
72.0%
74.0%
76.0%
78.0%
80.0%
82.0%
84.0%
LuxuryUpper upscaleUpper midscaleUpper upscaleUpper midscaleSelect serviceupper midscale
Secondarytowns/cities
Top 20 Cities(by TrevPAR)
UK REGIONAL LONDON
40
90
140
190
240
290
340
ADR
/ Rev
PAR
/ TRe
vPAR
Occu
panc
yOccupancy ADR RevPAR TRevPAR
Source: HotStats, Knight Frank Research
FIGURE 3
Key top line performance indicators Rolling 12 months, Nov-Oct 2017/18
Source: Knight Frank Research
UK occupancy levels remaining stable at 77% for the same period. Considering the quantum of new supply entering the UK hotel market, modest growth in RevPAR is a positive outcome.
Whilst an understanding of the entire UK regional market or total London market performance provides a useful measure of comparison, the performance trends of key geographical locations or different asset classes remain opaque. Knight Frank’s detailed analysis reveals that the Top 20 UK Regional towns/cities (in terms of an annual average TRevPAR performance over the past three-years), outperform secondary UK regional towns/cities, with a market penetration index (MPI) of 136%. As such, the Top 20 Regional UK towns/cities have achieved RevPAR growth of 2.4% as at October YTD, compared to 2.0% RevPAR growth achieved by other major secondary towns/cities. Meanwhile, on a city-wide basis, Birmingham, as the UK’s third largest regional hotel market and a city which holds a strong market position across all demand
generators, is one of five hotel markets, monitored by HotStats, achieving over 5% growth in RevPAR as at October YTD 2018. Other cities performing strongly with respectable RevPAR growth in 2018 include Brighton, Liverpool, Glasgow and Derby. The city of Edinburgh continues to perform well but with significantly lower growth than compared to the previous year. In 2017, a surge in Edinburgh’s RevPAR performance of 14% was attributed to the weakened pound and a strong surge in international visitors. The cities of Cardiff and Belfast are further examples of cities experiencing weaker or marginal annual RevPAR growth.
The London market suffered marginal or no growth for the first six months of 2018.
In London, after a phenomenal year in trading performance during 2017, growth rates in 2018 prior to the summer months have been marginal or on the decline. During the first half of 2018, luxury hotels in London managed to maintain the average room rate, but with fewer international visitors and shorter lengths of stays, this resulted in lower occupancy rates. Since the beginning of the summer, however, the performance of London’s upper-upscale and luxury hotels have rebounded strongly, achieving RevPAR growth as at October YTD of 4.5% and 4.9% respectively.
Meanwhile, with the budget sector accounting for approximately 70% of the 8,000 new rooms that have opened in the capital since the start of 2017, this has exerted significant pressure on the performance of London’s upper midscale hotel sector as they strive to compete for market share. With the primary focus of upper midscale hotels to maintain occupancy, this has resulted in lower average room rates and consequently lower growth in RevPAR.
Nevertheless, with the London hotel market having witnessed a slowdown during Q4-2017, the comparison for growth in Q4-2018 is expected to be positive. As such, Knight Frank envisages a year-end occupancy rate of close to 83% for London and with a respectable increase in ADR, RevPAR growth of 3.9% is forecast, equivalent of £142 PAR. As for regional UK, full-year occupancy of close to 77% is forecast, together with a 2.0% growth in ADR, this translates into 3.0% growth in RevPAR or £67 PAR. Meanwhile, the Top 20 regional UK towns / cities will achieve the strongest growth, with 4.5% growth in RevPAR anticipated. Crowne Plaza Manchester – Oxford Road (Opened September 2018)

76
UK HOTEL TRADING PERFORMANCE REVIEW RESEARCH
FIGURE 5
UK regional market segmentation % point change YTD Oct 2018
RACK/BAR Corporate ConferenceLeisure Tour Group
-2.0%-1.5%-1.0%-0.5%0.0%0.5%1.0%1.5%2.0%2.5%3.0%3.5%4.0%
UK R
egio
nal
Seco
ndar
y to
wns
/citi
es
Top
20 U
K Re
gion
alCi
ties
(by
Trev
PAR)
UK R
egio
nal
Lux
ury
inde
pend
ent
hote
ls
UK R
egio
nal
Upp
er u
psca
le
UK R
egio
nal
Uppe
r mid
scal
e
UK R
egio
nal
Sele
ct s
ervic
e u
pper
mid
scal
e
FIGURE 6
London market segmentation % point change YTD Oct 2018
RACK/BAR Corporate ConferenceLeisure Tour Group
-6.0%-5.0%-4.0%-3.0%-2.0%-1.0%0.0%1.0%2.0%3.0%4.0%5.0%6.0%7.0%8.0%
Lond
onCo
nfer
ence
Hot
els
Lond
on
Luxu
ry
Lond
on
Uppe
r Ups
cale
Lond
onUp
per m
idsc
ale
LondonLuxury
LondonUpperupscale
LondonUpper midscale
Top 20 UK RegionalCities (by TrevPAR)
UK RegionalLuxury independent hotels
UK RegionalUpper upscale
UK RegionalUpper midscale
UK RegionalSelect service
upper midscale 2%
21%
33%
77%
59%
33%
3%59%
5%
45%
6%
42%
66%
28%
3%
2%
20%
77%
74%
22%
66%
3%30%
3%
Rooms revenue Food & beverage revenue Other revenue
HOTEL REVENUESWe have compared and analysed the various hotel income streams and by applying various performance metrics, this allows us to draw the following conclusions:
• Independent luxury regional UK hotels are the least dependent on Rooms Revenue as the hotel’s main revenue driver, with only 45% of total revenue attributable to the rooms department. A lower bedroom count than typically branded operators, reputable restaurants, captive markets due to remote surroundings, multiple food and beverage outlets and a strong mix of conference and banqueting facilities are all factors that contribute to a balanced revenue mix.
• In regional UK, Select-Service upper midscale hotels are the most dependent on the Rooms product, driving 77% of their total revenue from the Rooms department. In contrast, full-service
upper upscale regional UK hotels typically drive around 59% of their revenue from the Rooms department.
• Full-service hotels in London typically generate around 75% or more of their revenue from the Rooms department. Strong occupancy levels at over 84% for certain datasets, for the 12 month period to October 2018, have enabled hoteliers to leverage the average room rate, with the increase in Rooms revenue helping to maintain or grow operating margins.
• Hotel sectors with over 75% of revenue derived from Rooms revenue are less impacted by any significant rise or fall in ancillary revenues. As such, any growth or decline in revenues from non-rooms
Source: HotStats, Knight Frank Research
FIGURE 4
Revenue mix % (POR) Rolling 12 Months, Nov-Oct 2017/18
0%
10%
20%
30%
40%
50%
60%
70%
80%
90%
100%
LOND
ON U
PPER
UPS
CALE
LOND
ON U
PPER
MID
SCAL
E
UK R
EGIO
NAL
LUX
URY
INDE
PEND
ENT
HOTE
LS
UK R
EGIO
NAL
UPPE
R UP
SCAL
E
UK R
EGIO
NAL
UPPE
R M
IDSC
ALE
UK R
EGIO
NAL
SELE
CT S
ERVI
CE U
PPER
MID
SCAL
E
LUXU
RY L
ONDO
N HO
TELS
Rack/BAR Corporate Conference Leisure Tour Groups Other
Source: HotStats, Knight Frank ResearchSource: HotStats, Knight Frank Research
Source: HotStats, Knight Frank Research
FIGURE 7
Market segmentation by occupied room nights Rolling 12 Months, Nov-Oct 2017/18
revenue departments are unlikely to have a material impact on profitability.
Rooms segmentation Whilst advancements in smart, automated revenue management software facilitates a hotel’s drive to enhance and maximise revenue performance, the productivity of such sophisticated tools and technology is largely dependent on having strong processes in place, in order to capture data and garner a holistic view of each and every customer. Having a well-defined set of market segments and having a strong insight into the distribution channels of each, not only presents a much clearer understanding of who is booking, why and when, but provides the foundation for setting a hotel’s pricing strategy correctly, from which successful and profitable revenue management techniques can be deployed.
There is significant variation in the segmentation mix of the various hotel market sets in both London and regional UK. In terms of room nights occupied for the period Nov-Oct 2017/18, with respect to regional UK hotels, independent luxury hotels penetrated the strongest in the transient leisure sector, with an average of 33% of the annual room nights attributed to this segment. The regional UK Upper Upscale hotels hold the weakest share of leisure room nights when compared to all other regional UK hotel datasets, but capture the strongest proportion of its volume from the Best Available Rate (BAR), Corporate and Conference markets, totalling some 69% of total annual room nights.
Hotel markets located in secondary regional UK cities capture on average 31% of the annual volume of room nights from the corporate market, compared to only 24% for hotels located in the Top 20 regional UK cities, which in contrast captures a greater proportion of room nights from the BAR and conference segments.
The annual change in segmentation mix amongst UK regional hotels outlines some key trends in activity. Most notably, there has been a strong increase in leisure demand across all hotel market sets (with the exception of the Upper Upscale segment). As at October YTD, London as a whole has observed 3.1% point change in the market share of leisure room nights as a percentage of total room nights. This shift is even more intense in London’s luxury hotel market, with a shift in segmentation mix of 6.1% for the leisure segment, with robust
demand from overseas, high-net-worth leisure visitors to London. Through active yield management, the strong demand for higher paying leisure business has been captured, combined with relatively stable trade in the corporate and conference segments and squeezing out the lower rated tour operator segment, this have led to London’s modest growth in RevPAR observed in 2018.
In Regional UK, the increase in leisure demand has resulted in a two percentage point change in the segmentation mix, with the Top 20 UK regional towns/cities witnessing an even greater variation, with the leisure mix rising by 3.7% points.
Rooms revenueThe importance of understanding a hotel’s market segmentation is core to optimising a hotel’s Rooms Revenue, allowing for better yielding, forecasting and management of the hotel’s various operating departments. Continued monitoring and actively working the business mix, identifying opportunities to replace lower yielding segments, knowing when to accept group business, enhance management of room types to minimise overbooking and maximise upselling and implementing a dynamic pricing strategy to yield individual market segments are all ways of improving a hotel’s RevPAR.
The composition of Rooms Revenue analysis reveal for the YTD period between January to October 2018, that across the majority of hotel categories there has been a strong rise in the proportion of rooms revenue driven by the leisure segment, which is up 13% in

98
UK HOTEL TRADING PERFORMANCE REVIEW RESEARCH
Source: HotStats, Knight Frank Research
-15%
-10%
-5%
0%
5%
10%
15% ADR
RevPAR
Londonconference
hotels
London luxury
London upper
upscale
Londonupper
midscale
CardiffBirminghamManchesterEdinburghUK Regional secondary towns/cities
Top 20 UKregional cities
(by TrevPAR)
FIGURE 9
Corporate revenue mix, ADR % change v RevPAR contribution % change Oct YTD 2018
Source: HotStats, Knight Frank Research
-30%-25%-20%-15%-10%-5%0%5%
10%15% ADR
RevPAR
LondonConference
Hotels
London Luxury
London Upper
Upscale
LondonUpper Mid& Upscale
CardiffBirminghamManchesterEdinburghUK Regional Secondary
Towns/Cities
Top 20 UKRegional Cities
(by TrevPAR)
Londonconference
hotels
Londonluxury
Londonupper upscale
Londonupper
midscale
CardiffBirminghamManchesterEdinburghUK regional secondary
towns/Cities
Top 20 UK Regional Cities
(by TrevPAR)
FIGURE 10
Conference revenue mix, ADR % change v RevPAR contribution % change Oct YTD 2018
Source: HotStats, Knight Frank Research
-25%
-20%
-15%
-1%0
-5%
0%
5%
10%
15%ADRRevPAR
Londonconference
hotels
Londonluxury
Londonupper upscale
London upper
midscale
CardiffBirminghamManchesterEdinburghUK regional secondary towns/cities
Top 20 UK regional cities
(by TrevPAR)
FIGURE 11
Tour group revenue mix, ADR % change v RevPAR contribution % change Oct YTD 2018
London and 11% on regional UK, compared to the same period in 2017, with the rise in revenue attributed to significant growth in occupancy as opposed to a rise in the average room rate.
London’s luxury hotels have observed a 14% fall in the average room rate of a leisure guest, however, the strong rise in leisure demand has resulted in a 19% rise in the contribution of this segment to RevPAR. Across regional UK, the majority of hotel markets have witnessed either marginal growth or declining ADR of the leisure segment, but a considerable rise in leisure generated rooms revenue. Top 20 Regional UK cities have recorded a 17% rise in Leisure RevPAR contribution, and cities such as Cardiff and Birmingham achieving RevPAR contribution growth in the leisure segment of 49% and 36% respectively.
Demand in regional UK for the corporate market has increased with growth of 2.6% in occupied room nights and a rise in the average room rate of 1.2% for October YTD. The increase in revenue, however, has not kept pace with the growth in the leisure segment, resulting in the RevPAR contribution from the corporate market declining by 1.0%. Certain UK cities, such as Edinburgh and Manchester have seen a greater decline in the corporate RevPAR contribution due to the leisure segment experiencing a much greater uplift.
In the conference segment, London’s midmarket sector has experienced a decline in both occupied room nights and the ADR by segment, with RevPAR contribution some 15% lower. Meanwhile, the luxury and upscale hotels have achieved strong RevPAR contribution growth of between 5% and 7% driven almost exclusively by growth in the ADR, which increased by 7.8% and 6.0% respectively.
Changes in demand resulting in an alteration of the segmentation mix, combined with continued growth in hotel supply have been the two main catalysts to slower growth rates in 2018, particularly so with respect to ADR growth. On a micro level some of the top yielding hotel markets have seen much greater changes to their market segmentation and revenue mix. As a result, whilst positive growth in hotel revenues have been achieved, on a UK-wide basis the growth is at a lower level than compared to the previous year.
Food & Beverage RevenueRegional UK as a whole has generally witnessed no growth in Food and Beverage
(F&B) revenues, there are certain hotel markets that have enjoyed reasonable growth. One such segment is the select-service segment which for the full year Nov-Oct 2017/18, achieved 3% growth on a PAR basis, with the self-service kiosks and grab-and-go concepts appealing to the changing habits of in-house guests. (Select Service hotels, a hybrid between limited service and full-service hotels, typically provide a product offering in keeping with limited-service properties, alongside a selection of the amenities, facilities, and services typical of full-service hotels.)
Luxury independent regional UK hotels have also fared well, with this market set particularly strong at promoting individuality and creating experiences for guests, as such strong growth in the leisure segment has impacted positively on food and beverage spend during the stay. As overnight leisure demand has continued to increase in 2018, so has the incremental F&B spend for luxury Source: HotStats, Knight Frank Research
Source: HotStats, Knight Frank Research
FIGURE 13
Food & beverage revenue (% of total revenue) Rolling 12 Months, Nov-Oct 2017/18
% of total revenue Annual % change (PAR)
UK REGIONAL LONDON
15%
20%
25%
30%
35%
40%
45%
Conf
eren
ce h
otel
s
Lux
ury
Uppe
r ups
cale
Uppe
r mid
scal
e
Top
20 U
K re
gion
alci
ties
by T
revP
AR)
Conf
eren
ce h
otel
s
Luxu
ry in
depe
nden
t hot
els
Uppe
r ups
cale
Uppe
r mid
scal
e
Sele
ct s
ervic
e up
per m
idsc
ale
-2%
-1%
0%
1%
2%
3%
4%
5%
6%
% o
f tot
al re
venu
e
% C
hang
e
UK REGIONALLess top 20 and secondary cities
Rack/BAR
Leisure
Tour Group
Other
UK REGIONALSecondary towns/cities
Rack/BAR
Leisure
Tour Group
Other
TOP 20 UK REGIONAL CITIES(by TrevPAR)
Rack/BAR
Leisure
Tour Group
Other
LONDON Luxury
Rack/BAR
Leisure
Tour Group
Other
LONDONUpper upscale
Rack/BAR
Leisure
Tour Group
Other
LONDONUpper midscale
Rack/BAR
Leisure
Tour Group
Other
Corporate
Conference
£98
£80
£99
£74
£80
£75
£73
£56
£105
£85
£99
£81
£294
£279
£326
£204
£196
£148
£162
£130
£143
£93
£125
£126
CorporateCorporateCorporate
CorporateCorporate
£79£72£84
£261£174£143
ConferenceConferenceConference
ConferenceConference
£103£87£107
£324£168£138
FIGURE 12
Average daily room rate by market segment, London v UK regional hotels (£) Rolling 12 Months, Nov-Oct 2017/18 In contrast to the leisure
segment, demand in regional UK for the corporate market has been much weaker.
independent hotels, with full year Nov-Oct 2017/18 growth of 4.7% achieved on a PAR basis, rising to 5.4% growth as at October YTD 2018.
However, in city-centre locations, where competition is fierce and branded hotels historically poor at promoting their food and beverage businesses, growth in F&B revenues have been much more elusive, with the Top 20 regional cities and secondary cities all witnessing declining revenues for the full year Nov-Oct 2017/18 and YTD 2018. Furthermore, those specific hotel markets which have suffered a decline in the conference segment have also recorded the greatest declines in F&B revenue, as ancillary spend across all revenue generating departments is impacted by fewer residential and day conferences. The F&B revenues for the hotel markets of Edinburgh and Cardiff have all been impacted, recording declines of 6% and 4% respectively, as at YTD October
Source: HotStats, Knight Frank Research
-20%
-10%
0%
10%
20%
30%
40%
50% ADRRevPAR
Londonconference
hotels
Londonluxury
London upper
upscale
Londonupper
midscale
CardiffBirminghamManchesterEdinburghUK regional secondary towns/cities
Top 20 UKregional cities
(by TrevPAR)
FIGURE 8
Leisure revenue mix, ADR % change v RevPAR contribution % change Oct YTD 2018

1110
UK HOTEL TRADING PERFORMANCE REVIEW RESEARCH
DEPARTMENTAL COSTSSome departmental operating costs are rising at a faster pace than departmental revenues, with the upward trajectory of both payroll costs and departmental expenses are contributing to the rise.
Rooms costDespite a continued rise in Room costs across all categories of hotels on a POR basis, Room costs have increased at their slowest rate in three years. For the fiscal period to Nov-Oct 2017/18, Rooms costs increased by 2.9% in London and 2.3% in regional UK; compared with a three-year compound annual average increase of 3.6% for London and 3.5% for regional UK for the same fiscal period.
Instrumental to the slowdown in rising rooms cost is a significant reduction in the cost of sales (which includes the travel agents’ commission, reservation fees, GDF fees, third party representation fees and internet booking fees), with the growing emphasis on booking direct by many of the global operators and changes to segmentation impacting on distribution channels likely to be having a positive impact. Following a 15% rise in the cost of sales in London over a two-year period up to October 2017, over the past 12 months, there has been a 1% reduction in commission and fees paid. Regional UK has witnessed a similar trend, with a 13% rise in the two-year period to October 2017, whilst the rise in the cost of sales has slowed to just over 1.7% in 2018.
As at October YTD 2018, Rooms cost of sales now make up 26% of the total Rooms cost in London, equivalent of £10.70 POR and 29% of the total Rooms cost in regional UK, which equates to £7.80 POR.
In terms of Rooms expenses, London has continued to observe a strong rise in this expense, growing by 7.4% on a POR basis for the fiscal period Nov-Oct 2018. The upward trend has continued in 2018, rising by 8.5% on a POR basis as at Oct YTD. Consequently, Rooms expenses in London account for approximately 24% of total rooms cost, which equates to £9.70 POR. Conversely, regional UK hotels have reduced the growth of Rooms expenses to 1.7% on a POR basis for the fiscal period Nov-Oct 2018, with this same margin maintained as at Oct YTD. Rooms expenses in regional UK now account for approximately 21% of total rooms cost, equating to £5.70 POR.
Rooms payroll costs represent the largest cost element in the rooms department and accounts for 50% of the total rooms cost. Payroll costs have increased by 2.9% in both London and regional UK, on a POR basis for the period Nov-Oct 2017/18, equivalent of £20.0 POR and £13.40 POR respectively. Whilst in London, the pace of increase in payroll costs, as at October YTD 2018, has slowed, reducing to 2.2% on a POR basis, regional UK continues to see payroll costs rise, increasing by 3%.
Significant variation exists in payroll costs between the specific hotel datasets, with our analysis confirming that certain major regional UK cities, namely Edinburgh, Manchester and Birmingham, have all witnessed a slowdown in the pace of rising
TOP 20 UKREGIONAL CITIES
(BY TREVPAR)
UK REGIONALCONFERENCE
HOTELS
UK REGIONALLUXURY
INDEPENDENTHOTELS
UK REGIONALUPPER
UPSCALE
UK REGIONALUPPER MID & UPSCALE
UK REGIONALSELECT SERVICE
UPPER MID & UPSCALE
LONDON LUXURY
LONDONUPPER
UPSCALE
LONDONUPPER MID& UPSCALE
SECONDARYTOWNS/CITIES
TOP 20 CITIES (BYTREVPAR)
CONFERENCEHOTELS
LUXURYINDEPENDENT
HOTELS
UPPERUPSCALE
UPPERMIDSCALE
SELECT SERVICEUPPER
MIDSCALE
LUXURY UPPERUPSCALE
UPPERMIDSCALE
UK REGIONAL LONDON
100
Food Beverage Room Hire
0
20
40
60
80
120
HOTEL
FIGURE 14
Split of F&B departmental revenue (PAR) Rolling 12 Months, Nov-Oct 2017/18
2018. Overall, for UK regional hotels, the contribution of F&B revenues to the total hotel revenue mix has declined by almost 0.5%, to 33% of total revenue.
In London, F&B revenues have generally increased, achieving 2.5% growth PAR for the full year Nov-Oct 2017/18 and rising to 3% growth PAR for October YTD 2018. London’s upper midscale, conference and luxury hotel markets have achieved the strongest growth, with F&B revenues rising between 2.5% and 4.5% PAR for October YTD 2018, with the contribution of F&B revenues to the total hotel revenue mix remaining stable.
Ancillary revenue streamsIn the period Nov-Oct 2017/18, ancillary revenue streams, such as telephone and leisure revenues, have declined in London by approximately 6% on a per occupied room basis (POR), whilst regional UK has witnessed no change overall. Ancillary revenues in hotels throughout the UK have been declining year-on-year since 2015, with ancillary revenues in regional UK hotels representing 8.7% of total revenue compared to over 9.1% three years earlier. In London, ancillary revenues now equate Source: HotStats, Knight Frank Research
Source: HotStats, Knight Frank Research
0%
1%
2%
3%
4%
5%
6% Rooms RevPAR % growth TRevPAR % growth
Luxury LondonUpperupscale
Uppermidscale
Top 20cities
(by TrevPAR)
Luxury independent
hotels
Upper upscale
Uppermidscale
Select serviceupper
midscale
UK REGIONAL LONDON
Secondary towns/cities
UKRegional
FIGURE 15
RevPAR v TRevPAR growth 2017/18 Annual % Change, Rolling 12 months Nov-Oct
FIGURE 16
Rooms departmental costs – % annual change (POR) Nov-Oct 2017/18 v 2016/17
Source: HotStats, Knight Frank Research
-10%
-5%
0%
5%
10%
15%
LondonLondonluxury
Londonupper upscale
Londonupper midscale
UK regionalUK regionalsecondary
towns/cities
Top 20 UKregional cities
(by TrevPAR)
Rooms cost of sales Rooms payroll Rooms expenses Total rooms cost
0.0
12.5
25.0
37.5
50.0
62.5
75.0
Conf
eren
ce h
otel
s
Luxu
ry
Uppe
r ups
cale
Uppe
r mid
scal
e
Seco
ndar
y to
wns
/citi
es
Top
20 c
ities
(by T
revP
AR)
Luxu
ry in
depe
nden
t hot
els
Uppe
r ups
cale
Uppe
r mid
scal
e
Sele
ct s
ervic
e up
per m
idsc
ale
UK REGIONAL LONDON
60%
63%
66%
69%
72%
75%
78%
Rooms cost of sales Rooms payroll PORRooms expenses POR Rooms gross profit %
Room
GP
%
Cost
s/Ex
pens
es P
OR
Source: HotStats, Knight Frank Research
FIGURE 17
Breakdown of rooms cost – POR (£) Rolling 12 months, Nov-Oct 2017-18
payroll costs as at October YTD 2018. The rise in the rooms cost of London’s luxury hotels, continues to increase at a significantly faster pace than the London market average, with payroll costs rising by 5.9% to £35 on a POR basis for the 12-month period Nov-Oct 2018. The impact of the increase in the minimum wage, given the high ratio of staff to guests, has contributed to the strong rise in payroll costs in London’s luxury hotel sector.
Food & beverage costsF&B costs throughout the UK, for the full year Nov-Oct 2017/18 have increased at a greater pace than any growth in departmental revenue, thereby causing departmental profit margins to decline. Even where a market has achieved revenue growth, the total rise in costs have outstripped the pace of revenue growth. In London, whilst F&B revenues have increased by 2.5% on a PAR basis, F&B costs have increased by 2.9%. In regional UK, stagnant
to approximately 3.5% of total revenue,
declining by one percentage point of total
revenue since 2015.
Rooms RevPAR v total RevPAR growthIn both London and regional UK, the
growth in rooms RevPAR for the full-year
Nov-Oct 2017/18 has outperformed the
growth in Total Revenue PAR (TRevPAR) in
the majority of all data sets analysed.
A few exceptions include luxury independent regional hotels which has achieved exceptionally strong growth in F&B revenues; Upper Upscale regional hotels which achieved only marginal growth in RevPAR; and upper midscale London hotels which yielded strong F&B revenues from the leisure segment, despite a fall in conference demand. Overall, however, the contribution from non-rooms revenue departments to Total Revenue has been marginal or led to a dilution of TRevPAR growth.

1312
UK HOTEL TRADING PERFORMANCE REVIEW RESEARCH
37.6% 18.7% 43.9% 23.9% 44.1% 23.7% 50.9% 28.6% 40.7% 21.2% 42.9% 23.0% 32.2% 16.9% 33.6% 17.5% 40.3% 21.6%
UK REGIONAL LONDON
£0
£30
£60
£90
£120
£150
Top 20 Cities (by Trevpar)
Luxury IndependentHotels
Secondary towns/citiesUpper upscale Upper mid & upscale
Luxury independenthotels
Upper upscale Uppermidscale
Upper upscale LuxuryUpper mid & upscale
Top 20 Cities (by TrevPAR)
Secondarytowns/cities
Upper upscale LuxuryUppermidscale
Select service Upper mid & upscale
Select serviceupper midscale
UK REGIONAL LONDON
Rooms F&B Other Departmental payroll % of total revenueDepartmental costs % of total revenue
Rooms F&B Other Departmental payroll % of total revenueDepartmental costs % of total revenue
18.7%
37.5%
21.7% 40.5%
21.7% 40.5%
21.7% 40.5%
21.7% 40.5%
21.7% 40.5%
21.7% 40.5%
21.7% 40.5%
21.7% 40.5%
£17
£10
£31
£61
£17
£22
£27
£5
£19
£23
£4
£22
£26
£3
£18
£17
£2
£26
£20
£1
£33
£29
£2
£53
£75
£7
Source: HotStats, Knight Frank Research
FIGURE 21
Departmental costs PAR by hotel type (£) Rolling 12 months Nov-Oct, 2017/18
0
20
40
60
80
100
120
-6
-4
-2
0
2
4
6
8
Rooms F&B Other operating departments Undistributed payroll
% change (operating departments) % change (non operating departments) Total payroll CAAG (3-year average)
Annu
al %
Cha
nge
PAR
(£)
LuxuryUpper upscale
Uppermidscale
Secondary towns/cities
Top 20 cities(by TrevPAR)
Luxury independent
hotels
Upper upscale
Uppermidscale
Select serviceupper midscale
UK REGIONAL LONDON
FIGURE 20
Breakdown of payroll costs PAR by hotel class (£) Rolling 12 months Nov-Oct, 2017/18
Source: HotStats, Knight Frank Research
F&B revenue growth, compounded by rising costs of 1.6% on a PAR basis have impacted profit margins.
F&B Payroll costs have increased by 3.8% in London, 1.6% in regional UK and by 2.3% in the Top 20 regional UK towns/cities on a PAR basis, for the 12-month period
Source: HotStats, Knight Frank Research
FIGURE 18
3-year average annual change in food & beverage costs (PAR) and % point change in profit margin 12-Months period Nov-Oct 2014/15 v 2017/18
-9%
-6%
-3%
0%
3%
6%
9%
12%
15%
LuxuryUpperupscale
Uppermidscale
Secondary towns/cities
Top 20cities
(by TrevPAR)
Luxury independent
hotels
Upper upscale
Uppermidscale
Select serviceupper
midscale
UK REGIONAL LONDON
-4.0%
-3.5%
-3.0%
-2.5%
-2.0%
-1.5%
-1.0%
-0.5%
0.0%
% P
oint
cha
nge
in p
rofit
mar
gin
% C
hang
e in
F&B
cos
t (PA
R)
Payroll (PAR)% change
Food cost (PAR)% change
Beverage cost (PAR) % change
% point change of departmentalprofit margin
Total departmental expensesDespite total departmental expenses increasing by 3.3% in London and 1.4% on a PAR basis for the 12-month period Nov-Oct 2017/18, the level of rising costs has slowed considerably compared to the fiscal period 12-months earlier, particularly so in regional UK. Nevertheless, there has been considerable fluctuation between the various hotel datasets, with London’s luxury hotels and independent regional UK luxury hotels having seen a greater increase in costs of between 4.5% and 4.2%. On a PAR basis, total departmental expenses have averaged approximately £70 PAR for London hotels, £50 PAR for UK regional hotels and £47 PAR
for the Top 20 regional UK towns/cities.
Payroll costsPayroll costs form the largest proportion of costs for a hotel, with our analysis showing that the average payroll costs, as at October YTD 2018, equate to 26% of total revenue for London hotels, increasing to over 30% in Regional UK hotels. Total payroll cost for the Top 20 regional UK towns/cities equates to 27% of total revenue, with payroll costs rising to 30% for other major UK city/town-centre locations. Further detailed analysis reveals that select service, upper midscale hotels in regional UK have the lowest payroll costs as a percentage of revenue at 24% of total revenue (approximately £17.60 PAR), whilst payroll costs at full-service, independent luxury hotels equate to 37% of total revenue (equivalent of over £80 PAR). London’s Luxury hotels, meanwhile, have the largest payroll allocation at approximately £98 PAR.
Source: HotStats, Knight Frank Research
FIGURE 19
Food & beverage cost breakdown PAR by asset class (£) Rolling 12 Months, Nov-Oct 2017/2018
0
10
20
30
40
50
60
70
80
% o
f F&B
reve
nue
Cost
PAR
(£)
Conf
eren
ce
Luxu
ry
Uppe
r ups
cale
Uppe
r mid
scal
e
Conf
eren
ce h
otel
s
Luxu
ry in
depe
nden
t
Uppe
r ups
cale
Uppe
r mid
scal
e
Sele
ct s
ervic
e up
per m
idsc
ale 22%
24%
26%
28%
30%
32%
34%
36%
38%
40%
F&B payroll PAR Food cost of sales PAROther F&B costs PARBeverage cost of sales PAR
F&B profit margin
UK REGIONAL LONDON
The Food & Beverage department typically has the highest payroll cost, representing 38% of the total payroll cost in London and 40% in Regional UK. However, F&B payroll costs for select service hotels, which by its namesake offers fewer services, represents only 29% of total payroll cost.
Payroll costs have increased across all categories of hotels throughout the UK, with the shortage of low-skilled workers, increased demand for staffing, rise in the National Living Wage to £8.21 per hour and employer minimum pension contributions increasing, all having contributed to the growth of payroll costs. In London, both operational and undistributed payroll costs increased by approximately 3.9% on a PAR basis for the 12-month period Nov-Oct 2017/18, although the pace of growth in
payroll costs has fallen to approximately 3.5% as at Oct YTD 2018. Luxury hotels and upper midscale hotels have observed the greatest rise in payroll costs in London, rising by over 4.9% and 5.2% respectively for the 12-month period Nov-Oct 2017/18. In regional UK, the select-service hotels have seen the greatest hike in payroll costs, with payroll costs spiralling upwards by 3.7% on a PAR basis, for the 12-month period Nov-Oct 2017/18 and rising by 4.5% for the ten-month period to October 2018.
The cost of labour is set to continue to increase throughout the medium term, as growing uncertainty weighs in over the end to the free movement of labour and the UK government announcing plans to bring down low skilled migration to the UK in a post Brexit environment.
Staybridge Suites Manchester – Oxford Road (Opened September 2018)
Nov-Oct 2017/18. The trend for larger city
centre hotels and the quantum of full-service
hotels located in city-centre destinations,
result in higher labour costs, as compared
to hotels located in a more regional or rural
setting. However, a softening in the rise in
payroll costs in 2018 has been observed,
with the level of increase falling to 3% in London and 1.5% in regional UK as at October YTD 2018. Albeit, payroll costs in the luxury and upscale sectors in regional UK are rising by around 4%, significantly higher than the regional UK average.
The rise in F&B costs over a three-year period reveals a sharp rise in payroll costs, with the combined cost of wages, salaries and employee benefits rising by over 10% in London and by greater than 8% in regional UK, based on a PAR basis. Upscale and luxury hotels which are the most labour intensive and cities where demand for personnel is at its most competitive, have seen payroll costs rise by as much as 15% over the three-year period.
In contrast, any movement in F&B cost of sales has been moderate, with regional UK witnessing prices falling by 2.5%, whilst London has endured a rise of 2.8% over the three-year period. Payroll costs have therefore been the over-riding contributing factor to increases in departmental costs, with London sustaining on average a 3% point decline in the profit margin to 30% and Regional UK suffering a 2.5 % point decline in profit margin to 33%.

1514
UK HOTEL TRADING PERFORMANCE REVIEW RESEARCH
-2%
-1%
0%1%
2%
3%
4%
5%
6%
7%
% C
hang
e
60%
65%
70%
75%
80%
85%
90%
Room
s pr
ofit
cont
ribut
ion
%
% C
hang
e
TREVPAR Total departmental costs Rooms profit contributionGOI PAR
Luxury LondonUpperupscale
Uppermidscale
Secondary towns/cities
Top 20cities
(by TrevPAR)
Luxury independent
hotels
Upper upscale
Uppermidscale
Select service
upper midscale
UK REGIONAL LONDON
Administration & generalAdministration and General (A&G) total expenses have increased by 3.9% per annum in London on a PAR basis, whilst in regional UK, the costs have remained stable for the 12-month period Nov-Oct 2017/18. On average, total A&G expenses in London equate to around £17 PAR, compared to approximately £11 PAR in regional UK.
The increased costs incurred by the London sample of hotels can be largely attributed to the 4.4% rise in payroll costs, which equate to 45% of the total A&G expense, combined with a 5.6% increase in credit card fees. Typically, as at October 2018, credit card fees range between 19% and 20% of the total A&G expense for the London market and around 11% for regional UK hotels. Credit card fees payable by London hotels have increased by a compound annual growth rate of 6% over the past four years as a result of a surge in contactless payments and elevated charges in the processing of these transactions and scheme fees. In terms of the regional UK hotel market, despite a marginal decline in total A&G costs for the fiscal period Nov-Oct 2017/18, credit card commission has continued to
surge upwards, rising by 3.9% on a PAR basis per annum. Certain regional markets have observed an above annual average rise in the credit card fees payable for the period, including the Top 20 regional UK towns/cities, where this expense line has increased by 6.2% per annum, select service hotels increasing by 8.9% per annum and regional independent luxury hotels recording an 8% rise per annum, on a PAR basis.
UNDISTRIBUTED OPERATING EXPENSESLondon hotels record a 4.3% rise in undistributed operating expenses, for the ten-month period to October 2018, brought about by increased payroll costs of 4.1% PAR, combined with a hike in energy costs of 9.5% PAR. Despite regional UK hotels impacted by similar influences, falling Sales & Marketing expenses and with no rise in A&G costs, this has resulted in no material upward change for the provincial markets.
Novotel London Heathrow (Opened January 2018)
GROSS OPERATING INCOMEWith London and regional hotels generating 85% and 73% of their total profit from the Rooms department, the importance of achieving respectable RevPAR growth cannot be overstated, particularly in a climate of rising costs.
For the rolling 12-month period, Nov-Oct 2017/18, the profits generated by the rooms department averaged 73% of total departmental profits for UK regional hotels and averaged over 85% for London hotels. With respect to UK regional conference hotels and independent luxury hotels where ancillary departments are more dominant, the profit contribution from the rooms department equated to 59% and 62% respectively. In contrast, by limiting the provision of its ancillary services, regional upper midscale select-service hotels, derived 85% of its total profit contribution from the rooms department.
Gross Operating Income (GOI) PAR varies considerably, according to location, size, market positioning and the condition of the hotel. For the 12-month period to October 2018, on average full-service, mid-market hotels in regional UK properties, achieved a GOI PAR of £58, compared to a GOI PAR of £46 for select-service upper midscale hotels. Regional UK upper-upscale hotels and the Top 20 towns/cities achieved a similar GOI PAR of £68 and £69 respectively for the same 12-month period, outperforming the total regional UK market with a GOI PAR index score of 108% and 110% respectively.
London’s hotel market achieved some of the strongest profit margins, averaging 64% GOI, compared to 55.5% in Regional UK and 59% for hotels located in the Top 20 regional UK cities. London’s upper midscale hotels had the highest profit conversion at approximately 68%, whilst London’s luxury hotels and hotels located at London Heathrow achieved a much lower profit margin, averaging around 59% to 60%. In terms of GOI PAR, London’s upper midscale hotels recorded an average GOI PAR of £99 for the 12-month period to October 2018, of which 88% of the contribution came from the rooms department. London’s full-service, upper-upscale hotels achieved an average GOI PAR of £127, with 86% profit contribution from the rooms department, whilst London’s Luxury hotels achieved GOI PAR of £199, with an 84% contribution from the rooms department.
London’s hotels create on average a 76% profit margin from the rooms department, from which over 85% of their total profits are generated and regional UK hotels produce a profit margin of 69% from the rooms department, contributing on average 73% of a hotel’s profit, any growth (or decline) in RevPAR can therefore potentially have a
significant impact on a hotel’s profitability. With departmental costs rising on average by 2.5% to 3% in London and between 1.4% and 2.0% in regional UK, an analysis across all the datasets reveals that where a hotel market has achieved less than 1.5% growth in TRevPAR, this has resulted in either a small decline or a very marginal increase in GOI PAR. In contrast, where a hotel dataset has achieved respectable growth in both RevPAR and TrevPAR, this corresponds to a similar increase in GOI PAR.
For example, select service hotels in regional UK achieved a 4.0% increase in RevPAR and a 3.7% increase in TRevPAR, which was translated into a respectable 4.3% increase in GOI PAR for the 12-month period to October 2018. In contrast, upper midscale regional UK hotels achieved 1.5% growth in RevPAR but with only marginal growth in TRevPAR of 0.7%, this resulted in GOI PAR remaining static. This trend is further reinforced following a review of the London market, which has recorded stronger growth in top-line revenue
020406080
100120140160180200220
-2%
-1%
0%
1%
2%
3%
4%
5%
6%7%
% C
hang
e
PAR
Rooms F&B Other % change, rolling 12 mth to Nov-Oct 2018
Luxury LondonUpperupscale
Uppermidscale
Secondary towns/cities
Top 20cities
(by TrevPAR)
Luxury independent
hotels
Upper upscale
Uppermidscale
Select serviceupper
midscale
UK REGIONAL LONDON
FIGURE 22
Gross operating income contribution (PAR) (£) Rolling 12 months Nov-Oct 2017/18
FIGURE 23
Total operating departments Key performance indicators, % change per annum, Nov-Oct 2017/18
as at October YTD 2018, than compared to a rolling 12-month period Nov-Oct 2017/18. The stronger performance as at YTD 2018 reveals a 1% uplift in RevPAR to 3.8% growth and 0.8% uplift in TRevPAR to 3.3% growth, which has transpired into a 1.2% uplift in GOI PAR to 3.2% growth. This upward swing in the KPIs reinforces the significance of the movement in RevPAR, (particularly in a market which achieves a high RevPAR), given the Rooms department’s substantial contribution to a hotel’s overall profitability.
Finally, despite RevPAR growth for regional UK hotels improving, to 2.1% as at October YTD, this has had no positive bearing on improving GOI PAR. A combination of a lower rooms profit contribution to total GOI (than compared to London), compounded with declining ancillary revenues and rising departmental costs, have resulted in no uplift in profitability, with GOI PAR held static at 0.8% for the 10-month period YTD period.
Sales & marketing On a PAR basis for the 12-month period
Nov-Oct 2017/18, Sales & Marketing (S&M)
undistributed expenses (which exclude
payroll) have increased by 1.2% per annum
in London, whilst regional UK has recorded
a 5.3% decline in S&M costs. Whilst the
Top 20 regional UK towns and cities and
secondary cities hotel datasets have also
FIGURE 24
Undistributed operating expenses PAR (£) Nov-Oct 2017/18
0
10
20
30
40
50
60
70
80
-1%
0%
1%
2%
3%
4%
5%
A&G Sales & marketing POM Utilities % change (non operating departments)
Annu
al %
Cha
nge
PAR
LuxuryUpperupscale
Uppermidscale
Top 20cities
(by TrevPAR)
Luxury independent
hotels
Upper upscale
Uppermidscale
Select serviceupper midscale
UK REGIONAL LONDON
Source for both charts: HotStats, Knight Frank Research
Source: HotStats, Knight Frank Research
1716
UK HOTEL TRADING PERFORMANCE REVIEW RESEARCH
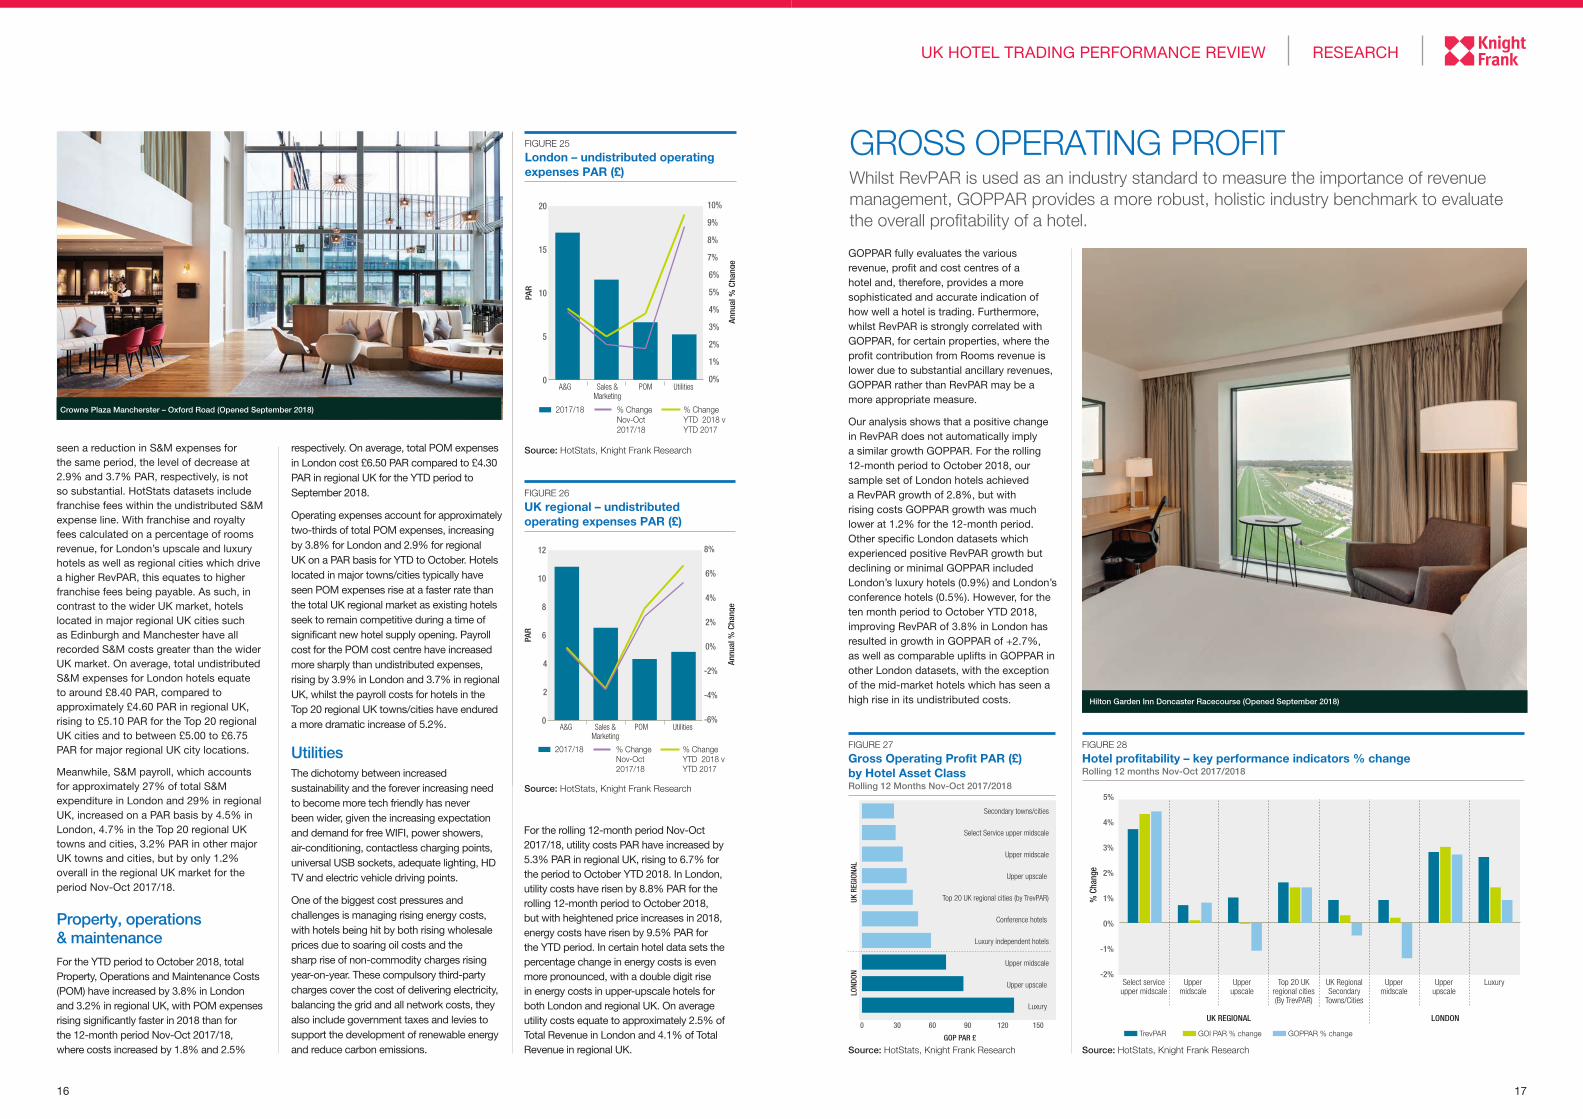
GROSS OPERATING PROFIT Whilst RevPAR is used as an industry standard to measure the importance of revenue management, GOPPAR provides a more robust, holistic industry benchmark to evaluate the overall profitability of a hotel.
seen a reduction in S&M expenses for the same period, the level of decrease at 2.9% and 3.7% PAR, respectively, is not so substantial. HotStats datasets include franchise fees within the undistributed S&M expense line. With franchise and royalty fees calculated on a percentage of rooms revenue, for London’s upscale and luxury hotels as well as regional cities which drive a higher RevPAR, this equates to higher franchise fees being payable. As such, in contrast to the wider UK market, hotels located in major regional UK cities such as Edinburgh and Manchester have all recorded S&M costs greater than the wider UK market. On average, total undistributed S&M expenses for London hotels equate to around £8.40 PAR, compared to approximately £4.60 PAR in regional UK, rising to £5.10 PAR for the Top 20 regional UK cities and to between £5.00 to £6.75 PAR for major regional UK city locations.
Meanwhile, S&M payroll, which accounts for approximately 27% of total S&M expenditure in London and 29% in regional UK, increased on a PAR basis by 4.5% in London, 4.7% in the Top 20 regional UK towns and cities, 3.2% PAR in other major UK towns and cities, but by only 1.2% overall in the regional UK market for the period Nov-Oct 2017/18.
Property, operations & maintenanceFor the YTD period to October 2018, total Property, Operations and Maintenance Costs (POM) have increased by 3.8% in London and 3.2% in regional UK, with POM expenses rising significantly faster in 2018 than for the 12-month period Nov-Oct 2017/18, where costs increased by 1.8% and 2.5%
respectively. On average, total POM expenses in London cost £6.50 PAR compared to £4.30 PAR in regional UK for the YTD period to September 2018.
Operating expenses account for approximately two-thirds of total POM expenses, increasing by 3.8% for London and 2.9% for regional UK on a PAR basis for YTD to October. Hotels located in major towns/cities typically have seen POM expenses rise at a faster rate than the total UK regional market as existing hotels seek to remain competitive during a time of significant new hotel supply opening. Payroll cost for the POM cost centre have increased more sharply than undistributed expenses, rising by 3.9% in London and 3.7% in regional UK, whilst the payroll costs for hotels in the Top 20 regional UK towns/cities have endured a more dramatic increase of 5.2%.
UtilitiesThe dichotomy between increased sustainability and the forever increasing need to become more tech friendly has never been wider, given the increasing expectation and demand for free WIFI, power showers, air-conditioning, contactless charging points, universal USB sockets, adequate lighting, HD TV and electric vehicle driving points.
One of the biggest cost pressures and challenges is managing rising energy costs, with hotels being hit by both rising wholesale prices due to soaring oil costs and the sharp rise of non-commodity charges rising year-on-year. These compulsory third-party charges cover the cost of delivering electricity, balancing the grid and all network costs, they also include government taxes and levies to support the development of renewable energy and reduce carbon emissions.
0
5
10
15
20
UtilitiesPOMSales &Marketing
A&G
Annu
al %
Cha
nge
PAR
0%
1%
2%
3%
4%
5%
6%
7%
8%
9%
10%
2017/18 % ChangeNov-Oct2017/18
% ChangeYTD 2018 vYTD 2017
FIGURE 25
London – undistributed operating expenses PAR (£)
Source: HotStats, Knight Frank Research
0
2
4
6
8
10
12
UtilitiesPOMSales &Marketing
A&GAn
nual
% C
hang
e
PAR
-6%
-4%
-2%
0%
2%
4%
6%
8%
2017/18 % ChangeNov-Oct2017/18
% ChangeYTD 2018 vYTD 2017
FIGURE 26
UK regional – undistributed operating expenses PAR (£)
Source: HotStats, Knight Frank Research
Source: HotStats, Knight Frank ResearchSource: HotStats, Knight Frank ResearchGOP PAR £
0 30 60 90 120 150
UK R
EGIO
NAL
LOND
ON
Luxury
Upper upscale
Upper midscale
Luxury independent hotels
Conference hotels
Top 20 UK regional cities (by TrevPAR)
Upper upscale
Upper midscale
Select Service upper midscale
Secondary towns/cities
FIGURE 27
Gross Operating Profit PAR (£) by Hotel Asset Class Rolling 12 Months Nov-Oct 2017/2018
-2%
-1%
0%
1%
2%
3%
4%
5%
TrevPAR GOI PAR % change GOPPAR % change
% C
hang
e
Upper upscale
Top 20 UKregional cities(By TrevPAR)
UK RegionalSecondary
Towns/Cities
Uppermidscale
Upper upscale
LuxuryUppermidscale
Select serviceupper midscale
UK REGIONAL LONDON
FIGURE 28
Hotel profitability – key performance indicators % change Rolling 12 months Nov-Oct 2017/2018
GOPPAR fully evaluates the various revenue, profit and cost centres of a hotel and, therefore, provides a more sophisticated and accurate indication of how well a hotel is trading. Furthermore, whilst RevPAR is strongly correlated with GOPPAR, for certain properties, where the profit contribution from Rooms revenue is lower due to substantial ancillary revenues, GOPPAR rather than RevPAR may be a more appropriate measure.
Our analysis shows that a positive change in RevPAR does not automatically imply a similar growth GOPPAR. For the rolling 12-month period to October 2018, our sample set of London hotels achieved a RevPAR growth of 2.8%, but with rising costs GOPPAR growth was much lower at 1.2% for the 12-month period. Other specific London datasets which experienced positive RevPAR growth but declining or minimal GOPPAR included London’s luxury hotels (0.9%) and London’s conference hotels (0.5%). However, for the ten month period to October YTD 2018, improving RevPAR of 3.8% in London has resulted in growth in GOPPAR of +2.7%, as well as comparable uplifts in GOPPAR in other London datasets, with the exception of the mid-market hotels which has seen a high rise in its undistributed costs.
For the rolling 12-month period Nov-Oct 2017/18, utility costs PAR have increased by 5.3% PAR in regional UK, rising to 6.7% for the period to October YTD 2018. In London, utility costs have risen by 8.8% PAR for the rolling 12-month period to October 2018, but with heightened price increases in 2018, energy costs have risen by 9.5% PAR for the YTD period. In certain hotel data sets the percentage change in energy costs is even more pronounced, with a double digit rise in energy costs in upper-upscale hotels for both London and regional UK. On average utility costs equate to approximately 2.5% of Total Revenue in London and 4.1% of Total Revenue in regional UK.
Hilton Garden Inn Doncaster Racecourse (Opened September 2018)
Crowne Plaza Mancherster – Oxford Road (Opened September 2018)

1918
UK HOTEL TRADING PERFORMANCE REVIEW RESEARCH
At this current time, clarity over the UK’s exit from the EU remains far from clear. The prolonged Brexit negotiations and the volatile political and economic climate make it increasingly difficult for businesses to make informed decisions regarding future investment and direction. The latest inbound tourism statistics, published by Visit Britain, for the first six months of 2018, have recorded a 7% decline in overseas visits to the UK, with an 8% decline in business travel and a 9% fall in overseas holidaymakers. However, the UK economy has rebounded over the summer months, achieving GDP growth of 0.7% between June and August 2018, with strong growth in particular coming from the tech and media industries. Meanwhile, with UK unemployment down to just 4% and UK pay growth at its highest level in nearly a decade, this presents further challenges to the hotel sector, with a shortage of labour and the increased cost of payroll all
significant issues, presenting real concerns for the UK hotel industry.
Looking to the year ahead, we retain a cautious yet optimistic outlook, particularly for London, as we forecast RevPAR growth in 2019 of 2.4% in the capital, as the city will continue to be a strong performer on a global scale, benefitting from its international gateway city status. We anticipate the regional UK market will retain its vigour, with RevPAR growth of 2.5%, however, the Top 20 UK towns/cities will continue to outperform the wider regional UK market for which we forecast 3.8% RevPAR growth.
Whilst RevPAR growth rates have slowed, controlling costs will become even more significant in order to preserve and enhance a hotel’s profitability. The impact of a growing shortage of labour is expected to intensify further, with payroll costs continuing to spiral upwards. Staff
retention is set to become a priority, with the situation exasperated by more intense competition for trained staff by the volume of new hotel supply continuing to enter the market. Improving productivity through creative, smarter operating practices and embracing the latest hotel technologies are set to become important key differentiators in maintaining a healthy bottom line.
Furthermore, as intensive users of energy, there has never been a more critical time for the hotel sector to find innovative and affordable ways of reducing energy consumption and to prioritise investment in order to pursue opportunities in energy efficiency. In doing so, the demands of high energy use can be met in a cost efficient way, thereby reducing energy spend, enhancing profitability and benefiting from offering a greener, more sustainable hotel.
SCOTLAND
£42
NORTH EAST
£26YORKSHIRE& HUMBER
£29
EASTMIDLANDS
£28
EAST OFENGLAND
£34
SOUTH EAST
£42
NORTH WEST
£37
WESTMIDLANDS
£37
WALES
£35
SOUTH WEST
£32LONDON
£86
<30% 30%-33%33.1%-35%35%+
GOP AS A % OFTOTAL REVENUE
KEY
FIGURE 29
Hotel profitability, gross operating profit PAR (£) Nov-Oct 2017/18
Source: HotStats, Knight Frank Research
Regional UK datasets show that for the ten-month period to October YTD, regional hotels have been more severely affected by rising departmental operating costs resulting in marginal or no growth in the GOI. Combined with increased costs in the undistributed operating expenses, this has resulted in the majority of the Regional UK datasets to suffer declining or minimal growth in GOP.
With hotels having an element of both fixed and variable costs, a hotel has to breakeven prior to any RevPAR growth having a material positive impact on the hotel’s profitability. Hence, why, as at October YTD 2018, with an increasing cost base, an improvement in RevPAR growth does not always deliver similar growth in the GOP. The importance of understanding fixed and variable costs is essential in order to determine a hotel’s break-even point. The type of hotel can also influence the ratio of fixed to variable costs, with the select service and mid-market datasets seen to be operating at a higher than average fixed cost, with the rise in undistributed operating expenses impacting upon profitability more so than other hotel types.
GLOSSARY OF TERMSBAR Best Available Rate
POR Per Occupied Room
PAR Per Available Room
OCCUPANCY % The number of rooms sold as a proportion of available rooms for a specified time period.
ADR (AVERAGE DAILY RATE) Calculated by dividing a hotel’s total room revenue by the number of rooms sold for a specified time period.
REVPAR The total Rooms Revenue divided by the total number of available rooms during the period.
TREVPAR Total Revenue from all operating departments plus rental income divided by the total available rooms during the period.
GOI % / PARGross Operating Income – Total Revenue less total Departmental Operating Expenses; expressed as a percentage of Total Revenue or divided by the total available rooms during the period.
UNDISTRIBUTED OPERATING EXPENSESExpenses attributable to the whole hotel, but not allocated to a specific department. These expenses are typically split between Administration & General; Sales & Marketing; Property, Operations & Maintenance; and Utilities.
GOP Total Revenue less Operating Expenses (Departmental Expenses and Undistributed Operating Expenses).
GOPPAR Total Gross Operating Profit across all revenue streams divided by total available rooms during the period.
PAYROLL % Departmental Payroll (or Total Departmental Payroll) as a percentage of departmental revenue (or total revenue).
TRADING PERFORMANCE OUTLOOKKAREN CALLAHAN MRICS Head of Hotel Valuation
Residence Inn Aberdeen, Opened October 2018
With hotels having an element of both fixed and variable costs, a hotel has to breakeven prior to any RevPAR growth having a material positive impact on the hotel’s profitability.

Knight Frank Research Reports are available at KnightFrank.com/Research
RECENT MARKET-LEADING RESEARCH PUBLICATIONS
UK Hotel Capital Markets Investment Review - 2018
Global Cities Report - 2018
UK Hotel Development Opportunities - 2018
Specialist Property Report - 2018 - The Human Factor
HOTELS TEAM
Alex BradbeerAssociate, Valuations
Karen Callahan Partner
HOTEL RESEARCH
Philippa Goldstein Hotel Analyst, +44 20 3826 0600 [email protected]
HOTELS
Shaun Roy MRICS Partner, Head of Hotels +44 20 7861 1222 [email protected]
Karen Callahan MRICS Partner, Head of Hotel Valuation +44 20 7861 1086 [email protected]
Henry Jackson MRICS Partner, Head of Hotel Agency +44 20 7861 1085 [email protected]
Knight Frank Research provides strategic advice, consultancy services and forecasting to a wide range of clients worldwide including developers, investors, funding organisations, corporate institutions and the public sector. All our clients recognise the need for expert independent advice customised to their specific needs.
We would like to express our greatest thanks to the HotStats team who have helped us in our research, with particular to David Stephens. The samples of hotels profiled in this report are drawn from intelligence collated from the HotStats database, which collects data from participating hotels on a monthly basis for benchmarking purposes. Without access to this data, the detail provided in this publication would not have been possible.
©HotStats Limited 2018. Unless otherwise attributed, all material in this press release is the copyright of HotStats Limited.
Front cover picture: Ibis Styles London Ealing (Opened June 2018)
Important Notice
This general document is provided strictly on the basis that you cannot rely on its contents and Knight Frank LLP (and our affiliates, members and employees) will have no responsibility or liability whatsoever in relation to the accuracy, reliability, currency, completeness or otherwise of its contents or as to any assumption made or as to any errors or for any loss or damage resulting from any use of or reference to the contents. You must take specific independent advice in each case. It is for general outline interest only and will contain selective information. It does not purport to be definitive or complete. Its contents will not necessarily be within the knowledge or represent the opinion of Knight Frank LLP. Knight Frank LLP is a property consultant regulated by the Royal Institution of Chartered Surveyors and only provides services relating to real estate, not financial services. It was prepared during the period of October 2018. It uses certain data available then, and reflects views of market sentiment at that time. Details or anticipated details may be provisional or have been estimated or otherwise provided by others without verification and may not be up to date when you read them. Computer-generated and other sample images or plans may only be broadly indicative and their subject matter may change. Images and photographs may show only certain parts of any property as they appeared at the time they were taken or as they were projected. Any forecasts or projections of future performance are inherently uncertain and liable to different outcomes or changes caused by circumstances whether of a political, economic, social or property market nature. Prices indicated in any currencies are usually based on a local figure provided to us and/or on a rate of exchange quoted on a selected date and may be rounded up or down. Any price indicated cannot be relied upon because the source or any relevant rate of exchange may not be accurate or up to date. VAT and other taxes may be payable in addition to any price in respect of any property according to the law applicable.
© Knight Frank LLP 2018. All rights reserved. No part of this presentation may be copied, disclosed or transmitted in any form or by any means, electronic or otherwise, without prior written permission from Knight Frank LLP for the specific form and content within which it appears. Each of the provisions set out in this notice shall only apply to the extent that any applicable laws permit. Knight Frank LLP is a limited liability partnership registered in England with registered number OC305934 and trades as Knight Frank. Our registered office is 55 Baker Street, London W1U 8AN, where you may look at a list of members’ names. Any person described as a partner is a member, consultant or employee of Knight Frank LLP, not a partner in a partnership.
Ellie KilfordGraduate, Valuations
Alex MacaulayGraduate, Agency
Josh Aspland-RobinsonSurveyor, Valuations
Liliana LelacquaAssociate, Valuations
Henry Jackson Partner
Kit AbramSenior Surveyor, Agency
Shaun RoyPartner