Embed Size (px)
DESCRIPTION
trading
Citation preview

TradingPairs
WhistlerFm.qxd 6/4/04 8:13 PM Page 1 Quark08 Quark08:Books:GK-Jobs:GK15/WHISLER:Chapter:

Founded in 1807, John Wiley & Sons is the oldest independent publishingcompany in the United States. With offices in North America, Europe,
Australia, and Asia, Wiley is globally committed to developing andmarketing print and electronic products and services for our customers’
professional and personal knowledge and understanding.
The Wiley Trading series features books by traders who have survived themarket’s ever-changing temperament and have prospered—some by
reinventing systems, others by getting back to basics. Whether a novicetrader, professional, or somewhere in between, these books will provide
the advice and strategies needed to prosper today and well into the future.
For a list of available titles, please visit our Web site atwww.WileyFinance.com.
WhistlerFm.qxd 6/4/04 8:13 PM Page 2 Quark08 Quark08:Books:GK-Jobs:GK15/WHISLER:Chapter:
TradingPairs
Capturing Profits and
Hedging Risk with Statistical
Arbitrage Strategies
John Wiley & Sons, Inc.
MARK WHISTLER
WhistlerFm.qxd 6/4/04 8:13 PM Page 3 Quark08 Quark08:Books:GK-Jobs:GK15/WHISLER:Chapter:
Copyright © 2004 by Mark Whistler. All rights reserved.
Published by John Wiley & Sons, Inc., Hoboken, New Jersey Published simultaneously in Canada
No part of this publication may be reproduced, stored in a retrieval system, or transmitted in anyform or by any means, electronic, mechanical, photocopying, recording, scanning, or otherwise,except as permitted under Section 107 or 108 of the 1976 United States Copyright Act, without eitherthe prior written permission of the Publisher, or authorization through payment of the appropriateper-copy fee to the Copyright Clearance Center, Inc., 222 Rosewood Drive, Danvers, MA 01923. 978-
mission should be addressed to the Permissions Department, John Wiley & Sons, Inc., 111 RiverStreet, Hoboken, NJ 07030, 201-748-6011, fax 201-748-6008, e-mail: [email protected].
Limit of Liability/Disclaimer of Warranty: While the publisher and author have used their best effortsin preparing this book, they make no representations or warranties with respect to the accuracy orcompleteness of the contents of this book and specifically disclaim any implied warranties of mer-chantability or fitness for a particular purpose. No warranty may be created or extended by salesrepresentatives or written sales materials. The advice and strategies contained herein may not besuitable for your situation. You should consult with a professional where appropriate. Neither thepublisher nor author shall be liable for any loss of profit or any other commercial damages, includ-ing but not limited to special, incidental, consequential, or other damages.
For general information on our other products and services, or technical support, please contact ourCustomer Care Department within the United States at 800-762-2974, outside the United States at317-572-3993, or fax 317-572-4002.
Wiley also publishes its books in a variety of electronic formats. Some content that appears in printmay not be available in electronic books.
For more information about Wiley products, visit our Web site at www.wiley.com.
Library of Congress Cataloging-in-Publication Data:
Whistler, Mark.Trading pairs : capturing profits and hedging risk with statistical
arbitrage strategies / Mark Whistler.p. cm. — (Wiley trading)
Includes bibliographical references and index.ISBN 0-471-58428-2 (cloth/cd-rom)
1. Pairs trading. 2. Stocks. I. Title. II. Series.HG4661.W46 2004332.64’5—dc22
2004002263
Printed in the United States of America
10 9 8 7 6 5 4 3 2 1
WhistlerFm.qxd 6/4/04 8:13 PM Page 4 Quark08 Quark08:Books:GK-Jobs:GK15/WHISLER:Chapter:
750-8400, fax 978-750-4470, or on the Web at www.copyright.com. Requests to the Publisher for per-

Acknowledgments xi
Introduction xiii
CHAPTER 1 The Nuts and Bolts 1
What Are Pairs? 1
How Do Pairs Work? 3
Who Uses Pairs? 3
Mindset of Reading This Book 4
CHAPTER 2 Why Fundamental Analysis? 5
Common Sense 5
China.com 6
How Fundamental Analysis Relates to Pairs 8
CHAPTER 3 Market Basics 9
Growth and Growth Ratios 12
Growth, PE, and the PEG Ratio 15PE Ratio 15
PEG Ratio 17
Tying It All Together 19
CHAPTER 4 Technical Analysis 21
Candlestick Charting 23Hammer Bottoms and Hangman Tops 23
Doji Star 25
v
Contents
WhistlerFm.qxd 6/4/04 8:13 PM Page v Quark08 Quark08:Books:GK-Jobs:GK15/WHISLER:Chapter:
vi CONTENTS
Shooting Stars 25
Engulfing Patterns 26
Support and Resistance 28
Trend Lines 28
Moving Averages 30
CHAPTER 5 Technical Analysis Indicators 33
Stochastics 33
Chaikin Money Flow Oscillator 35
On-Balance Volume 36
Relative Strength Index 36
CHAPTER 6 Basic Pairs Terminology 41
Understanding the Correlation 41
Spread, Differential, and Ratio 42Spread 43
Differential 43
Ratio 43
Divergence Trading 44
Convergence Trading 45
CHAPTER 7 Importing Data into Excel 47
CHAPTER 8 Understanding Correlations—Steve Price 51
CHAPTER 9 Correlation Simplified 59
What Is a Correlation? 59
Where to Find Correlations 59
Building a Correlation Using Excel 60
WhistlerFm.qxd 6/4/04 8:13 PM Page vi Quark08 Quark08:Books:GK-Jobs:GK15/WHISLER:Chapter:
Contents vii
CHAPTER 10 Understanding Stock Correlations in Relation to Indices 65
Why an Index? 65
What Is Beta? 65
How to Apply Beta 66
Where to Find Beta 67
CHAPTER 11 Basic Statistics 69
Frequency Distribution 69
Mean/Median/Mode 71
Mean Deviation 71
Variance 71
Standard Deviation 72
CHAPTER 12 Excel and Statistics 75
Setting Up the Spreadsheet 75
Average, Median, Mode, and Standard Deviation 77
Understanding the Present Data 80
How Do You Know Which Stock to Buy or Short? 80
Charting the Data 83
CHAPTER 13 Differential versus Ratio 87
Differential 87
Ratio 88
CHAPTER 14 Applying Statistics to Pairs 89
Density Curve 89
Understanding the Data 92
CHAPTER 15 Taking a Step Back for a Moment 95
WhistlerFm.qxd 6/4/04 8:13 PM Page vii Quark08 Quark08:Books:GK-Jobs:GK15/WHISLER:Chapter:

viii CONTENTS
CHAPTER 16 Moving Averages and Normalized Standard Deviation 97
Differential Moving Average 97
Normalized Standard Deviation 99
CHAPTER 17 Money Management 101
Why Money Management? 101
Psychology of Money Management 101
Understanding How Pairs Can Be Dangerous 103
CHAPTER 18 Money Management II 105
Fundamental Principles 105
Know Yourself 106
The Plan 106
CHAPTER 19 The Reality of Pairs 109
Do Pairs Really Work? 109
Trader or Investor? 113
Making the Style Work for You 113
Intraday Pairs 115
CHAPTER 20 Trading an Actual Pair 119
Introduction 119
Trading Diary—The Beginning 120
Historical Time Line of Divergence Events 122
CHAPTER 21 The Current Setup 133
Understanding Where the Pair Is Now 133Fundamentals 133
Earnings 134
Technical Analysis 135
Statistics 137
Summary 137
WhistlerFm.qxd 6/4/04 8:13 PM Page viii Quark08 Quark08:Books:GK-Jobs:GK15/WHISLER:Chapter:
Contents ix
Anadarko Petroleum 138Fundamentals 138
Earnings 140
Technical Analysis 140
Statistics 141
Summary 141
CHAPTER 22 Trading Diary 143
CHAPTER 23 Correlating Stocks to Indices 187
General Electric and ExxonMobil 187
General Electric and the DIAMONDS 189
ExxonMobil and the DIAMONDS 189
The Three Wise Men 193
CHAPTER 24 Option Basics—Scott P. Evans 195
CHAPTER 25 Understanding Volatility 201
What Is Volatility? 201
Volatility Position Sizing in Your Spreadsheet 201
Volatility and the Individual Stock 204
Weighted Volatility 205
CHAPTER 26 Understanding Volatility and Options 207
Speed and Option Premium 207
Option Strategies for Pairs 208Calls/Puts 208
Covered Calls/Puts 208
CHAPTER 27 Using Technical and Fundamental Analysis with Pairs 211
Technical Analysis 212Moving Averages 212
WhistlerFm.qxd 6/4/04 8:13 PM Page ix Quark08 Quark08:Books:GK-Jobs:GK15/WHISLER:Chapter:

x CONTENTS
Stochastics and Other Indicators 213
Volume 215
Fundamentals 216Price-to-Earnings (PE) Ratio 217
Price-to-Sales Ratio 219
KBH Homes and Tol Brothers 220
Moving Averages and Support and Resistance as Stops 225
CHAPTER 28 Assorted Advice to Assist Trading 229
CHAPTER 29 The Monitor Sheet 233
CHAPTER 30 Conclusion 237
The Market Bubble 237
Words of Caution 237
Last Words of Advice 238
Appendix I Economic Indicator Summary 239
Appendix II Web sites, Books, and Software 255
Endnotes 257
Glossary—Jonathan Crowell and with Additions from
Andrew and Aaron Long 261
Index 269
About the CD-ROM 273
WhistlerFm.qxd 6/4/04 8:13 PM Page x Quark08 Quark08:Books:GK-Jobs:GK15/WHISLER:Chapter:

I would like to dedicate this book to you, Mary; I am so proud of you for allof your accomplishments. Sandy and Ed—your love and support has mademe the man I am today. Words cannot express my love for you. Sue, Neil, andKaren and Mike Eck—thank you for being who you are; I love you and youare the most wonderful people in the world. I would like to thank LeighStevens, Pamela Van Giessen, and Lara Murphy for making this book a real-ity, without you this would book would have never made it to print. Thankyou so much Scot Darr, Steve Price, Scott P. Evans, Jonathan Crowell,Andrew Long, and Aaron Long for your amazing help and contributions.Francois Safeddine, our trading cemented my knowledge—thank you. KevinCuddie, Eric Perlstein, and all of the guys at ETG Securities in Denver—youtruly are super traders. Also, thank you Noel Smith and Mike Palumbo(Third Millenium Securities—Chicago) for your time—which helped togreatly further my options knowledge. To all of my loving family on the EastCoast, you are amazing and magnificent. Hugh McCulloh, though you maynot know this, your guidance two years ago helped make this book, the Website, and the software possible. I would also like to thank some wonderfulpeople for being who you are, and helping make me who I am: Paul, Lauren,and Alexis Whistler; John Crowley (the man who first opened my eyes topairs); Randy and Maddie Nichols; and Sally Schultz (thanks for helping mepass the fourth grade). Diane Hall, you are the most brilliant godmother any-one could ever ask for, I love you. And last, but certainly not least—SaraJacobson, Raifford Patton, and Mark Kuniholm—thank you so much forbeing there when I needed you most.
Acknowledgments
xi
WhistlerFm.qxd 6/4/04 8:13 PM Page xi Quark08 Quark08:Books:GK-Jobs:GK15/WHISLER:Chapter:

WhistlerFm.qxd 6/4/04 8:13 PM Page xii Quark08 Quark08:Books:GK-Jobs:GK15/WHISLER:Chapter:
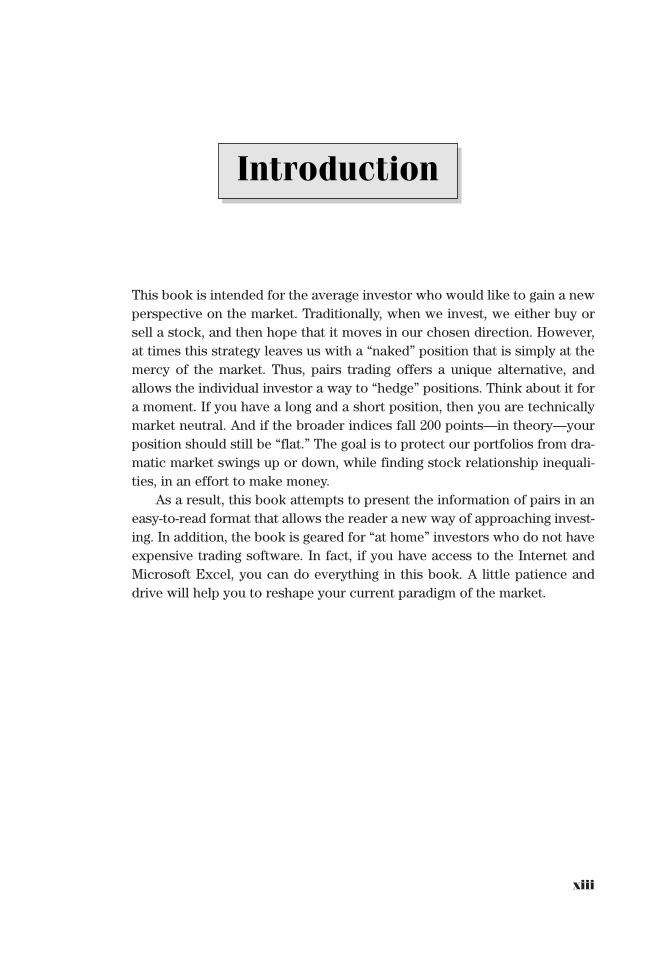
This book is intended for the average investor who would like to gain a newperspective on the market. Traditionally, when we invest, we either buy orsell a stock, and then hope that it moves in our chosen direction. However,at times this strategy leaves us with a “naked” position that is simply at themercy of the market. Thus, pairs trading offers a unique alternative, andallows the individual investor a way to “hedge” positions. Think about it fora moment. If you have a long and a short position, then you are technicallymarket neutral. And if the broader indices fall 200 points—in theory—yourposition should still be “flat.” The goal is to protect our portfolios from dra-matic market swings up or down, while finding stock relationship inequali-ties, in an effort to make money.
As a result, this book attempts to present the information of pairs in aneasy-to-read format that allows the reader a new way of approaching invest-ing. In addition, the book is geared for “at home” investors who do not haveexpensive trading software. In fact, if you have access to the Internet andMicrosoft Excel, you can do everything in this book. A little patience anddrive will help you to reshape your current paradigm of the market.
xiii
Introduction
WhistlerFm.qxd 6/4/04 8:13 PM Page xiii Quark08 Quark08:Books:GK-Jobs:GK15/WHISLER:Chapter:

WhistlerFm.qxd 6/4/04 8:13 PM Page xiv Quark08 Quark08:Books:GK-Jobs:GK15/WHISLER:Chapter:

TradingPairs
WhistlerFm.qxd 6/4/04 8:13 PM Page xv Quark08 Quark08:Books:GK-Jobs:GK15/WHISLER:Chapter:

WhistlerFm.qxd 6/4/04 8:13 PM Page xvi Quark08 Quark08:Books:GK-Jobs:GK15/WHISLER:Chapter:
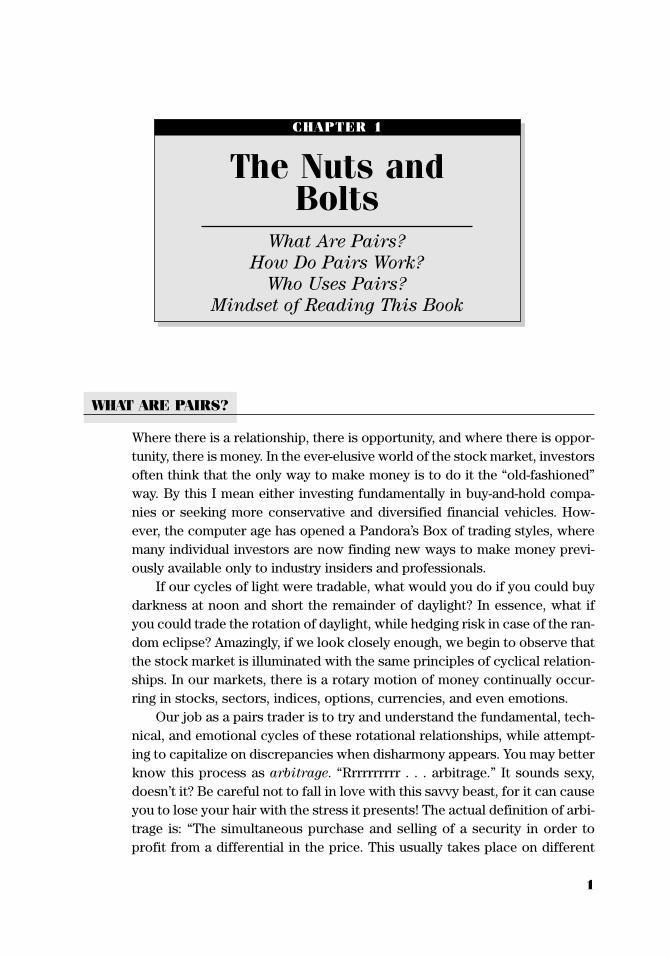
1
WHAT ARE PAIRS?
Where there is a relationship, there is opportunity, and where there is oppor-tunity, there is money. In the ever-elusive world of the stock market, investorsoften think that the only way to make money is to do it the “old-fashioned”way. By this I mean either investing fundamentally in buy-and-hold compa-nies or seeking more conservative and diversified financial vehicles. How-ever, the computer age has opened a Pandora’s Box of trading styles, wheremany individual investors are now finding new ways to make money previ-ously available only to industry insiders and professionals.
If our cycles of light were tradable, what would you do if you could buydarkness at noon and short the remainder of daylight? In essence, what ifyou could trade the rotation of daylight, while hedging risk in case of the ran-dom eclipse? Amazingly, if we look closely enough, we begin to observe thatthe stock market is illuminated with the same principles of cyclical relation-ships. In our markets, there is a rotary motion of money continually occur-ring in stocks, sectors, indices, options, currencies, and even emotions.
Our job as a pairs trader is to try and understand the fundamental, tech-nical, and emotional cycles of these rotational relationships, while attempt-ing to capitalize on discrepancies when disharmony appears. You may betterknow this process as arbitrage. “Rrrrrrrrrr . . . arbitrage.” It sounds sexy,doesn’t it? Be careful not to fall in love with this savvy beast, for it can causeyou to lose your hair with the stress it presents! The actual definition of arbi-trage is: “The simultaneous purchase and selling of a security in order toprofit from a differential in the price. This usually takes place on different
CHAPTER 1
The Nuts andBolts
What Are Pairs?
How Do Pairs Work?
Who Uses Pairs?
Mindset of Reading This Book
GK015-C01[1-4].qxd 6/10/04 7:24 PM Page 1 Virender Negi Quark07:BOOKS:GK015-Whistler:Quark files:
exchanges or marketplaces.” (EN 1.1) For the pairs trader, though, we willutilize another form of arbitrage called “statistical arbitrage,” which means:“A profit situation arising from pricing inefficiencies between securities.Investors identify the arbitrage situation through mathematical modelingtechniques.” (EN 1.2) For the purposes of this book, we will focus mainly onusing statistics to (1) identify relationships, (2) assist in determining thedirection of the relationship, and (3) ascertain how to execute our tradesbased on the data presented.
Also, in this text, we will use the term pairs trading interchangeablywith statistical arbitrage, thus eliminating any possible conflict of semantics.So what exactly is pairs trading and/or statistical arbitrage? Pairs trading isa style of investing/trading that attempts to institute at least one long andone short position for every trade, while statistically analyzing the relation-ship presented. (EN 1.1) What’s more, the pairs trader attempts to capitalizeon market imbalances between two or more stocks (or other financialinstruments) in anticipation of making money when the inequality is cor-rected. In short, the pairs trader believes two or more stocks have enough ofa correlated relationship that statistical analysis will unveil tradable oppor-tunities when the stocks move away from one another. When the two beginto secede from one another, the pairs trader will try to figure out “why” theyare separating and then institute a trade in an attempt to capitalize on eitheradditional divergence or possible reconvergence.
To measure these relationships, the pairs trader uses statistics, funda-mentals, technical analysis, and even probabilities. One of the main keys topairs trading is finding strong correlations between financial instruments,thus building a foundation for further analysis. We then hope to dissect theempirical data in an effort to unearth information that allows us an efficientand methodical way of attempting to make money in the stock market. Thekey word here is methodical. I would like to distinguish this word fromsystem, as it is important to recognize that we are trying to approach themarket with an orderly (backed by statistics in the case of pairs) but notautomated trading strategy. What’s more, in the first few chapters of thisbook I hope to relay a few commonsense nuggets of fundamental and tech-nical information that will help assist in making accurate decisions when ourmath fails. The overall goal of this book is to empower the individualinvestor with an entirely distinctive paradigm of trading than the typical buy-and-hold strategy. Pairs trading is by no means the “holy grail” of trading andwill have its ups and downs, like any other trading style. However, with theproper base of applicable knowledge and impeccable money managementskills, we may find ourselves with an effective trading strategy with which towork from.
2 TRADING PAIRS
GK015-C01[1-4].qxd 6/10/04 7:24 PM Page 2 Virender Negi Quark07:BOOKS:GK015-Whistler:Quark files:

The Nuts and Bolts 3
HOW DO PAIRS WORK?
Take a moment and imagine a highway and the service road that parallels it.Generally, the service road will follow the highway very closely, exceptwhere terrain or development prevents such. The resulting situation is adivergence of the service road from the highway, while the obstacle is over-come. In the end, the service road will almost always come back togetherwith the highway, as the two have a very highly correlated relationship. Now,imagine the area in between the service road and highway. This area isknown as the spread. The spread is the measured distance between the twoobjects traveling together. The pairs trader attempts to measure the spreadwith statistics in an effort to find a tradable relationship of inequality oppor-tunities, otherwise known as the previously mentioned arbitrage.
The key is the correlation between two (or more) stocks, sectors,indices, or other financial instruments to be studied. Because a highway andservice road parallel one another more closely than a highway and TownBoulevard, the highway and service road will likely have a higher correlationthan the latter two. I don’t want to leave you with the impression that thereisn’t opportunity to make money between the highway/boulevard relation-ship. However, one must simply understand the risks presented when usinga lower correlation or, in this case, a lesser correlated group of roads.
In fact, think of all the wonderful opportunities with a lower-correlatedgroup of roads. If the highway is the benchmark road that passes a town, itis likely that several roads within the town parallel the interstate. As a trad-ing analogy, this simple observation may allow the trader to buy and sellmany smaller streets, avenues, or boulevards using the interstate as a largerguide of general direction. This would be the same as using an index like theDow Jones Industrial Average as a benchmark for trend, while buying andselling (shorting) many components within that particular index.
Thus, in a nutshell, pairs trading works by betting that two or more securi-ties will diverge or converge in price. You are betting that a $50 stock and a $55stock will either have a larger or smaller spread ($5 in this case) when the tradeis closed. Divergence traders would like to see the spread increase, while con-vergence traders would prefer to see the spread decrease.
WHO USES PAIRS?
Anyone and everyone! Historically, pairs trading has been more of an “insti-tutional” trading style (coveted by hedge funds) for wealthy investors orthose with trading savvy who invest for a living. (As a brief side note, while
GK015-C01[1-4].qxd 6/10/04 7:24 PM Page 3 Virender Negi Quark07:BOOKS:GK015-Whistler:Quark files:
4 TRADING PAIRS
hedge funds seem mysterious, they are simply mutual finds that can goshort. That is not to say that all mutual funds cannot go short, though for themost part, many are able to purchase only long positions.) As computershelp to unlock much of the mystery of the financial markets for the averageinvestor, many individuals use the strategy to either “hedge” portfolios or inan effort to make money by intraday or swing trading. (Swing trading refersto holding a position anywhere from two days to several weeks.)
It is generally true that institutional investors require more complicatedanalysis and statistics, though at the heart of the issue, the fundamental con-cept is the same.
In fact, by the end of this book, my goal is to teach you, the individualinvestor (or institutional trader), how to create live spreadsheets and trackpairs like a pro! The bottom line is anyone can use pairs, so don’t fear theconcept. As Franklin D. Roosevelt said in 1933, “The only thing we have tofear is fear itself.”
MINDSET OF READING THIS BOOK
First, grab a cold beer . . . just kidding—maybe wait until Chapter 3!!! If yousmiled or chuckled just now, great! If not, put this book down and seriouslygo get some air; it’s time to relax. While trading is a very serious business,and should be approached with complete dedication, it is also important toremember to take life in strides. This book was written with a pinch ofhumor, while attempting to uncover the very dry (but incredibly interesting)subject of pairs.
My only point here is that you shouldn’t take trading so seriously thatyou forget to kiss your loved ones goodnight or forsake spending time withfriends on weekends to work.
This book is written in plain simple English, to make it an easy and funread. Pairs trading can be a complicated enough subject; thus, it is my goalto make this book NOT! That being said, please read this book with an openmind and remember that pairs trading is not only a foreign concept to many,but can also pull the “old switcheroo” on you at times. At some points youmay say, “That doesn’t make sense.” If a concept, number, or strategy eludesyou, please simply read on, and you may find yourself having an epiphanyshortly after.
In short, read this book while intoxicated and question nothing. Kidding.
GK015-C01[1-4].qxd 6/10/04 7:24 PM Page 4 Virender Negi Quark07:BOOKS:GK015-Whistler:Quark files:
5
COMMON SENSE
Before I begin to get into pairs, it is important that I build a small foundationfor which to lay our new pairs knowledge on. I will first cover fundamentalanalysis and then briefly tackle technical analysis. Fundamentally, it isimportant to understand at least a little bit about why stocks move as theydo. In other words, it is incredibly valuable to try to understand how andwhy a stock is currently priced. It is not my goal to make you a superstaranalyst, nor am I claiming to have a “fundamental” formula that will miracu-lously decipher stock valuation. Rather, I am merely attempting to try andmake sure that we all have fundamental common sense built on a few easilyidentifiable numbers.
Fundamental common sense is a necessity, not only to the pairs trader,but to the directional investor as well. Analysts generally study long andhard to truly understand all of the internal workings of a company. However,as a common investor, you may not have 12 hours a day to commit to suchanalysis. Or perhaps you do not have time to study for the Chartered FinancialAnalyst (CFA) designation or the Certified Financial Planner (CFP) title. Ifnot, it is extremely important to at least know where a company stands—ifonly scratching the surface of fundamental analysis.
The information in the next few chapters is designed to assist investorsin attempting to understand where a company is headed during the nearterm. On a commonsense level, if you are directional trading or pairs trading,
CHAPTER 2
WhyFundamental
Analysis?Common Sense
China.com
How Fundamental Analysis
Relates to Pairs
GK015-C02[5-8].qxd 6/10/04 7:24 PM Page 5 Virender Negi Quark07:BOOKS:GK015-Whistler:Quark files:
and a stock is moving away from you (you are losing money), please at least
take a look at the internal health of a company and consider the practical val-uation of the situation. While you may be reading this and possibly saying toyourself “Yeah bub, tell me something I don’t know,” I encourage you to takea brief moment to remember recent history. How many investors overlookedthe reality of the late 1990s Internet bubble and the numerous overextendedprice-to-earnings (PE) ratios before the bear market ravaged countless port-folios? If you lost money by denying fundamentals during the bubble, thenperhaps the next chapter is for you.
CHINA.COM
No matter how much we would like to believe otherwise, even when themarket may seem most exuberant, company-specific fundamentals cannotbe denied. Spot on; retail investors are usually too quick to overbuy somestocks that seem too good to be true! We have definitely witnessed thisthrough the trading action of many Internet stocks over the last few years.Amazingly, even though you would think we might have learned our lesson,there are still many crazy bulls out there looking for any opportunity to jumpon the Internet bandwagon. For example, a newsletter that I recently wrotefor (briefly) profiled the Internet stock China.com in July 2003.
On Thursday, July 31, 2003, we received a question from one subscriberinquiring whether China.com was “worth its salt at the present time?” Thesubscriber was trying to decide whether he should buy China.com eventhough the stock had run from $5 per share to $12 per share in just undertwo months. China.com had gained almost 140 percent in just 45 days fueledby rebounding bear market exuberance.
Our reply to the question was:
The daily chart of CHINA appears to be forming a lateral wedge as the
stock consolidates after running up almost 500% since October 2002.
In essence, exuberant bulls have sobered up and are now trying to
make sense of their new position. Typically, when a stock has a major
rally and then consolidates on lower volume, bulls are trying to set
themselves up for another leg up. Once the weaker hands are shaken
out of the stock, bulls will likely make an attempt at breaching descend-
ing resistance of the current wedge.
HOWEVER, in the case of CHINA (see Figure 2.1), one main prob-
lem exists . . . and that dilemma is valuation. Tom Jacobs from The
6 TRADING PAIRS
GK015-C02[5-8].qxd 6/10/04 7:24 PM Page 6 Virender Negi Quark07:BOOKS:GK015-Whistler:Quark files:
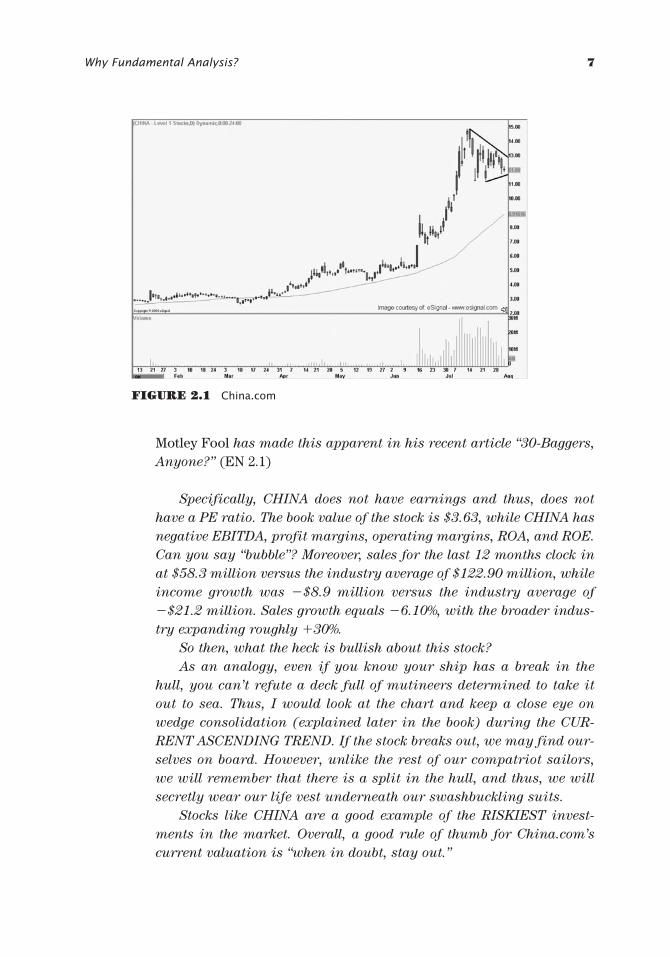
Why Fundamental Analysis? 7
Motley Fool has made this apparent in his recent article “30-Baggers,
Anyone?” (EN 2.1)
Specifically, CHINA does not have earnings and thus, does not
have a PE ratio. The book value of the stock is $3.63, while CHINA has
negative EBITDA, profit margins, operating margins, ROA, and ROE.
Can you say “bubble”? Moreover, sales for the last 12 months clock in
at $58.3 million versus the industry average of $122.90 million, while
income growth was �$8.9 million versus the industry average of
�$21.2 million. Sales growth equals �6.10%, with the broader indus-
try expanding roughly �30%.
So then, what the heck is bullish about this stock?
As an analogy, even if you know your ship has a break in the
hull, you can’t refute a deck full of mutineers determined to take it
out to sea. Thus, I would look at the chart and keep a close eye on
wedge consolidation (explained later in the book) during the CUR-
RENT ASCENDING TREND. If the stock breaks out, we may find our-
selves on board. However, unlike the rest of our compatriot sailors,
we will remember that there is a split in the hull, and thus, we will
secretly wear our life vest underneath our swashbuckling suits.
Stocks like CHINA are a good example of the RISKIEST invest-
ments in the market. Overall, a good rule of thumb for China.com’s
current valuation is “when in doubt, stay out.”
FIGURE 2.1 China.com
GK015-C02[5-8].qxd 6/10/04 7:24 PM Page 7 Virender Negi Quark07:BOOKS:GK015-Whistler:Quark files:
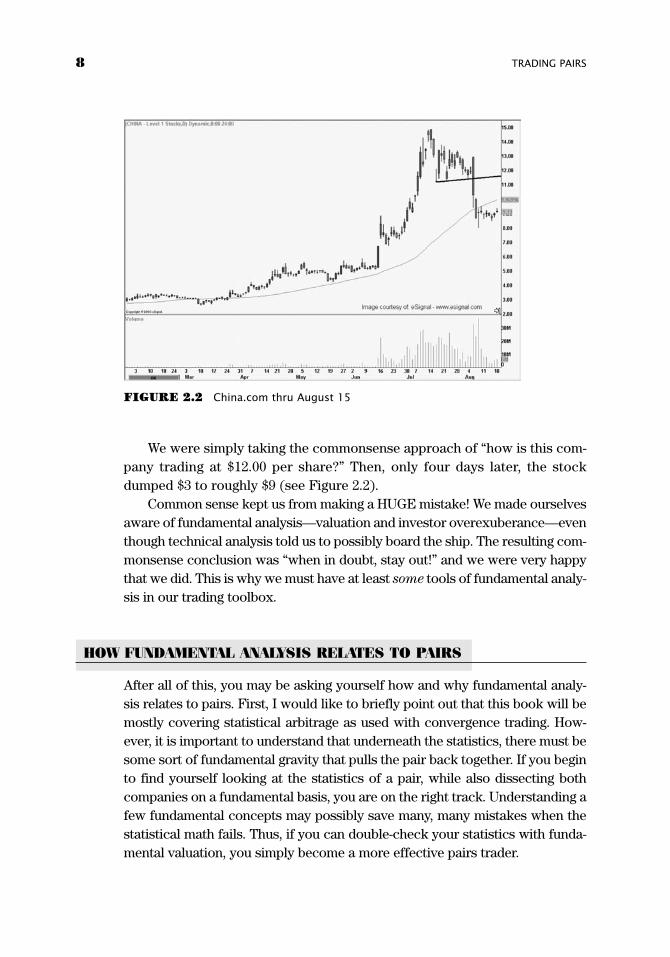
We were simply taking the commonsense approach of “how is this com-pany trading at $12.00 per share?” Then, only four days later, the stockdumped $3 to roughly $9 (see Figure 2.2).
Common sense kept us from making a HUGE mistake! We made ourselvesaware of fundamental analysis—valuation and investor overexuberance—eventhough technical analysis told us to possibly board the ship. The resulting com-monsense conclusion was “when in doubt, stay out!” and we were very happythat we did. This is why we must have at least some tools of fundamental analy-sis in our trading toolbox.
HOW FUNDAMENTAL ANALYSIS RELATES TO PAIRS
After all of this, you may be asking yourself how and why fundamental analy-sis relates to pairs. First, I would like to briefly point out that this book will bemostly covering statistical arbitrage as used with convergence trading. How-ever, it is important to understand that underneath the statistics, there must besome sort of fundamental gravity that pulls the pair back together. If you beginto find yourself looking at the statistics of a pair, while also dissecting bothcompanies on a fundamental basis, you are on the right track. Understanding afew fundamental concepts may possibly save many, many mistakes when thestatistical math fails. Thus, if you can double-check your statistics with funda-mental valuation, you simply become a more effective pairs trader.
8 TRADING PAIRS
FIGURE 2.2 China.com thru August 15
GK015-C02[5-8].qxd 6/10/04 7:24 PM Page 8 Virender Negi Quark07:BOOKS:GK015-Whistler:Quark files:
9
CHAPTER 3
Market BasicsGrowth and Growth Ratios
Growth, PE, and the PEG Ratio
Tying It All Together
First, there are a few concepts of elementary analysis that should beexamined in order to understand why companies “fundamentally”diverge. While much of this chapter is most likely review for some—
and definitely arguable by a few analysts—it is simply a commonsenseapproach to quickly gaining some idea of stock specific valuation, withinfive minutes or less. This chapter will not make you a professional analyst.Rather, it attempts to uncover a few easily accessible ways that the individ-ual investor can quickly glance at a company’s present and future financialhealth.
The following section will cover:
• Trading liquidity and shares outstanding• Understanding growth and growth ratios• Cash and the current ratio• Earnings and guidance
First, we must evaluate our personal risk preference to individualequity liquidity. Stocks that have less volume tend to be more erratic andvolatile, while stocks that trade more shares each day generally haveslower price movements. The greater a stock’s liquidity, the better chanceyou, the individual, have of getting filled at the price you specify to buy or sell.A good example of this is Microsoft (NASDAQ: MSFT) versus the regionalbank Cass Commercial Corporation (NASDAQ: CASS). While both stocksare equally difficult to predict, Microsoft will likely have less volatile short-term swings than a regional bank, due to greater liquidity. By this I meanthat because Microsoft has much more demand by investors to buy and sellstock at every penny, it will move up or down slower than a stock with lesstrading activity. When you want to sell your shares of Microsoft, you can be
GK015-C03[9-20].qxd 6/10/04 7:25 PM Page 9 Virender Negi Quark07:BOOKS:GK015-Whistler:Quark files:
10 TRADING PAIRS
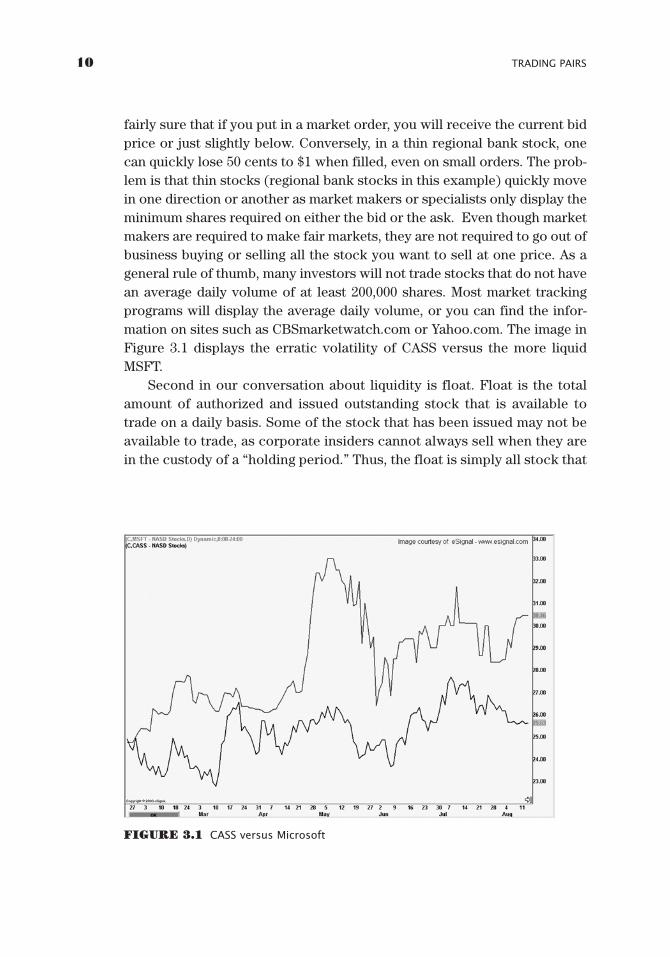
fairly sure that if you put in a market order, you will receive the current bidprice or just slightly below. Conversely, in a thin regional bank stock, onecan quickly lose 50 cents to $1 when filled, even on small orders. The prob-lem is that thin stocks (regional bank stocks in this example) quickly movein one direction or another as market makers or specialists only display theminimum shares required on either the bid or the ask. Even though marketmakers are required to make fair markets, they are not required to go out ofbusiness buying or selling all the stock you want to sell at one price. As ageneral rule of thumb, many investors will not trade stocks that do not havean average daily volume of at least 200,000 shares. Most market trackingprograms will display the average daily volume, or you can find the infor-mation on sites such as CBSmarketwatch.com or Yahoo.com. The image inFigure 3.1 displays the erratic volatility of CASS versus the more liquidMSFT.
Second in our conversation about liquidity is float. Float is the totalamount of authorized and issued outstanding stock that is available totrade on a daily basis. Some of the stock that has been issued may not beavailable to trade, as corporate insiders cannot always sell when they arein the custody of a “holding period.” Thus, the float is simply all stock that
FIGURE 3.1 CASS versus Microsoft
GK015-C03[9-20].qxd 6/10/04 7:25 PM Page 10 Virender Negi Quark07:BOOKS:GK015-Whistler:Quark files:
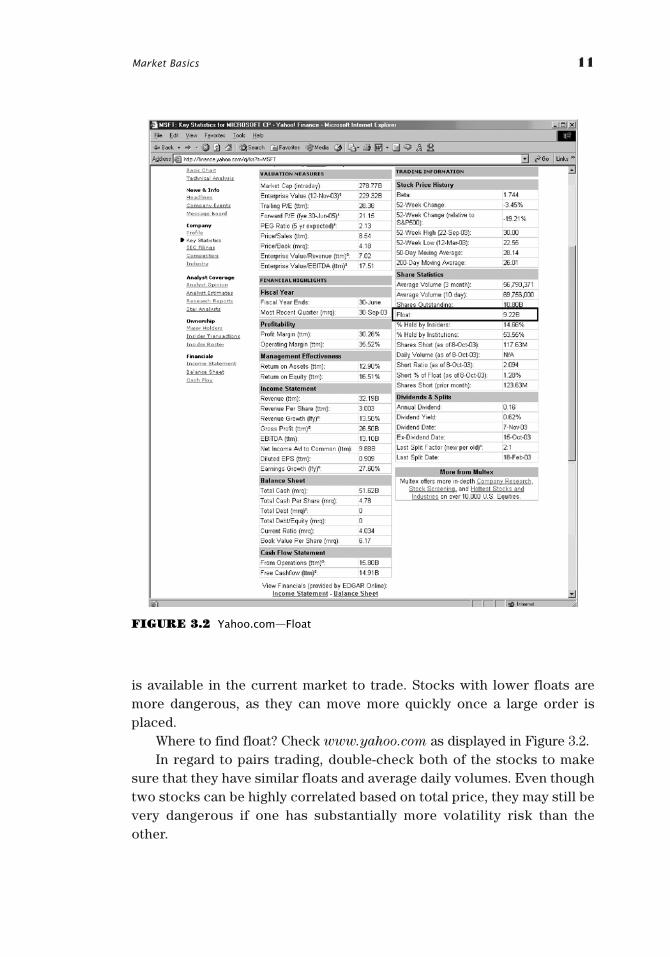
Market Basics 11
is available in the current market to trade. Stocks with lower floats aremore dangerous, as they can move more quickly once a large order isplaced.
Where to find float? Check www.yahoo.com as displayed in Figure 3.2.In regard to pairs trading, double-check both of the stocks to make
sure that they have similar floats and average daily volumes. Even thoughtwo stocks can be highly correlated based on total price, they may still bevery dangerous if one has substantially more volatility risk than theother.
FIGURE 3.2 Yahoo.com—Float
GK015-C03[9-20].qxd 6/10/04 7:25 PM Page 11 Virender Negi Quark07:BOOKS:GK015-Whistler:Quark files:

12 TRADING PAIRS
GROWTH AND GROWTH RATIOS
In making you an efficient five-minute equity analyst, it is very importantthat we cover growth ratios. Growth numbers are very important in under-standing where the stock is going, not where it currently is. After all, wealready know that!
There are two types of growth that we will first examine—sales growthand income growth; both are fairly straightforward. We simply want to knowhow much a company is growing and how the individual company stacks up inits respective sector. If a company had incredible sales growth of 80 percent,but a negative income growth rate of 10 percent, clearly there is a red flag.If this scenario were true for a real stock, we could put an “x” in the “badincome growth” box of our fundamental checklist.
Bottom line: If you are going to buy a stock, we want to see strongincome and sales growth numbers.
Where to find this information? The crux of fundamental analysis is learn-ing how to be able to do it yourself, which seems much more complicated thanit actually is. When looking for earnings growth, you can do a couple of dif-ferent things. First, it is important to remember that using any Web site is verydangerous. The numbers are sporadically updated and can be hardly reliableat best. Even sites like Yahoo.com can take several days to get updated afterearnings reports. You can’t blame them; you just have to remember to questionevery number you come across if you are going to make sure the figures youare examining are accurate. So let’s figure out how to find these numbers foryourself. First, the numbers aren’t half as hard to find as you think they are, itjust takes a little research to unearth them. To find earnings growth, I wouldlike to use the following chart invented by Todd Shaver of BullMarket.com.
Wal-Mart
Quarter 3Q02 3Q03 % Chg
Revenue $56B $63B �13Net Income $1.8B $2.0B �11Earnings per Share $0.40 $0.46 �15
This chart is an excerpt from BullMarket.com. The amazing part is thatthe numbers are right in front of you in any earnings announcement. Look atthe following Wal-Mart press release that the numbers came from. This is theactual press release that the company put forth and can be found on anynews service, including Yahoo.com.
GK015-C03[9-20].qxd 6/10/04 7:25 PM Page 12 Virender Negi Quark07:BOOKS:GK015-Whistler:Quark files:
Market Basics 13
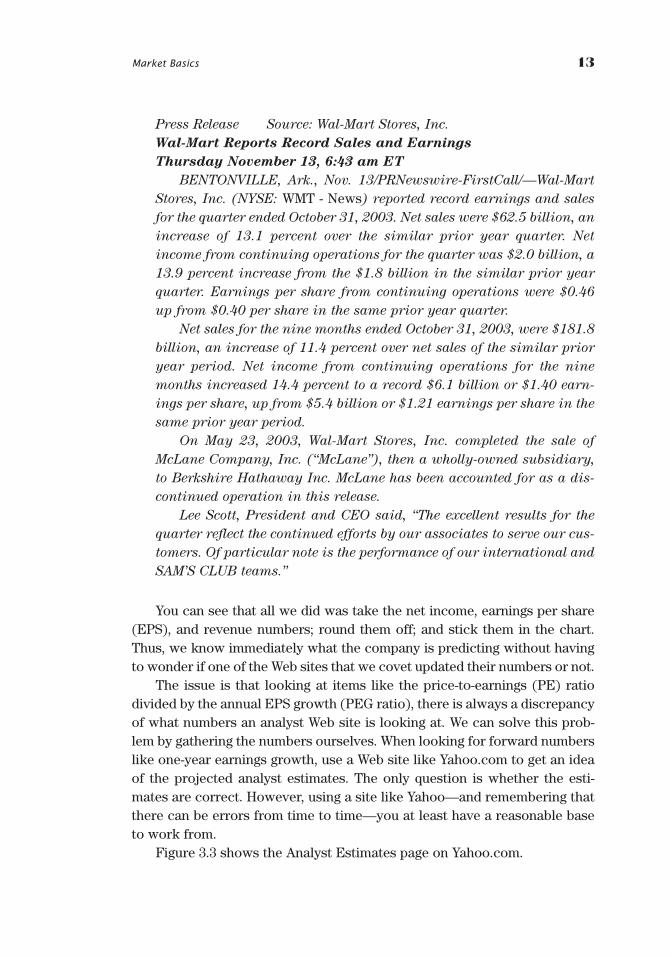
Press Release Source: Wal-Mart Stores, Inc.
Wal-Mart Reports Record Sales and Earnings
Thursday November 13, 6:43 am ET
BENTONVILLE, Ark., Nov. 13/PRNewswire-FirstCall/—Wal-Mart
Stores, Inc. (NYSE: WMT - News) reported record earnings and sales
for the quarter ended October 31, 2003. Net sales were $62.5 billion, an
increase of 13.1 percent over the similar prior year quarter. Net
income from continuing operations for the quarter was $2.0 billion, a
13.9 percent increase from the $1.8 billion in the similar prior year
quarter. Earnings per share from continuing operations were $0.46
up from $0.40 per share in the same prior year quarter.
Net sales for the nine months ended October 31, 2003, were $181.8
billion, an increase of 11.4 percent over net sales of the similar prior
year period. Net income from continuing operations for the nine
months increased 14.4 percent to a record $6.1 billion or $1.40 earn-
ings per share, up from $5.4 billion or $1.21 earnings per share in the
same prior year period.
On May 23, 2003, Wal-Mart Stores, Inc. completed the sale of
McLane Company, Inc. (“McLane”), then a wholly-owned subsidiary,
to Berkshire Hathaway Inc. McLane has been accounted for as a dis-
continued operation in this release.
Lee Scott, President and CEO said, “The excellent results for the
quarter reflect the continued efforts by our associates to serve our cus-
tomers. Of particular note is the performance of our international and
SAM’S CLUB teams.”
You can see that all we did was take the net income, earnings per share(EPS), and revenue numbers; round them off; and stick them in the chart.Thus, we know immediately what the company is predicting without havingto wonder if one of the Web sites that we covet updated their numbers or not.
The issue is that looking at items like the price-to-earnings (PE) ratiodivided by the annual EPS growth (PEG ratio), there is always a discrepancyof what numbers an analyst Web site is looking at. We can solve this prob-lem by gathering the numbers ourselves. When looking for forward numberslike one-year earnings growth, use a Web site like Yahoo.com to get an ideaof the projected analyst estimates. The only question is whether the esti-mates are correct. However, using a site like Yahoo—and remembering thatthere can be errors from time to time—you at least have a reasonable baseto work from.
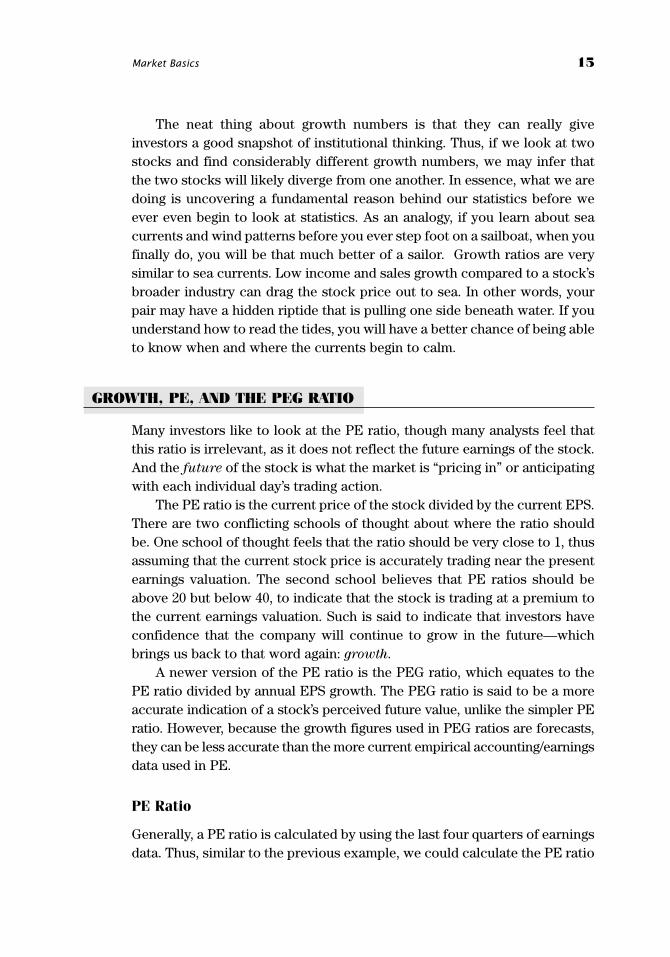
Figure 3.3 shows the Analyst Estimates page on Yahoo.com.
GK015-C03[9-20].qxd 6/10/04 7:25 PM Page 13 Virender Negi Quark07:BOOKS:GK015-Whistler:Quark files:

14 TRADING PAIRS
Notice that there are three boxes highlighted: the average estimate forthe Current Year and Next Year, followed by Year Ago EPS. If we are lookingfor the previous year’s growth—and we trust the Web site’s updates—thenwe would simply subtract 1.81 from 2.05 and then divide the difference by1.81, which is 13 percent. Referencing the earnings numbers in Figure 3.3, sofar so good. For a forward-looking number, subtract 2.05 from 2.34 and thendivide the difference from 2.05, which is 14 percent. Thus, our conclusion isthat (based on Yahoo’s numbers) the company—estimate-wise—is expect-ing earnings growth of 14 percent. See how easy this is?
FIGURE 3.3 Yahoo.com—Earnings
GK015-C03[9-20].qxd 6/10/04 7:25 PM Page 14 Virender Negi Quark07:BOOKS:GK015-Whistler:Quark files:
Market Basics 15
The neat thing about growth numbers is that they can really giveinvestors a good snapshot of institutional thinking. Thus, if we look at twostocks and find considerably different growth numbers, we may infer thatthe two stocks will likely diverge from one another. In essence, what we aredoing is uncovering a fundamental reason behind our statistics before weever even begin to look at statistics. As an analogy, if you learn about seacurrents and wind patterns before you ever step foot on a sailboat, when youfinally do, you will be that much better of a sailor. Growth ratios are verysimilar to sea currents. Low income and sales growth compared to a stock’sbroader industry can drag the stock price out to sea. In other words, yourpair may have a hidden riptide that is pulling one side beneath water. If youunderstand how to read the tides, you will have a better chance of being ableto know when and where the currents begin to calm.
GROWTH, PE, AND THE PEG RATIO
Many investors like to look at the PE ratio, though many analysts feel thatthis ratio is irrelevant, as it does not reflect the future earnings of the stock.And the future of the stock is what the market is “pricing in” or anticipatingwith each individual day’s trading action.
The PE ratio is the current price of the stock divided by the current EPS.There are two conflicting schools of thought about where the ratio shouldbe. One school of thought feels that the ratio should be very close to 1, thusassuming that the current stock price is accurately trading near the presentearnings valuation. The second school believes that PE ratios should beabove 20 but below 40, to indicate that the stock is trading at a premium tothe current earnings valuation. Such is said to indicate that investors haveconfidence that the company will continue to grow in the future—whichbrings us back to that word again: growth.
A newer version of the PE ratio is the PEG ratio, which equates to thePE ratio divided by annual EPS growth. The PEG ratio is said to be a moreaccurate indication of a stock’s perceived future value, unlike the simpler PEratio. However, because the growth figures used in PEG ratios are forecasts,they can be less accurate than the more current empirical accounting/earningsdata used in PE.
PE Ratio
Generally, a PE ratio is calculated by using the last four quarters of earningsdata. Thus, similar to the previous example, we could calculate the PE ratio
GK015-C03[9-20].qxd 6/10/04 7:25 PM Page 15 Virender Negi Quark07:BOOKS:GK015-Whistler:Quark files:
16 TRADING PAIRS
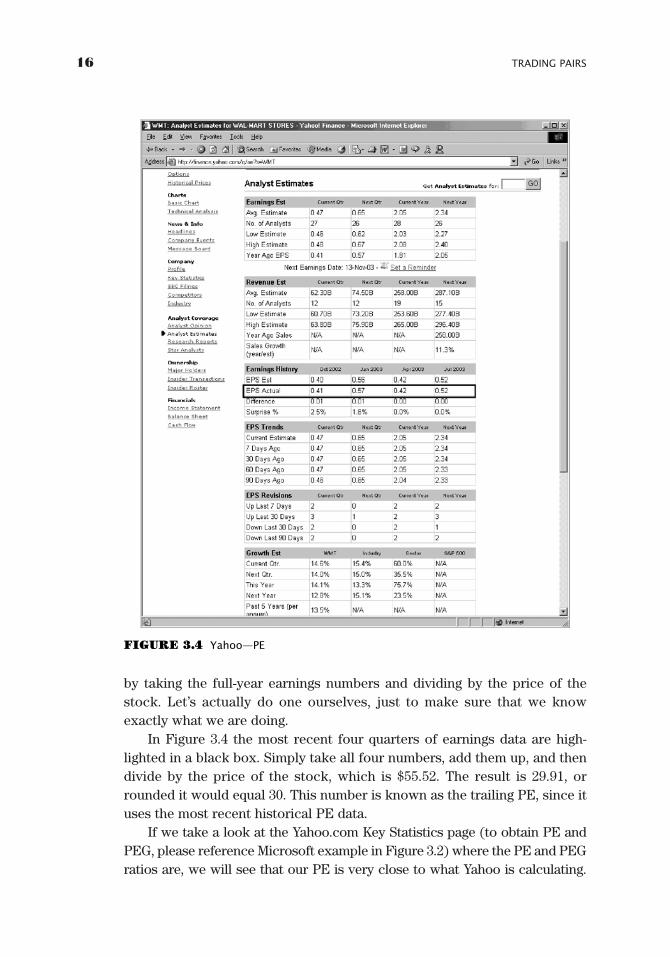
by taking the full-year earnings numbers and dividing by the price of thestock. Let’s actually do one ourselves, just to make sure that we knowexactly what we are doing.
In Figure 3.4 the most recent four quarters of earnings data are high-lighted in a black box. Simply take all four numbers, add them up, and thendivide by the price of the stock, which is $55.52. The result is 29.91, orrounded it would equal 30. This number is known as the trailing PE, since ituses the most recent historical PE data.
If we take a look at the Yahoo.com Key Statistics page (to obtain PE andPEG, please reference Microsoft example in Figure 3.2) where the PE and PEGratios are, we will see that our PE is very close to what Yahoo is calculating.
FIGURE 3.4 Yahoo—PE
GK015-C03[9-20].qxd 6/10/04 7:25 PM Page 16 Virender Negi Quark07:BOOKS:GK015-Whistler:Quark files:
Market Basics 17
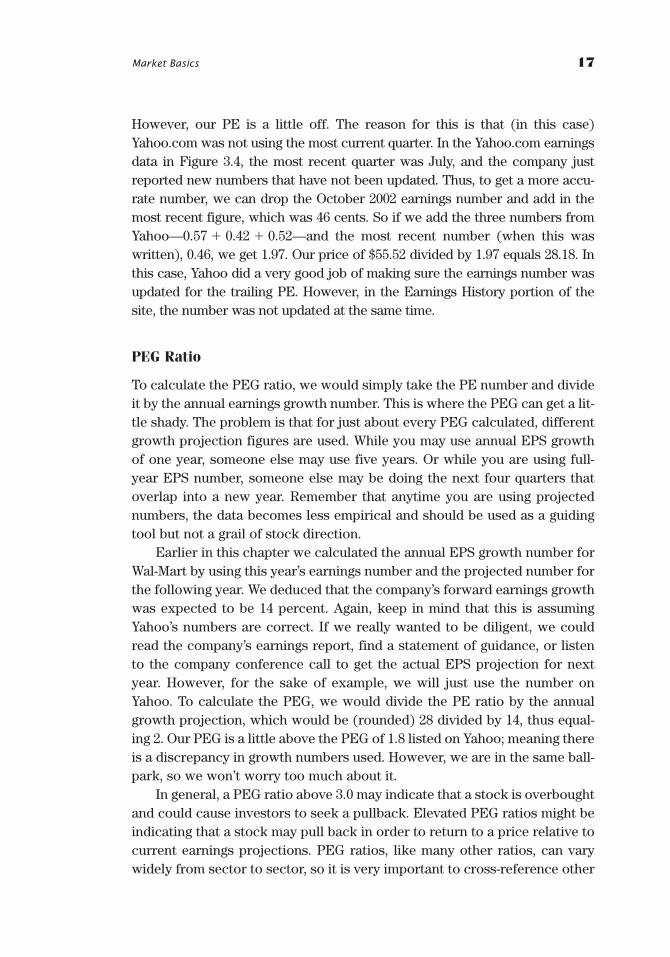
However, our PE is a little off. The reason for this is that (in this case)Yahoo.com was not using the most current quarter. In the Yahoo.com earningsdata in Figure 3.4, the most recent quarter was July, and the company justreported new numbers that have not been updated. Thus, to get a more accu-rate number, we can drop the October 2002 earnings number and add in themost recent figure, which was 46 cents. So if we add the three numbers fromYahoo—0.57 � 0.42 � 0.52—and the most recent number (when this waswritten), 0.46, we get 1.97. Our price of $55.52 divided by 1.97 equals 28.18. Inthis case, Yahoo did a very good job of making sure the earnings number wasupdated for the trailing PE. However, in the Earnings History portion of thesite, the number was not updated at the same time.
PEG Ratio
To calculate the PEG ratio, we would simply take the PE number and divideit by the annual earnings growth number. This is where the PEG can get a lit-tle shady. The problem is that for just about every PEG calculated, differentgrowth projection figures are used. While you may use annual EPS growthof one year, someone else may use five years. Or while you are using full-year EPS number, someone else may be doing the next four quarters thatoverlap into a new year. Remember that anytime you are using projectednumbers, the data becomes less empirical and should be used as a guidingtool but not a grail of stock direction.
Earlier in this chapter we calculated the annual EPS growth number forWal-Mart by using this year’s earnings number and the projected number forthe following year. We deduced that the company’s forward earnings growthwas expected to be 14 percent. Again, keep in mind that this is assumingYahoo’s numbers are correct. If we really wanted to be diligent, we couldread the company’s earnings report, find a statement of guidance, or listento the company conference call to get the actual EPS projection for nextyear. However, for the sake of example, we will just use the number onYahoo. To calculate the PEG, we would divide the PE ratio by the annualgrowth projection, which would be (rounded) 28 divided by 14, thus equal-ing 2. Our PEG is a little above the PEG of 1.8 listed on Yahoo; meaning thereis a discrepancy in growth numbers used. However, we are in the same ball-park, so we won’t worry too much about it.
In general, a PEG ratio above 3.0 may indicate that a stock is overboughtand could cause investors to seek a pullback. Elevated PEG ratios might beindicating that a stock may pull back in order to return to a price relative tocurrent earnings projections. PEG ratios, like many other ratios, can varywidely from sector to sector, so it is very important to cross-reference other
GK015-C03[9-20].qxd 6/10/04 7:25 PM Page 17 Virender Negi Quark07:BOOKS:GK015-Whistler:Quark files:
18 TRADING PAIRS
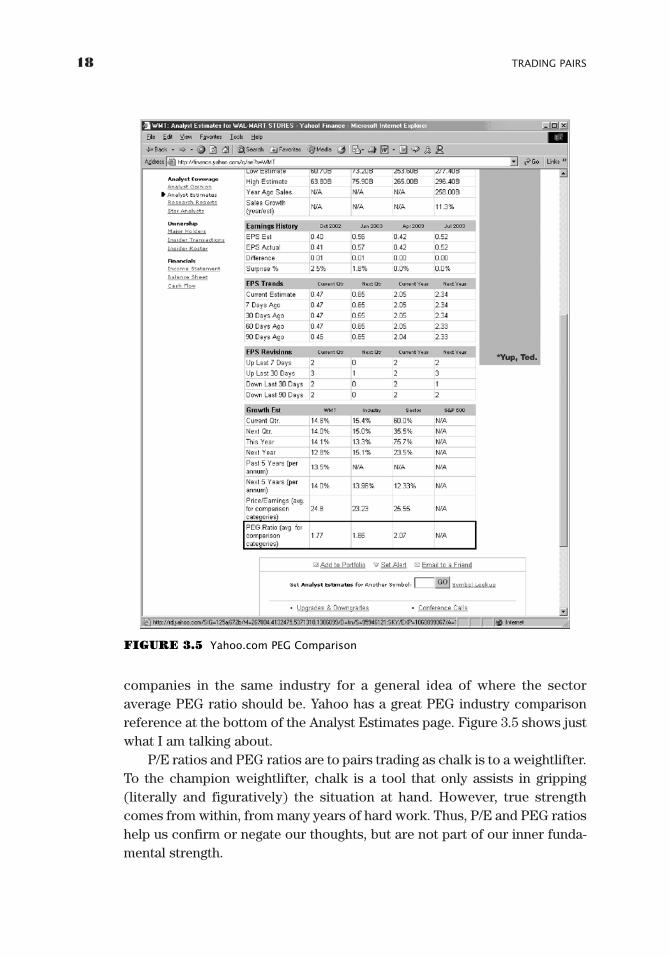
companies in the same industry for a general idea of where the sectoraverage PEG ratio should be. Yahoo has a great PEG industry comparisonreference at the bottom of the Analyst Estimates page. Figure 3.5 shows justwhat I am talking about.
P/E ratios and PEG ratios are to pairs trading as chalk is to a weightlifter.To the champion weightlifter, chalk is a tool that only assists in gripping(literally and figuratively) the situation at hand. However, true strengthcomes from within, from many years of hard work. Thus, P/E and PEG ratioshelp us confirm or negate our thoughts, but are not part of our inner funda-mental strength.
FIGURE 3.5 Yahoo.com PEG Comparison
GK015-C03[9-20].qxd 6/10/04 7:25 PM Page 18 Virender Negi Quark07:BOOKS:GK015-Whistler:Quark files:

Market Basics 19
Understanding just how much cash a company has is vitally important toshort-term investing. Cash-poor companies will generally always receivenegative comments from analysts and find themselves out of favor withinvestors. Bottom line: Cash is the big kahuna!
We will quickly examine a few ratios to understand how much cash acompany has. First, the current ratio equals current assets divided by cur-rent liabilities, and is meant to measure how effectively a company can mea-sure its short-term obligations. It is often thought that the higher the currentratio, the less a company will have to worry about a cash crunch.
Current assets are defined as balance sheet items that are cash, cashequivalents, inventory, marketable securities, prepaid expenses, and accountsreceivable. Current assets are generally all assets that can be converted intocash within one year.
Current liabilities are simply all liabilities (similar to accounts payable)that are short-term debts due within one year.
To find the current ratio, simply log on to Yahoo.com Finance and put ina ticker symbol. Then, click on “Profile” and voila—much of the company’sfinancial health is at your fingertips.
The debt-to-equity ratio (EN 3.1) is vital in quickly understanding how acompany is leveraging itself. The debt-to-equity ratio is calculated as a com-pany’s long-term debt divided by common shareholder equity, or equityavailable to common shareholders. Companies with higher debt-to-equityratios are thought to offer greater returns to investors, but are normallyriskier with larger liability obligations. The debt-to-equity ratio is also foundunder the Yahoo.com “profile” section.
TYING IT ALL TOGETHER
Many analysts may argue that the information cited in this chapter barelyscratches the surface of a company’s true financial health, and for all intentsand purposes, I agree. However, for the average investor who does not havethe luxury of countless hours to fundamentally pick apart every company heor she is considering, the information given here is designed to at least finda few red flags.
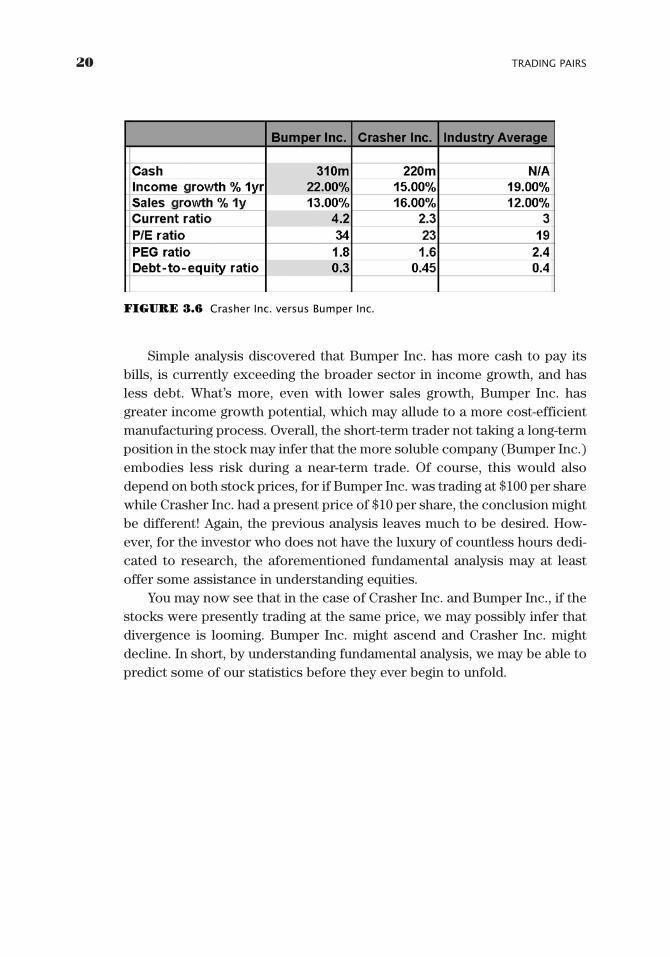
Let’s examine a hypothetical scenario. Imagine that two companies,Crasher Inc. and Bumper Inc., are both in the business of manufacturingairbags. Demand for airbags appears strong; thus, an investor may be think-ing about buying both stocks. However, when investigating the two compa-nies with simple fundamental analysis, the investor finds the informationshown in Figure 3.6.
GK015-C03[9-20].qxd 6/10/04 7:25 PM Page 19 Virender Negi Quark07:BOOKS:GK015-Whistler:Quark files:
20 TRADING PAIRS
Simple analysis discovered that Bumper Inc. has more cash to pay itsbills, is currently exceeding the broader sector in income growth, and hasless debt. What’s more, even with lower sales growth, Bumper Inc. hasgreater income growth potential, which may allude to a more cost-efficientmanufacturing process. Overall, the short-term trader not taking a long-termposition in the stock may infer that the more soluble company (Bumper Inc.)embodies less risk during a near-term trade. Of course, this would alsodepend on both stock prices, for if Bumper Inc. was trading at $100 per sharewhile Crasher Inc. had a present price of $10 per share, the conclusion mightbe different! Again, the previous analysis leaves much to be desired. How-ever, for the investor who does not have the luxury of countless hours dedi-cated to research, the aforementioned fundamental analysis may at leastoffer some assistance in understanding equities.
You may now see that in the case of Crasher Inc. and Bumper Inc., if thestocks were presently trading at the same price, we may possibly infer thatdivergence is looming. Bumper Inc. might ascend and Crasher Inc. mightdecline. In short, by understanding fundamental analysis, we may be able topredict some of our statistics before they ever begin to unfold.
FIGURE 3.6 Crasher Inc. versus Bumper Inc.
GK015-C03[9-20].qxd 6/10/04 7:25 PM Page 20 Virender Negi Quark07:BOOKS:GK015-Whistler:Quark files:
CHAPTER 4
TechnicalAnalysis
Candlestick Charting, Hammer
Bottoms and Hangman Tops,
Doji Star, Shooting Stars,
Engulfing Patterns, Support
and Resistance, Trend Lines,
Moving Averages
To understand pairs, we must also understand technical analysis sothat we can make more informed decisions when considering ourpositions. Technical analysis is simply the art of evaluating the
historical price movements of a stock in an attempt to find information thatmay discern possible future direction. Usually, this is in the form of readingcharts, coupled with assorted indicators such as: moving averages, stochas-tics, relative strength, and/or any other “indicator” that may map a stock’shistorical trading activity. Technical analysis can be both up to the moment,in “real time,” or on a historical basis. However, I would like to point out thateven real-time data is an event that has already occurred. Thus, all technicalanalysis is made up of lagging indicators, which presume future movements.For the swing trader, end-of-day (EOD) data will suffice to do proper analy-sis. End-of-day data is simply the open, close, high, and low of a stock’s tradingactivity after any given trading day. Real-time data is generally needed onlyfor day traders, institutional traders, or swing traders overly concerned abouttiming entries (or exits) in an effort to minimize slippage. (EN 4.1)
Again, it is important to remember that all technical analysis consists oflagging indicators because the data used denotes events that have alreadyoccurred. In short, technical analysis trys to map individual stocks, sectors,and indices using history as a potential guide to the future. Techniciansattempt to find measurable patterns or “indicators,” which may allude topossible future trading activity. In essence, it is said that technical analysis
21
GK015-C04[21-32].qxd 6/10/04 7:25 PM Page 21 Virender Negi Quark07:BOOKS:GK015-Whistler:Quark files:
is the science of “self-fulfilling prophecies.” By this I mean that technicalanalysis generally works only if many, many people follow similar indica-tors. As an analogy, when we go to buy tickets for an event, generally anorderly line forms as people wait their turn to get to the ticket window. Theline itself is not mandated, but is honored by many people who are follow-ing the same rule of order. Technical analysis allows individuals to findbenchmark rules of order on which to base market-oriented thought.
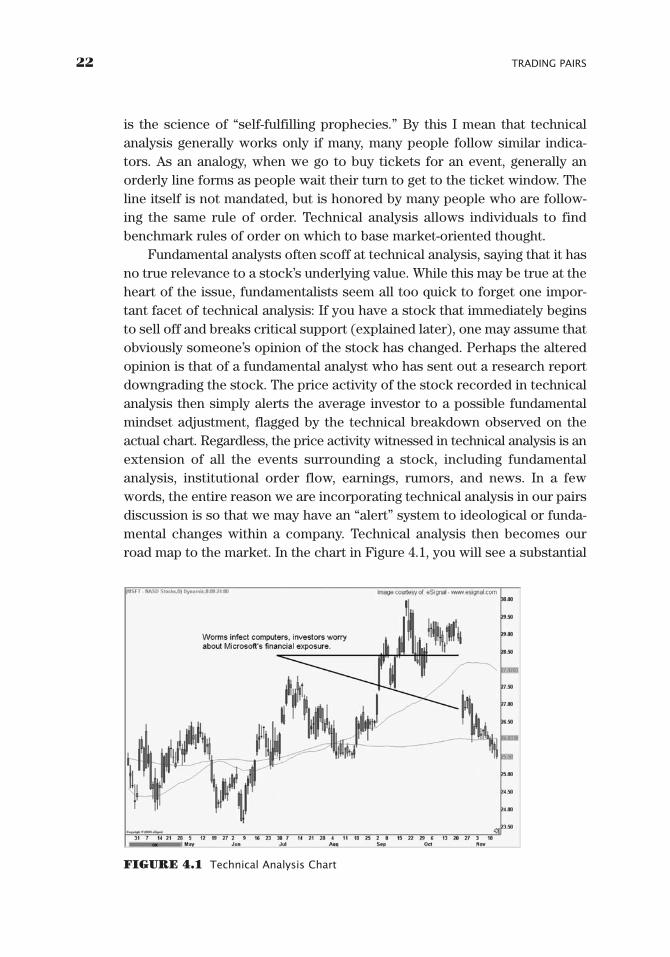
Fundamental analysts often scoff at technical analysis, saying that it hasno true relevance to a stock’s underlying value. While this may be true at theheart of the issue, fundamentalists seem all too quick to forget one impor-tant facet of technical analysis: If you have a stock that immediately beginsto sell off and breaks critical support (explained later), one may assume thatobviously someone’s opinion of the stock has changed. Perhaps the alteredopinion is that of a fundamental analyst who has sent out a research reportdowngrading the stock. The price activity of the stock recorded in technicalanalysis then simply alerts the average investor to a possible fundamentalmindset adjustment, flagged by the technical breakdown observed on theactual chart. Regardless, the price activity witnessed in technical analysis is anextension of all the events surrounding a stock, including fundamentalanalysis, institutional order flow, earnings, rumors, and news. In a fewwords, the entire reason we are incorporating technical analysis in our pairsdiscussion is so that we may have an “alert” system to ideological or funda-mental changes within a company. Technical analysis then becomes ourroad map to the market. In the chart in Figure 4.1, you will see a substantial
22 TRADING PAIRS
FIGURE 4.1 Technical Analysis Chart
GK015-C04[21-32].qxd 6/10/04 7:25 PM Page 22 Virender Negi Quark07:BOOKS:GK015-Whistler:Quark files:
Technical Analysis 23
breakdown in Microsoft. The actual sell-off was due to investor worriesabout Windows’ security. In late October, there were many viruses splatter-ing networks, all because of loopholes in the Windows code. ThoughMicrosoft quickly developed patches to solve the problem, there was stillselling in the stock. Even if you weren’t in the real world and did not knowof the viruses/worms, the chart would have alerted you that something bigwas happening. Thus, technical analysis is our eyes and ears to the market.
CANDLESTICK CHARTING
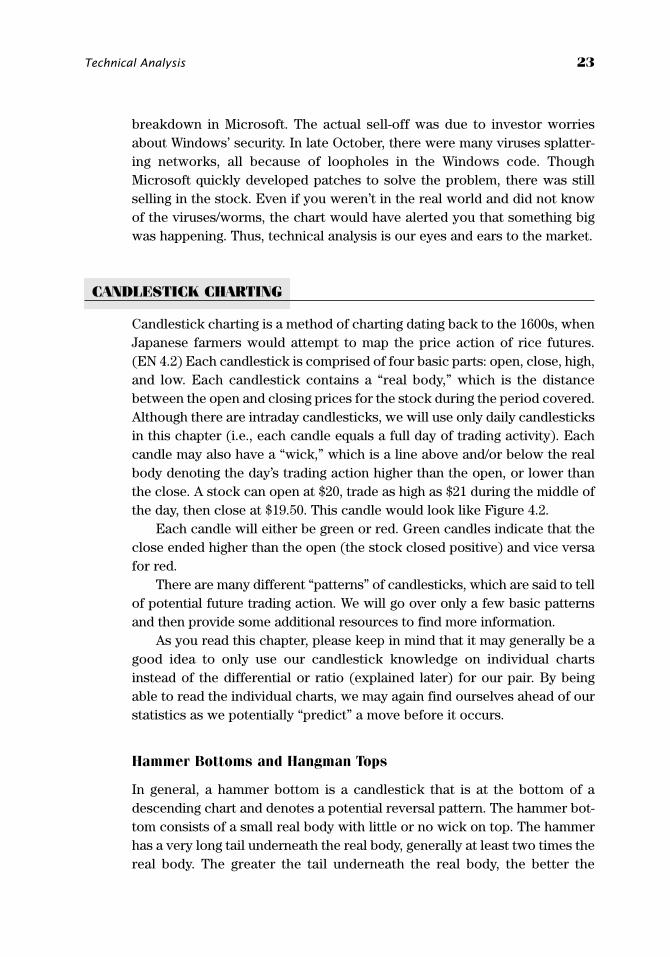
Candlestick charting is a method of charting dating back to the 1600s, whenJapanese farmers would attempt to map the price action of rice futures.(EN 4.2) Each candlestick is comprised of four basic parts: open, close, high,and low. Each candlestick contains a “real body,” which is the distancebetween the open and closing prices for the stock during the period covered.Although there are intraday candlesticks, we will use only daily candlesticksin this chapter (i.e., each candle equals a full day of trading activity). Eachcandle may also have a “wick,” which is a line above and/or below the realbody denoting the day’s trading action higher than the open, or lower thanthe close. A stock can open at $20, trade as high as $21 during the middle ofthe day, then close at $19.50. This candle would look like Figure 4.2.
Each candle will either be green or red. Green candles indicate that theclose ended higher than the open (the stock closed positive) and vice versafor red.
There are many different “patterns” of candlesticks, which are said to tellof potential future trading action. We will go over only a few basic patternsand then provide some additional resources to find more information.
As you read this chapter, please keep in mind that it may generally be agood idea to only use our candlestick knowledge on individual chartsinstead of the differential or ratio (explained later) for our pair. By beingable to read the individual charts, we may again find ourselves ahead of ourstatistics as we potentially “predict” a move before it occurs.
Hammer Bottoms and Hangman Tops
In general, a hammer bottom is a candlestick that is at the bottom of adescending chart and denotes a potential reversal pattern. The hammer bot-tom consists of a small real body with little or no wick on top. The hammerhas a very long tail underneath the real body, generally at least two times thereal body. The greater the tail underneath the real body, the better the
GK015-C04[21-32].qxd 6/10/04 7:25 PM Page 23 Virender Negi Quark07:BOOKS:GK015-Whistler:Quark files:
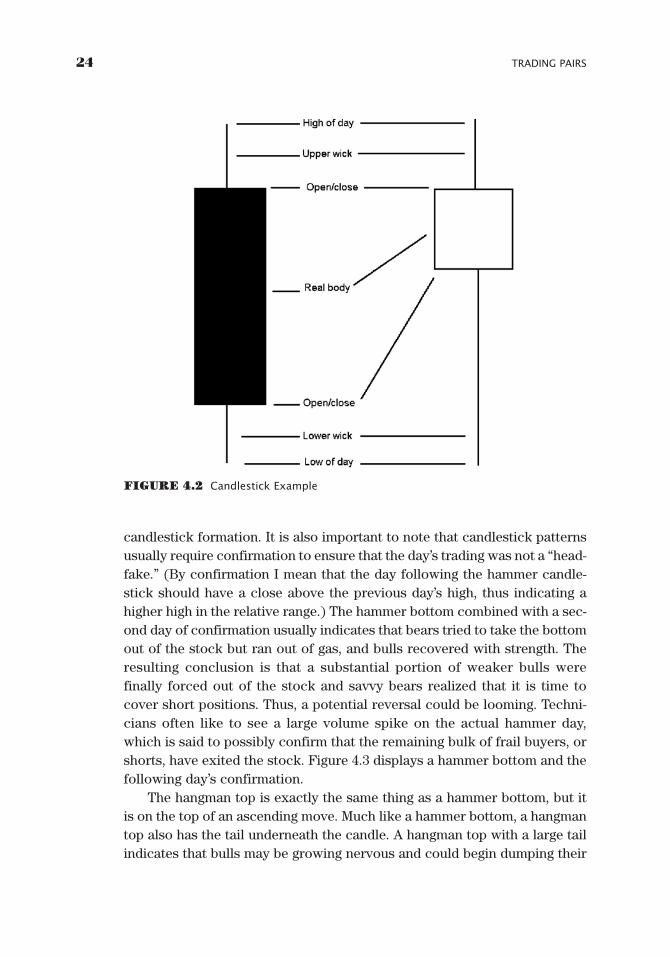
candlestick formation. It is also important to note that candlestick patternsusually require confirmation to ensure that the day’s trading was not a “head-fake.” (By confirmation I mean that the day following the hammer candle-stick should have a close above the previous day’s high, thus indicating ahigher high in the relative range.) The hammer bottom combined with a sec-ond day of confirmation usually indicates that bears tried to take the bottomout of the stock but ran out of gas, and bulls recovered with strength. Theresulting conclusion is that a substantial portion of weaker bulls werefinally forced out of the stock and savvy bears realized that it is time tocover short positions. Thus, a potential reversal could be looming. Techni-cians often like to see a large volume spike on the actual hammer day,which is said to possibly confirm that the remaining bulk of frail buyers, orshorts, have exited the stock. Figure 4.3 displays a hammer bottom and thefollowing day’s confirmation.
The hangman top is exactly the same thing as a hammer bottom, but itis on the top of an ascending move. Much like a hammer bottom, a hangmantop also has the tail underneath the candle. A hangman top with a large tailindicates that bulls may be growing nervous and could begin dumping their
24 TRADING PAIRS
FIGURE 4.2 Candlestick Example
GK015-C04[21-32].qxd 6/10/04 7:25 PM Page 24 Virender Negi Quark07:BOOKS:GK015-Whistler:Quark files:
positions. The close at the top of the tail signifies that even though bullswere able to hold ground, there are now many skeptical holders ready todrop the stock at the first sign of trouble. As with hammer bottoms, savvytechnical analysts may also look for confirmation of a lower low in thesubsequent trading day.
Doji Star
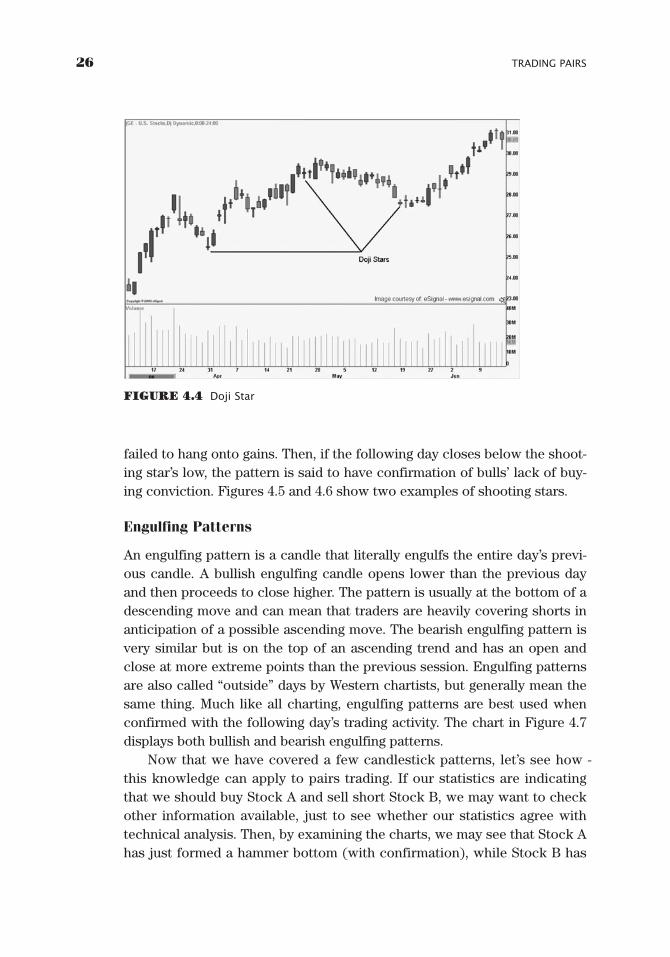
A doji star can be at either the top or bottom of a chart and may indicate thata stock is generally planning on making a new move. The doji is a day of con-solidation, wherein a stock generally has a range above and below the openand close. Doji stars are characterized by tails on both the top and bottomof the real body. Consolidation days (otherwise known as doji stars, like theone in Figure 4.4) can produce intraday ascending and descending trendlines that day traders watch for potential breakouts.
Shooting Stars
Shooting stars are found on the top of a trend. The stock may trade aboveand below the open, but generally closes relatively near where the day com-menced trading. The shooting star is similar to a doji, but with the upperwick resting at least two times above the real body. The theory behind ashooting star is that bulls gapped the stock up and tried to run it higher, but
Technical Analysis 25
FIGURE 4.3 Hammer Bottom
GK015-C04[21-32].qxd 6/10/04 7:25 PM Page 25 Virender Negi Quark07:BOOKS:GK015-Whistler:Quark files:
failed to hang onto gains. Then, if the following day closes below the shoot-ing star’s low, the pattern is said to have confirmation of bulls’ lack of buy-ing conviction. Figures 4.5 and 4.6 show two examples of shooting stars.
Engulfing Patterns
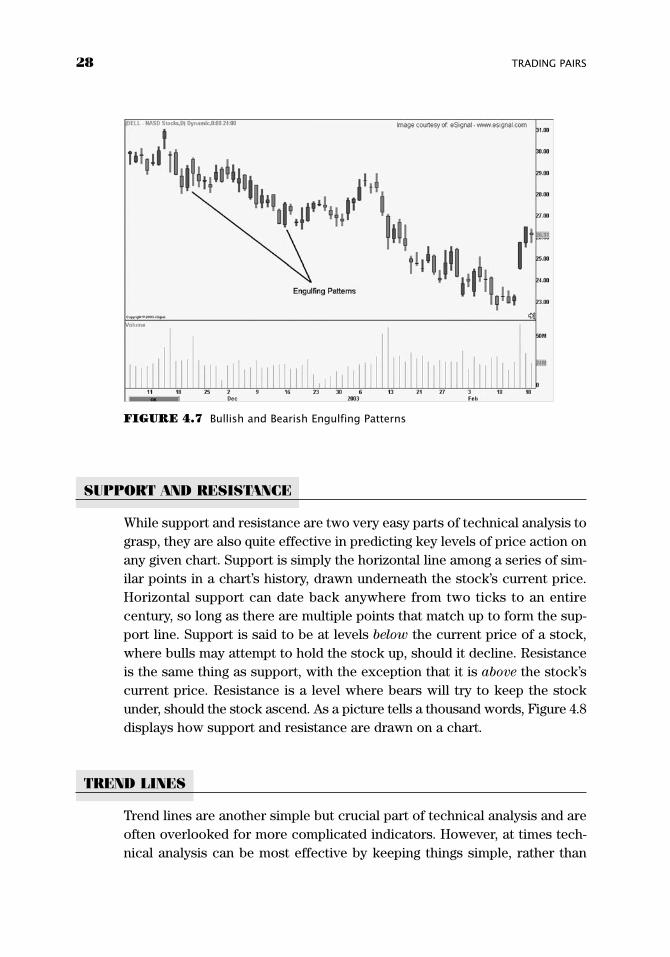
An engulfing pattern is a candle that literally engulfs the entire day’s previ-ous candle. A bullish engulfing candle opens lower than the previous dayand then proceeds to close higher. The pattern is usually at the bottom of adescending move and can mean that traders are heavily covering shorts inanticipation of a possible ascending move. The bearish engulfing pattern isvery similar but is on the top of an ascending trend and has an open andclose at more extreme points than the previous session. Engulfing patternsare also called “outside” days by Western chartists, but generally mean thesame thing. Much like all charting, engulfing patterns are best used whenconfirmed with the following day’s trading activity. The chart in Figure 4.7displays both bullish and bearish engulfing patterns.
Now that we have covered a few candlestick patterns, let’s see how -this knowledge can apply to pairs trading. If our statistics are indicatingthat we should buy Stock A and sell short Stock B, we may want to checkother information available, just to see whether our statistics agree withtechnical analysis. Then, by examining the charts, we may see that Stock Ahas just formed a hammer bottom (with confirmation), while Stock B has
26 TRADING PAIRS
FIGURE 4.4 Doji Star
GK015-C04[21-32].qxd 6/10/04 7:25 PM Page 26 Virender Negi Quark07:BOOKS:GK015-Whistler:Quark files:

created a shooting star (with confirmation), and we may feel more confi-dent about entering our pair. The key to being an effective directional orpairs trader is to get as many different indicators on our side as we can. Ifour statistics coincide with the fundamentals and the technical charts, wehave more favorable aspects of the trade working for us rather thanagainst us.
Technical Analysis 27
FIGURE 4.5 Shooting Star 1
FIGURE 4.6 Shooting Star 2
GK015-C04[21-32].qxd 6/10/04 7:25 PM Page 27 Virender Negi Quark07:BOOKS:GK015-Whistler:Quark files:
SUPPORT AND RESISTANCE
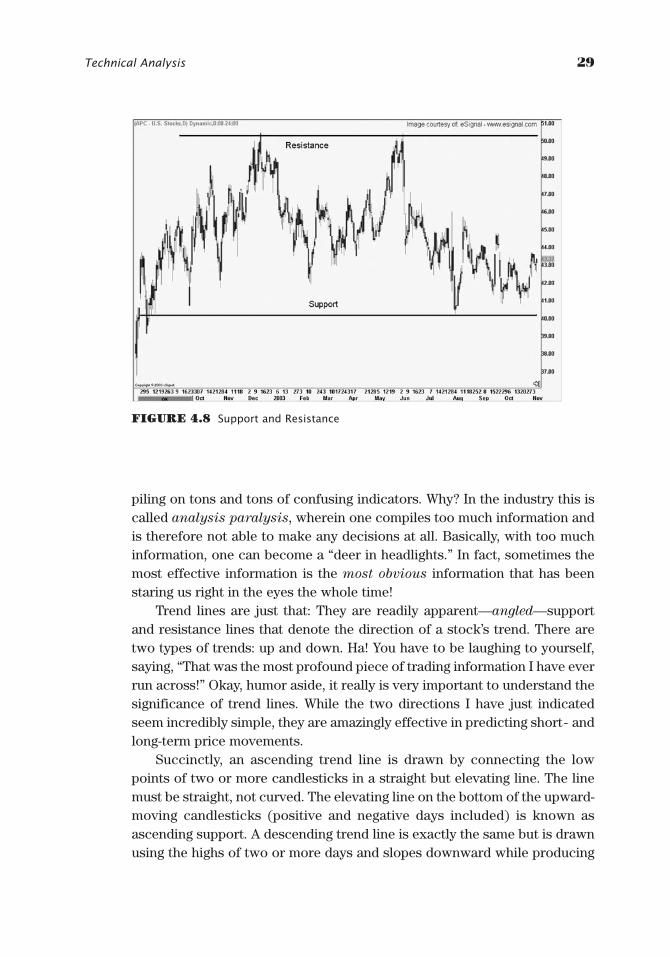
While support and resistance are two very easy parts of technical analysis tograsp, they are also quite effective in predicting key levels of price action onany given chart. Support is simply the horizontal line among a series of sim-ilar points in a chart’s history, drawn underneath the stock’s current price.Horizontal support can date back anywhere from two ticks to an entirecentury, so long as there are multiple points that match up to form the sup-port line. Support is said to be at levels below the current price of a stock,where bulls may attempt to hold the stock up, should it decline. Resistanceis the same thing as support, with the exception that it is above the stock’scurrent price. Resistance is a level where bears will try to keep the stockunder, should the stock ascend. As a picture tells a thousand words, Figure 4.8displays how support and resistance are drawn on a chart.
TREND LINES
Trend lines are another simple but crucial part of technical analysis and areoften overlooked for more complicated indicators. However, at times tech-nical analysis can be most effective by keeping things simple, rather than
28 TRADING PAIRS
FIGURE 4.7 Bullish and Bearish Engulfing Patterns
GK015-C04[21-32].qxd 6/10/04 7:25 PM Page 28 Virender Negi Quark07:BOOKS:GK015-Whistler:Quark files:
piling on tons and tons of confusing indicators. Why? In the industry this iscalled analysis paralysis, wherein one compiles too much information andis therefore not able to make any decisions at all. Basically, with too muchinformation, one can become a “deer in headlights.” In fact, sometimes themost effective information is the most obvious information that has beenstaring us right in the eyes the whole time!
Trend lines are just that: They are readily apparent—angled—supportand resistance lines that denote the direction of a stock’s trend. There aretwo types of trends: up and down. Ha! You have to be laughing to yourself,saying, “That was the most profound piece of trading information I have everrun across!” Okay, humor aside, it really is very important to understand thesignificance of trend lines. While the two directions I have just indicatedseem incredibly simple, they are amazingly effective in predicting short- andlong-term price movements.
Succinctly, an ascending trend line is drawn by connecting the lowpoints of two or more candlesticks in a straight but elevating line. The linemust be straight, not curved. The elevating line on the bottom of the upward-moving candlesticks (positive and negative days included) is known asascending support. A descending trend line is exactly the same but is drawnusing the highs of two or more days and slopes downward while producing
Technical Analysis 29
FIGURE 4.8 Support and Resistance
GK015-C04[21-32].qxd 6/10/04 7:25 PM Page 29 Virender Negi Quark07:BOOKS:GK015-Whistler:Quark files:

lower lows. The downward-slanting line on the top of the falling candles isotherwise known as descending resistance.
If a stock has been moving upward for several sessions and ascendingsupport is violated, the most obvious presumption is that (at least during thenear term) the direction of the stock will turn. When ascending support isviolated, a trader may be hoping the stock will pull back, while investorstake profits off the table and wait for a more ideal long reentry point. How-ever, if the stock violates ascending and horizontal support, more aggres-sive investors might attempt to short the stock in anticipation of a largerbreakdown (see Figure 4.9).
Simply trading trend lines coupled with support and resistance is not rec-ommended. Understanding this area of technical analysis certainly helpsincrease an investor’s repertoire of analysis tools to make more informed andeducated decisions, but is not enough information to base a trading strategy on.
However, I cannot pound the table enough for the average investor andeven for the “master” technician to rethink the vitality and importance oftrend lines!
MOVING AVERAGES
A simple moving average (SMA) is the average of a security’s price over aspecified period of time, represented in the form of a line on a stock’s chart.
30 TRADING PAIRS
FIGURE 4.9 Ascending Support and Descending Resistance
GK015-C04[21-32].qxd 6/10/04 7:25 PM Page 30 Virender Negi Quark07:BOOKS:GK015-Whistler:Quark files:
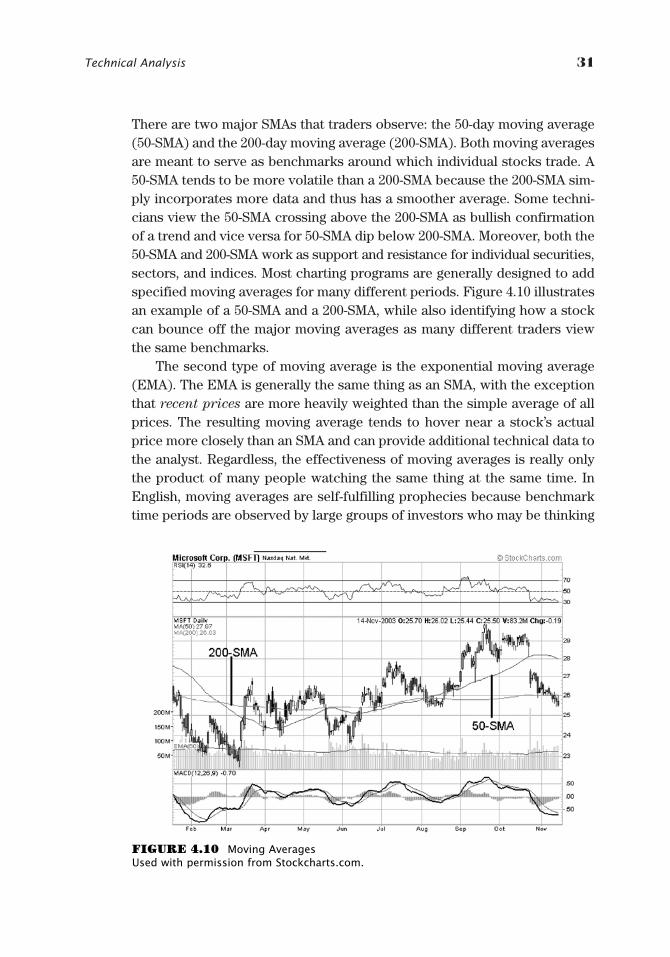
There are two major SMAs that traders observe: the 50-day moving average(50-SMA) and the 200-day moving average (200-SMA). Both moving averagesare meant to serve as benchmarks around which individual stocks trade. A50-SMA tends to be more volatile than a 200-SMA because the 200-SMA sim-ply incorporates more data and thus has a smoother average. Some techni-cians view the 50-SMA crossing above the 200-SMA as bullish confirmationof a trend and vice versa for 50-SMA dip below 200-SMA. Moreover, both the50-SMA and 200-SMA work as support and resistance for individual securities,sectors, and indices. Most charting programs are generally designed to addspecified moving averages for many different periods. Figure 4.10 illustratesan example of a 50-SMA and a 200-SMA, while also identifying how a stockcan bounce off the major moving averages as many different traders viewthe same benchmarks.
The second type of moving average is the exponential moving average(EMA). The EMA is generally the same thing as an SMA, with the exceptionthat recent prices are more heavily weighted than the simple average of allprices. The resulting moving average tends to hover near a stock’s actualprice more closely than an SMA and can provide additional technical data tothe analyst. Regardless, the effectiveness of moving averages is really onlythe product of many people watching the same thing at the same time. InEnglish, moving averages are self-fulfilling prophecies because benchmarktime periods are observed by large groups of investors who may be thinking
Technical Analysis 31
FIGURE 4.10 Moving Averages Used with permission from Stockcharts.com.
GK015-C04[21-32].qxd 6/10/04 7:25 PM Page 31 Virender Negi Quark07:BOOKS:GK015-Whistler:Quark files:
the same thing at a similar moment. Though arguable, we might assume thatthe 50- and 200-SMAs hold more weight than the 50- and 200-EMAs because,most likely, a larger portion of the technical analysis investing public moni-tors SMAs instead of EMAs. What’s more, a 50-EMA would likely be a moreimportant level to watch than a 32-SMA, as more people will likely follow the50-EMA over the obscure 32-SMA. (Incidentally, 32 is an arbitrary numberused merely as an example.) Moving averages (much like a great proportionof technical analysis) come down to how many people are watching uniformnumerical parameters. Obscure moving average time periods will generallynot help when trying to predict future movements of a stock price.
Beyond moving averages crossing over and under one another, the aver-ages are also used as support and resistance when monitoring charts. A 200-SMA is generally said to be a more significant benchmark of support (orresistance) than the 50-SMA. In addition, the 50-SMA typically stands asbolder support (or resistance) than a shorter-term moving average. When astock begins to near a major moving average, typically traders may look fora bounce off the moving average, before the stock moves though or turnsback. The theory is that many traders are watching the same average and(for an ascending stock) will sell their positions as the equity nears thebenchmark moving average. This causes a complete ricochet off the movingaverage, or will at least “shake out” weaker buyers before the stock pullsthrough. The bottom line here is to watch for support and resistance–fueledtrading activity when a stock nears a benchmark moving average.
For references on moving averages, see Appendix II.
32 TRADING PAIRS
GK015-C04[21-32].qxd 6/10/04 7:25 PM Page 32 Virender Negi Quark07:BOOKS:GK015-Whistler:Quark files:
33
CHAPTER 5
TechnicalAnalysis
IndicatorsStochastics
Chaikin Money Flow Oscillator
On-Balance Volume
Relative Strength Index
Getting into more complicated technical analysis, we will begin to lookat indicators as an additional way of examining the present stockprice, while deciphering historical price movements. Each of the indi-
cators in this chapter can be applied to individual stocks, while also beingused in conjunction with actual pairs. However, not all technical analysisprograms offer the ability to track spreads or apply indicators to either adifferential or ratio. Therefore, later in the book we will discuss how tobuild indicators in Excel. What’s more, in Appendix II you will find a list oftechnical analysis programs that are pairs friendly, with a brief descriptionof each.
STOCHASTICS
Our first indictor is called stochastics, which is an oscillator that is used todetermine overbought and oversold conditions. Stochastics are lines thatmove up and down in a horizontal oscillator and are intended to depict whena stock is receiving excessive buying or selling pressure. Most stochasticsconsist of two lines called the %k and %d. The stochastics oscillator rangesfrom 0 to 100, where a movement below 20 is said to indicate selling pres-sure possibly leading to oversold conditions, while a number above 80 isthought to point toward buying pressure potentially alluding to overboughtcircumstances. When stochastics are in the overbought region, they also
GK015-C05[33-40].qxd 6/10/04 7:25 PM Page 33 Virender Negi Quark07:BOOKS:GK015-Whistler:Quark files:
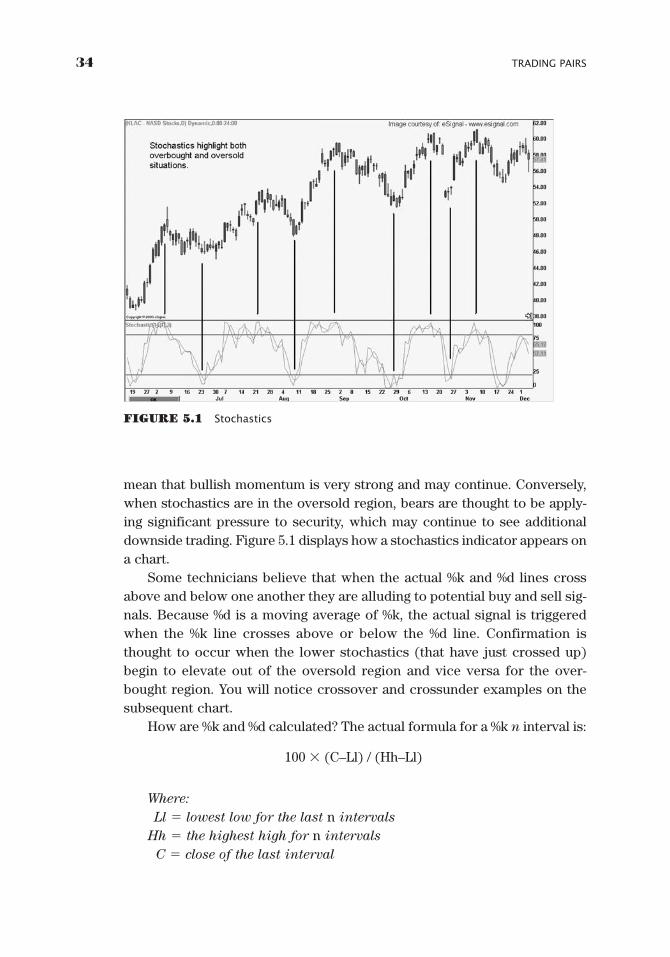
mean that bullish momentum is very strong and may continue. Conversely,when stochastics are in the oversold region, bears are thought to be apply-ing significant pressure to security, which may continue to see additionaldownside trading. Figure 5.1 displays how a stochastics indicator appears ona chart.
Some technicians believe that when the actual %k and %d lines crossabove and below one another they are alluding to potential buy and sell sig-nals. Because %d is a moving average of %k, the actual signal is triggeredwhen the %k line crosses above or below the %d line. Confirmation isthought to occur when the lower stochastics (that have just crossed up)begin to elevate out of the oversold region and vice versa for the over-bought region. You will notice crossover and crossunder examples on thesubsequent chart.
How are %k and %d calculated? The actual formula for a %k n interval is:
100 � (C–Ll) / (Hh–Ll)
Where:
Ll � lowest low for the last n intervals
Hh � the highest high for n intervals
C � close of the last interval
34 TRADING PAIRS
FIGURE 5.1 Stochastics
GK015-C05[33-40].qxd 6/10/04 7:25 PM Page 34 Virender Negi Quark07:BOOKS:GK015-Whistler:Quark files:
Technical Analysis Indicators 35
The %d line is a moving average or smoothed version of %k and is cal-culated as follows:
%d � 100 * (HP/LP)
Where:
HP � n periods sum of (C � Ll)
LP � n periods sum of (Hh � Ll)
In addition to %k and %d, there are also slow %k and slow %d lines,which simply add more data into the equation in an effort to smooth outvolatility. Sometimes, more savvy traders do not actually use stochastics asa leading indicator; rather, use the indicator as confirmation of the researchand resulting thoughts that have already been constructed. For example, ifan investor conducts fundamental research and discovers that a stock trad-ing at $50 should really be trading at only $15, and then sees that the dailystochastics are painfully overbought, he or she might then infer that bothtechnicians and fundamentalists may be seeking a pullback to bring thestock back to more sane levels.
CHAIKIN MONEY FLOW OSCILLATOR
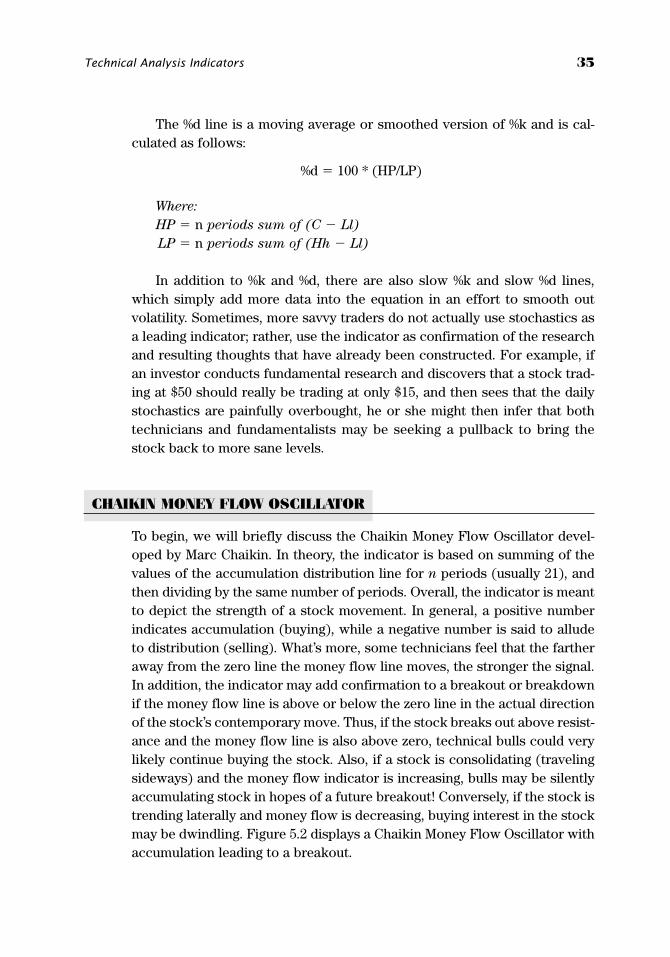
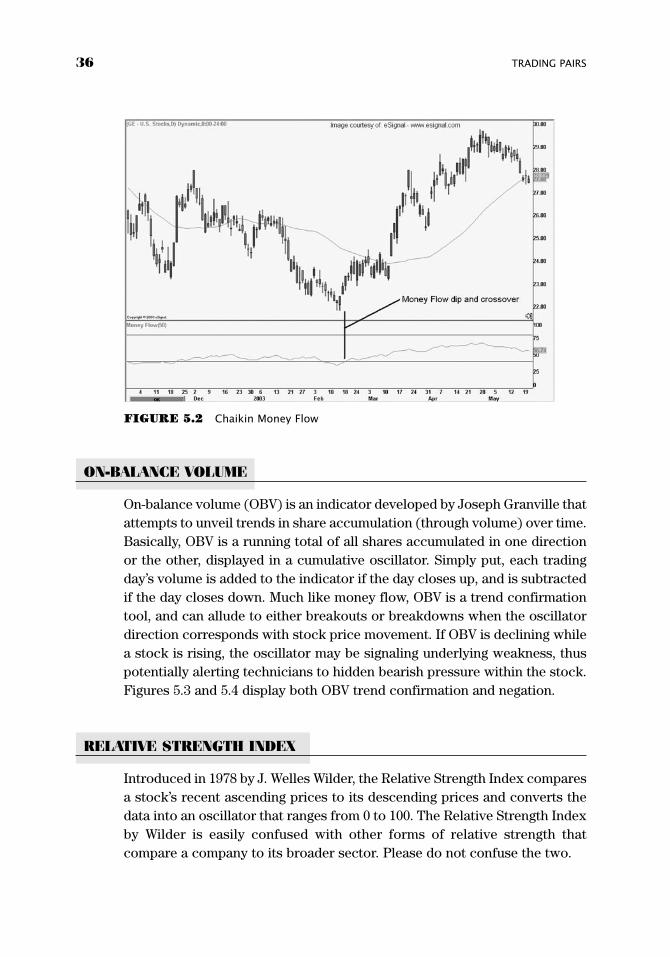
To begin, we will briefly discuss the Chaikin Money Flow Oscillator devel-oped by Marc Chaikin. In theory, the indicator is based on summing of thevalues of the accumulation distribution line for n periods (usually 21), andthen dividing by the same number of periods. Overall, the indicator is meantto depict the strength of a stock movement. In general, a positive numberindicates accumulation (buying), while a negative number is said to alludeto distribution (selling). What’s more, some technicians feel that the fartheraway from the zero line the money flow line moves, the stronger the signal.In addition, the indicator may add confirmation to a breakout or breakdownif the money flow line is above or below the zero line in the actual directionof the stock’s contemporary move. Thus, if the stock breaks out above resist-ance and the money flow line is also above zero, technical bulls could verylikely continue buying the stock. Also, if a stock is consolidating (travelingsideways) and the money flow indicator is increasing, bulls may be silentlyaccumulating stock in hopes of a future breakout! Conversely, if the stock istrending laterally and money flow is decreasing, buying interest in the stockmay be dwindling. Figure 5.2 displays a Chaikin Money Flow Oscillator withaccumulation leading to a breakout.
GK015-C05[33-40].qxd 6/10/04 7:25 PM Page 35 Virender Negi Quark07:BOOKS:GK015-Whistler:Quark files:
36 TRADING PAIRS
ON-BALANCE VOLUME
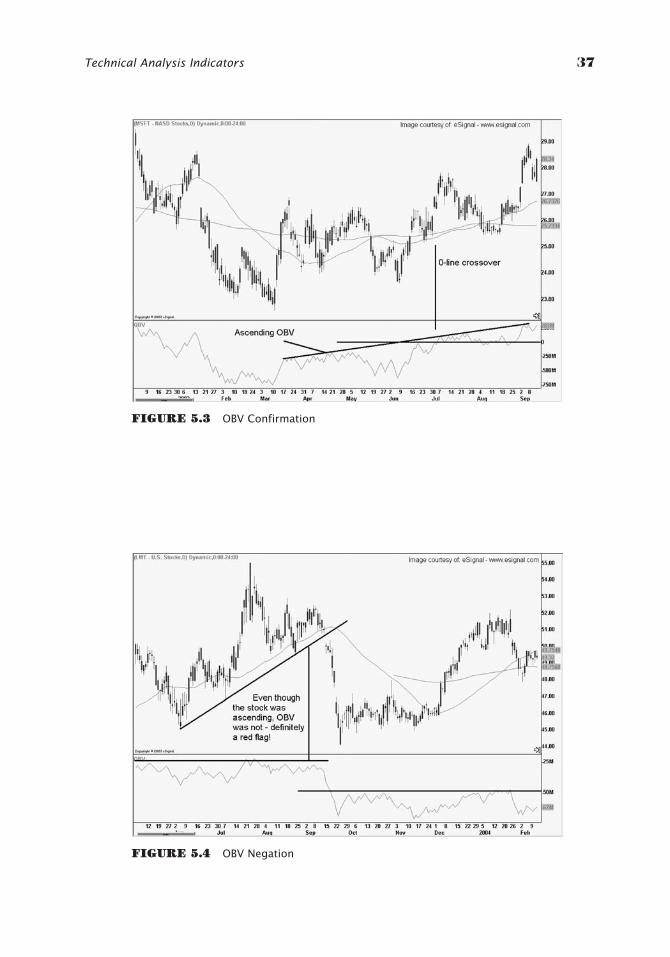
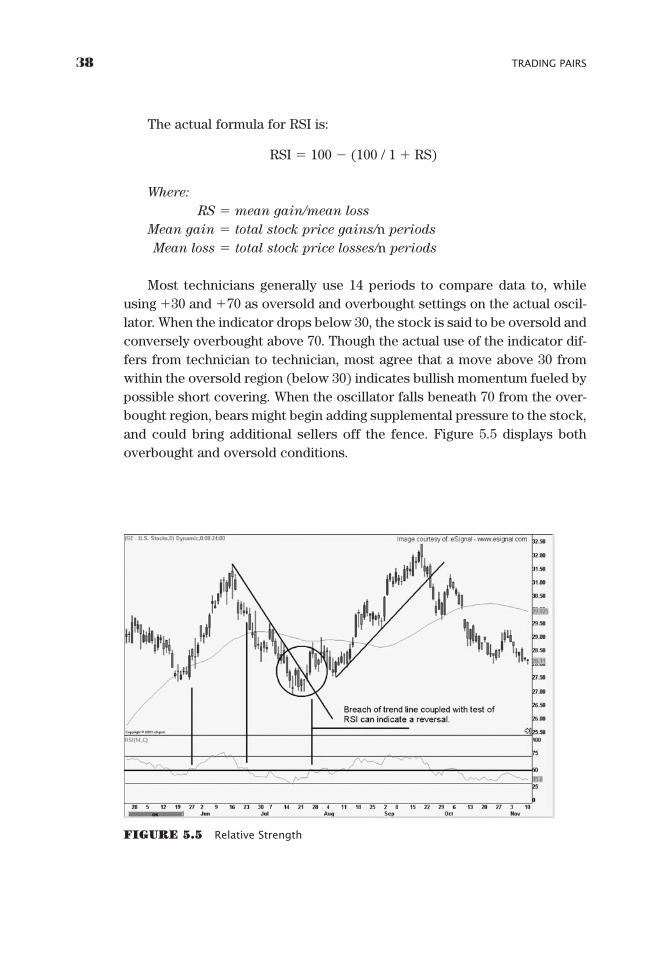
On-balance volume (OBV) is an indicator developed by Joseph Granville thatattempts to unveil trends in share accumulation (through volume) over time.Basically, OBV is a running total of all shares accumulated in one directionor the other, displayed in a cumulative oscillator. Simply put, each tradingday’s volume is added to the indicator if the day closes up, and is subtractedif the day closes down. Much like money flow, OBV is a trend confirmationtool, and can allude to either breakouts or breakdowns when the oscillatordirection corresponds with stock price movement. If OBV is declining whilea stock is rising, the oscillator may be signaling underlying weakness, thuspotentially alerting technicians to hidden bearish pressure within the stock.Figures 5.3 and 5.4 display both OBV trend confirmation and negation.
RELATIVE STRENGTH INDEX
Introduced in 1978 by J. Welles Wilder, the Relative Strength Index comparesa stock’s recent ascending prices to its descending prices and converts thedata into an oscillator that ranges from 0 to 100. The Relative Strength Indexby Wilder is easily confused with other forms of relative strength thatcompare a company to its broader sector. Please do not confuse the two.
FIGURE 5.2 Chaikin Money Flow
GK015-C05[33-40].qxd 6/10/04 7:25 PM Page 36 Virender Negi Quark07:BOOKS:GK015-Whistler:Quark files:
Technical Analysis Indicators 37
FIGURE 5.3 OBV Confirmation
FIGURE 5.4 OBV Negation
GK015-C05[33-40].qxd 6/10/04 7:25 PM Page 37 Virender Negi Quark07:BOOKS:GK015-Whistler:Quark files:
The actual formula for RSI is:
RSI � 100 � (100 / 1 � RS)
Where:
RS � mean gain/mean loss
Mean gain � total stock price gains/n periods
Mean loss � total stock price losses/n periods
Most technicians generally use 14 periods to compare data to, whileusing �30 and �70 as oversold and overbought settings on the actual oscil-lator. When the indicator drops below 30, the stock is said to be oversold andconversely overbought above 70. Though the actual use of the indicator dif-fers from technician to technician, most agree that a move above 30 fromwithin the oversold region (below 30) indicates bullish momentum fueled bypossible short covering. When the oscillator falls beneath 70 from the over-bought region, bears might begin adding supplemental pressure to the stock,and could bring additional sellers off the fence. Figure 5.5 displays bothoverbought and oversold conditions.
38 TRADING PAIRS
FIGURE 5.5 Relative Strength
GK015-C05[33-40].qxd 6/10/04 7:25 PM Page 38 Virender Negi Quark07:BOOKS:GK015-Whistler:Quark files:

Technical Analysis Indicators 39
At this point I would like to reiterate that it is very important to have astrong foundation of fundamental and technical information on which tobase your pairs knowledge. Once we begin to statistically uncover theopportunities of pairs trading, it will be important to double- and triple-checkall trades with fundamental and technical analysis. It is quite a bit of work,but the fact here is: If you don’t do it, someone else will. And that person mayuncover the one nugget of information that you don’t know. After all, thepoint of trading is to make money, and to do so effectively, we must workhard, while leaving no stone unturned.
GK015-C05[33-40].qxd 6/10/04 7:25 PM Page 39 Virender Negi Quark07:BOOKS:GK015-Whistler:Quark files:

GK015-C05[33-40].qxd 6/10/04 7:25 PM Page 40 Virender Negi Quark07:BOOKS:GK015-Whistler:Quark files:
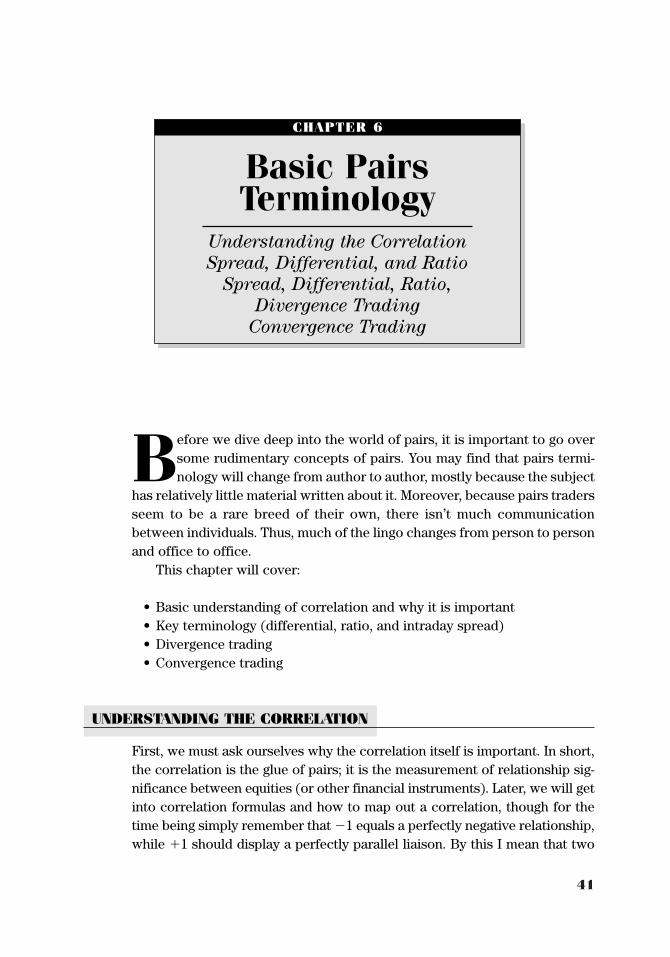
41
Before we dive deep into the world of pairs, it is important to go oversome rudimentary concepts of pairs. You may find that pairs termi-nology will change from author to author, mostly because the subject
has relatively little material written about it. Moreover, because pairs tradersseem to be a rare breed of their own, there isn’t much communicationbetween individuals. Thus, much of the lingo changes from person to personand office to office.
This chapter will cover:
• Basic understanding of correlation and why it is important• Key terminology (differential, ratio, and intraday spread)• Divergence trading• Convergence trading
UNDERSTANDING THE CORRELATION
First, we must ask ourselves why the correlation itself is important. In short,the correlation is the glue of pairs; it is the measurement of relationship sig-nificance between equities (or other financial instruments). Later, we will getinto correlation formulas and how to map out a correlation, though for thetime being simply remember that �1 equals a perfectly negative relationship,while �1 should display a perfectly parallel liaison. By this I mean that two
CHAPTER 6
Basic PairsTerminology
Understanding the Correlation
Spread, Differential, and Ratio
Spread, Differential, Ratio,
Divergence Trading
Convergence Trading
GK015-C06[41-46].qxd 6/10/04 7:25 PM Page 41 Virender Negi Quark07:BOOKS:GK015-Whistler:Quark files:

42 TRADING PAIRS
stocks with a �1 relationship would have exactly similar charts directlymirroring one another. Equities with a correlation of �1 would be comparableto positive and negative sides of a magnet. Even though they look similar onthe surface, when you try to put them together, they force themselves awayfrom one another. Sounds like a bad family reunion!
When we think of correlations, we consider not only the main correlationbetween two stocks, but also the correlation among any number of equitiesand other financial vehicles such as indices. For example, if you are anAmerican, you have a relationship with not only the federal government, butyour state government as well. While you may feel a stronger affiliation withyour home state, everything that the federal government does likely affectsyou in one way or another. Thus, whether you like it or not, you have to payattention to broader federal activities that will have an impact on your life.This would be the same as relating a sector to its corresponding index. Evenif you believe that you have found the “perfect” pair in a relatively safesector, it is still a good idea to know what the correlation is between yourchosen stocks and the indices in which that they are listed. That way, if themarket begins to dump, you may have a good idea of how your stocks willreact. Another way of watching this may be to monitor beta, which will bediscussed later in the book.
SPREAD, DIFFERENTIAL, AND RATIO
The differential, ratio, and intraday spread are simply three distinct ways ofviewing and/or reading pairs. One point that often confuses people is the useof the term spread. All three terms used above describe a certain type ofspread and are each calculated using different (though basic) math. How-ever, the term spread, as it will be used in this book refers to the intraday
and closing pairs spreads only. Intraday spreads are generally known as thedifference between the bid and ask on an intraday basis. Thus, using theterm spread only on an intraday basis keeps our terminology consistent withthat of the broader market. (There are many circumstances in which theterm spread applies to EOD [end of day—closing prices] data, though gen-erally in the context of equities, spread refers only to the intraday differencebetween the bid and ask.) Normal investors buy stock on the ask and sell onthe bid. If a stock were showing a spread of $1.20 by $1.40, then (if youentered a market order) you would buy the stock at $1.40 per share and sellit at $1.20. The spread would be $0.20 cents—and that, folks, is where mar-ket makers and specialists attempt to make their money. It is important to
GK015-C06[41-46].qxd 6/10/04 7:25 PM Page 42 Virender Negi Quark07:BOOKS:GK015-Whistler:Quark files:
Basic Pairs Terminology 43
remember that spreads in pairs trading are vastly different than the typicalbid/ask spread. Pairs spreads are described in the following paragraph. Onelast side note: With the exception of the term spread, when you hear eitherdifferential or ratio, assume that I am speaking about closing prices only.Other than the spread, any other data to be used on an intraday basis will bespecifically denoted using the term intraday in the description.
Spread
In terms of pairs, an intraday spread equals the intraday change in Stock Aminus the change in Stock B. For example, Intraday change during the pres-ent session (how much a stock is up or down) of Stock A – Intraday Changeof Stock B � Spread. If last Monday, Stock A had gained $1.30 at the closeand Stock B had lost $0.40, then the closing change spread would have been�$1.70. Yes, I know that “closing change spread” is confusing, but, stick withme for a moment. In general, when you hear someone say “What’s thespread?”, they will most likely be asking you during market hours when bothstocks are live. Thus, you can look to see where both stocks are, quickly getout your abacus, and add or subtract the two numbers—then you will soundlike a pro! However, when we are asked about the closing change spread, weare considering how much a stock gained or lost within that particular ses-sion. Some people will simply ask you “What was the closing spread?” Youwill then likely want to reply, “Do you mean the closing intraday spread orthe differential?” It gets confusing, I know, but it is what it is.
Differential
The differential is simply one equity minus the other. For example, Closingprice of Stock A – Closing price of Stock B � Differential. The differential isdissimilar to the spread, as it uses the pure closing price of both stocks anddoes not directly consider how much either stock gained or lost during thesession. While a differential can be calculated for specified intraday periods,we will not do so in this book. The differential will primarily be used forEOD data and swing trading analysis.
Ratio
The ratio equals either the closing price or intraday change of the first stockdivided by the second. For example, Intraday change of Stock A /Intradaychange of Stock B � Intraday ratio. The ratio is generally used to measurethe amount of one share needed to equal the value of another. Some traders
GK015-C06[41-46].qxd 6/10/04 7:25 PM Page 43 Virender Negi Quark07:BOOKS:GK015-Whistler:Quark files:
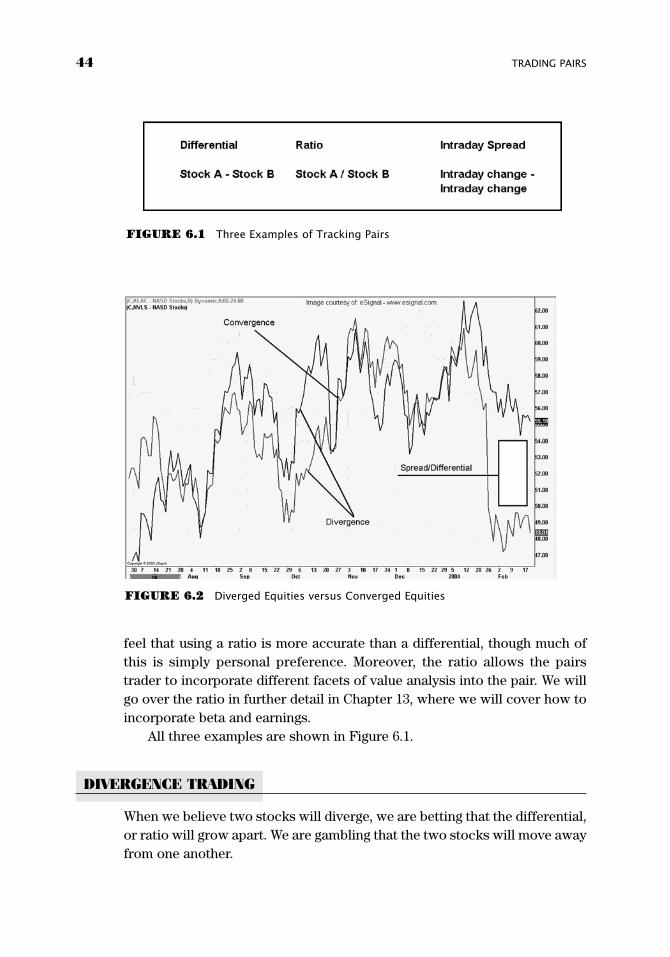
feel that using a ratio is more accurate than a differential, though much ofthis is simply personal preference. Moreover, the ratio allows the pairstrader to incorporate different facets of value analysis into the pair. We willgo over the ratio in further detail in Chapter 13, where we will cover how toincorporate beta and earnings.
All three examples are shown in Figure 6.1.
DIVERGENCE TRADING
When we believe two stocks will diverge, we are betting that the differential,or ratio will grow apart. We are gambling that the two stocks will move awayfrom one another.
44 TRADING PAIRS
FIGURE 6.1 Three Examples of Tracking Pairs
FIGURE 6.2 Diverged Equities versus Converged Equities
GK015-C06[41-46].qxd 6/10/04 7:25 PM Page 44 Virender Negi Quark07:BOOKS:GK015-Whistler:Quark files:
Divergence traders are trading away from the statistical mean and/orbelieve that the fundamental valuation of two companies has changed. Thisbelief denotes that the stocks will no longer trade together (at least in theshort term) and will begin to separate. Imagine a rubber band expanding.
CONVERGENCE TRADING
Convergence traders believe that two stocks have already diverged to apoint where the rubber band is near or at its maximum threshold, and willnot grow apart any further. Thus, the convergence trader is betting that thetwo equities are going to come back together. Once again, equities recon-verge for both technical and fundamental reasons, but can also simply havean independent event that sets one of the two equities in motion. No matterhow you slice it, divergence is the rubber band expanding and convergenceis the rubber band coming back together (see Figure 6.2).
Now that you have a general understanding of what pairs are and howthey work, the most important concept to grasp is that of the rubber band.Pairs are simply a relationship of elasticity (not in the economic sense)where companies are bound by their correlations. As previously mentioned,correlations are the glue of pairs!
Basic Pairs Terminology 45
GK015-C06[41-46].qxd 6/10/04 7:25 PM Page 45 Virender Negi Quark07:BOOKS:GK015-Whistler:Quark files:

GK015-C06[41-46].qxd 6/10/04 7:25 PM Page 46 Virender Negi Quark07:BOOKS:GK015-Whistler:Quark files:
47
You may be asking yourself: Why Excel? Well, my friend, even if youhave an advanced program that already calculates pairs, Excel will dowonders in helping you understand the internal workings of the
strategy. This chapter is meant only to assist investors in creating a basicExcel spreadsheet for pairs analysis and learn how to import free (yes,free) end-of-day data from Yahoo.com.
The data we will be using is end-of-day (EOD) data. By this I mean that wewill only be using each individual trading day’s open, close, high, low, and totalvolume. This data is the same data used to make up daily charts for equities.
Also, the reason for a brief chapter on Excel is that we will be doingmany of our calculations inside the spreadsheet program. In general, almosteveryone has access to Excel; thus, it serves as an easily accessible platformto convey the pairs subject.
Step 1. Open Excel (any version will do) and create a new spreadsheet.Type “Main Spreadsheet 1” in cell A1, and then save the sheet as Exam-ple_pairs_sheet1. We will continue adding to this sheet as you workthrough the book, so by the end you will have your own spreadsheet.(As a side note, you will need Internet access to build your spreadsheet.)
Step 2. Once you have your spreadsheet ready to go, label the three tabsat the bottom of the sheet (each indicates a different sheet within thegroup): Main, Stock 1, and Stock 2 (see Figure 7.1).
Step 3. Once this is done, jump on the Internet and go to www.yahoo.com.
Step 4. Click on “Finance,” or follow the link: http://finance.yahoo.com/?u
CHAPTER 7
Importing Datainto Excel
GK015-C07[47-50].qxd 6/10/04 7:26 PM Page 47 Virender Negi Quark07:BOOKS:GK015-Whistler:Quark files:

Step 5. In the stock ticker entry box, put in the ticker KLAC for the com-pany KLA Tencor.
Step 6. Next, look to the left of the screen and you will see a list of links.The fourth link down is titled “Historical Prices.”
Step 7. Click on the link.
Step 8. From here you will see a table displaying the stock’s closing EODdata, along with a date entry section at the top. In the date entry sectionuse a start date of January 1, 2002, and an end date of July 31, 2003. Thenclick “Get Prices.” Figure 7.2 shows what the screen should look like.
Step 9. Scroll to the bottom of the screen and click on the link titled“Download to Spreadsheet.” You may have to save the data, but youshould be able to just open it from the current location. The sheet shouldopen an Excel spreadsheet with all of the historical data requested.
48 TRADING PAIRS
FIGURE 7.1 Excel Spreadsheet Example
GK015-C07[47-50].qxd 6/10/04 7:26 PM Page 48 Virender Negi Quark07:BOOKS:GK015-Whistler:Quark files:
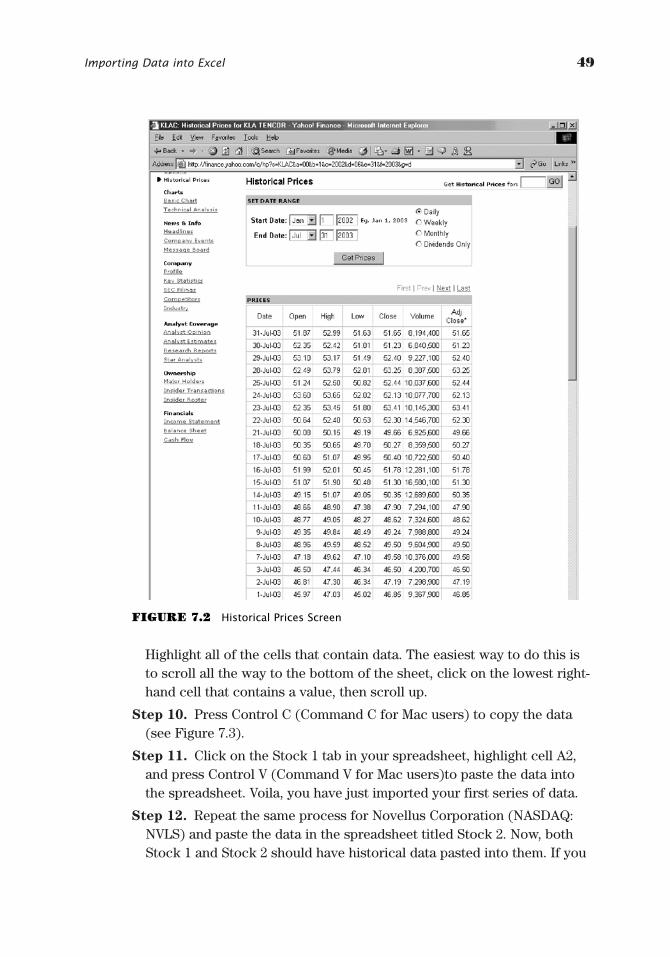
Importing Data into Excel 49
Highlight all of the cells that contain data. The easiest way to do this isto scroll all the way to the bottom of the sheet, click on the lowest right-hand cell that contains a value, then scroll up.
Step 10. Press Control C (Command C for Mac users) to copy the data(see Figure 7.3).
Step 11. Click on the Stock 1 tab in your spreadsheet, highlight cell A2,and press Control V (Command V for Mac users)to paste the data intothe spreadsheet. Voila, you have just imported your first series of data.
Step 12. Repeat the same process for Novellus Corporation (NASDAQ:NVLS) and paste the data in the spreadsheet titled Stock 2. Now, bothStock 1 and Stock 2 should have historical data pasted into them. If you
FIGURE 7.2 Historical Prices Screen
GK015-C07[47-50].qxd 6/10/04 7:26 PM Page 49 Virender Negi Quark07:BOOKS:GK015-Whistler:Quark files:
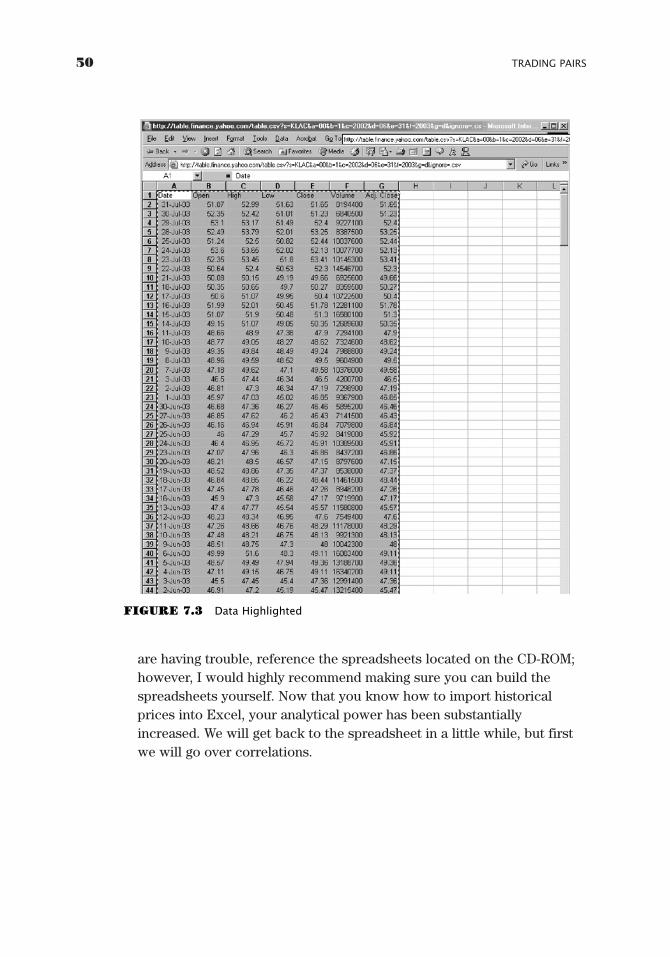
are having trouble, reference the spreadsheets located on the CD-ROM;however, I would highly recommend making sure you can build thespreadsheets yourself. Now that you know how to import historicalprices into Excel, your analytical power has been substantiallyincreased. We will get back to the spreadsheet in a little while, but firstwe will go over correlations.
50 TRADING PAIRS
FIGURE 7.3 Data Highlighted
GK015-C07[47-50].qxd 6/10/04 7:26 PM Page 50 Virender Negi Quark07:BOOKS:GK015-Whistler:Quark files:
51
CHAPTER 8
UnderstandingCorrelations
Steven Price
An investor looking to trade pairs may want a standardized method bywhich to compare the relationship between target stocks. Studyingthe recent spread or differential is one way to decide which stocks to
play; however, knowing just how well correlated those equities are over timeis a valuable tool that can contribute a historical perspective. Those thathave shown a strong positive correlation over some historical period aremore likely to do so in the future. Knowing this correlation may also open upa world of trading possibilities beyond simply stocks in related industries.For example, if a trader knew that two stocks were close to 100 percentcorrelated, would it matter whether one was American Airlines and theother was Wal-Mart? Probably not. What would matter is that those stocks,in addition to following other guidelines highlighted in this text, were alsostrongly matched with one another.
The mathematical calculation used by many fund managers as a riskmanagement tool is the correlation coefficient. When a fund manager islooking for diversification, therefore reducing risk, he or she sometimeslooks for stocks that are not closely correlated. This helps to ensure that abad quarter for one of the fund’s holdings can be offset by a good quarter foranother holding. For a pairs trader, however, the reverse would be helpful.The more closely one stock is correlated to another, the more reliable is themovement in the same direction. The higher correlation also increases the
Note: If you find this chapter confusing, Chapter 9 simplifies the information using Excel; however,I highly recommend having a strong grasp of the correlation coefficient, as it is the foundation ofpairs.
GK015-C08[51-58].qxd 6/10/04 7:32 PM Page 51 Virender Negi Quark07:BOOKS:GK015-Whistler:Quark files:
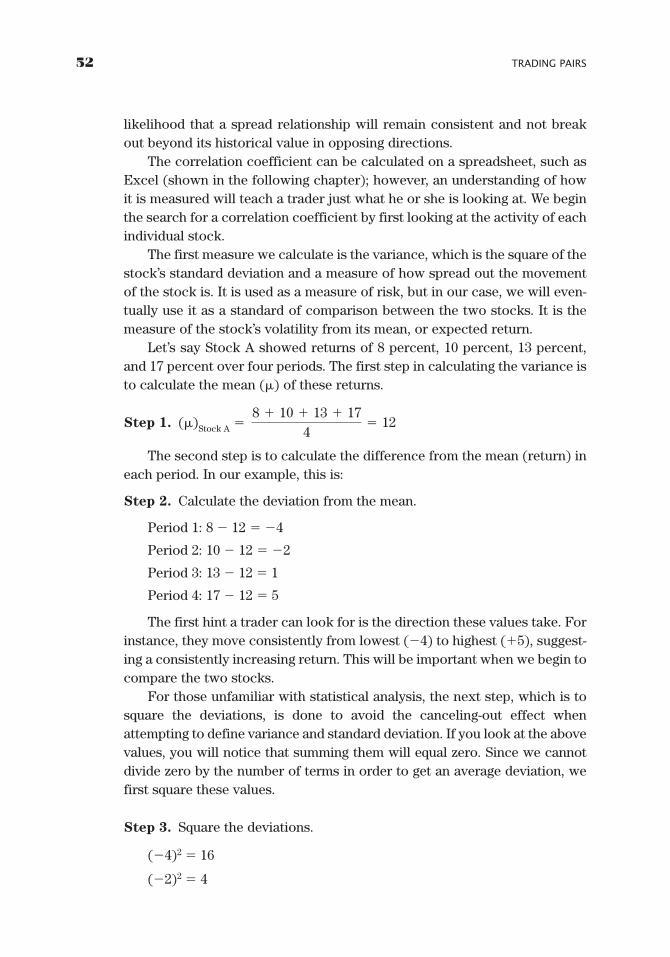
likelihood that a spread relationship will remain consistent and not breakout beyond its historical value in opposing directions.
The correlation coefficient can be calculated on a spreadsheet, such asExcel (shown in the following chapter); however, an understanding of howit is measured will teach a trader just what he or she is looking at. We beginthe search for a correlation coefficient by first looking at the activity of eachindividual stock.
The first measure we calculate is the variance, which is the square of thestock’s standard deviation and a measure of how spread out the movementof the stock is. It is used as a measure of risk, but in our case, we will even-tually use it as a standard of comparison between the two stocks. It is themeasure of the stock’s volatility from its mean, or expected return.
Let’s say Stock A showed returns of 8 percent, 10 percent, 13 percent,and 17 percent over four periods. The first step in calculating the variance isto calculate the mean (�) of these returns.
Step 1. (�)Stock A �
The second step is to calculate the difference from the mean (return) ineach period. In our example, this is:
Step 2. Calculate the deviation from the mean.
Period 1: 8 � 12 � �4
Period 2: 10 � 12 � �2
Period 3: 13 � 12 � 1
Period 4: 17 � 12 � 5
The first hint a trader can look for is the direction these values take. Forinstance, they move consistently from lowest (�4) to highest (�5), suggest-ing a consistently increasing return. This will be important when we begin tocompare the two stocks.
For those unfamiliar with statistical analysis, the next step, which is tosquare the deviations, is done to avoid the canceling-out effect whenattempting to define variance and standard deviation. If you look at the abovevalues, you will notice that summing them will equal zero. Since we cannotdivide zero by the number of terms in order to get an average deviation, wefirst square these values.
Step 3. Square the deviations.
(�4)2 � 16
(�2)2 � 4
8 � 10 � 13 � 174
� 12
52 TRADING PAIRS
GK015-C08[51-58].qxd 6/10/04 7:32 PM Page 52 Virender Negi Quark07:BOOKS:GK015-Whistler:Quark files:
(1)2 � 1
(5)2 � 25
We now sum these squared deviations and divide by the number of peri-ods (n) minus one, or (n � 1). The reason we divide by (n�1), rather than (n),is to help get an unbiased estimator of variance and also because we cannotget the variance of a set of less than two numbers. This is the rule for sampledata. For those traders who would like to delve further into this rule, a lessonin statistics is in order, which is beyond the scope of this text. However, forour purposes, we will simply follow the rule.
Step 4. Sum the squared deviations and divide by (n�1).
VarianceStock A �
We now have the variance, but we will also need the standard deviationto eventually calculate the correlation coefficient. The standard deviation isthe square root of the variance.
Step 5. Take the square root of the variance to calculate standarddeviation.
√15.33 � Standard deviation Stock A � 3.92
We now have the basic mathematical components to calculate the cor-relation coefficient, but we need to first combine these to calculate thecovariance between the returns. The covariance is the statistic that gives usa numerical value that tells us the actual correlation. It tells us if the targetstocks are moving together, moving in opposite directions, or are unrelated.However, the covariance number is difficult to interpret, as it is inconsistentamong stocks with different values. What does a covariance of 54 mean?What about �65? In general, a large positive number for covariance suggeststhat the stocks have a strong positive correlation (stocks that move in thesame direction at the same time). A large negative number suggests a strongnegative correlation (stocks that move in opposite directions in the sametime period). Rather than trying to decipher the meaning of different covari-ance numbers that are based on differently priced stocks, we can convertthat covariance term into a standardized value that applies to all pairs ofstocks, known as the correlation coefficient.
In order to calculate the covariance, we subtract each return of Stock Afrom its mean, and then we subtract each corresponding return of Stock Bfrom its mean and multiply the two values together. We then sum the resultingproducts and divide by (n�1). An example will make this clearer.
16 � 4 � 1 � 25 4 � 1
�463
� 15.33
Understanding Correlations 53
GK015-C08[51-58].qxd 6/10/04 7:32 PM Page 53 Virender Negi Quark07:BOOKS:GK015-Whistler:Quark files:

Rather than duplicate the same steps as above, assume the returns forStock B are as follows: 1 percent, 2 percent, 4 percent, and 5 percent. Thisgives Stock B a mean (�) of 3 percent, a variance of 3.33, and a standarddeviation of 1.83.
Covariance Calculation
Returns
Period A B (A � �) (B � �) (A � �) � (B � �)
1 8 1 8 � 12 � �4 1 � 3 � �2 �4 � �2 � 82 10 2 10 � 12 � �2 2 � 3 � �1 �2 � �1 � 2
3 13 4 13 � 12 � 1 4 � 3 � 1 1 � 1 � 1
4 17 5 17 � 12 � 5 5 � 3 � 2 5 � 2 � 10
Sum 21
Hint: Notice the difference in returns from stock B’s mean also move fromlowest to highest.
We take the sum of the products (21) and divide by (n�1):
Covariance of Stock A and Stock B:
Now let’s change some numbers around and look at another scenario.Suppose that instead of posting returns of 1 percent, 2 percent, 4 percent,and 5 percent in periods one through four, Stock B instead posted returns of5 percent, 4 percent, 2 percent, and 1 percent in those four periods.
Period A B (A � �) (B � �) (A � �) � (B � �)
1 8 5 8 � 12 � �4 5 � 3 � 2 �4 � 2 � �8
2 10 4 10 � 12 � �2 4 � 3 � 1 �2 � 1 � �2
3 13 2 13 � 12 � 1 2 � 3 � �1 1 � �1 � �1
4 17 1 17 � 12 � 5 1 � 3 � �2 5 � �2 � �10
Sum � �21
We take the sum of the products (�21) and divide by (n�1):
Covariance of Stock A and Stock B:
We can see that by reversing the order of the returns of Stock B, so thatit declines as Stock A’s returns increase, we get a negative covariance, imply-ing stocks that move in opposite directions. Although we can see the differ-ence in the direction of movement, it is difficult to know what exactly thevalues of 7 or �7 stand for in the world of all stocks.
�214 � 1
� �7
214 � 1
� 7
54 TRADING PAIRS
GK015-C08[51-58].qxd 6/10/04 7:32 PM Page 54 Virender Negi Quark07:BOOKS:GK015-Whistler:Quark files:
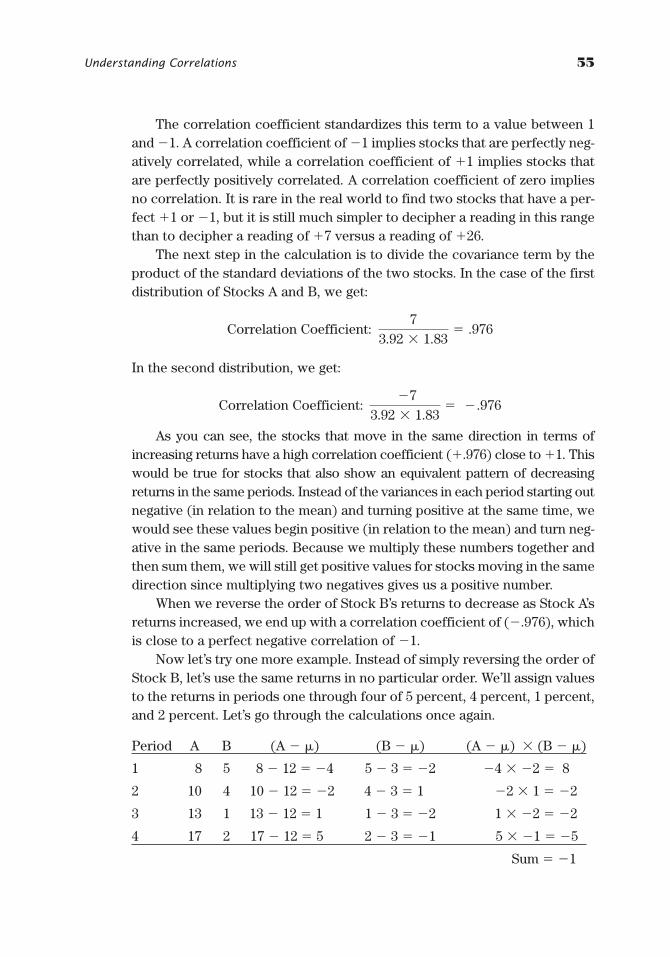
The correlation coefficient standardizes this term to a value between 1and �1. A correlation coefficient of �1 implies stocks that are perfectly neg-atively correlated, while a correlation coefficient of �1 implies stocks thatare perfectly positively correlated. A correlation coefficient of zero impliesno correlation. It is rare in the real world to find two stocks that have a per-fect �1 or �1, but it is still much simpler to decipher a reading in this rangethan to decipher a reading of �7 versus a reading of �26.
The next step in the calculation is to divide the covariance term by theproduct of the standard deviations of the two stocks. In the case of the firstdistribution of Stocks A and B, we get:
Correlation Coefficient:
In the second distribution, we get:
Correlation Coefficient:
As you can see, the stocks that move in the same direction in terms ofincreasing returns have a high correlation coefficient (�.976) close to �1. Thiswould be true for stocks that also show an equivalent pattern of decreasingreturns in the same periods. Instead of the variances in each period starting outnegative (in relation to the mean) and turning positive at the same time, wewould see these values begin positive (in relation to the mean) and turn neg-ative in the same periods. Because we multiply these numbers together andthen sum them, we will still get positive values for stocks moving in the samedirection since multiplying two negatives gives us a positive number.
When we reverse the order of Stock B’s returns to decrease as Stock A’sreturns increased, we end up with a correlation coefficient of (�.976), whichis close to a perfect negative correlation of �1.
Now let’s try one more example. Instead of simply reversing the order ofStock B, let’s use the same returns in no particular order. We’ll assign valuesto the returns in periods one through four of 5 percent, 4 percent, 1 percent,and 2 percent. Let’s go through the calculations once again.
Period A B (A � �) (B � �) (A � �) � (B � �)
1 8 5 8 � 12 � �4 5 � 3 � �2 �4 � �2 � 8
2 10 4 10 � 12 � �2 4 � 3 � 1 �2 � 1 � �2
3 13 1 13 � 12 � 1 1 � 3 � �2 1 � �2 � �2
4 17 2 17 � 12 � 5 2 � 3 � �1 5 � �1 � �5
Sum � �1
�73.92 � 1.83
� �.976
73.92 � 1.83
� .976
Understanding Correlations 55
GK015-C08[51-58].qxd 6/10/04 7:32 PM Page 55 Virender Negi Quark07:BOOKS:GK015-Whistler:Quark files:
By placing the returns from Stock B in no particular order compared toStock A, we now get the following covariance and correlation coefficient.
Covariance of Stock A and Stock B:
Correlation coefficient:
As you can see, a number close to zero indicates very little correlation atall between the two stocks. This can be seen in the returns, where Stock A’sreturns are increasing and Stock B’s returns first decrease, then increase,but show little similarity to Stock A.
Now let’s say you were analyzing groups of stocks for the possibility oftrading them in pairs and you got the preceding results of .976, �.976, or�.05 for your correlation coefficients of various comparisons. Which pair ofstocks would you be more likely to choose, all else being equal? The highcorrelation of .976 would indicate that these two stocks are highly correlatedwith one another and that a temporary move in the spread between the twobeyond historical values is more likely to correct itself than for either of theother two combinations.
A strong negative correlation might indicate that two stocks which arecurrently moving in the same direction could be due for divergence. In thiscase, the correlation coefficient would suggest that over the period of timefor which you have collected data the stocks moved in opposite directions.If they have now converged, it may be an opportunity to trade the two on theexpansion away from this convergence. Stocks that might exhibit this typeof relationship could be gold stocks and banking stocks, which tend to movein opposite directions based on the strength of the economy.
One of the biggest factors to consider when calculating this coefficientis the time period and frequency of the sample data. If a trader is taking onlyquarterly results, the coefficient will measure only the end point at whichthese stocks finish four times per year. This would certainly allow for a greatdeal of movement in the interim periods and could be very costly for a traderwith a rather short time horizon. Daily data is more accurate; however, it isalso very labor intensive to compile and may show more extreme fluctuationthan two stocks have exhibited over time, depending on the time period thatis chosen. For instance, a trader who chooses a single month’s worth of dailyclosing prices for his or her data sample may end up with a skewed pictureof the relationship between two companies. If Stock A releases earningsmid-month and Stock B experiences little movement that month, the picturemay be misleading.
�.3333.92 � 1.83
� �.05
�14 � 1
� �.333
56 TRADING PAIRS
GK015-C08[51-58].qxd 6/10/04 7:32 PM Page 56 Virender Negi Quark07:BOOKS:GK015-Whistler:Quark files:
The best way to address time and frequency of data sample collectionwould be for a trader to define the time horizon of his proposed trade andthen pick a reasonable frequency by which to measure the two stocks’returns. The next step would be to go back far enough in time to smooth outthe results of outlying blips in the data stream. If a trader is looking at a quar-terly time horizon, he may want to take weekly data and go back 5 to 10years to get an idea of just how correlated the stocks are. If a trader is look-ing at a time horizon of just a few days for his trade, it will be difficult to geta reliable coefficient; however, looking at daily data for the past few monthsmay be more appropriate. The idea is to match time horizons and thenextend back far enough historically to get a reliable number.
As mentioned earlier, the calculation for correlation coefficient can bedone quickly and easily on Excel or another statistical program. However, athorough understanding of how this is calculated can give a trader a betterunderstanding of the data he is seeing and the ability to “eyeball” a set ofreturns . . . and get an idea ahead of time, whether he has found candidatesfor his pairs trading strategy before spending the time to enter the data.
Understanding Correlations 57
GK015-C08[51-58].qxd 6/10/04 7:32 PM Page 57 Virender Negi Quark07:BOOKS:GK015-Whistler:Quark files:

GK015-C08[51-58].qxd 6/10/04 7:32 PM Page 58 Virender Negi Quark07:BOOKS:GK015-Whistler:Quark files:
59
CHAPTER 9
CorrelationSimplified
What Is a Correlation?
Where to Find Correlations
Building a Correlation
Using Excel
WHAT IS A CORRELATION?
As previously explained, the correlation is the glue that holds a pair together.On a commonsense level, we might expect ExxonMobil (NYSE: XOM) andChevronTexaco (NYSE: CVX) to have a higher correlation than ExxonMobiland Microsoft (NASDAQ: MSFT). Why you ask? Exxon and Chevron areboth major oil and gas integration and refinery companies, while Microsoftis the root of all evil, er, um, sorry, I mean Microsoft is a software company.(Really, just kidding there.) All right, back on track, the main principle hereis that comparable business models have higher correlations. Although thereare a few exceptions, most companies will have the highest correlationswith similar companies in their respective sectors; that is, trucking stockswill closely follow trucking stocks, while insurance stocks may faithfullypursue other insurance stocks.
WHERE TO FIND CORRELATIONS
While I highly recommend working through the previous chapter, I also havea shortcut. First, if you are willing to pay for data, the best resource availableis http://www.market-topology.com. This site has already neatly mapped outthe correlations for not only U.S. markets, but foreign markets as well. I amnot completely sure what time periods market-topology.com is using for itscorrelation data, though I have noticed that the correlation numbers areidentical to those retrieved on a Bloomberg terminal.
GK015-C09[59-64].qxd 6/10/04 7:27 PM Page 59 Virender Negi Quark07:BOOKS:GK015-Whistler:Quark files:
If you have access to a Bloomberg terminal (cost: around $1,400 permonth), the command to find historical spread information along with cor-relation numbers is: Ticker EQUITY Ticker EQUITY HS GO. Using actualcompany tickers, the historical spread function would be entered as XOMEQUITY CVX EQUITY GO. Then, once the historical spread screen is dis-played, hit “2” GO; you will then see the correlation number on the lowerleft-hand corner of the screen. Because Bloomberg never seems to change,I have a feeling that this spread command will be accurate for several yearsto come. (That’s a good thing.) But what if you don’t want to pay for the cor-relation data or do not have access to a Bloomberg terminal? No problem,we can build our own using an Excel spreadsheet.
BUILDING A CORRELATION USING EXCEL
Using the spreadsheet that we already created, the Excel syntax for calcu-lating correlations is CORREL. Let’s walk through how to calculate theaforementioned relationship.
A brief explanation of Excel syntax is needed before we go too far. Any-time you are putting a mathematical formula in a cell, if you click in the cho-sen cell, you will then see the label bar activated on the top of the screen.You can type the formula in either the actual chosen cell or the formula fieldat the top of the screen. Excel reads figures as a mathematical formula onlyif there is an equal sign (�) at the beginning of the syntax. After the equalsign, verbal functions must then come first before any actual cell values ormathematical equations. As an example of a verbal Excel function, when wetype in AVERAGE before our designated numbers, the spreadsheet willknow to automatically total all numbers in the specified period and divide bythe total amount of cells read. After the function comes the actual math syn-tax. In general, Excel reads math much like college algebra. For example,[A1 � (A1*B1)] would mean that the spreadsheet would first multiply A1and B1 and then add cell A1. When we put in syntax such as �AVERAGE
(A1:A100), we are asking Excel to return the mean of all cells summed fromA1 to A100. If you find yourself confused at any time, simply click on theHelp option on the toolbar and select the first option Microsoft Excel Help.You can type in key words like standard deviation, and Excel will bring upseveral options of topics to choose from.
Step 1. In cell A3 on the Main page, type in: Close Correlation. You willnotice that the text we have just typed overlaps into cell B3. To separate
60 TRADING PAIRS
GK015-C09[59-64].qxd 6/10/04 7:27 PM Page 60 Virender Negi Quark07:BOOKS:GK015-Whistler:Quark files:
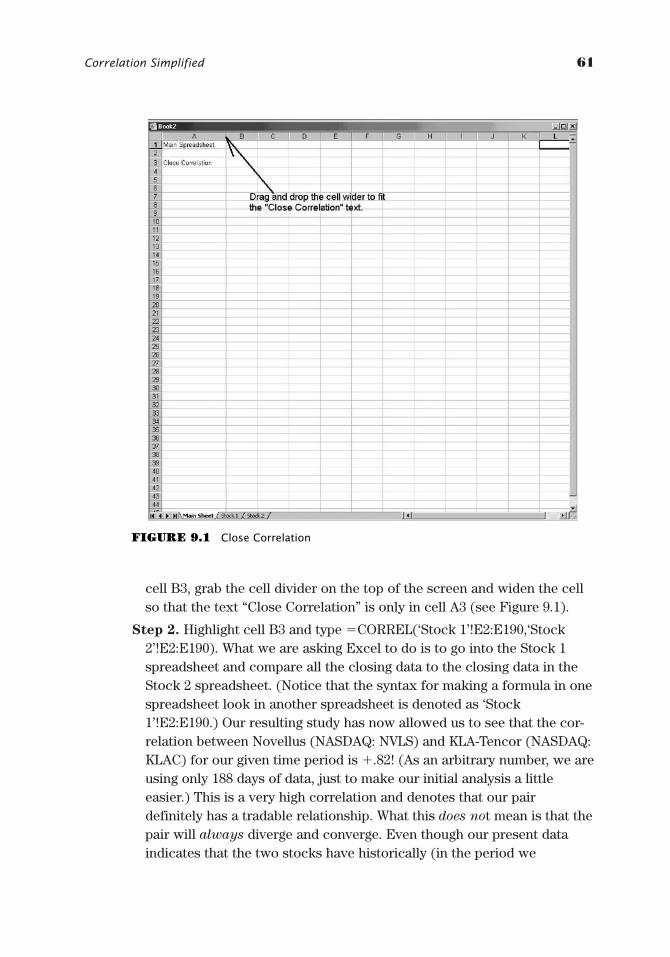
Correlation Simplified 61
cell B3, grab the cell divider on the top of the screen and widen the cellso that the text “Close Correlation” is only in cell A3 (see Figure 9.1).
Step 2. Highlight cell B3 and type �CORREL(‘Stock 1’!E2:E190,‘Stock2’!E2:E190). What we are asking Excel to do is to go into the Stock 1spreadsheet and compare all the closing data to the closing data in theStock 2 spreadsheet. (Notice that the syntax for making a formula in onespreadsheet look in another spreadsheet is denoted as ‘Stock1’!E2:E190.) Our resulting study has now allowed us to see that the cor-relation between Novellus (NASDAQ: NVLS) and KLA-Tencor (NASDAQ:KLAC) for our given time period is �.82! (As an arbitrary number, we areusing only 188 days of data, just to make our initial analysis a littleeasier.) This is a very high correlation and denotes that our pairdefinitely has a tradable relationship. What this does not mean is that thepair will always diverge and converge. Even though our present dataindicates that the two stocks have historically (in the period we
FIGURE 9.1 Close Correlation
GK015-C09[59-64].qxd 6/10/04 7:27 PM Page 61 Virender Negi Quark07:BOOKS:GK015-Whistler:Quark files:
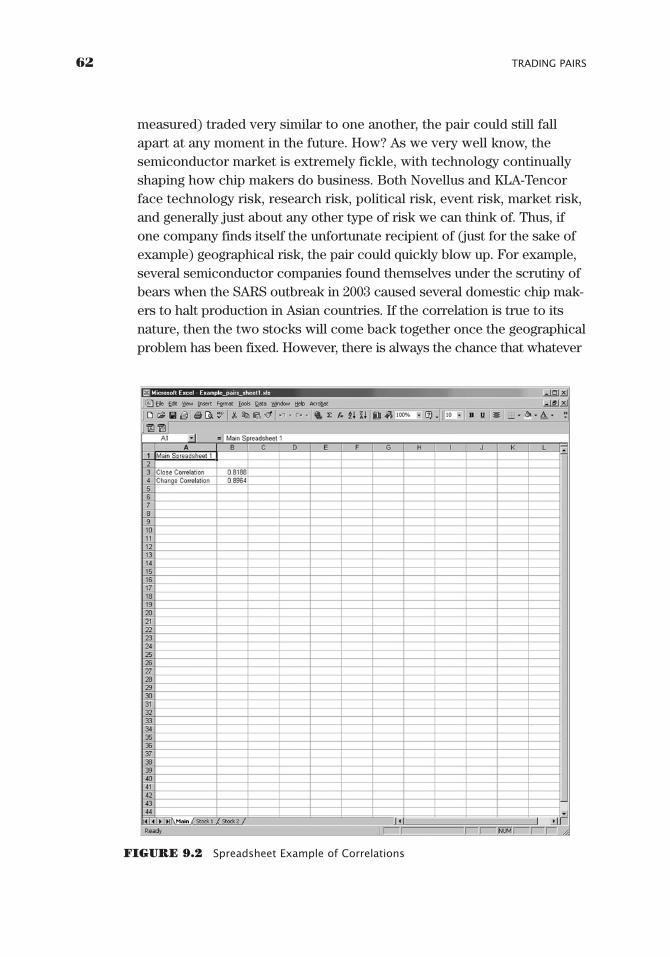
measured) traded very similar to one another, the pair could still fallapart at any moment in the future. How? As we very well know, thesemiconductor market is extremely fickle, with technology continuallyshaping how chip makers do business. Both Novellus and KLA-Tencorface technology risk, research risk, political risk, event risk, market risk,and generally just about any other type of risk we can think of. Thus, ifone company finds itself the unfortunate recipient of (just for the sake ofexample) geographical risk, the pair could quickly blow up. For example,several semiconductor companies found themselves under the scrutiny ofbears when the SARS outbreak in 2003 caused several domestic chip mak-ers to halt production in Asian countries. If the correlation is true to itsnature, then the two stocks will come back together once the geographicalproblem has been fixed. However, there is always the chance that whatever
62 TRADING PAIRS
FIGURE 9.2 Spreadsheet Example of Correlations
GK015-C09[59-64].qxd 6/10/04 7:27 PM Page 62 Virender Negi Quark07:BOOKS:GK015-Whistler:Quark files:
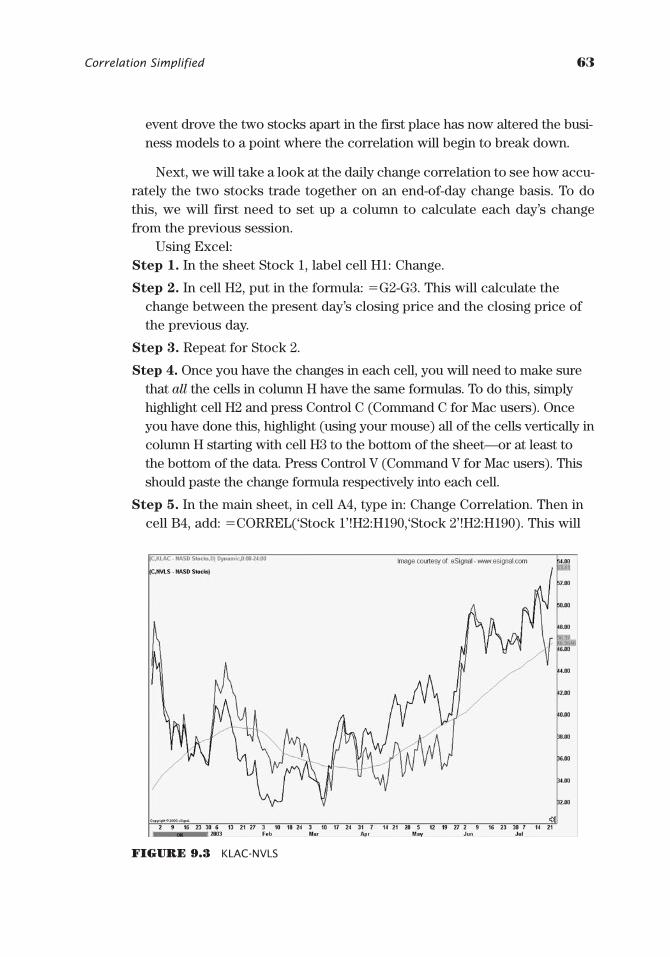
Correlation Simplified 63
event drove the two stocks apart in the first place has now altered the busi-ness models to a point where the correlation will begin to break down.
Next, we will take a look at the daily change correlation to see how accu-rately the two stocks trade together on an end-of-day change basis. To dothis, we will first need to set up a column to calculate each day’s changefrom the previous session.
Using Excel:Step 1. In the sheet Stock 1, label cell H1: Change.
Step 2. In cell H2, put in the formula: �G2-G3. This will calculate thechange between the present day’s closing price and the closing price ofthe previous day.
Step 3. Repeat for Stock 2.
Step 4. Once you have the changes in each cell, you will need to make surethat all the cells in column H have the same formulas. To do this, simplyhighlight cell H2 and press Control C (Command C for Mac users). Onceyou have done this, highlight (using your mouse) all of the cells vertically incolumn H starting with cell H3 to the bottom of the sheet—or at least tothe bottom of the data. Press Control V (Command V for Mac users). Thisshould paste the change formula respectively into each cell.
Step 5. In the main sheet, in cell A4, type in: Change Correlation. Then incell B4, add: �CORREL(‘Stock 1’!H2:H190,‘Stock 2’!H2:H190). This will
FIGURE 9.3 KLAC-NVLS
GK015-C09[59-64].qxd 6/10/04 7:27 PM Page 63 Virender Negi Quark07:BOOKS:GK015-Whistler:Quark files:
calculate the correlation of the day-to-day change between the twostocks. Figure 9.2 shows what your spreadsheet should now look like. Ifyou prefer all the data from our time range, you can put in �CORREL(‘Stock 1’!H2:H397, ‘Stock 2’cH2:H397). However, in the first CORRELexample under Step 5 we are using much less data, again, just for theease of analysis.
So what does this data mean? What these two correlations are telling usis that most likely KLAC/NVLS is a very viable pair to trade. Why?
First, the actual correlation between the two stock prices is (rounded)0.82, and the change correlation is 0.90 for the period of our study. If thechange correlation has a higher value than the EOD correlation, then weknow that the two stocks are not only a good pair to trade on an EOD basis,but will also have some intraday opportunity as well. You can see that ourcorrelation data has given us some food for thought.
Given the high correlation of our two stocks, we can also infer that thecharts of the two stocks should look extremely similar. Figure 9.3 demon-strates exactly that. Take a close look and you will see that there is a remark-able similarity between the two. I’m not sure about you, but I smell oppor-tunity here. When two stocks have a distinct relationship, then the “rubberband” theory is clearly in effect.
64 TRADING PAIRS
GK015-C09[59-64].qxd 6/10/04 7:27 PM Page 64 Virender Negi Quark07:BOOKS:GK015-Whistler:Quark files:
65
CHAPTER 10
UnderstandingStock
Correlationsin Relation to Indices
Why an Index?
What Is Beta?
How to Apply Beta
Where to Find Beta
WHY AN INDEX?
In Chapter 1, I mentioned that an index is similar to a highway runningthrough a small town. More than likely, many of the smaller roads in a townwill parallel the larger road’s general direction. This causes city planners torethink the development of newer suburbs in an effort to make the city’sstreets congruous with the larger, immobile interstate. This principle is wit-nessed in the market, as investors realize that they are less able to have animpact on a large index, than on a single stock. Thus, as investors, we areforced to base our decisions (the planning of our portfolio development) inaccordance with the greater direction of the corresponding index. Investorsmay then find information regarding a stock’s movement within an index byusing beta.
WHAT IS BETA?
Beta is the measurement of a stock’s volatility in relation to a larger index,usually the Standard & Poor’s (S&P) 500. Moreover, beta is said to be a mea-surement of market risk. Investopedia.com defines risk as: “The chance thatan investment’s actual return will be different than expected. This includes
GK015-C10[65-68].qxd 6/10/04 7:32 PM Page 65 Virender Negi Quark07:BOOKS:GK015-Whistler:Quark files:
66 TRADING PAIRS
the possibility of losing some or all of the original investment. It is usuallymeasured using the historical returns or average returns for a specific invest-ment.” Investorwords.com defines market risk as: “Risk which is common toan entire class of assets or liabilities. The value of investments may declineover a given time period simply because of economic changes or otherevents that impact large portions of the market. Asset allocation and diversi-fication can protect against market risk because different portions of themarket tend to under-perform at different times. This is also called system-atic risk.” In general, the S&P 500 is said to have a beta of �1; thus, any stockwith a beta of greater than 1 should (in theory) have greater volatility thanthe broader market. In brief, the greater a stock’s beta, the more amplified itsprice movement will be compared to the S&P 500, and the more market riska security may face. For example, a stock with a beta of �1 would likely havepercentage moves similar to the S&P 500. However, a stock with a beta of�1.5 would increase 50 percent when the S&P 500 was up 25 percent. Thekey in comparing beta is to understand that percentage moves are the greatequalizer. Thus, even though the daily change in the Dow may be �200 pointsand the daily change for Microsoft may only be �1.3 points, if the percent-age moves are similar, then the beta correlation will likely be near �1.
HOW TO APPLY BETA
If we look at Microsoft and Oracle, we know that there is a definite rela-tionship between the two companies. The correlation coefficient displays arelationship of �0.82. The relationship discovered when looking onYahoo.com is that Microsoft has a beta of 1.74, while Oracle has a beta of1.88. Both stocks have high betas compared to the S&P 500! Taking this onestep further, if we run a correlation study on both Microsoft and Oracle sep-arately against the S&P 500, we end up with 0.87 and 0.66, respectively.These numbers validate our thoughts on beta, as the lesser-correlated Ora-cle has a higher beta, thus indicating greater volatility compared to everydaymovements of the S&P 500. No matter how you slice it, though, becauseMicrosoft and Oracle both have betas above 1, they are both more volatilethan the S&P 500. For example, if S&P 500 moves (random number for thesake of argument) 0.03 percent in one day, Oracle should (in theory) close1.88 times (on a percentage basis) above the closing price of the S&P 500.However, given that day-to-day order flow and news events can cause stocksto trade more erratically than the indices, the beta measure of intradayvolatility does not always work. In fact, it’s probably a good idea to never
GK015-C10[65-68].qxd 6/10/04 7:32 PM Page 66 Virender Negi Quark07:BOOKS:GK015-Whistler:Quark files:
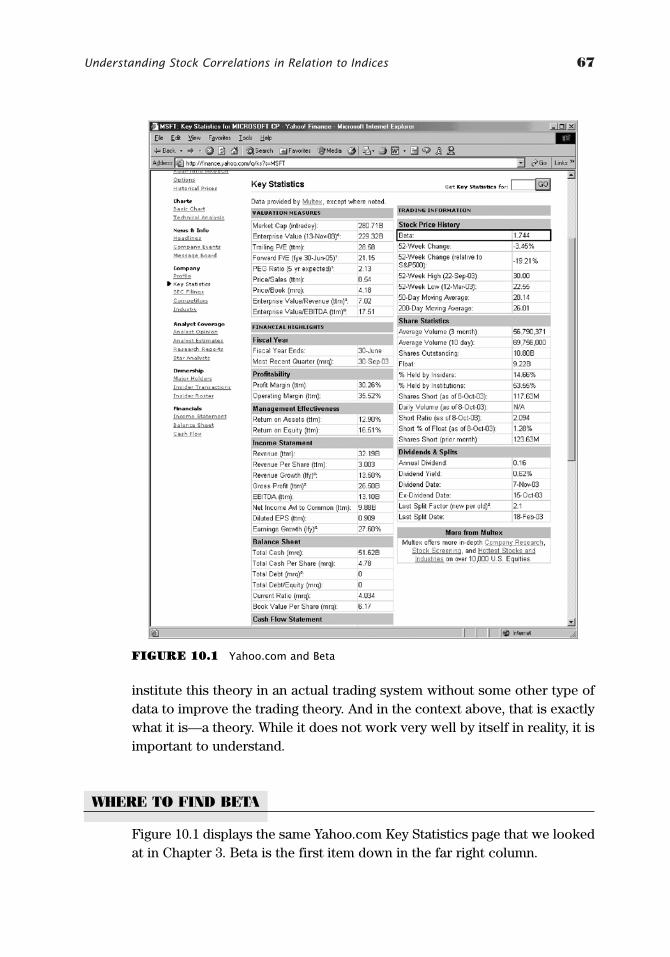
Understanding Stock Correlations in Relation to Indices 67
institute this theory in an actual trading system without some other type ofdata to improve the trading theory. And in the context above, that is exactlywhat it is—a theory. While it does not work very well by itself in reality, it isimportant to understand.
WHERE TO FIND BETA
Figure 10.1 displays the same Yahoo.com Key Statistics page that we lookedat in Chapter 3. Beta is the first item down in the far right column.
FIGURE 10.1 Yahoo.com and Beta
GK015-C10[65-68].qxd 6/10/04 7:32 PM Page 67 Virender Negi Quark07:BOOKS:GK015-Whistler:Quark files:

GK015-C10[65-68].qxd 6/10/04 7:32 PM Page 68 Virender Negi Quark07:BOOKS:GK015-Whistler:Quark files:

69
Although some statistics were discussed in Chapter 8, it is importantenough to delve a little deeper into. A basic understanding of statisticswill be the second layer of our pairs foundation, on which we build our
knowledge. So what is statistics? Statistics is the study of numerical data in anattempt to find systematic patterns. Hyperdictionary.com defines statistics as:“The practice, study or result of the application of mathematical functions tocollections of data in order to summarize or extrapolate that data.” As a result,we will be using simple descriptive statistics in an effort to uncover reliablepairs data in hopes of finding possible trading patterns.
FREQUENCY DISTRIBUTION
To begin our tour in statistics, we will look at a frequency distribution, whichis basically a table in which all data has been grouped in specific classescalled categories. The frequency distribution has nonoverlapping data thatcan be seen and analyzed.
The following steps show how to create a frequency distribution:
Step 1. Define the classes in which the data will be sorted. A class is alevel of prices that have definite upper and lower limits that do not over-lap with other levels. This principle is known as making prices mutuallyexclusive, so they cannot show up in two separate classes.
Step 2. Assign the observations (stock prices) to their classes. Once allthe prices are assigned to their respective classes, we may then find the
CHAPTER 11
Basic StatisticsFrequency Distribution
Mean/Median/Mode
Mean Deviation
Variance
Standard Deviation
GK015-C11[69-74].qxd 6/12/04 2:17 AM Page 69 Quark08 Quark08:Books:GK-Jobs:GK015-Whistler:Repro:
midpoint for further data analysis. For the midpoint, subtract the lowestvalue of all classes from the highest value.
Step 3. Count the number of observations in each class.
How do we define the classes? When we have the total amount ofobservations in the entire population, we will attempt to find out what ourclass interval is. A class interval is the total distance from the smallest tolargest values in any one class. To pick the size of the class interval, usethis formula: Class interval � (Highest value � Lowest value) / Number ofclasses. But how many classes are there? To find the total number ofclasses, we will use the formula: 2^k ≥ n. In the aforementioned equation,k stands for the power to which 2 is raised and is the smallest integer thatis greater than n, otherwise known as the total amount of observations.Hence, in a data set with 100 prices, our class size would be 7. This isbecause 2^6 � 64 is less than 100, while 2^7 � 128, which is greater than100. We would then have seven total classes. Next, using our previous for-mula, we would then have Class interval � (100 � 1) / 7, which equals14.14, or simply 14.
Setting up a frequency distribution allows us to actually see the patternof the data we are analyzing. Let’s construct a frequency distribution withthe following closing prices: 5, 4, 6, 8, 12, 5, 6, 4, 9.
First, we have nine total observations. Thus, we find that k � 4, as 2^4 � 16,and is the smallest integer equaling a sum greater than 9. Now, we know thatwe have four classes. To figure out the intervals within the four classes, wewould use: (12 � 4) / 4, which equals 2. As a result, our classes and obser-vations are:
4 � 5 46 � 7 27 � 8 18 � 9� 3
Using the frequency table that we have just created, we can then visuallysee how our data is skewed. The actual visual representation is called a his-togram and is represented as a line that looks like an upside-down “U” on achart. By skewed I mean what type of curve the data presents. Normal datais said to be “bell shaped” with the mean, median, and mode all in the cen-ter of the curve. A normal curve is a perfect upside-down U. Skewed datalooks like a U stretched either to the right or left, and represents that thereare more (or more extreme) values on one side of the data set. (EN 11.1)
70 TRADING PAIRS
GK015-C11[69-74].qxd 6/12/04 2:17 AM Page 70 Quark08 Quark08:Books:GK-Jobs:GK015-Whistler:Repro:
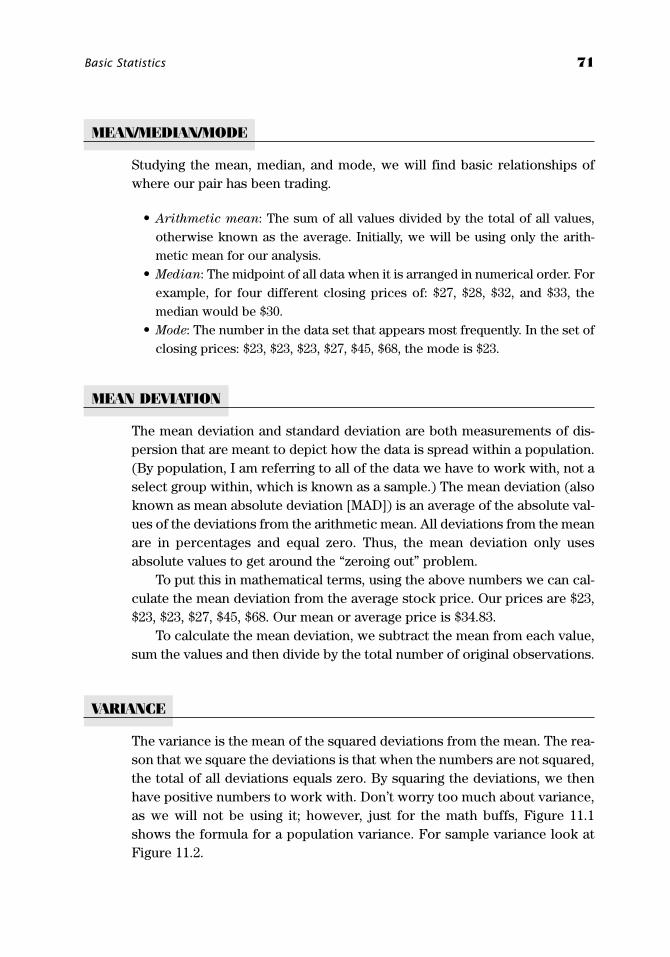
Basic Statistics 71
MEAN/MEDIAN/MODE
Studying the mean, median, and mode, we will find basic relationships ofwhere our pair has been trading.
• Arithmetic mean: The sum of all values divided by the total of all values,otherwise known as the average. Initially, we will be using only the arith-metic mean for our analysis.
• Median: The midpoint of all data when it is arranged in numerical order. Forexample, for four different closing prices of: $27, $28, $32, and $33, themedian would be $30.
• Mode: The number in the data set that appears most frequently. In the set ofclosing prices: $23, $23, $23, $27, $45, $68, the mode is $23.
MEAN DEVIATION
The mean deviation and standard deviation are both measurements of dis-persion that are meant to depict how the data is spread within a population.(By population, I am referring to all of the data we have to work with, not aselect group within, which is known as a sample.) The mean deviation (alsoknown as mean absolute deviation [MAD]) is an average of the absolute val-ues of the deviations from the arithmetic mean. All deviations from the meanare in percentages and equal zero. Thus, the mean deviation only usesabsolute values to get around the “zeroing out” problem.
To put this in mathematical terms, using the above numbers we can cal-culate the mean deviation from the average stock price. Our prices are $23,$23, $23, $27, $45, $68. Our mean or average price is $34.83.
To calculate the mean deviation, we subtract the mean from each value,sum the values and then divide by the total number of original observations.
VARIANCE
The variance is the mean of the squared deviations from the mean. The rea-son that we square the deviations is that when the numbers are not squared,the total of all deviations equals zero. By squaring the deviations, we thenhave positive numbers to work with. Don’t worry too much about variance,as we will not be using it; however, just for the math buffs, Figure 11.1shows the formula for a population variance. For sample variance look atFigure 11.2.
GK015-C11[69-74].qxd 6/12/04 2:17 AM Page 71 Quark08 Quark08:Books:GK-Jobs:GK015-Whistler:Repro:
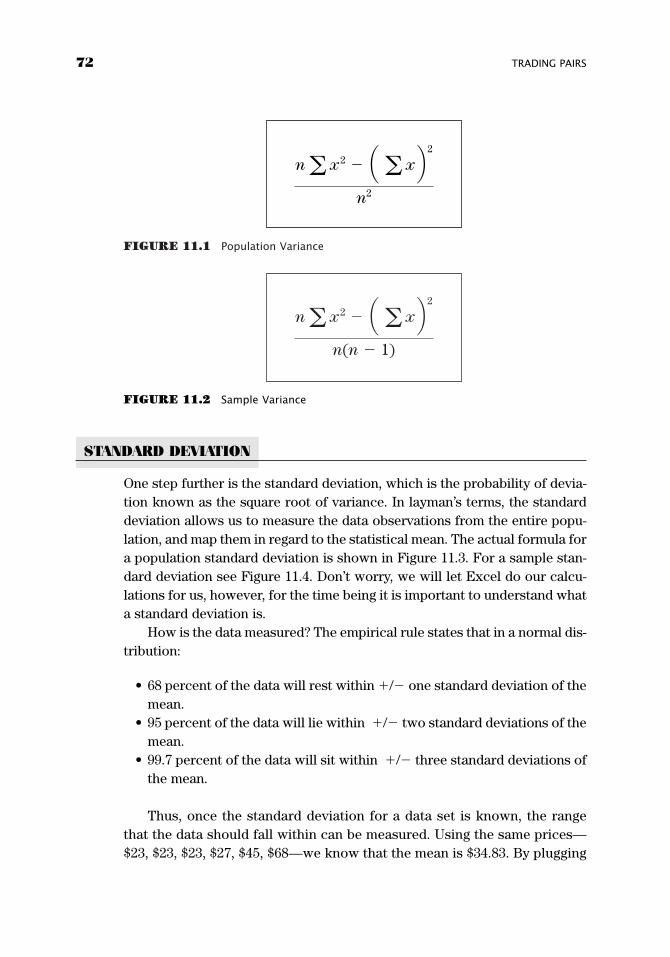
STANDARD DEVIATION
One step further is the standard deviation, which is the probability of devia-tion known as the square root of variance. In layman’s terms, the standarddeviation allows us to measure the data observations from the entire popu-lation, and map them in regard to the statistical mean. The actual formula fora population standard deviation is shown in Figure 11.3. For a sample stan-dard deviation see Figure 11.4. Don’t worry, we will let Excel do our calcu-lations for us, however, for the time being it is important to understand whata standard deviation is.
How is the data measured? The empirical rule states that in a normal dis-tribution:
• 68 percent of the data will rest within �/� one standard deviation of themean.
• 95 percent of the data will lie within �/� two standard deviations of themean.
• 99.7 percent of the data will sit within �/� three standard deviations ofthe mean.
Thus, once the standard deviation for a data set is known, the rangethat the data should fall within can be measured. Using the same prices—$23, $23, $23, $27, $45, $68—we know that the mean is $34.83. By plugging
72 TRADING PAIRS
FIGURE 11.2 Sample Variance
na x2 � a a x b 2
n(n � 1)
FIGURE 11.1 Population Variance
na x2 � a a x b 2
n2
GK015-C11[69-74].qxd 6/12/04 2:17 AM Page 72 Quark08 Quark08:Books:GK-Jobs:GK015-Whistler:Repro:
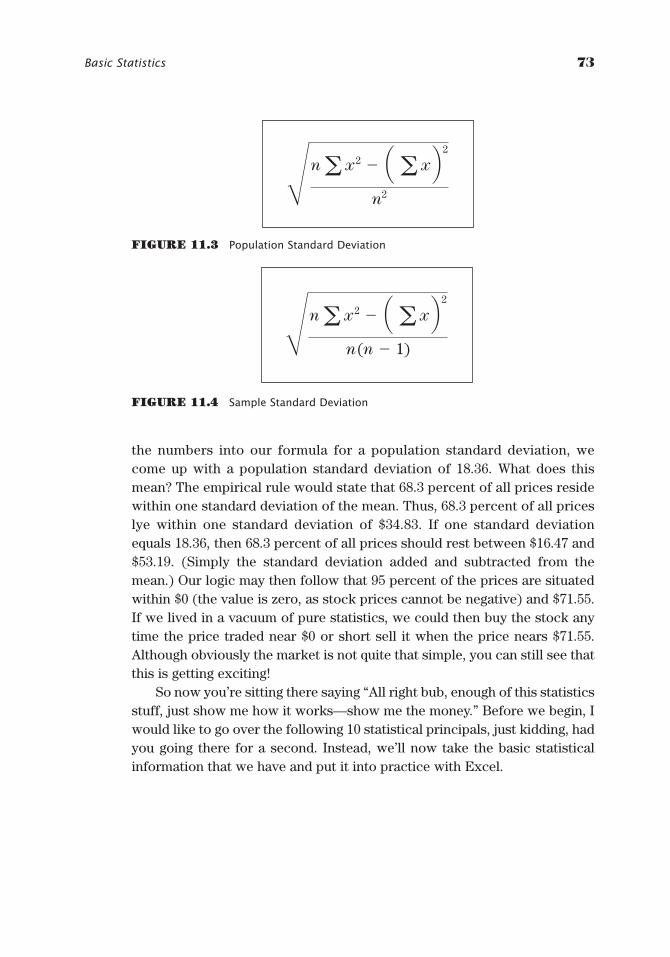
the numbers into our formula for a population standard deviation, wecome up with a population standard deviation of 18.36. What does thismean? The empirical rule would state that 68.3 percent of all prices residewithin one standard deviation of the mean. Thus, 68.3 percent of all priceslye within one standard deviation of $34.83. If one standard deviationequals 18.36, then 68.3 percent of all prices should rest between $16.47 and$53.19. (Simply the standard deviation added and subtracted from themean.) Our logic may then follow that 95 percent of the prices are situatedwithin $0 (the value is zero, as stock prices cannot be negative) and $71.55.If we lived in a vacuum of pure statistics, we could then buy the stock anytime the price traded near $0 or short sell it when the price nears $71.55.Although obviously the market is not quite that simple, you can still see thatthis is getting exciting!
So now you’re sitting there saying “All right bub, enough of this statisticsstuff, just show me how it works—show me the money.” Before we begin, Iwould like to go over the following 10 statistical principals, just kidding, hadyou going there for a second. Instead, we’ll now take the basic statisticalinformation that we have and put it into practice with Excel.
Basic Statistics 73
FIGURE 11.3 Population Standard Deviation
FIGURE 11.4 Sample Standard Deviation
Rna x2 � a a x b 2
n2
Rna x2 � a a x b 2
n(n � 1)
GK015-C11[69-74].qxd 6/12/04 2:17 AM Page 73 Quark08 Quark08:Books:GK-Jobs:GK015-Whistler:Repro:

GK015-C11[69-74].qxd 6/12/04 2:17 AM Page 74 Quark08 Quark08:Books:GK-Jobs:GK015-Whistler:Repro:
75
CHAPTER 12
Excel andStatistics
Setting Up the Spreadsheet
Average, Median, Mode, and
Standard Deviation
Understanding the Present Data
How Do You Know Which Stock
to Buy or Short?
Charting the Data
SETTING UP THE SPREADSHEET
All right, back to our trusty spreadsheet! At this point we should alreadyhave data imported into our spreadsheet, so now we just need to beginapplying our basic statistical functions to commence analyzing our pair.
Step 1. Bring up your spreadsheet and label cell A8 Mean, A9 Median, andA10 Mode. Then label B6 Differential, C6 Ratio, D6 Closing, and D7Spread.
Step 2. Label cell A12 Average Deviation, A13 Standard Deviation, and A14Population Standard Deviation.
Step 3. Right click on the Stock 1 spreadsheet tab and then insert a newworksheet. Label the worksheet Pair Data.
Step 4. In the Pair Data worksheet, label cell A1 Pair Data, then label thefollowing cells: A4 Date, B4 Differential, C4 Ratio, and D4 CloseSpread. (You may have to widen the cells, via drag and drop, to fit thetext.)
Step 5. Next, click in cell A5 and hit the � key. Then, click on the Stock 1worksheet tab, click once in cell A2, and hit Enter. What we have done isasked the Pair Data sheet cell A5 to always correspond the first date in
GK015-C12[75-86].qxd 6/12/04 2:17 AM Page 75 Quark08 Quark08:Books:GK-Jobs:GK015-Whistler:Repro:
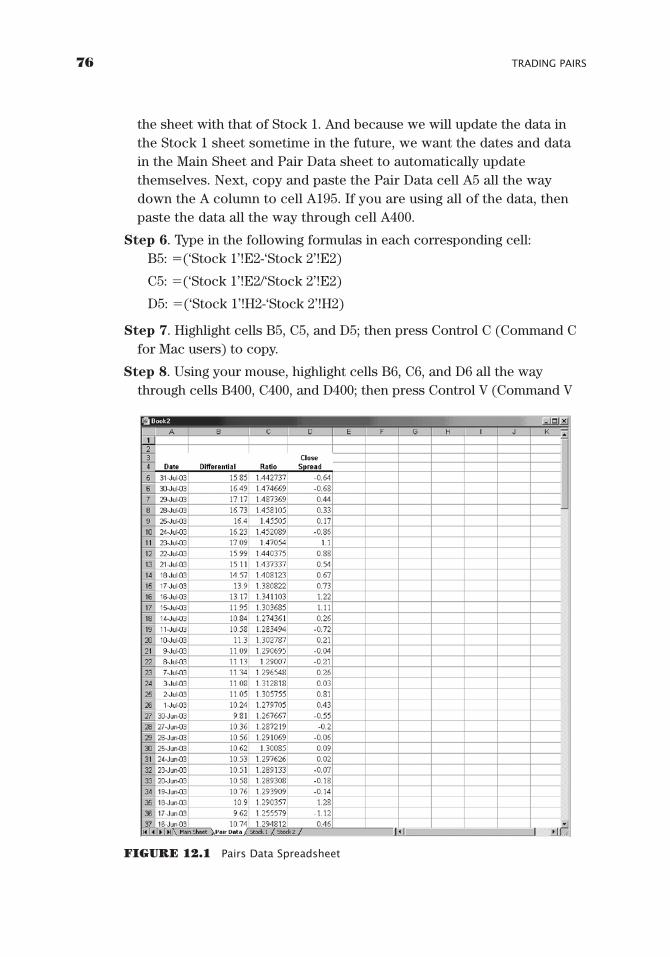
the sheet with that of Stock 1. And because we will update the data inthe Stock 1 sheet sometime in the future, we want the dates and datain the Main Sheet and Pair Data sheet to automatically updatethemselves. Next, copy and paste the Pair Data cell A5 all the waydown the A column to cell A195. If you are using all of the data, thenpaste the data all the way through cell A400.
Step 6. Type in the following formulas in each corresponding cell:B5: �(‘Stock 1’!E2-‘Stock 2’!E2)
C5: �(‘Stock 1’!E2/‘Stock 2’!E2)
D5: �(‘Stock 1’!H2-‘Stock 2’!H2)
Step 7. Highlight cells B5, C5, and D5; then press Control C (Command Cfor Mac users) to copy.
Step 8. Using your mouse, highlight cells B6, C6, and D6 all the waythrough cells B400, C400, and D400; then press Control V (Command V
76 TRADING PAIRS
FIGURE 12.1 Pairs Data Spreadsheet
GK015-C12[75-86].qxd 6/12/04 2:17 AM Page 76 Quark08 Quark08:Books:GK-Jobs:GK015-Whistler:Repro:
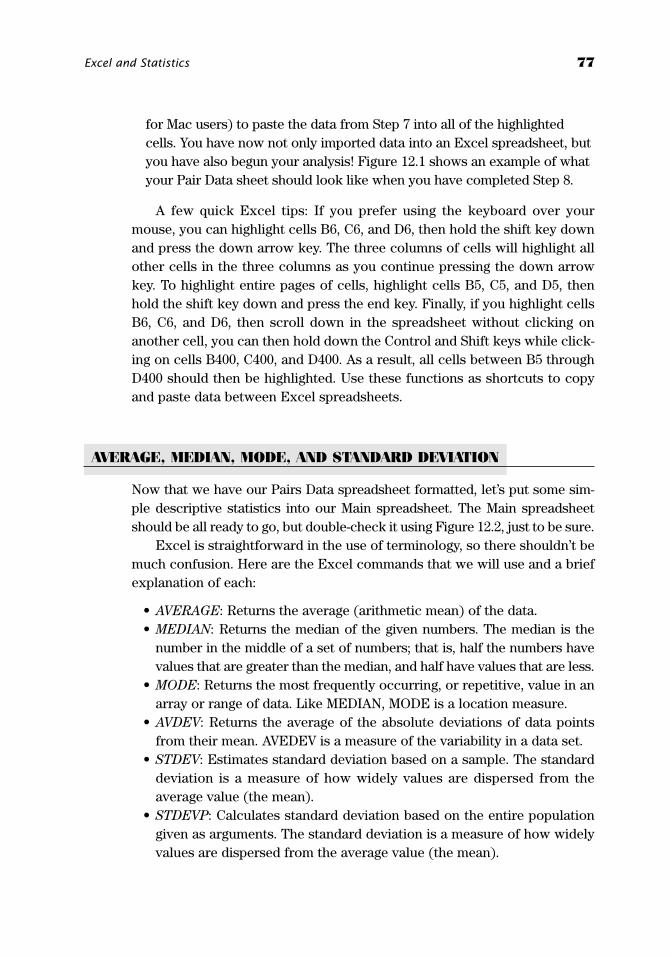
Excel and Statistics 77
for Mac users) to paste the data from Step 7 into all of the highlightedcells. You have now not only imported data into an Excel spreadsheet, butyou have also begun your analysis! Figure 12.1 shows an example of whatyour Pair Data sheet should look like when you have completed Step 8.
A few quick Excel tips: If you prefer using the keyboard over yourmouse, you can highlight cells B6, C6, and D6, then hold the shift key downand press the down arrow key. The three columns of cells will highlight allother cells in the three columns as you continue pressing the down arrowkey. To highlight entire pages of cells, highlight cells B5, C5, and D5, thenhold the shift key down and press the end key. Finally, if you highlight cellsB6, C6, and D6, then scroll down in the spreadsheet without clicking onanother cell, you can then hold down the Control and Shift keys while click-ing on cells B400, C400, and D400. As a result, all cells between B5 throughD400 should then be highlighted. Use these functions as shortcuts to copyand paste data between Excel spreadsheets.
AVERAGE, MEDIAN, MODE, AND STANDARD DEVIATION
Now that we have our Pairs Data spreadsheet formatted, let’s put some sim-ple descriptive statistics into our Main spreadsheet. The Main spreadsheetshould be all ready to go, but double-check it using Figure 12.2, just to be sure.
Excel is straightforward in the use of terminology, so there shouldn’t bemuch confusion. Here are the Excel commands that we will use and a briefexplanation of each:
• AVERAGE: Returns the average (arithmetic mean) of the data.• MEDIAN: Returns the median of the given numbers. The median is the
number in the middle of a set of numbers; that is, half the numbers havevalues that are greater than the median, and half have values that are less.
• MODE: Returns the most frequently occurring, or repetitive, value in anarray or range of data. Like MEDIAN, MODE is a location measure.
• AVDEV: Returns the average of the absolute deviations of data pointsfrom their mean. AVEDEV is a measure of the variability in a data set.
• STDEV: Estimates standard deviation based on a sample. The standarddeviation is a measure of how widely values are dispersed from theaverage value (the mean).
• STDEVP: Calculates standard deviation based on the entire populationgiven as arguments. The standard deviation is a measure of how widelyvalues are dispersed from the average value (the mean).
GK015-C12[75-86].qxd 6/12/04 2:17 AM Page 77 Quark08 Quark08:Books:GK-Jobs:GK015-Whistler:Repro:
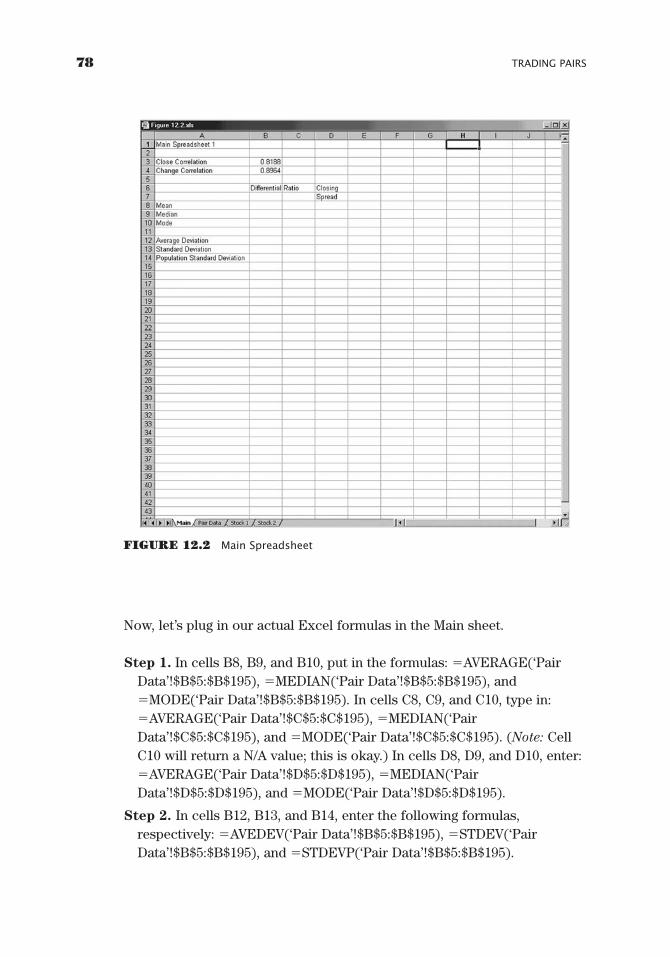
78 TRADING PAIRS
Now, let’s plug in our actual Excel formulas in the Main sheet.
Step 1. In cells B8, B9, and B10, put in the formulas: �AVERAGE(‘PairData’!$B$5:$B$195), �MEDIAN(‘Pair Data’!$B$5:$B$195), and�MODE(‘Pair Data’!$B$5:$B$195). In cells C8, C9, and C10, type in:�AVERAGE(‘Pair Data’!$C$5:$C$195), �MEDIAN(‘PairData’!$C$5:$C$195), and �MODE(‘Pair Data’!$C$5:$C$195). (Note: CellC10 will return a N/A value; this is okay.) In cells D8, D9, and D10, enter:�AVERAGE(‘Pair Data’!$D$5:$D$195), �MEDIAN(‘PairData’!$D$5:$D$195), and �MODE(‘Pair Data’!$D$5:$D$195).
Step 2. In cells B12, B13, and B14, enter the following formulas,respectively: �AVEDEV(‘Pair Data’!$B$5:$B$195), �STDEV(‘PairData’!$B$5:$B$195), and �STDEVP(‘Pair Data’!$B$5:$B$195).
FIGURE 12.2 Main Spreadsheet
GK015-C12[75-86].qxd 6/12/04 2:17 AM Page 78 Quark08 Quark08:Books:GK-Jobs:GK015-Whistler:Repro:
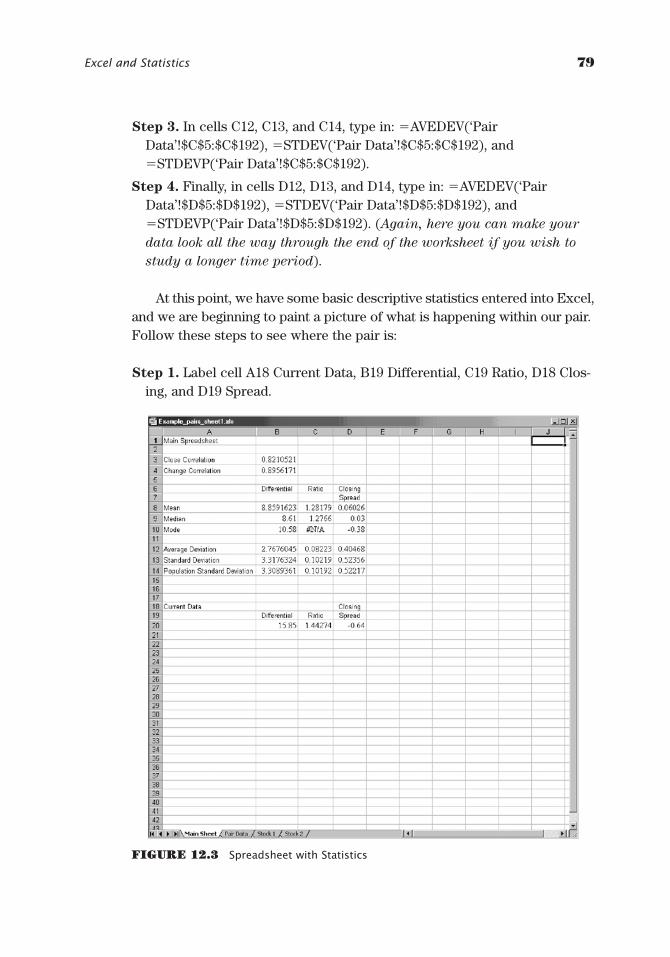
Step 3. In cells C12, C13, and C14, type in: �AVEDEV(‘PairData’!$C$5:$C$192), �STDEV(‘Pair Data’!$C$5:$C$192), and�STDEVP(‘Pair Data’!$C$5:$C$192).
Step 4. Finally, in cells D12, D13, and D14, type in: �AVEDEV(‘PairData’!$D$5:$D$192), �STDEV(‘Pair Data’!$D$5:$D$192), and�STDEVP(‘Pair Data’!$D$5:$D$192). (Again, here you can make your
data look all the way through the end of the worksheet if you wish to
study a longer time period).
At this point, we have some basic descriptive statistics entered into Excel,and we are beginning to paint a picture of what is happening within our pair.Follow these steps to see where the pair is:
Step 1. Label cell A18 Current Data, B19 Differential, C19 Ratio, D18 Clos-ing, and D19 Spread.
Excel and Statistics 79
FIGURE 12.3 Spreadsheet with Statistics
GK015-C12[75-86].qxd 6/12/04 2:17 AM Page 79 Quark08 Quark08:Books:GK-Jobs:GK015-Whistler:Repro:
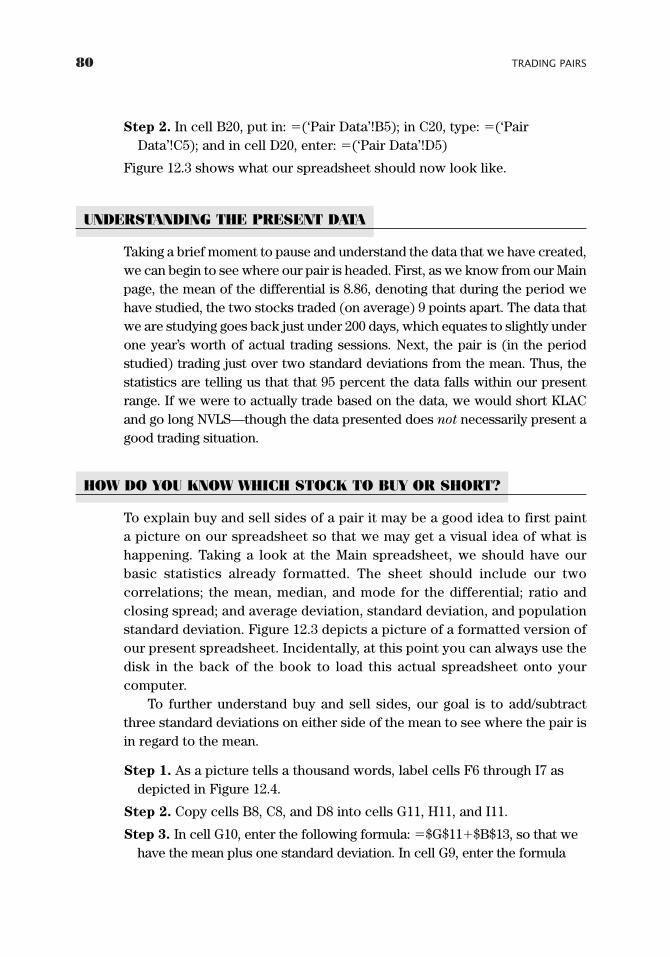
80 TRADING PAIRS
Step 2. In cell B20, put in: �(‘Pair Data’!B5); in C20, type: �(‘PairData’!C5); and in cell D20, enter: �(‘Pair Data’!D5)
Figure 12.3 shows what our spreadsheet should now look like.
UNDERSTANDING THE PRESENT DATA
Taking a brief moment to pause and understand the data that we have created,we can begin to see where our pair is headed. First, as we know from our Mainpage, the mean of the differential is 8.86, denoting that during the period wehave studied, the two stocks traded (on average) 9 points apart. The data thatwe are studying goes back just under 200 days, which equates to slightly underone year’s worth of actual trading sessions. Next, the pair is (in the periodstudied) trading just over two standard deviations from the mean. Thus, thestatistics are telling us that that 95 percent the data falls within our presentrange. If we were to actually trade based on the data, we would short KLACand go long NVLS—though the data presented does not necessarily present agood trading situation.
HOW DO YOU KNOW WHICH STOCK TO BUY OR SHORT?
To explain buy and sell sides of a pair it may be a good idea to first painta picture on our spreadsheet so that we may get a visual idea of what ishappening. Taking a look at the Main spreadsheet, we should have ourbasic statistics already formatted. The sheet should include our twocorrelations; the mean, median, and mode for the differential; ratio andclosing spread; and average deviation, standard deviation, and populationstandard deviation. Figure 12.3 depicts a picture of a formatted version ofour present spreadsheet. Incidentally, at this point you can always use thedisk in the back of the book to load this actual spreadsheet onto yourcomputer.
To further understand buy and sell sides, our goal is to add/subtractthree standard deviations on either side of the mean to see where the pair isin regard to the mean.
Step 1. As a picture tells a thousand words, label cells F6 through I7 asdepicted in Figure 12.4.
Step 2. Copy cells B8, C8, and D8 into cells G11, H11, and I11.
Step 3. In cell G10, enter the following formula: �$G$11�$B$13, so that wehave the mean plus one standard deviation. In cell G9, enter the formula
GK015-C12[75-86].qxd 6/12/04 2:17 AM Page 80 Quark08 Quark08:Books:GK-Jobs:GK015-Whistler:Repro:
Excel and Statistics 81
FIGURE 12.4 Spreadsheet Main Page
�$G$11�(2*$B$13). This gives us two standard deviations from the mean.In cell G8, do the same, except multiply cell B13 times three instead of two.
Step 4. Repeat steps 1 through 3 for all of the rest of the cells in this box,while remembering to subtract the standard deviation from the lowerhalf of the cells. As a result, your standard deviations box should looksimilar to Figure 12.5. Keep in mind that columns G, H, and I are using thevalues from row 13 of B, C, and D. I know this is confusing, so you canalways reference the spreadsheet in the CD-ROM. However, if you canstruggle through this and build the sheet, you will only empower yourselflater on.
It is important to always keep track of which stock came first in yourdata analysis. This is because when we refer to buying and selling a spread,we are assuming that there is a set structure for each of the equitiesinvolved. And indeed there is! Because KLAC comes first in our worksheets
GK015-C12[75-86].qxd 6/12/04 2:17 AM Page 81 Quark08 Quark08:Books:GK-Jobs:GK015-Whistler:Repro:
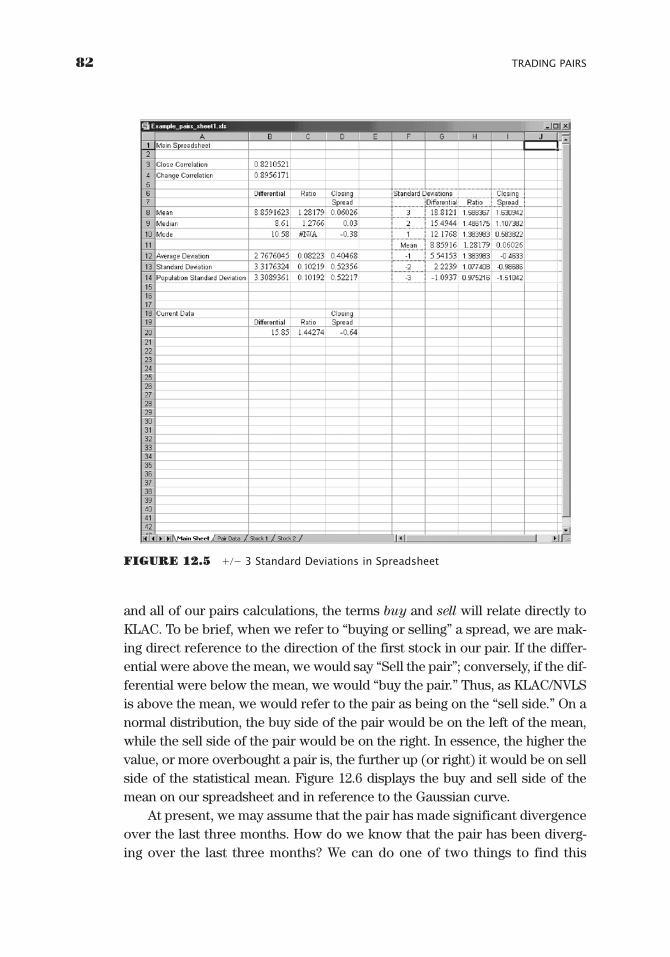
82 TRADING PAIRS
FIGURE 12.5 ��� 3 Standard Deviations in Spreadsheet
and all of our pairs calculations, the terms buy and sell will relate directly toKLAC. To be brief, when we refer to “buying or selling” a spread, we are mak-ing direct reference to the direction of the first stock in our pair. If the differ-ential were above the mean, we would say “Sell the pair”; conversely, if the dif-ferential were below the mean, we would “buy the pair.” Thus, as KLAC/NVLSis above the mean, we would refer to the pair as being on the “sell side.” On anormal distribution, the buy side of the pair would be on the left of the mean,while the sell side of the pair would be on the right. In essence, the higher thevalue, or more overbought a pair is, the further up (or right) it would be on sellside of the statistical mean. Figure 12.6 displays the buy and sell side of themean on our spreadsheet and in reference to the Gaussian curve.
At present, we may assume that the pair has made significant divergenceover the last three months. How do we know that the pair has been diverg-ing over the last three months? We can do one of two things to find this
GK015-C12[75-86].qxd 6/12/04 2:17 AM Page 82 Quark08 Quark08:Books:GK-Jobs:GK015-Whistler:Repro:
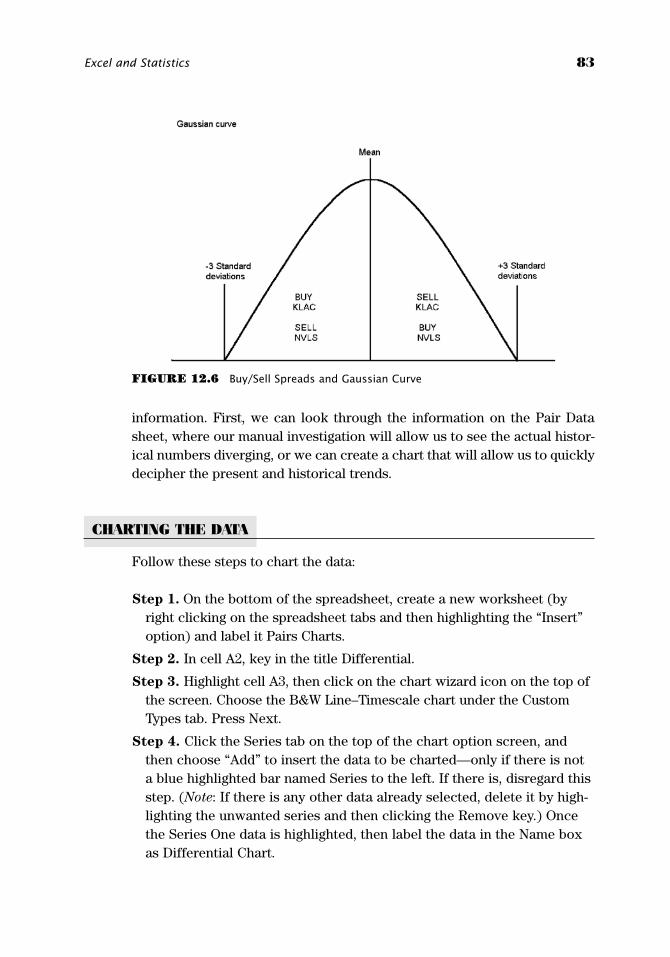
Excel and Statistics 83
FIGURE 12.6 Buy/Sell Spreads and Gaussian Curve
information. First, we can look through the information on the Pair Datasheet, where our manual investigation will allow us to see the actual histor-ical numbers diverging, or we can create a chart that will allow us to quicklydecipher the present and historical trends.
CHARTING THE DATA
Follow these steps to chart the data:
Step 1. On the bottom of the spreadsheet, create a new worksheet (byright clicking on the spreadsheet tabs and then highlighting the “Insert”option) and label it Pairs Charts.
Step 2. In cell A2, key in the title Differential.
Step 3. Highlight cell A3, then click on the chart wizard icon on the top ofthe screen. Choose the B&W Line–Timescale chart under the CustomTypes tab. Press Next.
Step 4. Click the Series tab on the top of the chart option screen, andthen choose “Add” to insert the data to be charted—only if there is nota blue highlighted bar named Series to the left. If there is, disregard thisstep. (Note: If there is any other data already selected, delete it by high-lighting the unwanted series and then clicking the Remove key.) Oncethe Series One data is highlighted, then label the data in the Name boxas Differential Chart.
GK015-C12[75-86].qxd 6/12/04 2:17 AM Page 83 Quark08 Quark08:Books:GK-Jobs:GK015-Whistler:Repro:
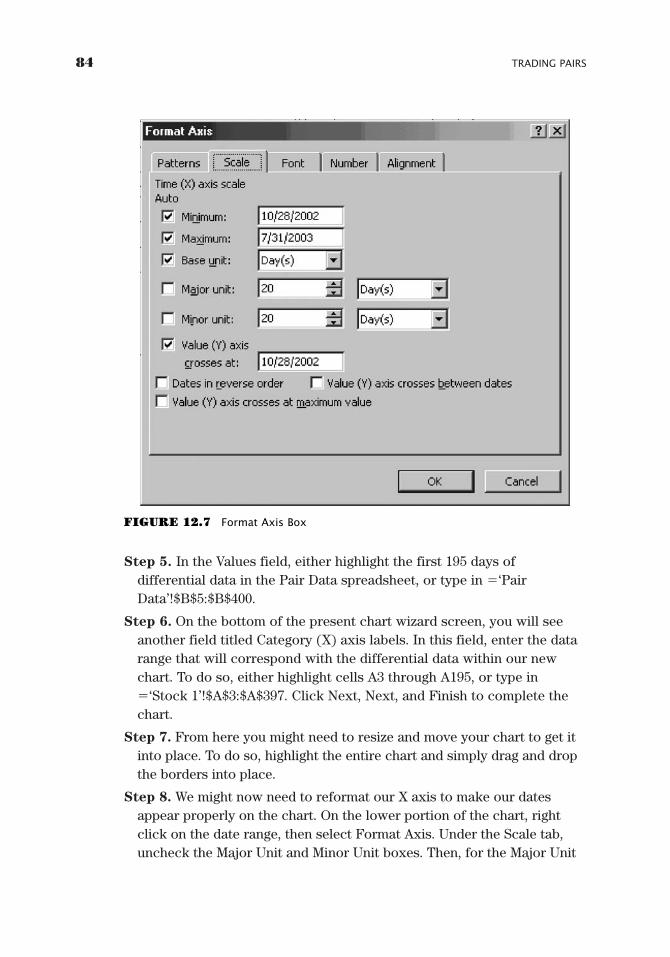
84 TRADING PAIRS
Step 5. In the Values field, either highlight the first 195 days ofdifferential data in the Pair Data spreadsheet, or type in �‘PairData’!$B$5:$B$400.
Step 6. On the bottom of the present chart wizard screen, you will seeanother field titled Category (X) axis labels. In this field, enter the datarange that will correspond with the differential data within our newchart. To do so, either highlight cells A3 through A195, or type in�‘Stock 1’!$A$3:$A$397. Click Next, Next, and Finish to complete thechart.
Step 7. From here you might need to resize and move your chart to get itinto place. To do so, highlight the entire chart and simply drag and dropthe borders into place.
Step 8. We might now need to reformat our X axis to make our datesappear properly on the chart. On the lower portion of the chart, rightclick on the date range, then select Format Axis. Under the Scale tab,uncheck the Major Unit and Minor Unit boxes. Then, for the Major Unit
FIGURE 12.7 Format Axis Box
GK015-C12[75-86].qxd 6/12/04 2:17 AM Page 84 Quark08 Quark08:Books:GK-Jobs:GK015-Whistler:Repro:
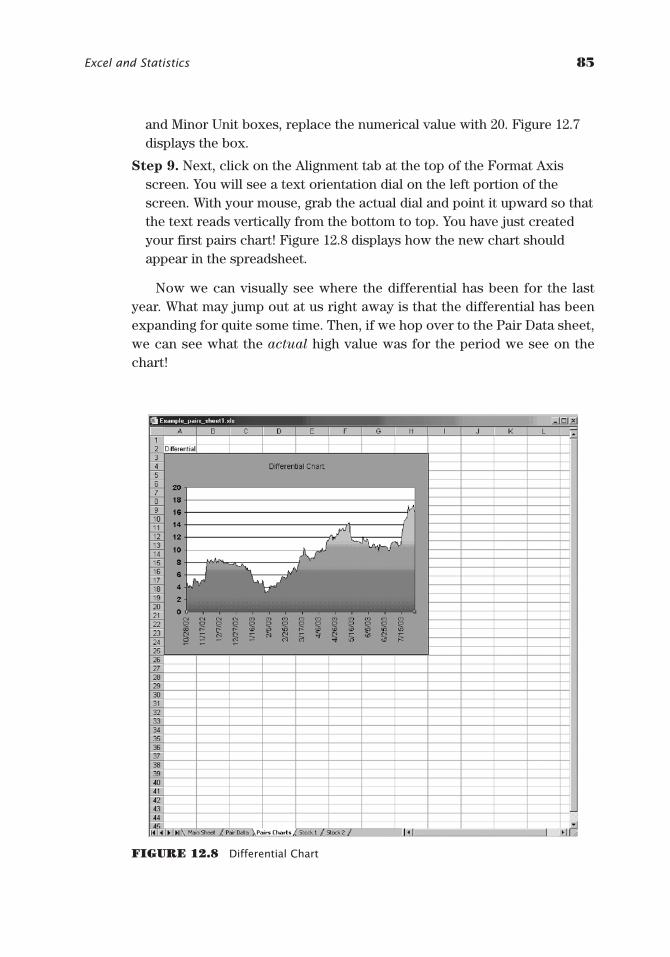
Excel and Statistics 85
and Minor Unit boxes, replace the numerical value with 20. Figure 12.7displays the box.
Step 9. Next, click on the Alignment tab at the top of the Format Axisscreen. You will see a text orientation dial on the left portion of thescreen. With your mouse, grab the actual dial and point it upward so thatthe text reads vertically from the bottom to top. You have just createdyour first pairs chart! Figure 12.8 displays how the new chart shouldappear in the spreadsheet.
Now we can visually see where the differential has been for the lastyear. What may jump out at us right away is that the differential has beenexpanding for quite some time. Then, if we hop over to the Pair Data sheet,we can see what the actual high value was for the period we see on thechart!
FIGURE 12.8 Differential Chart
GK015-C12[75-86].qxd 6/12/04 2:17 AM Page 85 Quark08 Quark08:Books:GK-Jobs:GK015-Whistler:Repro:

The highest value for the differential was (for the period studied) onFebruary 6th, 2002 (cell 377), when the two stocks were trading 18.04 pointsapart. Further scanning the data chronologically backwards, we can see thatthe spread hit a low of 3.19 on January 31, 2003. Thus, if history and statis-tics are any indication of what could happen in the future, we may deducethat the differential of 15.85 on July 31 may be nearing an actual tradingpoint. One quick word of caution: Even though our initial data is pointingtoward a nearing sell signal, we still have more work to do!
86 TRADING PAIRS
GK015-C12[75-86].qxd 6/12/04 2:17 AM Page 86 Quark08 Quark08:Books:GK-Jobs:GK015-Whistler:Repro:

87
Before getting too far into analyzing the present data, I will take amoment and make sure that we have a full understanding of how weare gauging our pairs. We are presently using the two simplest meth-
ods: differential and ratio. Each has its own merit for the pairs analyst,though the bulk of the pairs community seems to prefer a ratio over the dif-ferential. In this book, we are mainly using the differential for the sake ofsimplicity, though as you begin to move further forward in pairs research, itmay be a good idea to switch over to using a ratio. In the next few chapters,we quickly go over both in hope of grasping a deeper understanding of eachmethod.
DIFFERENTIAL
First and foremost, it may be a good idea to simply use the differential astrend confirmation of the ratio. While the differential is useful in gaugingwhere two stock prices are closing, it also lacks the ability to encompass val-uation calculations like the ratio. Usually, when I am looking at a differen-tial, I am only scanning a historical pairs chart to see just where the twostocks have traded in recent history. Generally, I can usually get a good ideawhere the visual mean is just by taking a moment to look over the chart. I donot want to discourage you entirely from using the differential as a way ofreading your pairs data; however, there might be added benefits when usinga ratio. For the purposes of this book, we will mainly concentrate on the dif-ferential, but will use the ratio as confirmation of our feelings.
CHAPTER 13
Differentialversus Ratio
Differential
Ratio
GK015-C13[87-88].qxd 6/10/04 7:34 PM Page 87 Virender Negi Quark07:BOOKS:GK015-Whistler:Quark files:
88 TRADING PAIRS
RATIO
When using a ratio, we may obtain a better comprehension of the actual val-uation of each stock. How is this so? If we use exterior data like earnings,beta, float, and dividends paid in our ratio calculation, the resulting numberbecomes more than simple division. For example, if one stock is trading at$100 and another at $50, the ratio is 2.0. This information indicates that foreach single share of the $100 stock that we buy, we may want to purchasetwo shares of the lesser-valued security. On paper, the simple ratio appearsto be a good idea, but unfortunately, we still leave out further valuation.
To get a better idea of how we could weight our pair, we can add infundamental concepts to tweak our position valuation. For example, whenadding volatility into our equation, we can divide each price by beta and thendivide the results from one another. As an example, on any random date,suppose stock A is trading at $45, while stock B is trading at $60. Calculat-ing a simple ratio (dividing Stock A by Stock B), we come up with 0.75. Whatthis is telling us is that for every one share of the less expensive stock, wewould purchase .75 shares of the more costly security. However, to measureStandard & Poor’s (S&P) 500 volatility, we can add in the beta numbers tofind an entirely new ratio. Assume that the beta for Stock A is 1.43, while thebeta for Stock B is 1.62. Our new equation would be [(45/1.43) / (60/1.60)],which equals 0.83. Remember that we are always using the denominator asthe subject stock. Thus, incorporating volatility, we would actually purchaseslightly more of Stock B than with the simple ratio division model.
GK015-C13[87-88].qxd 6/10/04 7:34 PM Page 88 Virender Negi Quark07:BOOKS:GK015-Whistler:Quark files:
89
Next, we will work on further breaking down our data, where wewill attempt to zero the mean. This is the most important part ofthe book and will be the ultimate “trigger” for where we enter
and exit our trades. Our goal is to try and pinpoint entry and exit pointsfor our pair, while taking little pain and having tight stop loss points. Thetool that we will use is called a density curve, the formula is shown inFigure 14.1.
DENSITY CURVE
By definition, a density curve is “the graph of a nonnegative functioncalled a density function. The area between the graph of the function andthe x axis is 1.” Generally, normal density curves have many differentfunctions, including characterizing probabilities; however, we will use itin a different fashion. A density curve looks similar to a bell curve, withthe data evenly distributed around the mean. However, our curve willactually show up as more of a moving histogram, depicting where our cur-rent and historical differential or ratio are in regard to the mean. The den-sity curve itself will yield a value between zero and positive one. Our buysignals will typically (though this changes from pair to pair) be triggeredwhen the pair is within 0.003 thousandths of zero. Conversely, the densitycurve will indicate a potential selling point when our data nears 0.997thousands of positive one. Let’s set up the normal density curve in ourspreadsheet.
CHAPTER 14
ApplyingStatisticsto PairsDensity Curve
Understanding the Data
GK015-C14[89-94].qxd 6/10/04 7:35 PM Page 89 Virender Negi Quark07:BOOKS:GK015-Whistler:Quark files:
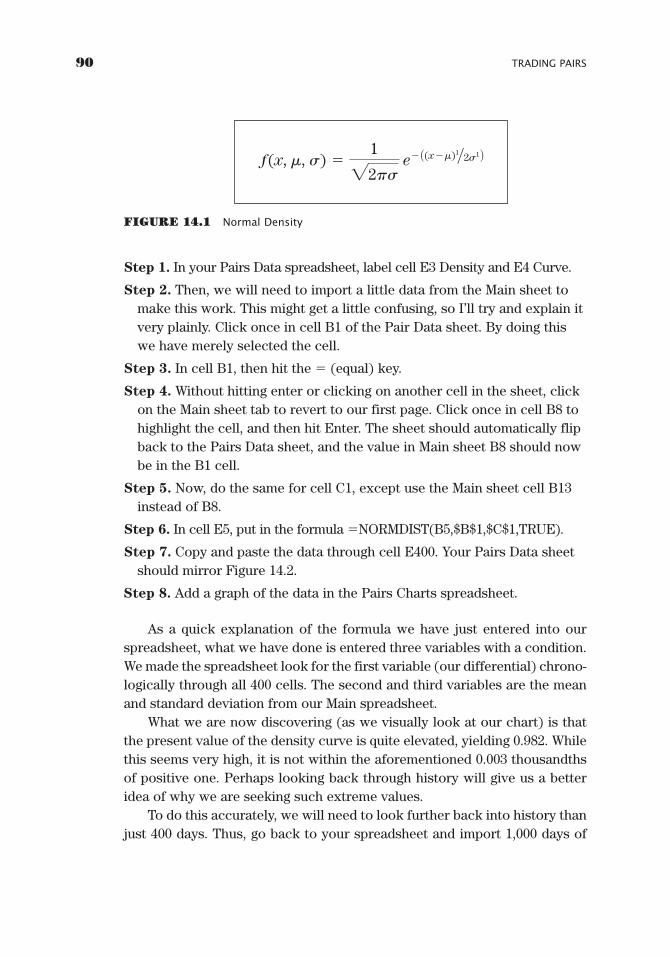
90 TRADING PAIRS
Step 1. In your Pairs Data spreadsheet, label cell E3 Density and E4 Curve.
Step 2. Then, we will need to import a little data from the Main sheet tomake this work. This might get a little confusing, so I’ll try and explain itvery plainly. Click once in cell B1 of the Pair Data sheet. By doing thiswe have merely selected the cell.
Step 3. In cell B1, then hit the � (equal) key.
Step 4. Without hitting enter or clicking on another cell in the sheet, clickon the Main sheet tab to revert to our first page. Click once in cell B8 tohighlight the cell, and then hit Enter. The sheet should automatically flipback to the Pairs Data sheet, and the value in Main sheet B8 should nowbe in the B1 cell.
Step 5. Now, do the same for cell C1, except use the Main sheet cell B13instead of B8.
Step 6. In cell E5, put in the formula �NORMDIST(B5,$B$1,$C$1,TRUE).
Step 7. Copy and paste the data through cell E400. Your Pairs Data sheetshould mirror Figure 14.2.
Step 8. Add a graph of the data in the Pairs Charts spreadsheet.
As a quick explanation of the formula we have just entered into ourspreadsheet, what we have done is entered three variables with a condition.We made the spreadsheet look for the first variable (our differential) chrono-logically through all 400 cells. The second and third variables are the meanand standard deviation from our Main spreadsheet.
What we are now discovering (as we visually look at our chart) is thatthe present value of the density curve is quite elevated, yielding 0.982. Whilethis seems very high, it is not within the aforementioned 0.003 thousandthsof positive one. Perhaps looking back through history will give us a betteridea of why we are seeking such extreme values.
To do this accurately, we will need to look further back into history thanjust 400 days. Thus, go back to your spreadsheet and import 1,000 days of
FIGURE 14.1 Normal Density
f(x, m, s) �122ps
e� A(x�m)1>2s1 B
GK015-C14[89-94].qxd 6/10/04 7:35 PM Page 90 Virender Negi Quark07:BOOKS:GK015-Whistler:Quark files:
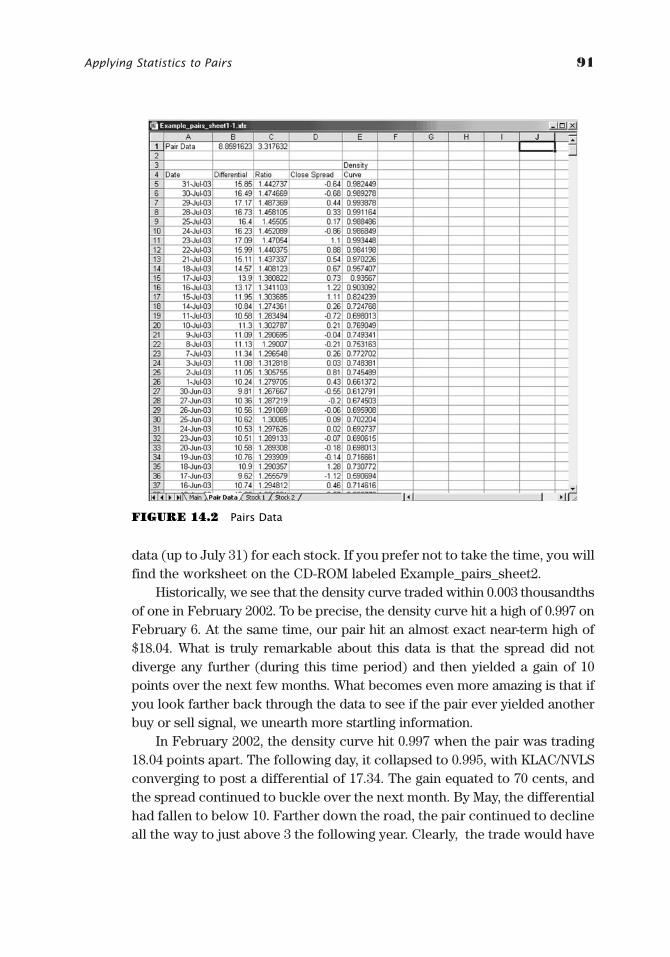
Applying Statistics to Pairs 91
data (up to July 31) for each stock. If you prefer not to take the time, you willfind the worksheet on the CD-ROM labeled Example_pairs_sheet2.
Historically, we see that the density curve traded within 0.003 thousandthsof one in February 2002. To be precise, the density curve hit a high of 0.997 onFebruary 6. At the same time, our pair hit an almost exact near-term high of$18.04. What is truly remarkable about this data is that the spread did notdiverge any further (during this time period) and then yielded a gain of 10points over the next few months. What becomes even more amazing is that ifyou look farther back through the data to see if the pair ever yielded anotherbuy or sell signal, we unearth more startling information.
In February 2002, the density curve hit 0.997 when the pair was trading18.04 points apart. The following day, it collapsed to 0.995, with KLAC/NVLSconverging to post a differential of 17.34. The gain equated to 70 cents, andthe spread continued to buckle over the next month. By May, the differentialhad fallen to below 10. Farther down the road, the pair continued to declineall the way to just above 3 the following year. Clearly, the trade would have
FIGURE 14.2 Pairs Data
GK015-C14[89-94].qxd 6/10/04 7:35 PM Page 91 Virender Negi Quark07:BOOKS:GK015-Whistler:Quark files:
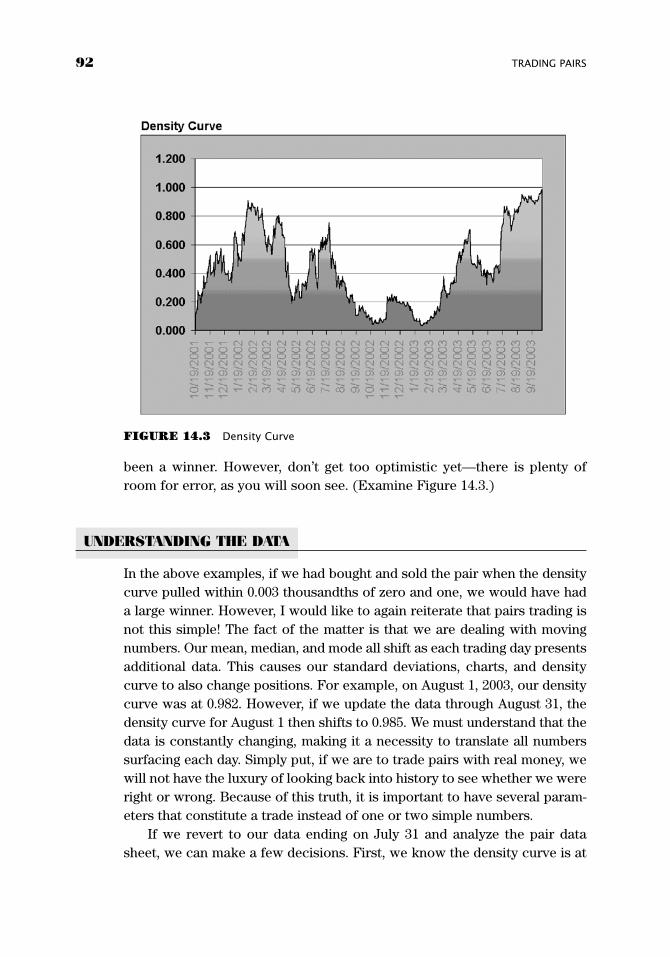
92 TRADING PAIRS
been a winner. However, don’t get too optimistic yet—there is plenty ofroom for error, as you will soon see. (Examine Figure 14.3.)
UNDERSTANDING THE DATA
In the above examples, if we had bought and sold the pair when the densitycurve pulled within 0.003 thousandths of zero and one, we would have hada large winner. However, I would like to again reiterate that pairs trading isnot this simple! The fact of the matter is that we are dealing with movingnumbers. Our mean, median, and mode all shift as each trading day presentsadditional data. This causes our standard deviations, charts, and densitycurve to also change positions. For example, on August 1, 2003, our densitycurve was at 0.982. However, if we update the data through August 31, thedensity curve for August 1 then shifts to 0.985. We must understand that thedata is constantly changing, making it a necessity to translate all numberssurfacing each day. Simply put, if we are to trade pairs with real money, wewill not have the luxury of looking back into history to see whether we wereright or wrong. Because of this truth, it is important to have several param-eters that constitute a trade instead of one or two simple numbers.
If we revert to our data ending on July 31 and analyze the pair datasheet, we can make a few decisions. First, we know the density curve is at
FIGURE 14.3 Density Curve
GK015-C14[89-94].qxd 6/10/04 7:35 PM Page 92 Virender Negi Quark07:BOOKS:GK015-Whistler:Quark files:
Applying Statistics to Pairs 93
0.982, not quite within the 0.003 thousandths of one that we would like toinstitute a trade. However, at the same time, the differential is trading at15.85, coming off a near-term high of 17.17 on July 29. For all practical pur-poses, our gut instinct may be telling us that the pair has expanded. In fact,if we look at the differential chart, it appears as if KLAC/NVLS may defi-nitely be at a potential sell signal. We infer this visually, with the differentialchart indicating that the pair is at an extreme point of expansion. What’smore, the ratio chart appears overbought, and is also displaying a possiblesell signal as well.
The pair is currently at 15.85, trading over two standard deviations fromthe mean at 8.86. If the empirical rule has any merit, then we are presentlytrading with 95 percent of the total data. While the data seems exciting atfirst glance, we must ask ourselves about that other 5 percent—or at leastthe other 4.7 percent that could pull the spread apart over three more pointsbefore we hit the third standard deviation at 18.81! The point of the entirelast paragraph is that regardless of how close our density curve is getting tozero or one, we may want to double-check our other descriptive statistics foradditional confirmation before we take a position.
GK015-C14[89-94].qxd 6/10/04 7:35 PM Page 93 Virender Negi Quark07:BOOKS:GK015-Whistler:Quark files:

GK015-C14[89-94].qxd 6/10/04 7:35 PM Page 94 Virender Negi Quark07:BOOKS:GK015-Whistler:Quark files:
95
CHAPTER 15
Taking a StepBack for aMoment
We have built our spreadsheet up to where we have a useful tool inanalyzing our pair. What’s more, we also have some fundamentaland technical information to also compare each individual stock
with, just to double-check the statistics that have been presented. So nowwe ask, what constitutes a decent convergence pair’s setup?
We would like to see our pair trade very close to (if not at) three standarddeviations, while our charts confirm extreme expansion at the same moment.I usually only take a position if the differential is within 10 percent of the thirdstandard deviation. Second, ideally the density curve will be within 0.003 thou-sandths of positive one, thus inferring that we are very close to maximumspread expansion. You must change the density curve entry signals for the typeof pairs you are trading. What I mean here is that if you are trading KLAC-NVLS,I would actually recommend waiting until the density curve is pegged out at 0or 1. The reason is that the entire sector and two stocks are much more volatilethan other, slower-moving equities like energy stocks. When trading slower oilstocks, I will use the 0.003 rule, but only after I have scanned the historicaldata to see if entries of 0.003 thousandths of zero or one proved to be prof-itable. The pairs information contained in this book leaves much to the deci-sion of the individual trader, and there is no single hard number that worksin every case. This is very important to remember: If you simply build aspreadsheet and wait for a 0.003 or 0.997 entry without doing technical, fun-damental, and commonsense analysis, you will lose.
I would like to take a step back and briefly discuss a losing situation withour present data. If we take another look at our Pair Data spreadsheet, wewill find some disturbing information. Peeping farther back into history to
GK015-C15[95-96].qxd 6/10/04 7:35 PM Page 95 Virender Negi Quark07:BOOKS:GK015-Whistler:Quark files:
April 2000, we see that the density curve was trading on the upper end of thescale pegged near 1.00. Keep in mind that, at this time, the market was com-pletely wacko, and it would have been a good idea not to trade at all, but forthe sake of example, I will use this time period to completely dissuade youfrom trading pairs. On March 10, 2000, the density curve hit 1.00, a dead-ontrade trigger. On that day, the differential closed at 21.18. The following day,the density curve began to drop very fast, bobbling around and showingextremely erratic trading. Ideally, we would have taken a position on the13th, when the differential was at 17.91. The result would have been a gigan-tic losing trade, as the pair opened up another 10 points. In fact, on April 7,the differential hit a high of 38.94 before falling. I think it is safe to say thatif you did not have a money management plan in place, you could have losta ton of money. It would have been very important to double-check allevents surrounding the trade, while also taking notice of all descriptive sta-tistics. I cannot reiterate how important it is to have a solid money manage-ment plan in place with tight stop losses before a trade is ever entered! Wewill go over money and risk management later in the book, but for nowplease just keep in mind that no system is completely foolproof and, thus,we must always keep the worst-case scenario in mind. What’s even moreamazing, as the bear market began to ravage portfolios when the bubbleburst, the density curve quickly sank to 0.001 on May 4. Had we taken a posi-tion, we might have made a little money if we had scalped, but more thanlikely, we would have lost our shirts. By October, the differential had fallento under 10. This is just food for thought. Though the market and pairs havecalmed down considerably, it is very important to note the possibility of los-ing megabucks if tight stops are not in place.
96 TRADING PAIRS
GK015-C15[95-96].qxd 6/10/04 7:35 PM Page 96 Virender Negi Quark07:BOOKS:GK015-Whistler:Quark files:
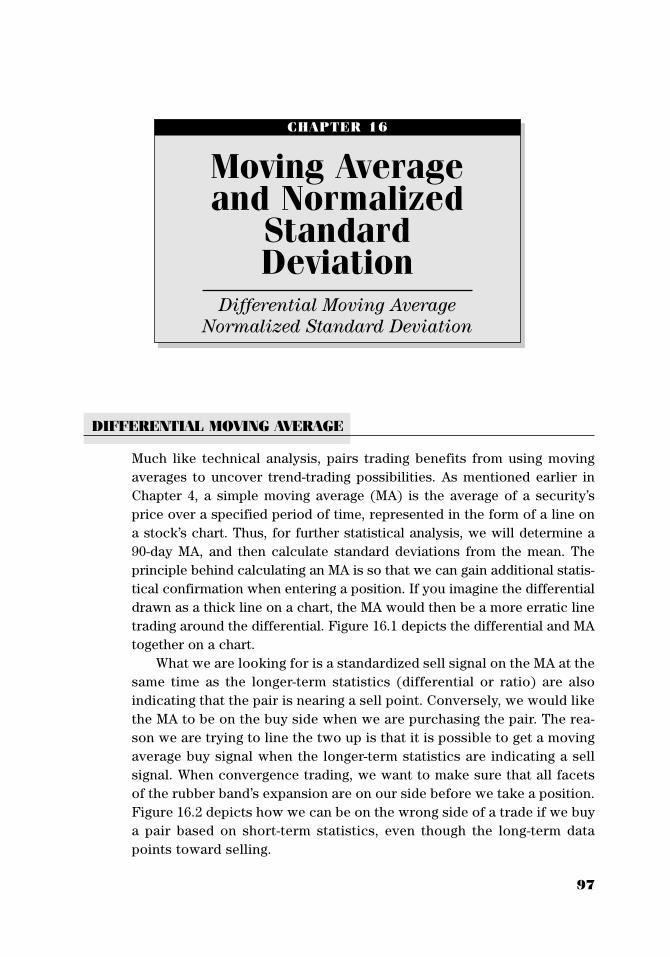
97
CHAPTER 16
Moving Averageand Normalized
StandardDeviation
Differential Moving Average
Normalized Standard Deviation
DIFFERENTIAL MOVING AVERAGE
Much like technical analysis, pairs trading benefits from using movingaverages to uncover trend-trading possibilities. As mentioned earlier inChapter 4, a simple moving average (MA) is the average of a security’sprice over a specified period of time, represented in the form of a line ona stock’s chart. Thus, for further statistical analysis, we will determine a90-day MA, and then calculate standard deviations from the mean. Theprinciple behind calculating an MA is so that we can gain additional statis-tical confirmation when entering a position. If you imagine the differentialdrawn as a thick line on a chart, the MA would then be a more erratic linetrading around the differential. Figure 16.1 depicts the differential and MAtogether on a chart.
What we are looking for is a standardized sell signal on the MA at thesame time as the longer-term statistics (differential or ratio) are alsoindicating that the pair is nearing a sell point. Conversely, we would likethe MA to be on the buy side when we are purchasing the pair. The rea-son we are trying to line the two up is that it is possible to get a movingaverage buy signal when the longer-term statistics are indicating a sellsignal. When convergence trading, we want to make sure that all facetsof the rubber band’s expansion are on our side before we take a position.Figure 16.2 depicts how we can be on the wrong side of a trade if we buya pair based on short-term statistics, even though the long-term datapoints toward selling.
GK015-C16[97-100].qxd 6/10/04 7:35 PM Page 97 Virender Negi Quark07:BOOKS:GK015-Whistler:Quark files:
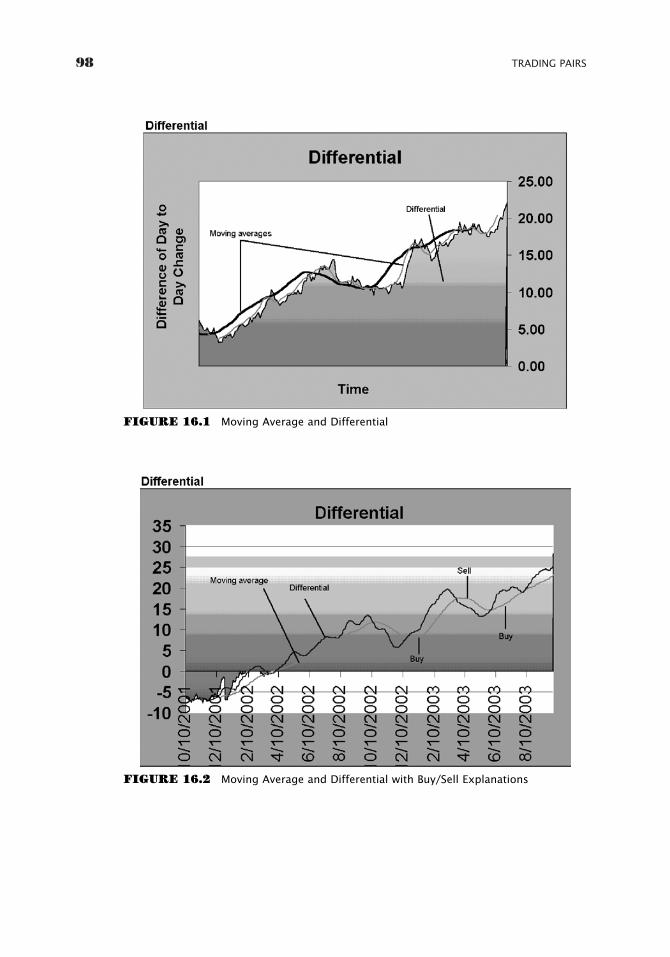
98 TRADING PAIRS
FIGURE 16.1 Moving Average and Differential
FIGURE 16.2 Moving Average and Differential with Buy/Sell Explanations
GK015-C16[97-100].qxd 6/10/04 7:35 PM Page 98 Virender Negi Quark07:BOOKS:GK015-Whistler:Quark files:
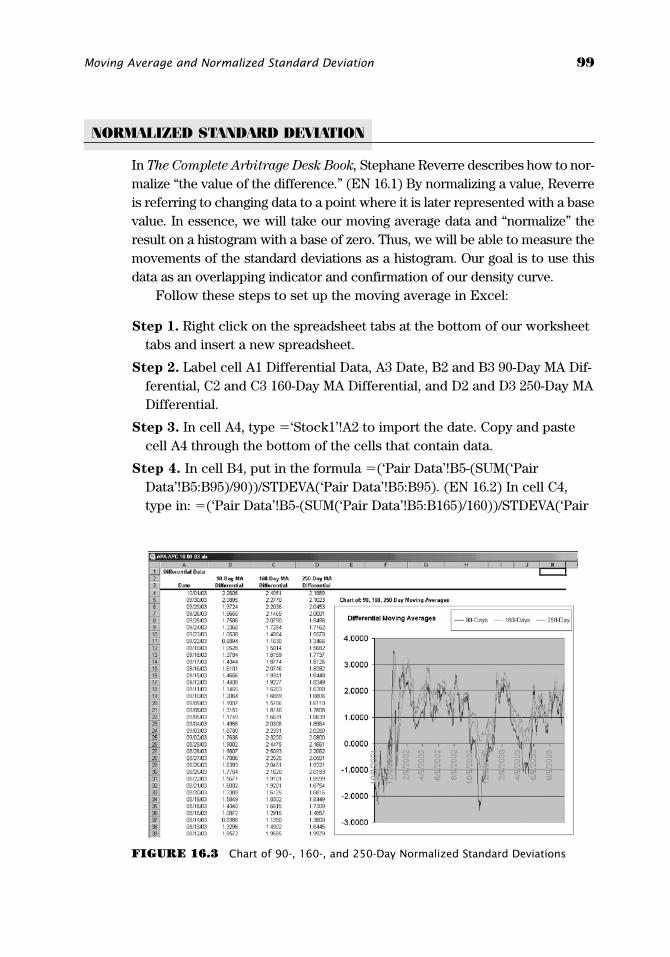
Moving Average and Normalized Standard Deviation 99
NORMALIZED STANDARD DEVIATION
In The Complete Arbitrage Desk Book, Stephane Reverre describes how to nor-malize “the value of the difference.” (EN 16.1) By normalizing a value, Reverreis referring to changing data to a point where it is later represented with a basevalue. In essence, we will take our moving average data and “normalize” theresult on a histogram with a base of zero. Thus, we will be able to measure themovements of the standard deviations as a histogram. Our goal is to use thisdata as an overlapping indicator and confirmation of our density curve.
Follow these steps to set up the moving average in Excel:
Step 1. Right click on the spreadsheet tabs at the bottom of our worksheettabs and insert a new spreadsheet.
Step 2. Label cell A1 Differential Data, A3 Date, B2 and B3 90-Day MA Dif-ferential, C2 and C3 160-Day MA Differential, and D2 and D3 250-Day MADifferential.
Step 3. In cell A4, type �‘Stock1’!A2 to import the date. Copy and pastecell A4 through the bottom of the cells that contain data.
Step 4. In cell B4, put in the formula �(‘Pair Data’!B5-(SUM(‘PairData’!B5:B95)/90))/STDEVA(‘Pair Data’!B5:B95). (EN 16.2) In cell C4,type in: �(‘Pair Data’!B5-(SUM(‘Pair Data’!B5:B165)/160))/STDEVA(‘Pair
FIGURE 16.3 Chart of 90-, 160-, and 250-Day Normalized Standard Deviations
GK015-C16[97-100].qxd 6/10/04 7:35 PM Page 99 Virender Negi Quark07:BOOKS:GK015-Whistler:Quark files:
Data’! B5:B165). In cell D4, add: �(‘Pair Data’!B5-(SUM(‘PairData’!B5:B255)/ 250))/STDEVA(‘Pair Data’!B5:B255).
Step 5. Chart the data from column B, C and D beginning in column E.
The resulting chart (like the one in Figure 16.3) has variables that hoverboth above and below zero. Different pairs can produce diverse numbers,though in general the histogram should usually be fairly insightful as to apair’s range. If you have trouble setting up the data, please refer to any of thespreadsheets in the back of the book.
Now, returning to our empirical rule, we remember that:
• 68 percent of the data will rest within �/� one standard deviation of themean.
• 95 percent of the data will lie within �/� two standard deviations of themean.
• 99.7 percent of the data will sit within �/� three standard deviations ofthe mean.
Ideally, we would like to see all three of our normalized differentialstrade above 2.0 standard deviations before selling a pair and converselybelow 2.0 standard deviations before buying the pair. Going back to our den-sity curve data from Chapter 14, we can now find new information that mayhave helped us make more informed decisions.
Generally, the rules for taking a trade are:
• The differential (or ratio) must be within 10 percent of the third standarddeviations (in real data) when the pair is instituted.
• The differential chart visually displays that the pair is trading away fromthe mean.
• The density curve must be printing within 0.003 of the high and low val-ues for the pair. Keep in mind that to substantially minimize risk youcould scale your entry signals back to 0.000 or 1.000 on more volatilestocks, like tech stocks.
• The 90-day, 160-day, and 250-day normalized standard deviations (NSDs)must all be above �2 or below �2.
If any one of the above indicators is not within the parameters that wehave mentioned, we will usually not take the trade, meaning that we will not
purchase or sell short either stock.
100 TRADING PAIRS
GK015-C16[97-100].qxd 6/10/04 7:35 PM Page 100 Virender Negi Quark07:BOOKS:GK015-Whistler:Quark files:
101
CHAPTER 17
MoneyManagement
Why Money Management?
Psychology of Money
Management
Understanding How Pairs Can
Be Dangerous
WHY MONEY MANAGEMENT?
This chapter may be a little premature; however, at this point I would like toslow down and take a moment to understand the risks involved with tradingpairs, while discussing how to protect ourselves with money management.Even though pairs trading is essentially a hedge, the strategy involves morerisk than directional trading, as each trade consists of two positions insteadof one. Thus, if a position goes against us, we have double the exposure of anormal directional trade, not to mention we are paying twofold more com-missions than a regular trade. If we are successively wrong on several posi-tions, our transaction costs can further erode our account. What’s more, ifwe do not have a firm understanding of both technical and fundamentalanalysis, we can endlessly watch our trading capital go down the drain whileour pair creates a statistical anomaly.
PSYCHOLOGY OF MONEY MANAGEMENT
One of the most incredible traders I have ever met has a great way ofapproaching money management psychology. Kevin Cuddie says, “If you donot honor your stops you are lying to yourself and stealing from your fam-ily.” While this is extremely harsh, it is exactly true at the heart of the issue.By not honoring our stops we are lying to ourselves from the moment weenter a trade. It is our duty as individual traders and investors to strictly
GK015-C17[101-104].qxd 6/10/04 7:35 PM Page 101 Virender Negi Quark07:BOOKS:GK015-Whistler:Quark files:
adhere to the trading plan and rules we have already set forth—before weever enter a single trade.
When Mr. Cuddie says you are stealing from your family, he is also righton the money. This sentence is very hard to swallow, but if you take amoment to consider the reality of the situation, you may find yourself hav-ing an incredible epiphany. Think about it for a moment. When you areinvesting, whether it be directional or pairs trading, you are working withyour (or your firm’s) hard-earned money. As students of the market, wealready have many things against us, including order flow, news, insiderknowledge, earnings, and, of course, our own emotions. It is necessary tounderstand that if you trade, you will lose from time to time, perhaps evenall the time if you are not careful. Simply put, being able to cut your lossesshort is the name of the game. If you do not cut your losses when your stoploss points are triggered, you are taking your own money out of your ownpocket. And if you have a family to take care of, you are taking money awayfrom your family’s livelihood, simply because you could not cut your ownlosses. It is generally true that we all want to progress both emotionallyand financially forward; accordingly, if we waste our resources on losingpositions, we hinder our ability to advance.
If you have a $100 account and you let a loss in one trade wipe out halfof your account, you are in big, big trouble. Why? To recoup your originalprincipal of $100, you now have to make 100 percent in the next trade to off-set your original 50 percent loss. How many trades have you ever made thatearned 100 percent? If you are like me, probably not many. Thus, we striveto take small loss after small loss, to then yield a large winner. Moreover,when we do not accommodate stops and take large losses, we only breedfear. And when you trade with fear, you might as well not be trading at all.When you fear losing money, you will find yourself with analysis paralysisand not be able to pull the trigger to enter a trade, or fear losing the rest ofyour money and not be able to close a losing trade.
The game blackjack has some interesting principles of money manage-ment that we should strive to learn from. First and foremost, when you placea bet on a blackjack table, you have specified your exact money manage-ment plan (in advance) for that particular trade. Unless you double down orsplit cards somewhere in the middle of the hand, you have specifically statedhow much you are willing to risk. When the hand is over, if you have lost tothe dealer, your money is taken by the house. At that point, you may be veryhappy that you didn’t bet more! Unfortunately, when an equity trade goesagainst us, we do not have the luxury of a set loss unless we are dealing inoptions or some other financial instruments. If we continue to play the hand,
102 TRADING PAIRS
GK015-C17[101-104].qxd 6/10/04 7:35 PM Page 102 Virender Negi Quark07:BOOKS:GK015-Whistler:Quark files:
Money Management 103
our losses can go on inevitably, or at least until we are completely broke.What’s worse is that if you are trading on margin, you can lose even moremoney than your account has, and actually end up owing money—clearly nota predicament that any us of want to be in!
Once our losing blackjack trade is over, it is then our responsibility tostop trading. As individuals, we must be accountable for our own decisions.No system in the entire world is completely foolproof; therefore, it is crucialthat we understand losses will occur. Much like the blackjack table, we muststop trading when we are down and review what went wrong. Further, if wedo not have expendable capital to step back up to the table with, then weshould just walk away. Trading, much like gambling, is not for everyone.More importantly, pairs trading may also not be for all individuals, especiallyanyone who does not have the time to conduct the proper research andanalysis. The information in this book is only as effective as the investor whoindividually pulls the trigger to enter a trade. Again, the statistics in this bookwill be wrong from time to time, consequently leaving us (as individuals) toknow when to stop the bleeding.
UNDERSTANDING HOW PAIRS CAN BE DANGEROUS
While we have already gone over both technical and fundamental analysis toassist our pairs knowledge, the crux of this book is based on statistics. As Ihave already mentioned, our statistics can fail us from time to time. How?First, there is always the risk of human error. What if you build a spreadsheetand have the formula in just one key cell wrong? The result could be detri-mental to your account if the mistake is not caught before a trade is entered.Second, pairs are only as strong as the statistics that back them. In all sta-tistics, there is always the risk of an anomaly that skews the data. Thus, ifour pair is at an outlying point where we receive a buy or sell signal, thetrade is definitely not a sure thing. Despite the hedge, we must understandthat the pair has diverged for a reason. It is our job as pairs traders to figureout why and then attempt to understand whether the correlation is strongenough to draw the two stocks back together. Take, for example, the buy sig-nal for KLAC/NVLS that we received on October 3, 2002. In an independentevent that affected our pair, Advanced Micro Devices (NYSE: AMD) hadwarned on October 2, 2002, while the broader chip sector seemed to be rap-idly falling to the wayside. Then on October 8th, when we took our position,Lehman Brothers analyst Edward White announced that the semiconductorsector could see weaker order trends throughout 2003. However, Mr. White
GK015-C17[101-104].qxd 6/10/04 7:35 PM Page 103 Virender Negi Quark07:BOOKS:GK015-Whistler:Quark files:

stated that he expected a few stocks to hold up well, specifically mention-ing KLA-Tencor, the buy-side stock in our pair. While this news event helpedto drive our pair in the right direction, consider the other side of the coin.It is very possible that White could have upgraded Novellus instead of KLA-Tencor. If such had happened, our pair could have quickly slipped furtherinto the bowels of the investing earth, while we sat by in a losing trade.Also, during early October 2002 we were in the middle of warnings season,when many chip companies were announcing that they would miss theirnumbers. The event risk that we faced was that KLA-Tencor, could haveannounced either tragic earnings numbers or guided lower for the comingquarters. Either incident would have caused us to lose money in our trade.The point here is that statistics got us in the trade, while positive currentevents helped us get out with a winner. If you are not shaking your head atthis very moment saying “I will never trade pairs, ever,” then I am not surewhat more I can say to convince you of the danger you face by trading sta-tistical arbitrage.
My intent during this chapter is purely to talk you out of pairs, for if youare nervous after the last few sentences, perhaps pairs are not for you. If thisis the case, please believe me when I say “no big deal.” As traders, we findourselves adapting to investment styles that fit our personalities much likedifferent artists use different painting techniques. If you are a marketimpressionist, please do not try to fit in the box of surrealists. Your style isyour style, and for many, the risks associated with pairs simply do not fit intheir money management plan or psychological profile.
104 TRADING PAIRS
GK015-C17[101-104].qxd 6/10/04 7:35 PM Page 104 Virender Negi Quark07:BOOKS:GK015-Whistler:Quark files:
105
FUNDAMENTAL PRINCIPLES
The fundamental principles behind money management are very simple.However, as people with emotions driven by fear and greed, we can have anincredibly hard time sticking to our strategy. The foremost principle is don’tlose money—ever. While this many seem a little elementary, it is a muchharder task to implement than we perceive. Have you ever let a trade goagainst you thinking it will come back? Were you a part of the bull marketbubble that blew up in all of our faces?
Let me tell you a little story about one of my more fantastic moments.While in college, I had the opportunity to participate in a pre–initial publicoffering, about which I knew almost nothing. However, it seemed like a fantas-tic deal at the time, so I put my hard-earned money to work. The companywas/is called Homeseekers.com. At the time it was named something else, butthe actual name no longer matters. I invested $10,000 in roughly 5,000 shares ofthis wonderful company at $2 a share. What a deal for a dot.com. I sat on thestock all through school, waiting for something to happen. Then after I wasfinished with my degree, the stock went public and I had the opportunity toexercise an additional 5,000 shares at $3. At the time it seemed like anotherwonderful opportunity, as the stock was trading at roughly $4. I scraped up themoney and put my capital to work. I now had 10,000 shares in my account.Going into December 1999, the stock fired up to $15 a share, where I took someprofits out. I think I cashed out about $70,000 worth and decided to let the restride. I was sure I would be a millionaire before I was 30. Then, just after January2000, the stock began rapidly descending. I kept telling myself, just a pullback,
CHAPTER 18
MoneyManagement II
Fundamental Principles
Know Yourself
The Plan
GK015-C18[105-108].qxd 6/10/04 7:36 PM Page 105 Virender Negi Quark07:BOOKS:GK015-Whistler:Quark files:
106 TRADING PAIRS
just a pullback, just a pullback, which it wasn’t. I never sold the remaining posi-tion of my shares, and at last glance the stock was trading on the NASDAQbulletin board at 0.001 cents a share. If I just cashed out all of my position nearthe top, I would have made over $250,000. But I didn’t; I rode it into the ground,just like any self-worthy Wall Street cowboy should. The bottom line: I had noplan and gave up a lot of money because of it.
If we are going to understand money management, we have to have aplan—any plan, just have a plan.
KNOW YOURSELF
To have a money management plan, you must first take a moment and get toknow yourself. Ask yourself: Am I driven by a trading goal? Am I driven by thesuccess of the trade or by the fear of losing money? Either way, are you drivenby fear or greed? If you are driven by greed, then you must make sure you havean excellent money management plan with tight stops. However, if you aredriven by fear, then you may want to loosen your stops a little, to ensure thatwhen you do have a winning trade, you can hang on to it for a larger winner.No matter which end of the spectrum you are on, it’s important to understandthat all negative actions lead not to greed but, rather, fear. And fear is the ulti-mate trading destroyer. There is a fine line between being a responsible moneymanager and trading with fear. If you trade with fear, you close every trade thatgoes against you, if even by a few pennies. This is good, as you will never loselarge amounts of money; however, you will never be able to make any realmoney or make rational, unbiased decisions. The best money managers in theworld understand that there is a middle ground, where trades are closed whenthey violate preset technical, fundamental, or statistical levels. Thus, the short-cut to becoming a great money manager is to simply have predetermined stopsbefore you ever take the position. Then, you have removed yourself from thetrade and are unbiased about the trading action that follows your entry. Andthis is how to get to know yourself. If you rationalize your stops before you takethe position, you can record your emotion when your stop nears. Do you wantto leave the trade open to make more money, or close it out of the fear of losing?
THE PLAN
First and foremost, you should never, ever, ever take more than an 81⁄2 percentloss on each side of your pairs trade. The total capital lost equals 17 per-cent and can still be devastating to an account. When you calculate an
GK015-C18[105-108].qxd 6/10/04 7:36 PM Page 106 Virender Negi Quark07:BOOKS:GK015-Whistler:Quark files:
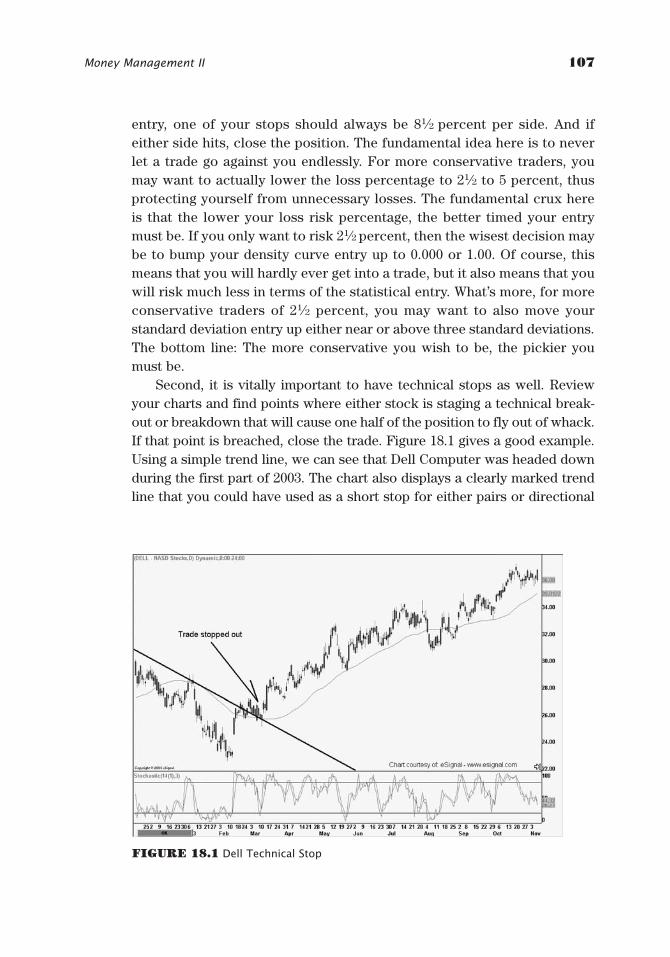
Money Management II 107
entry, one of your stops should always be 81⁄2 percent per side. And ifeither side hits, close the position. The fundamental idea here is to neverlet a trade go against you endlessly. For more conservative traders, youmay want to actually lower the loss percentage to 21⁄2 to 5 percent, thusprotecting yourself from unnecessary losses. The fundamental crux hereis that the lower your loss risk percentage, the better timed your entrymust be. If you only want to risk 21⁄2 percent, then the wisest decision maybe to bump your density curve entry up to 0.000 or 1.00. Of course, thismeans that you will hardly ever get into a trade, but it also means that youwill risk much less in terms of the statistical entry. What’s more, for moreconservative traders of 21⁄2 percent, you may want to also move yourstandard deviation entry up either near or above three standard deviations.The bottom line: The more conservative you wish to be, the pickier youmust be.
Second, it is vitally important to have technical stops as well. Reviewyour charts and find points where either stock is staging a technical break-out or breakdown that will cause one half of the position to fly out of whack.If that point is breached, close the trade. Figure 18.1 gives a good example.Using a simple trend line, we can see that Dell Computer was headed downduring the first part of 2003. The chart also displays a clearly marked trendline that you could have used as a short stop for either pairs or directional
FIGURE 18.1 Dell Technical Stop
GK015-C18[105-108].qxd 6/10/04 7:36 PM Page 107 Virender Negi Quark07:BOOKS:GK015-Whistler:Quark files:
108 TRADING PAIRS
traders. Once the stock closed above the descending resistance line, it wasoff to the races. It is vitally important to have technical stops on your chartas well as capital percentage loss stops in your account.
Third, statistical stops should also be set hard and fast for any trade. Igenerally use the third standard deviation as a good point to close positions,should the trade go against me. However, if I am taking a position on the sec-ond standard deviation, the third standard deviation can be quite a waysaway, and can infer substantial losses if the losing trade is held that long.Thus, I use the third standard deviation as an actual stop only when I imple-ment a trade within 10 percent of the same standard deviation. Moreconservative traders may want to decrease this number significantly, thoughremember that to do so also means you must time your entry properly inorder to avoid being quickly stopped out.
GK015-C18[105-108].qxd 6/10/04 7:36 PM Page 108 Virender Negi Quark07:BOOKS:GK015-Whistler:Quark files:
109
DO PAIRS REALLY WORK?
The answer to this question is as rhetorical as the question itself. Pairstrading is not a system that will automatically fill your account with endlessamounts of easy money. In fact, pairs trading might actually be more difficultthan regular trading. Think about it. If you are a directional trader investingin only one stock, then your research is fairly limited. You only do funda-mental research on the stock, sector, and market. Then, look at the stock’stechnical indicators, while also taking notice of historical news and pendingevents. After this is completed, you may then have a good idea whether thestock is worth trading. However, if you are a pairs trader, you have to con-duct the same amount of research on two stocks instead of one. You cannow see that this is not for the faint at heart.
Pairs do work; however, trading pairs is only as effective as the investorexecuting the trades. If you are willing to do only half of the research, thenyou will likely lose half (if not all) of your money. If you put in 100 percent,you will likely break even. The only way to make your account grow is to putin more effort than your competitor—and in the market, you are competingagainst everyone else. This may sound discouraging, but it is a market truththat will not go away. We cannot deny our responsibilities of hard work andexpect to get lucky. Thus, if we really want to trade our own money and besuccessful, we have to put in 150-plus percent.
If used correctly, pairs can hedge your risk in times of uncertainty. Youmay be tempted to trade pairs with sexy, high-flying stocks. However, ifyou instead stick to slower-moving, more fundamentally sound companies,
CHAPTER 19
The Reality of Pairs
Do Pairs Really Work?
Trader or Investor?
Making the Style Work for You
Intraday Pairs
GK015-C19[109-118].qxd 6/10/04 7:36 PM Page 109 Virender Negi Quark07:BOOKS:GK015-Whistler:Quark files:
110 TRADING PAIRS
you may very likely have greater results. Take energy stocks, for example.Some of the larger energy companies have moved incredibly slowly overthe past decade, while paying out consistent dividends. These stocks rarelyhave any volatility of divergence, unless some sort of scandalizing event orcrisis occurs. Many institutional investors have valued these stocks to thepenny and know exactly what each is worth. Thus, as long as the event thattriggered divergence is not caused by an event that is incredibly scan-dalous, the two stocks will likely return to their original value, which areexactly the opportunities that you and I, the pairs traders, are looking for.
Do pairs ever fail? I can only answer this question with a resounding“heck yes!” During 2000 to 2001 I traded an account that had a 100 percentwin/loss ratio. This means that we had no losers. Let me rephrase that to bemore correct: We had many pairs trades that had both a winning side and alosing side. However, the winners always exceeded the losers; thus, theoverall pairs positions were winners.
Then, going into the first few weeks of September 2001, we found awonderful position, with two large companies that appeared to present lessrisk than other flamboyant high-flying stocks. The two companies wereBoeing and Lockheed Martin. To be exact, the two companies were tradingapart two and a half standard deviations. As a result, we bought Boeing andsold short Lockheed Martin. The trade looked amazing, and we anticipatedthat the position would yield at least 10 points.
Then, on the morning of September 11, 2001, I left for work slightly laterthan usual. I needed to give my wonderful better half a ride to work. Afterdropping her off at her office building, I pulled into traffic and heard what Ithought at the time was a joke: “A plane has hit the World Trade Center inNew York.” I switched the station once, twice, three times—and then I knewit was for real. What I also then realized caused me to pull over for a momentand take a deep breath. I formed a hypothesis in my mind and drove to theoffice. When I arrived on the trading floor, all of the traders were not at theirdesks, but rather, were standing in front of the TVs watching CNBC andCNN. I knew what was going to happen and prayed for the market to openfor just one minute—all I needed was one stinking minute to get out of ourpositions. Then, when the New York Stock Exchange did not open and thesecond plane hit, I knew our fate was sealed. I left work that morning andwent home for what would turn into a week off while the markets stayedclosed. As the week progressed, I listened to the news and realized more andmore each day that the account that I put the Boeing/Lockheed Martin tradein was now on fire also. It was kind of like standing in front of a firing squadfor days on end; waiting for the inevitable, and then waiting some more.
GK015-C19[109-118].qxd 6/10/04 7:36 PM Page 110 Virender Negi Quark07:BOOKS:GK015-Whistler:Quark files:
The Reality of Pairs 111
The problem was obvious: Though Boeing had a substantial amount ofbusiness from defense, it also heavily relied on selling jets to commercialairlines. And when a terrorist attack comes in the form of commercial airlinesturning into hellish missiles over your own country’s soil, people stop flying.When people stop flying, the airlines stop ordering jets. And when the airlinescease purchasing or discontinue current leases, the companies that manu-facture planes (Boeing) take a huge dive. Conversely, Lockheed wascompletely exposed to defense; thus, the attack was sure to bring aboutimmediate defense budget increases. And it did. Shortly after, the defensebudget packed full of cash for research, development, and production for mil-itary/defense weapons and technology was passed. Washington soon afterpassed a fiscal stimulus package that amounted to $75 billion, of which manydefense companies like Lockheed Martin received a good portion. The futurewas imminent, when the market opened again, I was sure Boeing would gapdown and Lockheed Martin would gap up. And that’s exactly what happened.
When the market reopened on Monday, September 17, 2001, the Boe-ing/Lockheed Martin pair gapped against us 14 points. Everything we hadmade for the entire year (and then some) went up in smoke. The accountwas devastated.
I had never expected this situation to occur and had no idea whether thecorrelation would hold. In short, I had no idea if the trade would come back,but knew that the account could not stand to lose one cent more. Theaccount had grown 33 percent for the year prior to September 11. When themarket then opened on September 17, the losses totaled almost 45 percentof the September 10 close. Just to get the account back to where we hadstarted for the year, I needed to make 37 percent, and to get back to the levelwhere the account closed on September 10, we needed to book 82 percent.I’m not sure which was more devastated—the account or me.
This is where I learned the most important lesson of my entire tradingcareer. When you are down and out and are thinking about batting for thefences to recover losses, stop trading and take a break. Write down exactlywhat went wrong, or at least what you think went wrong, and put that pieceof paper away for a while.
The irony of the situation is that the pair did come back, and if I had justleft the trade open, it would have returned to its original value. However,even though I took a huge loss, I did the right thing. The situation was ananomaly and presented more future risk than it did reward. Had I not beenin Boeing/Lockheed Martin before September 11, it would have been a greatopportunity to take a position on the 17th. But then again, my 20/20hindsight account never loses a trade.
GK015-C19[109-118].qxd 6/10/04 7:36 PM Page 111 Virender Negi Quark07:BOOKS:GK015-Whistler:Quark files:
112 TRADING PAIRS
What I did after September 11 was keep trading. And from there Imanaged to give up another 6 percent in the following six months. At thatpoint I took a break, and thank God I did.
I decided to take some time off from trading during the late spring andsummer of 2002. In fact, I don’t think I actually placed a single trade untilSeptember 2002! During that time, I left the trading firm I had been at to gowrite for a financial newsletter. My timing when I stopped trading was oneof the most lucky events of my entire life, as another market anomaly wasabout to take place, and at the time I did not see it coming—nor would I haveknown how to deal with the situation that would be presented.
During the summer of 2002, the market completely fell apart when theDow Jones Industrial Average, NASDAQ, and Standard & Poor’s (S&P) 500all made fresh bear market lows. If there was one prominent theme to themarket that summer, it was scandal. Companies like Enron, Citigroup, andTyco were littered with corruption and accounting scandals. And investorsquickly learned that if you can’t trust a company’s officers and accountants,just get the heck out. The resulting action triggered mass selling in a varietyof different companies, and the selling generally appeared overnight. If atthat time you were trading pairs based on statistics and/or correlations, thenyou most likely got killed. Thankfully by pure chance, I was not. And, whenI went back and began reviewing trades that I might have taken, I was verypleased about my decision to take a break. September 11 and the summer of2002 taught me two very important things.
First, statistical arbitrage is only as good as the legitimacy of the corre-lation supporting the trade. I am mostly speaking of convergence tradinghere, though this also stands true for divergence trading as well. Basically,when the events that pull companies apart are so extreme that companiesare filing for bankruptcy, corporate insiders are being made to do the “perpwalk,” or class action suits are beginning to rise—just stay out. Of course,some argue that the aforementioned events create a perfect situation fordivergence trading. However, I have yet to meet anyone who can accuratelypredict such events on a consistent basis and make money. When in doubt,stay out.
The second lesson is that when the market begins to capitulate or is atan extreme level, that is, the Market Volatility Index (EN 19.1) is above 40, itmay be a good idea to sit on the sidelines. After all, if we are divergence trad-ing, then we want to wait for the rubber band to completely expand, versustrying to time the trade before the pair has capitulated. Of course, we won’talways be correct, but, when significant moments of substantial uncertaintyarise, it may be in our best interest to pass for a more reliable opportunity.
GK015-C19[109-118].qxd 6/10/04 7:36 PM Page 112 Virender Negi Quark07:BOOKS:GK015-Whistler:Quark files:
The Reality of Pairs 113
After all this, what I am trying to say is that pairs do work; however, muchlike any other trading style, there will be times when the bottom falls out.From here, we will soon see that money management is the name of thegame.
TRADER OR INVESTOR?
This is a question we must all ask ourselves. My advice in answering thisquestion is to simply ask yourself how much time you have every day towatch the market. If you are not in a position to watch the intraday move-ments, you are an investor, not a trader. This is not a bad thing at all actually!In fact, this is absolutely outstanding, as most intraday traders (day traders)take on the most risk. I know, because I’ve been there. The problem withtrading pairs on an intraday basis is that if two stocks are separating, they’redoing it for a reason, and could very likely close at a high. This means youlose. Though we only briefly went over intraday pairs, I would not recom-mend day trading for the average Joe. Being an investor and trading withlonger-term data, you have the ability to analyze your data and are notfighting against intraday order flow that you have no idea about.
To be an investor or, should we say, “swing trader,” is most likely thebetter bet. When we hold a position for a shorter amount of time, as in twodays to two months, we are keeping our capital at work, while not exposingourselves to long-term risk.
There is a concept known as churning, which is also branded asovertrading. A broker who is trying to make money on commissions typicallydoes this; however, swing traders who move in and out of their positionsexcessively can also be guilty of churning their own account. As pairs traders,we must be careful not to overtrade, as each pair has a long and short posi-tion, and thus, double the commissions. This is another reason I do notrecommend intraday pairs trading, as the commissions can be horrendous.
MAKING THE STYLE WORK FOR YOU
To make the style work for you, you must stay abreast of your data. Youmust update your data daily and watch for opportunities. What’s more, to bean effective pairs trader, we must also watch the news events surroundingus. If we are trading pairs into earnings season, and the companies that tradewith our pair begin warning, it is a good idea to examine the possibleoutcomes for our stocks. Despite correlations, our pair can make dramatic
GK015-C19[109-118].qxd 6/10/04 7:36 PM Page 113 Virender Negi Quark07:BOOKS:GK015-Whistler:Quark files:
114 TRADING PAIRS
swings during times of tribulation, like earnings. The last thing we want todo is wake up to a poor earnings report for the stock that we are long in.Even if the correlation is strong, the stock we are short may not react thesame as the stock we are long. In this scenario, I highly recommend lookingthrough each company’s earnings estimates and searching for analystguidance for the pending announcement. If our long stock has recently low-ered earnings guidance and our short stock has not, it may be a good idea toexit the position as a precautionary measure to potential losses. After all,missed money is much better than lost money.
Please also keep in mind that each investor’s risk tolerance is muchdifferent than the next. Thus, while I may have mentioned an 11 percent stop(5.5 percent per stock) for KLAC/NVLS, the same risk may not be acceptablefor an investor with a smaller account. Think about it for a moment. If youlose 20 percent on $1,000, then you have to make back 25 percent to breakeven. Every time you lose money, it becomes harder and harder to makethe money come back. I know that I have outlined this point twice in thischapter, but that’s how vitally important it is to remember.
One of the most incredible slogans of trading I have ever heard is “80percent of success is just showing up.” I cannot commend this statementenough. As an example, in the summer of 2001, I was in a pair of truckingstocks. At the time, I was not using the density curve, and had not figuredout how to accurately time the entry of my pairs yet. What I quickly discov-ered was that often, I had to sit on losing trades before they came back andmade money. Fortunately, all did; however, I partly attribute the winningstreak to dumb luck. Anyway, I had been sitting in the trucking pair for aboutsix weeks and was approximately five points out of the money when ananomaly occurred. The NASDAQ had a plethora of problems with its sys-tems and decided to keep the market open for an extra hour to allow tradersa chance to make up for the lost time during the trading day. When 4:00 P.M.EST rolled by (the normal closing time for the exchanges) I looked aroundthe trading floor and discovered—to my dismay—that almost every singleother trader had already left for the day. The lack of liquidity before the closegave the other traders an excuse to go play golf. However, I stayed becauseI remembered reading about low-volume days before holidays when themarkets went haywire, and I was already losing huge in my trucking pair anddidn’t want to come into any nasty surprises the following day. So I stayedand watched. Amazingly, the electronic communications network (ECN)activity was incredibly robust for both of my stocks. I began to see bids andasks build like the trucking stocks were tech highfliers. By this I mean thatthe buyers and sellers were stacking up tremendously on the bid and ask in
GK015-C19[109-118].qxd 6/10/04 7:36 PM Page 114 Virender Negi Quark07:BOOKS:GK015-Whistler:Quark files:
The Reality of Pairs 115
both stocks. My first thought was: Can this be real? Then I surmised thatthere must have been institutional players out there who either had somehuge orders to run—and saw the late day as an opportunity to move someserious volume—or that someone, somewhere was panicking.
Regardless, the bids were building on the stock I was long, and the askswere piling up in the stock I was short. My heart began racing—the pair thatI had just been five points out of the money on was now three points in themoney . . . then four points, then five points. I immediately marketed out ofhalf of both positions, and put the other two halves further out of the moneyto see if I would be hit. Amazingly, my orders were immediately taken, and Iwalked away with a huge 10-point profit. Next thing I knew, I was standingon the top of my desk swinging a golf club, screaming at the top of my lungsin victory elation. I had just recovered 15 points. When I came to my senses,you could hear a pin drop. The only people in our office were the branchmanager and compliance director, who were staring at me like I was a mad-man. And I was. I quietly put down my golf club, stepped off my desk, andleft as quickly as possible.
The most amazing part of the whole experience is that I learned youcan’t make money if you aren’t there. I later thought about the situation, andalso realized that I didn’t have to be there at all. I should have had orders out-standing in our system at my profit levels, whether I was out of the moneyor not. After all, that is the one benefit that computers give us: the ability toease our day-to-day activities. No matter how you slice it, though, I was therewhen the other traders went home, and I made money because of it. When Igot into the office the next morning, both stocks opened at where they hadbeen trading at noon the previous day. It was like nothing had everhappened. I waited all morning for our manager to come inform me that thetrades were unreasonable and that they had been broken; however, suchnever occurred. I won because I was there, I won because I was there, I wonbecause I was there. And you will too.
INTRADAY PAIRS
Intraday pairs often involve more risk than normal pairs, as intradaymovements can be less correlated than longer-term swings. On a valuationlevel, two stocks may trade closely together over a long period of time.This is because the stocks may have similar business models, assets,price-to-earnings (PE) ratios, earnings, or a variety of other congruous itemsthat cause institutional investors to see the companies as complementary.
GK015-C19[109-118].qxd 6/10/04 7:36 PM Page 115 Virender Negi Quark07:BOOKS:GK015-Whistler:Quark files:
116 TRADING PAIRS
Regardless of fundamentals, however, during intraday trading, the stocksmay be at the mercy of order flow. Order flow, as I define it, is all intradaybuying and selling that affects the price of a stock significantly in one direc-tion or another. Order flow is similar to the current of a stream; it is whatpushes a stock. Much like a flat stream can meander, or a rapid stream canhave many different sets of underlying currents and movements, it isextremely hard to predict the precise currents when you are in the water.The only thing you are sure of is that you are at the mercy of the flow of cur-rents. And while swimming downstream in the water, you can get stuck inan eddy or smash into an unseen rock at any moment.
When you are transacting a 100-share trade, you are not adding substan-tial order flow to a stock. However, when your 100 shares coupled with 100other people’s 100 share orders decide the direction of a stock, the result isorder flow. Keep in mind that this definition differs from person to person.The problem is that order flow is nearly impossible to figure out. If youwatch a level II screen and look for larger buyers and sellers, you will almostnever be able to see who is doing what. Five years ago, trading was a differ-ent story; however, now with many ECNs (e.g., Island, Instinet, Brut, Arca),market makers, specialists, and traders, the game has become very compli-cated. Seasoned traders may disagree with me, though for the averagetrader, order flow is impossible to accurately predict 100 percent of the time.As a result, it may be better for us to sometimes step away from the streamto observe the overall direction. Then if we can map out a safer course fromafar (swing trading), we may then have less misfortune running into unseenobstacles when we are in the water.
The intraday pairs trader is at the mercy of order flow, which is theprimary catalyst behind his or her trading actions. He or she is seeking tocapitalize on order flow that drives two stocks apart or brings them backtogether. The main issue here is that as an individual trader, you will never
know when substantial market moving, or individual stock-punishingorder flow will begin. Why? Simply put, you are not on the trading desk atMorgan Stanley, Goldman Sachs, Merrill Lynch, Janus, or any other finan-cial institution that runs huge orders. And even if you are on one of thosedesks, you still cannot predict what will happen with order flow, unlessone of your buddies on another desk calls you and tells you. And that’s oneof those little illegal things the Securities and Exchange Commission(SEC) and the National Association of Securities Dealers (NASD) highlyfrown on!
Say we are trading a hypothetical intraday pair that has spread wideopen, and we think it’s going to collapse back into the mean by the end of
GK015-C19[109-118].qxd 6/10/04 7:36 PM Page 116 Virender Negi Quark07:BOOKS:GK015-Whistler:Quark files:
The Reality of Pairs 117
the day. The hypothetical pair of stocks we are trading are: long ReportedMiserably Inc. (NYSE: RMI) and short Beat Estimates Corp. (NYSE: BE). Thepair has spread open—meaning that even though RMI missed earningsestimates and BE came in above estimates, the stocks are doing the oppo-site of what they should. By this I mean that your gut instinct tells you thatRMI should go down, while BE should ascend. Even though you may per-ceive that the two stocks “ought to” move in one direction or another, theycertainly don’t have to.
In another scenario, what if Crazy Hedgefund X has been building ashort position for months on end in a stock that is about to report, becausetheir analyst knew the stock would miss earnings estimates? This is a “buythe rumor, sell the news” scenario for Crazy Hedgefund X, and now thetraders will cover their huge short position into weakness, betting that suck-ers like you and me will be shorting after earnings. The end result of yourintraday trade is that the stock may never come back and you will have toclose your trade out a big, fat, stinky loser. What if we leave it open thinkingthat it has to recover some of the lost ground in the next few days? After all,we’re hedged—right? Wrong again.
What if you are on the losing side of a larger pairs move and it’s beginninga two-month divergence away from you? You would then be horribly wrongand have to sit in your losing trade until it either comes back or a margin callsells you out of the position and you lose all your money. Do you see therisks here? Intraday trading is extremely dangerous and should be left to thepros who have outstanding money management skills, plenty of expendabledollars to throw away (and the understanding that they probably will), ahighly advanced technical analysis program, outstanding trading platform(like Tradestation), and nerves of steel. I’m not saying you are not this cer-tain well educated, or well-tooled person; after all, you might be! However,for most people, intraday trading can be far above the acceptable level ofrisk tolerance!
GK015-C19[109-118].qxd 6/10/04 7:36 PM Page 117 Virender Negi Quark07:BOOKS:GK015-Whistler:Quark files:

GK015-C19[109-118].qxd 6/10/04 7:36 PM Page 118 Virender Negi Quark07:BOOKS:GK015-Whistler:Quark files:
119
INTRODUCTION
The next portion of the book was a bit of a gamble. With only a few weeksleft to my publishing deadline, I decided that drab information presentedin typical book form no more helps you learn how to trade pairs than read-ing a VCR manual does in helping you be actually able to program yourVCR. Thus, I decided to switch directions and discard a good part of thebook and put a trading diary in place. Here, I will walk you through a pairstrade—day by day—to show you exactly what I am looking for when Iapproach a pair and how I trade it. Furthermore, we will track the pair withreal money on a daily basis. This is a real pair, with real money, and I willtell you play by play exactly what I am thinking—win or loss. At the pointwhen I am writing this, I have no idea whether the pair will be a winner orloser by the time I close the position on November 14, 2003. I will useeverything that I have brought forward in this book in the upcoming trade.Moreover, we will look at the trade on a statistical, fundamental, and tech-nical basis, and will incorporate all of our market knowledge in an attemptto make money. I would like to again reiterate that this is a gamble, as I donot know what the outcome of the trade will be by the time this book goesto print. However, the lessons here should be timeless and invaluable, aswe will work with two oil companies—an industry that really doesn’tchange all that much. This is a little nerve wracking, but exciting at thesame time. As a trader, I have built my career on taking calculated chances,so this trade will be very interesting, as it is calculated chance as well.Here we go!
CHAPTER 20
Trading anActual Pair
Introduction
Trading Diary—The Beginning
Historical Time Line of
Divergence Events
GK015-C20[119-132].qxd 6/12/04 2:18 AM Page 119 Quark08 Quark08:Books:GK-Jobs:GK015-Whistler:Repro:
TRADING DIARY—THE BEGINNING
September 26, 2003: Today, I was looking around the market and noticeda possible pairs divergence that may be worth looking into. I used to tradethis pair quite a bit, but have not looked at it in about two years. The twostocks I noticed were Apache Oil (NYSE: APA) and Anadarko Petroleum(NYSE: APC). I absolutely cannot believe the divergence of these two stocks!When I traded them in 2000 and 2001, they were one of my best pairs with acorrelation of just under 90 percent. However, it now appears the correlationmust have dropped substantially, given the immense amount of divergencethat appears to have taken place. Looking at Figure 20.3, you can clearly seethat throughout 2001, Apache and Anadarko traded quite closely to oneanother. The chart says a few important words about the two companies:“similar business models.” However, the chart also shows that aroundJanuary 2002, the two stocks began a divergence that would carry bothequities far apart. We must try and figure out what happened at the time—and why Wall Street perceived so much change. Our goal is to then seekto understand whether the two stocks will come back together and, ifso, when?
First, let’s begin try to understand the two companies themselves, and seeif we can uncover any similarities in their business models or financial state-ments. According to a press release distributed by the company, Apache is “alarge oil and gas independent with core operations in the United States,Canada, the UK North Sea, Western Australia and Egypt.” According toYahoo.com, at of the end of 2002, Apache had 637 million barrels of crude oilin reserves, along with just over 4 trillion cubic feet of natural gas.
Anadarko Petroleum’s press releases say it is “one of the world’s largestindependent oil and gas exploration and production companies. Houston-based Anadarko is active in the U.S., Canada, Algeria and Qatar and is exe-cuting strategic exploration programs in several other countries.” At theend of 2002, Anadarko had 2.3 billion barrels of oil equivalent provedreserves. Taking a look at the balance sheet, as of June 30, 2002, Anadarkohad over $20 billion in assets, while Apache had just under $12 billion.
Our immediate impression here is that both companies are independentswith relatively similar goals. While total tangible balance sheet assets differ,both companies are operating in the same independent oil ballpark. Thus,we know why the charts have historically been quite comparable to oneanother—the companies were both pursuing similar types of business.
Looking back in time, we will scan the news around the beginning of 2001to see if there were any apparent signs of the divergence about to take place.
120 TRADING PAIRS
GK015-C20[119-132].qxd 6/12/04 2:18 AM Page 120 Quark08 Quark08:Books:GK-Jobs:GK015-Whistler:Repro:
At the beginning of 2001, oil began to climb back over $20 per barrel, basedon a possible U.S. oil workers’ strike and an explosion at a Kuwait oil field.However, just prior to these events, both Apache and Anadarko had reportedearnings for the fourth quarter of 2001. Apache matched Wall Street’s earn-ings estimates and announced a 31 percent climb in 2001 production, whichwas the largest production increase Apache had ever seen. In addition,despite an annual 16 percent decline in oil prices, Apache also mentioned thatcash flow from operations increased by just under $2 billion. Investors happilyembraced the news reported by Apache as a sign of stability and growth. Theactual date that Apache reported on was January 31, with the stock closing at$48.49. After Apache reported, there were no significant up or down gradesthat immediately drove the stock in one direction or another.
Anadarko, however, warned a few weeks earlier, painting a differentpicture than Apache’s optimistic outlook. One difference that Anadarkoalready faced going into earnings was that the company had recently begunslowing its drilling program in July 2001. The result was slower fourth-quarter volumes and not so stellar earnings. Then, one day before earningswere to be released, Anadarko announced that it would correct a 3Q01accounting error, which amounted to just over $1 billion. For the 4Q01,though, Anadarko reported 41 cents a share, with a 41 percent decline in rev-enue. Anadarko cited the tough year as being mostly caused by lower energyprices. In addition, Anadarko also stated that it would push some of its naturalgas developments to the side and wait for prices to become more attractive.Then, to add icing on the cake, the company forecasted 1Q02 earnings of 25cents a share, versus the consensus expectation of 34 cents. Not good.
This was the beginning of Anadarko and Apache’s divergence, though itwould take a little time still before the two stocks really began to buildmomentum away from one another. In fact, if we take a moment and look atour spreadsheet to analyze the pair using only the price data up to January31, 2002, we will see some pretty amazing things. Figures 20.1, 20.2, and 20.3show the Main page, the Pair Data page, and the Individual Charts page. Youwill quickly notice on the main page that the two stocks were 66 percent cor-related at the beginning of 2002. You can also see this directly on the Indi-vidual Charts page, where the two charts give an immediate visualrepresentation of how closely the two traveled together.
On the main page of the spreadsheet, we know that the two stocks were66 percent correlated, while also trading in between the mean and �1 stan-dard deviation. The differential mean on January 31, 2002, was �4.55, whilethe actual differential was �0.64. If we had been extremely watchful of thepair, we would have been able to infer that with the difference in earnings news
Trading an Actual Pair 121
GK015-C20[119-132].qxd 6/12/04 2:18 AM Page 121 Quark08 Quark08:Books:GK-Jobs:GK015-Whistler:Repro:
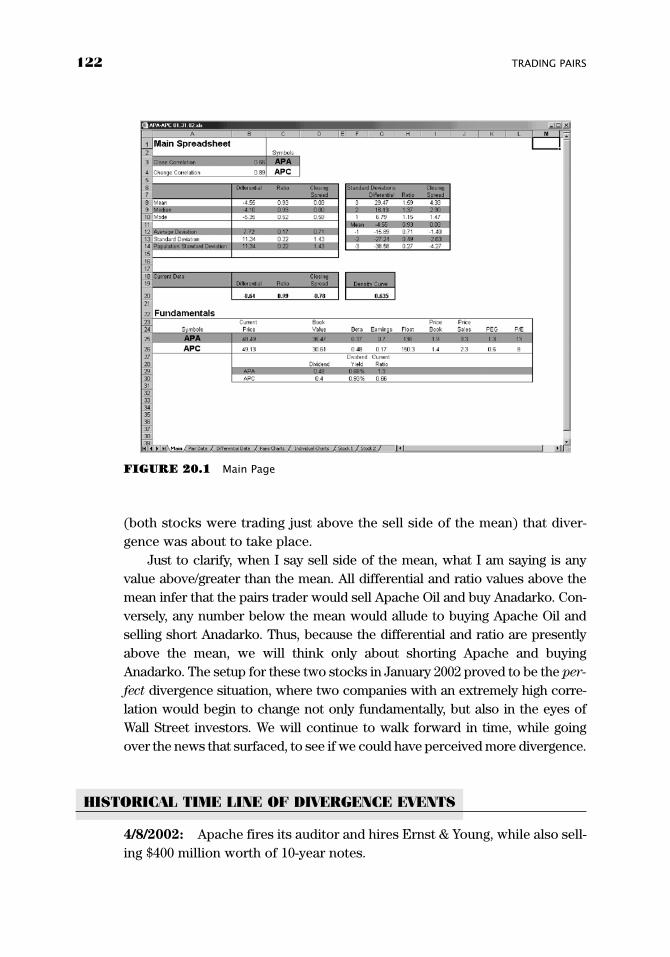
(both stocks were trading just above the sell side of the mean) that diver-gence was about to take place.
Just to clarify, when I say sell side of the mean, what I am saying is anyvalue above/greater than the mean. All differential and ratio values above themean infer that the pairs trader would sell Apache Oil and buy Anadarko. Con-versely, any number below the mean would allude to buying Apache Oil andselling short Anadarko. Thus, because the differential and ratio are presentlyabove the mean, we will think only about shorting Apache and buyingAnadarko. The setup for these two stocks in January 2002 proved to be the per-
fect divergence situation, where two companies with an extremely high corre-lation would begin to change not only fundamentally, but also in the eyes ofWall Street investors. We will continue to walk forward in time, while goingover the news that surfaced, to see if we could have perceived more divergence.
HISTORICAL TIME LINE OF DIVERGENCE EVENTS
4/8/2002: Apache fires its auditor and hires Ernst & Young, while also sell-ing $400 million worth of 10-year notes.
122 TRADING PAIRS
FIGURE 20.1 Main Page
GK015-C20[119-132].qxd 6/12/04 2:18 AM Page 122 Quark08 Quark08:Books:GK-Jobs:GK015-Whistler:Repro:

4/16/2002: Anadarko files to sell a $1 billion mixed shelf offering. Accordingto CBSmarketwatch.com, the company would “offer shares of common andpreferred stock, debt securities, depositary shares, warrants, and purchasecontracts and units.” Anadarko intended to use the proceeds for “general cor-porate purposes.” However, anytime you have an offering, you generally havemore stock, which means added saturation, translating into sluggishness forthe stock price.
Trading an Actual Pair 123
FIGURE 20.2 Pairs Data
GK015-C20[119-132].qxd 6/12/04 2:18 AM Page 123 Quark08 Quark08:Books:GK-Jobs:GK015-Whistler:Repro:
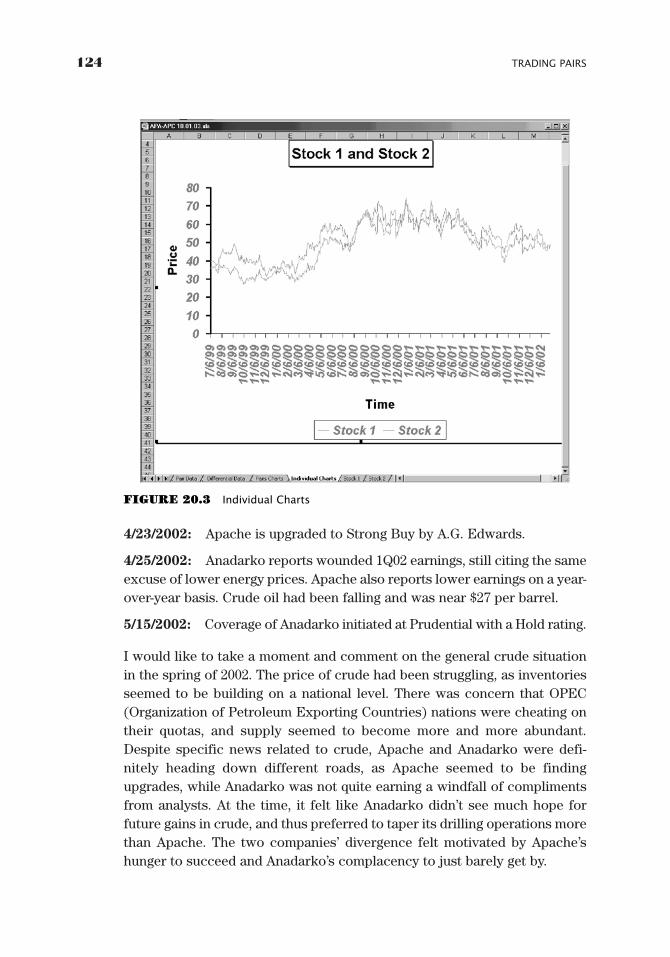
4/23/2002: Apache is upgraded to Strong Buy by A.G. Edwards.
4/25/2002: Anadarko reports wounded 1Q02 earnings, still citing the sameexcuse of lower energy prices. Apache also reports lower earnings on a year-over-year basis. Crude oil had been falling and was near $27 per barrel.
5/15/2002: Coverage of Anadarko initiated at Prudential with a Hold rating.
I would like to take a moment and comment on the general crude situationin the spring of 2002. The price of crude had been struggling, as inventoriesseemed to be building on a national level. There was concern that OPEC(Organization of Petroleum Exporting Countries) nations were cheating ontheir quotas, and supply seemed to become more and more abundant.Despite specific news related to crude, Apache and Anadarko were defi-nitely heading down different roads, as Apache seemed to be findingupgrades, while Anadarko was not quite earning a windfall of complimentsfrom analysts. At the time, it felt like Anadarko didn’t see much hope forfuture gains in crude, and thus preferred to taper its drilling operations morethan Apache. The two companies’ divergence felt motivated by Apache’shunger to succeed and Anadarko’s complacency to just barely get by.
124 TRADING PAIRS
FIGURE 20.3 Individual Charts
GK015-C20[119-132].qxd 6/12/04 2:18 AM Page 124 Quark08 Quark08:Books:GK-Jobs:GK015-Whistler:Repro:
6/17/2002: Anadarko announces that it unearthed gas wells in Louisianaand Texas.
7/10/2002: The price of crude continues to bobble, trading under $27 perbarrel. Halliburton (NYSE: HAL) came under scrutiny about possible account-ing fraud issues. First Albany makes comments that the firm expectedseveral independent oil companies to beat earnings, including Apache.
7/25/2002: Finally, an upgrade for Anadarko by Salomon Smith Barney,which upped the company after it announced that it had beat earnings. How-ever, Anadarko also stated that its second-quarter profit had declined 40 per-cent due to lower natural gas prices. Looking forward, the company loweredits 3Q02 earnings estimates to 60 cents a share, while analysts had previouslybeen anticipating 77 cents. No matter how you slice it, July’s earnings forAnadarko were not all that bright. Apache Oil also reported on the same day,singing tune of lower revenue. However, Apache’s production declined only5 percent year over year. The company went on to state that it was expect-ing its twenty-fifth year of growth, while also focusing efforts on expandingits drilling prospects. Purely from an investor’s perspective in late July, itseemed that Apache’s attitude toward business was aggressive and opti-mistic, while Anadarko’s was complacent and passive. Further divergencewould continue.
9/30/2002: Anadarko Petroleum offers to buy Howell (NYSE: HWL) for$265 million. Anadarko intended on putting $200 million into one of Howell’sWyoming properties to increase reserves by 150 million barrels. In the longrun, this appeared to be a good move by Anadarko; however, in the nearterm, investors smelled cash outlay.
10/24/2002: Apache reports in line with Wall Street estimates at $1 ashare. Though Apache did not blow away investors’ expectations, the silverlining was that the company had drilled 259 wells during the quarter. Evenmore incredible, Apache’s president mentioned that the total expense for the259 wells was the same as what 200 would have cost in 2001. Apache wasbecoming more cost efficient and was taking advantage of higher crudeprices to explore for more energy resources. (EN 20.1)
10/31/2002: Anadarko Petroleum beat earnings and then raised its 2002profit target. However, cash flow declined to $539 million from $735 millionone year earlier.
11/22/2002: In the article “Apache Oil-Drilling’s Outspoken Captain,” byCBSMarketwatch.com’s Lisa Sanders (EN 20.2), the following appeared:“Plank has an avowed distaste for carrying debt. At a time when many
Trading an Actual Pair 125
GK015-C20[119-132].qxd 6/12/04 2:18 AM Page 125 Quark08 Quark08:Books:GK-Jobs:GK015-Whistler:Repro:
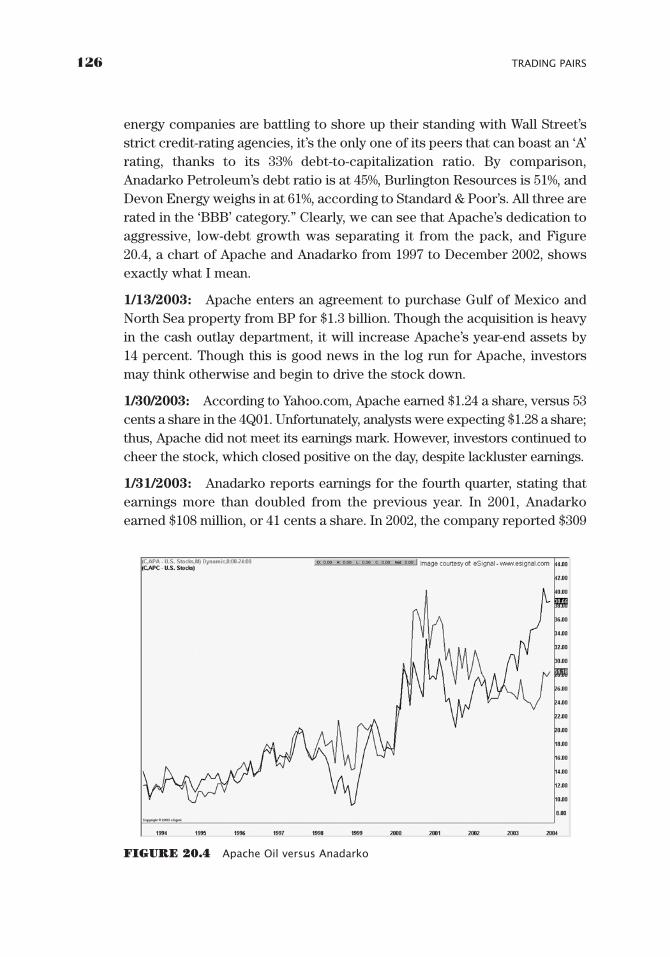
energy companies are battling to shore up their standing with Wall Street’sstrict credit-rating agencies, it’s the only one of its peers that can boast an ‘A’rating, thanks to its 33% debt-to-capitalization ratio. By comparison,Anadarko Petroleum’s debt ratio is at 45%, Burlington Resources is 51%, andDevon Energy weighs in at 61%, according to Standard & Poor’s. All three arerated in the ‘BBB’ category.” Clearly, we can see that Apache’s dedication toaggressive, low-debt growth was separating it from the pack, and Figure20.4, a chart of Apache and Anadarko from 1997 to December 2002, showsexactly what I mean.
1/13/2003: Apache enters an agreement to purchase Gulf of Mexico andNorth Sea property from BP for $1.3 billion. Though the acquisition is heavyin the cash outlay department, it will increase Apache’s year-end assets by 14 percent. Though this is good news in the log run for Apache, investorsmay think otherwise and begin to drive the stock down.
1/30/2003: According to Yahoo.com, Apache earned $1.24 a share, versus 53cents a share in the 4Q01. Unfortunately, analysts were expecting $1.28 a share;thus, Apache did not meet its earnings mark. However, investors continued tocheer the stock, which closed positive on the day, despite lackluster earnings.
1/31/2003: Anadarko reports earnings for the fourth quarter, stating thatearnings more than doubled from the previous year. In 2001, Anadarkoearned $108 million, or 41 cents a share. In 2002, the company reported $309
126 TRADING PAIRS
FIGURE 20.4 Apache Oil versus Anadarko
GK015-C20[119-132].qxd 6/12/04 2:18 AM Page 126 Quark08 Quark08:Books:GK-Jobs:GK015-Whistler:Repro:
million, or roughly $1.20. However, sales volume equaled 197 barrels of oil-equivalent products (including natural gas), down from 199 million barrelsin the prior year. Obviously, higher energy prices helped to bolsterAnadarko’s bottom line. Looking forward, Anadarko mentioned that salesvolume for 2003 would come in 2 million barrels below previous estimatesof 203 million. Anadarko was having production trouble because of theVenezuelan oil workers’ strike. In addition, Anadarko expected first-quarterearnings to come in at $1.15 a share, or 5 cents below the consensus estimate.
Toward the end of January, the United States was urging the United Nationsto seek a resolution that would authorize military action against Iraq, andwar uncertainty was causing the price of oil to rise.
03/18/2003: Coverage is initiated on Apache by Bank of America with aBuy rating.
03/25/2003: CEO John Seitz resigns from Anadarko and is replaced byRobert Allison. Seitz’s resignation came under extreme scrutiny of Anadarko’slagging stock price. However, Seitz’s sudden resignation with little explana-tion spooked investors, who were already concerned with the weak stockprice during times of rising energy prices. In addition, Allison is 64, and thecompany has a mandatory retirement policy at age 65. Speculation thatAnadarko will become a takeover target begins to surface.
I would like to quickly mention that at this time, natural gas was on themove, trading at over $5 per BTU. Geopolitical tensions were causing fossilfuels to find strong gains. Concerning our pair, we can see that divergencewill continue, while Anadarko has internal problems and Apache aggres-sively progresses toward becoming a more profitable company.
4/10/2003: Anadarko is upgraded to Buy at Prudential after the companyincreases its 1Q03 guidance from $1.15 a share to $1.35. However, analystsare still expecting the company to earn $1.48. Earnings per share aside,Anadarko expected $3 per share for cash flow in the first quarter, while theconsensus estimate was $2.96. At this time, the new CEO announces thatthe company expects 5 percent production growth in 2003 and 12 percentgrowth in 2004. Also, he mentions that a 20 percent increase in drillingactivity should result in a 20 percent increase in production volume for thefourth quarter over 1Q03. These are the first positive comments fromAnadarko in a while!
4/24/2003: Apache reports that 1Q03 earnings more than quadrupledbased on strapping oil and gas prices. Apache reported $2.10 a share, versus
Trading an Actual Pair 127
GK015-C20[119-132].qxd 6/12/04 2:18 AM Page 127 Quark08 Quark08:Books:GK-Jobs:GK015-Whistler:Repro:
the expected $2.02. However, the stock drops two points over the next fewdays after investors infer that part of the quarter’s results came from anearnings charge. The stock will not stay down for long, though, as thecompany expects to retire additional debt in the second quarter, giving it adebt-to-capital ratio under 35 percent, the lowest in the entire industry.(EN 20.3)
4/25/2003: Anadarko reports that first-quarter profits have also quadru-pled, with the company earning $1.45 a share, versus the consensus $1.43.Though Anadarko guided higher, investors let the shares slip over the nextmonth on concerns of future falling oil and gas prices. In addition, Anadarkomentions that it expects to earn $1.15 a share in the second quarter, farbelow the consensus estimate of $1.43. However, the company also revealsthat it expects full-year earnings to come in at $5.51, above analysts’ esti-mates of $5.03. The stock will likely go nowhere on this news, as the commoninvestor will probably ask him- or herself: “How can you beat estimates forthe year, when you lowered expectations for the quarter?”
4/30/2003: Anadarko updates its 2003-04 production volume forecastsand states that the company expects 2003 production growth to be about5 percent, and 2004 to come in at 12 percent. CEO Allison makes positivecomments that the company has reduced its drilling expenses by about 40percent in certain areas. Anadarko’s optimistic comments are good for thestock; however, the company still appears as if it has lost its hunger forgrowth.
5/01/2003: Anadarko files to sell $350 million in five-year notes.
5/08/2003: Apache Finance Canada issues $350 million in 12-year notes.Have you noticed some incredible similarities between these two compa-nies yet?
05/23/2003: Apache files to sell $1.5 billion in stock and debt (known as ashelf offering). Apache notes that the proceeds will be used for corporatepurposes like paying down debt. While the move is good for the company, itcan also translate to more supply in the stock and can drive the price lower.
At this time, the war with Iraq was coming to an “official” close, as statedby the White House. There was speculation that the war premium on oilwould begin to evaporate, which would cause oil to lose as much as $4.00 to$5.00, to around $25 per barrel. Crude was trading at around $29 per barrelat the beginning of summer. However, weekly reports by the Energy Infor-mation Agency (EIA) and American Petroleum Institute (API) indicated a
128 TRADING PAIRS
GK015-C20[119-132].qxd 6/12/04 2:18 AM Page 128 Quark08 Quark08:Books:GK-Jobs:GK015-Whistler:Repro:

large divergence in supply levels for the week. Thus, crude was thought tostill have some upside left, as there was still uncertainty in the market.
6/2/2003: Apache announces that the company is auctioning off 32 blocksin 18 western oil fields. The sale is part of Apache’s plan rid itself of propertiesthat can be sold to smaller companies.
6/5/2003: Anadarko announces that the company is raising its second-quarter forecasts and is also upping full-year guidance to $5.77 a share, farabove the consensus estimate of $5.14. However, the company also lowersits 2003 production goals. At the same time, the company receives a down-grade from Merrill Lynch from Buy to Neutral. So much for good news—Anadarko is still in trouble.
6/9/2003: Amerada Hess (NYSE: AHC) announces that it has sold $260million Gulf of Mexico assets to Anadarko.
6/24/2003: Apache announces that it will no longer have its natural gasmarketed by Cinergy (NYSE: CIN) and will now take over its own marketing.
At this time, natural gas is over $6 per BTU, almost double where the pricewas in 2000.
6/30/2003: Tropical Storm Bill passes and does not affect the productionof Anadarko’s Gulf of Mexico’s operations—a great break for Anadarko.However, the price of oil continues to stay high, as an oil strike in Nigeriagives investors more concern about supply issues.
7/11/2003: Gulf Storm Claudette causes Anadarko to evacuate some per-sonnel from platforms, and eventually causes it to shut down 10 percent ofits Gulf production. Claudette passes and operations are back to normal bythe latter half of the month.
7/24/2003: Apache reports second-quarter earnings; the company dis-closes $1.76 a share, topping analyst estimates of $1.74. However, the com-pany added in a one-time charge due to the weaker dollar; thus, the stockcame under selling pressure after investors realize that the company reallyearned only $1.49 a share. The charge amounted to approximately $45 mil-lion in unrealized currency losses. Though investors were disappointed withthe immediate outcome of earnings, Apache is still on track to higher produc-tion targets.
7/29/2003: Anadarko announces that it will begin shutting down somerigs to make sure it stays within its allotted 2003 budget. Didn’t the com-pany say in April that it had cut its drilling expenses by 40 percent in some
Trading an Actual Pair 129
GK015-C20[119-132].qxd 6/12/04 2:18 AM Page 129 Quark08 Quark08:Books:GK-Jobs:GK015-Whistler:Repro:
areas? I guess this wasn’t one of them. Expect more divergence from thetwo stocks.
7/31/2003: In a further effort to trim costs, Anadarko announces that it iscutting 400 jobs and is closing some of its offices in Texas. The cost-cuttingmove is anticipated to save $100 million a year. One third of the jobs arebeing cut in the company’s exploration and production division, with therest of the jobs being slashed in departments that support the aforemen-tioned unit. As a result, Bank of America downgrades the stock from Buy toNeutral, citing growth concerns for 2004 production. Anadarko also reportssecond-quarter earnings of $1.20 a share, below the consensus estimate of$1.25. In addition, the company trims its full-year guidance to $5.17 a share,down from $5.77. Remember on 4/25/2003, when we mentioned that thecommon investor might be asking him/herself: “How can you beat estimatesfor the year, when you lowered expectations for the quarter?” Well, the com-mon (or should we say commonsense) investor was right.
At this time, speculation that Anadarko is for sale is gaining momentum. TheCEO won’t deny any possible takeover rumors of Anadarko. Analysts arealso estimating that the company is worth only a price in the low $50s (as in$50 per share), as the bulk of Anadarko’s assets are in the United States, andthe company has roughly $5 billion in debt. However, with over 2 millionbarrels of proved oil and natural gas reserves, Anadarko would be a greatasset to buy . . . and then tear apart.
8/15/2003: Apache announces that the company is shutting down severalplatform valves in western Gulf of Mexico due to Tropical Storm Erika.
8/16/2003: Apache returns workers to rigs one day after evacuation; nodamages are incurred, just production losses.
There is speculation that Anadarko is talking to Italian firm Eni about a pos-sible sale. Takeover rumors generally drive a stock price up. Also, Anadarkomentions that recent cost cutting has freed up capital to spend on explo-ration and development. The extra cash the company is talking about camefrom eliminating part of its exploration and development division and thejobs that support it. However, the company also attributes lower costs todiscoveries and profitable developments.
9/12/2003: Apache announces that the stock will split 2 for 1 early in 2004and that it is increasing its dividend from 10 cents to 12 cents, payable onNovember 21 to shareholders on record October 22.
130 TRADING PAIRS
GK015-C20[119-132].qxd 6/12/04 2:18 AM Page 130 Quark08 Quark08:Books:GK-Jobs:GK015-Whistler:Repro:
9/21/2003: The Sunday Financial Times reports that Royal Dutch/ShellGroup is thinking about a $19.5 billion bid for Anadarko. Credit Suisse FirstBoston has been hired as the official negotiator for a possible deal.
9/25/2003: In response to an article earlier in the week by the Financial
Times, Eni publicly announces that it is not in a partnership with RoyalDutch/Shell to purchase Anadarko.
And that brings us to where we are now—looking for a trade in this pair. Wehave to ask ourselves, why would this be the time when these two stockshave finally reached the maximum point of expansion, and what would drivethem back together? When we review all of the events over the last two years,we can see why the two have diverged as much as they have. Apache hasbeen a strong company, aggressively trying to expand its drilling operations,while paying down debt. Anadarko would like to do the same thing, but as amuch larger company, it has had trouble gaining its footing. In addition,Anadarko has been fighting to keep investors happy with the stock, while try-ing to restructure the company to a more profitable entity. It would be a greatsurprise for Apache’s stock to decline in the future, unless analysts orinvestors begin to view the stock as being overvalued. If the price of oil dropsdramatically, the stock would fall, but then again, so would Anadarko’s. Inshort, we are looking for an opportunity where Apache is overbought, whileAnadarko is able to either solidify a merger or post some sort of decent newsthat shows the company is trying to do more than just hold onto its provenreserves.
You may be asking yourself: Why all of that? Why write all of the majorevents for both of these two companies for two years? Because when Iinvest money, I want to be sure I know what’s going on in both the past andpresent. And this is the type of historical news and earnings research I do onall my pairs. The great part is that I will trade Apache/Anadarko again in thefuture, and because of my notes, the bulk of the research will have alreadybeen done. All I will need to do is update my files, check current events andearnings, update my spreadsheet, and factor in both technical and funda-mental analysis—and I will be ready to trade. This may seem like a ton ofwork even for an updated pair, but we want to know everything that is goingfor or against us when we trade. Why leave any stone unturned?
Trading an Actual Pair 131
GK015-C20[119-132].qxd 6/12/04 2:18 AM Page 131 Quark08 Quark08:Books:GK-Jobs:GK015-Whistler:Repro:

GK015-C20[119-132].qxd 6/12/04 2:18 AM Page 132 Quark08 Quark08:Books:GK-Jobs:GK015-Whistler:Repro:
133
UNDERSTANDING WHERE THE PAIR IS NOW
Let’s look at both of the companies now. We will make a checklist of whatwe are examining. We will look at:
• Fundamentals• Earnings• Technical Analysis• Statistics• Summary
Now that we have a plan, let’s start with Apache Oil.
CHAPTER 21
The CurrentSetup
Understanding Where the Pair
Is Now
Apache Oil1, Fundamentals,
Earnings, Technical Analysis,
Statistics, Summary
Anadarko Petroleum
Fundamentals
Earnings, Technical Analysis,
Statistics, Summary
1Note: All charts for Apache Oil reflect post split prices, though the text includes pre-split numbers(the stock split 2-for-1 on January 15, 2004 after the text was written).
GK015-C21[133-142].qxd 6/10/04 7:36 PM Page 133 Virender Negi Quark07:BOOKS:GK015-Whistler:Quark files:
APACHE OIL1
Fundamentals
Unless noted otherwise all numbers are from Yahoo.com.To begin, the stock is trading with a price-to-earnings (PE) ratio of 13,
and a forward PE of 12. The difference between a regular PE (known as atrailing PE) and a forward PE is that a regular PE takes into considerationthe last four quarters of earnings. A forward PE looks at the earnings esti-mates for the next four quarters that have yet to happen. Thus, we canassume that Apache is trading at 13 times earnings now, and will be almostthe same in the next year. The industry average PE is 18; thus, on a valuationbasis, our company is trading at fewer times earnings than its competitors.PEG (PE to growth) is 1.7, while the industry average is 1.5. The result hereis that the market is expecting the earnings growth for Apache to be slightlygreater than the industry average. While a PEG number above one indicatesthat the stock could be overvalued, Apache is not in this case, as the indus-try average is also greater than one. One quick point to note: I double-checked the PEG ratio on Smartmoney.com, which lists a PEG of 0.9. If thisnumber is correct, then Apache is actually undervalued. The problem withforward-looking numbers is that different sources use different growth num-bers. This is exactly the case in this situation. My general rule of thumb is toaverage the two numbers. In this case, it would be 1.3, a reasonable forward-looking number, but not completely accurate. However, more diligent investorscan figure out what the PEG is by using the information in Chapter 3.
Next, Apache is trading at 3.3 times sales, while the industry average is1.8. This number is concerning, and indicates that the company might be a lit-tle top heavy in regard to revenue, which is good considering that we arethinking about shorting the stock. Next, the book value of the stock is $36;thus, the stock is trading at 1.9 times book. Obviously, the actual value of thestock is less than the stock itself. Just for a refresher, book value is the netasset value of the company, minus intangible assets and liabilities. (EN 21.1)We will wait to see what Anadarko’s book value is and compare the two. Thecurrent ratio is 1.3, indicating that if disaster struck, the company would beable to pay its bills 1.3 times over, before it runs out of current (liquid) assets.
Apache is reasonably valued at the current price, but may be getting alittle top heavy in regard to future earnings. The stock can ascend only sofar before institutional investors stop and ask themselves if the price isworth the risk. Long-term holders will not exit the stock unless fundamentals
134 TRADING PAIRS
GK015-C21[133-142].qxd 6/10/04 7:36 PM Page 134 Virender Negi Quark07:BOOKS:GK015-Whistler:Quark files:
erode, which is not likely. So from a fundamental basis, we are counting onshorter-term money to sell the stock based on valuation. These types of insti-tutional investors use a combination of market timing and fundamental val-uation to protect profits while occasionally trading in and out of positions.
Earnings
In the second quarter, Apache reported earnings of $243 million, or $1.49 ashare, up from $143 million, or 0.95 cents in the prior year. However, the com-pany missed analyst expectations of $1.74 a share. Excluding charges, thecompany beat by two pennies, but in real terms, the company missed. Thecompany cited fluctuations in foreign currencies as the cause for the short-fall; however, in the real world, things like currencies always fluctuate. Whatis important is that oil production rose by 40 percent in the quarter, while nat-ural gas production leaped 15 percent. The company stated: “We had signifi-cant drilling successes and we have completed $1.5 billion in acquisitionsyear-to-date, the impact of which will be reflected in future quarters.” (EN21.2) Despite the optimistic view from the CEO, the company’s one-timecharge of $45 million—attributed to currency fluctuations—was due to aweaker U.S. dollar. This is significant because recently several Asian coun-tries announced that they would stop artificially supporting the U.S. dollar tokeep their currencies down. The reason Asian countries have been doing thisis that when their currencies are low relative to the dollar, then they exportmore, which brings additional money into their countries. More exportingmeans increased manufacturing, which means more jobs overall. Thus, with-out artificial support propping the greenback up, the U.S. dollar is destined tofall lower in the near term. We know from the second quarter that a weakerdollar is bad for Apache. Do you see where I am going? We can generallyassume that the company will have the same type of “charge” in the thirdquarter, unless the company has instituted some sort of currency hedge.However, considering that the Asian currency announcement occurred inSeptember, we can assume Apache probably didn’t see it coming. Thus, forthe third quarter, I will bet that the company will miss estimates (aftercharges) again. And the company reports on October 23, just a few weeksfrom when this is being written. If I am correct, than the missed earnings willhelp the short side of our pair commence its decline. And none too soon!
Technical Analysis
Looking at the one-year chart for Apache (Figure 21.1), we can see severalthings. First, the stock is trading near resistance, which it has tested three
The Current Setup 135
GK015-C21[133-142].qxd 6/10/04 7:36 PM Page 135 Virender Negi Quark07:BOOKS:GK015-Whistler:Quark files:
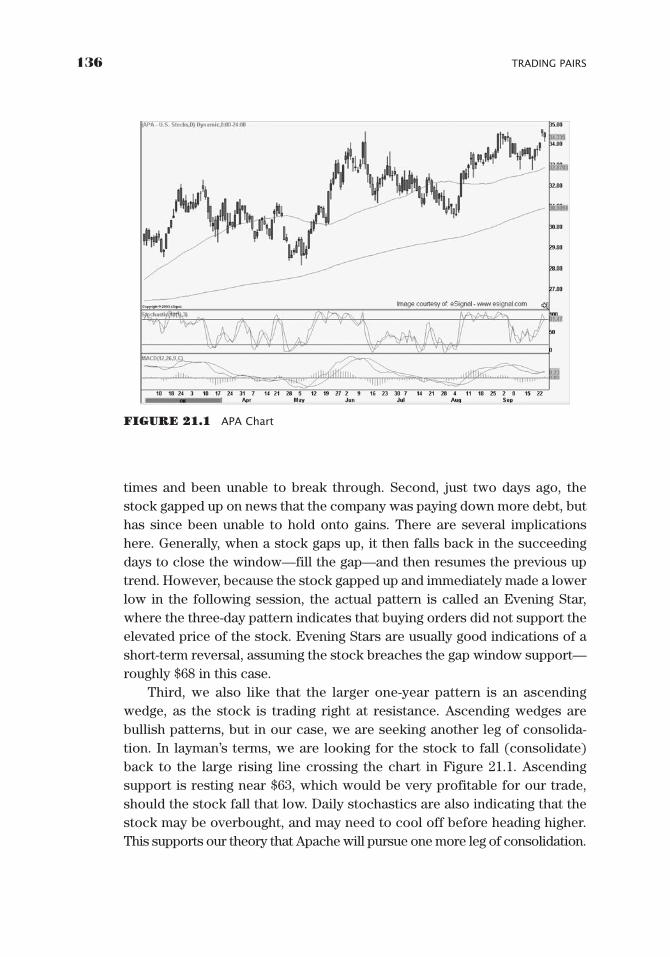
times and been unable to break through. Second, just two days ago, thestock gapped up on news that the company was paying down more debt, buthas since been unable to hold onto gains. There are several implicationshere. Generally, when a stock gaps up, it then falls back in the succeedingdays to close the window—fill the gap—and then resumes the previous uptrend. However, because the stock gapped up and immediately made a lowerlow in the following session, the actual pattern is called an Evening Star,where the three-day pattern indicates that buying orders did not support theelevated price of the stock. Evening Stars are usually good indications of ashort-term reversal, assuming the stock breaches the gap window support—roughly $68 in this case.
Third, we also like that the larger one-year pattern is an ascendingwedge, as the stock is trading right at resistance. Ascending wedges arebullish patterns, but in our case, we are seeking another leg of consolida-tion. In layman’s terms, we are looking for the stock to fall (consolidate)back to the large rising line crossing the chart in Figure 21.1. Ascendingsupport is resting near $63, which would be very profitable for our trade,should the stock fall that low. Daily stochastics are also indicating that thestock may be overbought, and may need to cool off before heading higher.This supports our theory that Apache will pursue one more leg of consolidation.
136 TRADING PAIRS
FIGURE 21.1 APA Chart
GK015-C21[133-142].qxd 6/10/04 7:36 PM Page 136 Virender Negi Quark07:BOOKS:GK015-Whistler:Quark files:
One trouble spot is the moving average convergence divergence (MACD),which has just witnessed a bullish crossover. We do not like this event andwould like to see the 12-day moving average (12-DMA) quickly fall backbeneath the 26-DMA. Given that the last two days have declined, and thatMACD is a trailing indicator, it would be fair to assume the 12-DMA will decline.
Statistics
To bring the statistics as current in our spreadsheet, we will need to updateour data through the close of September 26 for both stocks. Also, all of thespreadsheets for each day of the trading diary are located on the CD-ROMin the back of the book. I encourage you to pull up the spreadsheets onyour computer and sift through the data as each day passes. After all, theentire trading diary is meant to be a “hands-on” experience to unveil themystery of pairs.
Looking at the Main portion of our spreadsheet, we see that the pair ispresently trading above two standard deviations on the sell side at 26.72. Inaddition, the ratio is also above two standard deviations at 1.64. However,we also see that the pair has gained risk over the last two years, as it is nowtrading with a correlation of 0.59.
In the Pair Data portion of the sheet, the density curve is the key to ourtrade. Over the past several years, the density curve has been slowly open-ing up and is now at 0.994. My concern for the sake of the book is that I willnot get a sell signal before my publishing date. What’s more, if the densitycurve wobbles in this area for the next three weeks and then we do get a sig-nal, there may not be enough time before November 14 to allow the pairroom to collapse. Though there are many risks here, my instincts tell menow that the density curve is above 0.990—after several years of diver-gence—we should get a signal fairly soon. Looking at our pairs charts, weimmediately recognize the divergence that has occurred over the last fewyears. As a side note, you can also see how, if we had been on the ball fun-damentally, we could have traded the divergence of these two stocks overthe past few years. However, divergence is generally not measurable by sta-tistics, as when a pair is trading on the mean, it can go either way. Statisti-cally, our odds are no better trading the pair either way. Thus, when seekingdivergence trades, we must be fully aware of the fundamental events that aretranspiring. In short, convergence trading balances statistical odds againstfundamental information, while divergence trading—from the mean—doesnot have the added benefit of trading on the outlying standard deviations.
The Current Setup 137
GK015-C21[133-142].qxd 6/10/04 7:36 PM Page 137 Virender Negi Quark07:BOOKS:GK015-Whistler:Quark files:
Summary
We haven’t unearthed any information indicating that Apache is anunhealthy company by any means. It is important to distinguish this point inour pairs trading mentality. On the contrary, the information we have foundsimply indicates that Apache has been extremely strong over the last twoyears. What we are looking for is an overvalued situation that will present apullback for us to take advantage of as the stock falls to more reasonablelevels. Thus, it is crucial to understand that by considering shorting thisstock, we are going against the grain of “trading with the trend.” We are con-trarians and consequently have more risk. Our risk comes from the fact thatwe are trying to short a strong stock; we are in essence trying to pick a near-term top. Even with proper due diligence, this can be a losing battle simplybecause of investor’s emotions. Overall, people prefer to buy stocks thanshort them—after all, many investors don’t even know how to short a stock.The point I am trying to get across here is that even though we are trying toimplement a hedge, we have considerable risk ahead. I know this is simplyredundant rhetoric; I just want to make it extremely clear that we are bettingagainst the flow of each stock.
The crux of our summary is that Apache is starting to look a little topheavy fundamentally, statistically, and technically. There is no doubt inmy mind that the stock can go higher, but in the near term it’s due for apullback.
ANADARKO PETROLEUM
Fundamentals
We will begin with a little overview of Anadarko. The company is much largerthan Apache, with balance sheet assets over $20 billion as of June 30. This com-pany is almost twice the size of Apache in terms of financial statement assets.
Looking at fundamentals, the company has a PE ratio of 9 and a PEG of0.86. While these numbers aren’t exactly sparkling, they aren’t exactlytreacherous either. Just to start, we have to be encouraged at the funda-mental numbers that Anadarko is posting. Both numbers are lower thanApache’s, which is what we would like to see for our trade. What’s more, thecompany has a price to sales of 2.2, and a price to book of 1.4. Figure 21.2show Anadarko’s fundamentals according to Yahoo.com.
Going over the numbers that we have just mentioned, we can assumethat the company is fairly valued at present levels and is poised for gains,
138 TRADING PAIRS
GK015-C21[133-142].qxd 6/10/04 7:36 PM Page 138 Virender Negi Quark07:BOOKS:GK015-Whistler:Quark files:
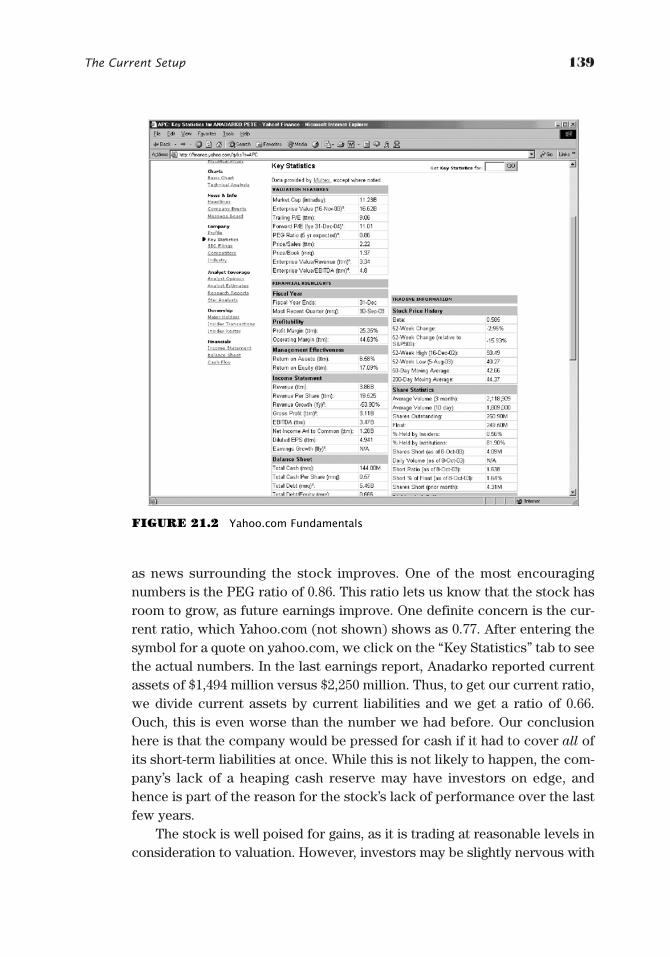
as news surrounding the stock improves. One of the most encouragingnumbers is the PEG ratio of 0.86. This ratio lets us know that the stock hasroom to grow, as future earnings improve. One definite concern is the cur-rent ratio, which Yahoo.com (not shown) shows as 0.77. After entering thesymbol for a quote on yahoo.com, we click on the “Key Statistics” tab to seethe actual numbers. In the last earnings report, Anadarko reported currentassets of $1,494 million versus $2,250 million. Thus, to get our current ratio,we divide current assets by current liabilities and we get a ratio of 0.66.Ouch, this is even worse than the number we had before. Our conclusionhere is that the company would be pressed for cash if it had to cover all ofits short-term liabilities at once. While this is not likely to happen, the com-pany’s lack of a heaping cash reserve may have investors on edge, andhence is part of the reason for the stock’s lack of performance over the lastfew years.
The stock is well poised for gains, as it is trading at reasonable levels inconsideration to valuation. However, investors may be slightly nervous with
The Current Setup 139
FIGURE 21.2 Yahoo.com Fundamentals
GK015-C21[133-142].qxd 6/10/04 7:36 PM Page 139 Virender Negi Quark07:BOOKS:GK015-Whistler:Quark files:
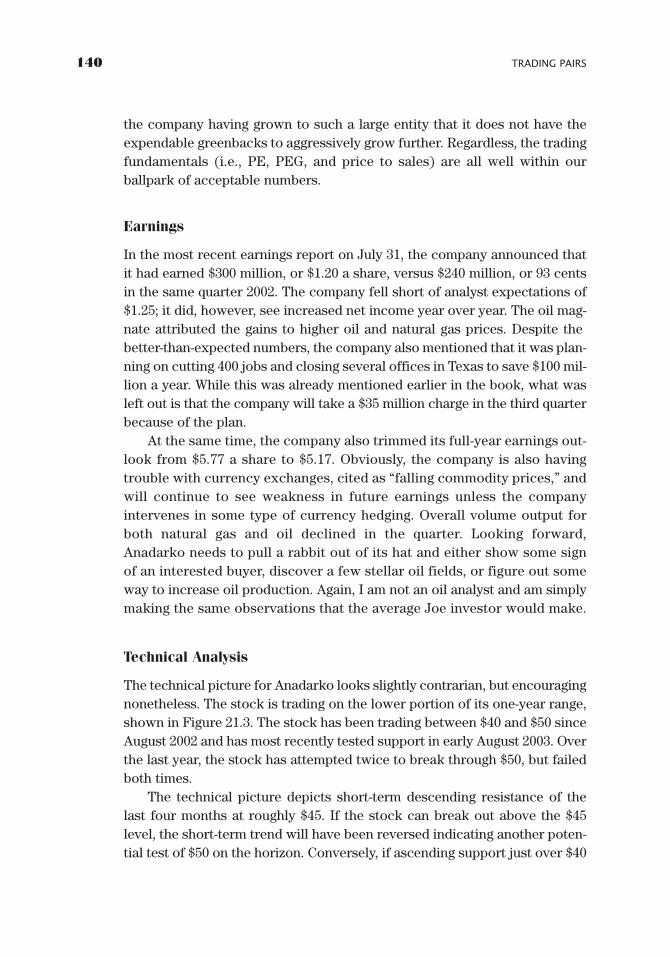
the company having grown to such a large entity that it does not have theexpendable greenbacks to aggressively grow further. Regardless, the tradingfundamentals (i.e., PE, PEG, and price to sales) are all well within ourballpark of acceptable numbers.
Earnings
In the most recent earnings report on July 31, the company announced thatit had earned $300 million, or $1.20 a share, versus $240 million, or 93 centsin the same quarter 2002. The company fell short of analyst expectations of$1.25; it did, however, see increased net income year over year. The oil mag-nate attributed the gains to higher oil and natural gas prices. Despite thebetter-than-expected numbers, the company also mentioned that it was plan-ning on cutting 400 jobs and closing several offices in Texas to save $100 mil-lion a year. While this was already mentioned earlier in the book, what wasleft out is that the company will take a $35 million charge in the third quarterbecause of the plan.
At the same time, the company also trimmed its full-year earnings out-look from $5.77 a share to $5.17. Obviously, the company is also havingtrouble with currency exchanges, cited as “falling commodity prices,” andwill continue to see weakness in future earnings unless the companyintervenes in some type of currency hedging. Overall volume output forboth natural gas and oil declined in the quarter. Looking forward,Anadarko needs to pull a rabbit out of its hat and either show some signof an interested buyer, discover a few stellar oil fields, or figure out someway to increase oil production. Again, I am not an oil analyst and am simplymaking the same observations that the average Joe investor would make.
Technical Analysis
The technical picture for Anadarko looks slightly contrarian, but encouragingnonetheless. The stock is trading on the lower portion of its one-year range,shown in Figure 21.3. The stock has been trading between $40 and $50 sinceAugust 2002 and has most recently tested support in early August 2003. Overthe last year, the stock has attempted twice to break through $50, but failedboth times.
The technical picture depicts short-term descending resistance of thelast four months at roughly $45. If the stock can break out above the $45level, the short-term trend will have been reversed indicating another poten-tial test of $50 on the horizon. Conversely, if ascending support just over $40
140 TRADING PAIRS
GK015-C21[133-142].qxd 6/10/04 7:36 PM Page 140 Virender Negi Quark07:BOOKS:GK015-Whistler:Quark files:
and horizontal support (not pictured) at the $40 whole number is broken, wemay then want to close both sides of our position. Next, the slow stochastichas been hovering near the overbought region and may now be indicatingthat some additional profit taking is on the horizon. The MACD appears tohave been consolidating near the 0 line and has now started to edge higher.Overall, the technical picture is good for our stock; we are trying to buy nearsupport with a tight stop just below the whole number. The MACD hasrecently turned up and the stock is close to breaking a short-term trend linethat, if breached, would bring momentum traders in off the fence. I like thetechnical setup—though not exactly a typical bullish chart, but good for ourpairs trading format.
Statistics
Refer to the statistics for Apache Oil on page 137.
Summary
The fundamental picture for Anadarko looks good; the stock is trading withfundamentals that support the current price and possible gains in the future.
The Current Setup 141
FIGURE 21.3 Anadarko Trading Range
GK015-C21[133-142].qxd 6/10/04 7:37 PM Page 141 Virender Negi Quark07:BOOKS:GK015-Whistler:Quark files:
Most encouraging is the PEG ratio, which alludes to growth on the horizon.Earnings were decent due to higher oil and crude prices, and the company’srestructuring program (including job cuts) will save money in the future.However, I am concerned that volumes for both natural gas and oil both fellin the second quarter and thus, have concerns about production growth. Thecompany is obviously looking for a merger, which will be a positive if itsurfaces, but is not something we can count on. The technical picture isgood for our setup, as the stock is trading on the lower portion of the range,with a clear stop at the $40 whole number. Overall, the setup is ideal for thistrade and is encouraging with the current statistical data as well.
142 TRADING PAIRS
GK015-C21[133-142].qxd 6/10/04 7:37 PM Page 142 Virender Negi Quark07:BOOKS:GK015-Whistler:Quark files:
143
CHAPTER 22
Trading Diary1
Friday, September 26
As you already know, I have just come across this pair and found that it maypresent some interesting opportunity in the near future. You may be askingyourself how I found the pair to begin with? I have a spreadsheet with over200 pairs that I check every day. The sheet updates itself with a macro I hadprogrammed that self-extracts data from Yahoo.com. While this portion ofthe program is proprietary and not available in this book, it should not stopyou from finding great pairs. In fact, the macro is a recent addition to my trad-ing, and only several months ago, I would scan charts each night to find pos-sible pairs divergences. What I do is keep a running “watch list” of pairs thatare beginning to separate with their correlations. Then, instead of scanning200 charts a night, I can look through only 50 or so. When I hear news abouttwo related stocks that may have diverged, I put them on the watch list andkeep a close eye on them. What’s more, every two weeks I go through my entirepairs universe of about 400 stocks to find possible convergence setups or fun-damental events that could lead to additional divergence. In my scans, I ranacross Apache/Anadarko, a pair that I have not traded in a long, long time.Obviously, I was not on board for the divergence (though I wish I had been) andam now trying to find a point where the rubber band will cease expanding.
Initially, I like the technical picture (see Figure 22.1) of the two stocksand the divergence that has occurred. Fundamentally, it feels like Apache isgetting top heavy, while Anadarko has been suppressed because of managerial
1Note: All charts for Apache Oil reflect post split prices, though the text includes pre-split numbers(the stock split 2-for-1 on January 15, 2004 after the text was written).
GK015-C22[143-186].qxd 6/10/04 7:37 PM Page 143 Virender Negi Quark07:BOOKS:GK015-Whistler:Quark files:
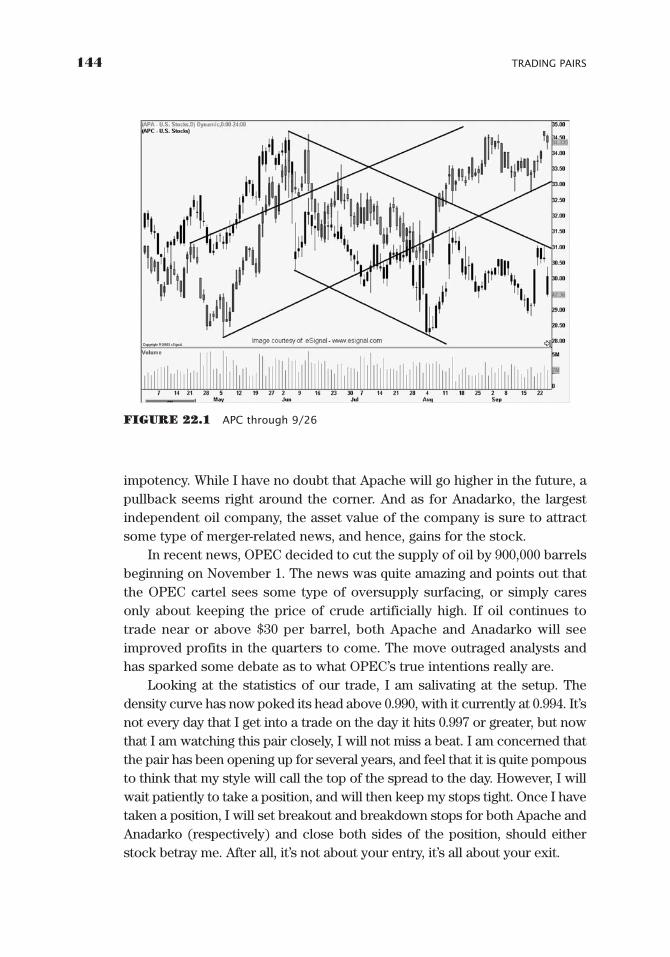
144 TRADING PAIRS
FIGURE 22.1 APC through 9/26
impotency. While I have no doubt that Apache will go higher in the future, apullback seems right around the corner. And as for Anadarko, the largestindependent oil company, the asset value of the company is sure to attractsome type of merger-related news, and hence, gains for the stock.
In recent news, OPEC decided to cut the supply of oil by 900,000 barrelsbeginning on November 1. The news was quite amazing and points out thatthe OPEC cartel sees some type of oversupply surfacing, or simply caresonly about keeping the price of crude artificially high. If oil continues totrade near or above $30 per barrel, both Apache and Anadarko will seeimproved profits in the quarters to come. The move outraged analysts andhas sparked some debate as to what OPEC’s true intentions really are.
Looking at the statistics of our trade, I am salivating at the setup. Thedensity curve has now poked its head above 0.990, with it currently at 0.994. It’snot every day that I get into a trade on the day it hits 0.997 or greater, but nowthat I am watching this pair closely, I will not miss a beat. I am concerned thatthe pair has been opening up for several years, and feel that it is quite pompousto think that my style will call the top of the spread to the day. However, I willwait patiently to take a position, and will then keep my stops tight. Once I havetaken a position, I will set breakout and breakdown stops for both Apache andAnadarko (respectively) and close both sides of the position, should eitherstock betray me. After all, it’s not about your entry, it’s all about your exit.
GK015-C22[143-186].qxd 6/10/04 7:37 PM Page 144 Virender Negi Quark07:BOOKS:GK015-Whistler:Quark files:
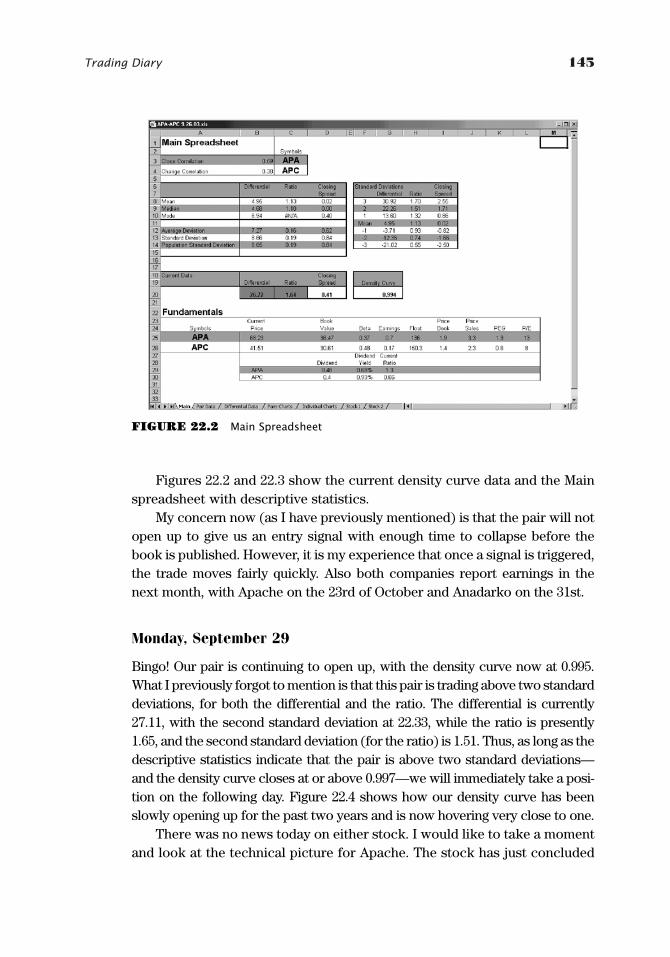
Trading Diary 145
Figures 22.2 and 22.3 show the current density curve data and the Mainspreadsheet with descriptive statistics.
My concern now (as I have previously mentioned) is that the pair will notopen up to give us an entry signal with enough time to collapse before thebook is published. However, it is my experience that once a signal is triggered,the trade moves fairly quickly. Also both companies report earnings in thenext month, with Apache on the 23rd of October and Anadarko on the 31st.
Monday, September 29
Bingo! Our pair is continuing to open up, with the density curve now at 0.995.What I previously forgot to mention is that this pair is trading above two standarddeviations, for both the differential and the ratio. The differential is currently27.11, with the second standard deviation at 22.33, while the ratio is presently1.65, and the second standard deviation (for the ratio) is 1.51. Thus, as long as thedescriptive statistics indicate that the pair is above two standard deviations—and the density curve closes at or above 0.997—we will immediately take a posi-tion on the following day. Figure 22.4 shows how our density curve has beenslowly opening up for the past two years and is now hovering very close to one.
There was no news today on either stock. I would like to take a momentand look at the technical picture for Apache. The stock has just concluded
FIGURE 22.2 Main Spreadsheet
GK015-C22[143-186].qxd 6/10/04 7:37 PM Page 145 Virender Negi Quark07:BOOKS:GK015-Whistler:Quark files:
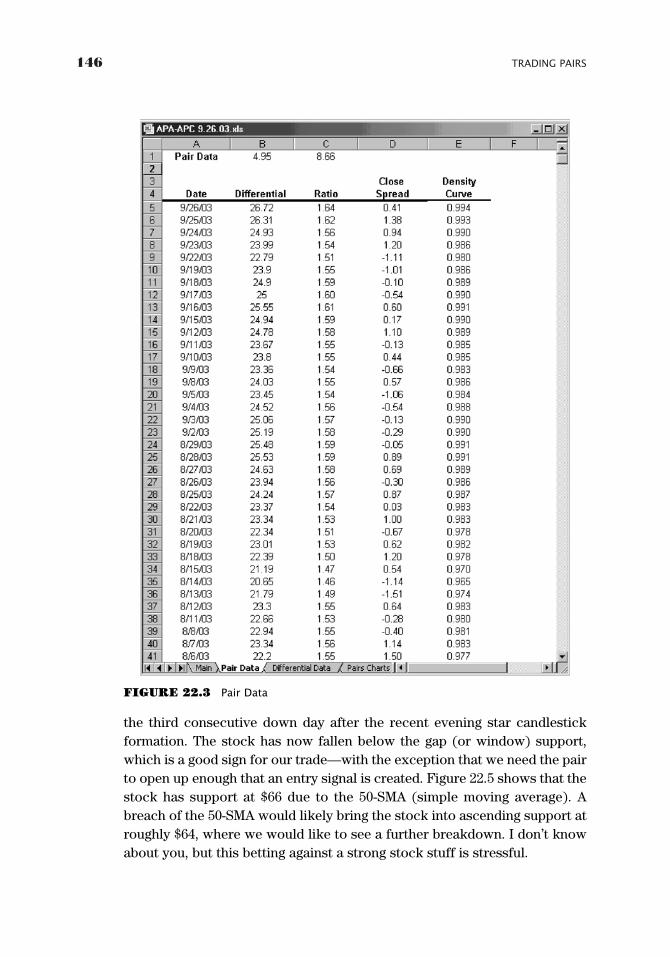
146 TRADING PAIRS
the third consecutive down day after the recent evening star candlestickformation. The stock has now fallen below the gap (or window) support,which is a good sign for our trade—with the exception that we need the pairto open up enough that an entry signal is created. Figure 22.5 shows that thestock has support at $66 due to the 50-SMA (simple moving average). Abreach of the 50-SMA would likely bring the stock into ascending support atroughly $64, where we would like to see a further breakdown. I don’t knowabout you, but this betting against a strong stock stuff is stressful.
FIGURE 22.3 Pair Data
GK015-C22[143-186].qxd 6/10/04 7:37 PM Page 146 Virender Negi Quark07:BOOKS:GK015-Whistler:Quark files:
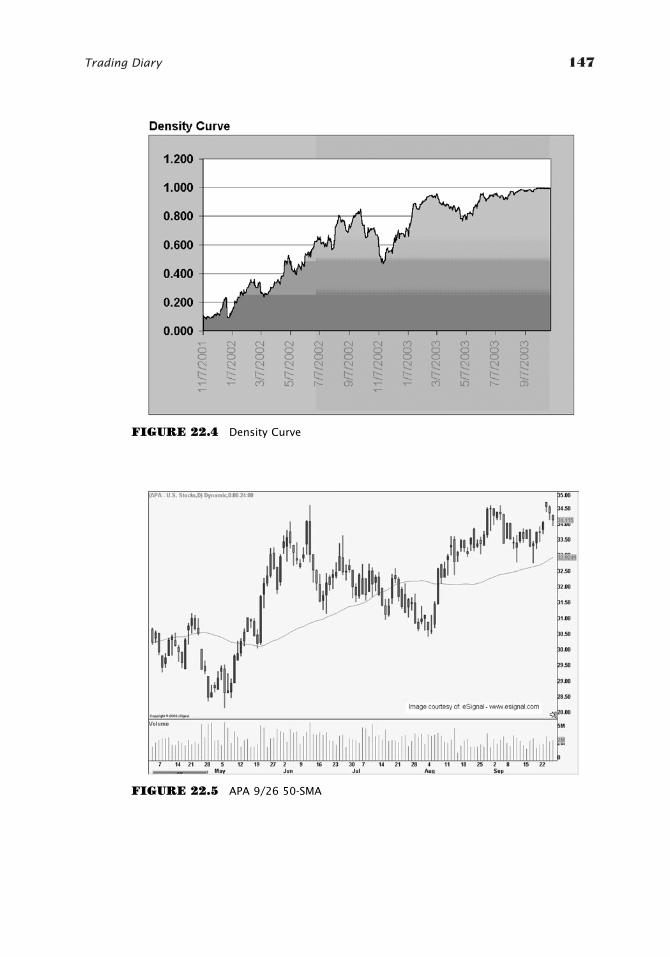
Trading Diary 147
FIGURE 22.4 Density Curve
FIGURE 22.5 APA 9/26 50-SMA
GK015-C22[143-186].qxd 6/10/04 7:37 PM Page 147 Virender Negi Quark07:BOOKS:GK015-Whistler:Quark files:
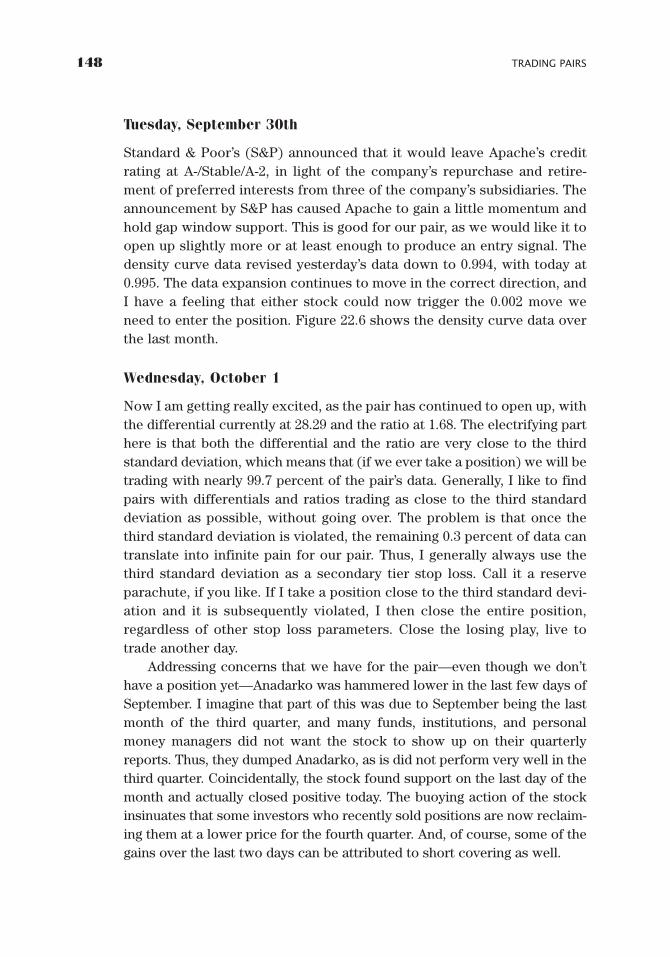
148 TRADING PAIRS
Tuesday, September 30th
Standard & Poor’s (S&P) announced that it would leave Apache’s creditrating at A-/Stable/A-2, in light of the company’s repurchase and retire-ment of preferred interests from three of the company’s subsidiaries. Theannouncement by S&P has caused Apache to gain a little momentum andhold gap window support. This is good for our pair, as we would like it toopen up slightly more or at least enough to produce an entry signal. Thedensity curve data revised yesterday’s data down to 0.994, with today at0.995. The data expansion continues to move in the correct direction, andI have a feeling that either stock could now trigger the 0.002 move weneed to enter the position. Figure 22.6 shows the density curve data overthe last month.
Wednesday, October 1
Now I am getting really excited, as the pair has continued to open up, withthe differential currently at 28.29 and the ratio at 1.68. The electrifying parthere is that both the differential and the ratio are very close to the thirdstandard deviation, which means that (if we ever take a position) we will betrading with nearly 99.7 percent of the pair’s data. Generally, I like to findpairs with differentials and ratios trading as close to the third standarddeviation as possible, without going over. The problem is that once thethird standard deviation is violated, the remaining 0.3 percent of data cantranslate into infinite pain for our pair. Thus, I generally always use thethird standard deviation as a secondary tier stop loss. Call it a reserveparachute, if you like. If I take a position close to the third standard devi-ation and it is subsequently violated, I then close the entire position,regardless of other stop loss parameters. Close the losing play, live totrade another day.
Addressing concerns that we have for the pair—even though we don’thave a position yet—Anadarko was hammered lower in the last few days ofSeptember. I imagine that part of this was due to September being the lastmonth of the third quarter, and many funds, institutions, and personalmoney managers did not want the stock to show up on their quarterlyreports. Thus, they dumped Anadarko, as is did not perform very well in thethird quarter. Coincidentally, the stock found support on the last day of themonth and actually closed positive today. The buoying action of the stockinsinuates that some investors who recently sold positions are now reclaim-ing them at a lower price for the fourth quarter. And, of course, some of thegains over the last two days can be attributed to short covering as well.
GK015-C22[143-186].qxd 6/10/04 7:37 PM Page 148 Virender Negi Quark07:BOOKS:GK015-Whistler:Quark files:
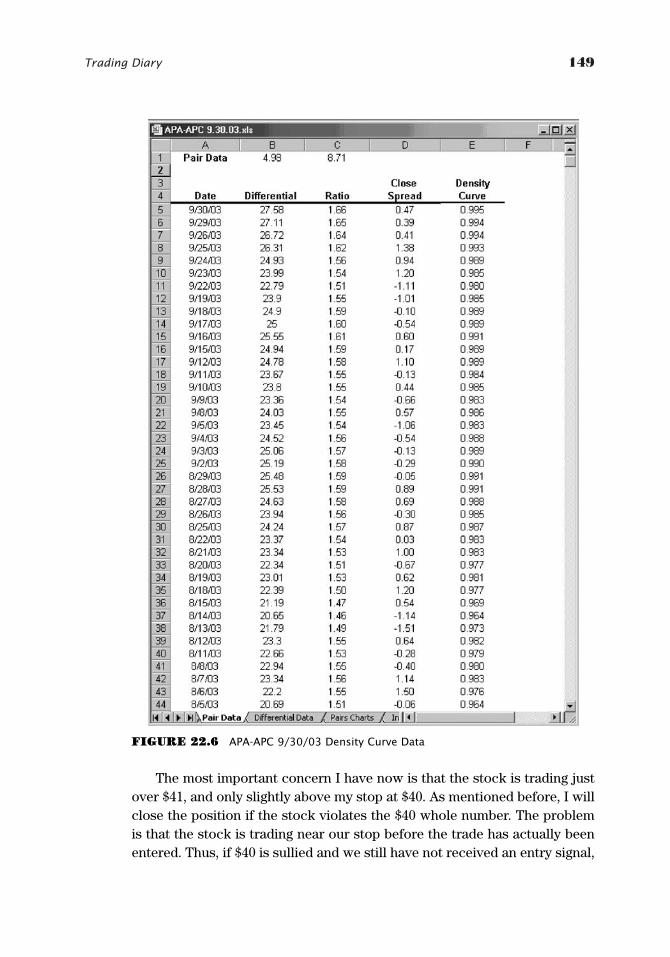
Trading Diary 149
FIGURE 22.6 APA-APC 9/30/03 Density Curve Data
The most important concern I have now is that the stock is trading justover $41, and only slightly above my stop at $40. As mentioned before, I willclose the position if the stock violates the $40 whole number. The problemis that the stock is trading near our stop before the trade has actually beenentered. Thus, if $40 is sullied and we still have not received an entry signal,
GK015-C22[143-186].qxd 6/10/04 7:37 PM Page 149 Virender Negi Quark07:BOOKS:GK015-Whistler:Quark files:
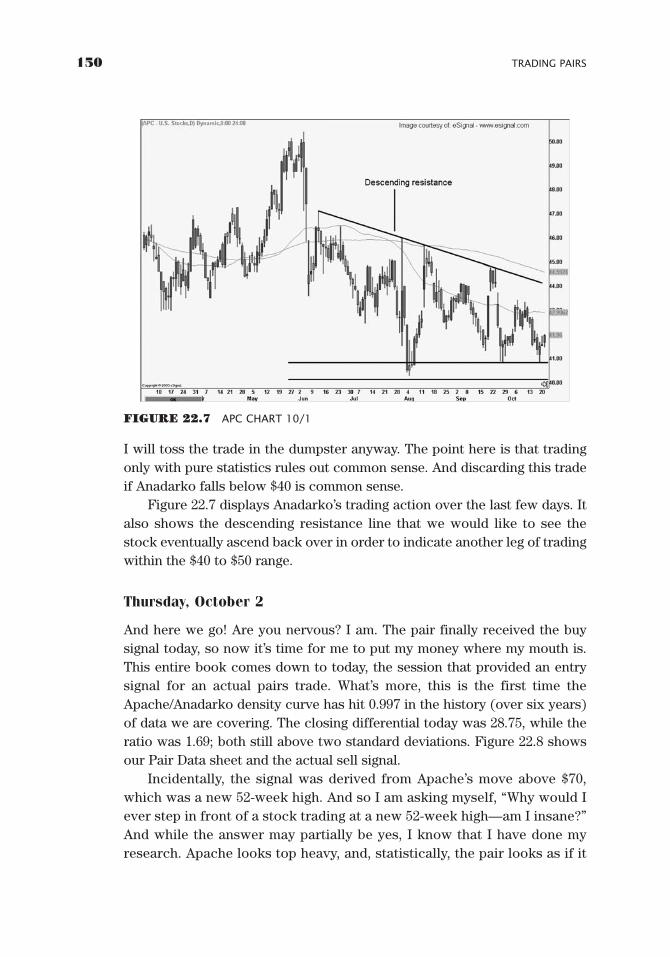
150 TRADING PAIRS
I will toss the trade in the dumpster anyway. The point here is that tradingonly with pure statistics rules out common sense. And discarding this tradeif Anadarko falls below $40 is common sense.
Figure 22.7 displays Anadarko’s trading action over the last few days. Italso shows the descending resistance line that we would like to see thestock eventually ascend back over in order to indicate another leg of tradingwithin the $40 to $50 range.
Thursday, October 2
And here we go! Are you nervous? I am. The pair finally received the buysignal today, so now it’s time for me to put my money where my mouth is.This entire book comes down to today, the session that provided an entrysignal for an actual pairs trade. What’s more, this is the first time theApache/Anadarko density curve has hit 0.997 in the history (over six years)of data we are covering. The closing differential today was 28.75, while theratio was 1.69; both still above two standard deviations. Figure 22.8 showsour Pair Data sheet and the actual sell signal.
Incidentally, the signal was derived from Apache’s move above $70,which was a new 52-week high. And so I am asking myself, “Why would Iever step in front of a stock trading at a new 52-week high—am I insane?”And while the answer may partially be yes, I know that I have done myresearch. Apache looks top heavy, and, statistically, the pair looks as if it
FIGURE 22.7 APC CHART 10/1
GK015-C22[143-186].qxd 6/10/04 7:37 PM Page 150 Virender Negi Quark07:BOOKS:GK015-Whistler:Quark files:
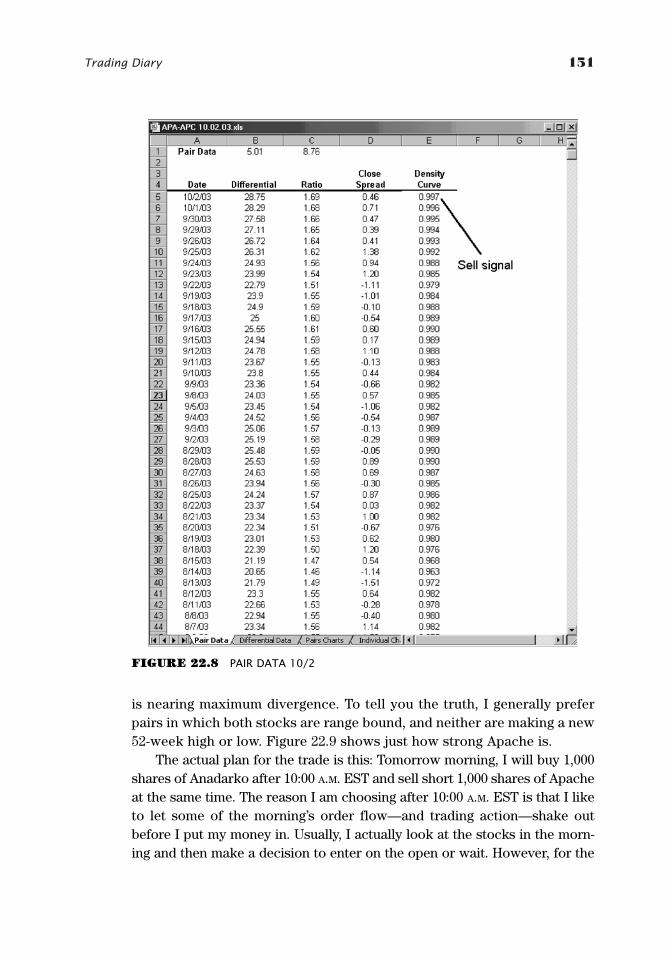
Trading Diary 151
is nearing maximum divergence. To tell you the truth, I generally preferpairs in which both stocks are range bound, and neither are making a new52-week high or low. Figure 22.9 shows just how strong Apache is.
The actual plan for the trade is this: Tomorrow morning, I will buy 1,000shares of Anadarko after 10:00 A.M. EST and sell short 1,000 shares of Apacheat the same time. The reason I am choosing after 10:00 A.M. EST is that I liketo let some of the morning’s order flow—and trading action—shake outbefore I put my money in. Usually, I actually look at the stocks in the morn-ing and then make a decision to enter on the open or wait. However, for the
FIGURE 22.8 PAIR DATA 10/2
GK015-C22[143-186].qxd 6/10/04 7:37 PM Page 151 Virender Negi Quark07:BOOKS:GK015-Whistler:Quark files:
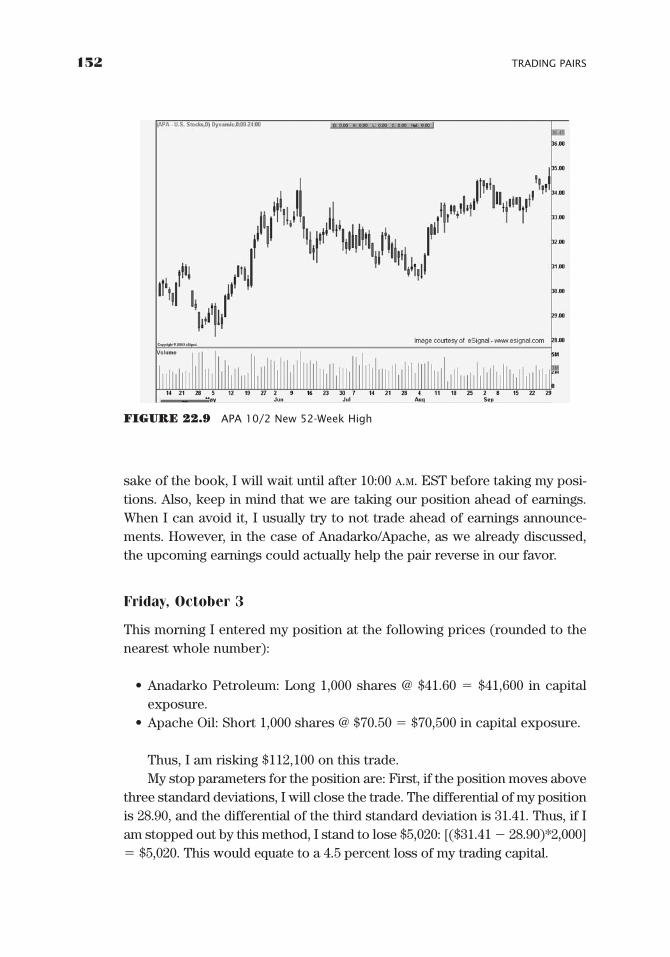
152 TRADING PAIRS
FIGURE 22.9 APA 10/2 New 52-Week High
sake of the book, I will wait until after 10:00 A.M. EST before taking my posi-tions. Also, keep in mind that we are taking our position ahead of earnings.When I can avoid it, I usually try to not trade ahead of earnings announce-ments. However, in the case of Anadarko/Apache, as we already discussed,the upcoming earnings could actually help the pair reverse in our favor.
Friday, October 3
This morning I entered my position at the following prices (rounded to thenearest whole number):
• Anadarko Petroleum: Long 1,000 shares @ $41.60 � $41,600 in capitalexposure.
• Apache Oil: Short 1,000 shares @ $70.50 � $70,500 in capital exposure.
Thus, I am risking $112,100 on this trade.My stop parameters for the position are: First, if the position moves above
three standard deviations, I will close the trade. The differential of my positionis 28.90, and the differential of the third standard deviation is 31.41. Thus, if Iam stopped out by this method, I stand to lose $5,020: [($31.41 � 28.90)*2,000]� $5,020. This would equate to a 4.5 percent loss of my trading capital.
GK015-C22[143-186].qxd 6/10/04 7:37 PM Page 152 Virender Negi Quark07:BOOKS:GK015-Whistler:Quark files:
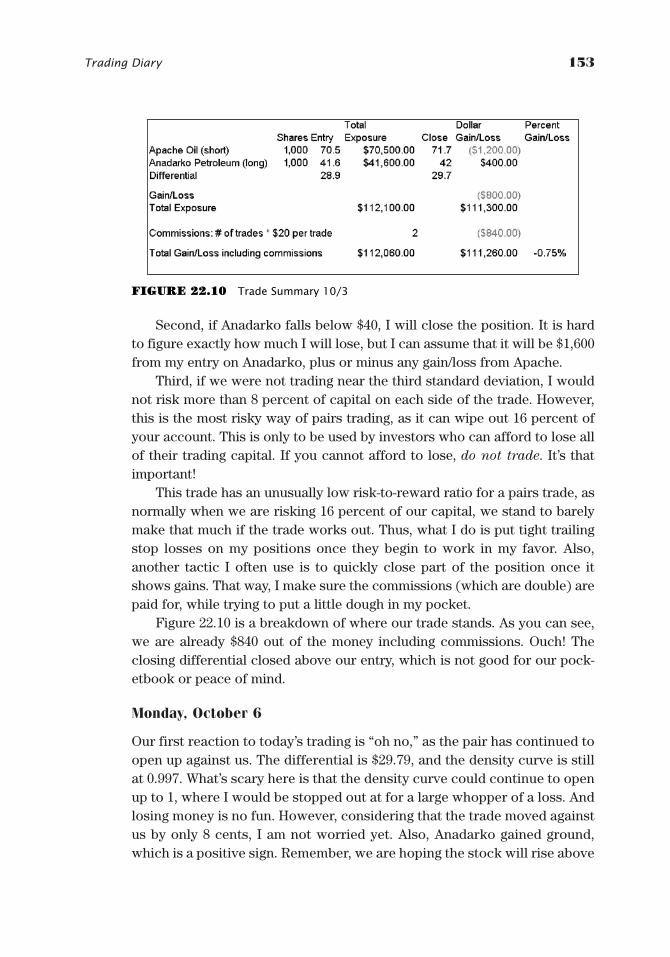
Trading Diary 153
Second, if Anadarko falls below $40, I will close the position. It is hardto figure exactly how much I will lose, but I can assume that it will be $1,600from my entry on Anadarko, plus or minus any gain/loss from Apache.
Third, if we were not trading near the third standard deviation, I wouldnot risk more than 8 percent of capital on each side of the trade. However,this is the most risky way of pairs trading, as it can wipe out 16 percent ofyour account. This is only to be used by investors who can afford to lose allof their trading capital. If you cannot afford to lose, do not trade. It’s thatimportant!
This trade has an unusually low risk-to-reward ratio for a pairs trade, asnormally when we are risking 16 percent of our capital, we stand to barelymake that much if the trade works out. Thus, what I do is put tight trailingstop losses on my positions once they begin to work in my favor. Also,another tactic I often use is to quickly close part of the position once itshows gains. That way, I make sure the commissions (which are double) arepaid for, while trying to put a little dough in my pocket.
Figure 22.10 is a breakdown of where our trade stands. As you can see,we are already $840 out of the money including commissions. Ouch! Theclosing differential closed above our entry, which is not good for our pock-etbook or peace of mind.
Monday, October 6
Our first reaction to today’s trading is “oh no,” as the pair has continued toopen up against us. The differential is $29.79, and the density curve is stillat 0.997. What’s scary here is that the density curve could continue to openup to 1, where I would be stopped out at for a large whopper of a loss. Andlosing money is no fun. However, considering that the trade moved againstus by only 8 cents, I am not worried yet. Also, Anadarko gained ground,which is a positive sign. Remember, we are hoping the stock will rise above
FIGURE 22.10 Trade Summary 10/3
GK015-C22[143-186].qxd 6/10/04 7:37 PM Page 153 Virender Negi Quark07:BOOKS:GK015-Whistler:Quark files:
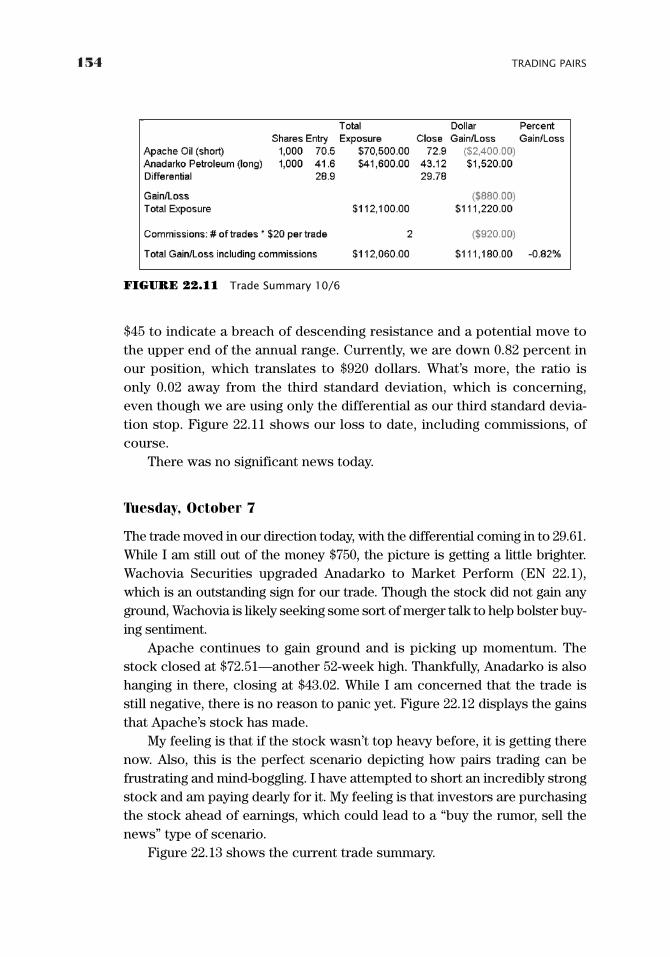
154 TRADING PAIRS
FIGURE 22.11 Trade Summary 10/6
$45 to indicate a breach of descending resistance and a potential move tothe upper end of the annual range. Currently, we are down 0.82 percent inour position, which translates to $920 dollars. What’s more, the ratio isonly 0.02 away from the third standard deviation, which is concerning,even though we are using only the differential as our third standard devia-tion stop. Figure 22.11 shows our loss to date, including commissions, ofcourse.
There was no significant news today.
Tuesday, October 7
The trade moved in our direction today, with the differential coming in to 29.61.While I am still out of the money $750, the picture is getting a little brighter.Wachovia Securities upgraded Anadarko to Market Perform (EN 22.1),which is an outstanding sign for our trade. Though the stock did not gain anyground, Wachovia is likely seeking some sort of merger talk to help bolster buy-ing sentiment.
Apache continues to gain ground and is picking up momentum. Thestock closed at $72.51—another 52-week high. Thankfully, Anadarko is alsohanging in there, closing at $43.02. While I am concerned that the trade isstill negative, there is no reason to panic yet. Figure 22.12 displays the gainsthat Apache’s stock has made.
My feeling is that if the stock wasn’t top heavy before, it is getting therenow. Also, this is the perfect scenario depicting how pairs trading can befrustrating and mind-boggling. I have attempted to short an incredibly strongstock and am paying dearly for it. My feeling is that investors are purchasingthe stock ahead of earnings, which could lead to a “buy the rumor, sell thenews” type of scenario.
Figure 22.13 shows the current trade summary.
GK015-C22[143-186].qxd 6/10/04 7:37 PM Page 154 Virender Negi Quark07:BOOKS:GK015-Whistler:Quark files:
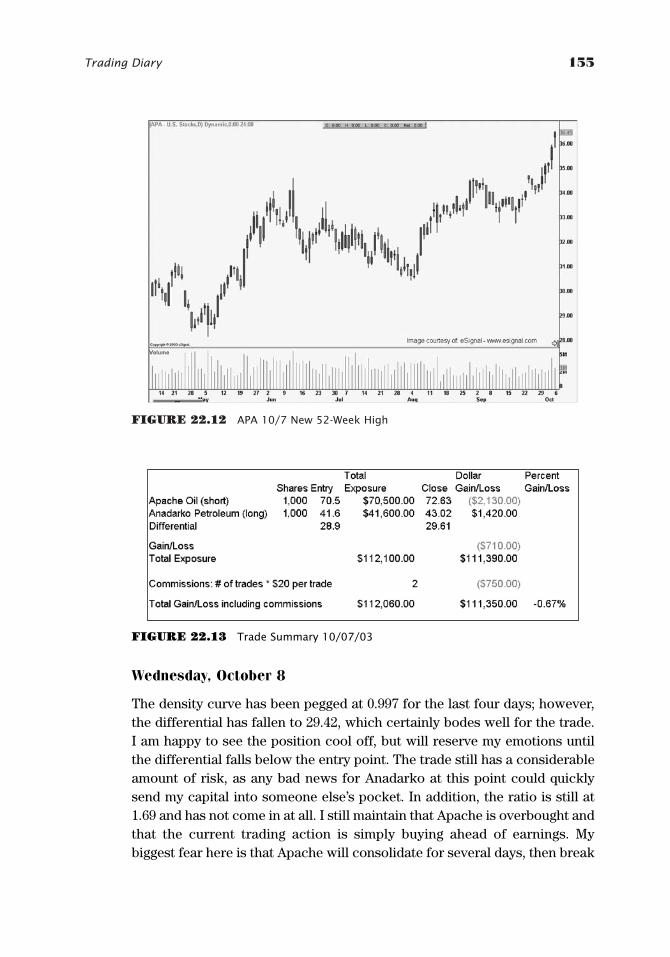
Trading Diary 155
FIGURE 22.12 APA 10/7 New 52-Week High
Wednesday, October 8
The density curve has been pegged at 0.997 for the last four days; however,the differential has fallen to 29.42, which certainly bodes well for the trade.I am happy to see the position cool off, but will reserve my emotions untilthe differential falls below the entry point. The trade still has a considerableamount of risk, as any bad news for Anadarko at this point could quicklysend my capital into someone else’s pocket. In addition, the ratio is still at1.69 and has not come in at all. I still maintain that Apache is overbought andthat the current trading action is simply buying ahead of earnings. Mybiggest fear here is that Apache will consolidate for several days, then break
FIGURE 22.13 Trade Summary 10/07/03
GK015-C22[143-186].qxd 6/10/04 7:37 PM Page 155 Virender Negi Quark07:BOOKS:GK015-Whistler:Quark files:
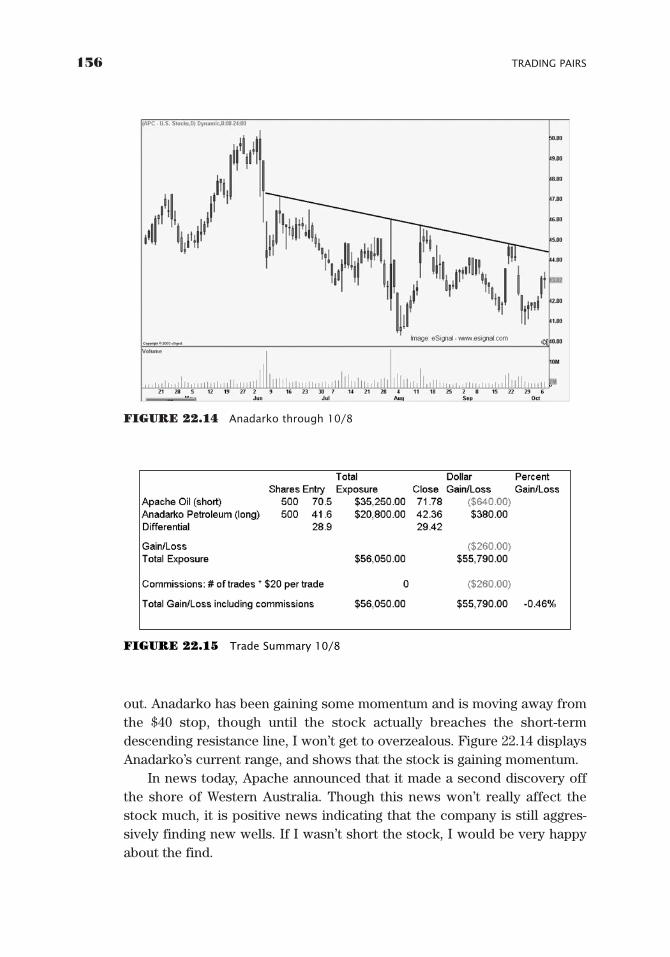
156 TRADING PAIRS
out. Anadarko has been gaining some momentum and is moving away fromthe $40 stop, though until the stock actually breaches the short-termdescending resistance line, I won’t get to overzealous. Figure 22.14 displaysAnadarko’s current range, and shows that the stock is gaining momentum.
In news today, Apache announced that it made a second discovery offthe shore of Western Australia. Though this news won’t really affect thestock much, it is positive news indicating that the company is still aggres-sively finding new wells. If I wasn’t short the stock, I would be very happyabout the find.
FIGURE 22.14 Anadarko through 10/8
FIGURE 22.15 Trade Summary 10/8
GK015-C22[143-186].qxd 6/10/04 7:37 PM Page 156 Virender Negi Quark07:BOOKS:GK015-Whistler:Quark files:
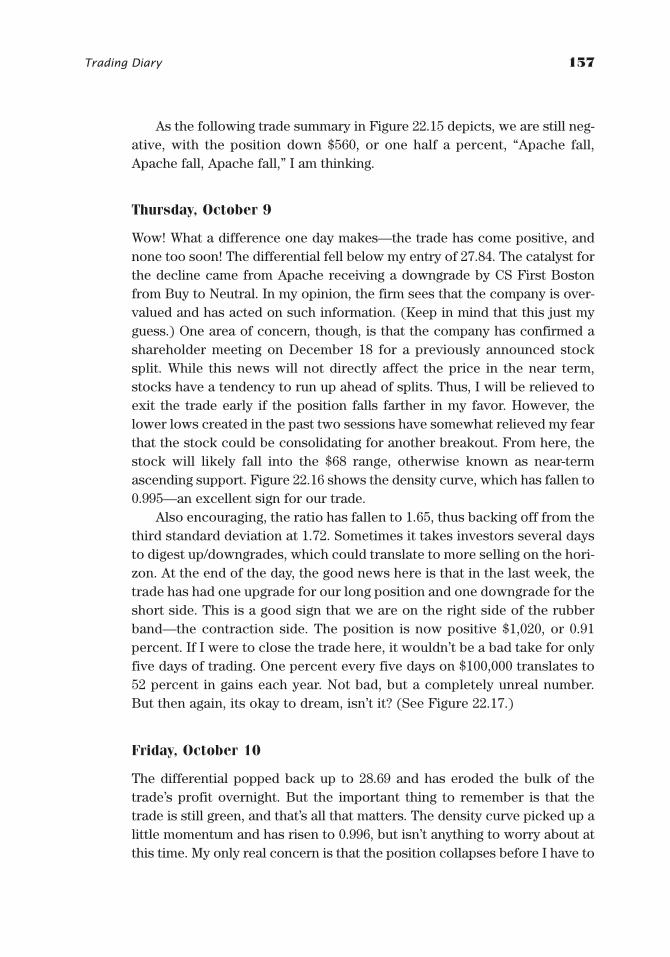
Trading Diary 157
As the following trade summary in Figure 22.15 depicts, we are still neg-ative, with the position down $560, or one half a percent, “Apache fall,Apache fall, Apache fall,” I am thinking.
Thursday, October 9
Wow! What a difference one day makes—the trade has come positive, andnone too soon! The differential fell below my entry of 27.84. The catalyst forthe decline came from Apache receiving a downgrade by CS First Bostonfrom Buy to Neutral. In my opinion, the firm sees that the company is over-valued and has acted on such information. (Keep in mind that this just myguess.) One area of concern, though, is that the company has confirmed ashareholder meeting on December 18 for a previously announced stocksplit. While this news will not directly affect the price in the near term,stocks have a tendency to run up ahead of splits. Thus, I will be relieved toexit the trade early if the position falls farther in my favor. However, thelower lows created in the past two sessions have somewhat relieved my fearthat the stock could be consolidating for another breakout. From here, thestock will likely fall into the $68 range, otherwise known as near-termascending support. Figure 22.16 shows the density curve, which has fallen to0.995—an excellent sign for our trade.
Also encouraging, the ratio has fallen to 1.65, thus backing off from thethird standard deviation at 1.72. Sometimes it takes investors several daysto digest up/downgrades, which could translate to more selling on the hori-zon. At the end of the day, the good news here is that in the last week, thetrade has had one upgrade for our long position and one downgrade for theshort side. This is a good sign that we are on the right side of the rubberband—the contraction side. The position is now positive $1,020, or 0.91percent. If I were to close the trade here, it wouldn’t be a bad take for onlyfive days of trading. One percent every five days on $100,000 translates to52 percent in gains each year. Not bad, but a completely unreal number.But then again, its okay to dream, isn’t it? (See Figure 22.17.)
Friday, October 10
The differential popped back up to 28.69 and has eroded the bulk of thetrade’s profit overnight. But the important thing to remember is that thetrade is still green, and that’s all that matters. The density curve picked up alittle momentum and has risen to 0.996, but isn’t anything to worry about atthis time. My only real concern is that the position collapses before I have to
GK015-C22[143-186].qxd 6/10/04 7:37 PM Page 157 Virender Negi Quark07:BOOKS:GK015-Whistler:Quark files:
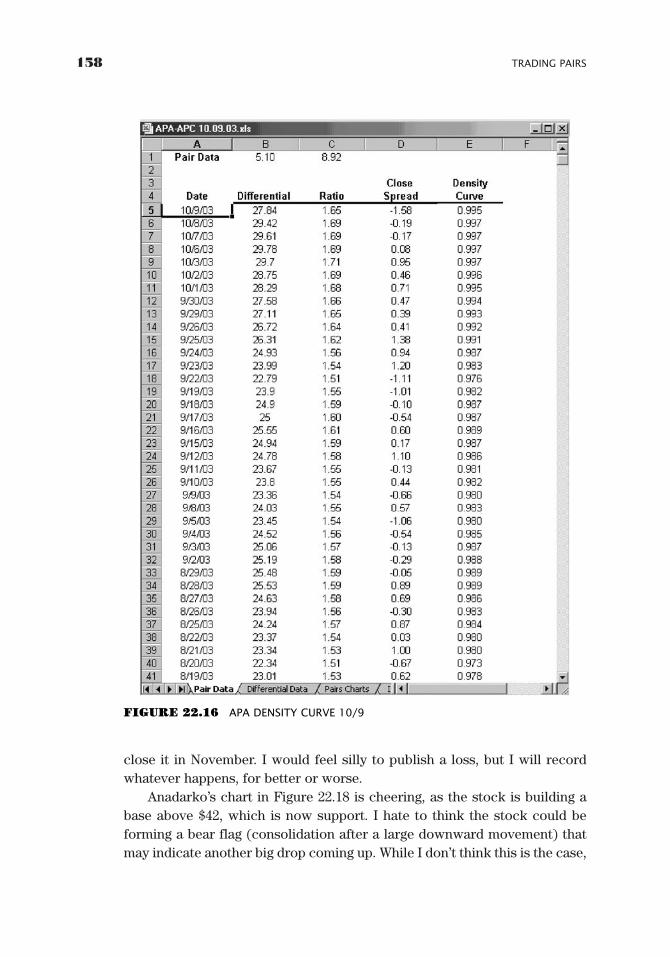
158 TRADING PAIRS
close it in November. I would feel silly to publish a loss, but I will recordwhatever happens, for better or worse.
Anadarko’s chart in Figure 22.18 is cheering, as the stock is building abase above $42, which is now support. I hate to think the stock could beforming a bear flag (consolidation after a large downward movement) thatmay indicate another big drop coming up. While I don’t think this is the case,
FIGURE 22.16 APA DENSITY CURVE 10/9
GK015-C22[143-186].qxd 6/10/04 7:37 PM Page 158 Virender Negi Quark07:BOOKS:GK015-Whistler:Quark files:
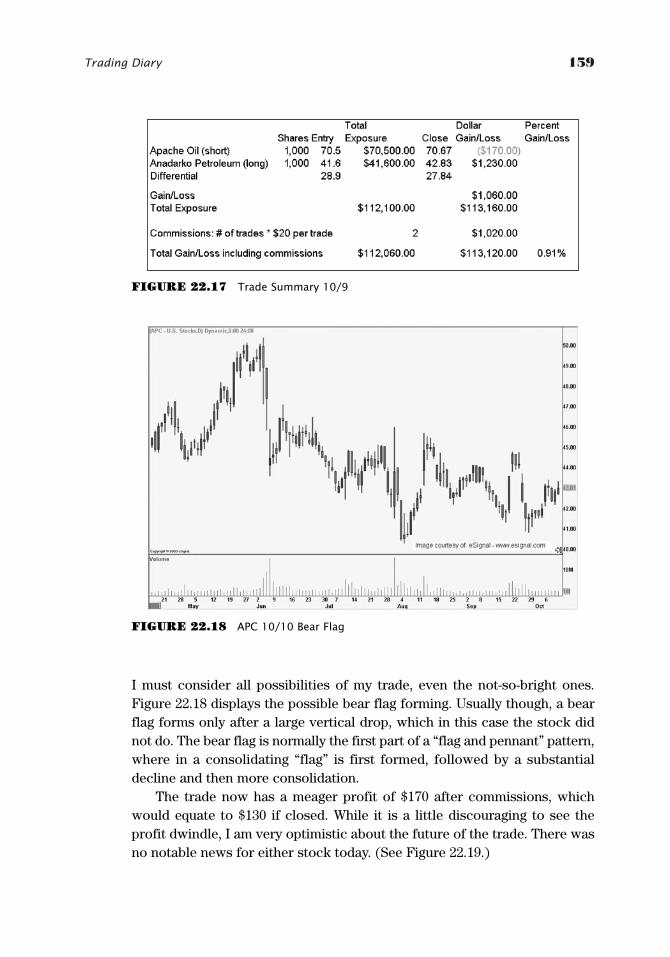
Trading Diary 159
FIGURE 22.17 Trade Summary 10/9
FIGURE 22.18 APC 10/10 Bear Flag
I must consider all possibilities of my trade, even the not-so-bright ones.Figure 22.18 displays the possible bear flag forming. Usually though, a bearflag forms only after a large vertical drop, which in this case the stock didnot do. The bear flag is normally the first part of a “flag and pennant” pattern,where in a consolidating “flag” is first formed, followed by a substantialdecline and then more consolidation.
The trade now has a meager profit of $170 after commissions, whichwould equate to $130 if closed. While it is a little discouraging to see theprofit dwindle, I am very optimistic about the future of the trade. There wasno notable news for either stock today. (See Figure 22.19.)
GK015-C22[143-186].qxd 6/10/04 7:37 PM Page 159 Virender Negi Quark07:BOOKS:GK015-Whistler:Quark files:
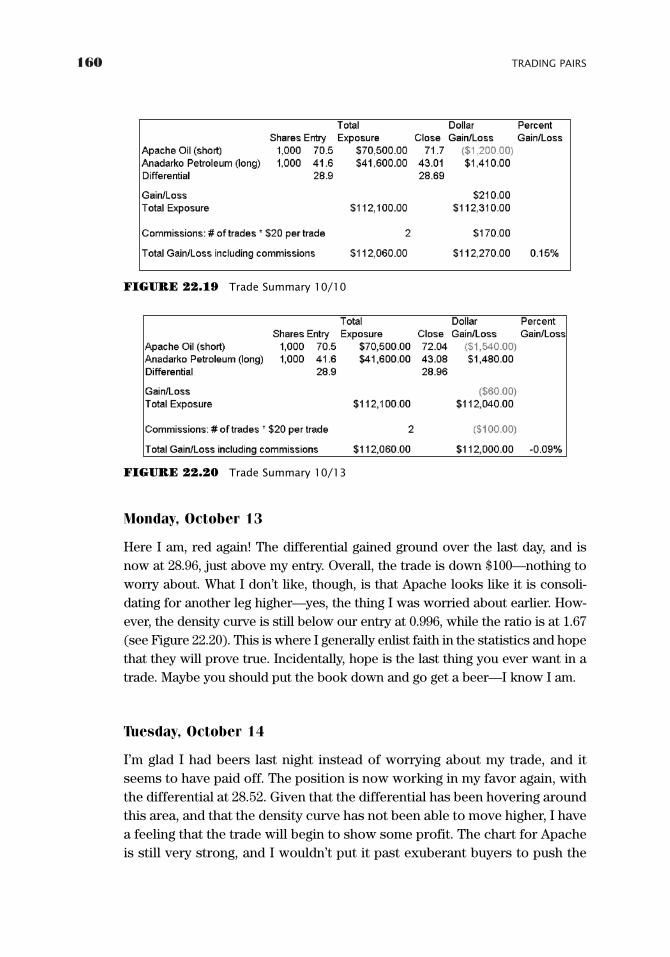
160 TRADING PAIRS
Monday, October 13
Here I am, red again! The differential gained ground over the last day, and isnow at 28.96, just above my entry. Overall, the trade is down $100—nothing toworry about. What I don’t like, though, is that Apache looks like it is consoli-dating for another leg higher—yes, the thing I was worried about earlier. How-ever, the density curve is still below our entry at 0.996, while the ratio is at 1.67(see Figure 22.20). This is where I generally enlist faith in the statistics and hopethat they will prove true. Incidentally, hope is the last thing you ever want in atrade. Maybe you should put the book down and go get a beer—I know I am.
Tuesday, October 14
I’m glad I had beers last night instead of worrying about my trade, and itseems to have paid off. The position is now working in my favor again, withthe differential at 28.52. Given that the differential has been hovering aroundthis area, and that the density curve has not been able to move higher, I havea feeling that the trade will begin to show some profit. The chart for Apacheis still very strong, and I wouldn’t put it past exuberant buyers to push the
FIGURE 22.19 Trade Summary 10/10
FIGURE 22.20 Trade Summary 10/13
GK015-C22[143-186].qxd 6/10/04 7:37 PM Page 160 Virender Negi Quark07:BOOKS:GK015-Whistler:Quark files:
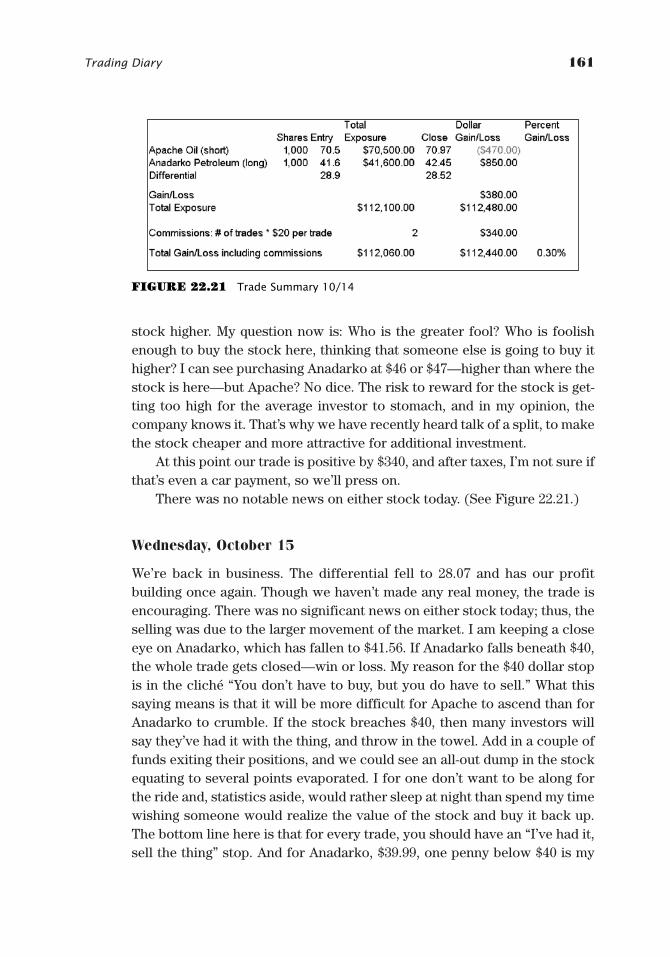
Trading Diary 161
stock higher. My question now is: Who is the greater fool? Who is foolishenough to buy the stock here, thinking that someone else is going to buy ithigher? I can see purchasing Anadarko at $46 or $47—higher than where thestock is here—but Apache? No dice. The risk to reward for the stock is get-ting too high for the average investor to stomach, and in my opinion, thecompany knows it. That’s why we have recently heard talk of a split, to makethe stock cheaper and more attractive for additional investment.
At this point our trade is positive by $340, and after taxes, I’m not sure ifthat’s even a car payment, so we’ll press on.
There was no notable news on either stock today. (See Figure 22.21.)
Wednesday, October 15
We’re back in business. The differential fell to 28.07 and has our profitbuilding once again. Though we haven’t made any real money, the trade isencouraging. There was no significant news on either stock today; thus, theselling was due to the larger movement of the market. I am keeping a closeeye on Anadarko, which has fallen to $41.56. If Anadarko falls beneath $40,the whole trade gets closed—win or loss. My reason for the $40 dollar stopis in the cliché “You don’t have to buy, but you do have to sell.” What thissaying means is that it will be more difficult for Apache to ascend than forAnadarko to crumble. If the stock breaches $40, then many investors willsay they’ve had it with the thing, and throw in the towel. Add in a couple offunds exiting their positions, and we could see an all-out dump in the stockequating to several points evaporated. I for one don’t want to be along forthe ride and, statistics aside, would rather sleep at night than spend my timewishing someone would realize the value of the stock and buy it back up.The bottom line here is that for every trade, you should have an “I’ve had it,sell the thing” stop. And for Anadarko, $39.99, one penny below $40 is my
FIGURE 22.21 Trade Summary 10/14
GK015-C22[143-186].qxd 6/10/04 7:37 PM Page 161 Virender Negi Quark07:BOOKS:GK015-Whistler:Quark files:
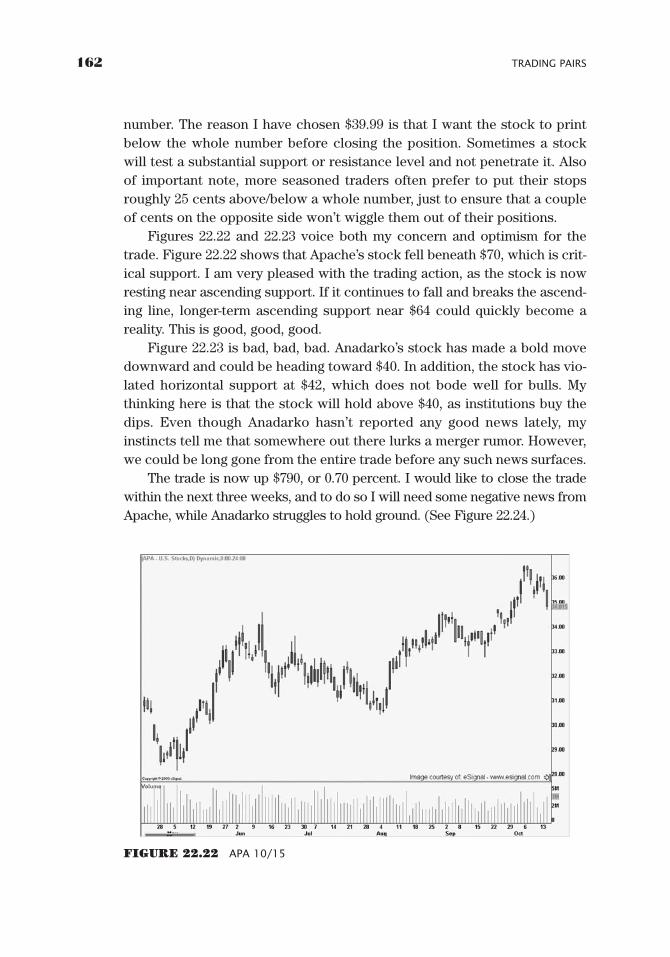
162 TRADING PAIRS
number. The reason I have chosen $39.99 is that I want the stock to printbelow the whole number before closing the position. Sometimes a stockwill test a substantial support or resistance level and not penetrate it. Alsoof important note, more seasoned traders often prefer to put their stopsroughly 25 cents above/below a whole number, just to ensure that a coupleof cents on the opposite side won’t wiggle them out of their positions.
Figures 22.22 and 22.23 voice both my concern and optimism for thetrade. Figure 22.22 shows that Apache’s stock fell beneath $70, which is crit-ical support. I am very pleased with the trading action, as the stock is nowresting near ascending support. If it continues to fall and breaks the ascend-ing line, longer-term ascending support near $64 could quickly become areality. This is good, good, good.
Figure 22.23 is bad, bad, bad. Anadarko’s stock has made a bold movedownward and could be heading toward $40. In addition, the stock has vio-lated horizontal support at $42, which does not bode well for bulls. Mythinking here is that the stock will hold above $40, as institutions buy thedips. Even though Anadarko hasn’t reported any good news lately, myinstincts tell me that somewhere out there lurks a merger rumor. However,we could be long gone from the entire trade before any such news surfaces.
The trade is now up $790, or 0.70 percent. I would like to close the tradewithin the next three weeks, and to do so I will need some negative news fromApache, while Anadarko struggles to hold ground. (See Figure 22.24.)
FIGURE 22.22 APA 10/15
GK015-C22[143-186].qxd 6/10/04 7:37 PM Page 162 Virender Negi Quark07:BOOKS:GK015-Whistler:Quark files:
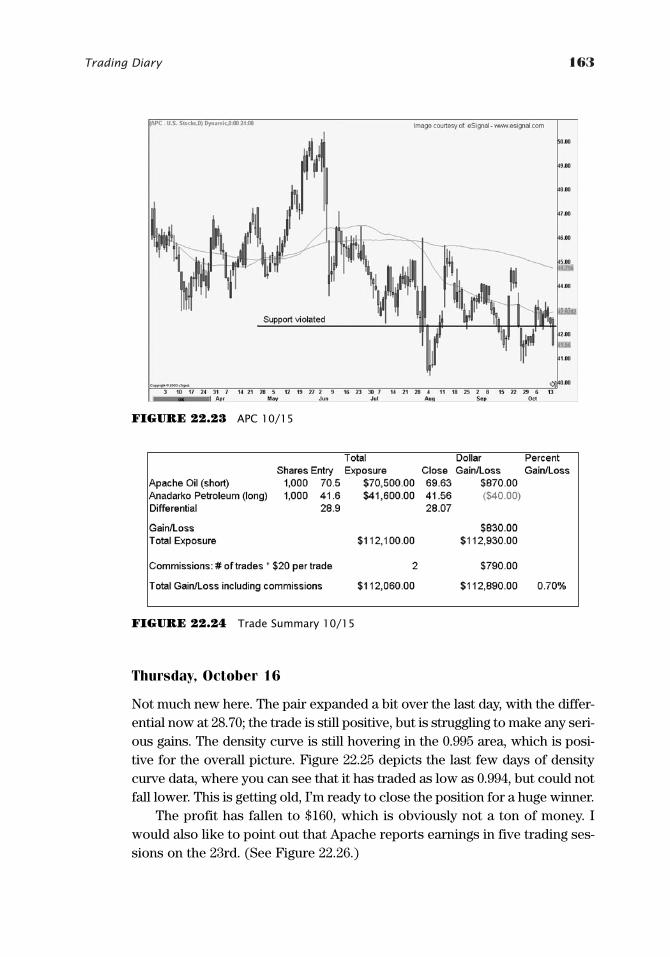
Trading Diary 163
FIGURE 22.23 APC 10/15
FIGURE 22.24 Trade Summary 10/15
Thursday, October 16
Not much new here. The pair expanded a bit over the last day, with the differ-ential now at 28.70; the trade is still positive, but is struggling to make any seri-ous gains. The density curve is still hovering in the 0.995 area, which is posi-tive for the overall picture. Figure 22.25 depicts the last few days of densitycurve data, where you can see that it has traded as low as 0.994, but could notfall lower. This is getting old, I’m ready to close the position for a huge winner.
The profit has fallen to $160, which is obviously not a ton of money. Iwould also like to point out that Apache reports earnings in five trading ses-sions on the 23rd. (See Figure 22.26.)
GK015-C22[143-186].qxd 6/10/04 7:37 PM Page 163 Virender Negi Quark07:BOOKS:GK015-Whistler:Quark files:
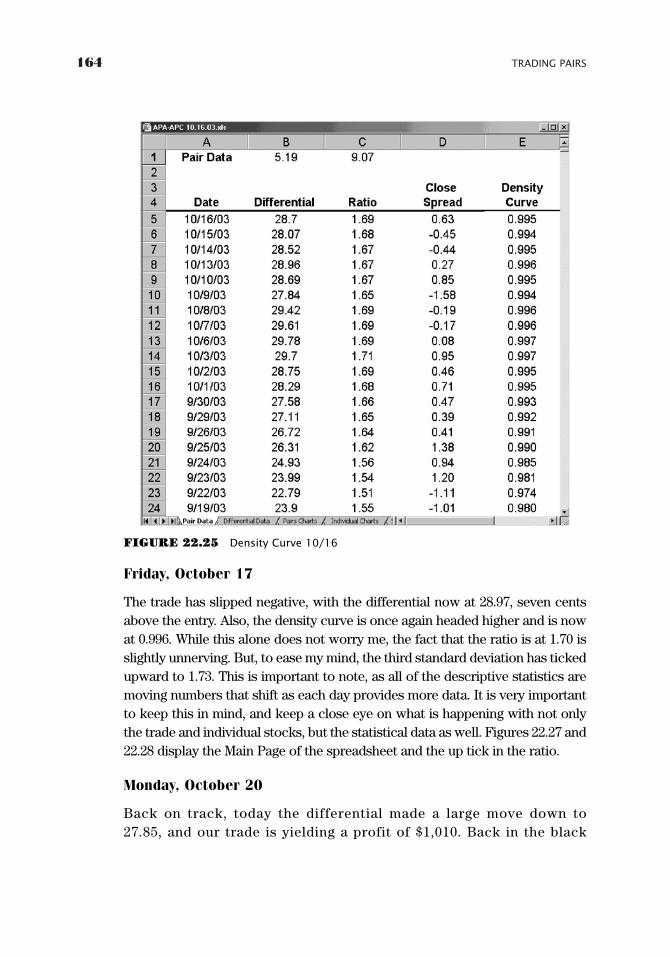
164 TRADING PAIRS
FIGURE 22.25 Density Curve 10/16
Friday, October 17
The trade has slipped negative, with the differential now at 28.97, seven centsabove the entry. Also, the density curve is once again headed higher and is nowat 0.996. While this alone does not worry me, the fact that the ratio is at 1.70 isslightly unnerving. But, to ease my mind, the third standard deviation has tickedupward to 1.73. This is important to note, as all of the descriptive statistics aremoving numbers that shift as each day provides more data. It is very importantto keep this in mind, and keep a close eye on what is happening with not onlythe trade and individual stocks, but the statistical data as well. Figures 22.27 and22.28 display the Main Page of the spreadsheet and the up tick in the ratio.
Monday, October 20
Back on track, today the differential made a large move down to27.85, and our trade is yielding a profit of $1,010. Back in the black
GK015-C22[143-186].qxd 6/10/04 7:37 PM Page 164 Virender Negi Quark07:BOOKS:GK015-Whistler:Quark files:

Trading Diary 165
again. Today is a huge day for our trade and what I think is the begin-ning of further convergence. The density curve has posted its lowestreading in seven sessions, while the ratio has fallen to 1.67. A breach of1.64 would be extremely positive for our trade, as it would be the firsttime the ratio has been below 1.64 since September 26, when I firstbegan looking at the trade. Statistically, it looks as if the pair hastopped out and is now beginning to contract. Figure 22.29 shows thedifferential, ratio, and density curve, followed by the usual trade sum-mary in Figure 22.30.
FIGURE 22.26 Trade Summary 10/16
FIGURE 22.27 Main Spreadsheet 10/17
GK015-C22[143-186].qxd 6/10/04 7:37 PM Page 165 Virender Negi Quark07:BOOKS:GK015-Whistler:Quark files:
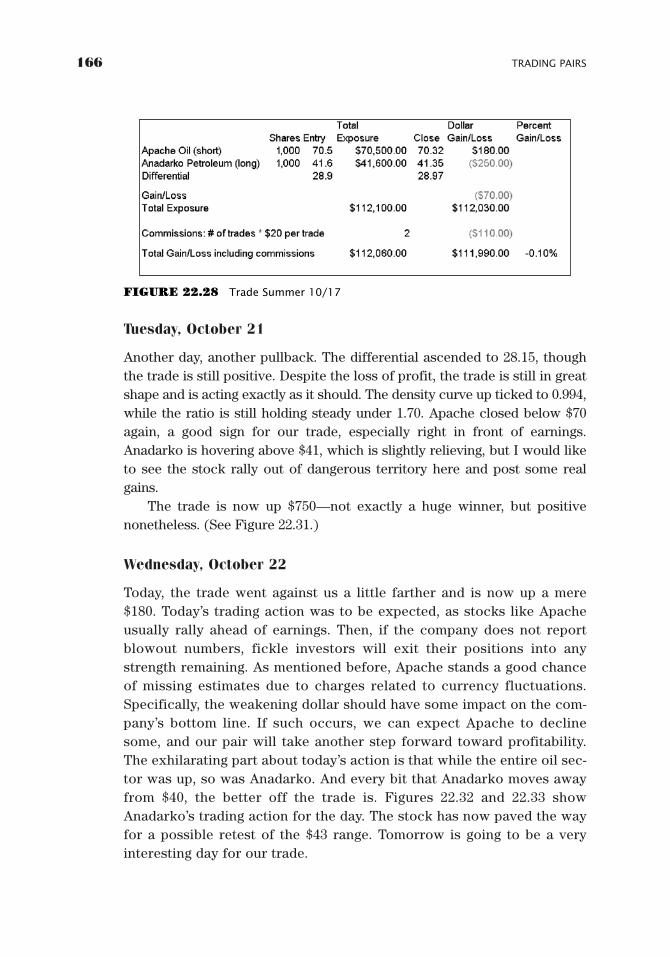
166 TRADING PAIRS
Tuesday, October 21
Another day, another pullback. The differential ascended to 28.15, thoughthe trade is still positive. Despite the loss of profit, the trade is still in greatshape and is acting exactly as it should. The density curve up ticked to 0.994,while the ratio is still holding steady under 1.70. Apache closed below $70again, a good sign for our trade, especially right in front of earnings.Anadarko is hovering above $41, which is slightly relieving, but I would liketo see the stock rally out of dangerous territory here and post some realgains.
The trade is now up $750—not exactly a huge winner, but positivenonetheless. (See Figure 22.31.)
Wednesday, October 22
Today, the trade went against us a little farther and is now up a mere$180. Today’s trading action was to be expected, as stocks like Apacheusually rally ahead of earnings. Then, if the company does not reportblowout numbers, fickle investors will exit their positions into anystrength remaining. As mentioned before, Apache stands a good chanceof missing estimates due to charges related to currency fluctuations.Specifically, the weakening dollar should have some impact on the com-pany’s bottom line. If such occurs, we can expect Apache to declinesome, and our pair will take another step forward toward profitability.The exhilarating part about today’s action is that while the entire oil sec-tor was up, so was Anadarko. And every bit that Anadarko moves awayfrom $40, the better off the trade is. Figures 22.32 and 22.33 showAnadarko’s trading action for the day. The stock has now paved the wayfor a possible retest of the $43 range. Tomorrow is going to be a veryinteresting day for our trade.
FIGURE 22.28 Trade Summer 10/17
GK015-C22[143-186].qxd 6/10/04 7:37 PM Page 166 Virender Negi Quark07:BOOKS:GK015-Whistler:Quark files:
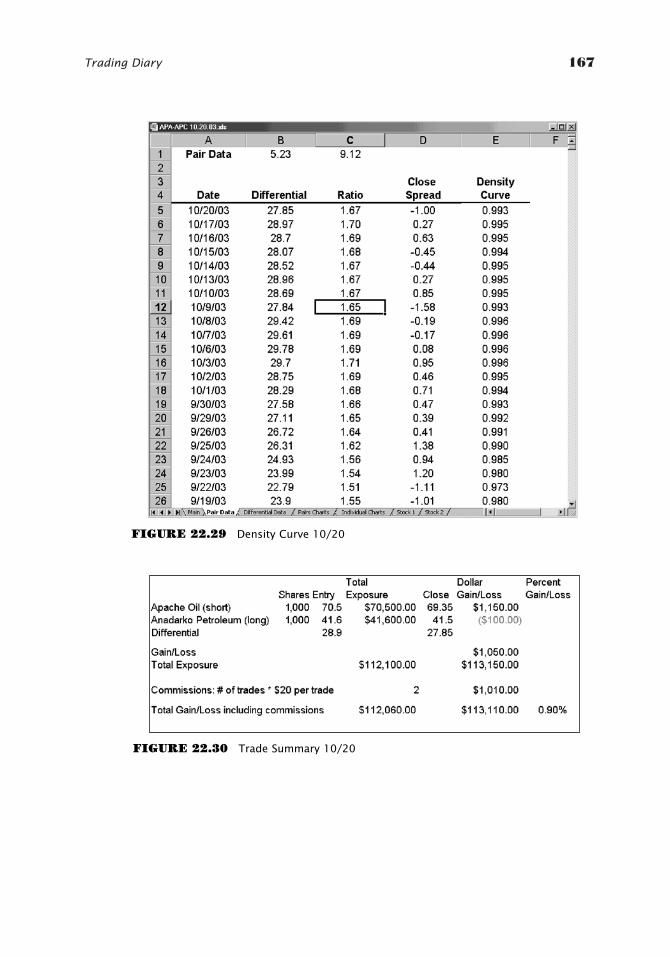
Trading Diary 167
FIGURE 22.29 Density Curve 10/20
FIGURE 22.30 Trade Summary 10/20
GK015-C22[143-186].qxd 6/10/04 7:37 PM Page 167 Virender Negi Quark07:BOOKS:GK015-Whistler:Quark files:

168 TRADING PAIRS
FIGURE 22.32 Anadarko Chart 10/22
Thursday, October 23
Apache reported third-quarter earnings today of $276 million, or $1.69 ashare, up from $145 million, or 95 cents one year earlier. While this news isgood for the most part, the company missed the consensus estimate of $1.77a share. Of course, before charges it beat expectations; however, we lookonly at net numbers, and in this case the net number is a disappointment. Thecompany had a 34 percent increase in oil-equivalent production for the quar-ter, which is remarkable. Regardless, because the stock has run up so muchover the last two years, it would have taken some seriously whopping num-bers to push the stock higher. In addition, the company said earnings wouldhave been higher, except that it had to take charges for unfavorable currency
FIGURE 22.31 Trade Summary 10/21
GK015-C22[143-186].qxd 6/10/04 7:37 PM Page 168 Virender Negi Quark07:BOOKS:GK015-Whistler:Quark files:
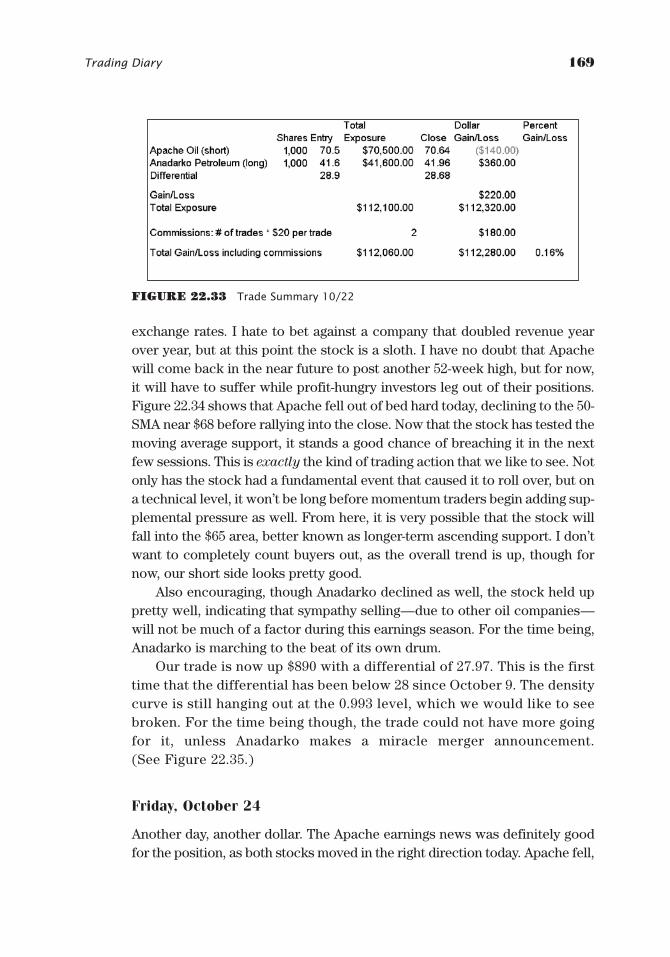
Trading Diary 169
exchange rates. I hate to bet against a company that doubled revenue yearover year, but at this point the stock is a sloth. I have no doubt that Apachewill come back in the near future to post another 52-week high, but for now,it will have to suffer while profit-hungry investors leg out of their positions.Figure 22.34 shows that Apache fell out of bed hard today, declining to the 50-SMA near $68 before rallying into the close. Now that the stock has tested themoving average support, it stands a good chance of breaching it in the nextfew sessions. This is exactly the kind of trading action that we like to see. Notonly has the stock had a fundamental event that caused it to roll over, but ona technical level, it won’t be long before momentum traders begin adding sup-plemental pressure as well. From here, it is very possible that the stock willfall into the $65 area, better known as longer-term ascending support. I don’twant to completely count buyers out, as the overall trend is up, though fornow, our short side looks pretty good.
Also encouraging, though Anadarko declined as well, the stock held uppretty well, indicating that sympathy selling—due to other oil companies—will not be much of a factor during this earnings season. For the time being,Anadarko is marching to the beat of its own drum.
Our trade is now up $890 with a differential of 27.97. This is the firsttime that the differential has been below 28 since October 9. The densitycurve is still hanging out at the 0.993 level, which we would like to seebroken. For the time being though, the trade could not have more goingfor it, unless Anadarko makes a miracle merger announcement. (See Figure 22.35.)
Friday, October 24
Another day, another dollar. The Apache earnings news was definitely goodfor the position, as both stocks moved in the right direction today. Apache fell,
FIGURE 22.33 Trade Summary 10/22
GK015-C22[143-186].qxd 6/10/04 7:37 PM Page 169 Virender Negi Quark07:BOOKS:GK015-Whistler:Quark files:

170 TRADING PAIRS
while Anadarko climbed, exactly the combination we are looking for. What’smore, the density curve is at 0.992, the lowest point since September 30.The ratio has backed off of the 1.67 area, and the differential could soon bein the 26 region. Overall, the trade is working very well. We have been in theposition for 16 trading days and we are up 1.27 percent. Not a bad take forless than a month of trading.
Apache continues to sit just above the 50-SMA and is the key to ourtrade’s success right now. We need the stock to violate the major movingaverage in order to bring momentum sellers and—dare I say—day traders inoff the fence to push the stock lower. (See Figure 22.36.)
FIGURE 22.35 Trade Summary 10/23
FIGURE 22.34 APA 10/23
GK015-C22[143-186].qxd 6/10/04 7:37 PM Page 170 Virender Negi Quark07:BOOKS:GK015-Whistler:Quark files:
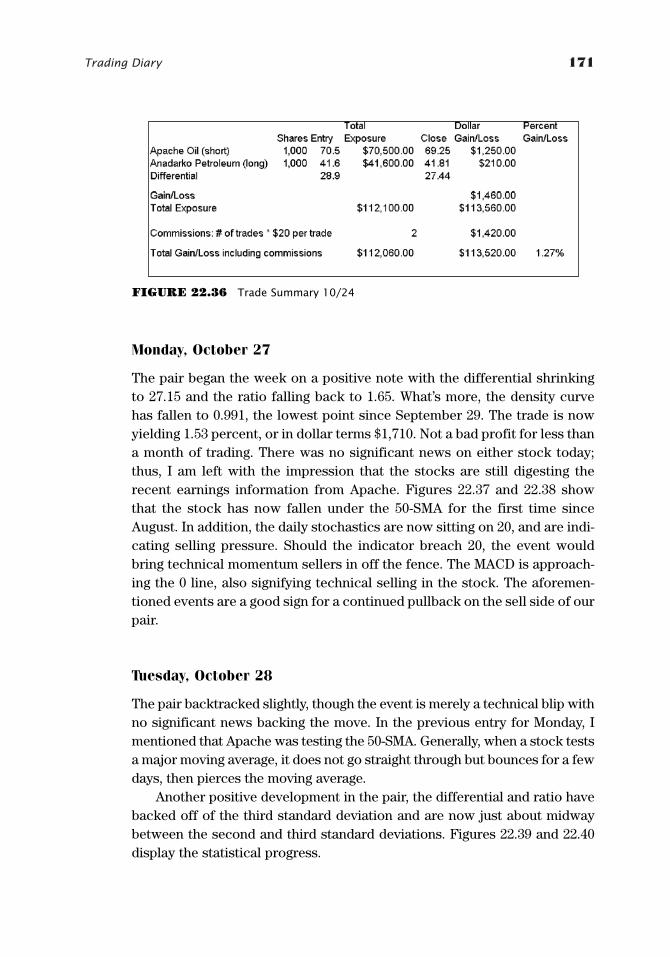
Trading Diary 171
Monday, October 27
The pair began the week on a positive note with the differential shrinkingto 27.15 and the ratio falling back to 1.65. What’s more, the density curvehas fallen to 0.991, the lowest point since September 29. The trade is nowyielding 1.53 percent, or in dollar terms $1,710. Not a bad profit for less thana month of trading. There was no significant news on either stock today;thus, I am left with the impression that the stocks are still digesting therecent earnings information from Apache. Figures 22.37 and 22.38 showthat the stock has now fallen under the 50-SMA for the first time sinceAugust. In addition, the daily stochastics are now sitting on 20, and are indi-cating selling pressure. Should the indicator breach 20, the event wouldbring technical momentum sellers in off the fence. The MACD is approach-ing the 0 line, also signifying technical selling in the stock. The aforemen-tioned events are a good sign for a continued pullback on the sell side of ourpair.
Tuesday, October 28
The pair backtracked slightly, though the event is merely a technical blip withno significant news backing the move. In the previous entry for Monday, Imentioned that Apache was testing the 50-SMA. Generally, when a stock testsa major moving average, it does not go straight through but bounces for a fewdays, then pierces the moving average.
Another positive development in the pair, the differential and ratio havebacked off of the third standard deviation and are now just about midwaybetween the second and third standard deviations. Figures 22.39 and 22.40display the statistical progress.
FIGURE 22.36 Trade Summary 10/24
GK015-C22[143-186].qxd 6/10/04 7:37 PM Page 171 Virender Negi Quark07:BOOKS:GK015-Whistler:Quark files:
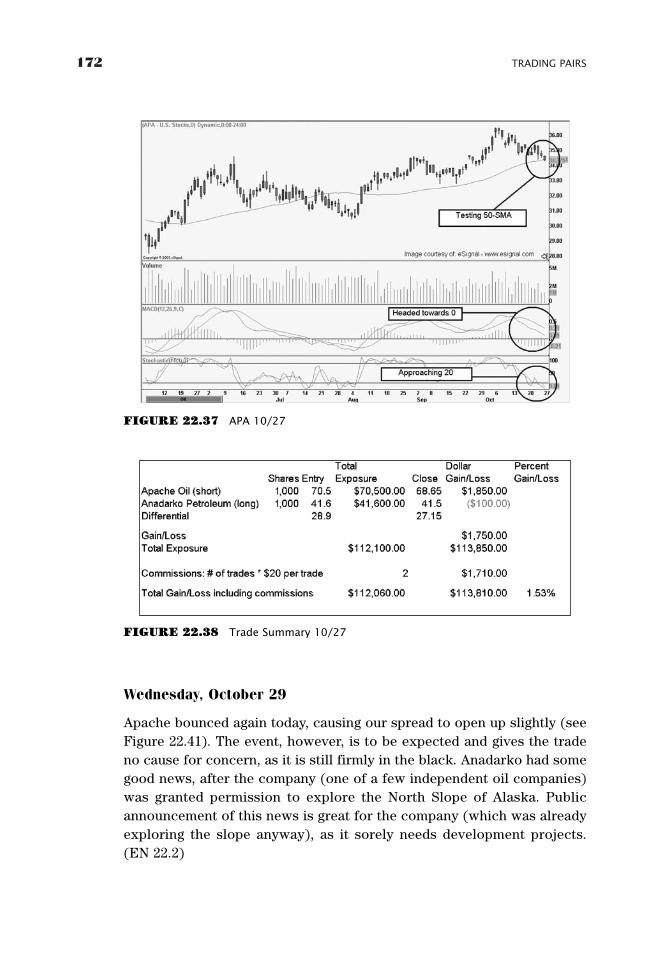
172 TRADING PAIRS
FIGURE 22.38 Trade Summary 10/27
Wednesday, October 29
Apache bounced again today, causing our spread to open up slightly (seeFigure 22.41). The event, however, is to be expected and gives the tradeno cause for concern, as it is still firmly in the black. Anadarko had somegood news, after the company (one of a few independent oil companies)was granted permission to explore the North Slope of Alaska. Publicannouncement of this news is great for the company (which was alreadyexploring the slope anyway), as it sorely needs development projects.(EN 22.2)
FIGURE 22.37 APA 10/27
GK015-C22[143-186].qxd 6/10/04 7:37 PM Page 172 Virender Negi Quark07:BOOKS:GK015-Whistler:Quark files:
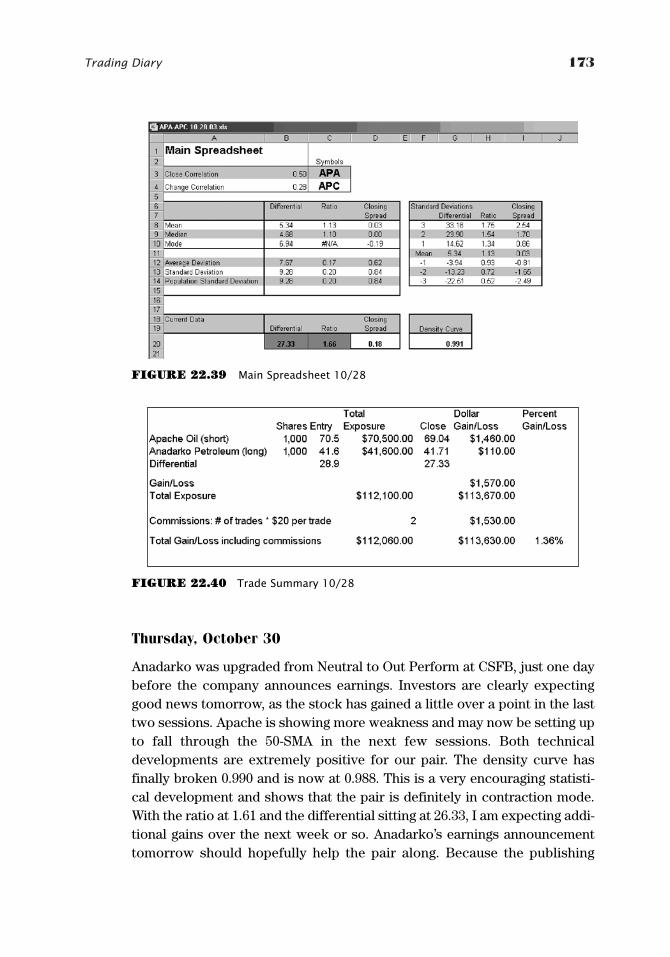
Trading Diary 173
FIGURE 22.39 Main Spreadsheet 10/28
FIGURE 22.40 Trade Summary 10/28
Thursday, October 30
Anadarko was upgraded from Neutral to Out Perform at CSFB, just one daybefore the company announces earnings. Investors are clearly expectinggood news tomorrow, as the stock has gained a little over a point in the lasttwo sessions. Apache is showing more weakness and may now be setting upto fall through the 50-SMA in the next few sessions. Both technicaldevelopments are extremely positive for our pair. The density curve hasfinally broken 0.990 and is now at 0.988. This is a very encouraging statisti-cal development and shows that the pair is definitely in contraction mode.With the ratio at 1.61 and the differential sitting at 26.33, I am expecting addi-tional gains over the next week or so. Anadarko’s earnings announcementtomorrow should hopefully help the pair along. Because the publishing
GK015-C22[143-186].qxd 6/10/04 7:37 PM Page 173 Virender Negi Quark07:BOOKS:GK015-Whistler:Quark files:
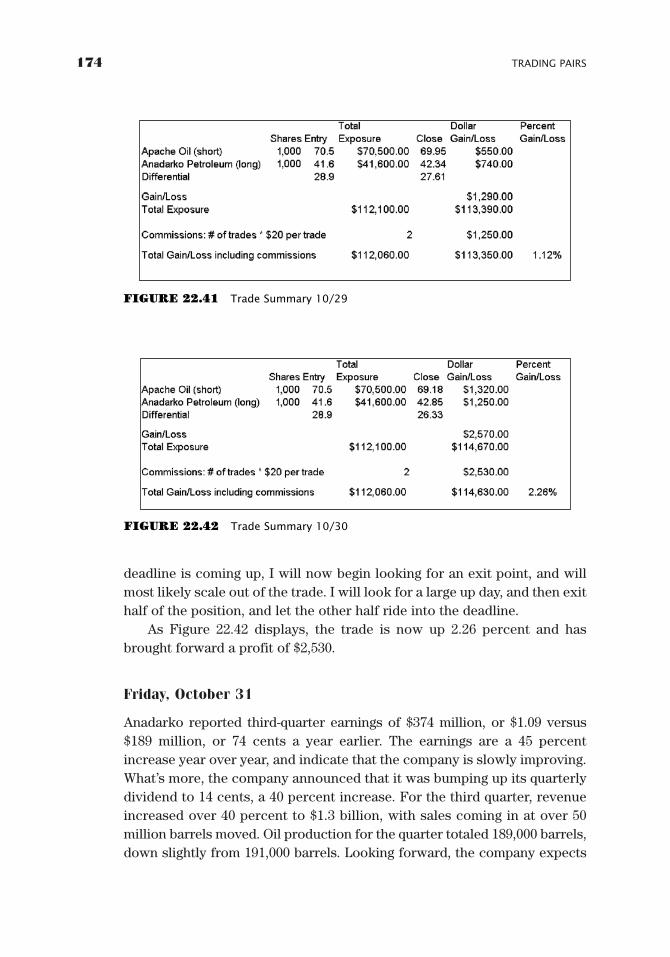
174 TRADING PAIRS
deadline is coming up, I will now begin looking for an exit point, and willmost likely scale out of the trade. I will look for a large up day, and then exithalf of the position, and let the other half ride into the deadline.
As Figure 22.42 displays, the trade is now up 2.26 percent and hasbrought forward a profit of $2,530.
Friday, October 31
Anadarko reported third-quarter earnings of $374 million, or $1.09 versus$189 million, or 74 cents a year earlier. The earnings are a 45 percentincrease year over year, and indicate that the company is slowly improving.What’s more, the company announced that it was bumping up its quarterlydividend to 14 cents, a 40 percent increase. For the third quarter, revenueincreased over 40 percent to $1.3 billion, with sales coming in at over 50million barrels moved. Oil production for the quarter totaled 189,000 barrels,down slightly from 191,000 barrels. Looking forward, the company expects
FIGURE 22.42 Trade Summary 10/30
FIGURE 22.41 Trade Summary 10/29
GK015-C22[143-186].qxd 6/10/04 7:37 PM Page 174 Virender Negi Quark07:BOOKS:GK015-Whistler:Quark files:

Trading Diary 175
fourth-quarter earnings of $1.10 a share, almost in line with the consensusestimate. The company also expects full-year earnings to total $5 a share,versus the expected $5.05 a share. Great news came in the form of anannouncement that the company plans on increasing its 2003 capital budgetby $100 million to $2.8 billion, while also eliminating debt by roughly $300million. With the exception of fourth-quarter and full-year guidance comingin under annual estimates, the report was very positive. The company’scapex budget increase is a good sign for the development and upgrading ofcurrent equipment. Overall, this report should be received very positively,and indicates that the company is working hard to turn things around.
Looking at the daily chart of Anadarko, the stock is now testingdescending resistance in the $44 region. A move above the resistance linewill definitely gain the notice of technical momentum traders and willbring supplemental buying in off the fence. As Figure 22.43 displays, thestock has also just witnessed a bullish crossover of the MACD and is see-ing strong momentum in daily stochastics.
The differential has now fallen to 26.10, the lowest point yet, while theratio has also made a new relative low at 1.60. The trade is now yielding2.46 percent with a $2,760 profit. Unless some sort of crazy news eventtranspires over the weekend, I will close half of the position on Mondaymorning. (See Figure 22.44.)
FIGURE 22.43 Anadarko 10/31
GK015-C22[143-186].qxd 6/10/04 7:37 PM Page 175 Virender Negi Quark07:BOOKS:GK015-Whistler:Quark files:
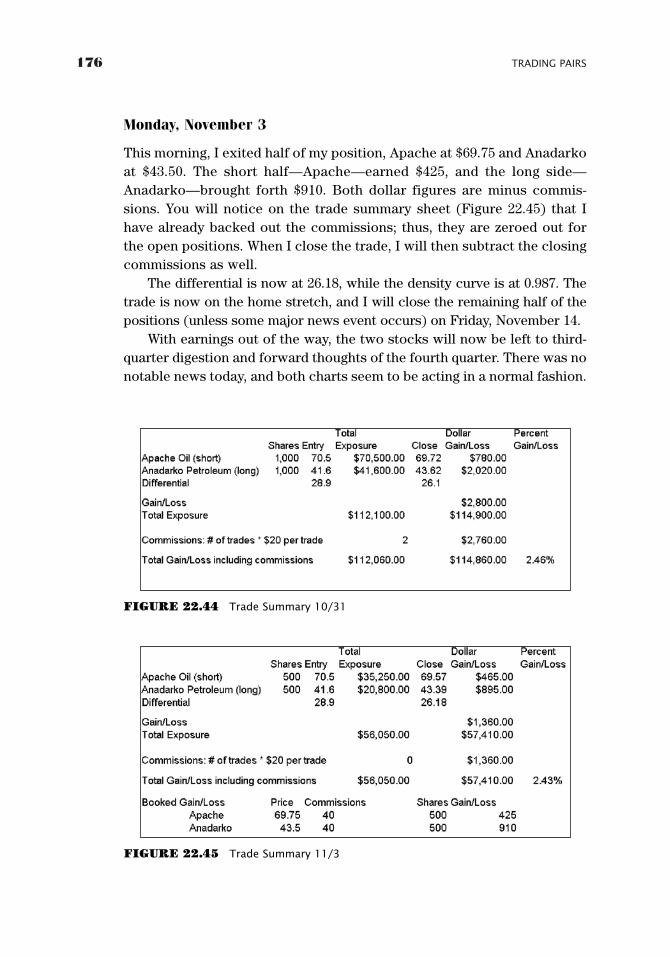
176 TRADING PAIRS
Monday, November 3
This morning, I exited half of my position, Apache at $69.75 and Anadarkoat $43.50. The short half—Apache—earned $425, and the long side—Anadarko—brought forth $910. Both dollar figures are minus commis-sions. You will notice on the trade summary sheet (Figure 22.45) that Ihave already backed out the commissions; thus, they are zeroed out forthe open positions. When I close the trade, I will then subtract the closingcommissions as well.
The differential is now at 26.18, while the density curve is at 0.987. Thetrade is now on the home stretch, and I will close the remaining half of thepositions (unless some major news event occurs) on Friday, November 14.
With earnings out of the way, the two stocks will now be left to third-quarter digestion and forward thoughts of the fourth quarter. There was nonotable news today, and both charts seem to be acting in a normal fashion.
FIGURE 22.44 Trade Summary 10/31
FIGURE 22.45 Trade Summary 11/3
GK015-C22[143-186].qxd 6/10/04 7:37 PM Page 176 Virender Negi Quark07:BOOKS:GK015-Whistler:Quark files:
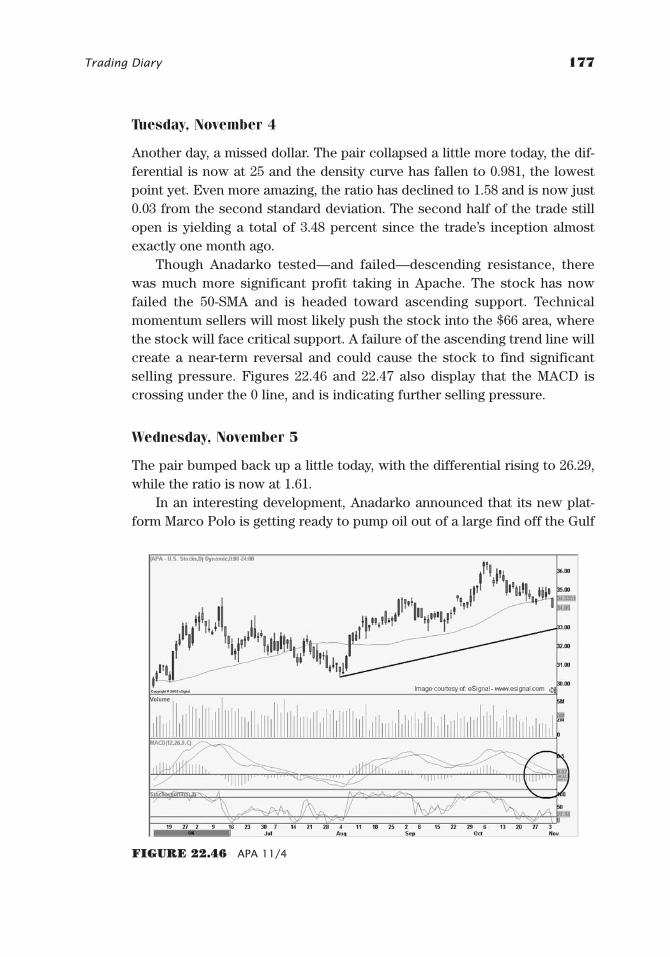
Trading Diary 177
Tuesday, November 4
Another day, a missed dollar. The pair collapsed a little more today, the dif-ferential is now at 25 and the density curve has fallen to 0.981, the lowestpoint yet. Even more amazing, the ratio has declined to 1.58 and is now just0.03 from the second standard deviation. The second half of the trade stillopen is yielding a total of 3.48 percent since the trade’s inception almostexactly one month ago.
Though Anadarko tested—and failed—descending resistance, therewas much more significant profit taking in Apache. The stock has nowfailed the 50-SMA and is headed toward ascending support. Technicalmomentum sellers will most likely push the stock into the $66 area, wherethe stock will face critical support. A failure of the ascending trend line willcreate a near-term reversal and could cause the stock to find significantselling pressure. Figures 22.46 and 22.47 also display that the MACD iscrossing under the 0 line, and is indicating further selling pressure.
Wednesday, November 5
The pair bumped back up a little today, with the differential rising to 26.29,while the ratio is now at 1.61.
In an interesting development, Anadarko announced that its new plat-form Marco Polo is getting ready to pump oil out of a large find off the Gulf
FIGURE 22.46 APA 11/4
GK015-C22[143-186].qxd 6/10/04 7:37 PM Page 177 Virender Negi Quark07:BOOKS:GK015-Whistler:Quark files:
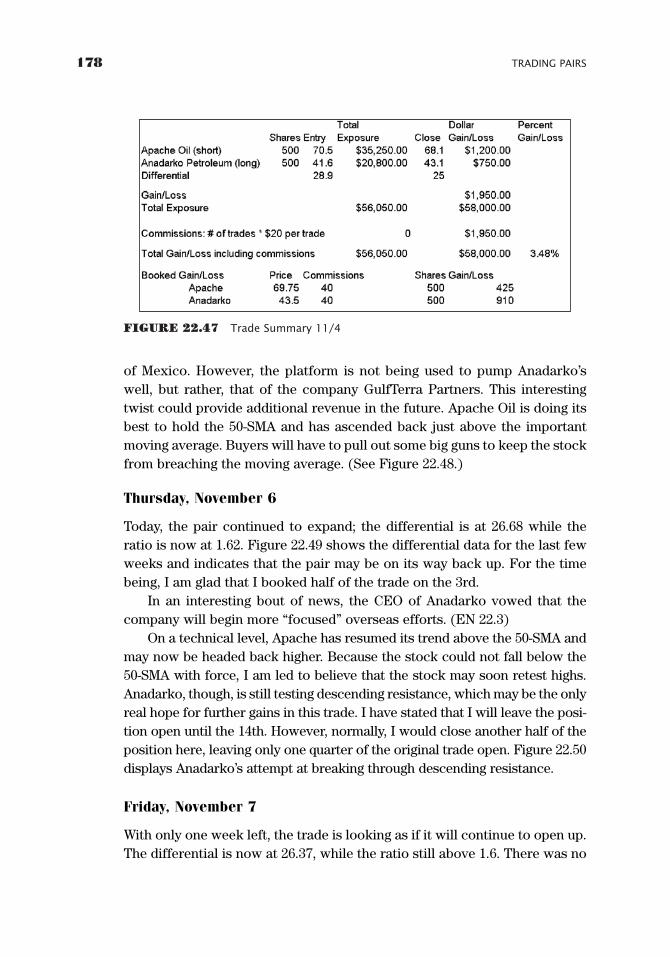
178 TRADING PAIRS
FIGURE 22.47 Trade Summary 11/4
of Mexico. However, the platform is not being used to pump Anadarko’swell, but rather, that of the company GulfTerra Partners. This interestingtwist could provide additional revenue in the future. Apache Oil is doing itsbest to hold the 50-SMA and has ascended back just above the importantmoving average. Buyers will have to pull out some big guns to keep the stockfrom breaching the moving average. (See Figure 22.48.)
Thursday, November 6
Today, the pair continued to expand; the differential is at 26.68 while theratio is now at 1.62. Figure 22.49 shows the differential data for the last fewweeks and indicates that the pair may be on its way back up. For the timebeing, I am glad that I booked half of the trade on the 3rd.
In an interesting bout of news, the CEO of Anadarko vowed that thecompany will begin more “focused” overseas efforts. (EN 22.3)
On a technical level, Apache has resumed its trend above the 50-SMA andmay now be headed back higher. Because the stock could not fall below the50-SMA with force, I am led to believe that the stock may soon retest highs.Anadarko, though, is still testing descending resistance, which may be the onlyreal hope for further gains in this trade. I have stated that I will leave the posi-tion open until the 14th. However, normally, I would close another half of theposition here, leaving only one quarter of the original trade open. Figure 22.50displays Anadarko’s attempt at breaking through descending resistance.
Friday, November 7
With only one week left, the trade is looking as if it will continue to open up.The differential is now at 26.37, while the ratio still above 1.6. There was no
GK015-C22[143-186].qxd 6/10/04 7:37 PM Page 178 Virender Negi Quark07:BOOKS:GK015-Whistler:Quark files:

Trading Diary 179
FIGURE 22.48 Trade Summary 11/5
FIGURE 22.49 Anadarko 11/6
significant news today, though on a technical level, Anadarko looks to beheaded up. The stock has built a base above the 50-SMA, and with any luck,buyers will attempt to push the stock higher. (See Figure 22.51.)
Monday, November 10
Today, the spread opened up a little more. This action is not boding well forthe trade and my instincts tell me that the trade will most likely close nearlyclose to flat, given the little amount to time that is left. However, the trade is
GK015-C22[143-186].qxd 6/10/04 7:37 PM Page 179 Virender Negi Quark07:BOOKS:GK015-Whistler:Quark files:
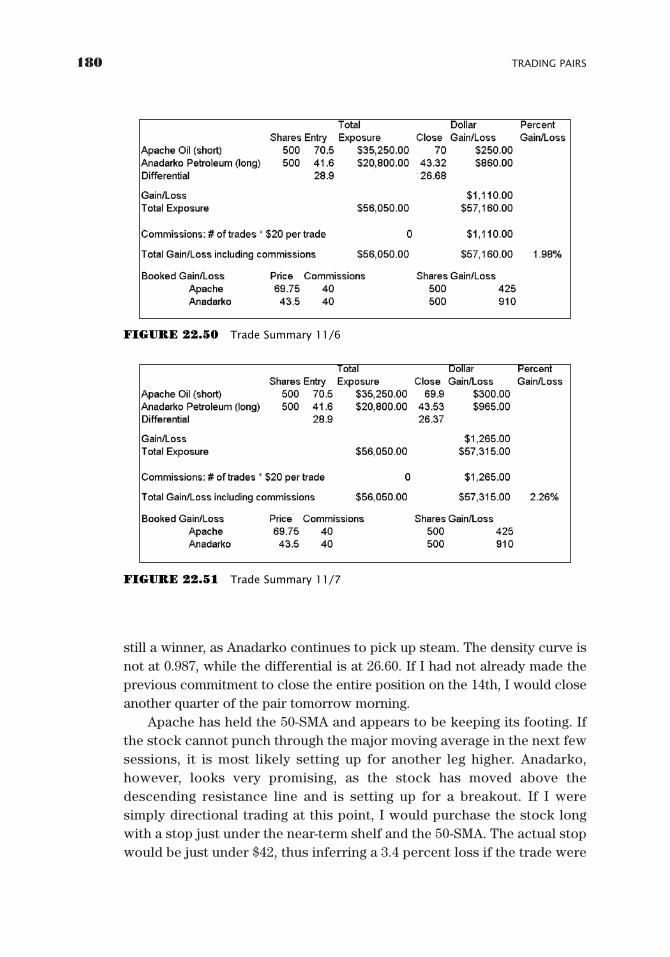
180 TRADING PAIRS
still a winner, as Anadarko continues to pick up steam. The density curve isnot at 0.987, while the differential is at 26.60. If I had not already made theprevious commitment to close the entire position on the 14th, I would closeanother quarter of the pair tomorrow morning.
Apache has held the 50-SMA and appears to be keeping its footing. Ifthe stock cannot punch through the major moving average in the next fewsessions, it is most likely setting up for another leg higher. Anadarko,however, looks very promising, as the stock has moved above thedescending resistance line and is setting up for a breakout. If I weresimply directional trading at this point, I would purchase the stock longwith a stop just under the near-term shelf and the 50-SMA. The actual stopwould be just under $42, thus inferring a 3.4 percent loss if the trade were
FIGURE 22.51 Trade Summary 11/7
FIGURE 22.50 Trade Summary 11/6
GK015-C22[143-186].qxd 6/10/04 7:37 PM Page 180 Virender Negi Quark07:BOOKS:GK015-Whistler:Quark files:
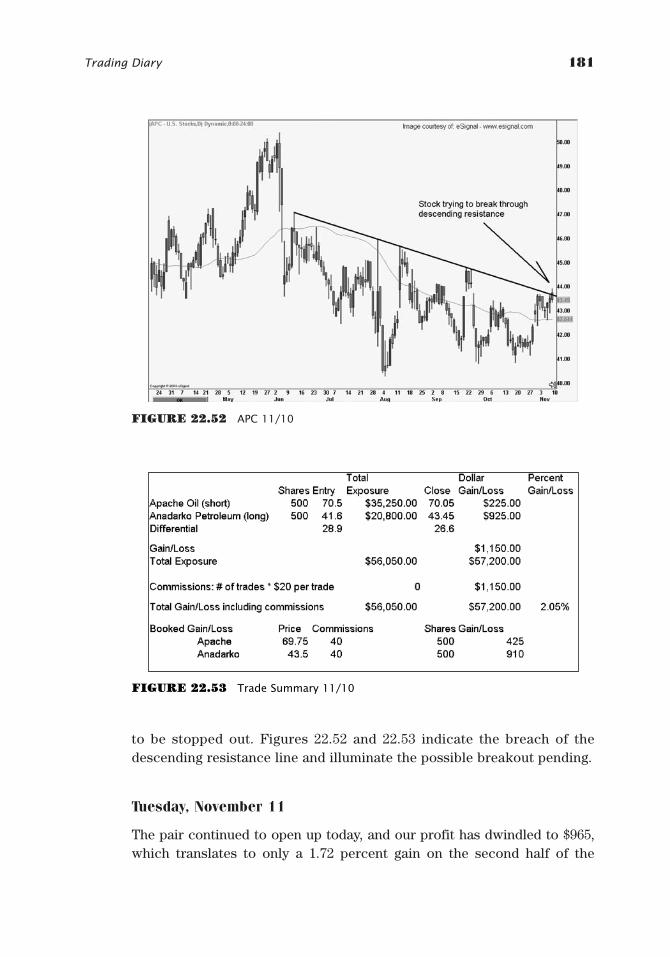
Trading Diary 181
to be stopped out. Figures 22.52 and 22.53 indicate the breach of thedescending resistance line and illuminate the possible breakout pending.
Tuesday, November 11
The pair continued to open up today, and our profit has dwindled to $965,which translates to only a 1.72 percent gain on the second half of the
FIGURE 22.52 APC 11/10
FIGURE 22.53 Trade Summary 11/10
GK015-C22[143-186].qxd 6/10/04 7:37 PM Page 181 Virender Negi Quark07:BOOKS:GK015-Whistler:Quark files:
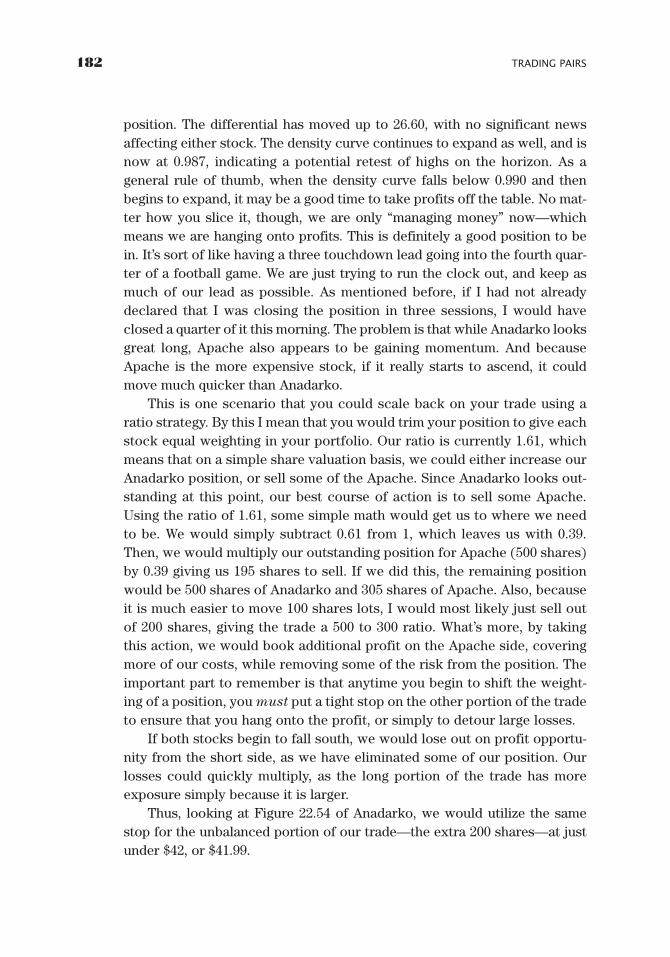
182 TRADING PAIRS
position. The differential has moved up to 26.60, with no significant newsaffecting either stock. The density curve continues to expand as well, and isnow at 0.987, indicating a potential retest of highs on the horizon. As ageneral rule of thumb, when the density curve falls below 0.990 and thenbegins to expand, it may be a good time to take profits off the table. No mat-ter how you slice it, though, we are only “managing money” now—whichmeans we are hanging onto profits. This is definitely a good position to bein. It’s sort of like having a three touchdown lead going into the fourth quar-ter of a football game. We are just trying to run the clock out, and keep asmuch of our lead as possible. As mentioned before, if I had not alreadydeclared that I was closing the position in three sessions, I would haveclosed a quarter of it this morning. The problem is that while Anadarko looksgreat long, Apache also appears to be gaining momentum. And becauseApache is the more expensive stock, if it really starts to ascend, it couldmove much quicker than Anadarko.
This is one scenario that you could scale back on your trade using aratio strategy. By this I mean that you would trim your position to give eachstock equal weighting in your portfolio. Our ratio is currently 1.61, whichmeans that on a simple share valuation basis, we could either increase ourAnadarko position, or sell some of the Apache. Since Anadarko looks out-standing at this point, our best course of action is to sell some Apache.Using the ratio of 1.61, some simple math would get us to where we needto be. We would simply subtract 0.61 from 1, which leaves us with 0.39.Then, we would multiply our outstanding position for Apache (500 shares)by 0.39 giving us 195 shares to sell. If we did this, the remaining positionwould be 500 shares of Anadarko and 305 shares of Apache. Also, becauseit is much easier to move 100 shares lots, I would most likely just sell outof 200 shares, giving the trade a 500 to 300 ratio. What’s more, by takingthis action, we would book additional profit on the Apache side, coveringmore of our costs, while removing some of the risk from the position. Theimportant part to remember is that anytime you begin to shift the weight-ing of a position, you must put a tight stop on the other portion of the tradeto ensure that you hang onto the profit, or simply to detour large losses.
If both stocks begin to fall south, we would lose out on profit opportu-nity from the short side, as we have eliminated some of our position. Ourlosses could quickly multiply, as the long portion of the trade has moreexposure simply because it is larger.
Thus, looking at Figure 22.54 of Anadarko, we would utilize the samestop for the unbalanced portion of our trade—the extra 200 shares—at justunder $42, or $41.99.
GK015-C22[143-186].qxd 6/10/04 7:37 PM Page 182 Virender Negi Quark07:BOOKS:GK015-Whistler:Quark files:
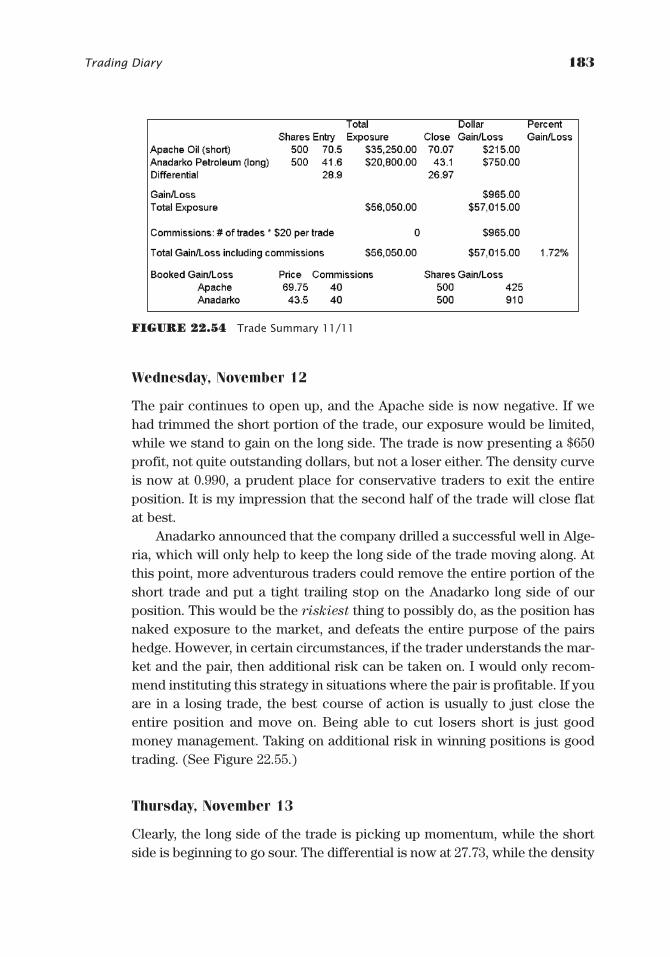
Trading Diary 183
Wednesday, November 12
The pair continues to open up, and the Apache side is now negative. If wehad trimmed the short portion of the trade, our exposure would be limited,while we stand to gain on the long side. The trade is now presenting a $650profit, not quite outstanding dollars, but not a loser either. The density curveis now at 0.990, a prudent place for conservative traders to exit the entireposition. It is my impression that the second half of the trade will close flatat best.
Anadarko announced that the company drilled a successful well in Alge-ria, which will only help to keep the long side of the trade moving along. Atthis point, more adventurous traders could remove the entire portion of theshort trade and put a tight trailing stop on the Anadarko long side of ourposition. This would be the riskiest thing to possibly do, as the position hasnaked exposure to the market, and defeats the entire purpose of the pairshedge. However, in certain circumstances, if the trader understands the mar-ket and the pair, then additional risk can be taken on. I would only recom-mend instituting this strategy in situations where the pair is profitable. If youare in a losing trade, the best course of action is usually to just close theentire position and move on. Being able to cut losers short is just goodmoney management. Taking on additional risk in winning positions is goodtrading. (See Figure 22.55.)
Thursday, November 13
Clearly, the long side of the trade is picking up momentum, while the shortside is beginning to go sour. The differential is now at 27.73, while the density
FIGURE 22.54 Trade Summary 11/11
GK015-C22[143-186].qxd 6/10/04 7:37 PM Page 183 Virender Negi Quark07:BOOKS:GK015-Whistler:Quark files:
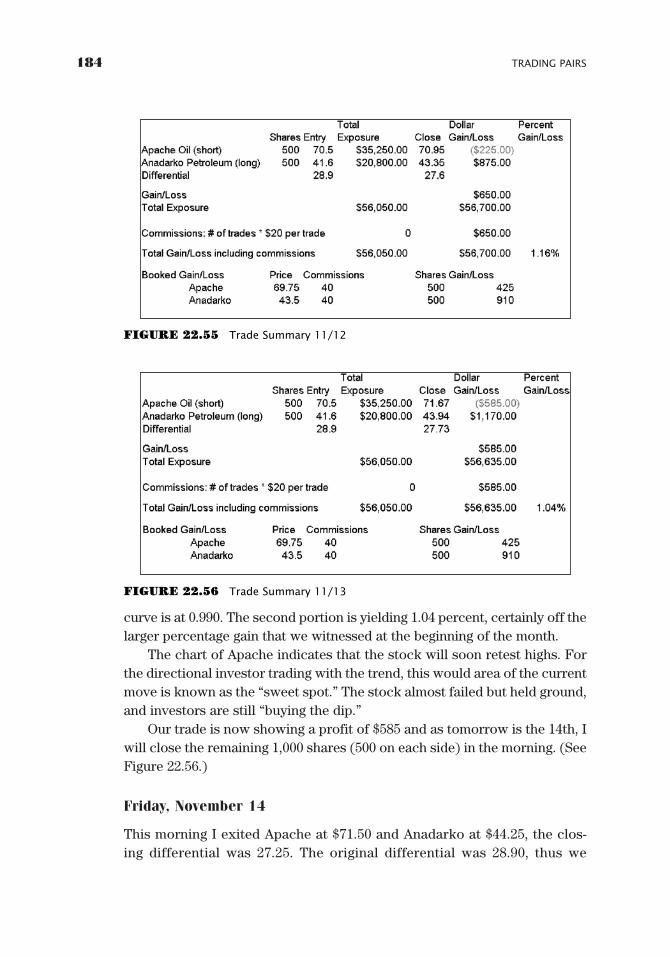
184 TRADING PAIRS
curve is at 0.990. The second portion is yielding 1.04 percent, certainly off thelarger percentage gain that we witnessed at the beginning of the month.
The chart of Apache indicates that the stock will soon retest highs. Forthe directional investor trading with the trend, this would area of the currentmove is known as the “sweet spot.” The stock almost failed but held ground,and investors are still “buying the dip.”
Our trade is now showing a profit of $585 and as tomorrow is the 14th, Iwill close the remaining 1,000 shares (500 on each side) in the morning. (SeeFigure 22.56.)
Friday, November 14
This morning I exited Apache at $71.50 and Anadarko at $44.25, the clos-ing differential was 27.25. The original differential was 28.90, thus we
FIGURE 22.55 Trade Summary 11/12
FIGURE 22.56 Trade Summary 11/13
GK015-C22[143-186].qxd 6/10/04 7:37 PM Page 184 Virender Negi Quark07:BOOKS:GK015-Whistler:Quark files:
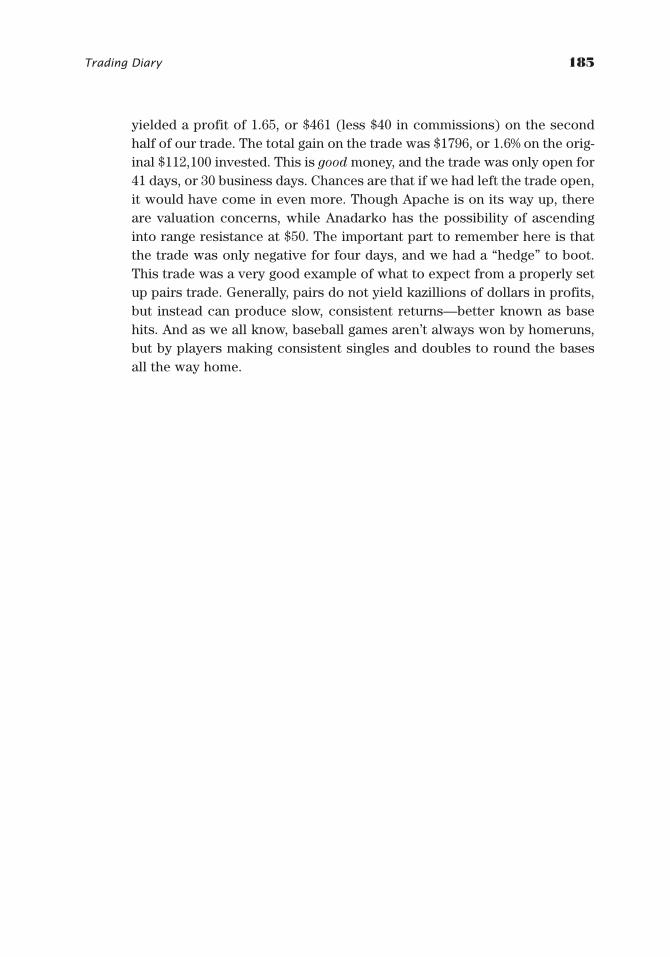
Trading Diary 185
yielded a profit of 1.65, or $461 (less $40 in commissions) on the secondhalf of our trade. The total gain on the trade was $1796, or 1.6% on the orig-inal $112,100 invested. This is good money, and the trade was only open for41 days, or 30 business days. Chances are that if we had left the trade open,it would have come in even more. Though Apache is on its way up, thereare valuation concerns, while Anadarko has the possibility of ascendinginto range resistance at $50. The important part to remember here is thatthe trade was only negative for four days, and we had a “hedge” to boot.This trade was a very good example of what to expect from a properly setup pairs trade. Generally, pairs do not yield kazillions of dollars in profits,but instead can produce slow, consistent returns—better known as basehits. And as we all know, baseball games aren’t always won by homeruns,but by players making consistent singles and doubles to round the basesall the way home.
GK015-C22[143-186].qxd 6/10/04 7:37 PM Page 185 Virender Negi Quark07:BOOKS:GK015-Whistler:Quark files:

GK015-C22[143-186].qxd 6/10/04 7:37 PM Page 186 Virender Negi Quark07:BOOKS:GK015-Whistler:Quark files:
187
CHAPTER 23
CorrelatingStocks toIndices
General Electric and
ExxonMobil
General Electric and
the DIAMONDS
ExxonMobil and the DIAMONDS
The Three Wise Men
In this chapter, we will go further into correlating stocks with indices tosee if we can find some other tradable opportunities—or at least see ifthe additional information can help you to make more informed direc-
tional trading decisions. First things first, we must set up a spreadsheet withthe proper information. For the sake of example, we will use the Dow JonesIndustrial Average, ExxonMobil, and General Electric. Figure 23.1 shows thethree together. Immediately, we can see a visual relationship, especially withExxonMobil and the Dow.
GENERAL ELECTRIC AND EXXONMOBIL
What we will do is first look at the relationship between ExxonMobil andGeneral Electric, and then cross-reference the two with the Dow. Figure 23.2shows that the two stocks are 0.58 percent correlated. While this is not anoutstanding relationship, what it does mean is that the two may provide asubstantial amount of trading opportunities, as there is plenty of divergenceand reconvergence.
It is very important to note that we made a change to the spreadsheet.On the Pair Data page, we changed the reference cells of the sheets Stock 1and Stock 2 from cell E (closing data) to cell G, to reflect the adjusted closes.
GK015-C23[187-194].qxd 6/10/04 7:37 PM Page 187 Virender Negi Quark07:BOOKS:GK015-Whistler:Quark files:
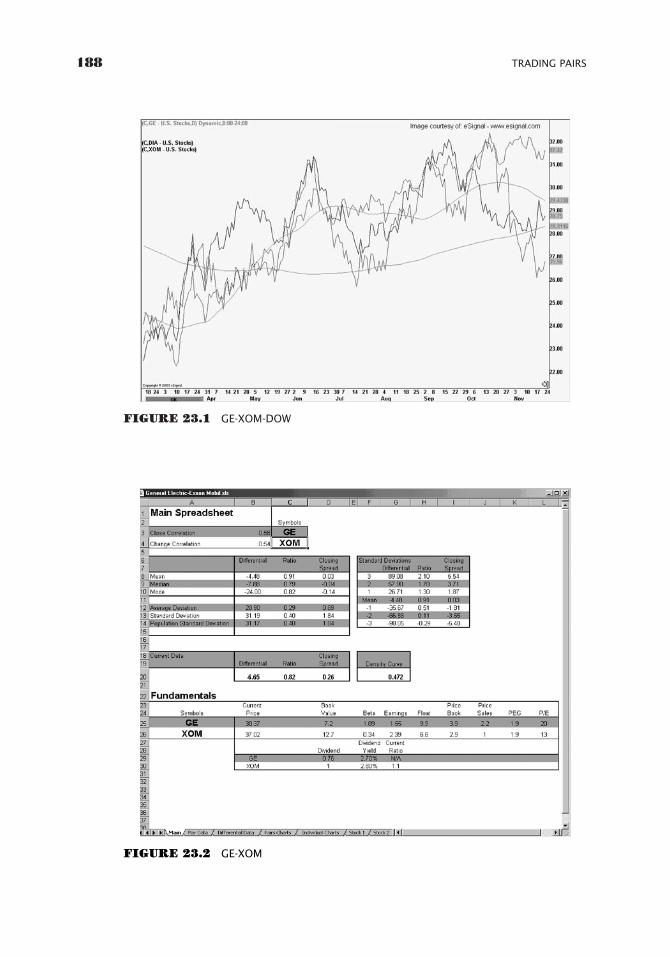
188 TRADING PAIRS
FIGURE 23.1 GE-XOM-DOW
FIGURE 23.2 GE-XOM
GK015-C23[187-194].qxd 6/10/04 7:37 PM Page 188 Virender Negi Quark07:BOOKS:GK015-Whistler:Quark files:
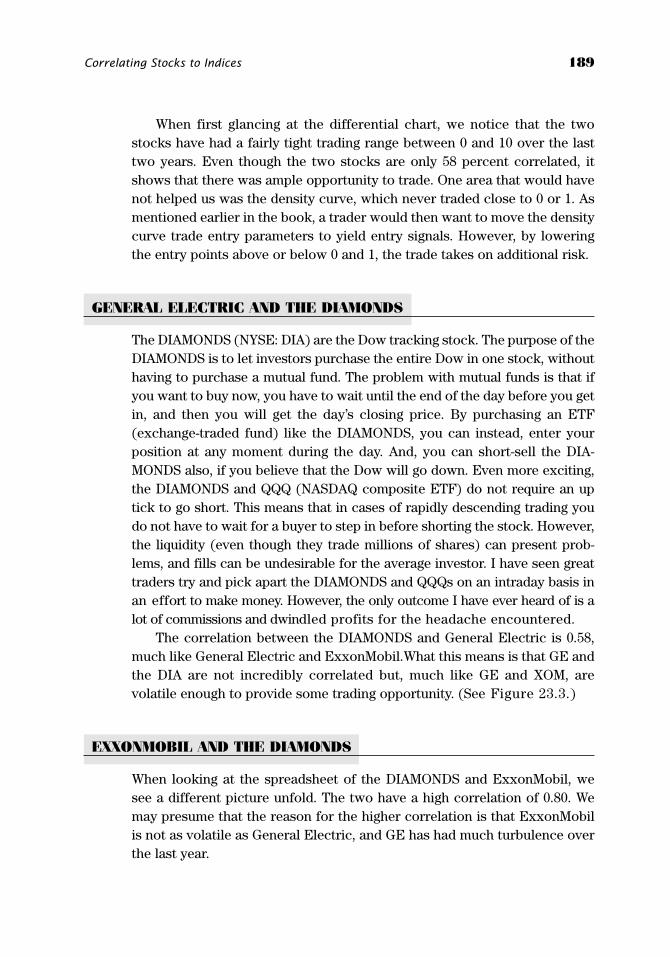
Correlating Stocks to Indices 189
When first glancing at the differential chart, we notice that the twostocks have had a fairly tight trading range between 0 and 10 over the lasttwo years. Even though the two stocks are only 58 percent correlated, itshows that there was ample opportunity to trade. One area that would havenot helped us was the density curve, which never traded close to 0 or 1. Asmentioned earlier in the book, a trader would then want to move the densitycurve trade entry parameters to yield entry signals. However, by loweringthe entry points above or below 0 and 1, the trade takes on additional risk.
GENERAL ELECTRIC AND THE DIAMONDS
The DIAMONDS (NYSE: DIA) are the Dow tracking stock. The purpose of theDIAMONDS is to let investors purchase the entire Dow in one stock, withouthaving to purchase a mutual fund. The problem with mutual funds is that ifyou want to buy now, you have to wait until the end of the day before you getin, and then you will get the day’s closing price. By purchasing an ETF(exchange-traded fund) like the DIAMONDS, you can instead, enter yourposition at any moment during the day. And, you can short-sell the DIA-MONDS also, if you believe that the Dow will go down. Even more exciting,the DIAMONDS and QQQ (NASDAQ composite ETF) do not require an uptick to go short. This means that in cases of rapidly descending trading youdo not have to wait for a buyer to step in before shorting the stock. However,the liquidity (even though they trade millions of shares) can present prob-lems, and fills can be undesirable for the average investor. I have seen greattraders try and pick apart the DIAMONDS and QQQs on an intraday basis inan effort to make money. However, the only outcome I have ever heard of is alot of commissions and dwindled profits for the headache encountered.
The correlation between the DIAMONDS and General Electric is 0.58,much like General Electric and ExxonMobil.What this means is that GE andthe DIA are not incredibly correlated but, much like GE and XOM, arevolatile enough to provide some trading opportunity. (See Figure 23.3.)
EXXONMOBIL AND THE DIAMONDS
When looking at the spreadsheet of the DIAMONDS and ExxonMobil, wesee a different picture unfold. The two have a high correlation of 0.80. Wemay presume that the reason for the higher correlation is that ExxonMobilis not as volatile as General Electric, and GE has had much turbulence overthe last year.
GK015-C23[187-194].qxd 6/10/04 7:37 PM Page 189 Virender Negi Quark07:BOOKS:GK015-Whistler:Quark files:
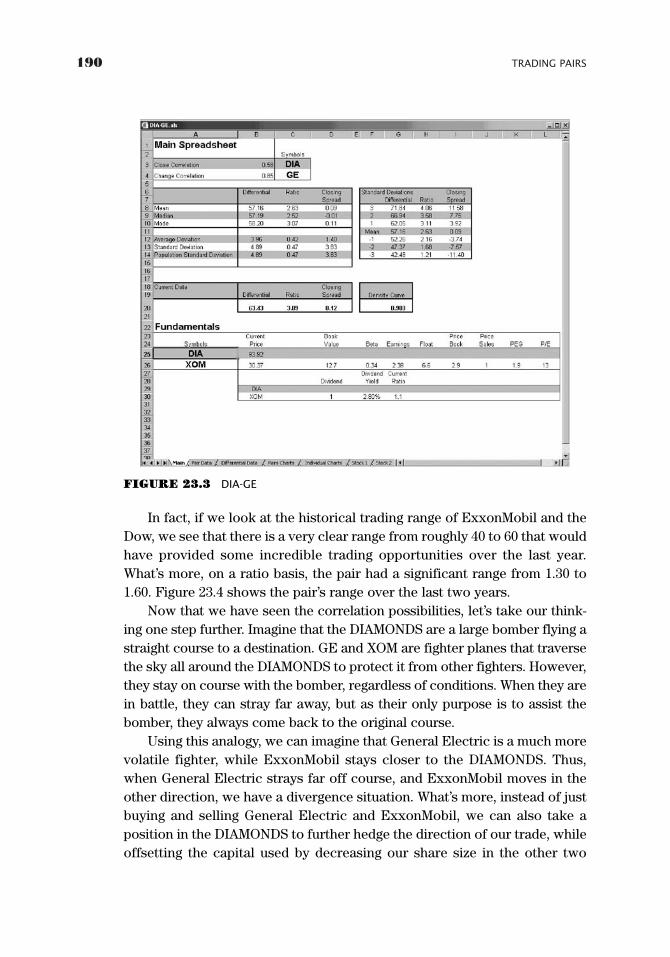
190 TRADING PAIRS
FIGURE 23.3 DIA-GE
In fact, if we look at the historical trading range of ExxonMobil and theDow, we see that there is a very clear range from roughly 40 to 60 that wouldhave provided some incredible trading opportunities over the last year.What’s more, on a ratio basis, the pair had a significant range from 1.30 to1.60. Figure 23.4 shows the pair’s range over the last two years.
Now that we have seen the correlation possibilities, let’s take our think-ing one step further. Imagine that the DIAMONDS are a large bomber flying astraight course to a destination. GE and XOM are fighter planes that traversethe sky all around the DIAMONDS to protect it from other fighters. However,they stay on course with the bomber, regardless of conditions. When they arein battle, they can stray far away, but as their only purpose is to assist thebomber, they always come back to the original course.
Using this analogy, we can imagine that General Electric is a much morevolatile fighter, while ExxonMobil stays closer to the DIAMONDS. Thus,when General Electric strays far off course, and ExxonMobil moves in theother direction, we have a divergence situation. What’s more, instead of justbuying and selling General Electric and ExxonMobil, we can also take aposition in the DIAMONDS to further hedge the direction of our trade, whileoffsetting the capital used by decreasing our share size in the other two
GK015-C23[187-194].qxd 6/10/04 7:37 PM Page 190 Virender Negi Quark07:BOOKS:GK015-Whistler:Quark files:
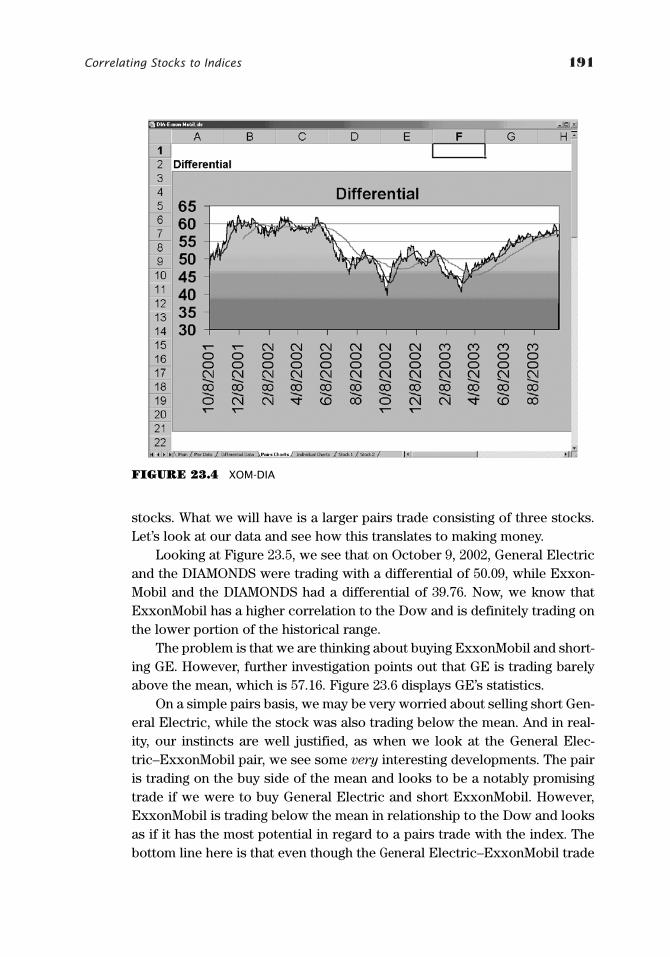
Correlating Stocks to Indices 191
FIGURE 23.4 XOM-DIA
stocks. What we will have is a larger pairs trade consisting of three stocks.Let’s look at our data and see how this translates to making money.
Looking at Figure 23.5, we see that on October 9, 2002, General Electricand the DIAMONDS were trading with a differential of 50.09, while Exxon-Mobil and the DIAMONDS had a differential of 39.76. Now, we know thatExxonMobil has a higher correlation to the Dow and is definitely trading onthe lower portion of the historical range.
The problem is that we are thinking about buying ExxonMobil and short-ing GE. However, further investigation points out that GE is trading barelyabove the mean, which is 57.16. Figure 23.6 displays GE’s statistics.
On a simple pairs basis, we may be very worried about selling short Gen-eral Electric, while the stock was also trading below the mean. And in real-ity, our instincts are well justified, as when we look at the General Elec-tric–ExxonMobil pair, we see some very interesting developments. The pairis trading on the buy side of the mean and looks to be a notably promisingtrade if we were to buy General Electric and short ExxonMobil. However,ExxonMobil is trading below the mean in relationship to the Dow and looksas if it has the most potential in regard to a pairs trade with the index. Thebottom line here is that even though the General Electric–ExxonMobil trade
GK015-C23[187-194].qxd 6/10/04 7:37 PM Page 191 Virender Negi Quark07:BOOKS:GK015-Whistler:Quark files:
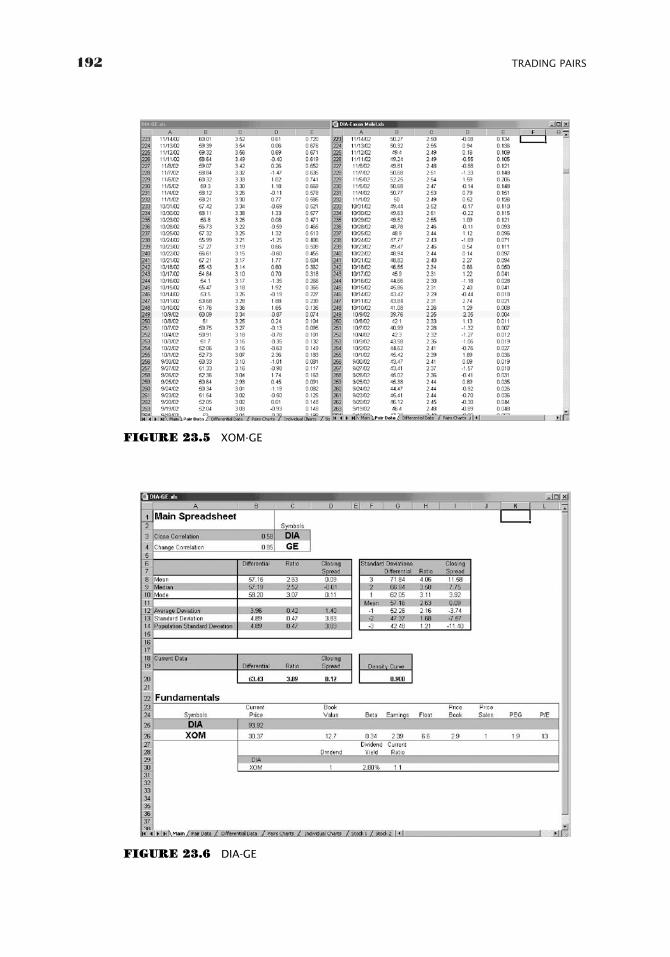
192 TRADING PAIRS
FIGURE 23.5 XOM-GE
FIGURE 23.6 DIA-GE
GK015-C23[187-194].qxd 6/10/04 7:37 PM Page 192 Virender Negi Quark07:BOOKS:GK015-Whistler:Quark files:
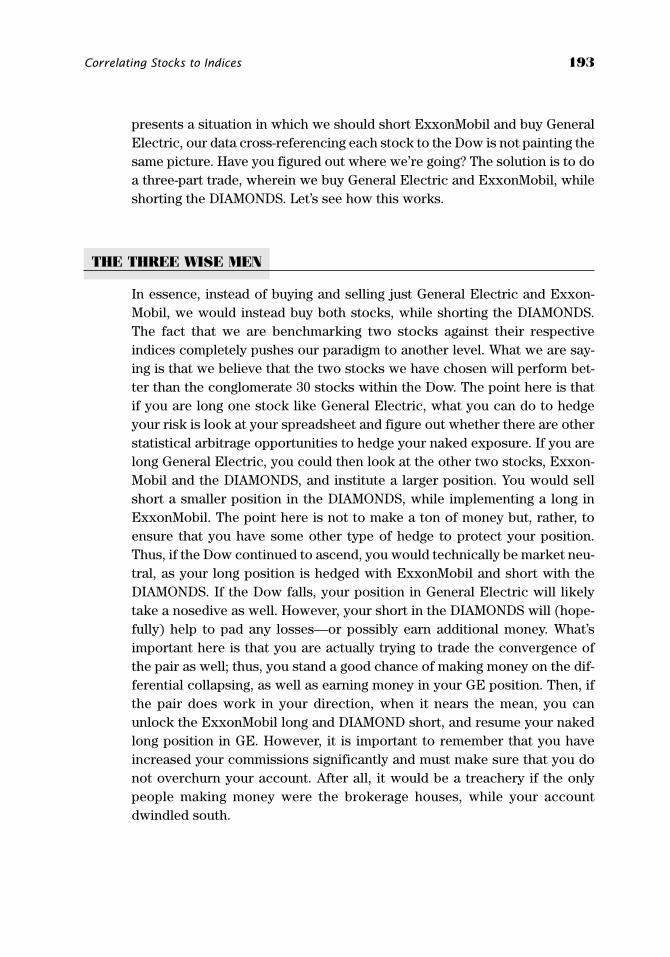
presents a situation in which we should short ExxonMobil and buy GeneralElectric, our data cross-referencing each stock to the Dow is not painting thesame picture. Have you figured out where we’re going? The solution is to doa three-part trade, wherein we buy General Electric and ExxonMobil, whileshorting the DIAMONDS. Let’s see how this works.
THE THREE WISE MEN
In essence, instead of buying and selling just General Electric and Exxon-Mobil, we would instead buy both stocks, while shorting the DIAMONDS.The fact that we are benchmarking two stocks against their respectiveindices completely pushes our paradigm to another level. What we are say-ing is that we believe that the two stocks we have chosen will perform bet-ter than the conglomerate 30 stocks within the Dow. The point here is thatif you are long one stock like General Electric, what you can do to hedgeyour risk is look at your spreadsheet and figure out whether there are otherstatistical arbitrage opportunities to hedge your naked exposure. If you arelong General Electric, you could then look at the other two stocks, Exxon-Mobil and the DIAMONDS, and institute a larger position. You would sellshort a smaller position in the DIAMONDS, while implementing a long inExxonMobil. The point here is not to make a ton of money but, rather, toensure that you have some other type of hedge to protect your position.Thus, if the Dow continued to ascend, you would technically be market neu-tral, as your long position is hedged with ExxonMobil and short with theDIAMONDS. If the Dow falls, your position in General Electric will likelytake a nosedive as well. However, your short in the DIAMONDS will (hope-fully) help to pad any losses—or possibly earn additional money. What’simportant here is that you are actually trying to trade the convergence ofthe pair as well; thus, you stand a good chance of making money on the dif-ferential collapsing, as well as earning money in your GE position. Then, ifthe pair does work in your direction, when it nears the mean, you canunlock the ExxonMobil long and DIAMOND short, and resume your nakedlong position in GE. However, it is important to remember that you haveincreased your commissions significantly and must make sure that you donot overchurn your account. After all, it would be a treachery if the onlypeople making money were the brokerage houses, while your accountdwindled south.
Correlating Stocks to Indices 193
GK015-C23[187-194].qxd 6/10/04 7:37 PM Page 193 Virender Negi Quark07:BOOKS:GK015-Whistler:Quark files:

GK015-C23[187-194].qxd 6/10/04 7:37 PM Page 194 Virender Negi Quark07:BOOKS:GK015-Whistler:Quark files:
195
Options are financial derivatives that give the owner the right, but notthe obligation, to buy or sell the underlying financial instrument for acertain period of time, at a specified price. There are two types of
options: call options and put options. It is important to note that the owner ofan option never has an obligation, but the seller of the option does have anobligation to either sell the shares of the underlying instrument (in the caseof a call) or to purchase the shares of the underlying instrument (in the caseof a put). It is completely up to the owner of the option to decide whether toexercise the option or not. Once the seller has sold the contract he is at themercy of the contract owner. The owner can always just let the option expireworthless—he or she would lose the money invested, but has no further risk.
On a more basic level, option contracts can be classified in one of twoways—as an American option or as a European option. With an Americanoption, the contract owner can exercise the option at any point in time upuntil the contract expiration date. Contrastingly, European options can onlybe exercised on the expiration date. Because of the added flexibility withregard to the ability to exercise the option contract, an American option willalways be worth more than a European option, except for on the expirationdate. On the date of expiration, both the American option and the Europeanoption will have the same value. The contract owner has until the optionexpiration date to exercise the contract. That given amount of time is knownas the time until expiration. Option contracts expire on the Saturday follow-ing the third Friday of each month (only for U.S. equity options).
There are many reasons and strategies for trading options. For many peo-ple the primary reason is that it increases the leverage you can get out of a
CHAPTER 24
Option Basics Scott P. Evans
GK015-C24[195-200].qxd 6/10/04 7:38 PM Page 195 Virender Negi Quark07:BOOKS:GK015-Whistler:Quark files:

limited amount of money. Since the premium paid to purchase the option isusually a fraction of the cost of the underlying instrument, you can controllarger positions with a lot less money. Additionally, a single stock option(100 shares of stock) controls 100 shares of the underlying stock so you geteven more leverage out of your money. Another reason that people tradeoptions is to generate income. Options sellers receive a premium when theysell the options contracts; sometimes this can be a risky proposition, but incertain circumstances it can be a safe, income-producing strategy. One otherreason people trade options is to hedge a portfolio. This strategy is most com-monly used by institutional traders and people who want to protect large port-folios. The most widely used strategy to hedge a portfolio is to buy puts. If youown a large portfolio and believe that the market is going to decline, insteadof selling out of all of your positions you can buy puts (usually on an index)and you will make up the money that you have lost on your portfolio during amarket drop with the gains you will make on the put options. Figuring out theexact put ratio can be a difficult task because you have to calculate how highlycorrelated your portfolio is to the returns on the index that you are using tohedge. Once you have figured out the relationship of returns between yourportfolio and the index, you purchase a proportionate amount of puts so thatthe value of your portfolio is protected. This sounds like a wonderful strategy,but it is actually difficult and expensive to execute. The relationship betweenthe volatility of your portfolio and the index underlying the put options willchange over time, and to remain completely hedged, put contracts must bebought or sold in order to keep the proportions in line. All of the buying andselling of put options generates large amount of transaction costs. Further-more, when the put options expire they must be replaced with contracts thathave later expirations. This too adds to the expense of the strategy. That iswhy the strategy is primarily used by institutions.
Options contracts can be traded on a variety of financial instruments.Foremost among these is the single stock option, an option written on onespecific underlying stock. There are also index options written on a variety offinancial indexes such as the Standard & Poor’s (S&P) 500, the NASDAQComposite, or the Dow Jones Industrial Index. Options contracts are alsowritten on foreign currencies. The underlying financial instrument is a unit ofthe foreign currency such as a Canadian dollar or a German deutsche mark.If you believe that the value of the foreign currency is going to appreciate, youcan buy a call on the currency, and if you are right you will make the differencebetween the strike price and the new price of the currency (less the premiumpaid). Finally, there are options on futures. In this case the underlying instru-ment is a futures contract. Futures contracts can be written on a large number
196 TRADING PAIRS
GK015-C24[195-200].qxd 6/10/04 7:38 PM Page 196 Virender Negi Quark07:BOOKS:GK015-Whistler:Quark files:
of goods. Many futures contracts are written on agricultural goods, preciousmetals, financial indexes, and foreign currencies. Unlike equity all optionscontracts, the purchaser of the futures contract has an obligation to purchasethe underlying instrument for a specified price for a specified length of time.
In an options transaction the buyer of the option contract pays the sellera premium for the right to call away (buy) the underlying shares of stock at aspecified price for a certain length of time (in a call transaction) or to force theseller to purchase the underlying shares from the purchaser at a specifiedprice for a certain length of time (in a put transaction). Subsequently, there isa greater risk of loss for the seller of the option contract than there is for thepurchaser. The greatest amount of money that the buyer of the option contractcan lose is limited to the premium that he or she pays for the contract. Con-versely, the seller of the option can theoretically have unlimited losses in spe-cific situations. When the seller of a call option does not own the underlyingsecurity, he or she is known to have sold (or “written”) a naked call option.This position creates the single greatest potential for losses in options trading.For example, if a call was written on a stock with a strike price of $20 for a $3premium and the price of the underlying stock climbs to $50, the writer of thecall would lose $30 less the $3 premium that he or she was paid. In this trans-action, the purchaser of the option contract would call away the underlyingstock from the seller and pay him $20 per share for the stock. Remember, theseller of the option does not own the underlying security, so she must go outinto the open market and purchase the shares for $50 apiece. It is importantto note that each stock option contract controls 100 shares of the underlyingsecurity. Thus, it is easy to see how quickly the losses can add up when sellingnaked calls. If the seller had sold 10 contracts, the buyer would have the rightto purchase 1,000 shares of the stock at $20 and the seller would have lost$27,000 ($50 minus the $3 premium, minus the $20 he or she received from thebuyer, multiplied by 1,000 shares). This is obviously a very risky position totake because theoretically there is no ceiling for your losses—a stock’s pricecould rise to an unlimited value. Similarly, the purchaser of a call option con-ceptually can experience unlimited gains. The easiest way to explain the over-all strategy for options is that buying a call is much like going long the under-lying security, and buying a put is similar to going short the underlyingsecurity. If you believe the price of the underlying stock is going to appreciate,you would want to buy a call option. If you believe that the price of the under-lying stock is going to decrease, you would buy a put option. Meanwhile, anoption seller is simply trying to generate the option premiums. It is much saferto be the buyer of any option than to be the seller, except for when you arewriting covered calls, which will be discussed later in the chapter.
Option Basics 197
GK015-C24[195-200].qxd 6/10/04 7:38 PM Page 197 Virender Negi Quark07:BOOKS:GK015-Whistler:Quark files:
Writing put options is also a very risky proposition, but there is a limit tothe losses that the seller can sustain. Since a stock’s price cannot sink below$0, the most a put writer can lose is the exercise price of the option less thepremium they received. If a put was sold with a strike price of $20 and theseller received a $3 premium, then the most they can lose would be $17 pershare. This works the same way for the purchaser of the put option—his orher gains would be limited by the difference between the exercise price andzero, less the premium paid.
The price of the premium paid for an option contract varies accordingto several factors. First and foremost is whether the option is in-the-money
or out-of-the-money. These terms relate to the current price of the underly-ing stock (or index, future’s contract, etc.) in comparison to the strike priceof the option. For a call option the contract will be in-the-money if the cur-rent price of the stock is above the strike price for the option. Referring toour previous example, a call option is written with a strike price of $20. Ifthe price of the stock is above $20, the option contract is considered to bein-the-money. This is because the owner of the contract could exercise thecontract at that time and would receive a gain of some magnitude. Ofcourse, the contract owner had to pay a premium for the option contract,so in our example with a $3 premium having been paid, the stock wouldhave to be trading above $23 for the contract owner to make a profit on thetransaction, although if the stock were trading between $20 and $23,the option owner could still recoup some of the premium paid by exercis-ing the option. For a put contract the relationship is reversed; if the price ofthe stock is below the strike price of the contract, the option is consideredto be in-the-money. If a put contract has a strike price of $20 and the stockis trading at $15, the owner of the put could go out in the open market andpurchase the underlying stock for $15, and the seller of the put would haveto purchase the stock from the option owner for $20, thereby locking in aprofit for the owner.
The opposite is true for an out-of-the-money option contract. A calloption is out-of-the-money when the price of the underlying stock is belowthe exercise price of the option. This contract would not be exercisedbecause the underlying stock could be purchased in the open market for lessthan the contract owner would have to pay if he or she exercised the option.Similarly, a put contract is out-of-the-money if the price of the stock is abovethe strike price of the option contract. It would not make sense to exercisethis contract either, because the contract owner would be purchasing thestock in the open market at a higher price than he or she would receive fromthe contract seller. Buying high and selling lower is not a very good strategyto make money by trading options.
198 TRADING PAIRS
GK015-C24[195-200].qxd 6/10/04 7:38 PM Page 198 Virender Negi Quark07:BOOKS:GK015-Whistler:Quark files:
There are really two components to the premium price of an option:extrinsic value and in-the-money value. Extrinsic value is simply the conceptthat the farther away the contract expiration date, the more valuable theoption. This is because the price of the underlying stock has the probability ofmoving to a much greater extent over a longer period of time. An option con-tract that has two weeks to expiration is much less valuable than one with twomonths to expiration (neglecting for a second in-the-money issue). The sec-ond component to option premium pricing is the in-the-money value. If anoption is in-the-money, the option seller must be compensated for that value.Otherwise (in a vacuum, but not reality), traders would simply purchase in-the-money contracts, immediately exercise them, and take a profit on thetransaction. Once again, we will use the prior example of an option contractwith a strike price of $20. If the stock is trading at $25, the premium for theoption will have to be at least $5 to make up for the guaranteed gain. Mostlikely, unless the option is at expiration, there will be an additional amountadded to the in-the-money amount to account for the intrinsic-value aspect.There are a few other things that can affect the premium charged for anoption. The volatility of the underlying stock has a lot to do with premiumpricing. A high-volatility stock, say with a standard deviation of 30 percent,would have a much higher premium than a lower volatility stock with a stan-dard deviation of 10 percent. The reason for this is similar to the time-valueconcept; the high-volatility stock has a much greater probability of experienc-ing dramatic price swings than the lower volatility stock, and consequentlycreates a greater risk of loss to the option seller. As with any situation in theinvestment world, risk must always be compensated. One final note on optionpremium pricing: Generally, the higher the price of the underlying stock, thehigher the premium price for the option, all else being equal.
As previously mentioned, there is a safe income-producing strategyknown as covered call writing. A covered call is the term given to the situa-tion in which the call writer actually owns shares of the underlying security(in proportion to the number of call options they have sold). The call writerreceives the premiums from the purchaser and if the stock gets called awayfrom him he will also receive the exercise price of the call option. The riskin this transaction is purely the opportunity cost if the stock’s price rises andit gets called away. The call writer will not actually lose any money becausehe can simply deliver the stock that he already owns, but he will miss out onthe gains that would have been attained had he still owned the underlyingstock. For that reason, most writers of covered calls hope that the stock’sprice remains around the exercise price of the calls so the option will expireworthless. That way, the covered call writer receives the premiums paid andstill gets to keep the stock.
Option Basics 199
GK015-C24[195-200].qxd 6/10/04 7:38 PM Page 199 Virender Negi Quark07:BOOKS:GK015-Whistler:Quark files:
Another fairly basic options strategy is referred to as a straddle. A strad-dle occurs when a call and a put are bought with the same exercise price andthe same expiration date. The purpose of a straddle is that the owner shouldmake money if there is any price volatility, regardless of the direction of themovement. If both a call and a put are bought with a strike price of $20 andthe stock price either gains or loses $5 in value, the owner of the straddle willface the same payoff profile whether the stock price moves up or down. If thestock price advances to $25 and the call option is exercised, the option ownerwill make $5 (disregarding the premiums paid) and the put option wouldexpire worthless. If the stock price declines to $15, the put option would bein-the-money by $5 and the call option would expire worthless. Unfortu-nately, if the stock price remains relatively unchanged both the call and theput option will expire worthless. It is for this reason that the straddle strat-egy is most effective when used with high-volatility underlying stocks. Thehigher-volatility stocks by nature have a greater probability of price move-ment and this increases the probability that one side of the straddle will fin-ish in the money. One application of this strategy is, using technical analysis,to buy a straddle with an exercise price that corresponds to a support orresistance level for a stock. That way, whether the stock breaks out or pullsback, as long as there is some price movement, your straddle will finish in-the-money.
Options trading has many applications in the investment world and is auseful tool to leverage your money, to hedge a portfolio, and for risk man-agement purposes—usually used by financial institutions. The last majoradvantage of trading options is that options do not have symmetrical payoffprofiles. You can limit your downside risk by purchasing options rather thanthe underlying stock because when buying options the maximum amountyou can possibly lose is the price of the option premium. When purchasingstocks your maximum loss potential is the price of the stock, or all themoney that you have invested. It is even worse if you are shorting stocksrather than buying puts because, as we discussed previously (when talkingabout selling calls), the potential loss is theoretically unlimited since stockshave no ceiling above which they cannot rise. Trading options can be a verylucrative investment strategy, but it should be approached with caution. Ifyou are writing calls and puts, you can quickly get yourself into a dangerousloss position, and if you are buying options, you can end up paying a lot ofmoney in premiums and have your options expire worthless. It is a good ideato educate yourself about the process as much as possible and then to prac-tice by paper trading before you actually start working with real money.
200 TRADING PAIRS
GK015-C24[195-200].qxd 6/10/04 7:38 PM Page 200 Virender Negi Quark07:BOOKS:GK015-Whistler:Quark files:
201
WHAT IS VOLATILITY?
To begin, the definition of volatility is generally known as the speed of themarket. (EN 25.1) By this, volatility is known as the speed at which yourposition moves up or down. Volatility is the percentage change of the stockover a given period of time. A stock that moves 2 points in two years has lessvolatility than a stock that moves 20. Though this concept is extremely sim-ple, you will soon see that it has a wide variety of uses when trading pairs,stocks, and/or equities.
To further expand on our definition, volatility is known as the time ittakes for a position to move. Volatility can also be incorporated in our sta-tistics to provide a better indication of our position sizing, along with help-ing us decide what types of option strategies to implement.
VOLATILITY POSITION SIZING IN YOUR SPREADSHEET
Volatility can be a little confusing at first, as some can mistake the conceptas an absolute percentage changes over a period of time. However, this isincorrect. Instead, volatility is a concept of speed that can have either apositive or negative impact. When we look at our KLAC/NVLS spreadsheet(titled KLAC-NVLS-Volatility on the CD-ROM), you will find the simple one-year volatility number located in each individual stock’s worksheet and the
CHAPTER 25
UnderstandingVolatility
What Is Volatility?
Volatility Position Sizing
in Your Spreadsheet
Volatility and the
Individual Stock
Weighted Volatility
GK015-C25[201-206].qxd 6/10/04 7:38 PM Page 201 Virender Negi Quark07:BOOKS:GK015-Whistler:Quark files:
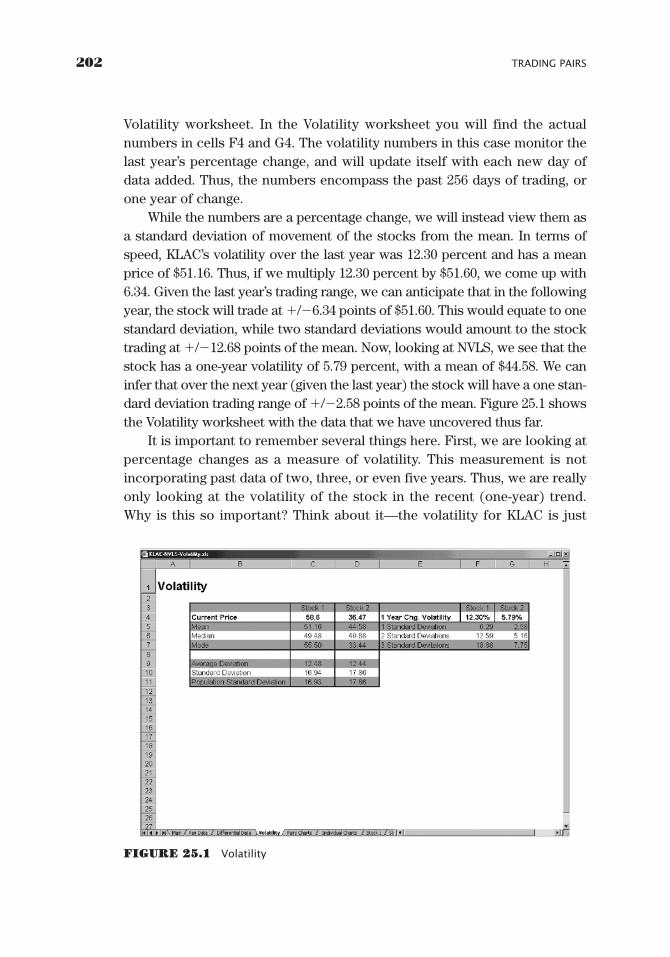
Volatility worksheet. In the Volatility worksheet you will find the actualnumbers in cells F4 and G4. The volatility numbers in this case monitor thelast year’s percentage change, and will update itself with each new day ofdata added. Thus, the numbers encompass the past 256 days of trading, orone year of change.
While the numbers are a percentage change, we will instead view them asa standard deviation of movement of the stocks from the mean. In terms ofspeed, KLAC’s volatility over the last year was 12.30 percent and has a meanprice of $51.16. Thus, if we multiply 12.30 percent by $51.60, we come up with6.34. Given the last year’s trading range, we can anticipate that in the followingyear, the stock will trade at �/�6.34 points of $51.60. This would equate to onestandard deviation, while two standard deviations would amount to the stocktrading at �/�12.68 points of the mean. Now, looking at NVLS, we see that thestock has a one-year volatility of 5.79 percent, with a mean of $44.58. We caninfer that over the next year (given the last year) the stock will have a one stan-dard deviation trading range of �/�2.58 points of the mean. Figure 25.1 showsthe Volatility worksheet with the data that we have uncovered thus far.
It is important to remember several things here. First, we are looking atpercentage changes as a measure of volatility. This measurement is notincorporating past data of two, three, or even five years. Thus, we are reallyonly looking at the volatility of the stock in the recent (one-year) trend.Why is this so important? Think about it—the volatility for KLAC is just
202 TRADING PAIRS
FIGURE 25.1 Volatility
GK015-C25[201-206].qxd 6/10/04 7:38 PM Page 202 Virender Negi Quark07:BOOKS:GK015-Whistler:Quark files:
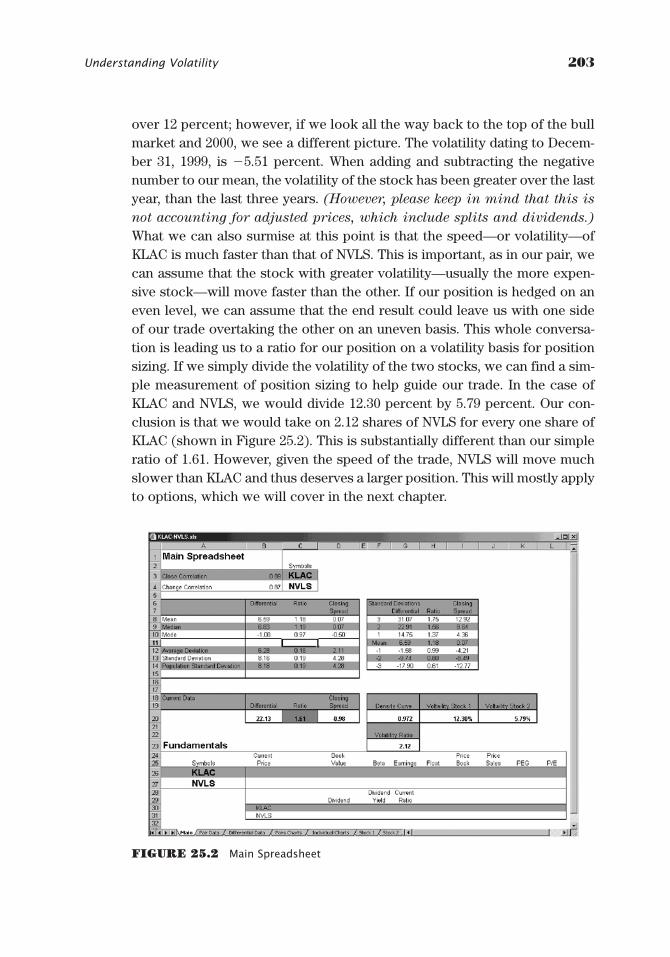
over 12 percent; however, if we look all the way back to the top of the bullmarket and 2000, we see a different picture. The volatility dating to Decem-ber 31, 1999, is �5.51 percent. When adding and subtracting the negativenumber to our mean, the volatility of the stock has been greater over the lastyear, than the last three years. (However, please keep in mind that this is
not accounting for adjusted prices, which include splits and dividends.)
What we can also surmise at this point is that the speed—or volatility—ofKLAC is much faster than that of NVLS. This is important, as in our pair, wecan assume that the stock with greater volatility—usually the more expen-sive stock—will move faster than the other. If our position is hedged on aneven level, we can assume that the end result could leave us with one sideof our trade overtaking the other on an uneven basis. This whole conversa-tion is leading us to a ratio for our position on a volatility basis for positionsizing. If we simply divide the volatility of the two stocks, we can find a sim-ple measurement of position sizing to help guide our trade. In the case ofKLAC and NVLS, we would divide 12.30 percent by 5.79 percent. Our con-clusion is that we would take on 2.12 shares of NVLS for every one share ofKLAC (shown in Figure 25.2). This is substantially different than our simpleratio of 1.61. However, given the speed of the trade, NVLS will move muchslower than KLAC and thus deserves a larger position. This will mostly applyto options, which we will cover in the next chapter.
Understanding Volatility 203
FIGURE 25.2 Main Spreadsheet
GK015-C25[201-206].qxd 6/10/04 7:38 PM Page 203 Virender Negi Quark07:BOOKS:GK015-Whistler:Quark files:
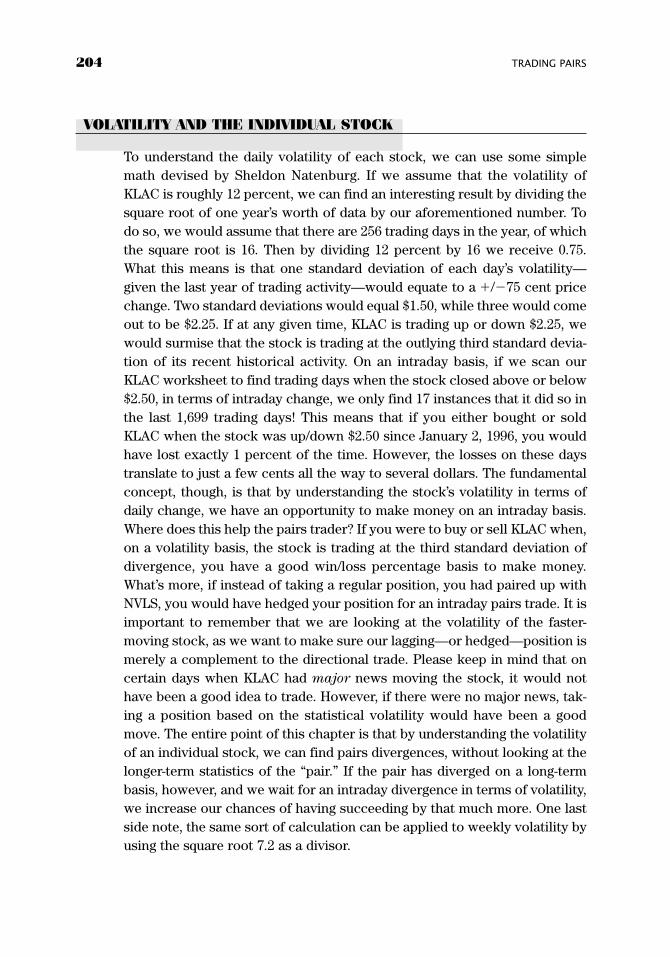
VOLATILITY AND THE INDIVIDUAL STOCK
To understand the daily volatility of each stock, we can use some simplemath devised by Sheldon Natenburg. If we assume that the volatility ofKLAC is roughly 12 percent, we can find an interesting result by dividing thesquare root of one year’s worth of data by our aforementioned number. Todo so, we would assume that there are 256 trading days in the year, of whichthe square root is 16. Then by dividing 12 percent by 16 we receive 0.75.What this means is that one standard deviation of each day’s volatility—given the last year of trading activity—would equate to a �/�75 cent pricechange. Two standard deviations would equal $1.50, while three would comeout to be $2.25. If at any given time, KLAC is trading up or down $2.25, wewould surmise that the stock is trading at the outlying third standard devia-tion of its recent historical activity. On an intraday basis, if we scan ourKLAC worksheet to find trading days when the stock closed above or below$2.50, in terms of intraday change, we only find 17 instances that it did so inthe last 1,699 trading days! This means that if you either bought or soldKLAC when the stock was up/down $2.50 since January 2, 1996, you wouldhave lost exactly 1 percent of the time. However, the losses on these daystranslate to just a few cents all the way to several dollars. The fundamentalconcept, though, is that by understanding the stock’s volatility in terms ofdaily change, we have an opportunity to make money on an intraday basis.Where does this help the pairs trader? If you were to buy or sell KLAC when,on a volatility basis, the stock is trading at the third standard deviation ofdivergence, you have a good win/loss percentage basis to make money.What’s more, if instead of taking a regular position, you had paired up withNVLS, you would have hedged your position for an intraday pairs trade. It isimportant to remember that we are looking at the volatility of the faster-moving stock, as we want to make sure our lagging—or hedged—position ismerely a complement to the directional trade. Please keep in mind that oncertain days when KLAC had major news moving the stock, it would nothave been a good idea to trade. However, if there were no major news, tak-ing a position based on the statistical volatility would have been a goodmove. The entire point of this chapter is that by understanding the volatilityof an individual stock, we can find pairs divergences, without looking at thelonger-term statistics of the “pair.” If the pair has diverged on a long-termbasis, however, and we wait for an intraday divergence in terms of volatility,we increase our chances of having succeeding by that much more. One lastside note, the same sort of calculation can be applied to weekly volatility byusing the square root 7.2 as a divisor.
204 TRADING PAIRS
GK015-C25[201-206].qxd 6/10/04 7:38 PM Page 204 Virender Negi Quark07:BOOKS:GK015-Whistler:Quark files:
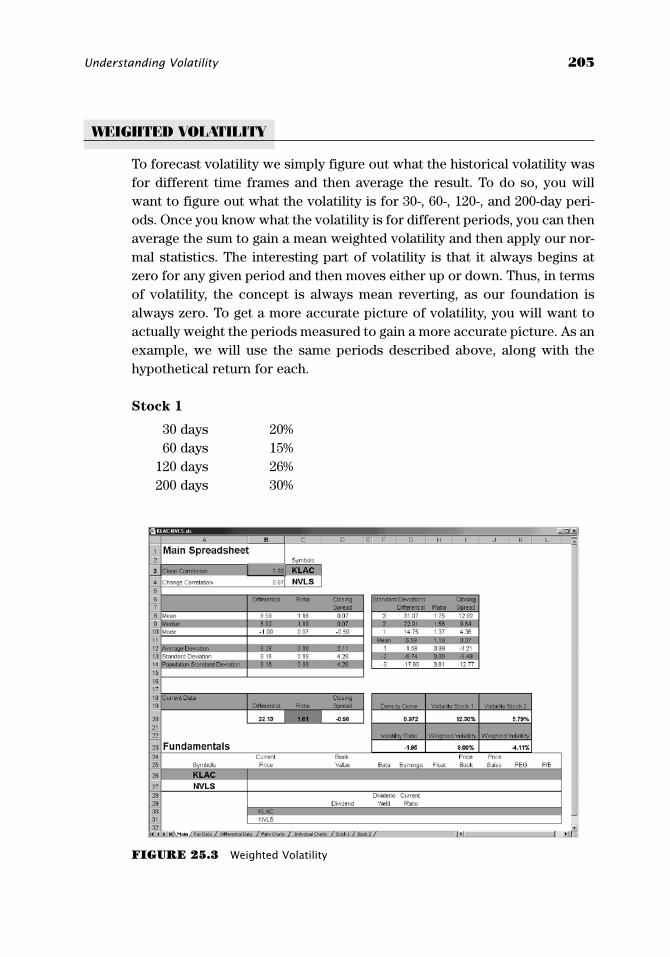
WEIGHTED VOLATILITY
To forecast volatility we simply figure out what the historical volatility wasfor different time frames and then average the result. To do so, you willwant to figure out what the volatility is for 30-, 60-, 120-, and 200-day peri-ods. Once you know what the volatility is for different periods, you can thenaverage the sum to gain a mean weighted volatility and then apply our nor-mal statistics. The interesting part of volatility is that it always begins atzero for any given period and then moves either up or down. Thus, in termsof volatility, the concept is always mean reverting, as our foundation isalways zero. To get a more accurate picture of volatility, you will want toactually weight the periods measured to gain a more accurate picture. As anexample, we will use the same periods described above, along with thehypothetical return for each.
Stock 1
30 days 20%60 days 15%
120 days 26%200 days 30%
Understanding Volatility 205
FIGURE 25.3 Weighted Volatility
GK015-C25[201-206].qxd 6/10/04 7:38 PM Page 205 Virender Negi Quark07:BOOKS:GK015-Whistler:Quark files:
The simple mean volatility is 22.75 percent for all periods covered.Because we want to give more weight to the most recent numbers, we
will actually divide them by a percentage to have a better understanding ofwhere our pair is.
[(40% * 20%)�(30% * 15%)�(20% * 26%)�(10% * 30%)]
The weighted mean return for the periods covered is 20.7 percent, whichis less than the simple average for the periods covered. To apply this to ourpair, we can measure different periods, and then weight the pair’s volatilityto have a better understanding of where the pair is. On the Main worksheet,you will find each individual stock’s weighted volatility in cells I23 and K23.
Looking at the KALC/NVLS spreadsheet (Figure 25.3), we now know thatthe weighted volatility for both stocks is lower than the simple volatility.
Though the volatility ratio in the worksheet is not configured forweighted volatility, the information is there and you can change the ratiofrom a simple ratio to weighted. However, this preference differs from traderto trader, with both numbers providing guidance for pairs trading.
206 TRADING PAIRS
GK015-C25[201-206].qxd 6/10/04 7:38 PM Page 206 Virender Negi Quark07:BOOKS:GK015-Whistler:Quark files:
207
SPEED AND OPTION PREMIUMS
So why all this talk about volatility if it doesn’t apply directly to your pair?Volatility does, and when taking option positions, if we understand the speedof the two stocks that we are using, we will be able to better determine whattypes of positions to take. When using options, we want to make sure that wehave appropriate risk with the volatility of the position. If a stock is highlyvolatile, then we may want to use less risky strategies like butterflies andstrangles, which have opposite price reaction to volatility. The point ofvolatility as we use it in relation to our pairs is to understand what types ofpositions we should take given the amount of time left to expiration. If thereare only three weeks left to expiration for a contract and the 30-day volatilityranges from 0 to 5%, then we can assume that the risk for taking a pairs posi-tion based purely on buying puts and calls would be much more risky than aposition that has much higher short-term volatility. In the case of KLAC/NVLSwe can see that the 30-day volatility is �0.30 percent and �14.30 percent,respectively. We would infer from this data that buying a KLAC call and anNVLS put would have much more risk of expiration worthless for KLAC thanNVLS. Why? NVLS is clearly showing much greater near-term volatility thanKLAC. In other words, KLAC has been much more stable over the last 30 daysthan NVLS. What’s more, this data coincides with taking a larger position inNVLS than KLAC, as it is more likely to actually move into the money thanthe latter stock. We are using our volatility data to understand how quicklyeach stock will move. There is conflicting data here, though, as historicallyKLAC is not only more expensive, but also almost twice as volatile. However,
CHAPTER 26
UnderstandingVolatility and
OptionsSpeed and Option Premiums
Option Strategies for Pairs
Calls/Puts, Covered Calls/Puts
GK015-C26[207-210].qxd 6/10/04 7:38 PM Page 207 Virender Negi Quark07:BOOKS:GK015-Whistler:Quark files:
in the near term—what we are concerned with—the NVLS contract has a bet-ter chance of moving toward our strike price than KLAC. There is a contraryargument here that because NVLS has been moving faster than KLAC, it willbegin to slow in the future, as KLAC actually begins to pick up more speed.However, I have generally found that taking a larger position based on the his-torical simple average, coupled with near-term speed, can benefit a position.What is critically important to remember is that the higher a stock’s volatility,the more expensive an option is. The seller of an option knows that greatervolatility means increased risk. If you are the buyer, that means a moreexpensive premium.
OPTION STRATEGIES FOR PAIRS
Pairs and options can quickly get very complicated and have many differentcombinations of positions. To keep it simple, we will use only a few positionstrategies for our pairs. For further reading, I highly recommend Option
Volatility and Pricing by Sheldon Natenburg. (EN 26.1) Mr. Natenburg givesa much deeper understanding of volatility and more complicated strategies,such as Delta Neutral trading. As a brief side note, over the next chapter, asI speak of buying calls or puts, please assume that I am talking about buyingat-the-money positions. At-the-money positions move more like the actualstock itself, and involve slightly—and I would like to reiterate slightly—lesscomplicated decisions.
Calls/Puts
The simplest strategy for our pair is simply to buy calls and puts for each sideof our pair. In the case of KLAC/NVLS, we would buy two NVLS puts for everyone KLAC call in the position. However, we will begin to find the strategy com-plicated as we try and figure out what our premiums are and how far out of themoney we should purchase each side. Thus, as mentioned earlier, our best betmay be to simply purchase at-the-money calls and puts. By doing so, theoptions will trade more like the actual stock. Our risk is that the options willnot move far enough in-the-money to actually provide a profit; however, by pur-chasing options, we have limited our risk if the pair continues to expand.
Covered Calls/Puts
In a neutral market, a trader can implement a covered call to hedge risk. Thestrategy is simply to buy the actual stock, while selling call options against
208 TRADING PAIRS
GK015-C26[207-210].qxd 6/10/04 7:38 PM Page 208 Virender Negi Quark07:BOOKS:GK015-Whistler:Quark files:
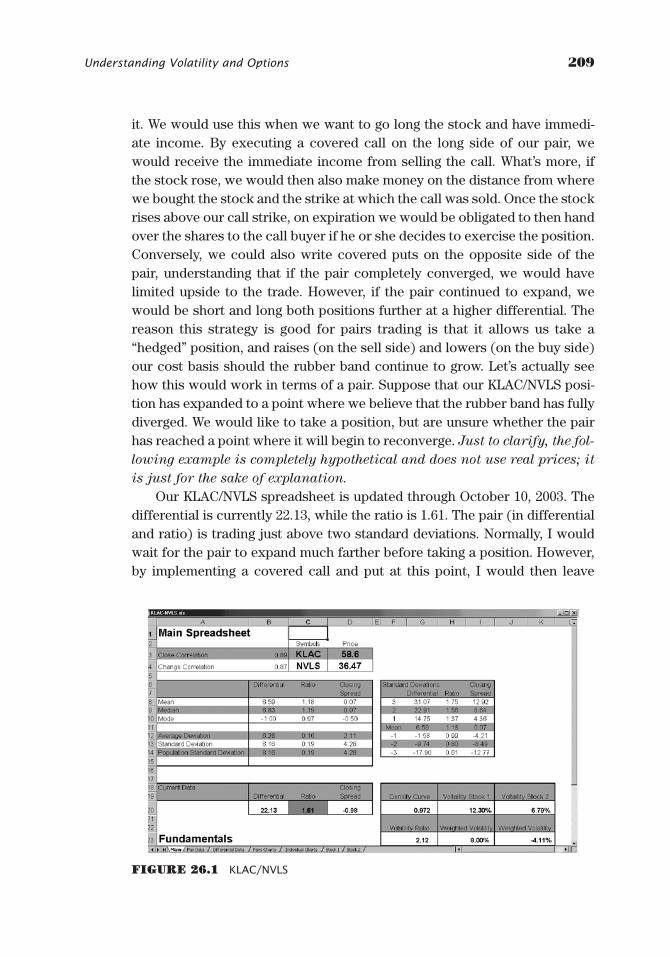
Understanding Volatility and Options 209
it. We would use this when we want to go long the stock and have immedi-ate income. By executing a covered call on the long side of our pair, wewould receive the immediate income from selling the call. What’s more, ifthe stock rose, we would then also make money on the distance from wherewe bought the stock and the strike at which the call was sold. Once the stockrises above our call strike, on expiration we would be obligated to then handover the shares to the call buyer if he or she decides to exercise the position.Conversely, we could also write covered puts on the opposite side of thepair, understanding that if the pair completely converged, we would havelimited upside to the trade. However, if the pair continued to expand, wewould be short and long both positions further at a higher differential. Thereason this strategy is good for pairs trading is that it allows us take a“hedged” position, and raises (on the sell side) and lowers (on the buy side)our cost basis should the rubber band continue to grow. Let’s actually seehow this would work in terms of a pair. Suppose that our KLAC/NVLS posi-tion has expanded to a point where we believe that the rubber band has fullydiverged. We would like to take a position, but are unsure whether the pairhas reached a point where it will begin to reconverge. Just to clarify, the fol-
lowing example is completely hypothetical and does not use real prices; it
is just for the sake of explanation.
Our KLAC/NVLS spreadsheet is updated through October 10, 2003. Thedifferential is currently 22.13, while the ratio is 1.61. The pair (in differentialand ratio) is trading just above two standard deviations. Normally, I wouldwait for the pair to expand much farther before taking a position. However,by implementing a covered call and put at this point, I would then leave
FIGURE 26.1 KLAC/NVLS
GK015-C26[207-210].qxd 6/10/04 7:38 PM Page 209 Virender Negi Quark07:BOOKS:GK015-Whistler:Quark files:
myself extra room for divergence. KLAC is trading at $58.60, while NVLS ispresently at $36.47. The pair is on the sell side of the mean, indicating thatwe would want to sell short KLAC and buy NVLS. Figure 26.1 brings us up tospeed on where the pair is for the current scenario.
What we immediately notice is that in terms of regular standard devia-tions from the mean, if the pair were to open up to the third standard devia-tion, we could lose almost nine points by simply buying and selling the indi-vidual stocks. But by implementing a covered call and put and collectingpremium, we would have the opportunity to engage the pairs position atalmost 2.5 standard deviations, thus allowing us to actually take the positionat better prices. Thus, we would buy the actual NVLS stock and write a callagainst it, potentially $1 to $5 out-of-the-money. On KLAC, we would sellshort the stock, while writing a put against it, also $1 to $5 out-of-the-money.On both sides of this trade, we are hoping that the options will expire worth-less and we will be left with the normal stock at better prices. It is extremelyimportant to remember that this strategy has much higher transaction costs,which could quickly erode all premium and profits. Also, our risk is still justas high for the trade in the sense that we are left with naked stock in the end,where we are still left with substantial risk. If you can shoulder the transac-tion costs and understand the risks involved, covered calls and puts are def-initely a very interesting strategy using pairs.
210 TRADING PAIRS
GK015-C26[207-210].qxd 6/10/04 7:38 PM Page 210 Virender Negi Quark07:BOOKS:GK015-Whistler:Quark files:
211
Af ter many years of hard lessons, I would like to pass some of myknowledge on. I hope that what I am going to tell you will give yousome insight into picking entry and exit points in your trades—outside
of statistics. The problem with statistics is that even though they are amazingat helping us determine relationships, and assisting in finding entry/exitpoints, two standard deviations tell us nothing about when a company hasaccounting problems. Take Enron, for example. If you had been pairs ordirectional trading Enron a few years back, and you thought the stock hadsome sort of “correlation” that would bring it back to the mean when itbegan to nosedive, you most likely lost everything.
Thus, this chapter is to help us tie our pairs data into real decisions thatare presented in everyday investing. While the foundation of pairs lies within
CHAPTER 27
Using Technicaland
FundamentalAnalysis with
PairsTechnical Analysis
Moving Averages
Stochastics and Other
Indicators
Volume
Fundamentals
Price-to-Earnings (PE) Ratio
Price-to-Sales Ratio
KBH Homes and Tol Brothers
Moving Averages and Support
and Resistance as Stops
GK015-C27[211-228].qxd 6/10/04 7:38 PM Page 211 Virender Negi Quark07:BOOKS:GK015-Whistler:Quark files:
descriptive statistics, we must use all other facets of knowledge to help usmake our final decisions. In addition, descriptive statistics don’t alwaysgive us exit signals or concise stop loss points. Thus, by using technicaland fundamental analysis as a guiding tool of market direction, we can helpdefine our trade targets and stops.
Along with technical analysis, we can also use fundamental analysis tohelp determine the valuation of the trade. While this may sound a little com-plicated, don’t sweat it. What we’re about to cover is actually very simple andrequires little math. Fundamental analysis scares most people, who associateit with countless hours of reading and extensive research. And while for theanalyst this is exactly the case, I will boil it down to some commonsense appli-cations based on what we have already covered. This chapter will start withtechnical analysis, skip over to fundamentals, and then tie the two together.
TECHNICAL ANALYSIS
Moving Averages
As previously stated, one of the most important aspects of technical analysisis major moving averages, like the 50 and 200-DMAs. Why? The reason thesetwo moving averages are so vital is that the bulk of the world’s investors whokeep an eye on technical analysis, watch the 50- and 200-DMAs. When a bigpart of the trading population may be making a decision based on two littlelines on a chart, then the little lines become very important. In essence, theybecome self-fulfilling prophecies. At the same time though, I would be hard-pressed to say that tons of traders are making decisions based on the mov-ing averages. In other words, it’s hardly likely that many people buy a stockjust because it bounces on the 50-DMA. However, it is very rational to saythat many more people are watching the stock with a closer eye as it nearsthe moving average. Simply put, moving averages are like alert beacons inthe night—something you want to pay close attention to when near.
We can even do statistical analysis on the two moving averages, to findout when the pair is spread apart on a 50-day historical basis. However, bydoing so we are analyzing data that is already analyzing data. In short, we areapplying statistics to something that is already lagging. If we were to do so(but we’re not), then it would be much wiser for us to use an exponentialmoving average, rather than a simple moving average.
As previously stated, the 50- and 200-DMAs can cause a stock to rico-chet off the average or plummet through. Why? As a trader, if you have1 million shares to sell at the best possible price and you know the technical
212 TRADING PAIRS
GK015-C27[211-228].qxd 6/10/04 7:38 PM Page 212 Virender Negi Quark07:BOOKS:GK015-Whistler:Quark files:
world will likely buy a stock as it hits a major moving average on adescending move, would you wait for a bounce to sell? Of course youwould, as you would want to get the best possible price. Most traders han-dling order flow never look at a moving average as a “reason” for enteringor exiting a trade, but they do take notice of the occurrence, and soshould you—even when you are looking at statistics. Ok, so how does thishelp me with pairs? If you are about to buy a stock and it is trading under
the 200-SMA, and your sole reason to buy it is because of statistics, mayberethink the trade. Don’t trade, you say? Yes, perhaps wait and see if thestock moves back above the 200-SMA before entering either side of thetrade. Common sense tells us that regardless of statistics, the 200-SMA—that is hypothetically just above our imaginary stock—will pose substan-tial resistance. Thus, why take the chance on having one side of our tradefail? However, if we are aware of this commonsense scenario, and thenwait for the stock to ascend above the moving average, we are much saferin the long run in both directional and pairs trading. So how do you put thisinto practice? Imagine that you are about to enter a pair that has beenexpanding for some time. The pair is close to three standard deviations,and the density curve is nearing a historical outlier. You are prepared totake the position, when you suddenly notice that the long side of yourtrade has a 200-SMA a half point above where you are thinking about enter-ing the trade. The commonsense solution is to simply wait until the longside of the trade ascends above the moving average and builds a base. Youmay lose a little of your potential profit in doing so, but your risk has beenminimized substantially. Think about it, taking the position ahead of the200-SMA is similar to trying to speed across train tracks ahead of anoncoming locomotive. While you may make it, overall, you’re taking a verystupid chance. Why not play it safe and let the train go by? And that wouldbe the same for waiting for a major moving average to be on the correctside of your trade before taking a position. This is technical common sensewhen pairs trading.
Stochastics and Other Indicators
Other indicators like stochastics and moving average convergence diver-gence (MACD) are hardly ever reliable as a leading indicator for a position.They can be, however, a good confirmation tool when taking a directionalposition. In pairs, they can also help us decide whether the pair has room toopen up more or whether it will begin to reconverge. Let’s look at a fewstocks, just to see how this could be used in our pairs strategy.
Using Technical and Fundamental Analysis with Pairs 213
GK015-C27[211-228].qxd 6/10/04 7:38 PM Page 213 Virender Negi Quark07:BOOKS:GK015-Whistler:Quark files:
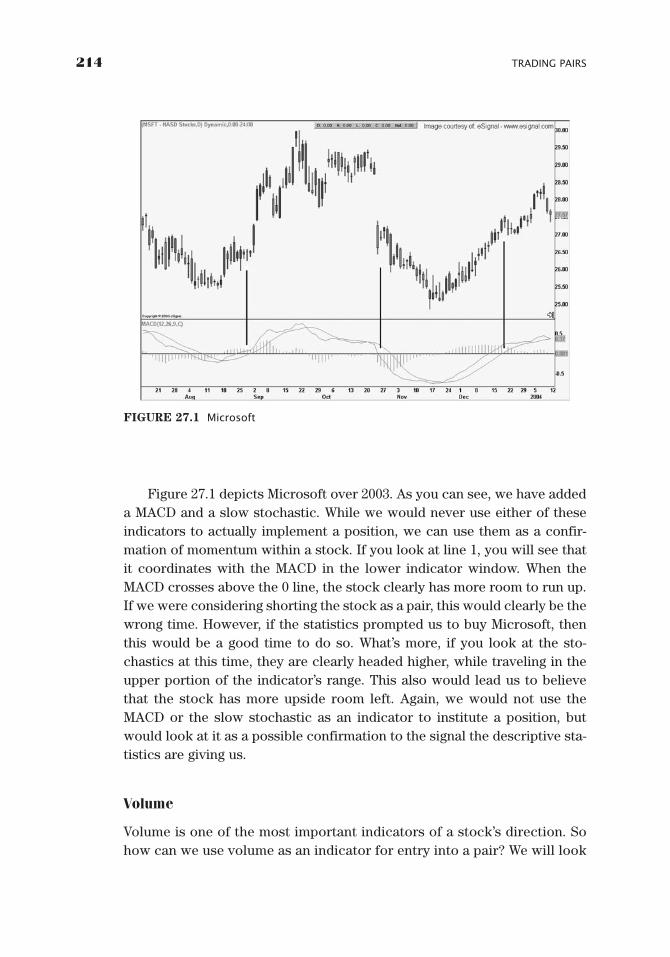
Figure 27.1 depicts Microsoft over 2003. As you can see, we have addeda MACD and a slow stochastic. While we would never use either of theseindicators to actually implement a position, we can use them as a confir-mation of momentum within a stock. If you look at line 1, you will see thatit coordinates with the MACD in the lower indicator window. When theMACD crosses above the 0 line, the stock clearly has more room to run up.If we were considering shorting the stock as a pair, this would clearly be thewrong time. However, if the statistics prompted us to buy Microsoft, thenthis would be a good time to do so. What’s more, if you look at the sto-chastics at this time, they are clearly headed higher, while traveling in theupper portion of the indicator’s range. This also would lead us to believethat the stock has more upside room left. Again, we would not use theMACD or the slow stochastic as an indicator to institute a position, butwould look at it as a possible confirmation to the signal the descriptive sta-tistics are giving us.
Volume
Volume is one of the most important indicators of a stock’s direction. Sohow can we use volume as an indicator for entry into a pair? We will look
214 TRADING PAIRS
FIGURE 27.1 Microsoft
GK015-C27[211-228].qxd 6/10/04 7:38 PM Page 214 Virender Negi Quark07:BOOKS:GK015-Whistler:Quark files:
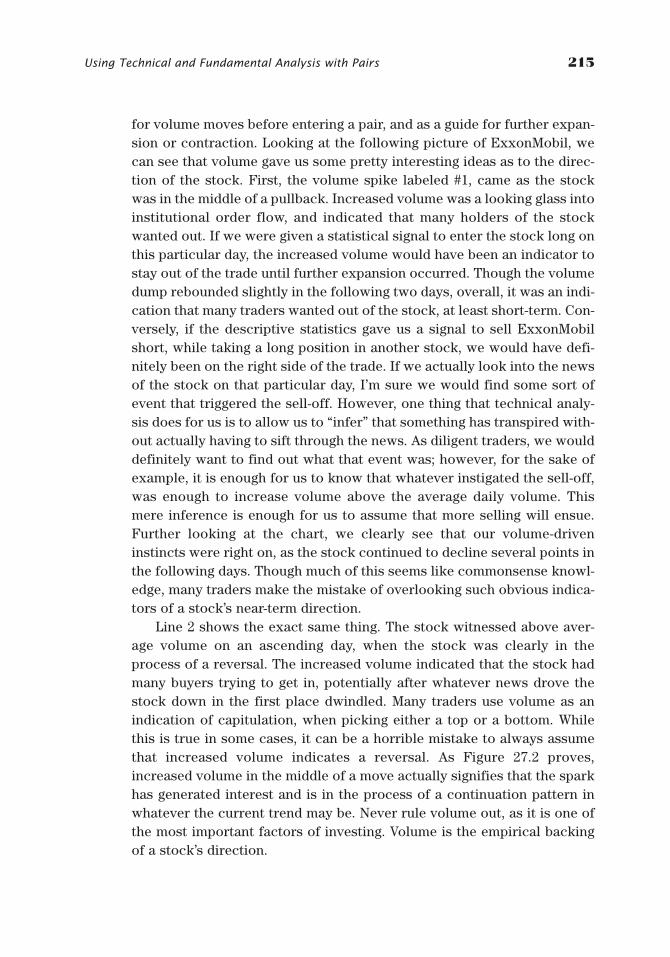
for volume moves before entering a pair, and as a guide for further expan-sion or contraction. Looking at the following picture of ExxonMobil, wecan see that volume gave us some pretty interesting ideas as to the direc-tion of the stock. First, the volume spike labeled #1, came as the stockwas in the middle of a pullback. Increased volume was a looking glass intoinstitutional order flow, and indicated that many holders of the stockwanted out. If we were given a statistical signal to enter the stock long onthis particular day, the increased volume would have been an indicator tostay out of the trade until further expansion occurred. Though the volumedump rebounded slightly in the following two days, overall, it was an indi-cation that many traders wanted out of the stock, at least short-term. Con-versely, if the descriptive statistics gave us a signal to sell ExxonMobilshort, while taking a long position in another stock, we would have defi-nitely been on the right side of the trade. If we actually look into the newsof the stock on that particular day, I’m sure we would find some sort ofevent that triggered the sell-off. However, one thing that technical analy-sis does for us is to allow us to “infer” that something has transpired with-out actually having to sift through the news. As diligent traders, we woulddefinitely want to find out what that event was; however, for the sake ofexample, it is enough for us to know that whatever instigated the sell-off,was enough to increase volume above the average daily volume. Thismere inference is enough for us to assume that more selling will ensue.Further looking at the chart, we clearly see that our volume-driveninstincts were right on, as the stock continued to decline several points inthe following days. Though much of this seems like commonsense knowl-edge, many traders make the mistake of overlooking such obvious indica-tors of a stock’s near-term direction.
Line 2 shows the exact same thing. The stock witnessed above aver-age volume on an ascending day, when the stock was clearly in theprocess of a reversal. The increased volume indicated that the stock hadmany buyers trying to get in, potentially after whatever news drove thestock down in the first place dwindled. Many traders use volume as anindication of capitulation, when picking either a top or a bottom. Whilethis is true in some cases, it can be a horrible mistake to always assumethat increased volume indicates a reversal. As Figure 27.2 proves,increased volume in the middle of a move actually signifies that the sparkhas generated interest and is in the process of a continuation pattern inwhatever the current trend may be. Never rule volume out, as it is one ofthe most important factors of investing. Volume is the empirical backingof a stock’s direction.
Using Technical and Fundamental Analysis with Pairs 215
GK015-C27[211-228].qxd 6/10/04 7:38 PM Page 215 Virender Negi Quark07:BOOKS:GK015-Whistler:Quark files:
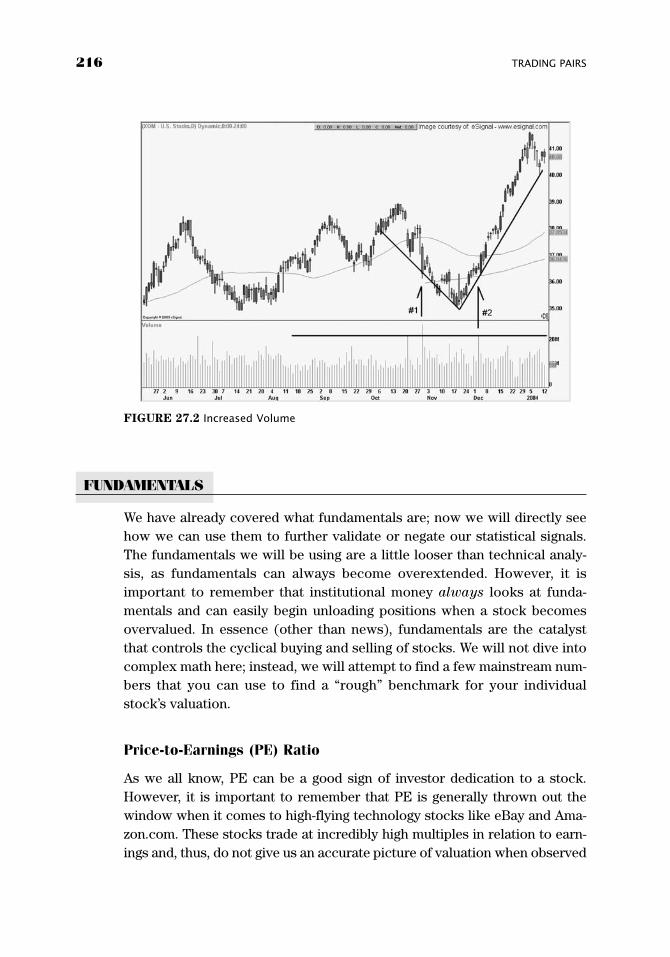
FUNDAMENTALS
We have already covered what fundamentals are; now we will directly seehow we can use them to further validate or negate our statistical signals.The fundamentals we will be using are a little looser than technical analy-sis, as fundamentals can always become overextended. However, it isimportant to remember that institutional money always looks at funda-mentals and can easily begin unloading positions when a stock becomesovervalued. In essence (other than news), fundamentals are the catalystthat controls the cyclical buying and selling of stocks. We will not dive intocomplex math here; instead, we will attempt to find a few mainstream num-bers that you can use to find a “rough” benchmark for your individualstock’s valuation.
Price-to-Earnings (PE) Ratio
As we all know, PE can be a good sign of investor dedication to a stock.However, it is important to remember that PE is generally thrown out thewindow when it comes to high-flying technology stocks like eBay and Ama-zon.com. These stocks trade at incredibly high multiples in relation to earn-ings and, thus, do not give us an accurate picture of valuation when observed
216 TRADING PAIRS
FIGURE 27.2 Increased Volume
GK015-C27[211-228].qxd 6/10/04 7:38 PM Page 216 Virender Negi Quark07:BOOKS:GK015-Whistler:Quark files:
in terms of PE. Some technology stocks don’t even have PEs, as they have noearnings. Let’s examine a few stocks just for the sake of argument.
When finding a stock’s PE in relation to the historical average, Smart-money.com has a great tool under the “Key Ratios” tab, once a stock isselected. We will look at Intel, to start our brief analysis. We can see inFigure 27.3 that Intel is currently trading with a PE of 48.70. While this ishigh for most standards, it is also far below the five-year high of 203.10. Theindustry average is 148.80. So what is our conclusion here? First, the stockis trading with a high PE in relation to traditional fundamental valuation.However, it is not completely exuberant given that the historical high andindustry average are far above the current number. While I would personallybe skeptical about taking a huge long-term position in the stock, it would notbe completely out of reason to take a short-term pairs position, as the PE isnot overextended. Let’s look at another example.
Using Technical and Fundamental Analysis with Pairs 217
FIGURE 27.3 Intel
GK015-C27[211-228].qxd 6/10/04 7:38 PM Page 217 Virender Negi Quark07:BOOKS:GK015-Whistler:Quark files:
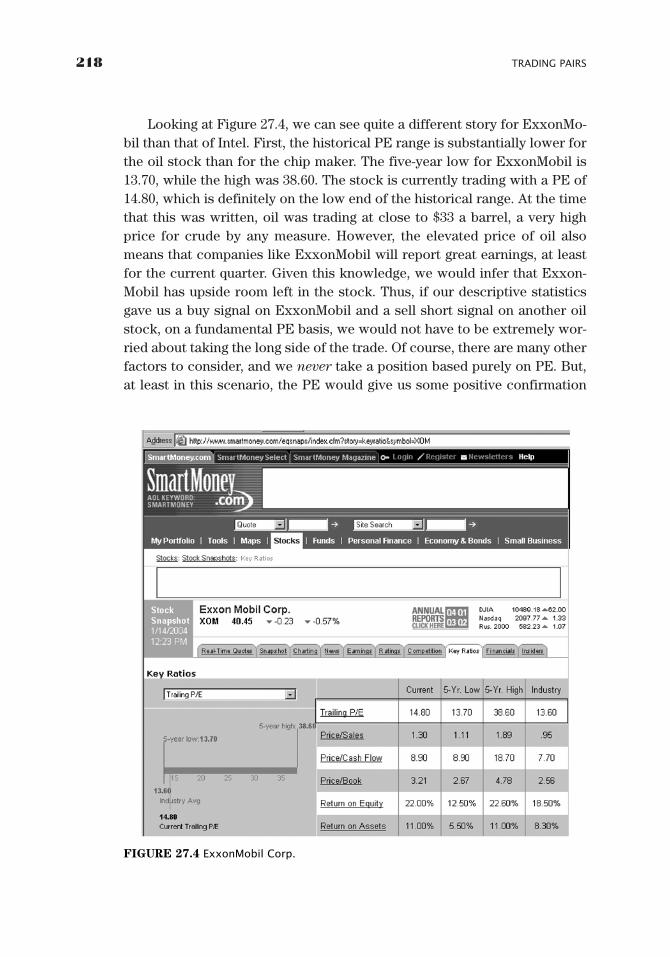
Looking at Figure 27.4, we can see quite a different story for ExxonMo-bil than that of Intel. First, the historical PE range is substantially lower forthe oil stock than for the chip maker. The five-year low for ExxonMobil is13.70, while the high was 38.60. The stock is currently trading with a PE of14.80, which is definitely on the low end of the historical range. At the timethat this was written, oil was trading at close to $33 a barrel, a very highprice for crude by any measure. However, the elevated price of oil alsomeans that companies like ExxonMobil will report great earnings, at leastfor the current quarter. Given this knowledge, we would infer that Exxon-Mobil has upside room left in the stock. Thus, if our descriptive statisticsgave us a buy signal on ExxonMobil and a sell short signal on another oilstock, on a fundamental PE basis, we would not have to be extremely wor-ried about taking the long side of the trade. Of course, there are many otherfactors to consider, and we never take a position based purely on PE. But,at least in this scenario, the PE would give us some positive confirmation
218 TRADING PAIRS
FIGURE 27.4 ExxonMobil Corp.
GK015-C27[211-228].qxd 6/10/04 7:38 PM Page 218 Virender Negi Quark07:BOOKS:GK015-Whistler:Quark files:
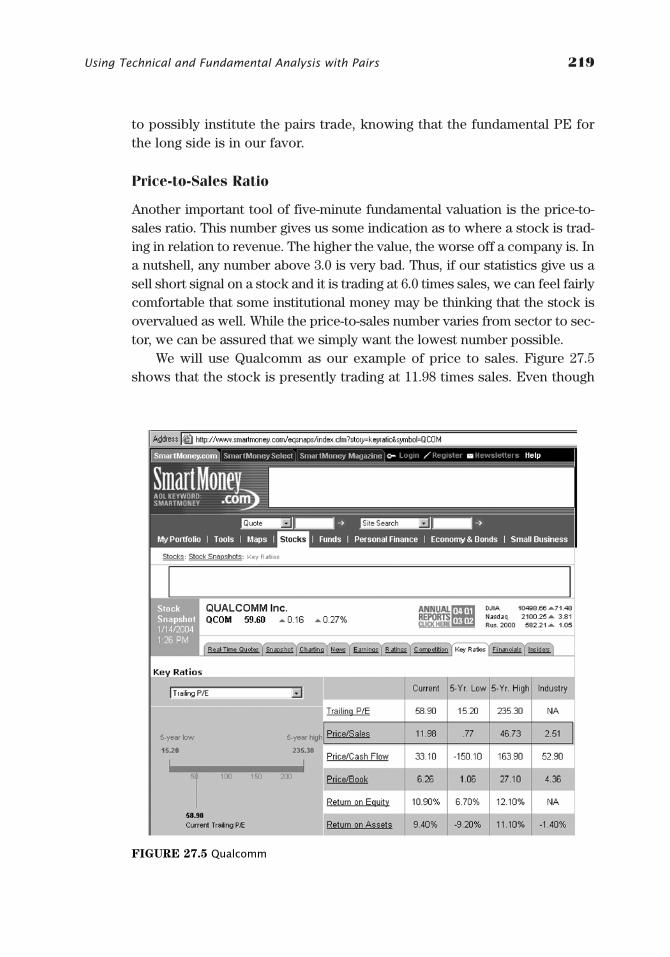
to possibly institute the pairs trade, knowing that the fundamental PE forthe long side is in our favor.
Price-to-Sales Ratio
Another important tool of five-minute fundamental valuation is the price-to-sales ratio. This number gives us some indication as to where a stock is trad-ing in relation to revenue. The higher the value, the worse off a company is. Ina nutshell, any number above 3.0 is very bad. Thus, if our statistics give us asell short signal on a stock and it is trading at 6.0 times sales, we can feel fairlycomfortable that some institutional money may be thinking that the stock isovervalued as well. While the price-to-sales number varies from sector to sec-tor, we can be assured that we simply want the lowest number possible.
We will use Qualcomm as our example of price to sales. Figure 27.5shows that the stock is presently trading at 11.98 times sales. Even though
Using Technical and Fundamental Analysis with Pairs 219
FIGURE 27.5 Qualcomm
GK015-C27[211-228].qxd 6/10/04 7:38 PM Page 219 Virender Negi Quark07:BOOKS:GK015-Whistler:Quark files:
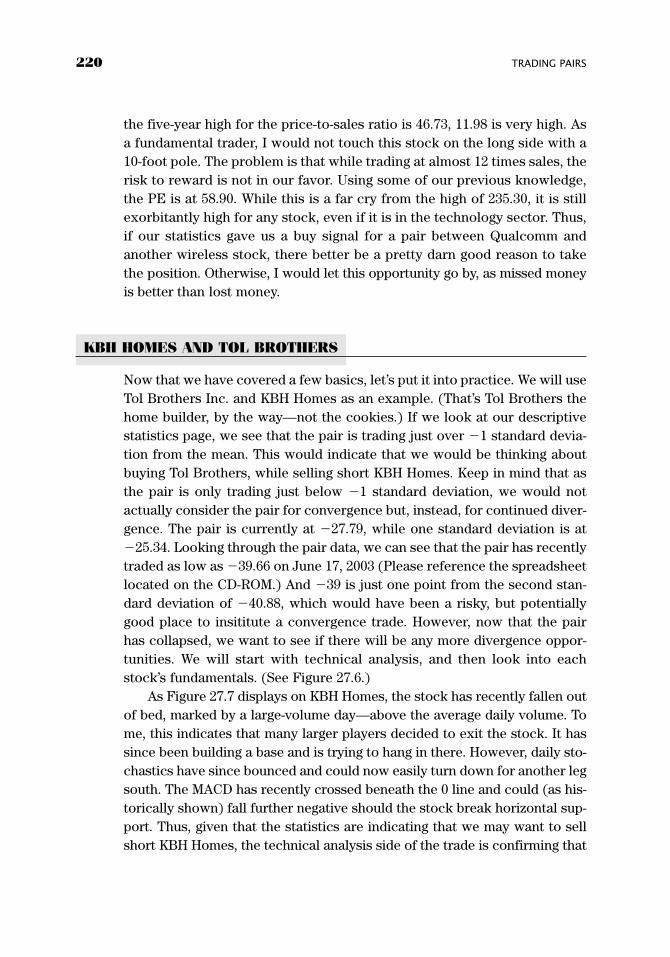
the five-year high for the price-to-sales ratio is 46.73, 11.98 is very high. Asa fundamental trader, I would not touch this stock on the long side with a10-foot pole. The problem is that while trading at almost 12 times sales, therisk to reward is not in our favor. Using some of our previous knowledge,the PE is at 58.90. While this is a far cry from the high of 235.30, it is stillexorbitantly high for any stock, even if it is in the technology sector. Thus,if our statistics gave us a buy signal for a pair between Qualcomm andanother wireless stock, there better be a pretty darn good reason to takethe position. Otherwise, I would let this opportunity go by, as missed moneyis better than lost money.
KBH HOMES AND TOL BROTHERS
Now that we have covered a few basics, let’s put it into practice. We will useTol Brothers Inc. and KBH Homes as an example. (That’s Tol Brothers thehome builder, by the way—not the cookies.) If we look at our descriptivestatistics page, we see that the pair is trading just over �1 standard devia-tion from the mean. This would indicate that we would be thinking aboutbuying Tol Brothers, while selling short KBH Homes. Keep in mind that asthe pair is only trading just below �1 standard deviation, we would notactually consider the pair for convergence but, instead, for continued diver-gence. The pair is currently at �27.79, while one standard deviation is at�25.34. Looking through the pair data, we can see that the pair has recentlytraded as low as �39.66 on June 17, 2003 (Please reference the spreadsheetlocated on the CD-ROM.) And �39 is just one point from the second stan-dard deviation of �40.88, which would have been a risky, but potentiallygood place to insititute a convergence trade. However, now that the pairhas collapsed, we want to see if there will be any more divergence oppor-tunities. We will start with technical analysis, and then look into eachstock’s fundamentals. (See Figure 27.6.)
As Figure 27.7 displays on KBH Homes, the stock has recently fallen outof bed, marked by a large-volume day—above the average daily volume. Tome, this indicates that many larger players decided to exit the stock. It hassince been building a base and is trying to hang in there. However, daily sto-chastics have since bounced and could now easily turn down for another legsouth. The MACD has recently crossed beneath the 0 line and could (as his-torically shown) fall further negative should the stock break horizontal sup-port. Thus, given that the statistics are indicating that we may want to sellshort KBH Homes, the technical analysis side of the trade is confirming that
220 TRADING PAIRS
GK015-C27[211-228].qxd 6/10/04 7:38 PM Page 220 Virender Negi Quark07:BOOKS:GK015-Whistler:Quark files:
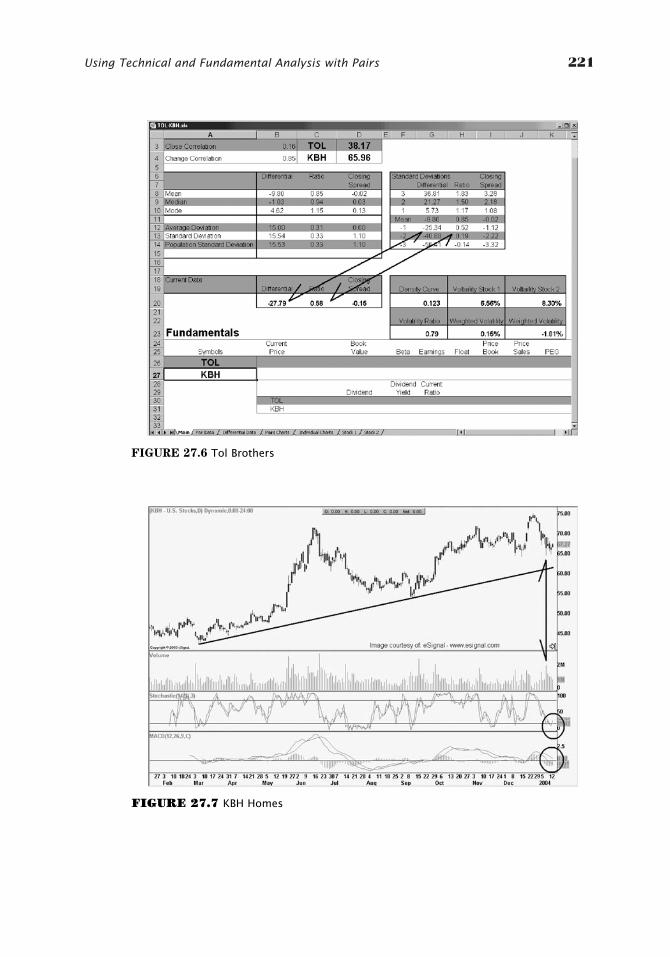
Using Technical and Fundamental Analysis with Pairs 221
FIGURE 27.6 Tol Brothers
FIGURE 27.7 KBH Homes
GK015-C27[211-228].qxd 6/10/04 7:38 PM Page 221 Virender Negi Quark07:BOOKS:GK015-Whistler:Quark files:

there may be more downside left. What’s the one thing we have going againstus? The most important thing of all. Taking a short position in this tradewould clearly be trading against the ascending trend. However, sometimesthat’s what pairs trading is all about.
Now, looking at the next chart of Tol Brothers in Figure 27.8, we see some-thing else happening. First, the stock has sold off some, but has also built abase after the stock touched ascending support. In addition, the volume spikedown day had a large recovery and did not close near the low of the day. Thismeans that even though many players sold the stock that day, there were alsomany investors waiting on the sidelines to take on new positions. This was agood sign for bulls and shows how volume can show different things on dif-ferent stocks. If the volume down day had closed near the low of the day, wewould have inferred that buyers were nowhere to be seen. Therefore, taking along position in Tol Brothers would have been much more risky.
On the same chart, we also see that the MACD fell much lower thanthat of KBH Homes and could now rebound more easily. This signal cou-pled with the daily stochastics, which are traveling the upper portion of theindicator window, would lead us to conclude that a short position wouldbe much more risky. As the statistics are indicating, a long position wouldnot be that bad of a decision, as long as a tight stop was instituted justbelow horizontal support, shown on the chart. Our conclusion thus far is
222 TRADING PAIRS
FIGURE 27.8 Tol Brothers
GK015-C27[211-228].qxd 6/10/04 7:38 PM Page 222 Virender Negi Quark07:BOOKS:GK015-Whistler:Quark files:
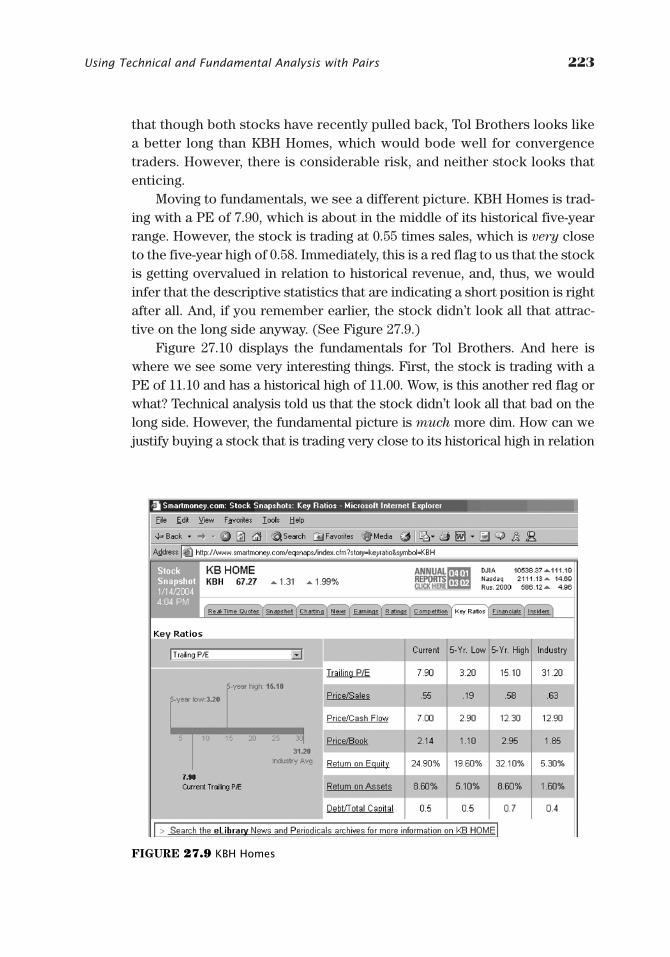
Using Technical and Fundamental Analysis with Pairs 223
that though both stocks have recently pulled back, Tol Brothers looks likea better long than KBH Homes, which would bode well for convergencetraders. However, there is considerable risk, and neither stock looks thatenticing.
Moving to fundamentals, we see a different picture. KBH Homes is trad-ing with a PE of 7.90, which is about in the middle of its historical five-yearrange. However, the stock is trading at 0.55 times sales, which is very closeto the five-year high of 0.58. Immediately, this is a red flag to us that the stockis getting overvalued in relation to historical revenue, and, thus, we wouldinfer that the descriptive statistics that are indicating a short position is rightafter all. And, if you remember earlier, the stock didn’t look all that attrac-tive on the long side anyway. (See Figure 27.9.)
Figure 27.10 displays the fundamentals for Tol Brothers. And here iswhere we see some very interesting things. First, the stock is trading with aPE of 11.10 and has a historical high of 11.00. Wow, is this another red flag orwhat? Technical analysis told us that the stock didn’t look all that bad on thelong side. However, the fundamental picture is much more dim. How can wejustify buying a stock that is trading very close to its historical high in relation
FIGURE 27.9 KBH Homes
GK015-C27[211-228].qxd 6/10/04 7:38 PM Page 223 Virender Negi Quark07:BOOKS:GK015-Whistler:Quark files:
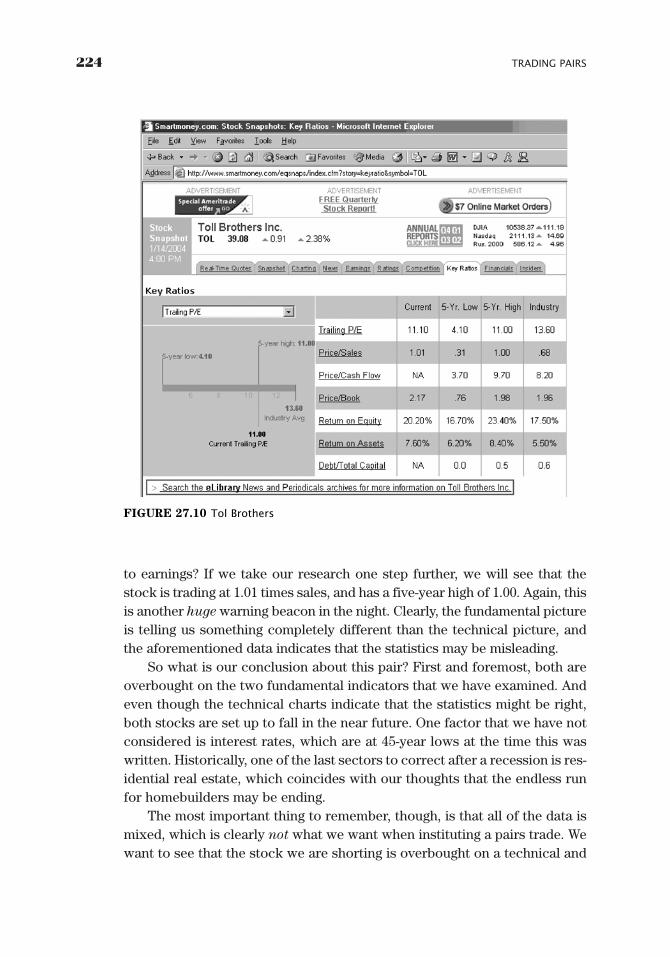
to earnings? If we take our research one step further, we will see that thestock is trading at 1.01 times sales, and has a five-year high of 1.00. Again, thisis another huge warning beacon in the night. Clearly, the fundamental pictureis telling us something completely different than the technical picture, andthe aforementioned data indicates that the statistics may be misleading.
So what is our conclusion about this pair? First and foremost, both areoverbought on the two fundamental indicators that we have examined. Andeven though the technical charts indicate that the statistics might be right,both stocks are set up to fall in the near future. One factor that we have notconsidered is interest rates, which are at 45-year lows at the time this waswritten. Historically, one of the last sectors to correct after a recession is res-idential real estate, which coincides with our thoughts that the endless runfor homebuilders may be ending.
The most important thing to remember, though, is that all of the data ismixed, which is clearly not what we want when instituting a pairs trade. Wewant to see that the stock we are shorting is overbought on a technical and
224 TRADING PAIRS
FIGURE 27.10 Tol Brothers
GK015-C27[211-228].qxd 6/10/04 7:38 PM Page 224 Virender Negi Quark07:BOOKS:GK015-Whistler:Quark files:

fundamental basis, while the stock we are buying is oversold—or, at least,undervalued.
If I had to guess, I would assume that if the pair reconverges, it will bemostly from KBH Homes falling more than Tol Brothers. However, bothstocks are set up to decline in the future. While I know this goes against thecurrent trend, it is common sense that the price charts are weakening, andthe simple fundamentals are overbought.
I would like to point out that we have only covered a few technical andfundamental factors in relation to the pair. Thus, you need to make sure youalso look at things like trend lines, support and resistance, price to book,PEG ratios, cash, price to cash flow, and forward PE.
It is vitally important to understand why a stock is doing what it is doing,before blindly trusting the statistics at hand. This is incredibly important, astrading purely off of statistics would be similar to never checking your oiland only depending on the gauges on your dashboard. The gauges can gobad, and are not errorproof; thus, you have to get under the hood and occa-sionally check for yourself.
MOVING AVERAGES AND SUPPORT AND RESISTANCE AS STOPS
Last but certainly not least, I would like to talk about the importance of sup-port and resistance and trend lines as stop loss points for your statisticaltrades. This is very simple, but so vitally important. Statistics can always goagainst us, and thus it is critical that you have concise stop loss points foreach side of your position. If one side breaks down, close the entire position.It’s as simple as that. Moving averages and trend lines are major benchmarksof technical trading. Usually, when one or the other is broken, it signifiesthat some sort of news-related or fundamental event has occurred that iscausing a paradigm shift in the stock. Simply put, if a major moving averageor trend line is broken, something big is happening. Thus, in our pair, we canuse moving averages and trend lines to assist us in making stop loss deci-sions. Let’s go through a few examples.
Figure 27.11 displays eBay and the trading action over the last year whenthis was written. You can clearly see that the 200-SMA would have served asa significant stop loss point had we been long the stock in November. Thestock was sitting just above $50, which was also major horizontal support atthat time. If we were in a pairs trade and the stock had broken down—andwe were long eBay—we would have wanted to close the entire position.
Using Technical and Fundamental Analysis with Pairs 225
GK015-C27[211-228].qxd 6/10/04 7:38 PM Page 225 Virender Negi Quark07:BOOKS:GK015-Whistler:Quark files:
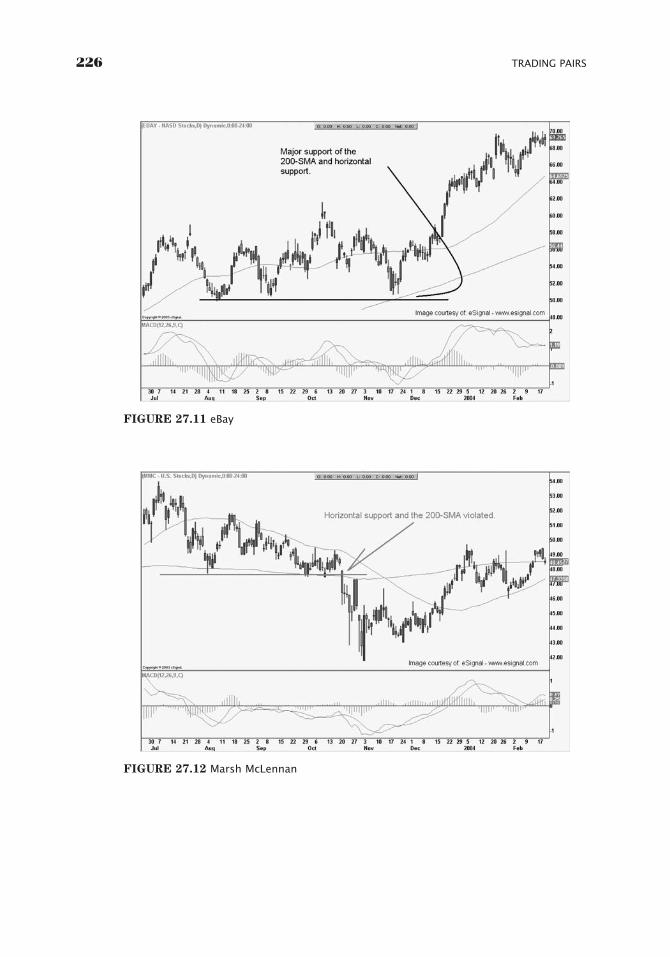
226 TRADING PAIRS
FIGURE 27.11 eBay
FIGURE 27.12 Marsh McLennan
GK015-C27[211-228].qxd 6/10/04 7:38 PM Page 226 Virender Negi Quark07:BOOKS:GK015-Whistler:Quark files:
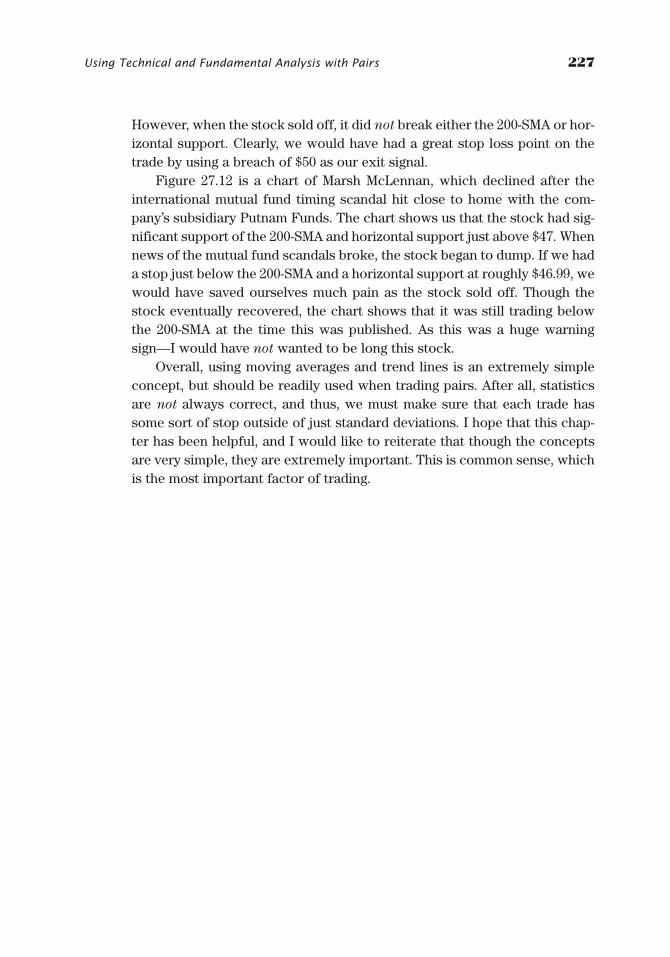
However, when the stock sold off, it did not break either the 200-SMA or hor-izontal support. Clearly, we would have had a great stop loss point on thetrade by using a breach of $50 as our exit signal.
Figure 27.12 is a chart of Marsh McLennan, which declined after theinternational mutual fund timing scandal hit close to home with the com-pany’s subsidiary Putnam Funds. The chart shows us that the stock had sig-nificant support of the 200-SMA and horizontal support just above $47. Whennews of the mutual fund scandals broke, the stock began to dump. If we hada stop just below the 200-SMA and a horizontal support at roughly $46.99, wewould have saved ourselves much pain as the stock sold off. Though thestock eventually recovered, the chart shows that it was still trading belowthe 200-SMA at the time this was published. As this was a huge warningsign—I would have not wanted to be long this stock.
Overall, using moving averages and trend lines is an extremely simpleconcept, but should be readily used when trading pairs. After all, statisticsare not always correct, and thus, we must make sure that each trade hassome sort of stop outside of just standard deviations. I hope that this chap-ter has been helpful, and I would like to reiterate that though the conceptsare very simple, they are extremely important. This is common sense, whichis the most important factor of trading.
Using Technical and Fundamental Analysis with Pairs 227
GK015-C27[211-228].qxd 6/10/04 7:38 PM Page 227 Virender Negi Quark07:BOOKS:GK015-Whistler:Quark files:

GK015-C27[211-228].qxd 6/10/04 7:38 PM Page 228 Virender Negi Quark07:BOOKS:GK015-Whistler:Quark files:
229
This is the last moment where I can tell you about some of my experi-ences trading pairs and what I have learned. First and foremost, neverunlock a pair and close one side of the position, just because it is
making more money than the other. There will be certain circumstanceswhere you will want to maybe trim both sides or unlock a portion of one sideif you have a plan. However, to just unlock a side merely to book profit is abad, bad idea. Why? Simply put, if anything can go wrong, it always will. Andif you unlock the winning side, the losing side will most likely move againstyou—at lease according to Murphy’s Law. Thus, remember that if you aregoing to shuffle around your position, always have some sort of plan that jus-tifies your actions, and even more importantly, have a predetermined stoploss to close the trade should it move against you.
• When trading intraday pairs, it is a good idea to generally take a breakduring earnings season. Why? From my experience, intraday pairs that aremoving because of earnings-related news can very often close at the high ofthe day. This is because the outstanding earnings news has triggered a surgeof order flow, wherein large funds are trying to get either in or out of a trade.Thus, during earnings season, there can actually be more opportunity trad-ing divergence pairs than convergence. The best rule of thumb here, though,is: When in doubt, stay out.
• Always update your data once you are in a pair. While this seems likecommon sense, it’s easy to get lazy and not update your data on a day-to-day basis. If you do not update the data, you will not be able to see theactual statistical numbers moving. And we have to remember that thesenumbers fluctuate on a daily basis—they never remain the same.
CHAPTER 28
Assorted Adviceto AssistTrading
GK015-C28[229-232].qxd 6/10/04 7:39 PM Page 229 Virender Negi Quark07:BOOKS:GK015-Whistler:Quark files:
230 TRADING PAIRS
• As a trading idea, I have seen intraday traders trade mergers on a sortof pseudo risk arbitrage basis. What they do is find a pair of stocks that aremerging. Usually, a merger pair is has a predetermined price at which bothstocks have to close. Thus, intraday traders will set up a histogram that is aratio or a differential of the two stocks. The histogram can be anywherefrom 5 to 10 days, and gives visual representation of the pair’s intraday trad-ing range. Then, the trader will simply wait until the pair trades near one endor the other and then scalp the intraday trade for a few pennies or a dime.Does it work? In my opinion, not really. The problem is that the massiveamounts of commissions on an intraday basis can put a serious dent in anyprofits. It is also my opinion that the institutional guys trading the stocks liketo ramp them out of whack once in a while, just to railroad any day traderstrying to actually trade the merger. Thus, my advice is set up a histogram oftwo stocks and watch the merger trade, but do not actually trade it yourselfunless you really know what you are doing. After all, they’re pros who havethe single job of trading mergers, and if you are trying to compete with a fewthousand dollars, well, the house usually wins.
• As another trading idea, I have also watched traders set up percentagegraphs (you could say volatility) of three or more stocks benchmarkedagainst an index. The idea is to wait for two- to three-day divergences of thestocks against the index, and then attempt to implement convergence swingtrade or day trade positions. The idea is that on a percentage basis, stocksgenerally revert to the mean for the index they follow. As a good example ofthis, a trader would look at an index like the XOI.X, which is the AMEX OilIndex. Then, knowing that the stocks must trade relative to the index on apercentage basis, the trader will wait for individual stocks to move away fromthe index. Once the stocks have diverged (above the mean), the trader willshort those farthest out, while buying those nearest to the index. This is actu-ally an effective strategy and can provide hedging ideas for naked positions.
The faster the stocks, the tougher they are to trade. By this I mean thattrading fast moving technology stocks can be more dangerous than tradingslower utility stocks. Of course, there is always an exception to the rule.However, sometimes trading less sexy stocks like oil or truckers can providebetter results than trading high flyers.
• My entire point here is: Don’t rule out slower-moving stocks, as theymay actually provide more opportunity than technology or Internet stocks.
If you are looking for stocks that will reconverge, remember that the cor-relation is the key. The stronger the correlation, the greater the chance thatthe two stocks will come back together. However, it is also important toremember that a strong correlation doesn’t always mean the stocks have to
GK015-C28[229-232].qxd 6/10/04 7:39 PM Page 230 Virender Negi Quark07:BOOKS:GK015-Whistler:Quark files:
Assorted Advice to Assist Trading 231
come back together. Thus, never bank your account on the correlationalone. If the trade is opening up and moves past the third standard deviation,it may be a good idea to consider exiting your position.
• If you are in a swing-trading pair during earnings or warnings season,and one of your stocks warns or reports poorly in a direction that goesagainst your pair, close the entire position. This is important, as sometimeswhen in a pair, we can fool ourselves into thinking that because the positionis a hedge, we will not lose money. However, this is wrong. If one half of thepair is working against you because of earnings-related news, you will mostlikely end up with a huge loser, as institutional money rotates in and out ofthe stocks. If you find yourself ever hoping a trade will come back, close it.
• Stay away from biotech stocks. This is my own personal opinion, butone that I find to be very accurate for the average trader. The problem withbiotech stocks is that they are very dependant on Food and Drug Adminis-tration (FDA) approvals, clinical trials, research, and many other loosefacets of drug research and manufacturing. Simply put, there is too much tobe quantified, unless you have additional countless hours to do the properresearch to understand what each company has in the works and where rev-enue will come from. All I am saying is that biotech companies can havehuge surprises, like FDA approvals, which can pound a portfolio should yoube on the wrong side of the trade. Thus, if you are willing to do the researchto uncover each biotech company’s entire repertoire of potential drugs, fine.If you’re not, then, as mentioned earlier, slower-moving stocks with trans-parent business plans may be better to trade.
• Lastly, always put on the short side of the pair first! This is very impor-tant to remember, as you will find with some stocks you may not be able toget any shares short, or you may not be able to get an up tick to get into theshort side. Please remember that it is vitally important to always make sureyou first have the short side secured before entering your long order. I gen-erally wait until I know that I actually have the short position, before evensending out the buy order. This is because sending both orders out at thesame time can sometimes result in getting filled on the long side, then hav-ing your short order rejected for whatever reason.
GK015-C28[229-232].qxd 6/10/04 7:39 PM Page 231 Virender Negi Quark07:BOOKS:GK015-Whistler:Quark files:

GK015-C28[229-232].qxd 6/10/04 7:39 PM Page 232 Virender Negi Quark07:BOOKS:GK015-Whistler:Quark files:
233
One of the last steps in our book is to use the spreadsheet that mon-itors many pairs at one time. The spreadsheet can be used as eitheran end-of-day tracking system or can also monitor pairs in real
time if you use a quote vendor that interfaces with Excel. For the mostpart, Excel will pull in quotes from just about any vendor and can be a use-ful tool in monitoring intraday pairs. The one drawback is that the quotesare not recorded, and thus drop off moment by moment. Imagine a hollowpipe you are pushing dirt through. As soon as you push dirt in one end, itfalls out of the other, and is only in the pipe so long as more dirt is notpushed in. I know this is a rough analogy, but it’s exactly how Excel reactsto the quote dilemma. While you can record data in Excel, I will not coverit in this book. Just remember that if you are using a live quote vendor,your pair will show live data, but will not display historical intraday chartsor movements.
The actual spreadsheet for tracking multiple pairs is located in the CD-ROM; thus, we will not actually build one from scratch, but it is important tounderstand what is going on in this sheet.
Figure 29.1 shows the sheet with only one line of data for KLAC/NVLS.However, the sheet in the CD-ROM has all of the actual data in it andincludes just under 100 pairs. Figure 29.1 displays the left side of the Monitorsheet, with 48 pairs. The goal of the sheet is to enable the tracking of multi-ple pairs all at one time, without having to look at all of the individual sheets.When you open the Monitor sheet, it should then give you the option to openall of the corresponding sheets, and/or update itself automatically. It isimportant to note that this will take up sufficient memory and could slow
CHAPTER 29
The MonitorSheet
GK015-C29[233-236].qxd 6/10/04 7:40 PM Page 233 Virender Negi Quark07:BOOKS:GK015-Whistler:Quark files:
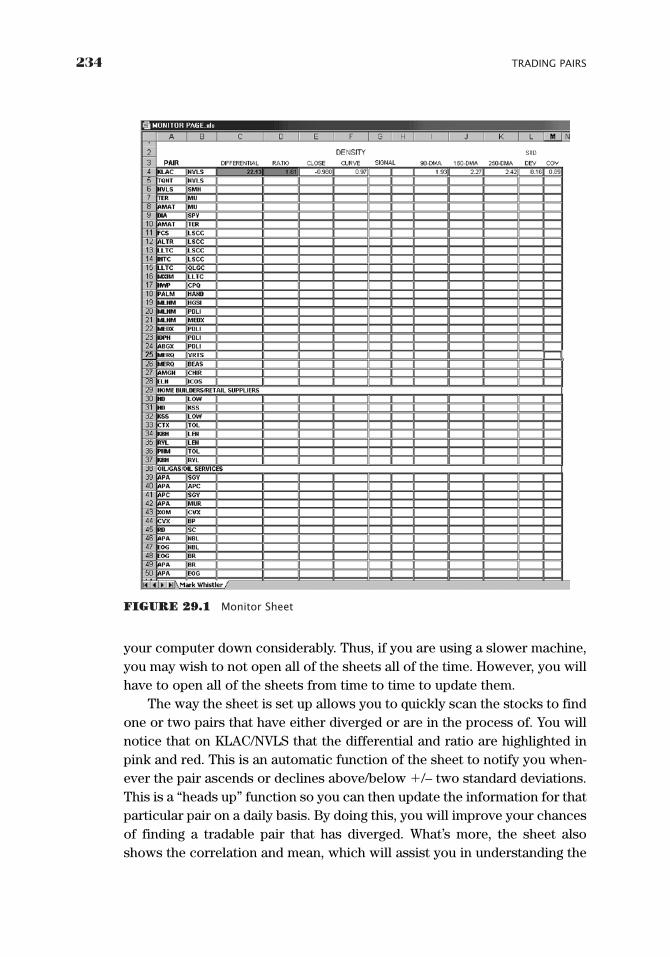
234 TRADING PAIRS
FIGURE 29.1 Monitor Sheet
your computer down considerably. Thus, if you are using a slower machine,you may wish to not open all of the sheets all of the time. However, you willhave to open all of the sheets from time to time to update them.
The way the sheet is set up allows you to quickly scan the stocks to findone or two pairs that have either diverged or are in the process of. You willnotice that on KLAC/NVLS that the differential and ratio are highlighted inpink and red. This is an automatic function of the sheet to notify you when-ever the pair ascends or declines above/below �/– two standard deviations.This is a “heads up” function so you can then update the information for thatparticular pair on a daily basis. By doing this, you will improve your chancesof finding a tradable pair that has diverged. What’s more, the sheet alsoshows the correlation and mean, which will assist you in understanding the
GK015-C29[233-236].qxd 6/10/04 7:40 PM Page 234 Virender Negi Quark07:BOOKS:GK015-Whistler:Quark files:
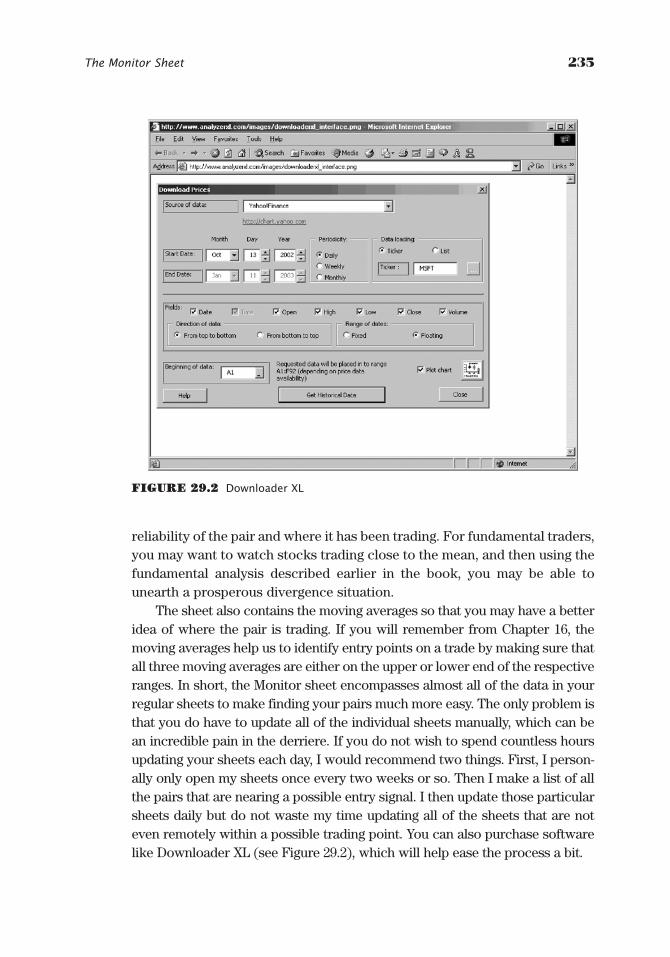
reliability of the pair and where it has been trading. For fundamental traders,you may want to watch stocks trading close to the mean, and then using thefundamental analysis described earlier in the book, you may be able tounearth a prosperous divergence situation.
The sheet also contains the moving averages so that you may have a betteridea of where the pair is trading. If you will remember from Chapter 16, themoving averages help us to identify entry points on a trade by making sure thatall three moving averages are either on the upper or lower end of the respectiveranges. In short, the Monitor sheet encompasses almost all of the data in yourregular sheets to make finding your pairs much more easy. The only problem isthat you do have to update all of the individual sheets manually, which can bean incredible pain in the derriere. If you do not wish to spend countless hoursupdating your sheets each day, I would recommend two things. First, I person-ally only open my sheets once every two weeks or so. Then I make a list of allthe pairs that are nearing a possible entry signal. I then update those particularsheets daily but do not waste my time updating all of the sheets that are noteven remotely within a possible trading point. You can also purchase softwarelike Downloader XL (see Figure 29.2), which will help ease the process a bit.
The Monitor Sheet 235
FIGURE 29.2 Downloader XL
GK015-C29[233-236].qxd 6/10/04 7:40 PM Page 235 Virender Negi Quark07:BOOKS:GK015-Whistler:Quark files:

GK015-C29[233-236].qxd 6/10/04 7:40 PM Page 236 Virender Negi Quark07:BOOKS:GK015-Whistler:Quark files:
237
THE MARKET BUBBLE
Bottom line, there’s always a bubble, and we have to constantly check tomake sure we’re not in it. While pairs trading is meant to hedge risk frompossible extraneous circumstances, it is critically important to rememberthat even when you are hedged, your portfolio could still be devastated.Thus, when you hear of a “bubble,” think more about your own money man-agement skills than the actual market circumstances. If you have preparedyourself well, understand your stocks, and have tight stops, then any—andall—bubbles will simply be trading events that you either win big in, or getstopped out for small losers. As investors, we live in glass houses, and trad-ing is like heaving huge stones of emotions. The true bubble is that of fearand greed, even if you are market neutral. Thus, pairs traders strive to breakdown the inevitable bubble paradigm by engaging in hedged trades. How-ever, as previously mentioned, our risk increases with additional capitalexposure, and more transaction fees. Our bubble is not one of market direc-tion, but one of efficient trading action within our own account. So, the nexttime you hear someone speak of a bubble, ask them what they mean. Afterall, skydivers without parachutes are generally more fearful than those whodo have them.
WORDS OF CAUTION
In my final words of caution, I would like to reiterate that the informationpresented in this book does not make up a “system” in which buy and sell
CHAPTER 30
ConclusionThe Market Bubble
Words of Caution
Last Words of Advice
GK015-C30[237-238].qxd 6/10/04 7:40 PM Page 237 Virender Negi Quark07:BOOKS:GK015-Whistler:Quark files:
238 TRADING PAIRS
points are automatically produced. Rather, we have come up with a tradingstyle, based on hedging risk. While we do use descriptive statistics to assistin our decision-making process, we do not isolate ourselves to this one pathof trading indicators. Instead, we cross-reference our decisions with funda-mental and technical analysis to make sure that the statistics alone will notprovide false indicators. I would also like to add that trading on the densitycurve alone can be incredibly dangerous. On volatile pairs, the density curvecan peg out at 0 or 1 for extended periods, while the pair continues to openup. If you do not have a tight stop loss for your trade, you can rest assuredthat you will lose money. What’s more, density curve entry signals vary fromstock to stock, so it is vitally important to make sure that you adjust theentry signal for every pair. Look through the historical data and see whatworks. Amazingly, a little common sense can save you countless hours offrustration, and may just be the savior of your entire account.
LAST WORDS OF ADVICE
Please remember that all of the information contained in this book is merelya basic guide to the pairs strategy. However, with a good understanding ofpairs trading and a little research, you can become a very successfulinvestor. All of the information in this book is meant to help you find a newmarket paradigm, with which to reshape the entire way you see investing.Lastly, please remember that the entry signals are the easy part of trading.Exiting trades successfully is what separates the novices from the pros. Ifyou cannot emotionally distance yourself from your positions, you arealmost guaranteed to hold on to losers when they move away from you. Thebest traders in the entire world are not stock pickers, but rather are moneymanagers who always make sure that they have a trading plan in effectbefore a trade is ever entered. With this in mind, good luck in your tradingventures, and remember, please take life in strides. After all, it’s only money—and family and friends are much, much more important.Godspeed.
GK015-C30[237-238].qxd 6/10/04 7:40 PM Page 238 Virender Negi Quark07:BOOKS:GK015-Whistler:Quark files:
APPENDIX I
EconomicIndicatorSummary
239
This appendix is in place because as a pairs trader it is crucial that youunderstand the events surrounding your positions, including eco-nomic news. I cannot enforce strongly enough how vitally important
it is to have a good understanding of the broader market. Thus, when aneconomic report is released, please reference this appendix to understandhow the news will affect your position(s).
ABC NEWS/Money Magazine Consumer Confidence Index: Weekly
Importance: 4Data lag factor: Several days
A rolling average with roughly 1,000 telephone interviews from Americanadults. The Index can range anywhere from �100 to �100, with participantsrating the national economy, personal finances, and buying climate.
Bankruptcy Filings: Monthly
Importance: 4Data lag factor: Two months
Measures chapter 7, 11, 12, and 13 bankruptcy filings for each quarter:
• Chapter 7: Business or personal liquidation, excluding some exemptproperty. Proceeds are given to creditors.
GK015-C31[239-254].qxd 6/10/04 7:40 PM Page 239 Virender Negi Quark07:BOOKS:GK015-Whistler:Quark files:
• Chapter 11: Businesses or individuals continue operations, but aretemporarily protected from creditors while reforming finances.
• Chapter 12: Aids financially stressed or defunct farmers. • Chapter 13: Creates three- to five-year payment plan for the repayment
of creditors.
http://www.uscourts.gov/Press_Releases/index.html
Beige Book: Published eight times per year
Importance: 7Data lag factor: Several days
Summarizes current economic conditions contributed by each FederalReserve Bank, the data is then summarized by district. Analysts look forcomments on construction and real estate, banking and finance, agricul-ture, energy and natural resources, regional labor market conditions, retailsales, consumer spending, and manufacturing activity. Does not includeany hard data; thus, investors are left to sift through the Fed’s chatter.
http://www.federalreserve.gov/policy.htm
Business Inventories: Monthly
Importance: 4Data lag factor: Two months
Measures business inventories in terms of retail, wholesale, and manufacturingdata. Analysts look at dollar value of merchant sales, along with end-of-monthinventories. In addition, the inventory-to-sales ratio measures time versusinventory depletion or replenishment. A low ratio indicates that manufacturersmust build more inventory.
http://www.census.gov/mtis/www/current.html
Chain Store Sales Snapshot: Monthly
Importance: 6Data lag factor: One month
240 APPENDIX I
GK015-C31[239-254].qxd 6/10/04 7:40 PM Page 240 Virender Negi Quark07:BOOKS:GK015-Whistler:Quark files:
This index tracks consumer spending at larger chain stores, focusing onDepartment of General Merchandise locations. The index records data onlyfrom stores that have been in business for more than one year. Thus, inphases of rapid growth, the data may not accurately reflect actual marketconditions. Reported as a percentage change, analysts like to see stablegrowth with stronger numbers during the holiday season.
http://www.btmny.com/reports/research/comment/Chain_Store_Sales.htm
Challenger Report: Monthly
Importance: 5Data lag factor: Roughly one week
The private firm Challenger, Grey, and Christmas collects and compilesinformation about layoffs from press releases. This information is then cat-egorized and summed in a report that attempts to give an accurate snapshotof labor market cutbacks, including layoffs from smaller firms. Reportbecomes much more important during bear markets.
Chicago Fed National Activity Index: Monthly
Importance: 3Data lag factor: One month
Released by the Chicago Reserve Board, the Index is meant to uncoverbroader economic conditions and to forecast inflation. The Index fluctuatesaround zero, with a positive number indicating that the economy is expandingabove its capability. Conversely, a number below zero potentially designatesthat the economy is not producing to its fullest potential.
http://www.chicagofed.org/economicresearchanddata/national/index.cfm
Chicago PMI: Monthly
Importance: 5Data lag factor: Not much, end-of-month data
Survey compiles information from purchasing managers about the manu-facturing industry. Any number above 50 indicates expansion, while a
Appendix I 241
GK015-C31[239-254].qxd 6/10/04 7:40 PM Page 241 Virender Negi Quark07:BOOKS:GK015-Whistler:Quark files:

number below 50 alludes to manufacturing contraction. The Index can beseasonally weighted at different times.
Construction Spending: Monthly
Importance: 4Data lag factor: One month
Attempts to report the total month-to-month amount of gains or losses (indollar values) in construction spending. Report is broken down into public,residential, and nonresidential construction expenditures. Because of largerevisions from month to month, analysts do not observe this report closely.
http://www.census.gov/const/www/c30index.html
Consumer Credit: Monthly
Importance: 3Data lag factor: Five weeks
Measures household (consumers) loans (credit) used for purchasing goodsand services, or refinancing other debt. Examines two categories, revolvingand nonrevolving debt, but does not include any loans secured with realestate. The report is subject to huge revisions and, thus, does not have muchmarket impact.
http://www.federalreserve.gov/releases/G19/
Consumer Price Index: Monthly
Importance: 8Data lag factor: Two weeks
Regarded as one of the most closely watched indicators of inflation, the CPImeasures changes of a fixed basket of goods and services. Most analysts onlylook at the “core rate” of inflation from the CPI, as food and energy can playhavoc with the results. Thus, excluding food and energy gives economistsmore reliable results and helps to understand long-term inflation trends.
http://www.bls.gov/news.release/cpi.toc.htm
242 APPENDIX I
GK015-C31[239-254].qxd 6/10/04 7:40 PM Page 242 Virender Negi Quark07:BOOKS:GK015-Whistler:Quark files:
Durable Goods Orders: Monthly
Importance: 7Data lag factor: Three weeks
Measures the total dollar volume of orders and shipments. The report is saidto be a leading indicator of the factory orders report, which is usuallyreleased the following week. Durable goods are products with a life spanof more than three years. Moreover, an increase in durable goods ordersmay allude to improving sentiment and demand from consumers who arewilling to purchase larger-ticket items. Analysts recommend removingdefense and aircraft orders to get a more accurate snapshot of durablegoods’ true picture.
http://www.census.gov/indicator/www/m3/adv/index.htm
ECRI Future Inflation Gauge: Monthly
Importance: 4Data lag factor: One month
Measured by the future inflation gauge (FIG), which is a weighted averageof eight separate sets of economic data. A rise in the FIG can precede aninflation increase.
http://www.businesscycle.com
ECRI Weekly Leading Index: Weekly
Importance: 5Data lag factor: One week
The Index is theoretically intended to predict near-term economic conditionsby weighting stock prices, bond yields, jobless claims, money supply, mort-gage applications, and bond spreads. Much of the data is already known bythe time this report is published; thus, it is not truly “leading.” Perhaps itshould be called “summary of leading indicators already published.”
http://www.businesscycle.com/freedata.php
Appendix I 243
GK015-C31[239-254].qxd 6/10/04 7:40 PM Page 243 Virender Negi Quark07:BOOKS:GK015-Whistler:Quark files:
Employment Cost Index: Monthly
Importance: 7Data lag factor: One month
This index is designed to record and measure the change in employers’costs for labor. Employment cost measures payrolls for the third month ofthe quarter and attempts to find changes in labor costs that potentiallyallude to growth in the broader economy. Gauged in quarter-over-quarterand year-over-year percentages.
http://www.bls.gov/news.release/eci.toc.htm
Employment Situation: Monthly
Importance: 6Data lag factor: One month
This report is a breakdown of total payrolls by sector, average workweek,and average earnings. Report is summarized as total change in nonfarmemployment for the month and year. This report is important to the Fedwhen gathering data for their decision on interest rates.
http://www.bls.gov/news.release/empsit.toc.htm
Existing Home Sales: Monthly
Importance: 5Data lag factor: One month
Existing home sales measured in actual unit numbers for single-familyhomes. Report can vary from time to time with volatile weather conditions.Can precede retail sector moves, as consumers need either more or feweritems for new homes. For example, a massive rise in home sales can pavethe way for a profitable quarter in home furnishing stocks.
http://realtor.org/Research.nsf/Pages/EHSPage?OpenDocument
Factory Orders: Monthly
Importance: 5Data lag factor: One month
244 APPENDIX I
GK015-C31[239-254].qxd 6/10/04 7:40 PM Page 244 Virender Negi Quark07:BOOKS:GK015-Whistler:Quark files:
Simply, a more detailed release of monthly durable goods, which usually con-tains the same information. The durable goods report leads factory orders.
http://www.census.gov/indicator/www/m3/prel/index.htm
FOMC Meeting: Meets eight times per year
Importance: 10Data lag factor: N/A
At FOMC meetings, the Fed makes decisions on monetary policy/interestrates and establishes its bias toward the economy. Minutes are released thefollowing day.
http://www.federalreserve.gov/fomc/
GDP: Monthly
Importance: 7Data lag factor: N/A
Gross domestic product (GDP) is a measurement of economic activitythrough the production and consumption of U.S. goods. The GDP is mea-sured by income and expenditures for both production and consumption.The deflator is then used to define the cycles of GDP. GDP growth is expectedto stay in the 2.0 to 2.5 range. Ideally, unemployment is not to exceed 6.0 per-cent. Growth above 2.7 percent indicates inflationary pressure.
http://www.bea.doc.gov/bea/dn1.htm.
Import and Export Prices: Monthly
Importance: 6Data lag factor: One month
A large change in import prices can affect the way analysts view foreignmanufacturers. In a nutshell, a weaker dollar means more exporting and lessimporting.
http://www.bls.gov/news.release/ximpim.toc.htm
Appendix I 245
GK015-C31[239-254].qxd 6/10/04 7:40 PM Page 245 Virender Negi Quark07:BOOKS:GK015-Whistler:Quark files:
Industrial Production: Monthly
Importance: 6Data lag factor: One month
Weighted measurement of the output of mines, factories, and utilities. Inaddition, industrial production gives analysts insight into capacity utiliza-tion. Measured month-over-month on a percentage basis, economists like tosee stable growth in capacity utilization.
http://www.federalreserve.gov/releases/G17/Current/default.htm
Internet Sales: Quarterly
Importance: 5Data lag factor: One quarter
This report covers sales of goods and services over the Internet. Bullishanalysts prefer to observe continued sales growth, thus supporting the con-tinued expansion of e-commerce.
http://www.census.gov/mrts/www/current.html
ISM Index: Monthly
Importance: 8Data lag factor: Several days
The ISM Index is comprised of data collected from purchasing managersabout production, new orders, employment, deliveries, and inventories. TheISM usually precedes the employment report and is said to indicate eco-nomic expansion above 44 percent. The overall average break-even level forthe broader report is 50 percent; however, production and employmentbreak even at lower levels.
http://www.ism.ws/ISMReport/index.cfm
ISM Non-Manufacturing Index: Monthly
Importance: 8Data lag factor: Several days
246 APPENDIX I
GK015-C31[239-254].qxd 6/10/04 7:40 PM Page 246 Virender Negi Quark07:BOOKS:GK015-Whistler:Quark files:
The ISM encompasses data collected from purchasing managers about busi-ness activity, new orders, inventories, and employment. All together, thedata reflects 10 separate indexes, though we have listed only four here. Anumber above 50 percent indicates manufacturing expansion, while a num-ber below 50 percent shows contraction.
http://www.ism.ws/ISMReport/index.cfm#nonmanufacturing
Jobless Claims: Weekly
Importance: 6.5 in bear market, 3 in bull marketData lag factor: Several days
Self-explanatory, though analysts like to see both initial claims and the four-week moving average stay beneath 400,000.
http://www.dol.gov/opa/media/press/eta/ui/current.htm
Kansas City Fed Manufacturing: Monthly
Importance: 5Data lag factor: Two weeks
This report surveys several facets of manufacturing plants to indicate expan-sion or contraction. A number above 100 is said to indicate growth, while anumber below signals a reduction. Can help to affirm results form the ISMreport.
http://www.kc.frb.org/mfgsurv/mfgmain.htm
MBA Mortgage Applications Survey: Weekly
Importance: 5Data lag factor: One week
Counts mortgage and refinancing applications for personal real estate trans-actions. However, the survey is a leading indicator of conditions becauseapplications are a proposed event to occur in the future.
http://www.mbaa.org/news/weekly_app.html
Appendix I 247
GK015-C31[239-254].qxd 6/10/04 7:40 PM Page 247 Virender Negi Quark07:BOOKS:GK015-Whistler:Quark files:
Monthly Mass Layoffs: Monthly
Importance: 4, with the exception of bear marketsData lag factor: One month
This report consists of unemployment information collected from individualstates. Increasing layoffs during tough times will not bode well for bulls.
http://www.bls.gov/news.release/mmls.toc.htm
NAHB Housing Market Index: Monthly
Importance: 4Data lag factor: Very little
The NAHB Index is a builders’ sentiment survey designed to rate current andfuture sales. However, current conditions and mood do not always accu-rately predict future trends.
http://www.nahb.org/
NAPM–NY Report: Monthly
Importance: 4Data lag factor: Very little
National Association of Purchasing Managers, surveys purchasingmanagers to gain insight into the manufacturing sector. A reading above50 is said to indicate expansion, while a reading below 50 alludes tocontraction.
New Home Sales: Monthly
Importance: 5Data lag factor: Very little
New Home Sales measures private homes that have either sold or are forsale. The report’s inventory reading is an indicator into future trends of thehousing markets.
http://www.census.gov/const/www/newressalesindex.html
248 APPENDIX I
GK015-C31[239-254].qxd 6/10/04 7:40 PM Page 248 Virender Negi Quark07:BOOKS:GK015-Whistler:Quark files:
New Residential Construction: Monthly
Importance: 6Data lag factor: One month
Measures the number of houses planned, in process, authorized, started, andcompleted. All statistics are for private residential real estate. Measured interms of total units, New Residential Construction is a looking glass intobuilders’ inventories.
http://www.census.gov/const/www/newresconstindex.html
Oil and Gas Inventories: Weekly
Importance: 5Data lag factor: One week
Measurements by the Energy Information Agency (EIA) and the AmericanPetroleum Institute (API) are complied to get accurate readings on inven-tory levels of crude, distillates, and gasoline. Market mostly pays attentionto whether the weekly numbers exceed or fail predictions.
http://www.eia.doe.gov/
http://api-ec.api.org/newsplashpage/index.cfm
Personal Income: Monthly
Importance: 5Data lag factor: One week
Personal Income measures household income from all sources. Analysts seekconstant growth to keep up with inflation and indicate healthy labor markets.
http://www.bea.doc.gov/bea/rels.htm
Philadelphia Fed Survey: Monthly
Importance: 7Data lag factor: Very little
Appendix I 249
GK015-C31[239-254].qxd 6/10/04 7:40 PM Page 249 Virender Negi Quark07:BOOKS:GK015-Whistler:Quark files:
The Survey polls manufacturers on general business conditions. The outlookgenerated usually shows up in the NAPM report, but only behind theChicago Fed Survey, which has slightly more weight.
http://www.phil.frb.org/econ/bos/index.html
PPI: Monthly
Importance: 7Data lag factor: Very little
Basically, the PPI measures wholesale prices. Wholesale goods are lumpedinto three groups: crude, intermediate, and finished. Results are based onmonth-over-month and year-over-year results.
http://www.bls.gov/news.release/ppi.toc.htm
Productivity and Costs: Quarterly
Importance: 5Data lag factor: One month
Measures productivity and costs associated with the production of nonfarmgoods. GDP released before this report can foreshadow the expected resultsfrom productivity.
http://www.bls.gov/news.release/prod.toc.htm
Retail Sales (MARTS): Monthly
Importance: 5Data lag factor: One month
Measures retail sales by total receipts of established companies in theUnited States. Many analysts take auto sales (ex-auto) out of the report inorder to get a more accurate picture of consumers’ spending habits.
http://www.census.gov/svsd/www/fullpub.html
250 APPENDIX I
GK015-C31[239-254].qxd 6/10/04 7:40 PM Page 250 Virender Negi Quark07:BOOKS:GK015-Whistler:Quark files:

Richmond Fed Manufacturing Survey: Monthly
Importance: 4. Data lag factor: One week
Survey by the Richmond Fed, which polls manufacturers’ purchasing man-agers, plant managers, and controllers about current conditions. The surveyhas a range of �100 to �100, with a value above 0 expressing expansion anda value below 0 indicating contraction.
http://www.rich.frb.org/research/surveys/mfg.html
SEMI Book-to-Bill Ratio: Monthly
Importance: 6. Data lag factor: Two to three weeks
This survey compiles data on orders and shipments and then calculates thethree-month moving average and the book-to-bill ratio. Basically, a ratio above1.0 means expansion, while a value below 1.0 points toward contraction.
http://www.semi.org/web/wpress.nsf/url/booktobill
Semiconductor Billings: Monthly
Importance: 7 for semiconductors Data lag factor: Six weeks
Report is a regional breakdown of circuit sales including almost all facets ofchips. The report then creates a three-month moving average for the follow-ing regions: the Americas, Europe, Japan, and Asia-Pacific.
http://www.semichips.org/pressroom.cfm
The Conference Board Consumer Confidence: Monthly
Importance: 5 Data lag factor: One week
Appendix I 251
GK015-C31[239-254].qxd 6/10/04 7:40 PM Page 251 Virender Negi Quark07:BOOKS:GK015-Whistler:Quark files:
Measures consumer confidence by the direct mailing of 5,000 households.The survey initially began at 100 in 1985; thus, investors can use the 100benchmark to gauge consumer trends.
http://www.conference-board.org/
The Conference Board Leading Indicators: Monthly
Importance: 5Data lag factor: Three weeks
Takes 10 leading indicators and creates a weighted average that is supposedto lead turns in the economy. Look for trends of gains or losses lasting threeor more months to indicate a potential economic reversal.
http://www.conference-board.org/
Treasury Budget: Monthly
Importance: 3Data lag factor: Two weeks
Treasury budget data that attempts to unveil budget trends by uncoveringmonthly fluctuations in the national deficit. Watch analysts’ estimates formarket reaction.
http://www.fms.treas.gov/mts/
UBS Index of Investor Optimism: Monthly
Importance: 4Data lag factor: One month
Telephone survey attempting to gauge consumer confidence, with data com-mencing in 1996. Has little market impact, but may be used to affirm otherconsumer confidence reports.
University of Michigan Consumer Sentiment Survey: Monthly
Importance: 7Data lag factor: Not much
252 APPENDIX I
GK015-C31[239-254].qxd 6/10/04 7:40 PM Page 252 Virender Negi Quark07:BOOKS:GK015-Whistler:Quark files:
Telephone survey of 500 consumers. The Survey had a low of 70 in 1992 anda high of just over 110 in 2000.
http://www.sca.isr.umich.edu/
Vehicle Sales: Monthly
Importance: 4Data lag factor: Two days
In a nutshell, this report measures vehicle sales broken down by types ofautomobiles. Simply look for ascending or descending trends that surpriseor disappoint analysts.
Weekly Natural Gas Storage Report: Weekly
Importance: 4Data lag factor: One week
Report gives total natural gas storage in the United States by Bcf (billioncubic feet). Analysts look for inventory fluctuations, along with where stor-age levels are relative to their five-year moving averages. Report is brokendown into regional sections of the United States Producing (Alabama,Arkansas, Kansas, Louisiana, Mississippi, New Mexico, Oklahoma, andTexas), East, and West.
http://tonto.eia.doe.gov/oog/info/ngs/ngs.html
Wholesale Trade: Monthly
Importance: 4Data lag factor: Two months
Measures the second stage of manufacturing by collecting information onsales and inventory. Most analysts look only at the inventory/sales ratio,which indicates whether manufactures will need to increase/decreaseproduction.
http://www.census.gov/svsd/www/mwts.html
Appendix I 253
GK015-C31[239-254].qxd 6/10/04 7:40 PM Page 253 Virender Negi Quark07:BOOKS:GK015-Whistler:Quark files:

GK015-C31[239-254].qxd 6/10/04 7:40 PM Page 254 Virender Negi Quark07:BOOKS:GK015-Whistler:Quark files:

APPENDIX II
Websites, Books,and Software
255
Website References
Correlations—pay site http://www.market-topology.com/
Hedge funds—general informationhttp://www.hedgeworld.com/
Hedge Fund Indexhttp://www.hedgefund-index.com/
News: Bloomberg.comhttp://www.bloomberg.com/
News: CBS Marketwatch.comhttp://cbs.marketwatch.com/news/default.asp?siteid�&avatar�seen
News and resources: Yahoo.comhttp://finance.yahoo.com/?u
News and resources: Smartmoney.comhttp://www.smartmoney.com/
News and resources—pay site: Briefing.comhttp://www.briefing.com/
SEC link on hedge fundshttp://www.sec.gov/answers/hedge.htm
Sectors: Barchart.comhttp://www2.barchart.com/sectors.asp?base�industry
GK015-C32[255-256].qxd 6/10/04 7:42 PM Page 255 Virender Negi Quark07:BOOKS:GK015-Whistler:Quark files:
Books and Articles
Book: The Complete Arbitrage Deskbook by Stephane Reverre
Definitions: Investorwords.comhttp://www.investorwords.com/cgi-bin/getword.cgi?5803
Paper: Pairs Trading: Performance of a Relative Value Arbitrage Rule
http://econpapers.hhs.se/paper/nbrnberwo/7032.htm
Stocks and commodities—article costs $3.95Pairs Trading by Stephane Reverrehttp://store.traders.com/traderscom/v19319pairtr.html
Time article on Hedge Fundshttp://www.time.com/time/globalbusiness/article/0,9171,1101020701-
265448,00.html
USA Today article on Hedge Fundshttp://www.usatoday.com/money/perfi/funds/2003-02-10-hedge x.htm
Software
ACME Trader—pairs softwarehttp://www.acmetrader.com/pages/576123/
Happy Trader—pairs softwarehttp://www.happytrader.com/products/pairs.htm
ITG Pairs Softwarehttp://www.itginc.com/products/quantex/qtx99-pairs.html
Linnsoft—pairs softwarehttp://www.linnsoft.com/tutorials/pairsTrading.htm
Technical Analysis softwarehttp://www.analyzerxl.com/
Tricom—pairs softwarehttp://www.tricom.com.au/equities/articles/pairs.asp
256 APPENDIX II
GK015-C32[255-256].qxd 6/10/04 7:42 PM Page 256 Virender Negi Quark07:BOOKS:GK015-Whistler:Quark files:
257
Glossary
Chapter 1
1.1. Source: http://www.investopedia.com/terms/a/arbitrage.asp.
1.2. Source: http://www.investopedia.com/terms/s/statisticalarbitrage.asp\\ .
Chapter 2
2.1. Source: Tom Jacobs, “30-Baggers, Anyone?”, The Motley Fool,
http://biz.yahoo.com/fool/030730/1059581940_3.html.
Chapter 3
3.1. At the time this was written, there was legislation pending meant torecognize preferred stock as debt instead of equity. The result of this legisla-tion would be that many companies will see their debt-to-equity ratios surgehigher overnight, once they actually have to recognize the preferred stock ontheir books. Initially, the new laws will affect only trust preferred companiessuch as real estate investment trusts (REITs) and mortgage corporations.
Chapter 4
4.1. Slippage denotes the price received versus the price intended. If youenter a market order to buy XYZ at $20 and the stock is rapidly ascending,without a limit order, your actual fill price may be higher than the priceyou have anticipated. To best protect against slippage, it is a good idea toenter “limit orders” with all trades. An order to buy Stock XYZ at $20 witha limit of $20.25 ensures that investors will not receive a price higher than$20.25. The resulting downside is that if the stock is rapidly ascendingand the price of the stock moves above $20.25, you may not get filled atall! However, perhaps it is better to miss a trade entirely than to get filledway above the desired level.
Endnotes
GK015-C33[257-260].qxd 6/10/04 7:42 PM Page 257 Virender Negi Quark07:BOOKS:GK015-Whistler:Quark files:
4.2. Steve Nison, Beyond Candlesticks: New Japanese Charting Techniques.
New York: John Wiley & Sons, Inc., 1994.
Chapter 11
11.1. As previously mentioned, a Gaussian curve is also known as a normaldistribution, where the mean, median, and mode are all in the center of theupside down U, also known as a “bell curve.” When we draw a normal dis-tribution, our goal with standard deviations is to measure the data from thecenter of the curve to the outlying tails.
Chapter 16
16.1. Stephane Reverre, The Complete Arbitrage Desk Book. New York:McGraw-Hill, 2001.16.2. The point of this equation is to divide a 90-day MA by the standarddeviation of 90 days’ worth of data.
Chapter 19
19.1. The CBOE Volatility Index (VIX) is a key measure of market expecta-tions of near-term volatility conveyed by S&P 500 index options prices.Since its introduction in 1993, VIX has been considered by many to be theworld’s premier barometer of investor sentiment and market volatility.Source: http://www.cboe.com/micro/vix/index.asp
Chapter 20
20.1. Lisa Sanders, “Apache Posts Four-fold Rise in Profit.”CBS.MarketWatch.com. Last update: April 24, 2003.20.2. Lisa Sanders, “Oil-drilling’s Outspoken Captain: At 80, Apache’s PlankRides Hard, and He’s Unapologetic,” CBS.MarketWatch.com, November 22,2002. http://cbs.marketwatch.com/news/story.asp?siteid�mktw&guid�
%7BFF334005%2DCB6C%2D40E8%2DBD1B%2DDB20D04CAC41%7D&.
20.3. Lisa Sanders, “Apache Posts Four-fold Rise in Profit.” CBS.MarketWatch.com, April 24, 2003. http://cbs.marketwatch.com/news/story.asp?guid�
{78DF8265-EB81-49C1-8185-5E221E821517}&siteid�mktw&dist�
&archive�true
258 ENDNOTES
GK015-C33[257-260].qxd 6/10/04 7:42 PM Page 258 Virender Negi Quark07:BOOKS:GK015-Whistler:Quark files:
Chapter 21
21.1. Investopedia.com. http://www.investopedia.com/terms/b/bookvalue.asp.21.2. Lisa Sanders, “Record Production Fuels Apache Q2. CBS.MarketWatch.com.” 7-24-2003
Chapter 22
22.1. “Anadarko Petroleum Upped to ‘mkt perform’ at Wachovia.” CBSMarketWatch.com, October 7, 2003. http://cbs.marketwatch.com/tools/quotes/
news.asp?siteid�mktw&docty
22.2. Yereth Rosen, “Independents Win Rights to Explore Alaska N. Slope,” October 29, 2003. http://cbs.marketwatch.com/tools/quotes/newsArticle.
asp?guid � {6C8B7FD3-A8CC-4B2A-B5C5-3ADDED58A303}
&siteid�mktw&archive� thirdtrue&dist�RegSignIn
22.3. Joseph A. Giannone, “Anadarko CEO Vows More Focused OverseasEfforts,” November 6, 2003. http://cbs.marketwatch.com/tools/quotes/
newsarticle.asp?siteid�mktw&sid�582&guid�%7B6A46A633%2D34B2%i
2D4871%2DB927%2DD4192EB45881%7D.
Chapter 26
26.1. Sheldon Natenber, “Option Pricing & Volatility,” McGraw-Hill, 1994.
Endnotes 259
GK015-C33[257-260].qxd 6/10/04 7:42 PM Page 259 Virender Negi Quark07:BOOKS:GK015-Whistler:Quark files:

GK015-C33[257-260].qxd 6/10/04 7:42 PM Page 260 Virender Negi Quark07:BOOKS:GK015-Whistler:Quark files:
261
Absolute return: A method of measuring investment results in terms ofpositive and negative, as opposed to comparing returns to a market index.
Active management: An investment process in which the fund or accountattempts to outperform a benchmark. Active management is often referredto as the practice of market timing.
Active manager: A money manager who participates in several aspects of theinvestment process. An active manager may have a hand in risk management,investment selection, and asset allocation.
Accredited investor: An investor with a net worth in excess of $1 millionor who has made $200,000 per year the previous two years, or a householdthat has made $300,000 per year the previous two years.
Alternative investments: Investments generally not available to the massinvesting public. A common example is a hedge fund.
AMEX: The American Stock Exchange is the primary market for mostexchange-traded funds.
Arbitrage: A low-risk strategy of simultaneously buying and selling securitieson different markets to take advantage of price inefficiencies. An examplewould be to buy a security on one exchange and simultaneously sell it onanother for a profit.
Bear market: A market condition wherein prices are heading lower. If anindividual believes the market is going down, he/she would be considered“bearish on the market.”
Blue-chip stocks: Large, well-known companies with long histories of div-idends and earnings. Some examples are 3M, IBM, Disney, Alcoa, and Coca-Cola. The Dow Jones Industrial average is considered to be made up ofblue-chip stocks. They are considered to be less risky or volatile than otherclasses of stocks.
Bond: A debt obligation of a corporation or a government. The bond isissued with a face amount and has a specific term. The issuer of the bond
GlossaryJonathan Crowell
GK015-C34[261-268].qxd 6/12/04 2:18 AM Page 261 Quark08 Quark08:Books:GK-Jobs:GK015-Whistler:Repro:
will pay interest during the term of the bond. When the term is expired, thebond is considered mature and the issuer is obligated to pay back the faceamount of the bond. Bonds are similar to credit cards. When we use a creditcard we pay interest on the amount borrowed and pay back the balance at alater date.
Market breadth: The measure of how many stocks on an exchange partic-ipated in a day’s move. If the market goes up and three fourths of the stockson that exchange go up as well, this would be considered good marketbreadth. It is used as an indicator to gain insight into potential future marketmovements.
Breakout: Term used in technical analysis. Refers to a stock price movingabove a resistance level, important to technical analysts because it could be aprecursor to a major price move. A breakout can be used as a buy or sell sig-nal and also aid in choosing your exit point prior to entering an investment.
Bull market: A market condition wherein prices are moving higher. If anindividual believes the market is poised to move higher, he/she would beconsidered “bullish on the market.”
Correlation: A statistical measure of two numerical values. The market isfull of correlations; for example, an increase in oil prices will increase an air-line’s fixed expenses, leading to airlines having lower profit margins orcharging higher ticket prices. It could be said that the airline and oil sectorare negatively correlated. An example of a positive correlation would be PCsales and microchip sales. If PC sales are strong, it would stand to reason thatmicrochip sales would also be strong, since microchips power PCs.
Debt-to-asset ratio: A ratio used to measure the amount of debt a companyhas in relation to its assets. This is important when performing fundamentalanalysis of a company. This is also important when looking at a market sectorbecause the level of debt may vary from sector to sector. The higher thedebt level, the more vulnerable a sector could be to interest rates andcredit problems.
Debt-to-equity ratio: This is a measure of a company’s leverage. This is animportant number when performing fundamental analysis of a company.This measures the amount of debt a company has in relation to equity. It iscalculated by dividing a company’s long-term debt by market capitalization.
Derivative: An asset whose value is derived from an underlying security. Anexample of a derivative would be a pork belly future. The current value ofthe future contract is derived from or contingent upon the current marketprice of pork bellies.
262 GLOSSARY
GK015-C34[261-268].qxd 6/12/04 2:18 AM Page 262 Quark08 Quark08:Books:GK-Jobs:GK015-Whistler:Repro:
Discount rate: The interest rate the Federal Reserve charges memberbanks for loans. This is the base rate used when banks set their loan rates.
Diversification: The strategy of investing across many different asset classes.The logic is that different asset classes will perform differently, leveling outperformance and reducing the volatility of a portfolio.
DIAMONDS: An exchange-traded fund designed to duplicate the performanceof the Dow Jones Industrial Average.
Dow Jones Industrial Average: An index of 30 major companies, repre-senting the majority of the U.S. economy. This is also known as “The Dow.”This is the most widely quoted and followed index in the United States.
Enhanced indexing: This is a strategy used when simply trying to outper-form an index.
Equity: Represents ownership in a corporation. Also known as stock orshares in a company.
Federal funds rate: This is a widely followed number because it is the bestindicator of the direction interest rates are headed. This is the overnight rateat which financial institutions lend money to each other. This rate is set bythe Federal Reserve.
Federal Reserve System: Created in 1931 to regulate credit. Also knownas “The Fed.”
Folio: A basket of diversified stocks, giving the investor the flexibility tomanage the stocks on an individual basis. Folios are made up of 30 to 50 indi-vidual stocks and can be quite difficult to track. Folios are better suited towealthy investors who can afford a professional to aid them in managing theindividual securities making up the folio.
Fundamental analysis: An approach to investment selection focusing on acompany’s balance sheet, business environment, sales, and managements skills.
Hedge: A strategy used to offset risk. The most commonly used hedgingtechniques are short selling, options, and futures. Hedging can limit down-side risk, making it critical to risk management.
Hedge fund: An investment product, similar to a mutual fund. Hedge fundsare usually set up for accredited investors only; they have high fees and alimited number of investors. Generally, the manager of a hedge fund willinvest his or her own personal money in the fund. Hedge funds, unlike mutualfunds, try to hedge or limit the risk they take on every investment.
HOLDRs: A diversified basket of stocks, similar to an exchange-tradedfund. HOLDRs have an underlying basket of stock from which they derive
Glossary 263
GK015-C34[261-268].qxd 6/12/04 2:18 AM Page 263 Quark08 Quark08:Books:GK-Jobs:GK015-Whistler:Repro:
their value. The owner of a HOLDR has the ability to convert from theHOLDR share to the basket of underlying stock. The tax consequences ofconverting a HOLDR to the underlying basket can be quite complicated andshould be done only under the guidance of an investment professional. Thecommissions charged on this strategy will make it cost prohibitive for mostsmall investors.
How to Short a Stock:
Written by aspiring author, Aaron J. Long (12 Years Old)
Shorting a stock is like taking a loan. You borrow a stock, sell it, and atsome point you pay it back. Although unlike a loan, there isn’t always inter-est. Sometimes you have to pay back less than you borrowed because youdon’t pay it back in money, you pay it back in stock. So say Ed wants to sellshort 100 shares, of MGM stock. He finds the stock from the firm’s list ofstocks; he borrows 100 hundred shares, then sells them. Now at some pointhe has to pay it back. So he buys the stock again and pays it back to thefirm. Let’s say that in between this time MGM stock drops $1.27 per share.That way Ed has to pay $127 less to buy the 100 shares back. So he makes$127. But if he had shorted 1,000 shares, he would have made $1,270. In thesame way what if that stock’s value goes up? Ed would have to pay more forthe stock. And therefore he would lose money. Shorting a stock is just asrisky as buying and selling stock the old fashioned way. But as they say: “Noguts, no glory.”
Index: A numerical value assigned to a representative group of stocks orbonds. The purpose of an index is to benchmark the market’s movement.
Index fund: A fund designed to perform exactly as the underlying indexperforms. Many exchange-traded funds are designed to follow or trackspecific indexes.
Indexation: The practice of a fund’s attempting to duplicate the performanceof an index.
Institutional investors: A term used to describe banks, mutual funds, bro-kerage firms, pension funds, insurance companies, and so on. Basically, anylarge interest other than an individual could be classified as an institutionalinvestor.
Investment banking: The practice of raising capital for entrepreneurs. Theterm is most often used on Wall Street when referring to initial public offeringsor raising money by selling new issues in securities.
Investment Company Act of 1940: Legislation passed in 1940 to regulatefunds and investment advisors. This act gave birth to the modern-day mutualfund industry.
264 GLOSSARY
GK015-C34[261-268].qxd 6/12/04 2:18 AM Page 264 Quark08 Quark08:Books:GK-Jobs:GK015-Whistler:Repro:
Investment horizon: The length of time an investor plans to hold aninvestment.
Investment objective: When referring to a fund or manager, it is theexpected result of the management. When referring to an investor, it is whatthe investor hopes to achieve by investing. Some examples would be growthor income. Investment objectives are important because different objectivesrequire different investments. Growth investors hope to see the value of thestocks in their portfolio increase, while income investors need a regularincome and would be better off owning an investment that paid regulardividends or interest.
Leverage: Anything multiplying the effect of a price change in an underlyingsecurity. The most common form of leverage is margin borrowing.
Limit order: An order in which you state a specific price you will be buyingor selling a security.
Liquidity: The ease with which an investment can be bought or sold. Factorsaffecting liquidity are volume and the number of market participants.
Market capitalization: The total value of a company’s outstanding stock.The number can be figured by multiplying the total number of shares out-standing by the stock price. This can also be referred to as capitalization ora company’s capitalization.
Market order: An order to buy or sell a security in the open market at thefirst available price.
Mutual fund: A professionally managed account in which investors canpool their money to accomplish a common investment objective.
NASD: National Association of Securities Dealers, a self-regulatory agency,charged with maintaining high ethical standards and uniform practicesamong member firms.
NASDAQ: A real-time quotation and trading system set up by the NASD.
NYSE: New York Stock Exchange, the oldest and most prestigious market inthe United States. The NYSE is a self-regulatory agency similar to the NASD.
Passive management: The opposite of active management. Passive man-agement begins with a set portfolio that does not change. Indexation is acommon form of passive management.
Pullback:
Written by future novelist, Andrew C. Long (16 Years Old)
A pullback occurs when the demand for a particular stock drops and withthe demand goes the price. This is good if you are waiting to buy the stock, butif you are already “riding the train” and trying to get off . . . you’re in trouble.
Glossary 265
GK015-C34[261-268].qxd 6/12/04 2:18 AM Page 265 Quark08 Quark08:Books:GK-Jobs:GK015-Whistler:Repro:
QQQ: Also known as the Qs. An exchange-traded fund designed to duplicatethe performance of the NASDAQ 100 index.
REIT: Real estate investment trust. They trade on an exchange and aremanaged portfolios of real estate.
Risk/reward ratio: A basic concept used in determining the merits of aninvestment. It measures the expected return versus the maximum loss on aninvestment. If you make money on 50 percent of your investments, a mini-mum ratio for an investment should be 3 to 1. For every $3 you expect toearn in profits, you are willing to risk losing $1.
RIA: Registered investment advisor. A company registered with a state orthe Securities and Exchange Commission. RIAs give investment advice on afee-based basis.
Rule 12 (d)(1) Limit: Limits the amount of stock a mutual fund can holdin a particular issue.
SEC: Security Exchange Commission, created by congress in 1931 to over-see the investment industry.
Short sale: The practice of selling a security not currently owned in hopesof purchasing it at a lower price in the future.
Short sale rule: Requires that certain market conditions be met prior to enter-ing an order to sell short.
Specialist: An exchange member responsible for keeping a fair and orderlymarket in a security during exchange hours. Specialists are located on thefloor of the exchange.
SPDRs: Also known as the spiders. An exchange-traded fund designed toduplicate the performance of the S&P 500 index.
S&P 500 index: Standard and Poors 500 index. An index comprised of 500industry-leading companies.
Stop order: A two-part order. The stop price, the first part of the order, isa price the security must trade at before the second part of the order may beactivated. Once the stop price is triggered, the order converts into a marketorder. This order is difficult to understand, yet essential to your success. Besure to ask your broker for assistance when you are first learning to use thisorder.
Stop limit order: This order works like a stop order, but when the secondpart is activated it turns into a limit order. This order is difficult to under-stand, yet essential to your success. Be sure to ask your broker for assistancewhen you are first learning to use this order.
266 GLOSSARY
GK015-C34[261-268].qxd 6/12/04 2:18 AM Page 266 Quark08 Quark08:Books:GK-Jobs:GK015-Whistler:Repro:
Systematic investment plan: An investment strategy used to invest inopen-ended mutual funds. This is a good strategy for low-dollar investors. Itallows investors to invest a regular amount on a regular basis, as little as $25and as often as twice a month. These plans are good for smaller investorsbecause there is generally no additional fee for the service.
Technical analysis: The use of charts and graphs to identify trends andprice patterns that may predict future price movements.
Ticker: The symbol used to buy and sell an investment.
Third market: Trading of an exchange-listed security on the over-the-counter(OTC) market.
Top-down investing: The practice of focusing first on major market trends,then narrowing the view to specific industries and finally to individual stocks.
Value investing: Focusing on stocks with a low price-to-book ratio with agood dividend yield.
Volatility: The price fluctuation of the market, a fund, or an individualstock.
Volume: Usually measured on a daily basis. It refers to the total number ofshares traded on an exchange or an individual stock. This is an important fac-tor in technical analysis. When compared over like periods, it is consideredto give insight into the strength of a price movement.
Glossary 267
GK015-C34[261-268].qxd 6/12/04 2:18 AM Page 267 Quark08 Quark08:Books:GK-Jobs:GK015-Whistler:Repro:

GK015-C34[261-268].qxd 6/12/04 2:18 AM Page 268 Quark08 Quark08:Books:GK-Jobs:GK015-Whistler:Repro:
269
Index
A
American options, 195Anadarko Petroleum:
fundamental analysis of, 138–142trading diary for, 119–131, 143–185
Apache Oil:fundamental analysis of, 113–138trading diary for, 119–131, 143–185
Arbitrage, defined, 1–2Average, in Excel spreadsheet, 75–80
B
Beta:explained, 65–66how to apply, 66–67ratio and, 88
Biotech stocks, 231Bloomberg terminals, 59–60Book value, 134Bubble, 237
C
Call options, 195–200pairs and, 208–210
Candlestick charting, 23–28doji star, 25, 26engulfing patterns, 26–28hammer bottoms and hangman tops,
23–25shooting stars, 25–26, 27
Cash, importance of company’s, 19CBOE Volatility Index (VIX), 258Chaikin Money Flow Oscillator, 35–36Charts, 83–86China.com, 6–8Churning, 113Classes of data, defining of, 69–70Convergence trading, 45, 112Correlation:
building in Excel, 60–64explained, 41–42, 51–57, 59indices and, 65–67, 230where to find, 59–60
Covariance, 53–54Covered call, 199
pairs and, 208–210Covered puts, pairs and, 208–210Cuddie, Kevin, 101Current ratio, 19
D
Data, see Excel spreadsheet; StatisticsDay trading, see Intraday tradingDebt-to-equity ratio, 19, 257Density curve, 89–93, 95–96
used in Apache/Anadarko analysis,145–184
Derivatives, see OptionsDIAMONDS, General
Electric/ExxonMobil and, 189–193Diary, see Trading diaryDifferential, 42–44, 87–88Differential moving average (DMA),
97–98applied to pairs, 212–213
Divergence trading, 44–45, 112–113Doji star, 25, 26
E
Earnings:of Anadarko Petroleum, 140of Apache Oil, 134–135cautions about trading in earnings
season, 229, 231researching growth in, 12–15
eBay, 225–227Economic indicator reports, summary of,
239–253
Whistler Index [269-272].qxd 6/10/04 7:43 PM Page 269 Virender Negi Quark07:BOOKS:GK015-Whistler:Quark fi
270 INDEX I
End-of-day (EOD) data, importing intoExcel, 47–50
Engulfing patterns, 26–28European options, 195Evening Star pattern, 135–136Excel spreadsheet:
analyzing statistical data in, 80–83,95–96
building correlation using, 60–64charting statistical data in, 75–80,
83–86density curve in, 90–91importing data into, 47–50monitor sheet in, 233–235syntax and command vocabulary in,
60, 77volatility position sizing in, 201–203
Exchange-traded fund (ETF), 189Exponential moving average (EMA),
31–32ExxonMobil:
correlating to General Electric,187–193
PE and, 218volume and, 215
F
Fear, as trading destroyer, 106Float, 10–11Foreign currency, options on, 196Forward PE, 133–134Frequency distribution, 69–70Frequency of date, in correlation
coefficient calculation, 56–57Fundamental analysis, 5–8, 19–20
of Anadarko Petroleum, 138–142of Apache Oil, 113–138Apache Oil/Anadarko Petroleum
trading diary, 119–131, 143–185applied to pairs, 216–220growth/PE/PEG and, 15–19growth ratios and, 12–15of KBH Homes and Toll Brothers,
220–225liquidity and shares outstanding, 9–11
Futures, options on, 196–197
G
Gaussian curve, 82–83, 258General Electric, correlating to
ExxonMobil, 187–193
Growth:growth ratios and, 12–15PE and the PEG, 15–19
H
Hammer bottoms, 23–25Hangman tops, 23–25Hedge funds, 4
I
Indices, 3, 65–67, 187–193, 230Intel, 217Internet, using for earnings reports,
12–14Intraday trading, 4, 113
in earnings season, 229–230risks of, 115–117stock volatility and, 204
K
KBH Homes, 220–225
L
Lagging indicators, 21Liquidity, and shares outstanding, 9–11Losses, cutting of, 101–103
M
Market bubble, 237Market risk, defined, 66Marsh McLennan, 226, 227Mean deviation, 71Median, 71, 75–80Mode, 71, 75–80Money management, 96
dangers of pairs trading, 103–104importance of cutting losses, 101–103principles of, 105–108
Monitor sheet, 233–235Moving average convergence divergence
(MACD), 213–214Moving average, 30–32, 97–98. See also
Simple moving average (SMA)applied to pairs, 212–213stop loss points and, 225–227
N
Naked call option, 197Natenburg, Sheldon, 208Normalized standard deviation,
99–100
Whistler Index [269-272].qxd 6/10/04 7:43 PM Page 270 Virender Negi Quark07:BOOKS:GK015-Whistler:Quark fi

O
Oil industry, see Anadarko Petroleum;Apache Oil
On-balance volume (OBV), 36, 37Options:
basics of trading, 195–200volatility and, 207–210
Order flow, 116“Outside” days, see Engulfing patternsOvertrading, 113
P
Pairs trading, see also Intraday pairs;Trading diary
author’s advice on, 226–231, 237–238explained, 2–3news events and, 110–113terminology of, 41–45work/attention required for, 109–110,
114–115PEG ratio, 15, 17–19Percentage loss stops, 106–107Price-to-earnings (PE) ratio:
applied to pairs, 216–219calculating, 15–17forward PE, 133–134
Price-to-sales ratio, 219–220Put options, 195–200
pairs and, 208–210
Q
QQQ, 189Qualcomm, 219–220
R
Ratio, 42–44, 88strategy discussed in Apache/Anadarko
analysis, 182–183Relative strength index, 36, 38–39Research, see Fundamental analysisReverre, Stephane, 99Risk, defined, 65–66. See also Money
management
S
S&P 500, beta and, 65–66Shooting stars, 25–26, 27Simple moving average (SMA), 30–32
applied to pairs, 213used in Apache/Anadarko analysis,
146–147, 171, 177–178, 180–181
Slippage, 257–258SmartMoney.com, 217Spread, 3, 42–44Spreadsheet, see Excel spreadsheetStandard deviation, 52–53, 72–73
in Excel spreadsheet, 75–80normalized, 99–100stock volatility and, 204used in Apache/Anadarko analysis,
148, 152–153Statistical arbitrage, defined, 2. See also
Pairs tradingStatistical stops, 108Statistics:
of Anadarko Petroleum, 141analyzing/charting in Excel, 75–86,
95–96of Apache Oil, 137defined, 69density curve and, 89–93, 95–96frequency distribution, 69–70mean deviation, 71mean/median/mode, 71risks of using, 103–104standard deviation, 72–73variance, 71–72
Stochastics, 33–35, 213–214Stop loss points, 106–108
moving averages and trend lines,225–227
used in Apache/Anadarko analysis, 144, 149–150, 161–162
Straddle, 200Support and resistance, 28, 29, 225–227Swing trading, 4
T
Technical analysis, 21–23of Anadarko Petroleum, 140–141,
145–147of Apache Oil, 135–136, 145–147applied to pairs, 212–216candlestick charting, 23–28Chaikin Money Flow Oscillator,
35–36of KBH Homes and Toll Brothers,
220–225moving averages, 30–32on–balance volume, 36, 37relative strength index, 36, 38–39stochastics, 33–35
Index 271
Whistler Index [269-272].qxd 6/10/04 7:43 PM Page 271 Virender Negi Quark07:BOOKS:GK015-Whistler:Quark fi

272 INDEX I
Technical analysis, (Continued)
support and resistance, 28, 29
trend lines, 28–30Technical stops, 107–108Time, in correlation coefficient
calculation, 56–57Toll Brothers, 220–225Topology.com, 59Trading diary, Apache
Oil/Anadarko Petroleum, 119–131,143–185
Trailing PE, 16Trend lines, 28–30,
225–227
V
Variance, 52–54, 71–72Volatility, see also Beta
CBOE Volatility Index, 258defined, 201individual stocks and, 204options and, 207–210in sample spreadsheet, 201–203weighted volatility, 205–206
Volume, 214–216
Y
Yahoo.com:exporting data into Excel, 47–50using for earnings reports, 12–14
Whistler Index [269-272].qxd 6/10/04 7:43 PM Page 272 Virender Negi Quark07:BOOKS:GK015-Whistler:Quark fi
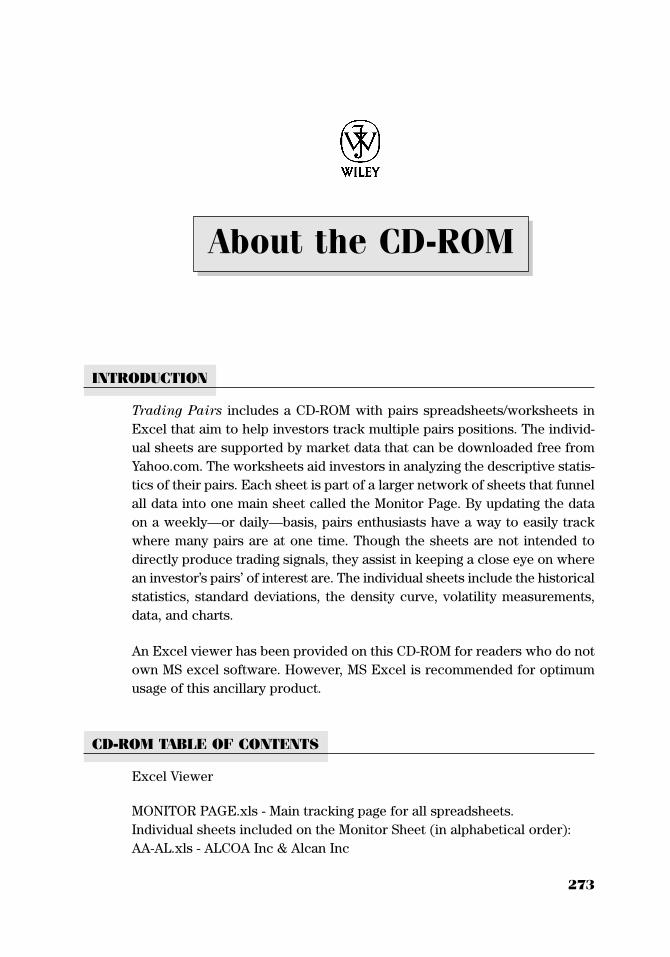
273
INTRODUCTION
Trading Pairs includes a CD-ROM with pairs spreadsheets/worksheets inExcel that aim to help investors track multiple pairs positions. The individ-ual sheets are supported by market data that can be downloaded free fromYahoo.com. The worksheets aid investors in analyzing the descriptive statis-tics of their pairs. Each sheet is part of a larger network of sheets that funnelall data into one main sheet called the Monitor Page. By updating the dataon a weekly—or daily—basis, pairs enthusiasts have a way to easily trackwhere many pairs are at one time. Though the sheets are not intended todirectly produce trading signals, they assist in keeping a close eye on wherean investor’s pairs’ of interest are. The individual sheets include the historicalstatistics, standard deviations, the density curve, volatility measurements,data, and charts.
An Excel viewer has been provided on this CD-ROM for readers who do notown MS excel software. However, MS Excel is recommended for optimumusage of this ancillary product.
CD-ROM TABLE OF CONTENTS
Excel Viewer
MONITOR PAGE.xls - Main tracking page for all spreadsheets.Individual sheets included on the Monitor Sheet (in alphabetical order):AA-AL.xls - ALCOA Inc & Alcan Inc
About the CD-ROM
GK015-C35[273-287].qxd 6/10/04 7:42 PM Page 273 Virender Negi Quark07:BOOKS:GK015-Whistler:Quark files:
ABGX-PDLI.xls - Abgenix, Inc & Protein Design Labs Inc
ABX-NEM.xls - Barrick Gold Corp & Placer Dome Inc
AEM-PDG.xls - Placer Dome Inc & Agnico-Eagle Mines Ltd
ALTR-LSCC.xls - Altera Corp & Lattice Semiconductor Corp
AMAT-MU.xls - Applied Materials Inc & Micron Technology Inc
AMAT-TER.xls - Applied Materials Inc & Teradyne Inc
AMGN-CHIR.xls - Amgen Inc & Chiron Corp
APA-APC.xls - Apache Corp & Stone Energy Corp
APA-EOG.xls - Apache Corp & EOG Resources Inc
APA-MUR.xls - Apache Corp & Murphy Oil Corp
APA-NBL.xls - Apache Corp & Noble Energy Inc
APA-SGY.xls - Apache Corp & Stone Energy Corp
APD-PX.xls - Air Products and Chemicals Inc & Praxair Inc
ATK-LLL.xls - Alliant Techsystems Inc & L-3 Communications Holdings, Inc
AU-PDG.xls - AngloGold Ltd & Placer Dome Inc
BBY-CC.xls - Best Buy Co Inc & Circuit City Stores Inc
BNI-CSX.xls - Burlington Northern Santa Fe Corp & CSX Corp
BNI-UNP.xls - Burlington Northern Santa Fe Corp & Union Pacific Corp
BP-CVX.xls - BP PLC & ChevronTexaco Corp
COST-WMT.xls - Costco Wholesale Corp & Wal-Mart Stores Inc
CTX-TOL.xls - Centex Corp & Toll Brothers Inc
CMI-CAT.xls - Cummins Inc & Caterpillar Inc
DD-PPG.xls - E.I. Du Pont De Nemours & Co & PPG Industries Inc
DF-KFT.xls - Dean Foods Co & Kraft Foods Inc
DIA-SPY.xls - DIAMONDS Trust, Series 1 & S&P SPDRs
ELN-ICOS.xls - Elan Corp PLC & Icos Corp
EMN-PPG.xls - Eastman Chemical Co & PPG Industries Inc
EOG-APA.xls - EOG Resources Inc & Apache Corp
EOG-BR.xls - EOG Resources Inc & Burlington Resources Inc
EOG-NBL.xls - EOG Resources Inc & Noble Energy Inc
FCS-LSCC.xls - Fairchild Semiconductor Corp & Lattice Semiconductor Corp
274 TRADING PAIRS
GK015-C35[273-287].qxd 6/10/04 7:42 PM Page 274 Virender Negi Quark07:BOOKS:GK015-Whistler:Quark files:

HD-KSS.xls - Home Depot Inc & Kohl’s Corp
HD-LOW.xls - Home Depot Inc & Lowe’s Cos Inc
HLYW-MOVI.xls - Hollywood Entertainment Corp & Movie Gallery Inc
INTC-LSCC.xls - Intel Corp & Lattice Semiconductor Corp
IP-BCC.xls - International Paper Co & Boise Cascade Corp
IR-PH.xls - Ingersoll-Rand Co Ltd & Parker Hannifin Corp
JBHT-HTLD.xls - JB Hunt Transport Services Inc & Heartland Express Inc
KBH-LEN.xls - KB Home & Lennar Corp
KBH-RYL.xls - KB Home & Ryland Group Inc
KLAC-NVLS.xls - KLA Tencor Corp & Novellus Systems Inc
KMX-SAH.xls - Carmax Inc & Sonic Automotive Inc
KSS-LOW.xls - Kohl’s Corp & Lowe’s Cos Inc
LEH-GS.xls - Lehman Brothers Holdings Inc & The Goldman Sachs Group Inc
LLTC-LSCC.xls - Linear Technology Corp & Lattice Semiconductor Corp
LLTC-MXIM.xls - Linear Technology Corp & Maxim Integrated Products Inc
LLTC-QLGC.xls - Linear Technology Corp & QLogic Corp
LMT-BA.xls - Lockheed Martin Corp & The Boeing Co
LMT-LLL.xls - Lockheed Martin Corp & L-3 Communications Holdings, Inc
MEDX-PDLI.xls - Medarex Inc & Protein Design Labs Inc
MER-GS.xls - MERRILL LYNCH & The Goldman Sachs Group Inc
MER-MWD.xls - MERRILL LYNCH & MORGAN STANLEY
MERQ-BEAS.xls - Mercury Interactive Corp & BEA Systems Inc
MERQ-VRTS.xls - Mercury Interactive Corp & Veritas Software Corp
MLNM-HGSI.xls - Millennium Pharmaceuticals Inc & Human Genome
Sciences Inc
MLNM-MEDX.xls - Millennium Pharmaceuticals Inc & Medarex Inc
MLNM-PDLI.xls - Millennium Pharmaceuticals Inc & Protein Design Labs Inc
MO-RJR.xls - Altria Group Inc & R.J. Reynolds Tobacco Holdings Inc
MWD-GS.xls - MORGAN STANLEY & The Goldman Sachs Group Inc
MYG-WHR.xls - Maytag Corp & Whirlpool Corp
NEM-AEM.xls - Newmont Mining Corp & Agnico-Eagle Mines Ltd
About the CD-ROM 275
GK015-C35[273-287].qxd 6/10/04 7:42 PM Page 275 Virender Negi Quark07:BOOKS:GK015-Whistler:Quark files:
NEM-AU.xls - Newmont Mining Corp & AngloGold Ltd
NEM-PDG.xls - Newmont Mining Corp & Placer Dome Inc
PHM-TOL.xls - Pulte Homes & Toll Brothers Inc
PNC-KEY.xls - The PNC Financial Services Group & Keycorp
PNC-MEL.xls - The PNC Financial Services Group & Mellon Financial
Corp
RCL-CCL.xls - Royal Caribbean Cruises Ltd ASA & Carnival Corp
RD-SC.xls - Royal Dutch Petroleum Co & Shell Transport & Trading Co PLC
RYL-LEN.xls - Ryland Group Inc & Lennar Corp
SGY-APC.xls - Stone Energy Corp & Anadarko Petroleum Corp
SMH-NVLS.xls - Semiconductor Holders Trust & Novellus Systems Inc
SPC-XL.xls - St. Paul Companies Inc & XL Capital Ltd
SSP-GCI.xls - EW Scripps Co & Gannett Co Inc
TER-MU.xls - Teradyne Inc & Micron Technology Inc
TGT-WMT.xls - Target Corp & Wal-Mart Stores Inc
TOL-KBH.xls - Toll Brothers Inc & KB Home
TQNT-NVLS.xls - Triquint Semiconductor Inc & Novellus Systems Inc
WERN-YELL.xls - Werner Enterprises Inc & Yellow Roadway Corporation
XOM-CVX.xls - Exxon Mobil Corp & ChevronTexaco Corp
All sheets represented as APA-APC 00.00.00.xls correspond with a date
referenced in Chapter 22, Trading Diary.
Example_pairs_sheet1.xls—Sample spreadsheet referenced in Chapter 12
Example_pairs_sheet2.xls—Additional sample spreadsheet to assist
readers in building their own sheets
General Electric-Exxon Mobil.xls—Spreadsheet referenced in Chapter 23
DIA-Exxon Mobil.xls—Spreadsheet referenced in Chapter 23
DIA-GE.xls—Spreadsheet referenced in Chapter 23
MINIMUM SYSTEM REQUIREMENTS
Make sure that your computer meets the minimum system requirementslisted in this section. If your computer doesn’t match up to most of theserequirements, you may have a problem using the contents of the CD.
276 TRADING PAIRS
GK015-C35[273-287].qxd 6/10/04 7:42 PM Page 276 Virender Negi Quark07:BOOKS:GK015-Whistler:Quark files:

For Windows 98, or above:
• PC with a Pentium processor running at 120 Mhz or faster• At least 32 MB of total RAM installed on your computer; for best per-
formance, we recommend at least 64 MB • A CD-ROM drive• Microsoft Excel
For Macintosh:
• Mac OS computer with a 68040 or faster processor running OS 7.6 or later• At least 32 MB of total RAM installed on your computer; for best per-
formance, we recommend at least 64 MB• A CD-ROM drive• Microsoft Excel. (An Excel viewer has been provided on this CD-ROM
for readers who do not own MS excel software. However, MS Excel isrecommended for optimum usage of this ancillary product.)
USING THE CD WITH WINDOWS
To install the items from the CD to your hard drive, follow these steps:
1. Insert the CD into your computer’s CD-ROM drive.
2. A window appears with the following options: Install, Explore, Links,and Exit.
Install: Gives you the option to install the supplied software and/orthe author-created samples on the CD-ROM.Explore: Enables you to view the contents of the CD-ROM in its direc-tory structure.Exit: Closes the autorun window.
If you do not have autorun enabled, or if the autorun window does notappear, follow these steps to access the CD:
1. Click Start @> Run.
2. In the dialog box that appears, type d:\setup.exe, where d is the letterof your CD-ROM drive. This brings up the autorun window describedin the preceding set of steps.
3. Choose the Install, Explore, or Exit option from the menu. (See Step 2in the preceding list for a description of these options.)
About the CD-ROM 277
GK015-C35[273-287].qxd 6/10/04 7:42 PM Page 277 Virender Negi Quark07:BOOKS:GK015-Whistler:Quark files:
USING THE CD WITH THE MAC OS
To install the items from the CD to your hard drive, follow these steps:
1. Insert the CD into your CD-ROM drive.
2. Double-click the icon for the CD after it appears on the desktop.
3. Most programs come with installers; for those, simply open theprogram’s folder on the CD and double-click the Install or Installericon. Note: To install some programs, just drag the program’s folderfrom the CD window and drop it on your hard drive icon.
TROUBLESHOOTING
If you have difficulty installing or using any of the materials on the compan-ion CD, try the following solutions:
• Turn off any antivirus software that you may have running.
Installers sometimes mimic virus activity and can make your computerincorrectly believe that it is being infected by a virus. (Be sure to turn theantivirus software back on later.)
• Close all running programs. The more programs you’re running, theless memory is available to other programs. Installers also typicallyupdate files and programs; if you keep other programs running, installa-tion may not work properly.
• Reference the ReadMe: Please refer to the ReadMe file located at theroot of the CD-ROM for the latest product information at the time ofpublication.
If you still have trouble with the CD-ROM, please call the Wiley ProductTechnical Support phone number: (800) 762-2974. Outside the United States,call 1(317) 572-3994. You can also contact Wiley Product Technical Supportat www.wiley.com/techsupport. Wiley Publishing will provide technical sup-port only for installation and other general quality control items; for techni-cal support on the applications themselves, consult the program’s vendor orauthor.
To place additional orders or to request information about other Wileyproducts, please call (800) 225-5945.
278 TRADING PAIRS
GK015-C35[273-287].qxd 6/10/04 7:42 PM Page 278 Virender Negi Quark07:BOOKS:GK015-Whistler:Quark files:
USING THE SOFTWARE
Each file is a tracking Excel spreadsheet that can be used to better under-stand pairs trading. By updating the data on a weekly—or daily—basis, pairsenthusiasts have a way to easily track where many pairs are at one time.
USER ASSISTANCE
About the CD-ROM 279
If you have questions about the software, please contact John Wileyand Sons.If you need assistance or have a damaged disk, please contact WileyTechnical Support at:Phone: (201) 748-6753Fax: (201) 748-6800 (Attention: Wiley Technical Support)Email: http://www.wiley.com/techsupportTo place additional orders or to request information about Wiley prod-ucts, please call (800) 225-5945.
GK015-C35[273-287].qxd 6/10/04 7:42 PM Page 279 Virender Negi Quark07:BOOKS:GK015-Whistler:Quark files:


![Pairs Trading, Convergence Trading, Cointegration - Freedocs.finance.free.fr/DOCS/Yats/cointegration-en[1].pdf · Pairs Trading, Convergence Trading, Cointegration ... ”Trying to](https://img.pdfslide.us/doc/110x75/5aad9ad77f8b9a9c2e8e8580/pairs-trading-convergence-trading-cointegration-1pdfpairs-trading-convergence.jpg)