Embed Size (px)
Citation preview
1
Tradeoffs in Crop Residue Utilization in Mixed Crop-Livestock Systems and Implications for Conservation Agriculture and Sustainable Land Management
Moti Jaleta a, Menale Kassie b, and Bekele Shiferaw b a International Maize and Wheat Improvement Center (CIMMYT), P.O. Box, 5689, Addis Ababa,
Ethiopia. [email protected]
b CIMMYT, P.O. Box 1041-00621, Nairobi, Kenya. [email protected] ; [email protected]
Selected paper prepared for presentation at the International Association of Agricultural Economists (IAAE) Triennial Conference, Foz do Iguacu, Brazil, 18-24 August, 2012.
Copyright 2012 by [authors]. All rights are reserved. Readers may make verbatim copies of this document for non-commercial purposes by any means, provided that this copyright notice appears on all such copies.
1
Tradeoffs in Crop Residue Utilization in Mixed Crop-Livestock Systems and Implications for Conservation Agriculture and Sustainable Land Management
Abstract
Crop residue use for soil mulch and animal feed are the two major competing purposes and the basic
source of fundamental challenge in conservation agriculture (CA) where residue retention on farm plots is
one of the three CA principles. Using survey data from Kenya and applying bivariate ordered Probit and
bivariate Tobit models, this paper analyzes the tradeoffs in maize residue use as soil mulch and livestock
feed in mixed farming systems. Results show that both the proportion and quantity of maize residue used
for soil mulch and livestock feed are strongly affected by agroecology and livestock holding. Farmer
knowledge about alternative use of crop residues and farmer perception of soil erosion risk (proxied
through plot steepness) positively affect the amount of residue farmers retain on maize plots. Results
imply that crop residue use as soil mulch in conservation agriculture is challenged in mixed crop-
livestock systems and particularly by smallholder farmers owning cross-bred and exotic dairy animals. In
general, reducing the demand for crop residues as livestock feed through the introduction of alternative
feed sources, better extension services on the use of crop residue as soil mulch and designing agroecology
specific strategies and interventions could facilitate the adoption and expansion of CA-based practices in
mixed crop-livestock systems.
Keywords: Maize residue, Mixed farming system, Conservation agriculture, Bivariate model, Kenya.
2
1. Introduction
Mixed crop-livestock systems in the developing countries support two-third of the world
population and produce about half of the world food (Herrero et al., 2010). Yet, these systems
are under a significant pressure caused by the rising demand of human population, increased
income, and rates of urbanization (Delgado et al., 1999; Herrero et al., 2009). To cope up with
this pressure and attain the increasing demand for food, feed and energy at no or minimum
damage to natural resources, adopting and adapting more resilient, intensified and sustainable
agricultural production systems is indispensable (Hobbs, 2007; Gowing and Palmer, 2008;
Kassam et al., 2010; McDermott et al., 2010).
In this regard, conservation agriculture1 (CA) could be seen as a potential option that could help
in maintaining and improving crop yield, attaining more resilient farming systems with reduced
risks and hazards, while protecting and stimulating the biological function of the soil (Hobbs,
2007; FAO, 2008). Although CA was introduced to some of the Sub-Sahara African countries a
couple of decades ago, its adoption in smallholder agriculture in the region as a whole package
has been low (Ekboir et al., 2002; Pascal and Josef, 2007). Moreover, whether CA fits to most
farming systems in Sub-Saharan Africa and especially in mixed crop-livestock systems is still
debated (Gowing and Palmer, 2008; Giller et al., 2009; 2011). The debate mainly arises from the
potential tradeoffs in the allocation of resources (Giller et al., 2011) and the socioeconomic
setups influencing resource use in the mixed crop-livestock systems (Umar et al., 2011).
1As defined in FAO (2008), conservation agriculture (CA) is a concept for resource-efficient agricultural crop
production based on an integrated management of soil, water and biological resources combined with external inputs
and achieved through its three principles (minimum or no mechanical soil disturbance, permanent organic soil cover,
and diversified crop rotations) that enhance biological processes above and below the ground.

3
In mixed crop-livestock systems, use of crop residues as livestock feed is one of the major
interactions between crop and livestock production2 (McIntire and Gryseels, 1987; Latham,
1997; Erenstein and Thorpe, 2010; Moritz, 2010). At the same time, crop residue use as livestock
feed exerts a competitive pressure on residue use as soil mulch, which is one of the three
principles of conservation agriculture.
Maize is the main crop grown in Eastern and Southern Africa where Kenya is one of the major
producers. Maize provides grain for food and stover or residue which is widely used for feeding
livestock during the dry season. Eastern and western parts of Kenya are known for their maize-
based mixed crop-livestock system but, to some extent, have different levels of interactions and
intensifications in crop and livestock production that could enable to examine and compare the
tradeoffs in crop residue use and its implications for conservation agriculture.
Though there is a wide literature on crop residue use and the potential tradeoffs in its use as feed
and soil mulch, there is a dearth of information explaining the implications of crop residue use
tradeoffs on conservation agriculture and sustainable land management. The main objective of
this paper is, therefore, to assess the tradeoffs in maize residue use as feed and soil mulch in
eastern and western Kenya, and examine the determinants of crop residue use for feeding
livestock and soil fertility management and implication for the expansion of conservation
agricultural practices in maize-based systems.
The paper is organized as follows. Section 2 presents conceptual framework of the study. Section
3 describes the study area and data. Section 4 presents methodologies used in data analysis.
2 In addition to crop residue, manure use as soil fertility management, draft power in land preparation and cultivation
practices, and financing the purchase of inputs in crop production through livestock sale are other major sources of
interactions between crop and livestock subsystems (Erenstein and Thorpe, 2010).
4
Section 5 discusses analysis results and, based on the empirical findings, section 6 draws major
conclusions and implications.
2. Conceptual Framework
Retaining permanent organic soil cover, as one of the three pillars in conservation agriculture, is
strongly recommended in reducing surface run-offs, improving rain water infiltration,
suppressing and controlling weed growth, etc. (Hobbs, 2007; FAO, 2008; Giller et al., 2009). In
conservation agriculture, 30% organic soil cover is set as a minimum requirement based on
studies showing a 30% organic soil cover could reduce soil erosion by 80% (Erenstein, 2002;
2003; Giller et al., 2009; Mazvimavi and Twomlow, 2009). After harvest, soil could be covered
by growing forage legumes, green manure cover crops, or other food or feed crops. But, when
farmers lack these options or such practices are less common, use of crop residue from previous
harvest as soil mulch becomes essential. However, in a mixed crop livestock system, crop
residue has several other purposes among which its use as livestock feed exerts a substantial
challenge on residue use as organic soil cover. This potential tradeoff in residue use is critical in
areas where farmers experience long dry spell between successive cropping seasons and with no
or limited alternative feed sources. On top of that, households also use crop residue as firewood,
construction of fences, storage, or other structures, and as a source of income through sale. Some
households may also burn crop residue on plots with the aim of making land preparation/tillage
easy and reducing the population of pests, insects, and rodents (Erenstein, 2003).
In areas where there is more than one cropping season, the length and nature of off-periods
between two successive cropping seasons are usually not the same and could affect farmers’
decisions in the proportion of crop residue allocated to different purposes. Under such
5
circumstances, analyzing households’ crop residue use by season is relevant. At a household
level, the size and type of livestock holding could influence the quantity of crop residue
demanded for feed. On the other hand, the amount of crop residue retained on farm plots as soil
mulch is subject to plot characteristics which include soil depth, soil fertility, slope and distance
from homestead. Plots with fertile and deep soils usually produce more biomass that could
increase the volume of residue produced and made available to be used as feed and/or soil
mulch. Households could use crop residue as soil mulch to reduce the intensity of run-off and
increase rainfall infiltration into the soil particularly in plots with steep slopes (Thierfelder and
Wall, 2009). Compared to plots closer to homestead, collection of crop residue from distant plots
for livestock feed and other purposes could be laborious. This may contribute towards retaining
more crop residue as soil mulch on distant plots and extracting residue from nearby plots for feed
and other purposes.
Agroecology influences the diversity and biomass of crop production. Moreover, human and
livestock population density, availability of feed and grazing land, etc. are agroecology specific.
Thus, households in different agroecologies could use available crop residue resources in a
unique pattern. In addition, available institutional services like extension and training on
livestock production and management, agronomic practices that could include best way of using
crop residue, etc. could influence farmers’ behavior in residue use. Households tend to make use
of rented-in lands in a more productive way that could maximize their overall benefits.
Particularly when the lease contract is for a short period, there could be a possibility of soil
mining and low interest in maintaining soil fertility through crop residue management or other
options. Thus, one could expect lower rate of crop residue retention on rented-in lands than own
plots.

6
3. Description of Study Sites and Data
3.1. Study sites
The study was conducted in five districts purposively selected from the eastern and western parts
of Kenya, namely: Embu, Meru South and Imenti South from the Eastern Province, and
Bungoma and Siaya from the Western and Nyanza Provinces, respectively. These districts are
where the International Maize and Wheat Improvement Center (CIMMYT), The World
Agroforestry Center (ICRAF) and Kenyan Agricultural Research Institute (KARI) are
collaborating and conducting conservation agriculture based on-farm trials in selected villages
and households. In addition, these districts are known for their large proportion of maize
production but have a contrasting agroecology and farming systems that could help to make a
comparison on the crop residue use and its implications on the adoption and adaptation of
conservation agriculture practices. In the Eastern Province, the agroecology is more of semi-
humid mid-lowland with relatively lower rainfall. The province is densely populated and farmers
practice intensive farming. However, districts in the western part (Bungoma and Siaya) are
mainly in a mid-highland agroecology with better rainfall where population density is relatively
low and extensive farming is more common.
3.2. Data
Data used in this analysis was collected from 613 sample households in five districts mentioned
above. The survey was conducted during January and February 2011 using a structured survey
instrument and administered as a personal interview by experienced and trained enumerators.
The data collection process was closely monitored and supervised by KARI-Embu, KARI-
Kakamega, and CIMMYT staffs in the field. Within each district, divisions and villages were
randomly selected from which the sample households were randomly selected proportionately to

7
the total farm households. Table 1 presents the distribution of sample households by District and
gender of the household head.
< TABLE 1 HERE >
The survey data in table 2 shows that maize is an important crop in the selected study areas.
During the 2010 production year, from the total 613 sample households, 583 and 452 of them
produced maize during season 1 and 2, respectively.3 About 74% of the households producing
maize in season 1 are also maize producers in season 2. On average, maize covers above 67% of
the total cultivated land per household in both seasons. More than 97% of the households
producing maize in 2010 used maize residue at least for one of the alternative purposes:
firewood, soil mulch, animal feed, construction, sale, or burn on-situ. Majority of the households
(about 54 and 57% of the households in season 1 and 2, respectively) used maize residue for a
single purpose. During both seasons, about 33-35% of the sample households used maize residue
both as feed and soil mulch, 59-61% used either as feed or soil mulch, and only about 5% of the
households used neither as feed nor as soil mulch.
< TABLE 2 HERE>
Looking at the proportion of maize residue used for feed and soil mulch in table 3, larger number
of households used maize residue for livestock feed. Of the total 580 households reported their
maize residue use in the first season, 253 households (i.e., 43.6%) used more than 66% of their
3 There are two cropping seasons both in the eastern and western parts of Kenya. Season 1, as referred throughout
this paper starts in March/April and goes till June/July whereas season 2 starts in August/September and ends in
November. In the cycle of cropping seasons, relatively, there is a short duration between season 1 and 2 than
between season 2 and 1.

8
maize residue as feed. For the same season, only 22.9% of the households retained more than
66% of maize residue on plots as mulch. In season 2, about 48.2% of the households who
reported the proportion of their maize residue use indicated that more than 66% of their maize
residue production was allocated to livestock feed. In the same season, the proportion of
households who retained more than 66% of their maize residue is only 20.3%. This clearly
shows to what extent the use of maize residue for livestock feed is dominating the alternative use
for soil mulch.
< TABLE 3 HERE>
The sample household heads have an average age of 50.3 years and 7 years of schooling. About
19% of the sample households are female headed and the average family size is 5.7 per
household. On average, sample households are about 6 km far from main markets. Majority of
the households (84%) own livestock (ruminants) that could be fed on crop residue. On average,
each household has 1.5 TLU (Tropical Livestock Unit) of cattle and 2 small ruminants (sheep or
goat). About 29% and 39% of the households got extension and training services on livestock
production and crop residue use as soil mulch, respectively. Details of household characteristics
across the five districts are presented in table 4 below.
< TABLE 4 HERE>
4. Empirical models
In this section, first, a bivariate ordered Probit model for the proportion of crop residue use as
feed and mulch classified in three categories is presented. Then, a bivariate Tobit model is
9
specified to estimate the quantity of maize residue use as livestock feed and soil mulch jointly.
Explanatory variables used in the specifications and hypotheses to be tested are discussed briefly.
4.1. Proportion of maize residue use: Bivariate Ordered Probit Model
On whatever quantity of maize residue households produce, analyzing the proportion used for
alternative purposes could help in identifying the importance of each specific purpose in
household’s maize residue use. The data shows maize residue use as feed and soil mulch
constitute more than 83% of the total maize residue use in both seasons of the 2010 production
year, Accordingly, throughout the analyses, we considered only these two important and
competing purposes of maize residue use. Looking at the distribution of the proportion of maize
residue use reported by the sample households, which is mainly concentrated at 0%, 50%, and
100%, and the 30% minimum organic soil cover requirement in conservation agriculture to
reduce runoff by 80% (Erenstein, 2002; 2003; Giller et al., 2009; Mazvimavi and Twomlow,
2009), we grouped the proportionate residue use in three categories (0 if below 34% is used for
the specific purpose, 1 if the percentage use is between 34 and 66%, both inclusive, and 2 if the
percentage use is >66%). This gives ordinal discrete values (0, 1, 2) that can be estimated using
ordered Probit model (Verbeek, 2004). However, the proportion of maize residue used either as
feed or soil mulch is not independent to each other. For a specific season, both residue use for
feed and soil mulch purposes are satisfied from the same residue harvest. Therefore, in
estimating the likelihood of using more proportion of maize residue as feed or mulch, we opted
for a bivariate ordered Probit model that accounts both for the ordinal nature of the categories
and the potential interdependence between the two alternative uses (feed and mulch).
Following Sajaia (2008), the bivariate ordered Probit model is specified as:
10
������ ������ � ��� �� � ������ ����������� � ���������� where, ��������� �� , and � ������ ��� ��������! (1)
Where ����� and ����� are the latent proportion of maize residue used as livestock feed and soil
mulch, respectively. � and � are parameters to be estimated, �� and �� are vector of
explanatory variables in feed and soil mulch equations , respectively. � is error term assumed to
follow a bivariate standard normal distribution. The actual proportion of maize residue used as
feed (����) and soil mulch (����) reported by farmers and grouped in three categories (0, 1, and 2)
is specified as:
���� "����������������������#$��������� % &��'���������#$����&��' ( ����� % &��)*�������������������#$���������� + &��) , and ���� "�������������������#$���������� % &��'�����#$�����&��' ( ����� % &��)*�������������������#$���������� + &��)
, (2)
Where &��' , &��) , &��' and &��) are unknown boundaries/cutting points of the categories in the
latent variables.
Generally, the probability that a given household falls in one of the possible combinations (say
category - in feed and . in mulch) is given as:
/01���� -2����� .3 /01&��45' ( ����� % &��4��� ���&��65' ( ����� % &��63� =�/01����� % &��4����� ����� % &��63 - /01����� % &��45'����������� %�&��6'3 - /01����� % &��4����������� % &��65'3 +�/01����� % &��45'��� ����� % &��65'3 (3)

11
4.2. Quantity of maize residue use: Bivariate Tobit Model
There could be households with the same proportion of maize residue used as feed and soil
mulch but differ when we look at the quantity allocated to these purposes. For any quantity of
maize residue produced, which was estimated from maize grain production using a harvest index
of 0.5 (Hay and Gilbert, 2001), the proportion used in one purpose affects proportion left for the
other. However, a household could increase the quantity of residue used for both purposes by
increasing the volume of crop residue production. Thus, analysis on the quantity of maize residue
used for soil mulch and feed is important to examine the overall demand for maize residue as
feed and mulch. As indicated above in the descriptive statistics, there are households who did not
use maize residue as feed and/or soil mulch. Thus, the quantity of residue used as feed and mulch
are censored at lower level. The censored nature of residue use data for alternative purposes
necessitates the use of Tobit model. Moreover, there is a joint decision between the two major
alternative residue uses (feed and mulch) where the proportion or volume used in one purpose
depends on the other. Under such circumstances, separate Tobit estimation for each alternative
purpose may not result in a robust estimation. Assuming 7���� and 7���� are, respectively, the latent
quantities of maize residue allocated as feed ($) and mulch (8) by household #, a bivariate Tobit
model is specified as:
97���� ����� � ��������7���� ����� � ��� , where :�; <������ � � � �)��������� � � ������� �) �����= (4a)
and
7��� >7���� + ������������������?@AB0C#DB , and 7��� >7���� + ������������������?@AB0C#DB , (4b)

12
Where 7��� and 7��� are the actual quantity of maize residue used as livestock feed and soil
mulch, respectively. �� and �� are vectors of explanatory variables used in the feed and mulch
equations. Details of the explanatory variables used in each equation are discussed in the
subsequent section. If the covariance between the two specifications ( �� E � �) is equal to
zero, i.e., E �, then, the two Tobit equations could be estimated separately as a univariate
Tobit. In addition, it is worth noting that plot characteristics are included in the soil mulch
equation but not in the livestock feed equation. This is due to the fact that plot characteristics
have more direct effect on household decisions in crop residue retention as soil mulch than using
it as livestock feed. Thus, the set of explanatory variables in both equations are not exactly the
same, which could help to solve the identification problem in a joint estimation.
4.3. Explanatory variables
In the equation on maize residue use for livestock feed, the following set of explanatory variables
are included: household characteristics (age, gender, and education of the household head, active
agricultural labor force in the family), livestock types owned (indigenous cow, cross-bred cow,
exotic cow, trained oxen, bulls, heifers, calves, small ruminants), extension and/or training
service received on livestock production, maize plot size used in a specific season, proportion of
own maize plots from the total maize plots used in a specific season, weighted distance to maize
plots from homestead, number of mature trees in maize plots, total quantity of maize residue
produced in a specific season, and district dummies.
On the other hand, most explanatory variables used in the feed equation are included in the soil
mulch equation. In the later, owned livestock types are aggregated as cattle and small ruminants.
Moreover, instead of extension on livestock production, we used extension and/or training
service received on retaining crop residue. On top of these adjustments, plot characteristics
13
aggregated at a household level and only for those producing maize in a specific season are also
included. The plot characteristics considered here include: intensity of manure used on maize
plots during the specific season, weighted average level of soil fertility (1=poor, 2=medium,
3=good), weighted average soil depth (1=shallow, 2=medium, 3=deep), and weighted average
slope of maize plots (1=flat, 2=gentle slope, 3=steep slope). These plot characteristics were
weighted by the respective plot area under maize production in a specific season.
4.4. Hypotheses to be tested
Based on the above econometric specifications; the following selected hypotheses are tested.
Size and type of livestock owned: generally, ownership of larger number of livestock is expected
to increase the demand for crop residue as feed. Moreover, the demand for crop residue as feed
potentially depends on the livestock type households keep (Erenstein and Thorpe, 2010). Feed
requirement of exotic breeds are higher than indigenous ones. Thus, households owning large
number of exotic breed are expected to use more proportion and quantity of maize residue as
animal feed. Similarly, small ruminants could positively affect the demand for residue as feed
but at a lower extent compared to cattle.
Soil fertility and depth: Households growing maize on relatively fertile and deep soil are
expected to produce larger maize biomass and be able to satisfy both soil mulching and livestock
feed, which are the two purposes maize residue is mainly used for. Thus, good soil fertility and
soil depth helps to have more residues both for feed and soil mulch. On the other hand,
households using maize plots with relatively better depth and fertile soil might be less concerned
about soil fertility management, at least in the short term, and could tend to prefer using crop
residue as livestock feed than soil mulch.

14
Soil slope: compared to plots on flat land, steep sloped plots under conventional tillage are more
degraded in soil quality. Thus, households growing maize on steep slopes are expected to retain
more crop residue in fields. However, this could be influenced by other physical structures on the
plots to conserve soil movement and water infiltration, which is not considered in this analysis.
Quantity (biomass) produced: The competition between use of residue as soil mulch and
livestock feed could be severe when the biomass production is low. Unless residue is marketed
for the purpose of livestock feed in the vicinity, there could be a threshold quantity of biomass
production above which the competition between these two alternative uses is no more serious
Thus, increased biomass production is expected to have a positive effect both on the quantity of
residue use as soil mulch and livestock feed.
Extension/training service: Provision of extension or training service to farmers on the use of
crop residue as soil mulch is expected to affect the proportion and quantity of residue they retain
on farm plots (Mazvimavi and Twomlow, 2009).
Agroecology: cropping patterns, population and livestock density, residue use, and availability of
resources potentially differ by agroecology. Comparing humid and semi-arid agroecologies in
the Indo-Gangetic plains, Erenstein (2003) shows that relatively larger proportion of crop residue
is left on plots in humid than semi-arid agroecologies due to the availability of other alternative
sources for feed, construction and firewood in the humid parts. Thus, due to better amount of
rainfall and humid climate in the western part of Kenya, we expect larger proportion of residue
use as soil mulch in Bungoma and Siaya districts.
15
5. Results and Discussions
5.1. Analysis of descriptive results
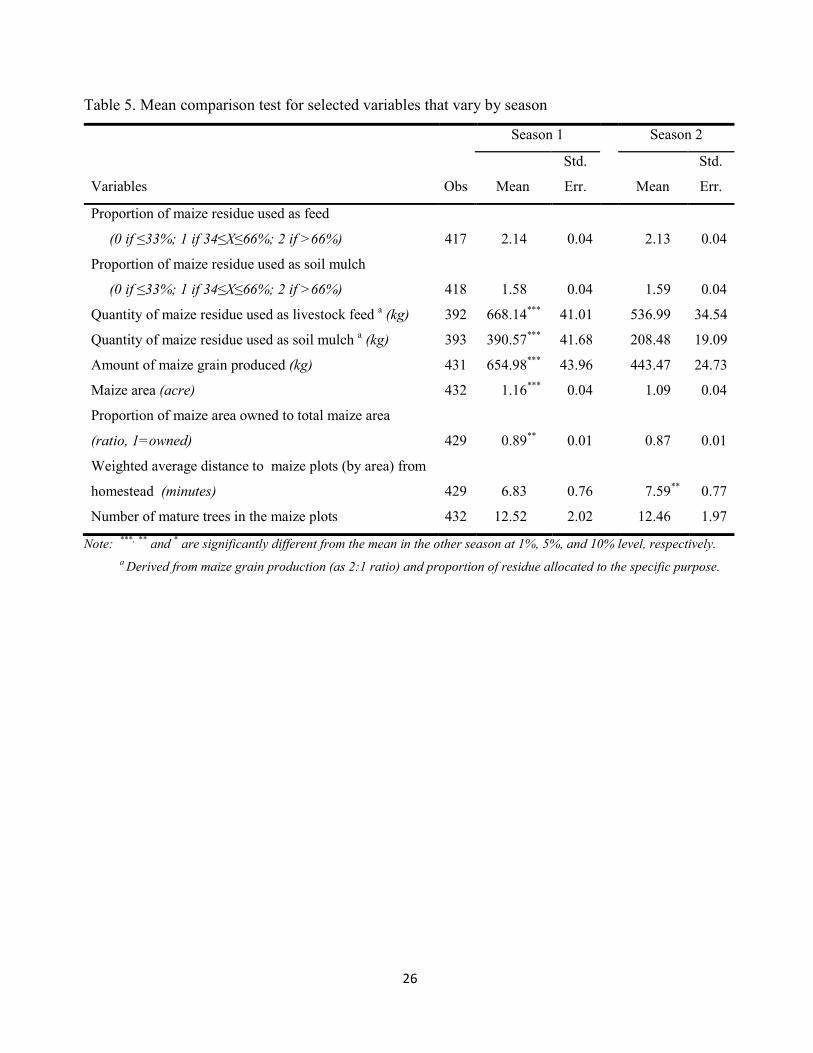
Mean equality test in table 5 shows no significant seasonal difference in the average proportion
of maize residue use as feed and soil mulch. However, the average quantity of maize residue
used as feed and mulch are significantly higher for residue produced in season 1. In addition, in
season 1, households are using relatively far-away plots to grow maize and the total plot size
allocated to maize is larger in the same season. Moreover, compared to season 2, the average
proportion of rented-in plots to the total plot size used to grow maize is lower in season 1.
< TABLE 5 HERE >
5.2. Empirical results
Results from the empirical analysis are presented below in two sub sections. First, joint
estimation results from the bivariate ordered Probit model on the determinants of maize residue
proportions used as feed and mulch are presented. Then, the bivariate Tobit model estimation
results on the determinants of the quantity of maize residue used as feed and soil mulch are
discussed. Both the proportion and quantity analyses are made for the two seasons separately.
5.2.1. Determinants of proportion of residue use as feed and soil mulch
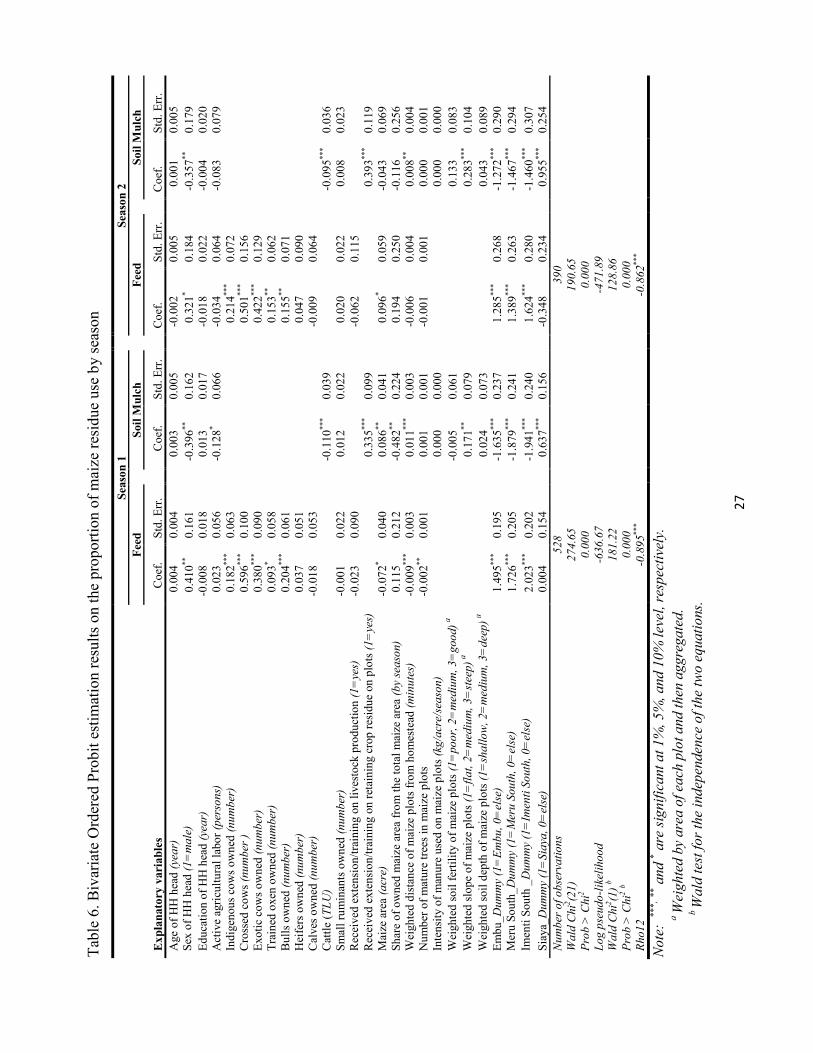
Bivariate ordered Probit estimation on the proportion of maize residue use shows the existence of
regional differences in the use of maize residue both for livestock feed and soil mulch (Table 6).
Compared to Bungoma, the likelihood of using larger proportion of maize residue as livestock
feed is higher for households in Embu, Meru South and Imenti South districts (Eastern
Province). On contrary, compared to Bungoma, the likelihood of leaving larger proportion of
maize residue on plots is as soil mulch is lower for these districts. In the western part, the

16
likelihood of using relatively larger proportion of maize residue as soil mulch is higher in Siaya
than in Bungoma.
The farther the maize plots from homestead, as weighted by plot area, the lower the likelihood of
using larger proportion of maize residue used for feed. Similarly, households growing maize on
larger plots are using less proportion of their maize residue for livestock feed. This could be due
to the increased biomass production from increased maize plot area.
As expected, the proportions of residue use both as feed and soil mulch strongly depends on the
size of livestock owned and particularly the number of dairy cows. The effect on the proportion
of maize residue use for feed is positive and higher for households owning cross-bred and exotic
cows during both cropping seasons. Though not as strong as the exotic breeds, the number of
indigenous cows owned also has a significant effect on the proportion of maize residue use for
feed purpose. Number of bulls owned in season 1 affects the proportion of residue used for feed
positively. More educated households use less proportion of maize residue as livestock feed.
Coming to soil mulch, those households who received extension and/or training services on
retaining crop residue on plots left larger proportion of maize residue during both seasons. The
effect of maize plots size on the proportion of maize residue left on farm is significant only
during season 1. Larger proportion is left on farm by households using larger maize plots in
season 1. Opposite to the proportion of residue use as feed, the farther the maize plots from
homestead, the larger proportion of maize residue left on farm. This might be associated with the
demand for more labor to collect and transport maize residue to a living quarter where usually
animals are fed. The proportion of residue left on plots by households that are growing maize on
a relatively fertile land is negative. As expected, larger proportion of maize residue is retained by
17
households growing maize on relatively steeper slopes, which could reduce the intensity of soil
erosion and increase rain water infiltration.
< TABLE 6 HERE >
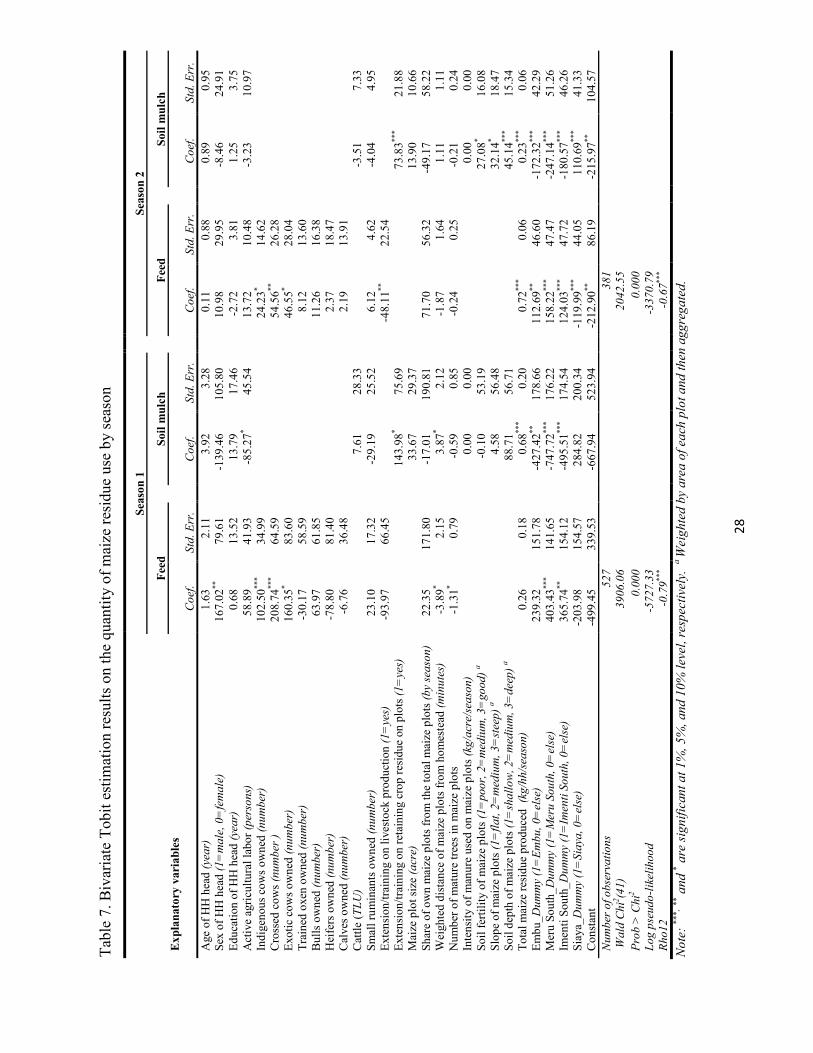
5.2.2. Determinates of maize residue quantity used as feed and mulch
In explaining the variation in the quantity of maize residue used as feed and soil mulch, a
bivariate Tobit model is estimated. Estimation results in table 7 indicate that, during both
seasons, quantity of residue use as feed increases with the number of dairy cows owned. The
effect of indigenous cows is not significant in season 1 but in season 2. Since there is a dry
season between season 2 and season 1 cycle, the number of small ruminants owned also affects
the quantity of residue used as feed positively. Households growing maize on larger plots are
able to retain more quantities of reside on plots during both seasons and also able to provide
larger quantity as feed. This apparently shows how biomass production could help to reduce the
competition between feed and mulch.
Contrary to our expectations, the quantity of maize residue retained as soil mulch decreases with
the proportion of maize plots owned from the total maize plots operated in season 1. The further
the maize plots from homestead, the lower the quantity of residue used as feed. Existence of
large number of mature trees in farm plots also decrease the quantity of residue used as feed.
This could be due to the fact that some of these tree leaves and shoots might be used to feed
livestock and reduce the pressure on maize stover as feed. Further study on this particular issue
seems important as the dataset used in this study tells only the number of trees but not the
specific tree species in the maize plots. Larger quantity of maize residue is retained by
households using relatively fertile plots to grow maize. This could be a result of increased
18
biomass production on fertile plots and the produced biomass exceeds household’s livestock feed
requirement. Moreover, compared to Bungoma, the quantity of maize residue used as mulch is
significantly lower for districts in the Eastern province. On the other hand, compared to the
quantity of residue used as livestock feed in Bungoma, quantity used as feed in Meru South and
Imenti South is higher while it is lower in Siaya district in the West.
< TABLE 7 HERE >
6. Conclusions
Using survey data from eastern and western Kenya, this study assessed the tradeoffs in crop
residue use for livestock feed and soil mulch and its implications for conservation agriculture and
sustainable land management. A bivariate ordered Probit and bivariate Tobit models,
respectively, were used to estimate the effect of farm and household level characteristics on the
proportion and quantity of maize residue used as feed and mulch during different production
seasons.
The results revealed a clear regional difference between the eastern and western provinces of
Kenya in maize residue use as livestock feed and soil mulch. In the eastern part, maize residue is
used more as livestock feed while in the western part a larger proportion is retained in the field as
soil mulch. This difference emanates from the relatively different intensity of farming in both
regions. Such a difference calls for targeting different strategies in promoting conservation
agriculture in different agroecologies.
Moreover, households with larger livestock holding clearly allocated larger proportion of their
maize residue to feed. The importance of this increases with the number of dairy cows owned.

19
The volume of maize residue used as livestock feed increases with the number of cross-bred and
exotic cows owned by the farm households. Under intensive dairy production, the introduction of
alternative feed sources is crucial to reduce the pressure on residue use as livestock feed and to
increase the proportion of residue retained on farmland as soil mulch.
Provision of extension and training services on the importance of crop residue use as soil mulch
helps in increasing awareness among farmers and could enhance their current level of maize
residue use as soil mulch. Increasing biomass production of maize residue could also help in
reducing the severe competition between animal feed and soil mulch. Retention of crop residues
on farm plots can be beneficial in the long term to improve crop productivity and hence
production of more biomass to meet the competing residue use for soil fertility and feeding
livestock. For households to gradually achieve this benefit, giving focus to maize varieties with
higher potential of biomass production (without compromising grain yield) and the introduction
of alternative feed sources could be crucial.
Generally, interventions introducing and promoting conservation agriculture and sustainable land
management through crop residue management should account for tradeoffs related to alternative
and competing uses of crop residue as livestock feed and soil mulch. In some cases crop residue
may also be used as source of bio-energy or firewood for cooking and heating which exerts more
competitive pressure and need to be addressed as well. Finally, strategies designed in retaining
more crop residue on farm plots should be context specific based on agroecology, cropping
systems and the existing level of crop-livestock interactions.
20
References
Delgado, C., Rosegrant, M., Steinfeld, H., Ehui, S., Courbois, C., 1999. Livestock to 2020: the
next food revolution. Food, Agriculture and the Environment Discussion Paper 28.
IFPRI/FAO/ILRI, Washington, DC, USA.
Ekboir, J., Boa K., Dankyi, A.A., 2002. Impact of No-Till Technologies in Ghana. Economics
Program Paper 02-01. CIMMYT, Mexico.
Erenstein, O., 2002. Crop residue mulching in tropical and semi-tropical countries: an evaluation
of residue availability and other technological implications. Soil Tillage Res. 67, 115-133.
Erenstein, O., 2003. Smallholder conservation farming in the tropics and sub-tropics: a guide to
the development and dissemination of mulching with crop residues and cover crops. Agric.,
Ecosyst. and Environ. 100, 17-37.
Erenstein, O., Thorpe, W., 2010. Crop-Livestock Interactions along agro-ecological gradients: a
meso-level analysis in the Indo-Gangetic Plains, India. Environ. Dev. and Sustain. 12, 669-
689.
FAO, 2008. Investing in Sustainable Agricultural Intensification. The Role of Conservation
Agriculture. A Framework for Action. Food and Agriculture Organization of the United
Nation, Rome.
Giller, K.E., Witter, E., Corbeels, M., Tittonell, P., 2009. Conservation agriculture and
smallholder farming in Africa: The heretics’ view. Field Crops Res. 114, 23-34.
21
Giller, K.E., Corbeels, M., Nyamangara, J., Triomphe, B., Affholder, F., Scopel, E., Tittonell, P.,
2011. A research agenda to explore the role of conservation agriculture in African
smallholder farming systems. Field Crops Res. 124(3), 468-472.
Gowing, J.W., Palmer, M., 2008. Sustainable agricultural development in sub- Saharan Africa:
the case for a paradigm shift in land husbandry. Soil Use Manag. 24, 92–99.
Hay, R.K.M., Gilbert, R.A., 2001. Variation in the Harvest Index of Tropical Maize: Evaluation
of Recent Evidence from Mexico and Malawi. Ann. of Appl. Biol. 138, 103-109.
Herrero, M., Thornton, P.K., Notenbaert, A., Msangi, S., Wood, S., Kruska, R., Dixon, J., Bossio,
D., van de Steeg, J., Freeman, H.A., Li, X., Rao, P.P., 2009. Drivers of change in crop-
livestock systems and their potential impacts on agroecosystems services and human well-
being to 2030. CGIAR Systemwide Livestock Program, ILRI, Nairobi, Kenya.
Herrero, M., Thornton, P.K., Notenbaert, A.M., Wood, S., Msangi, S., Freeman, H.A., Bossio, D.,
Dixon, J., Peters, M., van de Steeg, J., Lynam, J., Rao, P.P., Macmillan, S., Gerard, B.,
McDermott, J., Seré, C., Rosegrant, M., 2010. Smart investments in sustainable food
production: revisiting mixed crop-livestock systems. Sci. 327(5967), 822-825.
Hobbs, P.R., 2007. Conservation agriculture; what is it and why is it important for future
sustainable food production? J. of Agric. Sci.145, 127-137.
Kassam, A., Kueneman, E., Kebe, B., Ouedraogo, S., Youdeowei, A., 2010. Enhancing Crop-
Livestock Systems in Conservation Agriculture for Sustainable Production Intensification: A
Farmer Discovery Process Going to Scale in Burkina Faso, Integrated Crop Management
Vol.7-2009, FAO, Rome.
22
Latham, M., 1997. Crop residues as a strategic resource in mixed farming systems. In: Renard, C.
(Ed.), Crop Residues in Sustainable Mixed Crop/Livestock Farming Systems. CAB-
ICRISAT-ILRI, Wallingford, UK, pp. 181-196.
Mazvimavi, K., Twomlow, S., 2009. Socioeconomic and institutional factors influencing adoption
of conservation farming by vulnerable households in Zimbabwe. Agric. Syst. 101, 20-29
McDermott, J.J., Staal, S.J., Freeman, H.A., Herrero, M., Van de Steeg, J.A., 2010. Sustaining
intensification of smallholder livestock systems in the tropics. Live-st. Sci. 130, 95-109.
McIntire, J., Gryseels, G., 1987. Crop-Livestock Interactions in Sub-Saharan Africa and their
Implications for Farming Systems Research. Exp. Agric. 23, 235-243.
Moritz, M., 2010. Crop livestock interactions in agricultural and pastoral systems of West Africa.
Agric. and Hum. Values. 27, 119-128.
Pascal, K., Josef, K., (eds.), 2007. Conservation agriculture as practiced in Kenya: two case
studies. Nairobi. African Conservation Tillage Network, Centre de Coopération
Internationale de Recherche Agronomique pour le Développement, FAO, Rome.
Sajaia, Z., 2008. Maximum likelihood estimation of a bivariate ordered Probit model:
implementation and Monte Carlo Simulations. The Stata J. 4(2), 1-18.
Storck, H., Emana, B., Adnew, B., Borowiccki, A., Woldehawariat, S., 1991. Farming Systems
and Resource Economics in the Tropics: Farming System and Farm Management Practices of
Smallholders in the Hararghe Highland. Vol. II,Wissenschaftsverlag Vauk, Kiel, Germany.
Thierfelder, C., Wall, P.C., 2009. Effects of conservation agriculture techniques on infiltration
and soil water content in Zambia and Zimbabwe. Soil and Tillage Res. 105(2), 217-227.
23
Umar, B.B., Aune, J.B., Johnsen, F.H., Lungu, O.I., 2011. Options for Improving Smallholder
Conservation Agriculture in Zambia. J. of Agric. Sci. 3(3), 50-62.
Verbeek, M., 2004. A Guide to Modern Econometrics. 2nd edition. John Wiley & Sons, Ltd.

24
Table 1. Distribution of the sample households surveyed
Province District Male headed Female headed Total Percent
Western Bungoma 131 19 150 24.4
Nyanza Siaya 110 39 149 24.3
Eastern Embu 82 28 110 17.9
Eastern Meru South 84 18 102 16.6
Eastern Imenti South 87 15 102 16.6
Total 494 119 613 100.0
Table 2. Distribution of the sample households in maize production and residue use (2010 production year) Variables
Season 1 Season 2 Obs Freq. % Obs Freq. %
Number of households producing maize 613 585 95.1 613 456 73.7 Households reported maize residue use 585 580 99.5 456 438 96.9 Number of households used maize residue as:
Livestock feed
580
422
72.8
438
321
73.3 Soil mulch 580 332 57.2 438 241 55.0 Firewood 580 59 10.2 438 15 3.4 Construction 580 1 0.2 438 1 0.2 Sale 580 35 6.0 438 25 5.7 Burn on plots 580 36 6.2 438 22 5.0 Feed and soil mulch 580 205 35.3 438 146 33.3 Feed, soil mulch, and firewood 580 36 6.2 438 9 2.1

25
Table 3. Distribution of the sample households by their proportion of maize residue use for feed and soil mulch.
Season 1 Season 2
Proportion
Soil mulch Soil mulch
≤ 33% 34-66% >66% Total ≤ 33% 34-66% >66% Total
Feed
≤ 33% 74 23 133 230 47 13 89 149 34-66% 31 66 0 a 97 17 61 0 78
> 66% 253 0 0 253 211 0 0 211 Total 358 89 133 580 275 74 89 438
Note: a Combinations of (34-66%, >66%), (>66%, 34-66%) and (>66%, >66%) for feed and mulch cannot exist due to the fact that higher use in one purpose (>66%) decreases the proportion made available to the other (≤33%).
Table 4. Descriptive statistics of household and farm characteristics (N=613)
Variable Mean Std. Dev. Age of household head (years) 50.31 14.76 Gender of household head (1=male) 0.81 0.40 Education of the household head (years of schooling) 7.38 3.97 Family size (persons) 5.74 2.64 Households owning large ruminants (%) 74.55 - Households owning small ruminants (%) 52.36 - Households owning large or small ruminants (%) 84.18 - Number of indigenous cows owned 0.54 1.19 Number of cross-bred cows owned 0.20 0.54 Number of exotic breed cows owned 0.14 0.53 Number of oxen owned 0.15 0.64 Number of bulls owned 0.24 0.58 Number of heifers owned 0.19 0.71 Number of calves owned 0.58 0.99 Total cattle owned (TLU) a 1.48 1.85 Number of small ruminants owned 2.03 2.81 Got extension/training service on residue use as soil mulch (1=yes) 0.29 0.46 Got extension/training on livestock production (1=yes) 0.39 0.49
Note: a TLU is Tropical Livestock Unit as defined in Storck et al. (1991).
26
Table 5. Mean comparison test for selected variables that vary by season
Variables Obs
Season 1 Season 2
Mean
Std.
Err. Mean
Std.
Err.
Proportion of maize residue used as feed
(0 if ≤33%; 1 if 34≤X≤66%; 2 if >66%) 417 2.14 0.04 2.13 0.04
Proportion of maize residue used as soil mulch
(0 if ≤33%; 1 if 34≤X≤66%; 2 if >66%) 418 1.58 0.04 1.59 0.04
Quantity of maize residue used as livestock feed a (kg) 392 668.14*** 41.01 536.99 34.54
Quantity of maize residue used as soil mulch a (kg) 393 390.57*** 41.68 208.48 19.09
Amount of maize grain produced (kg) 431 654.98*** 43.96 443.47 24.73
Maize area (acre) 432 1.16*** 0.04 1.09 0.04
Proportion of maize area owned to total maize area
(ratio, 1=owned) 429 0.89** 0.01 0.87 0.01
Weighted average distance to maize plots (by area) from
homestead (minutes) 429 6.83 0.76 7.59** 0.77
Number of mature trees in the maize plots 432 12.52 2.02 12.46 1.97
Note: ***, ** and * are significantly different from the mean in the other season at 1%, 5%, and 10% level, respectively. a Derived from maize grain production (as 2:1 ratio) and proportion of residue allocated to the specific purpose.
27
T
able
6. B
ivar
iate
Ord
ered
Pro
bit e
stim
atio
n re
sults
on
the
prop
ortio
n of
mai
ze re
sidu
e us
e by
sea
son
Exp
lana
tory variables
Season
1
Se
ason
2
Feed
So
il Mulch
Feed
So
il Mulch
Coe
f. St
d. E
rr.
C
oef.
Std.
Err
.
Coe
f. St
d. E
rr.
C
oef.
Std.
Err
. A
ge o
f HH
hea
d (y
ear)
0.
004
0.00
4
0.00
3 0.
005
-0
.002
0.
005
0.
001
0.00
5 Se
x of
HH
hea
d (1
=m
ale)
0.
410**
0.
161
-0
.396
**
0.16
2
0.32
1* 0.
184
-0
.357
**
0.17
9 E
duca
tion
of H
H h
ead
(yea
r)
-0.0
08
0.01
8
0.01
3 0.
017
-0
.018
0.
022
-0
.004
0.
020
Act
ive
agri
cultu
ral l
abor
(per
sons
) 0.
023
0.05
6
-0.1
28*
0.06
6
-0.0
34
0.06
4
-0.0
83
0.07
9 In
dige
nous
cow
s ow
ned
(num
ber)
0.
182**
* 0.
063
0.21
4***
0.07
2
Cro
ssed
cow
s (n
umbe
r )
0.59
6***
0.10
0
0.
501**
* 0.
156
E
xotic
cow
s ow
ned
(num
ber)
0.
380**
* 0.
090
0.42
2***
0.12
9
Tra
ined
oxe
n ow
ned
(num
ber)
0.
093*
0.05
8
0.
153**
0.
062
B
ulls
ow
ned
(num
ber)
0.
204**
* 0.
061
0.15
5**
0.07
1
Hei
fers
ow
ned
(num
ber)
0.
037
0.05
1
0.
047
0.09
0
Cal
ves
owne
d (n
umbe
r)
-0.0
18
0.05
3
-0
.009
0.
064
C
attle
(TLU
)
-0.1
10**
* 0.
039
-0.0
95**
* 0.
036
Smal
l rum
inan
ts o
wne
d (n
umbe
r)
-0.0
01
0.02
2
0.01
2 0.
022
0.
020
0.02
2
0.00
8 0.
023
Rec
eive
d ex
tens
ion/
trai
ning
on
lives
tock
pro
duct
ion
(1=
yes)
-0
.023
0.
090
-0.0
62
0.11
5
Rec
eive
d ex
tens
ion/
trai
ning
on
reta
inin
g cr
op re
sidu
e on
plo
ts (1
=ye
s)
0.
335**
* 0.
099
0.39
3***
0.11
9 M
aize
are
a (a
cre)
-0
.072
* 0.
040
0.
086**
0.
041
0.
096*
0.05
9
-0.0
43
0.06
9 Sh
are
of o
wne
d m
aize
are
a fr
om th
e to
tal m
aize
are
a (b
y se
ason
) 0.
115
0.21
2
-0.4
82**
0.
224
0.
194
0.25
0
-0.1
16
0.25
6 W
eigh
ted
dist
ance
of m
aize
plo
ts fr
om h
omes
tead
(min
utes
) -0
.009
***
0.00
3
0.01
1***
0.00
3
-0.0
06
0.00
4
0.00
8**
0.00
4 N
umbe
r of m
atur
e tr
ees
in m
aize
plo
ts
-0.0
02**
0.
001
0.
001
0.00
1
-0.0
01
0.00
1
0.00
0 0.
001
Inte
nsity
of m
anur
e us
ed o
n m
aize
plo
ts (k
g/ac
re/s
easo
n)
0.
000
0.00
0
0.
000
0.00
0 W
eigh
ted
soil
fert
ility
of m
aize
plo
ts (1
=po
or, 2
=m
ediu
m, 3
=go
od) a
-0.0
05
0.06
1
0.
133
0.08
3 W
eigh
ted
slop
e of
mai
ze p
lots
(1=
flat,
2=m
ediu
m, 3
=st
eep)
a
0.
171**
0.
079
0.28
3***
0.10
4 W
eigh
ted
soil
dept
h of
mai
ze p
lots
(1=
shal
low
, 2=
med
ium
, 3=
deep
) a
0.
024
0.07
3
0.
043
0.08
9 E
mbu
_Dum
my
(1=
Em
bu, 0
=el
se)
1.49
5***
0.19
5
-1.6
35**
* 0.
237
1.
285**
* 0.
268
-1
.272
***
0.29
0 M
eru
Sout
h_D
umm
y (1
=M
eru
Sout
h, 0
=el
se)
1.72
6***
0.20
5
-1.8
79**
* 0.
241
1.
389**
* 0.
263
-1
.467
***
0.29
4 Im
enti
Sout
h _D
umm
y (1
=Im
enti
Sout
h, 0
=el
se)
2.02
3***
0.20
2
-1.9
41**
* 0.
240
1.
624**
* 0.
280
-1
.460
***
0.30
7 Si
aya_
Dum
my
(1=
Siay
a, 0
=el
se)
0.00
4 0.
154
0.
637**
* 0.
156
-0
.348
0.
234
0.
955**
* 0.
254
Num
ber
of o
bser
vatio
ns
528
390
W
ald
Chi
2 (21)
27
4.65
19
0.65
Pro
b >
Chi
2 0.
000
0.00
0
Log
pseu
do-l
ikel
ihoo
d -6
36.6
7
-4
71.8
9
Wal
d C
hi2 (1
) b 18
1.22
12
8.86
Pro
b >
Chi
2 b 0.
000
0.00
0
Rho
12
-0.8
95**
*
-0
.862
***
Not
e: **
*, **
and
* are
sig
nific
ant a
t 1%
, 5%
, and
10%
leve
l, re
spec
tivel
y.
a
Wei
ghte
d by
are
a of
eac
h pl
ot a
nd th
en a
ggre
gate
d.
b W
ald
test
for
the
inde
pend
ence
of t
he tw
o eq
uatio
ns.
28
T
able
7. B
ivar
iate
Tob
it es
timat
ion
resu
lts o
n th
e qu
antit
y of
mai
ze re
sidu
e us
e by
sea
son
Exp
lana
tory variables
Season
1
Season
2
Feed
Soil mulch
Feed
Soil mulch
Coe
f. St
d. E
rr.
Coe
f. St
d. E
rr.
Coe
f. St
d. E
rr.
Coe
f. St
d. E
rr.
Age
of H
H h
ead
(yea
r)
1.63
2.
11
3.92
3.
28
0.11
0.
88
0.89
0.
95
Sex
of H
H h
ead
(1=
mal
e, 0
=fe
mal
e)
167.
02**
79
.61
-139
.46
105.
80
10.9
8 29
.95
-8.4
6 24
.91
Edu
catio
n of
HH
hea
d (y
ear)
0.
68
13.5
2 13
.79
17.4
6 -2
.72
3.81
1.
25
3.75
A
ctiv
e ag
ricu
ltura
l lab
or (p
erso
ns)
58.8
9 41
.93
-85.
27*
45.5
4 13
.72
10.4
8 -3
.23
10.9
7 In
dige
nous
cow
s ow
ned
(num
ber)
10
2.50
***
34.9
9 24
.23*
14.6
2 C
ross
ed c
ows
(num
ber
) 20
8.74
***
64.5
9 54
.56**
26
.28
Exo
tic c
ows
owne
d (n
umbe
r)
160.
35*
83.6
0 46
.55*
28.0
4 T
rain
ed o
xen
owne
d (n
umbe
r)
-30.
17
58.5
9 8.
12
13.6
0 B
ulls
ow
ned
(num
ber)
63
.97
61.8
5 11
.26
16.3
8 H
eife
rs o
wne
d (n
umbe
r)
-78.
80
81.4
0 2.
37
18.4
7 C
alve
s ow
ned
(num
ber)
-6
.76
36.4
8 2.
19
13.9
1 C
attle
(TLU
)
7.61
28
.33
-3.5
1 7.
33
Smal
l rum
inan
ts o
wne
d (n
umbe
r)
23.1
0 17
.32
-29.
19
25.5
2 6.
12
4.62
-4
.04
4.95
E
xten
sion
/trai
ning
on
lives
tock
pro
duct
ion
(1=
yes)
-9
3.97
66
.45
-48.
11**
22
.54
Ext
ensi
on/tr
aini
ng o
n re
tain
ing
crop
resi
due
on p
lots
(1=
yes)
143.
98*
75.6
9 73
.83**
* 21
.88
Mai
ze p
lot s
ize
(acr
e)
33
.67
29.3
7 13
.90
10.6
6 Sh
are
of o
wn
mai
ze p
lots
from
the
tota
l mai
ze p
lots
(by
seas
on)
22.3
5 17
1.80
-1
7.01
19
0.81
71
.70
56.3
2 -4
9.17
58
.22
Wei
ghte
d di
stan
ce o
f mai
ze p
lots
from
hom
este
ad (m
inut
es)
-3.8
9* 2.
15
3.87
* 2.
12
-1.8
7 1.
64
1.11
1.
11
Num
ber o
f mat
ure
tree
s in
mai
ze p
lots
-1
.31*
0.79
-0
.59
0.85
-0
.24
0.25
-0
.21
0.24
In
tens
ity o
f man
ure
used
on
mai
ze p
lots
(kg/
acre
/sea
son)
0.00
0.
00
0.00
0.
00
Soil
fert
ility
of m
aize
plo
ts (1
=po
or, 2
=m
ediu
m, 3
=go
od) a
-0
.10
53.1
9 27
.08*
16.0
8 Sl
ope
of m
aize
plo
ts (1
=fla
t, 2=
med
ium
, 3=
stee
p) a
4.
58
56.4
8 32
.14*
18.4
7 So
il de
pth
of m
aize
plo
ts (1
=sh
allo
w, 2
=m
ediu
m, 3
=de
ep) a
88
.71
56.7
1 45
.14**
* 15
.34
Tot
al m
aize
resi
due
prod
uced
(kg
/hh/
seas
on)
0.26
0.
18
0.68
***
0.20
0.
72**
* 0.
06
0.23
***
0.06
E
mbu
_Dum
my
(1=
Em
bu, 0
=el
se)
239.
32
151.
78
-427
.42**
17
8.66
11
2.69
**
46.6
0 -1
72.3
2***
42.2
9 M
eru
Sout
h_D
umm
y (1
=M
eru
Sout
h, 0
=el
se)
403.
43**
* 14
1.65
-7
47.7
2***
176.
22
158.
22**
* 47
.47
-247
.14**
* 51
.26
Imen
ti So
uth_
Dum
my
(1=
Imen
ti So
uth,
0=
else
) 36
5.74
**
154.
12
-495
.51**
* 17
4.54
12
4.03
***
47.7
2 -1
80.5
7***
46.2
6 Si
aya_
Dum
my
(1=
Siay
a, 0
=el
se)
-203
.98
154.
57
284.
82
200.
34
-119
.99**
* 44
.05
110.
69**
* 41
.33
Con
stan
t -4
99.4
5 33
9.53
-6
67.9
4 52
3.94
-2
12.9
0**
86.1
9 -2
15.9
7**
104.
57
Num
ber
of o
bser
vatio
ns
527
381
Wal
d C
hi2 (4
1)
3906
.06
2042
.55
Pro
b >
Chi
2
0.
000
0.00
0 Lo
g ps
eudo
-lik
elih
ood
-5
727.
33
-337
0.79
R
ho12
-0
.79**
* -0
.67**
*
Not
e: **
*, **
and
* are
sig
nific
ant a
t 1%
, 5%
, and
10%
leve
l, re
spec
tivel
y. a
Wei
ghte
d by
are
a of
eac
h pl
ot a
nd th
en a
ggre
gate
d.