Embed Size (px)
Citation preview
Trademarks as Indicators for knowledge-intensive services
Ulrich Schmoch
Stephan Gauch
Fraunhofer Institute for Systems and Innovation Research
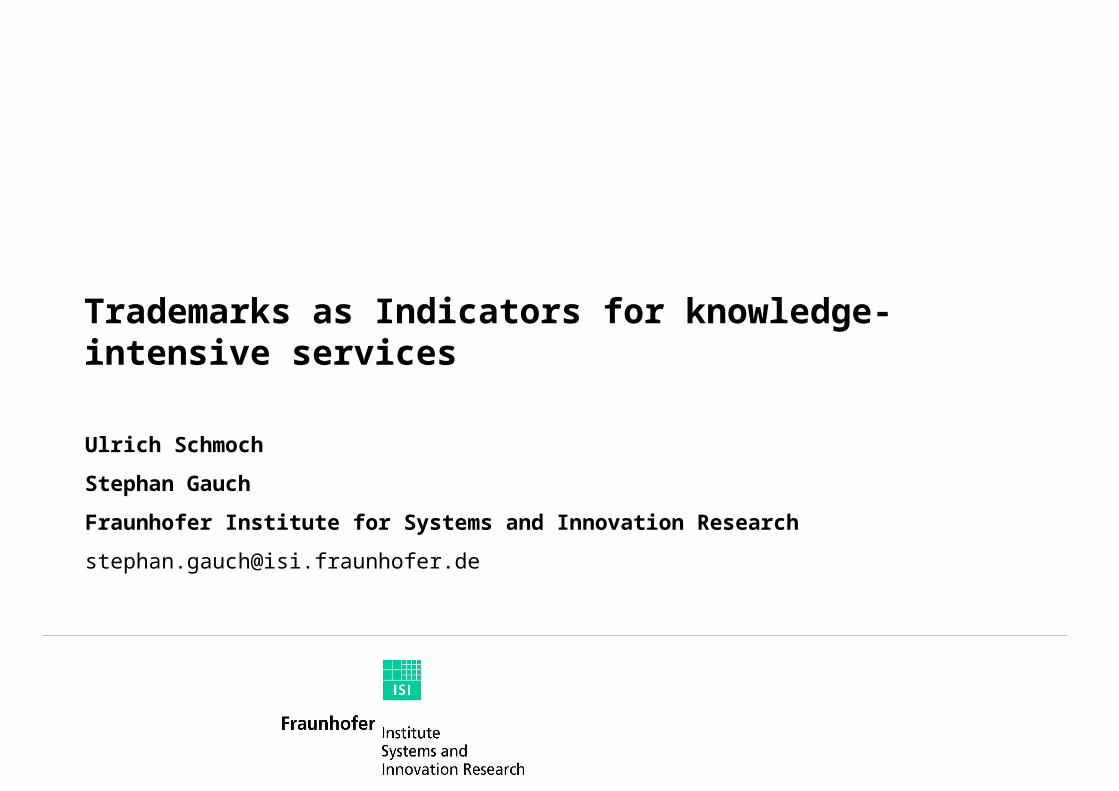
Trademarks as Indicators for Service Innovation
• Services become increasingly important and influence technological competitiveness
• Trademarks are mostly used as Indicators on Microlevel (e.g CIS)
• Most Indicators that can be used to describe services are only limited available
• In Europe services can not be patented
• Problem to measure competitiveness in product-accompanying services and value-added services
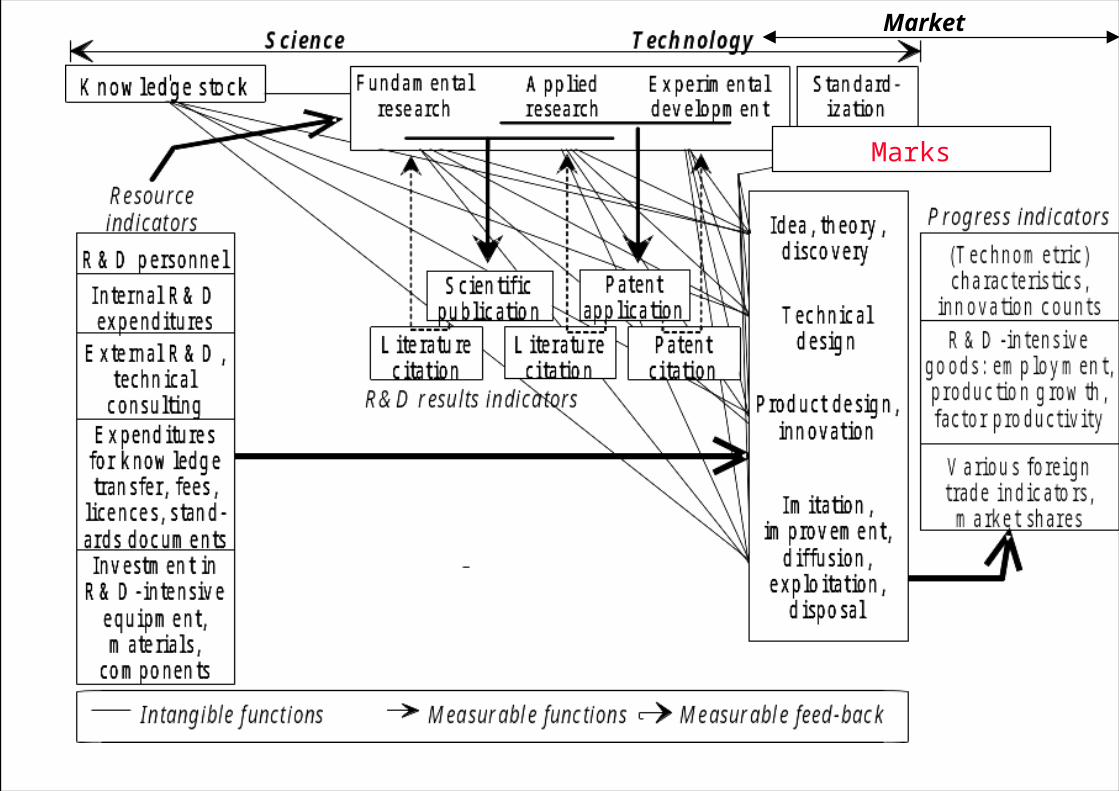
Marks
Market
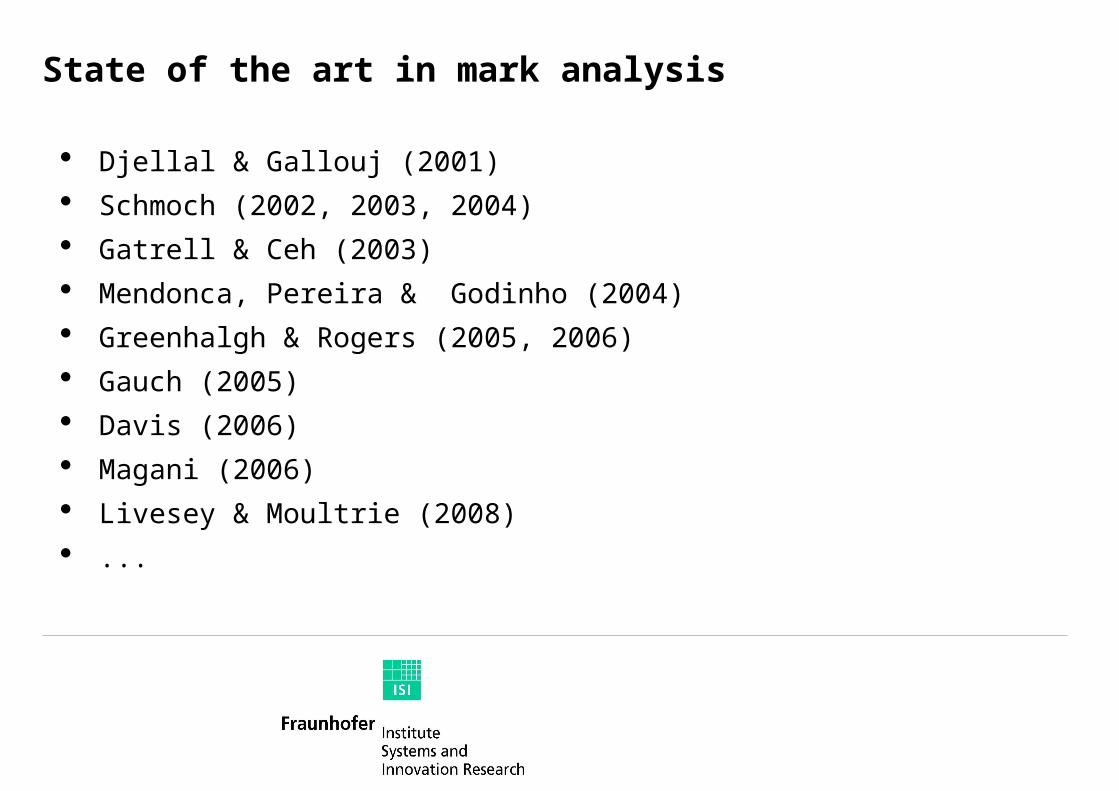
State of the art in mark analysis
Djellal & Gallouj (2001) Schmoch (2002, 2003, 2004) Gatrell & Ceh (2003) Mendonca, Pereira & Godinho (2004) Greenhalgh & Rogers (2005, 2006) Gauch (2005) Davis (2006) Magani (2006) Livesey & Moultrie (2008) ...
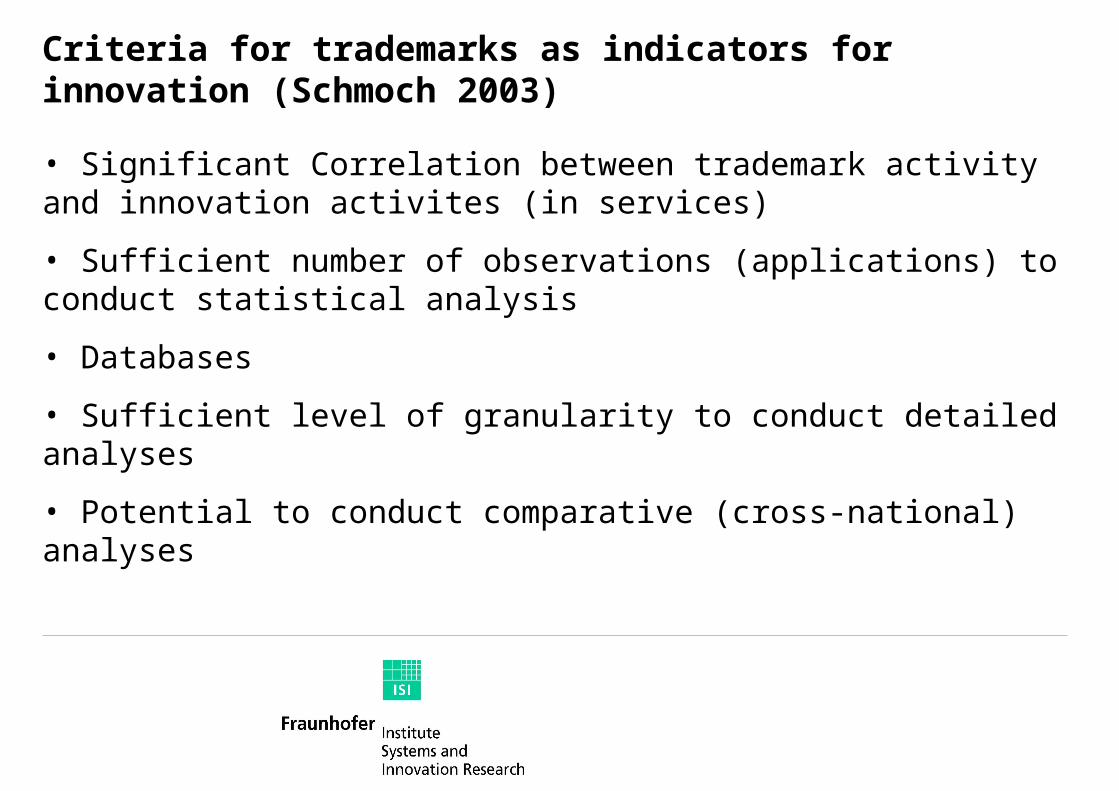
Criteria for trademarks as indicators for innovation (Schmoch 2003)
• Significant Correlation between trademark activity and innovation activites (in services)
• Sufficient number of observations (applications) to conduct statistical analysis
• Databases
• Sufficient level of granularity to conduct detailed analyses
• Potential to conduct comparative (cross-national) analyses
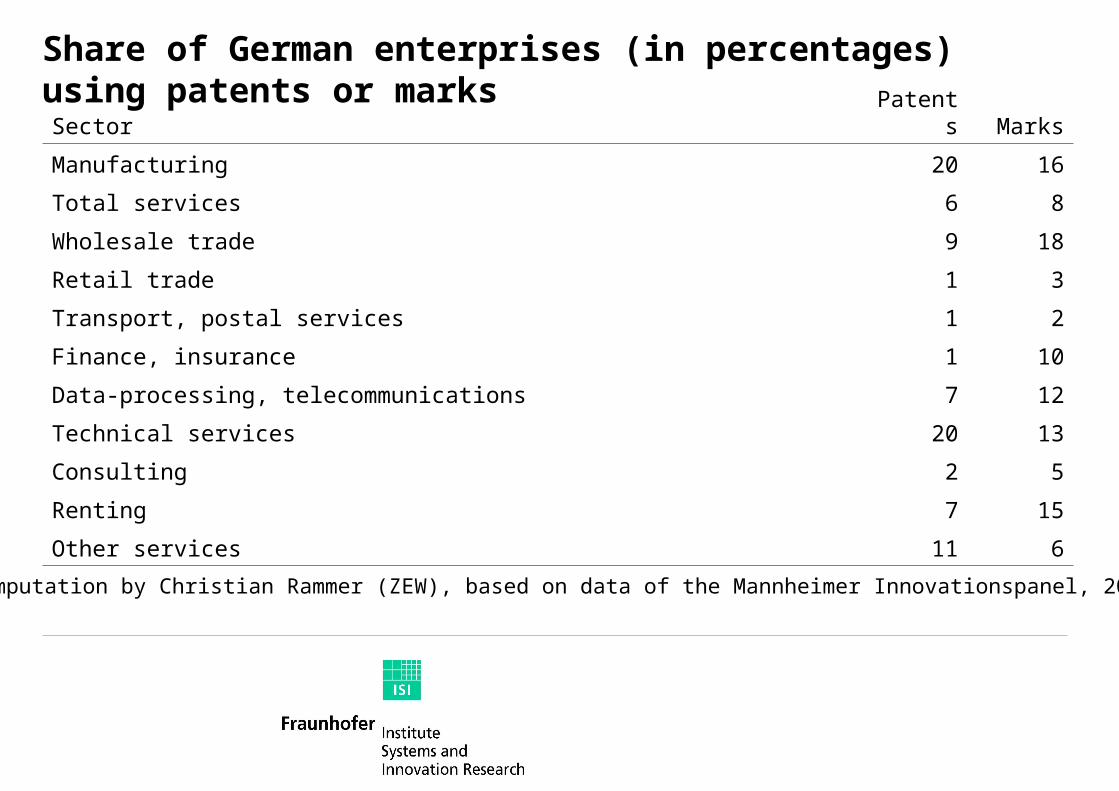
Share of German enterprises (in percentages) using patents or marksSector Patents Marks
Manufacturing 20 16
Total services 6 8
Wholesale trade 9 18
Retail trade 1 3
Transport, postal services 1 2
Finance, insurance 1 10
Data-processing, telecommunications 7 12
Technical services 20 13
Consulting 2 5
Renting 7 15
Other services 11 6
Source: Computation by Christian Rammer (ZEW), based on data of the Mannheimer Innovationspanel, 2000
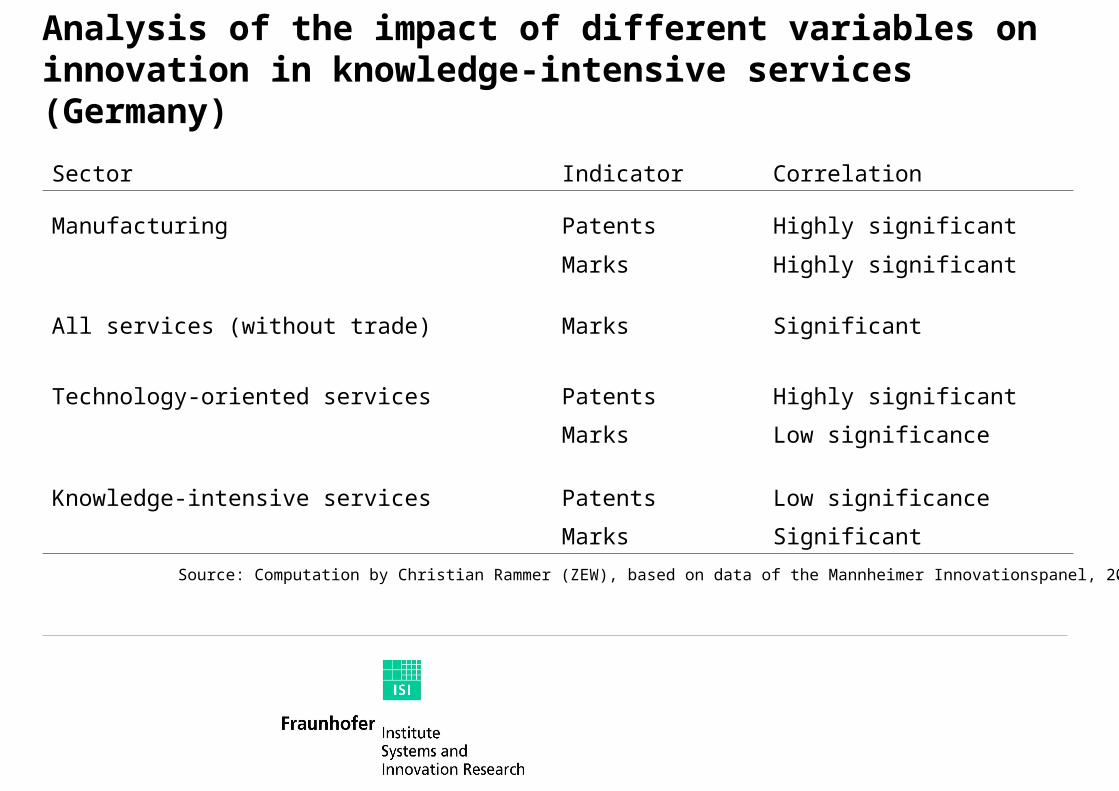
Analysis of the impact of different variables on innovation in knowledge-intensive services (Germany)
Sector Indicator Correlation
Manufacturing Patents Highly significant
Marks Highly significant
All services (without trade) Marks Significant
Technology-oriented services Patents Highly significant
Marks Low significance
Knowledge-intensive services Patents Low significance
Marks Significant
Source: Computation by Christian Rammer (ZEW), based on data of the Mannheimer Innovationspanel, 2000
Methodological Problems
IR vs. CTM Relationship of innovation in manufacturing
vs. services Level of Abstraction mostly rather high

Distribution of filings of IR and CTM trademarks for selected countries (2003-2005)
0%
10%
20%
30%
40%
50%
60%
70%
80%
90%
100%
DE US UK IT SE CH CA FR JP NL FI KR
CTM IR
CTM
IR
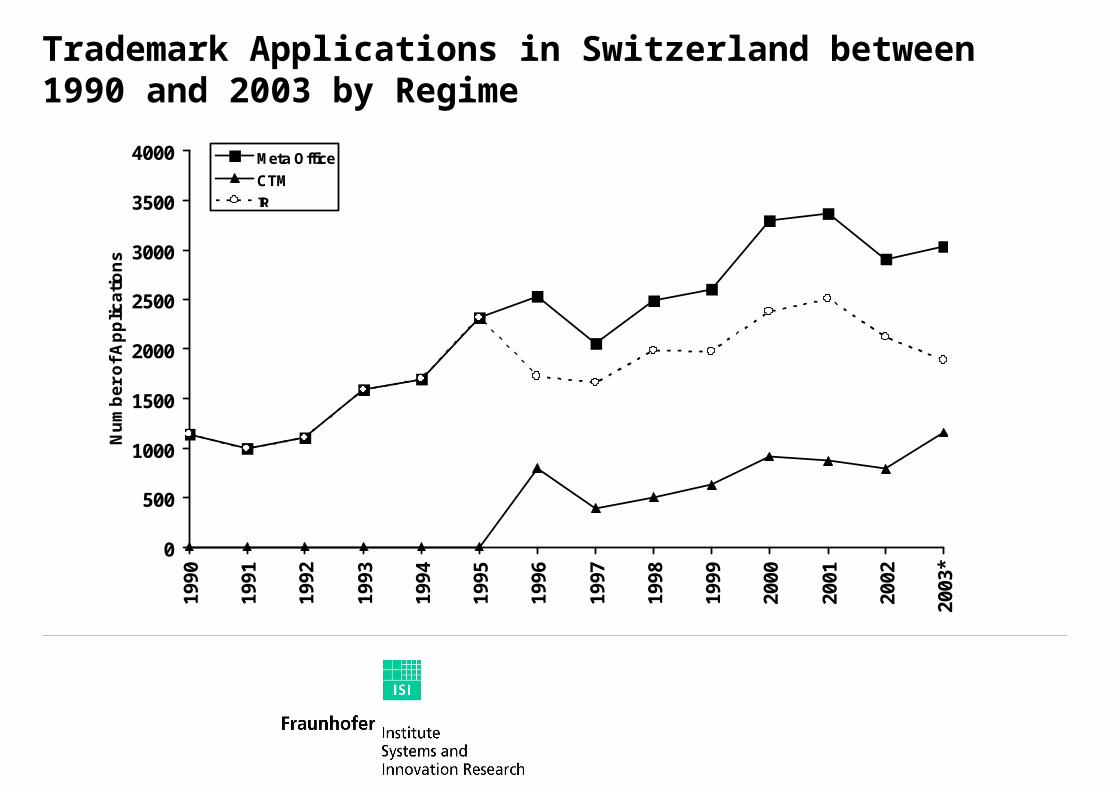
Trademark Applications in Switzerland between 1990 and 2003 by Regime
0
500
1000
1500
2000
2500
3000
3500
4000
1990
1991
1992
1993
1994
1995
1996
1997
1998
1999
2000
2001
2002
2003
*
Nu
mb
er
of
Ap
plic
ati
on
s
Meta Office
CTM
IR
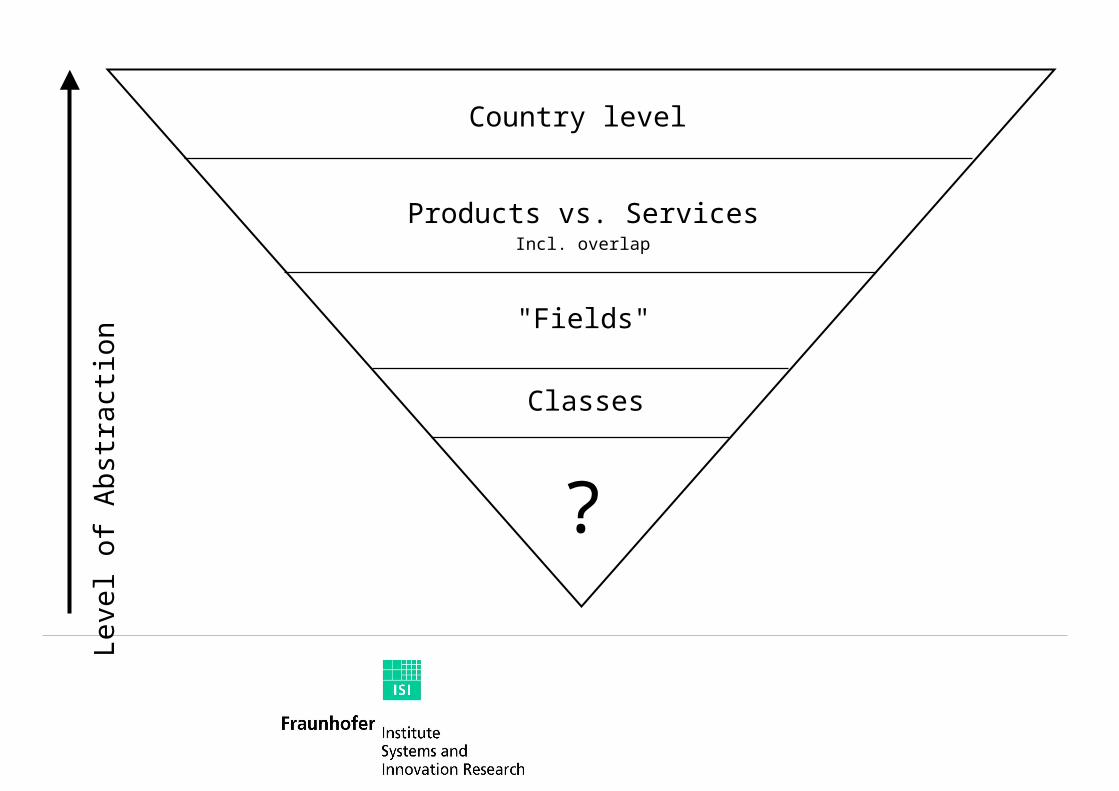
Le
vel of
Ab
stra
ctio
nCountry level
"Fields"
Products vs. Services
Classes
?
Incl. overlap
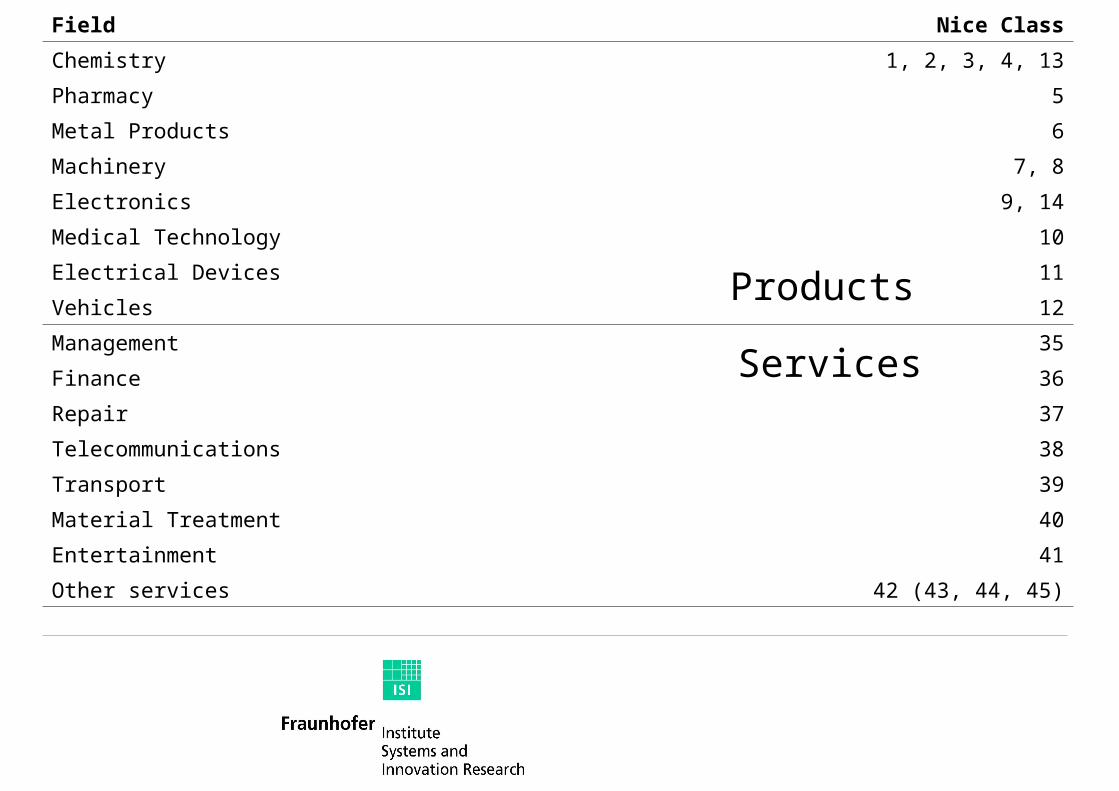
Field Nice Class
Chemistry 1, 2, 3, 4, 13
Pharmacy 5
Metal Products 6
Machinery 7, 8
Electronics 9, 14
Medical Technology 10
Electrical Devices 11
Vehicles 12
Management 35
Finance 36
Repair 37
Telecommunications 38
Transport 39
Material Treatment 40
Entertainment 41
Other services 42 (43, 44, 45)
Products
Services
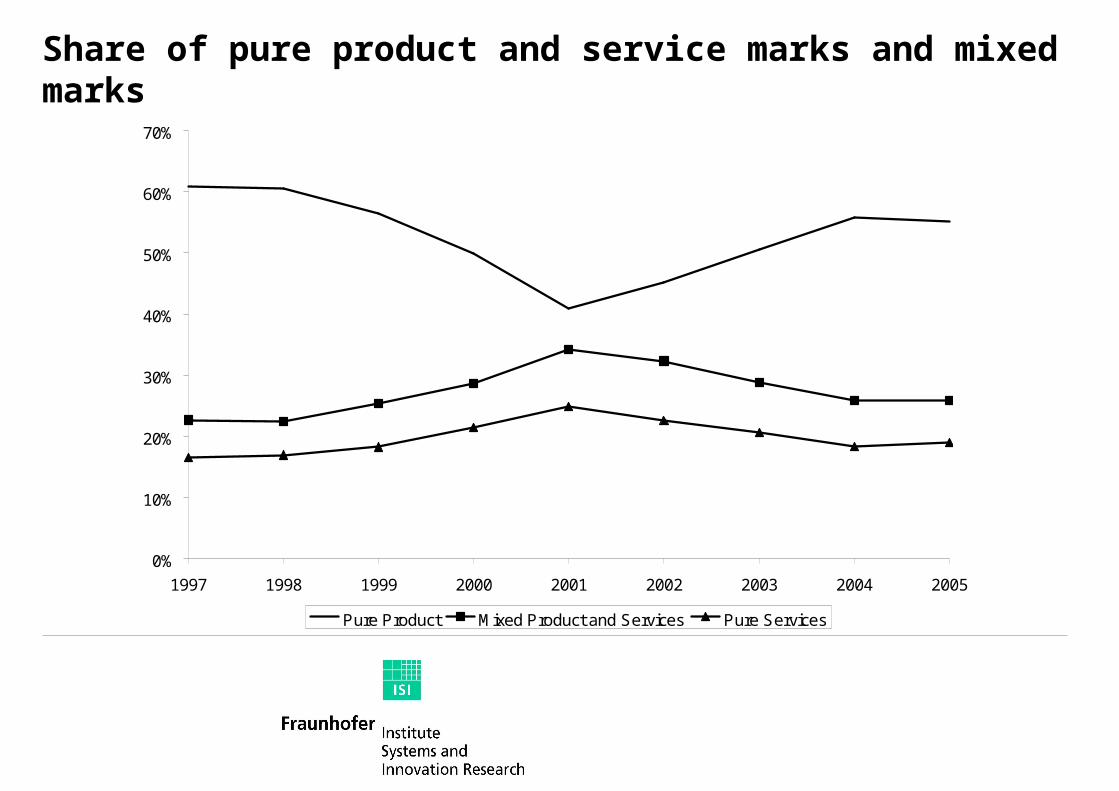
Share of pure product and service marks and mixed marks
0%
10%
20%
30%
40%
50%
60%
70%
1997 1998 1999 2000 2001 2002 2003 2004 2005
Pure Product Mixed Product and Services Pure Services
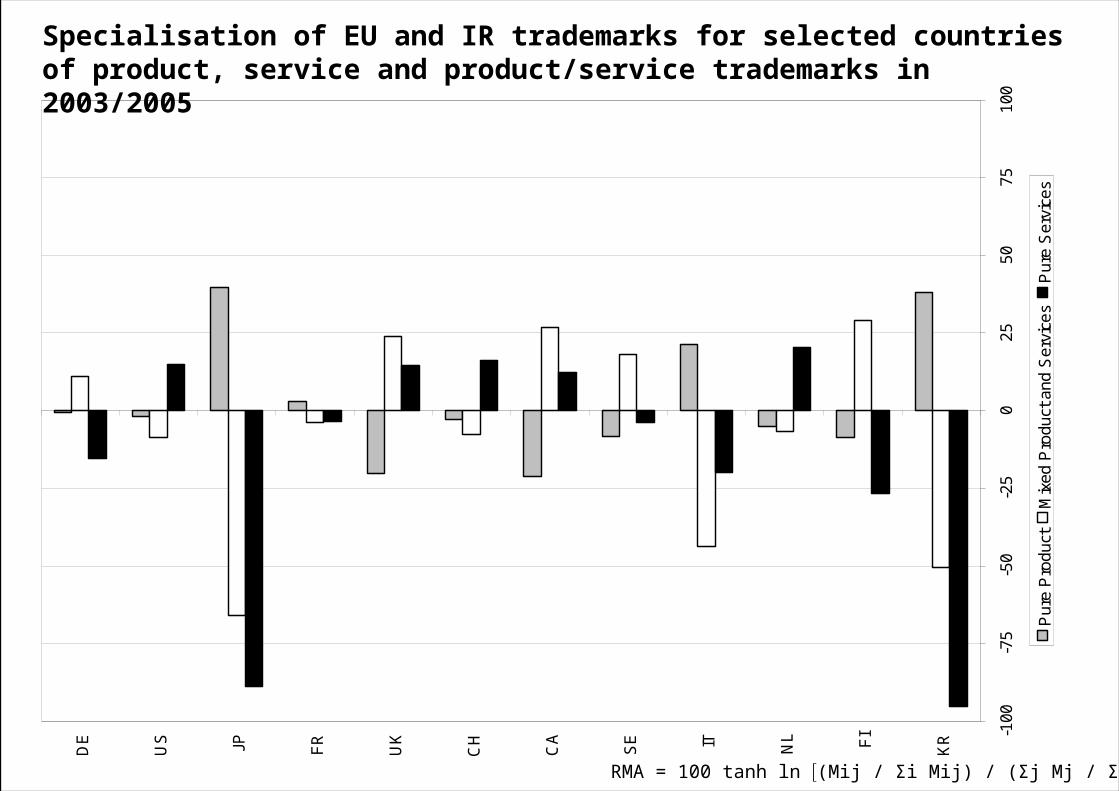
Specialisation of EU and IR trademarks for selected countries of product, service and product/service trademarks in 2003/2005
RMA = 100 tanh ln (Mij / Σi Mij) / (Σj Mj / Σij Mij)
-100
-75
-50
-25
025
5075
100
DE
US JP FR
UK
CH
CA
SE IT NL FI
KR
Pur
e P
rodu
ctM
ixed
Pro
duct
and
Ser
vice
sP
ure
Ser
vice
s
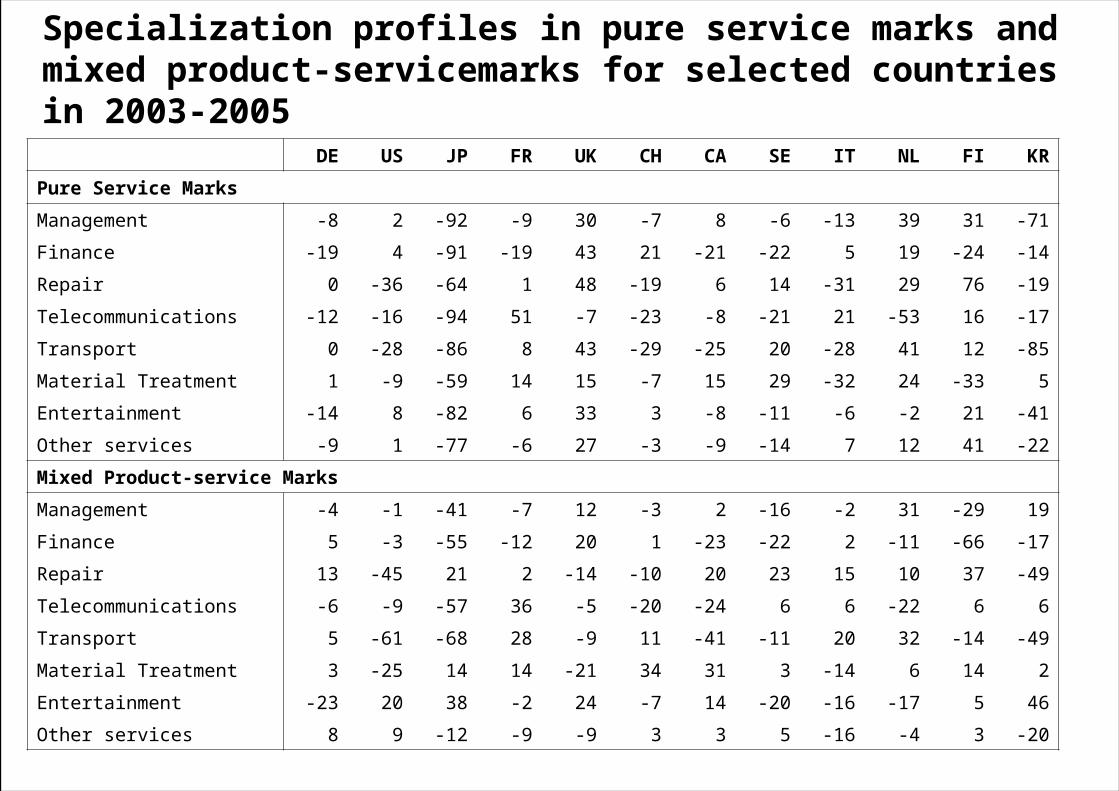
Specialization profiles in pure service marks and mixed product-servicemarks for selected countries in 2003-2005
DE US JP FR UK CH CA SE IT NL FI KR
Pure Service Marks
Management -8 2 -92 -9 30 -7 8 -6 -13 39 31 -71
Finance -19 4 -91 -19 43 21 -21 -22 5 19 -24 -14
Repair 0 -36 -64 1 48 -19 6 14 -31 29 76 -19
Telecommunications -12 -16 -94 51 -7 -23 -8 -21 21 -53 16 -17
Transport 0 -28 -86 8 43 -29 -25 20 -28 41 12 -85
Material Treatment 1 -9 -59 14 15 -7 15 29 -32 24 -33 5
Entertainment -14 8 -82 6 33 3 -8 -11 -6 -2 21 -41
Other services -9 1 -77 -6 27 -3 -9 -14 7 12 41 -22
Mixed Product-service Marks
Management -4 -1 -41 -7 12 -3 2 -16 -2 31 -29 19
Finance 5 -3 -55 -12 20 1 -23 -22 2 -11 -66 -17
Repair 13 -45 21 2 -14 -10 20 23 15 10 37 -49
Telecommunications -6 -9 -57 36 -5 -20 -24 6 6 -22 6 6
Transport 5 -61 -68 28 -9 11 -41 -11 20 32 -14 -49
Material Treatment 3 -25 14 14 -21 34 31 3 -14 6 14 2
Entertainment -23 20 38 -2 24 -7 14 -20 -16 -17 5 46
Other services 8 9 -12 -9 -9 3 3 5 -16 -4 3 -20
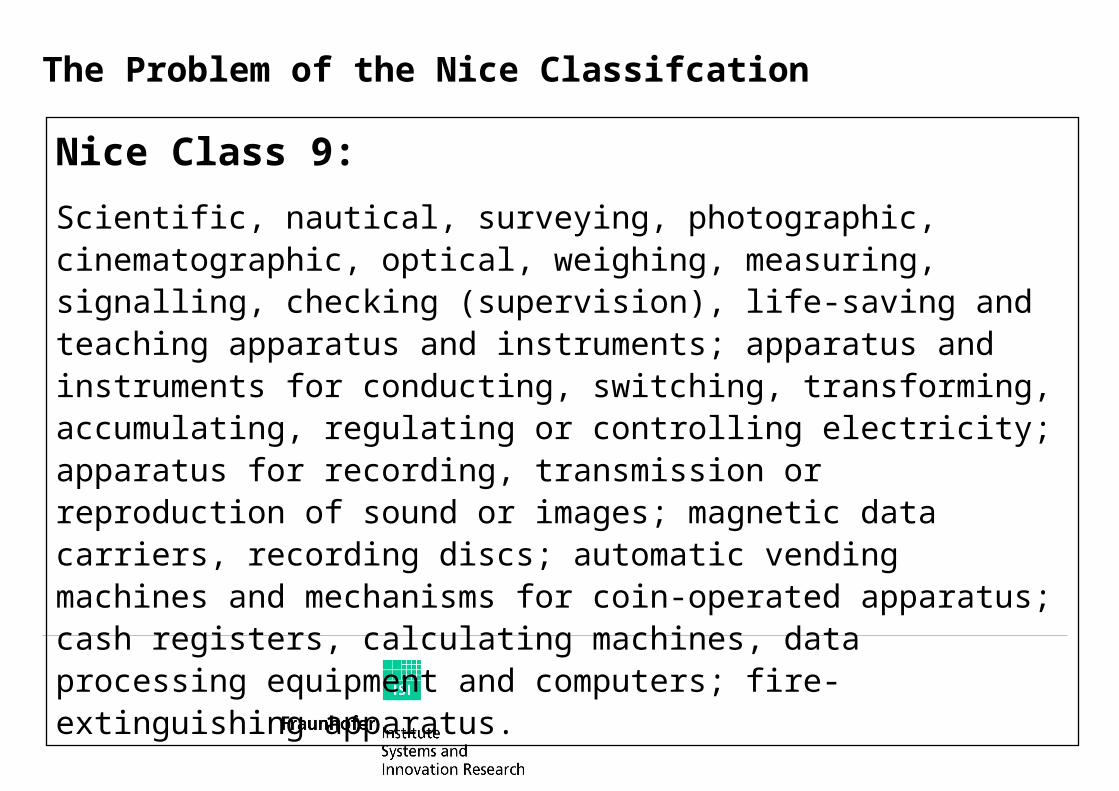
The Problem of the Nice Classifcation
Nice Class 9:
Scientific, nautical, surveying, photographic, cinematographic, optical, weighing, measuring, signalling, checking (supervision), life-saving and teaching apparatus and instruments; apparatus and instruments for conducting, switching, transforming, accumulating, regulating or controlling electricity; apparatus for recording, transmission or reproduction of sound or images; magnetic data carriers, recording discs; automatic vending machines and mechanisms for coin-operated apparatus; cash registers, calculating machines, data processing equipment and computers; fire-extinguishing apparatus.
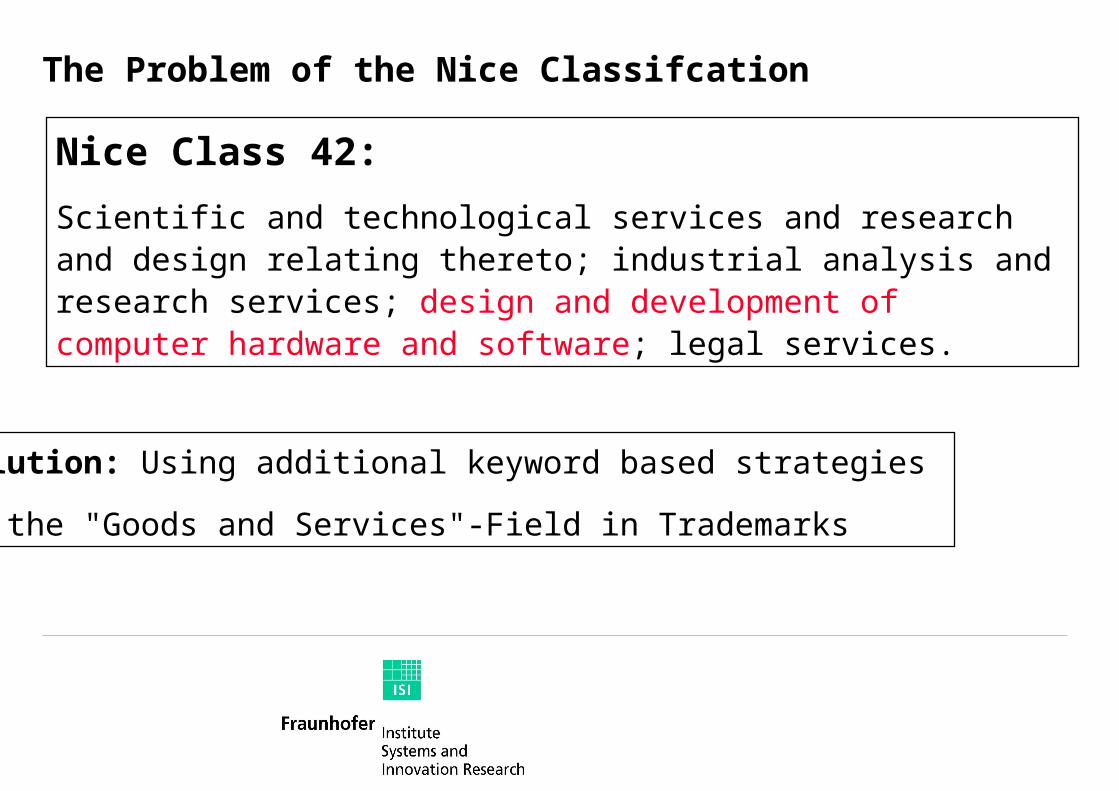
The Problem of the Nice Classifcation
Nice Class 42:
Scientific and technological services and research and design relating thereto; industrial analysis and research services; design and development of computer hardware and software; legal services.
Solution: Using additional keyword based strategies
on the "Goods and Services"-Field in Trademarks
Example
The case of IT-related services
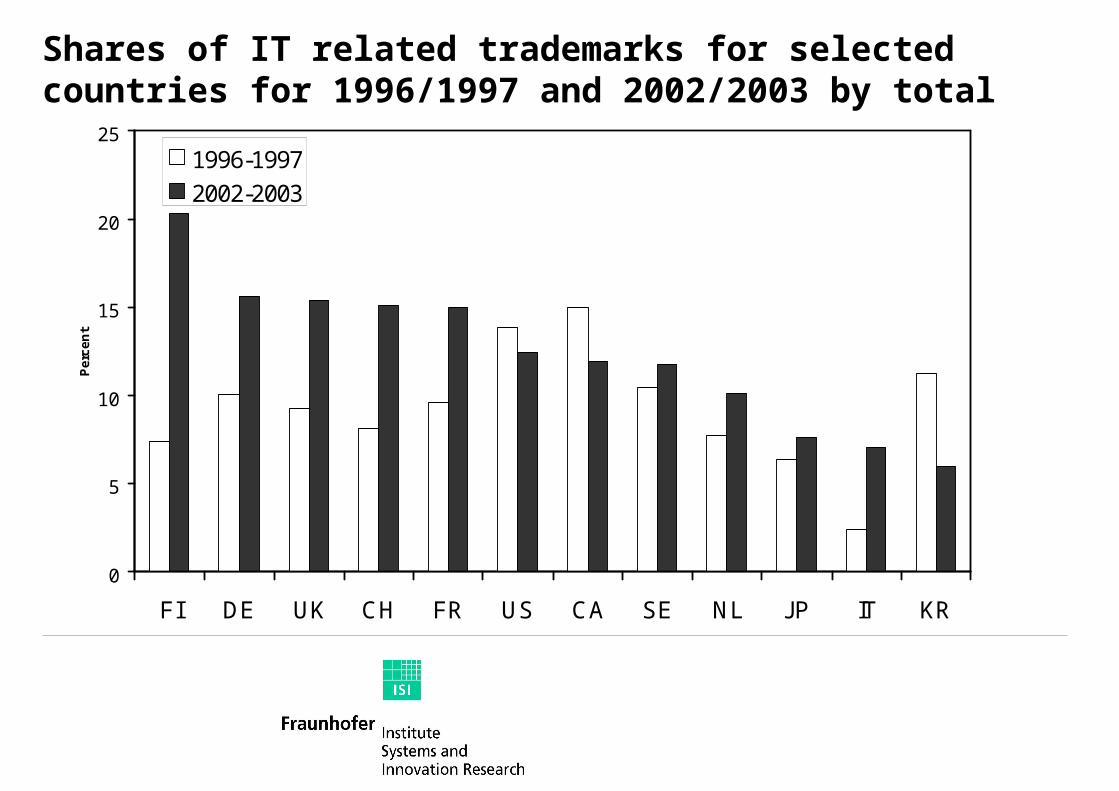
Shares of IT related trademarks for selected countries for 1996/1997 and 2002/2003 by total
0
5
10
15
20
25
FI DE UK CH FR US CA SE NL JP IT KR
Pe
rce
nt
1996-1997
2002-2003
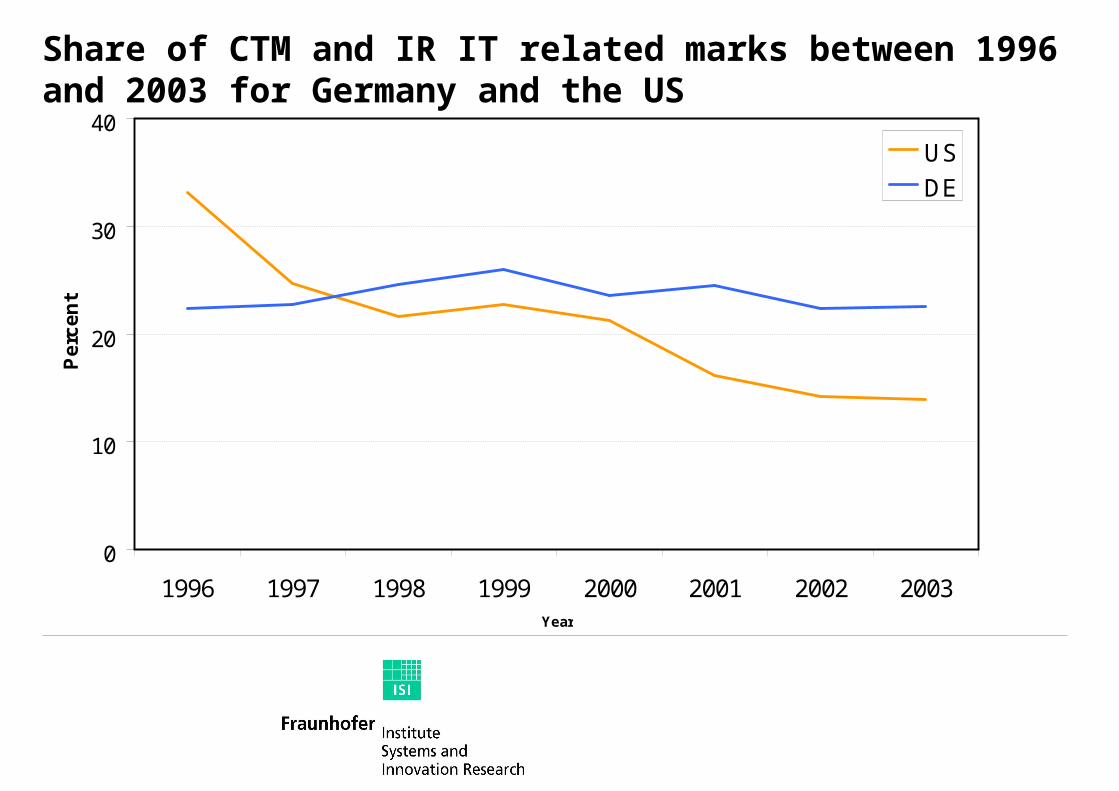
Share of CTM and IR IT related marks between 1996 and 2003 for Germany and the US
0
10
20
30
40
1996 1997 1998 1999 2000 2001 2002 2003Year
Pe
rce
nt
US
DE
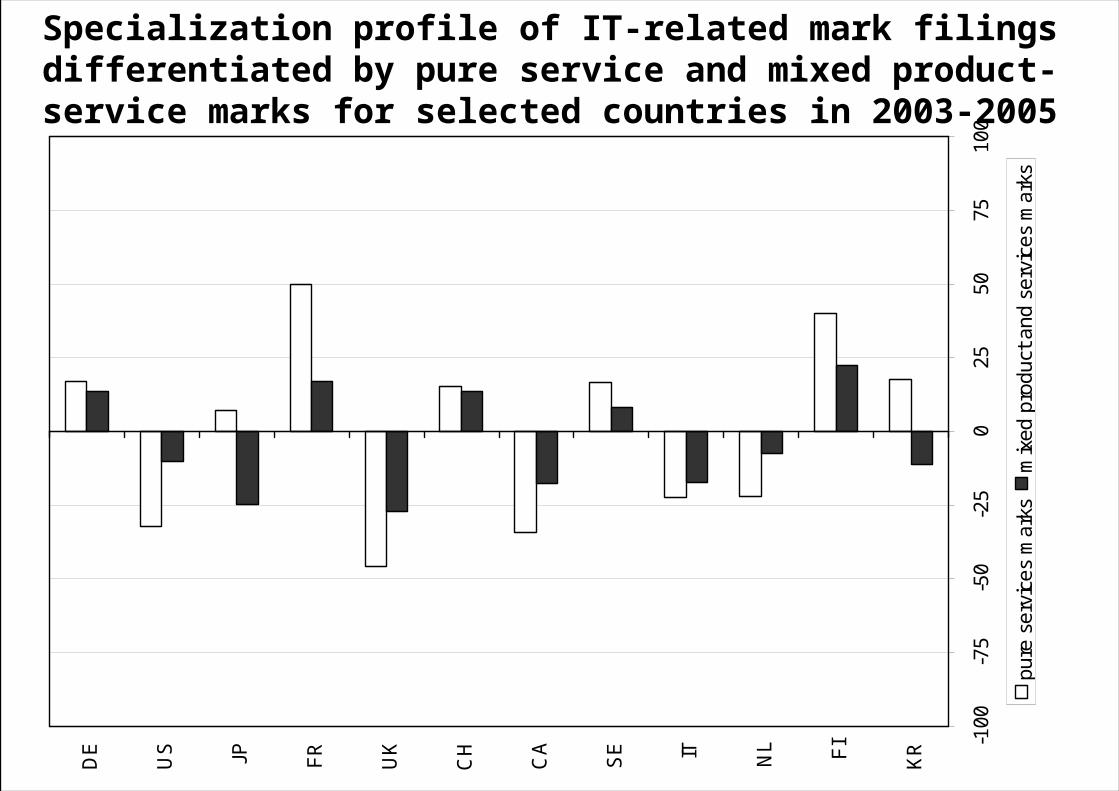
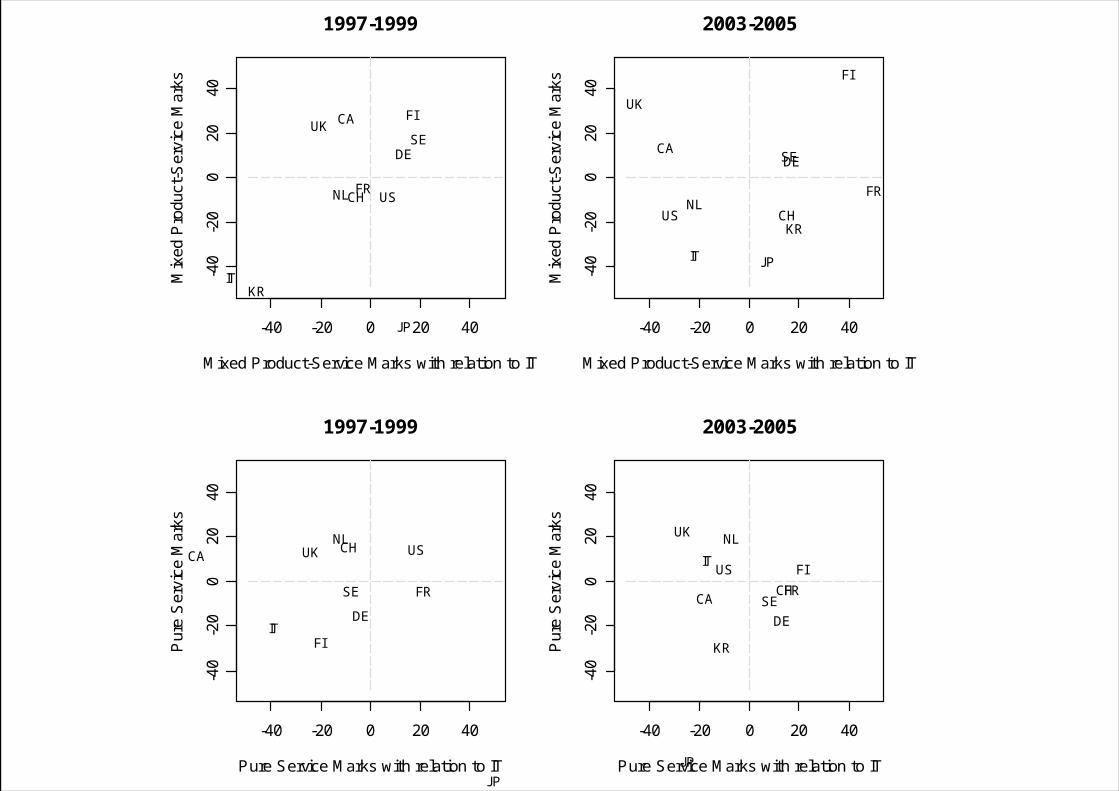
Specialization profile of IT-related mark filings differentiated by pure service and mixed product-service marks for selected countries in 2003-2005
-100
-75
-50
-25
025
5075
100
DE
US JP FR
UK
CH
CA
SE IT NL FI
KR
pure
ser
vice
s m
arks
mix
ed p
rodu
ct a
nd s
ervi
ces
mar
ks
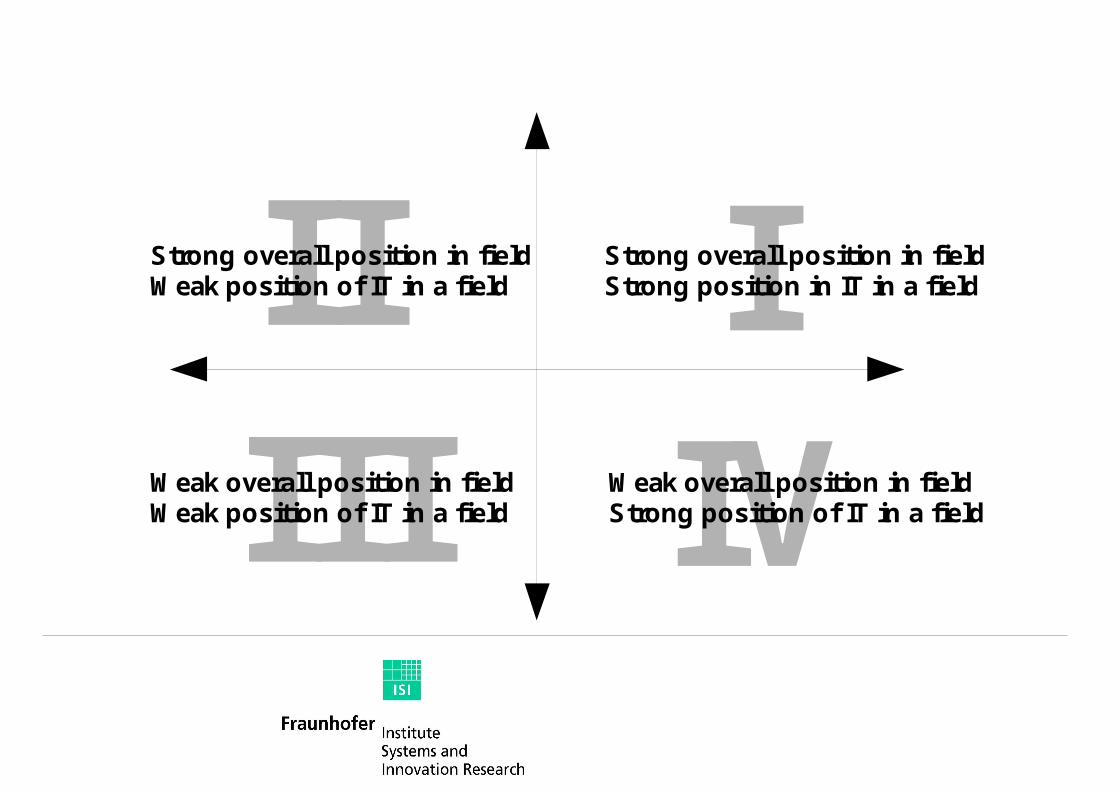
IIIII IStrong overall position in field
Strong position in IT in a field
IVWeak overall position in fieldStrong position of IT in a field
Strong overall position in fieldWeak position of IT in a field
Weak overall position in fieldWeak position of IT in a field
-40 -20 0 20 40
-40
-20
020
40
1997-1999
Mixed Product-Service Marks with relation to IT
Mix
ed P
rodu
ct-S
ervi
ce M
arks
DE
US
JP
FR
UK
CH
CA
SE
IT
NL
FI
KR
-40 -20 0 20 40
-40
-20
020
40
2003-2005
Mixed Product-Service Marks with relation to IT
Mix
ed P
rodu
ct-S
ervi
ce M
arks
DE
US
JP
FR
UK
CH
CASE
IT
NL
FI
KR
-40 -20 0 20 40
-40
-20
020
40
1997-1999
Pure Service Marks with relation to IT
Pur
e S
ervi
ce M
arks
DE
US
JP
FR
UK CHCA
SE
IT
NL
FI
-40 -20 0 20 40
-40
-20
020
40
2003-2005
Pure Service Marks with relation to IT
Pur
e S
ervi
ce M
arks
DE
US
JP
FR
UK
CHCA SE
IT
NL
FI
KR
-100 -50 0 50 100
-100
-50
050
100
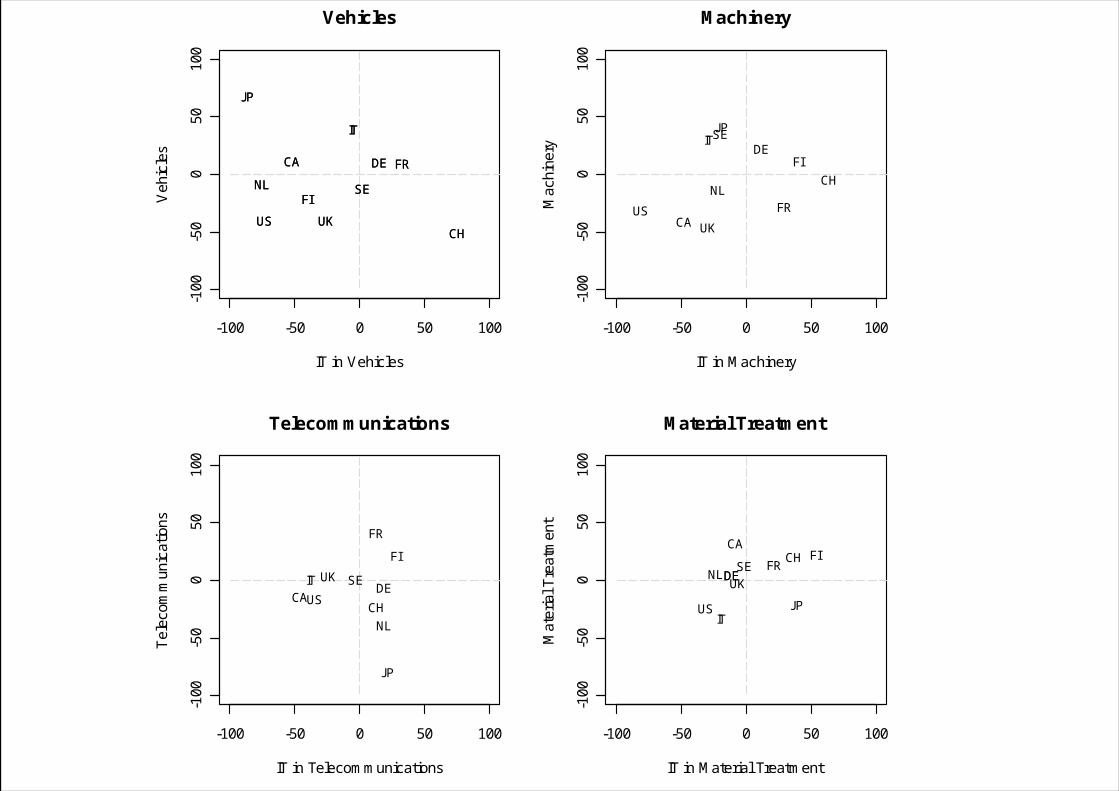
Vehicles
IT in Vehicles
Veh
icle
sDE
US
JP
FR
UKCH
CA
SE
IT
NLFI
DE
US
JP
FR
UKCH
CA
SE
IT
NLFI
-100 -50 0 50 100
-100
-50
050
100
Machinery
IT in Machinery
Mac
hine
ry DE
US
JP
FR
UK
CH
CA
SEIT
NL
FI
-100 -50 0 50 100
-100
-50
050
100
Telecommunications
IT in Telecommunications
Tel
ecom
mun
icat
ions
DEUS
JP
FR
UK
CHCA
SEIT
NL
FI
-100 -50 0 50 100
-100
-50
050
100
Material Treatment
IT in Material Treatment
Mat
eria
l Tre
atm
ent
DE
US JP
FR
UK
CHCA
SE
IT
NL
FI
DE
Discussion
• Trademarks are suitable innovation (output) indicators for services!
• To draw comparative conclusions "Meta Office" analyses have to be conducted!
• Merging marks from OHIM and WIPO into "families"
• To draw sector-based conclusions keyword-based strategies are necessary!
• Relation of patents and trademarks in the US (complementary vs. substitutive?)
• Potential of analyzing the evolution of co-classification patterns over time
Thank you!