Embed Size (px)
Citation preview

0:53:95
172:212:241
165:165:165
115:153:198
7:133:73
139:195:70
246:127:38
190:50:50
115:153:198 Hyperlink
October 2018
Goldman Sachs does and seeks to do business with companies covered in its research reports. As a result, investors should be aware that the firm may have a conflict of interest
that could affect the objectivity of this report. Investors should consider this report as only a single factor in making their investment decision.
For Reg AC certification and other important disclosures, see the Disclosure Appendix, or go to www.gs.com/research/hedge.html.
Analysts employed by non-US affiliates are not registered/qualified as research analysts with FINRA in the U.S.
Trade War: Who Wins and Who Loses
Prepared for ICF Congress 2018 in Muscat, Oman
Hui Shan Goldman, Sachs & Co. +1 212-902-4447 [email protected]
2 Global Investment Research
0:53:95
172:212:241
165:165:165
115:153:198
7:133:73
139:195:70
246:127:38
190:50:50
115:153:198 Hyperlink
Outline
A look at history
US effective tariffs rate declining over the past century
Historically US current account improved in recessions
China did not start (but probably accelerated) US manufacturing job losses
Where are we now?
Trade threats have become reality
Section 232 steel and aluminum tariffs still evolving
Direct impact on economy limited so far
Our view
Tariffs redirect, not eliminate, trade flows
Headline risk higher, not lower, after the US mid-term election
US-China trade war more than just trade war

A Look at the History

4 Global Investment Research
0:53:95
172:212:241
165:165:165
115:153:198
7:133:73
139:195:70
246:127:38
190:50:50
115:153:198 Hyperlink
Long history of US trade policy
.
For most of the 19th century, the US maintains a largely protectionist trade stance
Begnning in the mid-1930s, the US significantly reduces tariffs while attempting to secure
reciprocal market access
Beginning in 1989, free-trade agreements (FTAs) proliferate; as multilateral talks stall, US trade
negotiations shift towards bilateral and regional trade pacts
Source: US International Trade Commission, US Department of Commerce, WTO, Irwin, Douglas A., "Clashing Over Commerce: A History of US Trade Policy," Goldman Sachs Global Investment Research.
5 Global Investment Research
0:53:95
172:212:241
165:165:165
115:153:198
7:133:73
139:195:70
246:127:38
190:50:50
115:153:198 Hyperlink
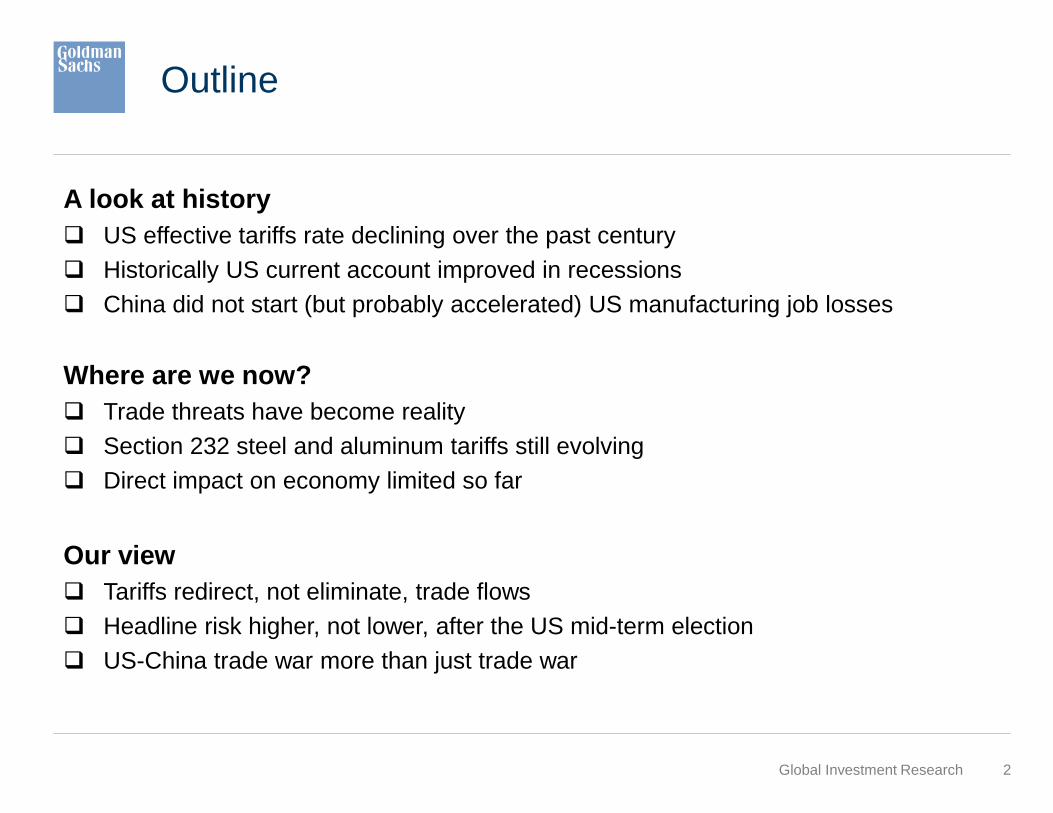
Source: Haver Analytics, Goldman Sachs Global Investment Research.
Historically US current account improved in recessions
-8
-7
-6
-5
-4
-3
-2
-1
0
1
2
-8
-7
-6
-5
-4
-3
-2
-1
0
1
2
1960 1970 1980 1990 2000 2010
%%Recession US Current Account Balance as % of GDP
6 Global Investment Research
0:53:95
172:212:241
165:165:165
115:153:198
7:133:73
139:195:70
246:127:38
190:50:50
115:153:198 Hyperlink
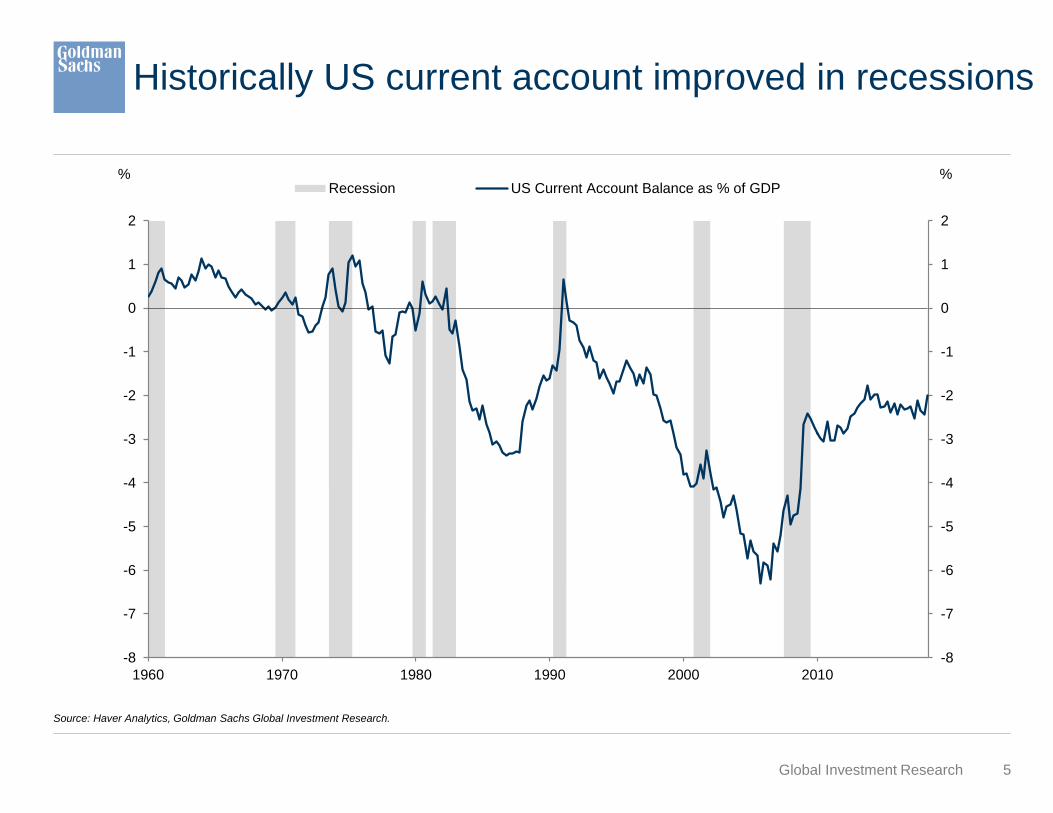
Source: Haver Analytics, Goldman Sachs Global Investment Research.
China did not start US manufacturing job losses
0
5
10
15
20
25
0
5
10
15
20
25
30
35
40
45
1940 1950 1960 1970 1980 1990 2000 2010
Million%
US Manufacturing Employment Manufacturing Share of US Jobs

Where Are We Now?
8 Global Investment Research
0:53:95
172:212:241
165:165:165
115:153:198
7:133:73
139:195:70
246:127:38
190:50:50
115:153:198 Hyperlink
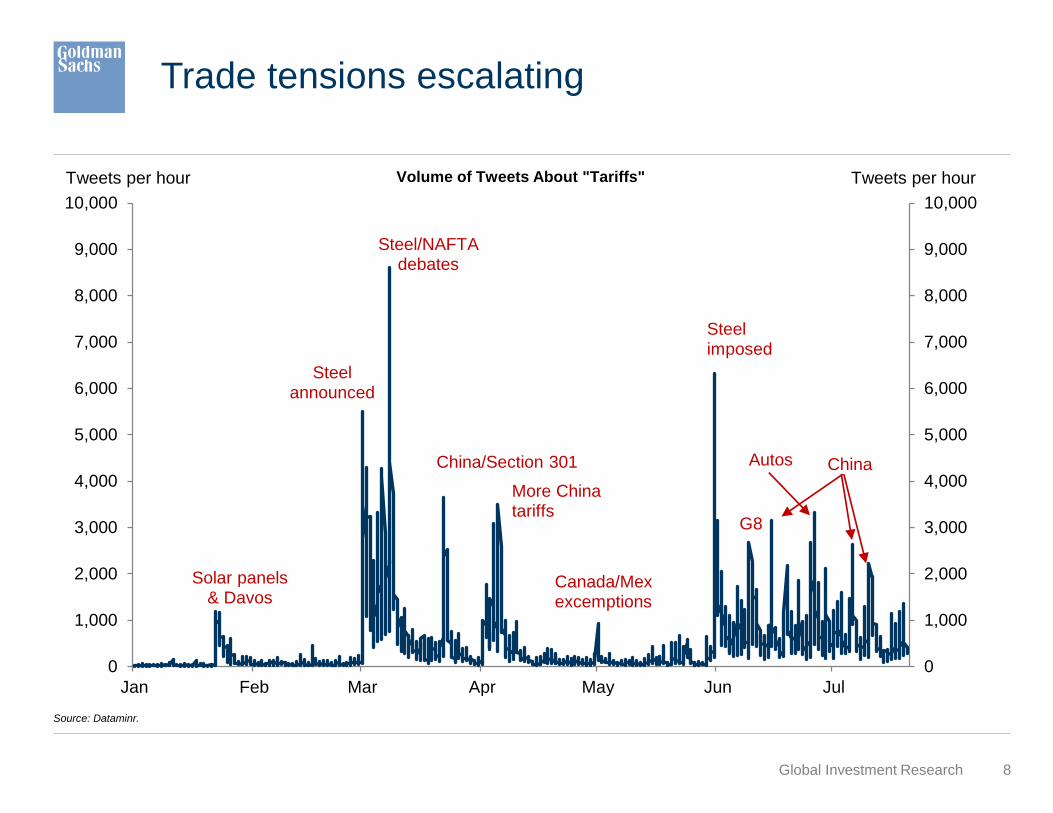
Source: Dataminr.
Trade tensions escalating
0
1,000
2,000
3,000
4,000
5,000
6,000
7,000
8,000
9,000
10,000
0
1,000
2,000
3,000
4,000
5,000
6,000
7,000
8,000
9,000
10,000
Jan Feb Mar Apr May Jun Jul
Tweets per hour Tweets per hour
Solar panels& Davos
Steelannounced
Steel/NAFTAdebates
China/Section 301
More Chinatariffs
Canada/Mexexcemptions
Steelimposed
G8
Autos China
Volume of Tweets About "Tariffs"

9 Global Investment Research
0:53:95
172:212:241
165:165:165
115:153:198
7:133:73
139:195:70
246:127:38
190:50:50
115:153:198 Hyperlink
Source: USITC, White House, Goldman Sachs Global Investment Research.
Tariff threats start to become reality
0
200
400
600
800
1000
0
200
400
600
800
1000
Jan Feb Mar Apr May Jun Jul Aug Sep Oct
Proposed
Implemented
Billions of dollars Billions of dollars
Steel
& Alum
China 301
Tarif f s
Announced
($50bn) Additional China 301*
Sec. 232Autos
AdditionalChina 301*
Washing Machines
& Solar Panels
US Imports Subject to Proposed vs. Implemented Tariffs
Steel and aluminum
*In April, the White House proposed tarif f s on additional $100bn in imports in response to China's retaliation.This supplemental proposal was increased to $400bn on June 18 and to all remaining imports on July 20.
China 301: Remaining imports*
China: +$200bn
imposed
Sept. 24
China:+$16bn
China:+$34bn
*In April, the White House proposed tarif f s on additional $100bn in imports in response to China's retaliation.This supplemental proposal was increased to $400bn on June 18 and to all remaining imports on July 20.
10 Global Investment Research
0:53:95
172:212:241
165:165:165
115:153:198
7:133:73
139:195:70
246:127:38
190:50:50
115:153:198 Hyperlink
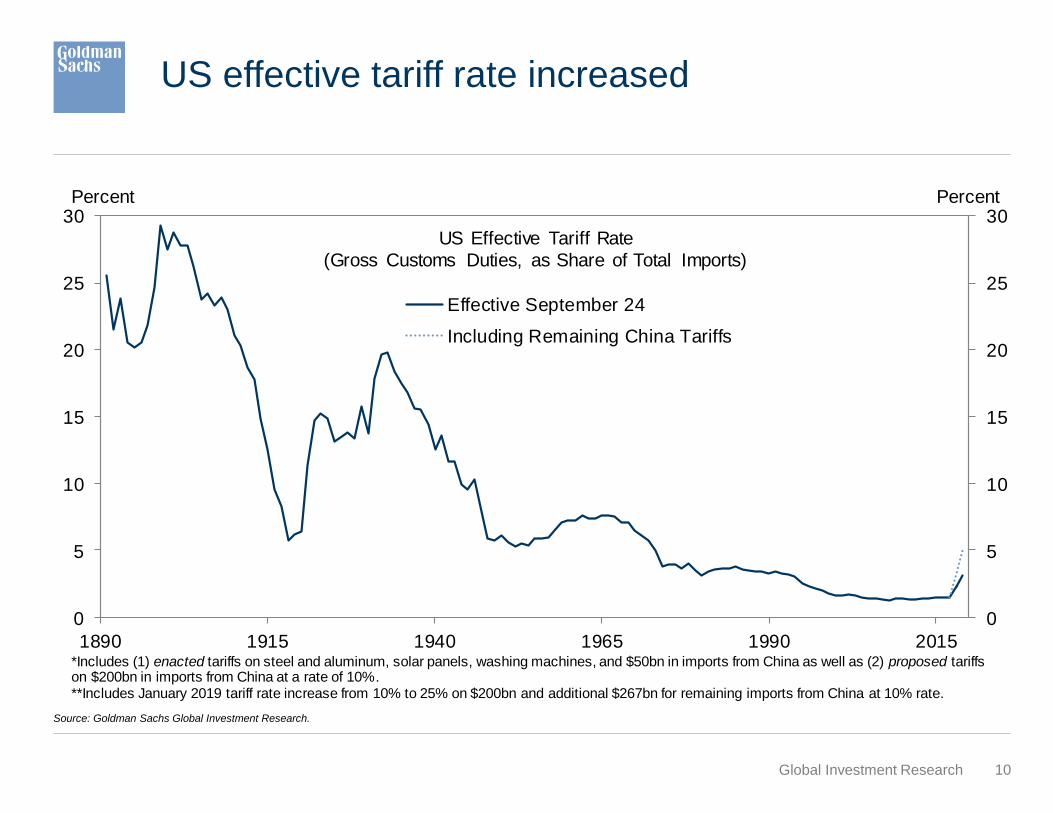
Source: Goldman Sachs Global Investment Research.
US effective tariff rate increased
0
5
10
15
20
25
30
0
5
10
15
20
25
30
1890 1915 1940 1965 1990 2015
Effective September 24
Including Remaining China Tariffs
US Effective Tariff Rate
(Gross Customs Duties, as Share of Total Imports)
Percent Percent
*Includes (1) enacted tariffs on steel and aluminum, solar panels, washing machines, and $50bn in imports from China as well as (2) proposed tariffson $200bn in imports from China at a rate of 10%.**Includes January 2019 tariff rate increase from 10% to 25% on $200bn and additional $267bn for remaining imports from China at 10% rate.

11 Global Investment Research
0:53:95
172:212:241
165:165:165
115:153:198
7:133:73
139:195:70
246:127:38
190:50:50
115:153:198 Hyperlink
Source: USITC, United Nations, WTO, Goldman Sachs Global Investment Research
Initial tariffs avoided consumer products
0
20
40
60
80
100
120
140
160
0
20
40
60
80
100
120
140
160
Tranche 1 - $34bn Tranche 2 - $16bn Next $200bn Remaining $267bn
Capital
Intermediate
Consumption
Billions of dollars Billions of dollars
US Imports From China by Broad Economic Category

12 Global Investment Research
0:53:95
172:212:241
165:165:165
115:153:198
7:133:73
139:195:70
246:127:38
190:50:50
115:153:198 Hyperlink
Source: USGS, Goldman Sachs Global Investment Research.
One can make a case for aluminum tariffs
0
10
20
30
40
50
60
70
80
90
100
0
10
20
30
40
50
60
70
80
90
100
%% Aluminum Smelter Capacity Utilization Rate in 2017
37%
11%
21%
33%
41%
53%
61%
0%
10%
20%
30%
40%
50%
60%
70%
0
500
1,000
1,500
2,000
2,500
2012 2013 2014 2015 2016 2017
ReliancektUS Aluminum Production and Import Reliance
Primary Aluminum Production Import Reliance (RHS)
13 Global Investment Research
0:53:95
172:212:241
165:165:165
115:153:198
7:133:73
139:195:70
246:127:38
190:50:50
115:153:198 Hyperlink
Source: Goldman Sachs Global Investment Research.
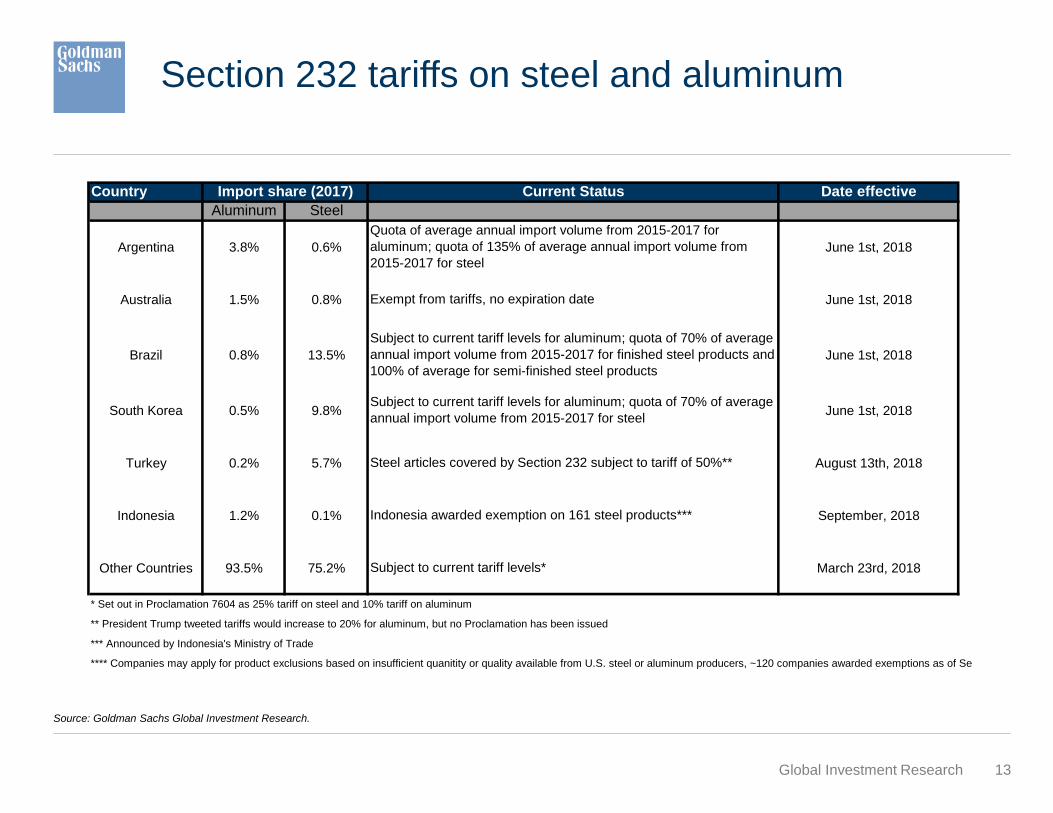
Section 232 tariffs on steel and aluminum
Country Current Status Date effective
Aluminum Steel
Argentina 3.8% 0.6% June 1st, 2018
Australia 1.5% 0.8% June 1st, 2018
Brazil 0.8% 13.5% June 1st, 2018
South Korea 0.5% 9.8% June 1st, 2018
Turkey 0.2% 5.7% August 13th, 2018
Indonesia 1.2% 0.1% September, 2018
Other Countries 93.5% 75.2% March 23rd, 2018
* Set out in Proclamation 7604 as 25% tariff on steel and 10% tariff on aluminum
** President Trump tweeted tariffs would increase to 20% for aluminum, but no Proclamation has been issued
*** Announced by Indonesia's Ministry of Trade
**** Companies may apply for product exclusions based on insufficient quanitity or quality available from U.S. steel or aluminum producers, ~120 companies awarded exemptions as of September
Indonesia awarded exemption on 161 steel products***
Subject to current tariff levels*
Import share (2017)
Quota of average annual import volume from 2015-2017 for
aluminum; quota of 135% of average annual import volume from
2015-2017 for steel
Exempt from tariffs, no expiration date
Subject to current tariff levels for aluminum; quota of 70% of average
annual import volume from 2015-2017 for finished steel products and
100% of average for semi-finished steel products
Subject to current tariff levels for aluminum; quota of 70% of average
annual import volume from 2015-2017 for steel
Steel articles covered by Section 232 subject to tariff of 50%**

14 Global Investment Research
0:53:95
172:212:241
165:165:165
115:153:198
7:133:73
139:195:70
246:127:38
190:50:50
115:153:198 Hyperlink
Source: Company Data, USGS, US Dept. of Commerce, Goldman Sachs Global Investment Research.
Trade is complicated

Our Views

16 Global Investment Research
0:53:95
172:212:241
165:165:165
115:153:198
7:133:73
139:195:70
246:127:38
190:50:50
115:153:198 Hyperlink
Tariffs redirect, not eliminate, trade flows
Source: CEIC, USDA, Goldman Sachs Global Investment Research.
The case of oil… … and the case of soybean

17 Global Investment Research
0:53:95
172:212:241
165:165:165
115:153:198
7:133:73
139:195:70
246:127:38
190:50:50
115:153:198 Hyperlink
The politics of US-China trade are different
Source: Pew Research. Goldman Sachs Global Investment Research.
-30
-20
-10
0
10
20
30
40
50
-30
-20
-10
0
10
20
30
40
50
1997 2000 2003 2006 2009 2012 2015 2018
Total
Republican
Democratic
Percentage points Percentage points
Share of public that views trade agreements as "agood thing" minus share that sees as "bad thing"
-60
-40
-20
0
20
40
60
80
-60
-40
-20
0
20
40
60
80
Canada EU Japan Mexico China
Republicans
Independents
Democrats
Trade with ____ is "fair" minus "unfair" (June 2018)
Percentage points Percentage points

18 Global Investment Research
0:53:95
172:212:241
165:165:165
115:153:198
7:133:73
139:195:70
246:127:38
190:50:50
115:153:198 Hyperlink
Prediction markets imply a divided congress
Source: PredictIt.. Goldman Sachs Global Investment Research.
0
10
20
30
40
50
60
70
80
90
100
0
10
20
30
40
50
60
70
80
90
100
Sep-2017 Nov-2017 Jan-2018 Mar-2018 May-2018 Jul-2018 Sep-2018 Nov-2018
Senate
House
Implied Probability Congressional Republicans Retain MajorityAs of October 12, 2018
Percent Percent

19 Global Investment Research
0:53:95
172:212:241
165:165:165
115:153:198
7:133:73
139:195:70
246:127:38
190:50:50
115:153:198 Hyperlink
For China, trade war is more than just trade war
Source: CEIC. Goldman Sachs Global Investment Research.

20
0:53:95
172:212:241
165:165:165
115:153:198
7:133:73
139:195:70
246:127:38
190:50:50
115:153:198 Hyperlink
Disclosure Appendix
October 12, 2018
Investors should consider this report as only a single factor in making their investment decision. For Reg AC certification and other important disclosures, see the Disclosure
Appendix, or go to www.gs.com/research/hedge.html.
21 Global Investment Research
0:53:95
172:212:241
165:165:165
115:153:198
7:133:73
139:195:70
246:127:38
190:50:50
115:153:198 Hyperlink
Reg AC
I, Hui Shan, hereby certify that all of the views expressed in this report accurately reflect our personal views, which have not been influenced by considerations of the firm's
business or client relationships.
Unless otherwise stated, the individuals listed on the cover page of this report are analysts in Goldman Sachs' Global Investment Research division.
Disclosures
Global product; distributing entities
The Global Investment Research Division of Goldman Sachs produces and distributes research products for clients of Goldman Sachs on a global basis. Analysts based in
Goldman Sachs offices around the world produce equity research on industries and companies, and research on macroeconomics, currencies, commodities and portfolio strategy.
This research is disseminated in Australia by Goldman Sachs Australia Pty Ltd (ABN 21 006 797 897); in Brazil by Goldman Sachs do Brasil Corretora de Títulos e Valores
Mobiliários S.A.; Ombudsman Goldman Sachs Brazil: 0800 727 5764 and / or [email protected]. Available Weekdays (except holidays), from 9am to 6pm.
Ouvidoria Goldman Sachs Brasil: 0800 727 5764 e/ou [email protected]. Horário de funcionamento: segunda-feira à sexta-feira (exceto feriados), das 9h às 18h;
in Canada by either Goldman Sachs Canada Inc. or Goldman Sachs & Co. LLC; in Hong Kong by Goldman Sachs (Asia) L.L.C.; in India by Goldman Sachs (India) Securities
Private Ltd.; in Japan by Goldman Sachs Japan Co., Ltd.; in the Republic of Korea by Goldman Sachs (Asia) L.L.C., Seoul Branch; in New Zealand by Goldman Sachs New
Zealand Limited; in Russia by OOO Goldman Sachs; in Singapore by Goldman Sachs (Singapore) Pte. (Company Number: 198602165W); and in the United States of America by
Goldman Sachs & Co. LLC. Goldman Sachs International has approved this research in connection with its distribution in the United Kingdom and European Union.
European Union: Goldman Sachs International authorised by the Prudential Regulation Authority and regulated by the Financial Conduct Authority and the Prudential Regulation
Authority, has approved this research in connection with its distribution in the European Union and United Kingdom; Goldman Sachs AG and Goldman Sachs International
Zweigniederlassung Frankfurt, regulated by the Bundesanstalt für Finanzdienstleistungsaufsicht, may also distribute research in Germany.
Disclosure Appendix

22 Global Investment Research
0:53:95
172:212:241
165:165:165
115:153:198
7:133:73
139:195:70
246:127:38
190:50:50
115:153:198 Hyperlink
General disclosures
This research is for our clients only. Other than disclosures relating to Goldman Sachs, this research is based on current public information that we consider reliable, but we do not
represent it is accurate or complete, and it should not be relied on as such. The information, opinions, estimates and forecasts contained herein are as of the date hereof and are
subject to change without prior notification. We seek to update our research as appropriate, but various regulations may prevent us from doing so. Other than certain industry
reports published on a periodic basis, the large majority of reports are published at irregular intervals as appropriate in the analyst's judgment.
Goldman Sachs conducts a global full-service, integrated investment banking, investment management, and brokerage business. We have investment banking and other business
relationships with a substantial percentage of the companies covered by our Global Investment Research Division. Goldman Sachs & Co. LLC, the United States broker dealer, is
a member of SIPC (http://www.sipc.org).
Our salespeople, traders, and other professionals may provide oral or written market commentary or trading strategies to our clients and principal trading desks that reflect opinions
that are contrary to the opinions expressed in this research. Our asset management area, principal trading desks and investing businesses may make investment decisions that
are inconsistent with the recommendations or views expressed in this research.
The analysts named in this report may have from time to time discussed with our clients, including Goldman Sachs salespersons and traders, or may discuss in this report, trading
strategies that reference catalysts or events that may have a near-term impact on the market price of the equity securities discussed in this report, which impact may be
directionally counter to the analysts' published price target expectations for such stocks. Any such trading strategies are distinct from and do not affect the analysts' fundamental
equity rating for such stocks, which rating reflects a stock's return potential relative to its coverage group as described herein.
We and our affiliates, officers, directors, and employees, excluding equity and credit analysts, will from time to time have long or short positions in, act as principal in, and buy or
sell, the securities or derivatives, if any, referred to in this research.
The views attributed to third party presenters at Goldman Sachs arranged conferences, including individuals from other parts of Goldman Sachs, do not necessarily reflect those of
Global Investment Research and are not an official view of Goldman Sachs.
Any third party referenced herein, including any salespeople, traders and other professionals or members of their household, may have positions in the products mentioned that are
inconsistent with the views expressed by analysts named in this report.
This research is not an offer to sell or the solicitation of an offer to buy any security in any jurisdiction where such an offer or solicitation would be illegal. It does not constitute a
personal recommendation or take into account the particular investment objectives, financial situations, or needs of individual clients. Clients should consider whether any advice or
recommendation in this research is suitable for their particular circumstances and, if appropriate, seek professional advice, including tax advice. The price and value of investments
referred to in this research and the income from them may fluctuate. Past performance is not a guide to future performance, future returns are not guaranteed, and a loss of original
capital may occur. Fluctuations in exchange rates could have adverse effects on the value or price of, or income derived from, certain investments.
Certain transactions, including those involving futures, options, and other derivatives, give rise to substantial risk and are not suitable for all investors. Investors should review
current options disclosure documents which are available from Goldman Sachs sales representatives or at http://www.theocc.com/about/publications/character-risks.jsp.
Transaction costs may be significant in option strategies calling for multiple purchase and sales of options such as spreads. Supporting documentation will be supplied upon
request.
Disclosure Appendix

23 Global Investment Research
0:53:95
172:212:241
165:165:165
115:153:198
7:133:73
139:195:70
246:127:38
190:50:50
115:153:198 Hyperlink
Disclosure Appendix
Differing Levels of Service provided by Global Investment Research: The level and types of services provided to you by the Global Investment Research division of GS may
vary as compared to that provided to internal and other external clients of GS, depending on various factors including your individual preferences as to the frequency and manner
of receiving communication, your risk profile and investment focus and perspective (e.g., marketwide, sector specific, long term, short term), the size and scope of your overall
client relationship with GS, and legal and regulatory constraints. As an example, certain clients may request to receive notifications when research on specific securities is
published, and certain clients may request that specific data underlying analysts' fundamental analysis available on our internal client websites be delivered to them electronically
through data feeds or otherwise. No change to an analyst's fundamental research views (e.g., ratings, price targets, or material changes to earnings estimates for equity
securities), will be communicated to any client prior to inclusion of such information in a research report broadly disseminated through electronic publication to our internal client
websites or through other means, as necessary, to all clients who are entitled to receive such reports.
All research reports are disseminated and available to all clients simultaneously through electronic publication to our internal client websites. Not all research content is
redistributed to our clients or available to third-party aggregators, nor is Goldman Sachs responsible for the redistribution of our research by third party aggregators. For research,
models or other data related to one or more securities, markets or asset classes (including related services) that may be available to you, please contact your GS representative
or go to http://360.gs.com.
Disclosure information is also available at http://www.gs.com/research/hedge.html or from Research Compliance, 200 West Street, New York, NY 10282.
© 2018 Goldman Sachs.
No part of this material may be (i) copied, photocopied or duplicated in any form by any means or (ii) redistributed without the prior written consent of The Goldman
Sachs Group, Inc.