Embed Size (px)
Citation preview
TRADE UNION MEMBERSHIP 2017 STATISTICAL BULLETIN
May 2018

Contents
Introduction _________________________________________________________ 2
Key findings _________________________________________________________ 4
1. Long Term and Recent Trends ________________________________________ 5
2. Private and Public Sectors ____________________________________________ 12
3. Personal and job characteristics _______________________________________ 15
4. Country and Regional Trends _________________________________________ 17
Tables ______________________________________________________________ 22
1. Long term trends ______________________________________________ 22
2. Private and Public Sectors _______________________________________ 37
3. Personal and job characteristics ___________________________________ 44
4. Country and Regional Trends _____________________________________ 46
Annex: Technical Note _________________________________________________ 49
Annual National Statistic reports _________________________________________ 58

Trade Union Membership 2017: Statistical Bulletin
2
Introduction
The Department for Business, Energy and Industrial Strategy is responsible for publishing the National Statistics on trade union membership.
An annual question on trade union membership was introduced into the Labour Force Survey (LFS) in 1989 and it has been asked in the fourth quarter (Q4) every year since 1992. Questions on trade union presence were added in 1993, and the question on collective agreements between an employer and a trade union was introduced in 1996. The LFS trade union questions have United Kingdom coverage from 1995 onwards.
Trade Union Membership statistics have been produced as an annual National Statistics bulletin since 2004. This bulletin succeeded the annual article in the Office for National Statistics journal Labour Market Trends. It contains annual estimates of trade union membership from the Labour Force Survey up to the fourth quarter of 2017 (October to December 2017).
Official government statistics on trade union membership have been collected on a regular basis since 1892 from administrative records. These statistics are presented in Table 1.1 and have a greater coverage than the population of employees reported elsewhere in the report, with statistics since 1974 provided by the Certification Officer (see technical note).
This bulletin presents estimates on the proportion (density) of employees who are trade union members, and the proportion whose pay and conditions are directly affected by collective agreements as reported by employees. These estimates are also presented by age, gender, ethnicity, income, major occupation, industry, full and part-time employment, sector, nation and region. Industrial sectors are presented based on Standard Industrial Classification 2007. The occupations figures from 2011 onwards are based on the new Standard Occupational Classification 2010 (SOC2010), which has replaced the previous version, SOC2000, in LFS datasets from 2011. Some estimates for those in employment, which includes the self-employed, are provided in Chapter 1.
We have revised our estimates of trade union presence (the percentage of employees that are based in a workplace where there are union members), after re-considering the calculation used to derive the estimates. The revised approach has produced rates of union presence higher by around 7.9 percentage points on average since 1999. More details of the change are contained in the technical annex.
The data behind this bulletin are available in the accompanying Excel spreadsheet.
About Labour Market Analysis
Labour Market Analysis is a multi-disciplinary team of economists, social researchers and statisticians based in the Labour Market Directorate of the Department for Business, Energy and Industrial Strategy. Members of the team are responsible for producing this bulletin.
Statistical contacts
If you have any feedback or questions about this statistical bulletin, please contact: [email protected] or [email protected].

Trade Union Membership 2017: Statistical Bulletin
3
Code of Practice for Official Statistics
National Statistics are produced to high professional standards set out in the Code of Practice for Official Statistics. They undergo regular quality assurance reviews to ensure that they meet customer needs. They are produced free from any political interference.
The UK Statistics Authority has designated these statistics as National Statistics, in accordance with the Statistics and Registration Service Act 2007 and signifying compliance with the Code of Practice for Official Statistics.
Designation can be broadly interpreted to mean that the statistics:
• Meet identified user needs; • Are well explained and readily accessible; • Are produced according to sound methods, and • Are managed impartially and objectively in the public interest.
Once statistics have been designated as National Statistics it is a statutory requirement that the Code of Practice shall continue to be observed.
Conventions
The statistics presented in this bulletin are based on fourth quarter estimates (October to December) from the Labour Force Survey unless otherwise specified. Members of the armed forces are excluded from analysis. All tables and charts relate to employees (population aged 16 or over in paid employment) in the United Kingdom with the exception of those specified in Chapter 1 (Long Term Trends).
Estimates are presented for those in employment. This is defined as the population aged 16 or over in paid employment (employees) in addition to those in self-employment or government employment & training programmes. Unpaid family workers are excluded from the population in employment in this bulletin.
More detailed information on the concepts, methods, and quality of data used in this bulletin is available in the technical note.
Symbols
The following symbols are used:
* sample size too small for a reliable estimate
- data not available
Weighting
This publication uses the latest available Labour Force Survey weights for each year for its statistics. For the datasets for the years 2012 to 2017, the latest available weights are the 2017 weights.

Trade Union Membership 2017: Statistical Bulletin
4
Key findings
1. Trade Union Membership: Long term and recent trends
Around 6.2 million employees in the UK were trade union members in 2017. The level of overall union members slightly increased by 19,000 over the year from 2016 (a 0.3% increase). Current membership levels are well below the peak of over 13 million in 1979.
Alongside the marginal rise in trade union membership levels, there was a sharper increase in the number of UK employees between 2016 and 2017. As a result, the proportion of employees who were trade union members fell to 23.2% in 2017, from 23.5% in 2016. This is the lowest rate of trade union membership recorded since 1995. Over this period, the proportion of employees who were trade union members in the UK has decreased 9.2 percentage points, from 32.4% in 1995.
Female employees are more likely to be a trade union member. The proportion of female employees who were in a trade union was around 25.6% in 2017, compared with 20.9% for male employees.
A higher proportion of UK born employees in the UK were in a trade union compared with non-UK born employees. About 24.6% of UK born employees were in a trade union in 2017, compared with 16.3% for non-UK born employees.
2. Trade union membership: Public and private sectors
Union membership levels in the private sector were around 2.7 million, an increase of 70,000 since 2016. The proportion of trade union members amongst private sector employees rose slightly from 13.4% to 13.5%.
In the public sector, union membership levels fell by 51,000 to 3.54 million in 2017. Trade union density in the public sector fell from 52.7% to 51.8% in 2017.
3. Trade union membership: Personal and job characteristics
Older workers account for a larger proportion of union members than younger workers. About 39.8% of trade union member employees were aged over 50 in 2017, but 28.8% of employees are in this age group. The proportion of trade union members aged below 50 has fallen since 1995, whilst the proportion aged above 50 has increased.
Employees in professional occupations were more likely to be trade union members than other employees. Employees in the professional occupations account for 37.9% of union members, but only 20.8% of employees in the UK worked in these occupations.

Trade Union Membership 2017: Statistical Bulletin
5
1. Long Term and Recent Trends
Trade union membership levels reached their peak in 1979 and declined sharply through the 1980s and early 1990s before stabilising from the mid-1990s to the mid-2000s. After falling during the recession and years following, the trade union membership levels among employees again stabilised between 2011 and 2015, before falling again in 2016. From 2016 to 2017 trade union membership levels increased only marginally. Despite the broad stability in membership levels between 1995 and 2007, and 2011 to 2015, the proportion of UK employees who were in the trade union declined because union membership levels did not keep pace with the increase in the total number of UK employees. These declines were exacerbated by falls in union membership levels between 2007 and 2011 and in 2016.
Trade union membership levels stabilised between 2016 and 2017
The number of employees who were trade union members in 2017 was 6.235 million, 19 thousand more than in 2016 (a 0.3% increase). However, given stronger growth in the total number of people in employment, the proportion of employees who are trade union members fell to 23.2% in 2017 (a 0.3 percentage point decrease from 23.5% in 2016).
Private sector memberships increase whilst public sector memberships decrease
Private sector memberships increased by 70,000 in 2017, following a decrease of similar scale in the previous year. Meanwhile the downward trend in trade union numbers in the public sector, which started in 2010, continued again with membership levels falling slightly by 51,000 in 2017. It remains true that the overall proportion of employees who are trade union members is much lower in the private sector (13.5%) than the public sector (51.8%).

Trade Union Membership 2017: Statistical Bulletin
6
Chart 1: Trade union membership levels in UK from 1892 to 2017
Membership, Thousands Source: Historic data is administrative data from Department for Employment (1892-1973); and the Certification Office (1974-2016).
Data on UK employees that are trade union members is based on the Labour Force Survey, Office
for National Statistics
Chart 2: Trade union membership levels in UK from 1995 to 2017
Membership, Thousands Source: Historic data is administrative data from Department for Employment (1892-1973); and the Certification Office (1974-2015).
Data on UK employees that are trade union members is based on the Labour Force Survey, Office
for National Statistics
0
2,000
4,000
6,000
8,000
10,000
12,000
14,000
189
2
189
8
190
4
191
0
191
6
192
2
192
8
193
4
194
0
194
6
195
2
195
8
196
4
197
0
197
5
198
1
198
7
199
3
199
9
200
5
201
1
201
7
Historic/Certification Officer data
trade union members that areemployees, UK
trade union members that areemployees, GB
5,000
5,500
6,000
6,500
7,000
7,500
8,000
8,500
199
5
199
6
199
7
199
8
199
9
200
0
200
1
200
2
200
3
200
4
200
5
200
6
200
7
200
8
200
9
201
0
201
1
201
2
201
3
201
4
201
5
201
6
201
7
Historic/Certification Officer data
trade union members that areemployees, UK

Trade Union Membership 2017: Statistical Bulletin
7
Female and male union membership rates fell again.
At 20.9%, the proportion of male employees who were in a trade union was the lowest in the data series that started in 1995. The proportion of female employees also fell this year to 25.6%. Male membership levels increased slightly by 1% in 2017. The number of female trade union members decreased by 10,000 (-0.3%) and is now at its lowest level since 2001. Despite the fall in 2017, the relative declines in the proportion of employees who are in a trade union since 1995 have been much weaker for women. In 1995, the proportion of male employees who belonged to a trade union was around 35%, compared with just below 30% for female employees. High falls in union membership among males steadily narrowed the gap between males and females. In 2002, the proportion of employees who belonged to a trade union was around 29% for both genders.
The trend continued between 2002 and 2017, with union membership among male employees falling by 7.8 percentage points from 28.7% in 2002 to 20.9% in 2017. Until 2016 there has been relative stability in the rate for females, however, union membership among female employees has fallen by 3.4 percentage points since 2002. From the noticeable decline last year, the female union membership rate stayed low and fell further from 25.9% in 2016 to 25.6% in 2017.
Chart 3: Employee trade union density by gender, 1995 to 2017
Per cent of UK employees who are trade union-members
Source: Labour Force Survey, Office for National Statistics
0.0%
5.0%
10.0%
15.0%
20.0%
25.0%
30.0%
35.0%
40.0%
All employees Male Female

Trade Union Membership 2017: Statistical Bulletin
8
UK born and Black ethnic group employees are more likely to be union members
A higher proportion of UK born employees are in a trade union compared with non-UK born employees. About 24.6% of UK born employees were in a trade union in 2017, compared with 16.3% for non-UK born employees (Table 1.5).
The proportion of employees who were trade union members was highest in the Black or Black British ethnic group at around 24.1% in 2017 (2.3 percentage points lower than in 2016), followed by the White ethnic group at 23.8%. The proportion of trade union members amongst employees in Mixed, Asian or Asian British and Chinese/other ethnic groups was lower, at 20.4%, 18.8% and 11.5% respectively.
Higher proportions of female employees belonged to a trade union than males in all the ethnic groups. The largest difference was within the Mixed ethnic group in 2017, where the proportion of female employees who belonged to a trade union was around 23.7%, compared with around 16.7% for male employees (Table 1.5).
Chart 4: Trade union density by gender and ethnicity, 2017
Per cent of UK employees who are trade union-members
Source: Labour Force Survey, Office for National Statistics
0.0
5.0
10.0
15.0
20.0
25.0
30.0
White Mixed Asian or AsianBritish
Black or BlackBritish
Chinese or otherethnic group
All employees Male Female

Trade Union Membership 2017: Statistical Bulletin
9
Highly educated employees are more likely to be union members
The proportion of employees who were trade union members was greater for people with a higher qualification, such as a degree, compared with those with lower level qualifications, or no qualifications.
About 28.7% of employees with a degree or equivalent, and 30.6% with some other Higher Education qualification were in a trade union, compared with just 14.8% of employees without formal qualifications (Table 1.5).
Employees in larger workplaces are more likely to be member of a trade union
Employees who worked in larger workplaces (with 50 or more staff) were more likely to be in a trade union and were more likely to have a trade union present in the workplace. Employees in larger workplaces were also more likely to have their pay directly affected by a collective agreement between their employer and a trade union (Table 1.10).
The method for calculating estimates of trade union presence in the workplace has been revised. See the technical annex for details.
The proportion of employees who belonged to a trade union in larger workplaces was 31% in 2017 (0.5 percentage points lower than in 2016), compared with 14.4% in the workplaces with less than 50 employees (0.2 percentage points lower than in 2016). Around 65% of employees in larger workplaces reported that a trade union was present in their workplace. This compares with 29% of employees in workplaces of less than 50 employees reporting the presence of a trade union in their workplace. The proportion of employees who had their pay directly affected by a collective agreement between their employer and a union was around 36.6% in larger workplaces, compared with 14% in workplaces with less than 50 employees (Table 1.10).
Employees are more likely to have their pay directly affected by collective agreements between their employer and a union if they work in ‘public administration and defence’ compared with the other sectors, in Northern Ireland compared to the other nations, and in the North East compared to the other regions (Table 1.10).
Employees are more likely to be trade union members in permanent jobs and full-time jobs
Permanent employees were more likely than those in temporary jobs to be union members in most occupations. The proportion of permanent employees who were trade union members was 23.9% in 2017, compared with 13.1% for temporary employees (Table 1.4).
Full-time employees were also more likely than those in part-time work to be union members; 24.7% of full-time employees are in trade unions, compared to 19.1% of part-time employees. (Table 1.4).
The majority of union member employees worked full-time (78.5%), compared with 74.3% of
all employees (Table 3.1).

Trade Union Membership 2017: Statistical Bulletin
10
Middle-income earners are more likely to be trade union members
Middle-income earners were more likely to be trade union members than either high or low paid employees. About 33.7% of employees who earned between £500 and £999 per week were members of a trade union, compared with 20% of employees earning £1,000 or more per week. The proportion of employees earning less than £250 per week who were trade union members was 11.3% (Table 1.5).
Employees in professional occupations are more likely to be trade union members
Employees in professional occupations were more likely to be trade union members than employees in other occupations. Employees in the professional occupations account for 37.9% of all union members, but only 20.8% of all employees in the UK worked in this sector (Table 3.1)
The proportion of employees who were trade union members was 41.4% within the professional occupations sector, compared with 11.9% in the ‘managers, directors and senior officials’ occupation. The proportion of trade union members in professional occupations is similar to recent years despite the change in Standard Occupational Classification in 2011. The new classification, among other changes, moved nurses and midwives, and therapy professionals, both relatively highly unionised occupations, into the professional group, from ‘associate professional and technical’. This partly accounts for the 19 percentage point decrease in associate professional and technical occupations, from about 40.2% in 2010 to 21.1% in 2017 (Tables 1.7a and 1.7b).
Despite generally being more likely to be a union member than male employees, females were only represented in higher proportions in three of the nine occupation groups: ‘professional occupations’, ‘managers, directors and senior officials’ and ‘administrative and secretarial occupations’ (Table 1.4).
Chart 5: Trade union density by gender and occupation, 2017
Per cent of UK employees who are trade union-members
Source: Labour Force Survey, Office for National Statistics
0.0
10.0
20.0
30.0
40.0
50.0
60.0
Managers, Directors AndSenior Officials
Associate ProfessionalAnd TechnicalOccupations
Skilled TradesOccupations
Sales And CustomerService Occupations
Elementary Occupations
Male Female All employees

Trade Union Membership 2017: Statistical Bulletin
11
Employees in public sector and utility industries more likely to be in a trade union
The likelihood of belonging to a trade union varies substantially by sector. Employees in industries with higher proportions of public sector workers are more likely to belong to trade unions, including the ‘public administration and defence’ and ‘education’ industries.
The rate of union membership in manufacturing, which has traditionally been seen as a high union membership industry, has fallen substantially in recent years and now has a below average proportion of trade union members. Density has fallen by more than 15 percentage points, from 32.8% in 1995 to 17.6% in 2017.
As in previous years, ‘education’ was the sector with the highest proportions of trade union members with 48.1% of employees being union members. The proportion of employees in trade unions in ‘electricity, gas, steam and air conditioning supply’ sector reverted to previous levels after its drop to 32.6% in 2016. Accommodation and food services had the lowest at 2.9% (Table 1.8).
Chart 6: Trade union density by industry, 2017
Per cent of UK employees who are trade union-members
Source: Labour Force Survey, Office for National Statistics
0% 10% 20% 30% 40% 50% 60%
Accommodation and food service activities
Professional, scientific and technical activities
Real estate activities
Information and communication
Administrative and support service activities
Construction
Other service activities
Wholesale and retail trade; repair of motor vehicles and motorcycles
Financial and insurance activities
Arts, entertainment and recreation
Mining and quarrying
Manufacturing
All employees
Water supply, sewerage, waste management and remediation activities
Transportation and storage
Human health and social work activities
Public administration and defence; compulsory social security
Electricity, gas, steam and air conditioning supply
Education

Trade Union Membership 2017: Statistical Bulletin
12
2. Private and Public Sectors
In 2017, public sector union membership fell to its lowest level during the period 1995 to 2017, continuing the broadly downward trend in public sector membership levels since 2010. There was a 563,000 fall in the public sector membership level between 2010 and 2017. During this period, private sector membership levels have generally risen, increasing by 209,000 from 2010 to 2017.
This contrasted with the previous decade, when public sector union membership accounted for an increasing proportion of overall union membership in the period up to 2010. This was driven by a steady rise in the public sector membership in the 2000s up to 2005 and stability until 2010. The overall public sector membership level grew between 1995 and 2010 by 381,000. Over the same period, private sector union membership levels declined by 905,000.
Chart 7: Trade union membership levels by sector, 1995 to 2017
Membership, Thousands
Source: Labour Force Survey, Office for National Statistics.
In 2017, around 3.5 million public sector employees belonged to a union in the UK, 51,000 less than in 2016. The rate of trade union membership in the public sector fell from 52.7% in 2016 to 51.8% in 2017. In the private sector, there were 2.7 million members, an increase of 70,000 since 2016. The proportion of trade union members amongst private sector employees rose slightly from 13.4% to 13.5%. (Tables 2.1a, 2.1b and 2.2).
0
500
1,000
1,500
2,000
2,500
3,000
3,500
4,000
4,500
19
95
19
96
19
97
19
98
19
99
20
00
20
01
20
02
20
03
20
04
20
05
20
06
20
07
20
08
20
09
20
10
20
11
20
12
20
13
20
14
20
15
20
16
20
17
Private Sector Public Sector

Trade Union Membership 2017: Statistical Bulletin
13
Chart 8: Employee composition by trade union membership and sector, 1995 , 2010 and 2017
Membership, thousands
Source: Labour Force Survey, Office for National Statistics
Chart 9: Trends in trade union densities by sector, 1995-2017
Per cent of sectors who are trade union members
Source: Labour Force Survey, Office for National Statistics
3,391 2,486 2,695
12,465 15,24917,589
3,7224,103
3,5402,349
3,1983,316
0
5,000
10,000
15,000
20,000
25,000
30,000
1995 2010 2017
TU membership Private sector TU non-membership Private sector
Tu membership public sector TU non-membership pubic sector
0.0%
10.0%
20.0%
30.0%
40.0%
50.0%
60.0%
70.0%
19
95
19
96
19
97
19
98
19
99
20
00
20
01
20
02
20
03
20
04
20
05
20
06
20
07
20
08
20
09
20
10
20
11
20
12
20
13
20
14
20
15
20
16
20
17
All employees Private Sector Public Sector

Trade Union Membership 2017: Statistical Bulletin
14
The trade union wage gap remained unchanged
The trade union wage gap, defined as the percentage difference in average gross hourly earnings of union members compared with non-members, rose sharply from 14.5% in 2016 to 16.9% in 2017, in the public sector. The private sector trade union wage gap is 7.1% in 2017, down only slightly from 7.6% in 2016.
For the public sector this amounts to a 2.4 percentage points increase when compared with 2016. A number of factors influence this figure, and the size of the premium is likely to be strongly influenced by other differences in the characteristics of unionised and non-unionised employees. It should also be noted that where pay is determined by collective agreements, these are likely to apply to both unionised and non-unionised employees in the bargaining unit (Table 2.3).

Trade Union Membership 2017: Statistical Bulletin
15
3. Personal and job characteristics
Female employees are more likely to be a trade union member
As noted previously, female employees are more likely to be a trade union member. 54.6% of employee union members were female in 2017, up from 45% in 1995. The proportion of female employees who were in a trade union was around 25.6% in 2017, slightly down from 25.9% in 2016. In comparison, 20.9% of male employees were in a trade union in 2017, down from 21.1% in 2016 (Table 1.2b).
Trade union members are increasingly older employees
Older workers account for a larger proportion of union members than younger workers. About 39.8% of trade union member employees were aged over 50 in 2017, but 28.8% of employees are in this age group (Table 3.1). The proportion of trade union members aged below 50 has fallen since 1995, whilst the proportion aged above 50 has increased.
Those employees with ten or more years of service make up about 51.5% of all union members but only 30.7% of all employees (Table 3.1).
Chart 10: Age of trade union members, 1995 and 2017
Per cent
Source: Labour Force Survey, Office for National Statistics
0
5
10
15
20
25
30
35
40
45
50
16 to 24 25 to 34 35 to 49 50 plus
1995 2017

Trade Union Membership 2017: Statistical Bulletin
16
Employees with a disability are more likely to be union members
The proportion of employees who were trade union members was higher for those classified as having a disability, 26.6%, than those without a disability, 22.7% (Table 1.5).
Employees who have a disability made up an increasing amount of all trade union members in 2017, at 16.4%, slightly higher than the 14% of all employees in the UK who have a disability (Table 3.1).
Trade Union Membership 2017: Statistical Bulletin
17
4. Country and Regional Trends
Employees in the northern regions of England more likely to be trade union members
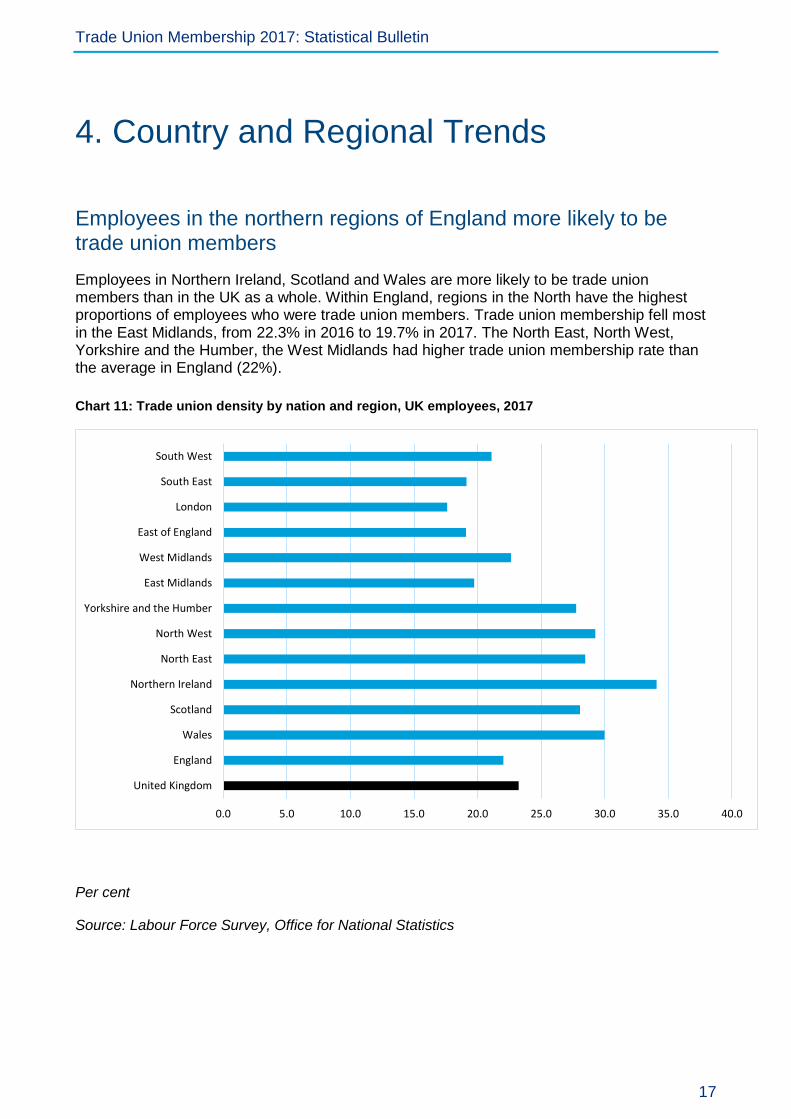
Employees in Northern Ireland, Scotland and Wales are more likely to be trade union members than in the UK as a whole. Within England, regions in the North have the highest proportions of employees who were trade union members. Trade union membership fell most in the East Midlands, from 22.3% in 2016 to 19.7% in 2017. The North East, North West, Yorkshire and the Humber, the West Midlands had higher trade union membership rate than the average in England (22%).
Chart 11: Trade union density by nation and region, UK employees, 2017
Per cent
Source: Labour Force Survey, Office for National Statistics
0.0 5.0 10.0 15.0 20.0 25.0 30.0 35.0 40.0
United Kingdom
England
Wales
Scotland
Northern Ireland
North East
North West
Yorkshire and the Humber
East Midlands
West Midlands
East of England
London
South East
South West
Trade Union Membership 2017: Statistical Bulletin
18
Membership levels down since 1995 in England, Scotland, Wales and Northern Ireland
Trade union membership levels in England decreased by around 678,000 between 1995 and 2017, compared with a 137,000 decrease in Scotland and an 82,000 reduction in Wales. Compared to the previous year, trade union membership in Wales has fallen by 16.6%, marking the sharpest decrease amongst all nations. On the other hand, trade union membership increased in Northern Ireland by 19,000 between 1995 and 2017 (Table 4.2).
Trade union membership as proportion of employees in fell by 5.5 percentage points in Wales and by 1.2 percentage points in Scotland between 2016 and 2017. On the other hand, trade union membership as proportion of employees rose by 5 percentage points in Northern Ireland and remained stable in England.
Between 1995 and 2017, the proportion of employees who were in a trade union has decreased by 8.8 percentage points in England, and 10.9 percentage points in Scotland, driven by growth in employee numbers and falling union membership.

Trade Union Membership 2017: Statistical Bulletin
19
Chart 12 shows the proportion of employees who were in a trade union across 20 geographical regions of the UK in 2017. The highest rate was 38.9% in Merseyside, whilst the lowest was 13.8% in Inner London (Table 4.3).
Chart 12: Trade union membership as a proportion of employees, by region, UK employees, 2017
Source: Labour Force Survey, Office for National Statistics Contains Ordnance Survey data © Crown copyright and database right 2017
Trade Union Membership 2017: Statistical Bulletin
20
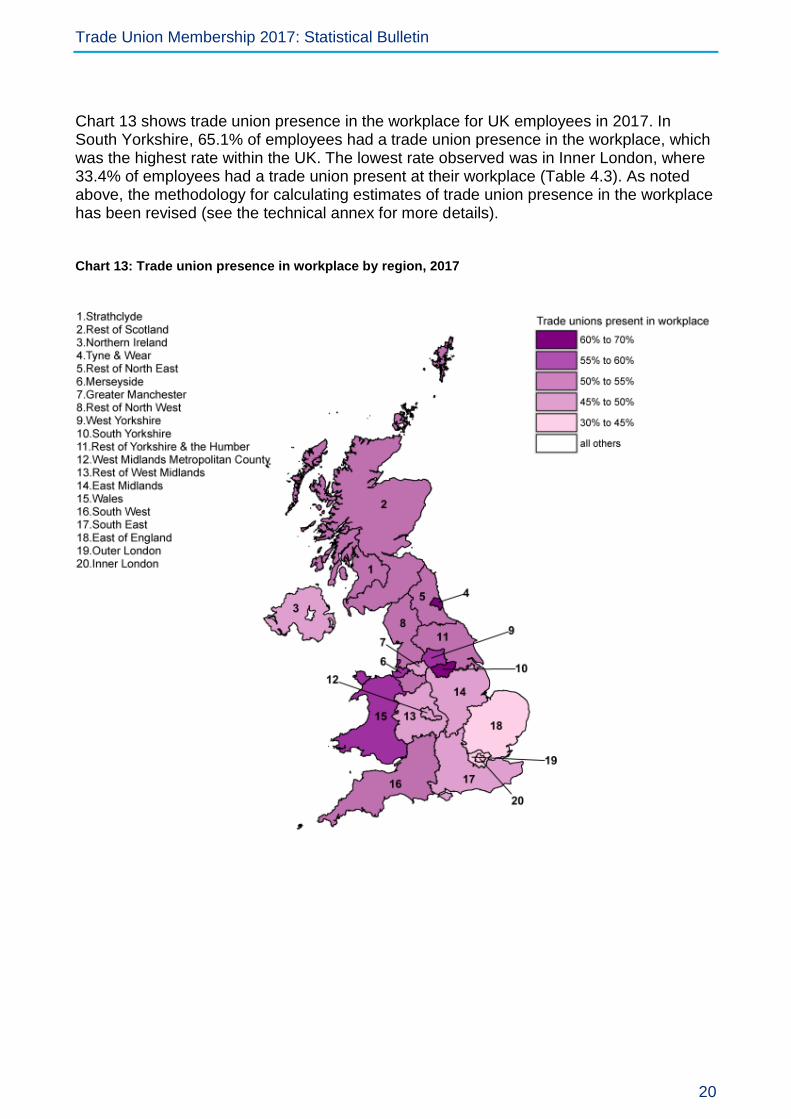
Chart 13 shows trade union presence in the workplace for UK employees in 2017. In South Yorkshire, 65.1% of employees had a trade union presence in the workplace, which was the highest rate within the UK. The lowest rate observed was in Inner London, where 33.4% of employees had a trade union present at their workplace (Table 4.3). As noted above, the methodology for calculating estimates of trade union presence in the workplace has been revised (see the technical annex for more details).
Chart 13: Trade union presence in workplace by region, 2017

Trade Union Membership 2017: Statistical Bulletin
21
Chart 14 shows coverage of collective agreements between their employer and a union that affect an employee’s pay and conditions in 2017. This shows that Northern Ireland had the highest proportion of employees covered at 43.3%. Inner London again had the lowest coverage at 14.8% (Table 4.3).
Chart 14: Collective agreement coverage by region, 2017

Trade Union Membership 2017: Statistical Bulletin
22
Tables
1. Long term trends
Table 1.1: Trade union membership, Unions registered listed or scheduled in Great Britain1, 1892 to 2015-16
Thousands
Trade union
members Trade union
members Trade union
members 1892 1,576 1930 4,842 1975 11,656 1893 1,559 1931 4,624 1976 12,133 1894 1,530 1932 4,444 1977 12,719 1895 1,504 1933 4,392 1978 13,054 1896 1,608 1934 4,590 1979 13,212 1897 1,731 1935 4,867 1980 12,636 1898 1,752 1936 5,295 1981 12,311 1899 1,911 1937 5,842 1982 11,744 1900 2,022 1938 6,053 1983 11,300 1901 2,025 1939 6,298 1984 10,774 1902 2,013 1940 6,613 1985 10,819 1903 1,994 1941 7,165 1986 10,598 1904 1,967 1942 7,867 1987 10,480 1905 1,997 1943 8,174 1988 10,387 1906 2,210 1944 8,087 1989 10,044 1907 2,513 1945 7,875 1990 9,810 1908 2,485 1946 8,803 1991 9,489 1909 2,477 1947 9,145 1992 8,929 1910 2,565 1948 9,362 1993 8,666 1911 3,139 1949 9,318 1994 8,231 1912 3,416 1950 9,289 1995 8,031 1913 4,135 1951 9,535 1996 7,938 1914 4,145 1952 9,588 1997 7,801 1915 4,359 1953 9,527 1998 7,852 1916 4,644 1954 9,566 1999-2000 7,898 1917 5,499 1955 9,741 2000-2001 7,779 1918 6,533 1956 9,778 2001-2002 7,751 1919 7,926 1957 9,829 2002-2003 7,736 1920 8,348 1958 9,639 2003-2004 7,559 1921 6,633 1959 9,623 2004-2005 7,473 1922 5,625 1960 9,835 2005-2006 7,603 1923 5,429 1961 9,916 2006-2007 7,628 1924 5,544 1962 10,014 2007-2008 7,656 1925 5,506 1963 10,067 2008-2009 7,388 1926 5,219 1964 10,218 2009-2010 7,329 1927 4,919 1965 10,325 2010-2011 7,261 1928 4,806 1966 10,259 2011-2012 7,197 1929 4,858 1967 10,191 2012-2013 7,086 1930 4,842 1968 10,193 2013-2014 7,011 1931 4,624 1969 10,472 2014-2015 6,949 1932 4,444 1970 11,179 2015-2016 6,865 1933 4,392 1971 11,128 1934 4,590 1972 11,350 1935 4,867 1973 11,444 1936 5,295 1974 11,755 1937 5,842 1974 11,044
Source: Department of Employment Statistics Division (1892-1974); Certification Office (1974-2016); 1 From 1974 these statistics show the membership numbers of trade unions listed or scheduled by the Certification Officer (these include some members in countries outside of the UK).

Trade Union Membership 2017: Statistical Bulletin
23
Table 1.2a: Trade union membership levels, employees, 1989 to 2017
Thousands
United Kingdom Great Britain
All employees Male Female All employees
1989 - - - 8,700
1990 - - - 8,577
1991 - - - 8,310
1992 - - - 6,980
1993 - - - 7,004
1994 - - - 7,083
1995 7,113 3,922 3,191 6,895
1996 6,961 3,766 3,195 6,745
1997 6,900 3,723 3,177 6,689
1998 6,932 3,717 3,214 6,695
1999 6,978 3,748 3,231 6,762
2000 7,119 3,752 3,367 6,891
2001 7,044 3,691 3,353 6,800
2002 7,030 3,606 3,423 6,773
2003 7,119 3,611 3,508 6,886
2004 7,080 3,572 3,508 6,834
2005 7,083 3,486 3,597 6,829
2006 7,059 3,445 3,614 6,803
2007 7,051 3,394 3,657 6,792
2008 6,928 3,293 3,636 6,695
2009 6,770 3,134 3,636 6,514
2010 6,589 2,989 3,600 6,362
2011 6,447 2,931 3,516 6,220
2012 6,508 2,951 3,556 6,264
2013 6,490 2,933 3,557 6,253
2014 6,458 2,901 3,557 6,218
2015 6,491 2,899 3,592 6,251
2016 6,216 2,818 3,398 6,017
2017 6,235 2,847 3,388 5,998
Table Notes: 1. Membership levels are based on the methodology described in the technical note 2. There was a small data issue with the LFS questionnaire in Northern Ireland in 1997 causing an undercount of up to 10,000 union members or 0.1 percentage points (see technical note for an explanation)
Table Source: Labour Force Survey, Office for National Statistics

Trade Union Membership 2017: Statistical Bulletin
24
Table 1.2b: Trade union membership as a proportion of employees, 1989 to 2017
Per cent, not seasonally adjusted
United Kingdom Great Britain
All employees Male Female All employees
1989 - - - 38.6 1990 - - - 37.8 1991 - - - 37.2 1992 - - - 36.2 1993 - - - 35.3 1994 - - - 33.8 1995 32.4 35.0 29.7 32.2 1996 31.4 33.3 29.5 31.2 1997 30.7 32.1 29.3 30.2 1998 29.9 31.2 28.6 29.7 1999 29.7 30.9 28.4 29.5 2000 29.8 30.4 29.1 29.5 2001 29.3 29.9 28.6 29.0 2002 28.8 28.7 29.0 28.5 2003 29.3 29.1 29.6 29.1 2004 28.8 28.5 29.2 28.5 2005 28.6 27.7 29.6 28.3 2006 28.3 27.1 29.6 28.0 2007 28.0 26.5 29.6 27.7 2008 27.5 25.7 29.3 27.3 2009 27.4 25.3 29.6 27.1 2010 26.6 23.9 29.4 26.4 2011 26.0 23.4 28.6 25.8 2012 26.1 23.5 28.7 25.8 2013 25.6 23.0 28.3 25.4 2014 25.0 22.3 27.7 24.7 2015 24.7 21.7 27.7 24.4 2016 23.5 21.1 25.9 23.3 2017 23.2 20.9 25.6 22.9 Table Notes: 1. There was a small data issue with the LFS questionnaire in Northern Ireland in 1997 causing an undercount of up to 10,000 union members or 0.1 percentage points (see technical note for an explanation)
Table Source: Labour Force Survey, Office for National Statistics

Trade Union Membership 2017: Statistical Bulletin
25
Table 1.3a: Trade union membership levels, in employment, 1989 to 2017
Thousands
United Kingdom Great Britain
All in employment Male Female All in employment
1989 - - - 9,045
1990 - - - 8,931
1991 - - - 8,686
1992 - - - 7,897
1993 - - - 7,647
1994 - - - 7,405
1995 7,393 4,138 3,255 7,165
1996 7,266 4,004 3,262 7,042
1997 7,185 3,921 3,264 6,972
1998 7,188 3,909 3,279 6,945
1999 7,291 3,973 3,318 7,069
2000 7,408 3,947 3,461 7,175
2001 7,341 3,911 3,430 7,091
2002 7,300 3,789 3,511 7,038
2003 7,447 3,842 3,604 7,205
2004 7,363 3,764 3,599 7,101
2005 7,390 3,719 3,672 7,123
2006 7,390 3,661 3,728 7,123
2007 7,371 3,618 3,753 7,101
2008 7,265 3,534 3,731 7,019
2009 7,103 3,356 3,747 6,828
2010 6,896 3,194 3,702 6,657
2011 6,741 3,120 3,621 6,506
2012 6,811 3,159 3,652 6,557
2013 6,785 3,142 3,643 6,536
2014 6,762 3,094 3,668 6,514
2015 6,808 3,106 3,701 6,565
2016 6,563 3,036 3,527 6,356
2017 6,566 3,043 3,523 6,325
Table Notes: 1. Membership levels are based on the methodology described in the technical note 2. There was a small data issue with the LFS questionnaire in Northern Ireland in 1997 causing an undercount of up to 10,000 union members or 0.1 percentage points (see technical note for an explanation)
Table Source: Labour Force Survey, Office for National Statistics

Trade Union Membership 2017: Statistical Bulletin
26
Table 1.3b: Trade union membership as a proportion of those in employment, 1989 to 2017
Per cent, not seasonally adjusted
United Kingdom Great Britain
All in employment Male Female All in employment
1989 - - - 34.1
1990 - - - 33.4
1991 - - - 33.2
1992 - - - 32.4
1993 - - - 31.3
1994 - - - 30.0
1995 28.8 29.7 27.8 28.7
1996 28.1 28.6 27.6 28.0
1997 27.7 27.8 27.6 27.2
1998 27.1 27.1 27.0 26.8
1999 27.1 27.2 27.0 26.9
2000 27.2 26.8 27.7 27.0
2001 26.7 26.3 27.2 26.5
2002 26.3 25.2 27.6 26.0
2003 26.6 25.4 28.0 26.4
2004 26.0 24.6 27.6 25.8
2005 25.9 24.2 27.9 25.7
2006 25.7 23.6 28.1 25.4
2007 25.3 23.1 27.9 25.1
2008 25.0 22.6 27.7 24.8
2009 24.8 22.1 27.8 24.5
2010 23.9 20.7 27.6 23.7
2011 23.3 20.2 26.7 23.1
2012 23.3 20.3 26.6 23.0
2013 22.8 19.8 26.1 22.5
2014 22.2 19.2 25.6 22.0
2015 21.9 18.8 25.5 21.7
2016 21.0 18.3 24.0 20.8
2017 20.7 18.1 23.6 20.5
Table Notes: 1. There was a small data issue with the LFS questionnaire in Northern Ireland in 1997 causing an undercount of up to 10,000 union members or 0.1 percentage points (see technical note for an explanation)
Table Source: Labour Force Survey, Office for National Statistics

Trade Union Membership 2017: Statistical Bulletin
27
Table 1.4: Trade union membership as a proportion of employees by gender, full/ part time and permanent/ temporary status, 2017
Per cent, not seasonally adjusted
Gender Full time/ part time
status Permanent/temporary
status
All
employees Male Female Full-time Part-time Permanent Temporary
All employees 23.2 20.9 25.6 24.7 19.1 23.9 13.1
Age bands
16 to 24 7.8 7.2 8.5 10.0 4.3 8.4 5.1
25 to 34 19.1 17.4 20.9 19.8 15.6 19.2 17.2
35 to 49 25.4 22.5 28.3 26.1 23.2 25.7 17.4
50 plus 30.5 28.1 32.8 33.1 24.7 31.1 17.4
Sector
Private 13.5 14.9 11.6 14.7 9.9 13.9 5.4
Public 51.8 50.9 52.3 55.4 42.9 53.6 29.3
Occupation 1
Managers, Directors And Senior Officials 11.9 10.6 14.5 12.5 6.5 12.0 *
Professional Occupations 41.4 28.6 53.3 39.6 49.8 42.1 32.1
Associate Professional And Technical Occupations 21.1 21.9 20.2 21.3 20.3 21.7 10.8
Administrative And Secretarial Occupations 16.7 16.1 16.9 17.8 14.5 17.4 *
Skilled Trades Occupations 17.3 17.8 13.3 18.6 * 17.6 *
Caring, Leisure And Other Service Occupations 25.3 27.8 24.7 28.9 20.2 25.8 18.5
Sales And Customer Service Occupations 14.2 14.4 14.2 16.1 12.6 15.2 *
Process, Plant And Machine Operatives 26.5 27.9 15.9 28.8 11.2 28.0 *
Elementary Occupations 15.3 18.5 11.7 20.0 10.0 16.4 5.3
Industry 2
Agriculture, forestry and fishing * * * * * * *
Mining and quarrying 15.1 17.3 * 16.4 * 15.9 *
Manufacturing 17.6 20.5 9.0 18.9 5.5 18.1 *
Electricity, gas, steam and air conditioning supply 44.5 47.5 36.5 43.5 * 44.4 * Water supply, sewerage, waste management and remediation activities 30.4 33.3 * 30.7 * 30.6 *
Construction 11.3 12.6 5.9 12.2 * 11.4 * Wholesale and retail trade; repair of motor vehicles and motorcycles 12.7 12.1 13.4 12.6 12.9 13.3 *
Transportation and storage 35.6 38.1 27.7 37.5 24.4 37.3 *
Accommodation and food service activities 2.9 2.6 3.1 3.7 2.0 2.9 *
Information and communication 9.5 9.2 10.2 9.7 * 9.7 *
Financial and insurance activities 13.5 11.4 16.1 12.3 21.2 13.9 *
Real estate activities 9.2 * 8.5 10.7 * 9.3 *
Professional, scientific and technical activities 7.8 8.7 6.7 8.4 4.8 7.8 *
Administrative and support service activities 9.9 10.1 9.7 9.7 10.7 9.5 14.9 Public administration and defence; compulsory social security 42.9 43.9 42.0 42.6 44.2 44.1 19.7
Education 48.1 48.4 47.9 55.1 34.2 50.6 26.0
Human health and social work activities 38.3 39.3 38.0 42.2 31.0 38.9 27.1
Arts, entertainment and recreation 13.8 17.5 9.7 17.9 7.4 15.5 *
Other service activities 11.7 13.4 10.4 14.3 6.3 12.3 *
Table Notes: 1. Based on Standard Occupational Classification 2010. 2. Based on Standard Industrial Classification 2007. Table Source: Labour Force Survey, Office for National Statistics

Trade Union Membership 2017: Statistical Bulletin
28
Table 1.5: Trade union membership as a proportion of employees – Personal, work and job characteristics, 2017
Per cent, not seasonally adjusted
Gender Full time/ part time status
All employees Male Female Full-time Part-time
All employees 23.2 20.9 25.6 24.7 19.1
Ethnicity White 23.8 21.5 26.0 25.1 20.0
Mixed 20.4 16.7 23.7 20.5 20.2
Asian or Asian British 18.8 17.1 20.9 21.3 11.6
Black or Black British 24.1 21.0 26.8 29.0 10.1 Chinese or other ethnic group 11.5 10.9 12.3 11.8 10.0
Nationality UK, British 24.5 22.0 27.1 26.2 20.0
Other 12.2 12.1 12.4 13.1 9.3
Country of Birth UK 24.6 22.2 27.1 26.2 20.2
Other 16.3 14.9 17.9 17.5 12.3
Disability Disabled 26.6 24.1 28.6 30.0 20.5
Not disabled 22.7 20.5 25.0 24.0 18.8
Highest qualification Degree or equivalent 28.7 22.2 34.9 28.5 29.9
Other higher education 30.6 24.4 35.6 31.4 28.4
A-level or equivalent 19.7 21.1 18.0 22.2 13.0 GCSE grades A-C or equivalent 18.8 19.3 18.4 20.9 14.7
Other qualifications 16.5 19.4 12.8 18.6 11.3
No qualification 14.8 15.5 13.9 16.2 12.5
Dependent children No dependent children 23.4 20.9 26.1 24.5 19.6 Dependent child under six 21.0 20.1 22.0 21.2 20.5 Dependent child six or over 23.7 21.5 25.7 26.6 18.1
Workplace size Less than 50 14.4 11.6 16.9 15.8 11.4
50 or more 31.0 28.5 33.8 31.2 30.4
Managerial status Manager 22.9 18.7 28.8 22.8 23.4
Foreman or supervisor 32.9 27.3 38.9 32.9 32.8 Not manager or supervisor 21.7 20.8 22.5 24.0 17.2 Flexible working hours Flexible working hours 27.3 25.5 28.9 28.4 23.8 Not flexible working hours 22.7 20.4 25.1 24.2 18.6
Length of service Less than 1 year 10.6 10.0 11.3 12.9 6.2
Between 1 and 2 years 13.1 12.7 13.4 14.6 9.5
Between 2 and 5 years 17.5 15.8 19.3 18.8 13.5 Between 5 and 10 years 23.4 20.4 26.7 24.0 21.4 Between 10 and 20 years 34.2 30.3 38.0 34.7 32.6
20 years or more 45.1 41.6 48.7 46.2 41.8 Permanent or temporary status Permanent 23.9 21.5 26.3 25.1 20.0
Temporary 13.1 11.6 14.5 14.0 12.4 Weekly earnings in main job Less than £250 11.3 9.2 12.2 8.6 12.1
£250 to £499 22.9 18.7 26.6 20.2 37.8
£500 to £999 33.7 29.7 40.6 33.5 37.6
£1000 and above 20.0 18.1 25.8 20.0 19.7
Table Source: 1. The LFS questions on disability were changed in 2013 to reflect Government Statistical Service Harmonised Standards, which are designed to be consistent with the 2010 Equality Act. The 2013 figures are therefore not directly comparable with those for previous years. Table Source: Labour Force Survey, Office for National Statistics

Trade Union Membership 2017: Statistical Bulletin
29
Table 1.6: Trade union membership as a proportion of employees by age group and gender, 1995 to 2017
1995 2004 2005 2006 2007 2008 2009 2010 2011 2012 2013 2014 2015 2016 2017
All employees 32.4 28.8 28.6 28.3 28.0 27.5 27.4 26.6 26.0 26.1 25.6 25.0 24.7 23.5 23.2
16 to 19 6.4 3.9 3.3 5.2 3.8 4.4 4.1 3.9 3.1 2.9 3.0 2.9 2.4 3.5 2.0
20 to 24 19.3 13.5 13.2 13.1 13.0 12.1 11.7 12.1 11.2 10.2 9.4 11.0 11.6 10.1 10.2
25 to 29 28.4 22.8 21.9 21.9 19.5 20.2 20.9 19.5 18.2 18.9 19.3 17.3 17.7 17.9 18.2
30 to 34 33.2 26.8 27.0 24.8 25.1 24.9 24.1 22.6 24.1 24.0 22.9 21.3 21.9 20.0 20.0
35 to 39 37.1 31.1 29.4 29.0 30.1 27.5 27.6 27.0 26.8 27.1 25.8 24.3 25.2 24.0 22.3
40 to 44 39.7 34.6 35.0 35.2 33.5 33.3 30.6 31.2 29.5 29.1 29.3 27.6 26.1 26.8 25.2
45 to 49 41.2 39.9 37.6 37.7 37.0 35.4 36.2 34.1 33.7 32.8 32.4 33.4 30.3 28.6 28.5
50 to 54 39.6 39.3 40.6 39.9 39.0 38.4 37.6 37.6 36.2 36.5 35.1 34.6 36.0 33.8 32.4
55 to 59 38.6 36.3 37.5 36.5 38.6 38.2 38.9 37.1 35.4 36.0 36.6 35.1 34.0 31.5 33.0
60 to 64 30.2 28.4 27.5 28.4 30.1 29.0 30.3 28.2 29.1 29.8 28.8 29.9 30.0 28.5 29.7
65 to 69 * 8.8 15.6 15.3 12.9 19.1 16.3 13.6 14.2 17.0 20.7 20.4 20.1 18.1 17.4
Over 70 * * * * 9.3 * 12.7 7.2 13.4 12.5 10.0 10.2 12.2 9.2 8.7
Male 35.0 28.5 27.7 27.1 26.5 25.7 25.3 23.9 23.4 23.5 23.0 22.3 21.7 21.1 20.9
16 to 19 6.8 5.3 4.0 7.0 4.7 5.4 5.4 4.7 4.8 4.2 3.9 3.4 2.9 4.7 2.3
20 to 24 20.1 13.5 13.0 13.3 11.8 12.9 12.2 11.0 11.2 11.2 8.9 10.4 10.2 9.1 9.1
25 to 29 28.0 20.5 18.9 20.1 16.9 17.0 17.6 16.9 14.9 14.7 16.3 14.3 15.0 15.8 16.5
30 to 34 34.3 25.1 23.4 21.3 21.6 21.8 20.0 18.2 20.3 20.1 19.0 17.3 19.8 18.2 18.2
35 to 39 39.5 29.7 28.2 27.5 28.6 24.3 24.2 24.1 21.7 22.6 22.0 21.2 21.1 21.0 20.3
40 to 44 45.9 34.5 33.8 33.8 31.2 31.2 28.1 27.1 26.6 25.8 25.4 24.5 22.4 22.9 20.5
45 to 49 45.9 41.4 37.7 36.1 35.8 33.1 34.2 31.1 31.9 29.8 29.0 30.0 26.2 26.4 26.5
50 to 54 45.1 38.4 41.7 39.1 37.8 36.4 35.8 34.9 33.7 34.9 33.3 31.5 32.5 30.1 30.1
55 to 59 42.4 38.2 38.4 36.1 39.5 38.6 37.2 35.6 32.6 32.9 35.2 33.4 30.3 29.1 31.1
60 to 64 32.8 30.4 27.8 29.0 31.0 30.7 30.7 28.1 28.1 29.2 27.8 28.8 29.2 27.8 26.1
65 to 69 * * 14.5 15.2 9.6 17.0 12.9 10.5 13.5 15.3 18.7 19.3 20.3 16.6 17.1
Over 70 * * * * * * * * 17.8 17.9 * * 12.3 10.0 9.4
Female 29.7 29.2 29.6 29.6 29.6 29.3 29.6 29.4 28.6 28.7 28.3 27.7 27.7 25.9 25.6
16 to 19 6.0 2.7 2.7 3.5 3.1 3.3 3.1 3.3 * * * 2.4 * 2.5 1.8
20 to 24 18.4 13.5 13.3 12.9 14.2 11.3 11.2 13.2 11.2 9.2 9.9 11.6 13.0 11.2 11.3
25 to 29 28.7 25.2 25.1 23.9 22.5 23.7 24.4 22.3 21.8 23.3 22.6 20.5 20.6 20.1 20.0
30 to 34 32.0 28.8 31.1 28.6 29.0 28.2 28.5 27.5 28.1 28.3 27.1 25.5 24.2 22.0 21.9
35 to 39 34.6 32.5 30.5 30.6 31.7 30.8 31.2 30.1 32.2 31.9 30.1 27.6 29.6 27.3 24.5
40 to 44 33.6 34.7 36.2 36.7 35.7 35.4 33.0 35.2 32.5 32.4 33.1 30.8 30.0 30.7 29.9
45 to 49 36.8 38.4 37.6 39.3 38.1 37.5 37.9 37.0 35.4 35.6 35.5 36.7 34.1 30.7 30.3
50 to 54 34.3 40.2 39.7 40.7 40.2 40.2 39.2 40.0 38.5 38.0 36.8 37.5 39.2 37.2 34.7
55 to 59 34.8 34.4 36.7 36.8 37.7 37.9 40.5 38.5 38.0 39.0 38.0 36.8 37.6 33.7 34.8
60 to 64 26.1 25.5 27.1 27.6 28.7 26.7 29.6 28.3 30.4 30.6 30.0 31.1 30.9 29.2 33.4
65 to 69 * * 16.8 15.5 16.9 21.8 19.9 16.8 15.0 19.0 22.8 21.6 19.8 19.8 17.7
Over 70 * * * * * * * * * * * 14.3 * * 8.0
Table source: Labour Force Survey, Office for National Statistics
Trade Union Membership 2017: Statistical Bulletin
30
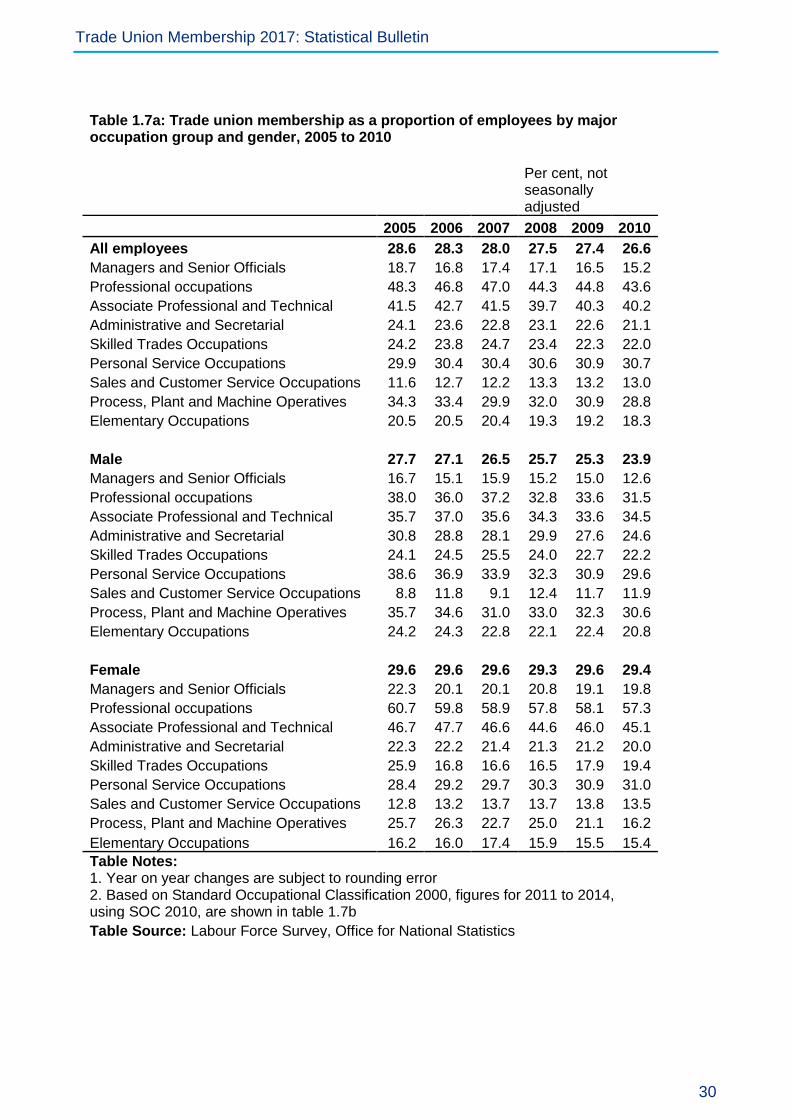
Table 1.7a: Trade union membership as a proportion of employees by major occupation group and gender, 2005 to 2010
Per cent, not seasonally adjusted
2005 2006 2007 2008 2009 2010
All employees 28.6 28.3 28.0 27.5 27.4 26.6
Managers and Senior Officials 18.7 16.8 17.4 17.1 16.5 15.2
Professional occupations 48.3 46.8 47.0 44.3 44.8 43.6
Associate Professional and Technical 41.5 42.7 41.5 39.7 40.3 40.2
Administrative and Secretarial 24.1 23.6 22.8 23.1 22.6 21.1
Skilled Trades Occupations 24.2 23.8 24.7 23.4 22.3 22.0
Personal Service Occupations 29.9 30.4 30.4 30.6 30.9 30.7
Sales and Customer Service Occupations 11.6 12.7 12.2 13.3 13.2 13.0
Process, Plant and Machine Operatives 34.3 33.4 29.9 32.0 30.9 28.8
Elementary Occupations 20.5 20.5 20.4 19.3 19.2 18.3
Male 27.7 27.1 26.5 25.7 25.3 23.9
Managers and Senior Officials 16.7 15.1 15.9 15.2 15.0 12.6
Professional occupations 38.0 36.0 37.2 32.8 33.6 31.5
Associate Professional and Technical 35.7 37.0 35.6 34.3 33.6 34.5
Administrative and Secretarial 30.8 28.8 28.1 29.9 27.6 24.6
Skilled Trades Occupations 24.1 24.5 25.5 24.0 22.7 22.2
Personal Service Occupations 38.6 36.9 33.9 32.3 30.9 29.6
Sales and Customer Service Occupations 8.8 11.8 9.1 12.4 11.7 11.9
Process, Plant and Machine Operatives 35.7 34.6 31.0 33.0 32.3 30.6
Elementary Occupations 24.2 24.3 22.8 22.1 22.4 20.8
Female 29.6 29.6 29.6 29.3 29.6 29.4
Managers and Senior Officials 22.3 20.1 20.1 20.8 19.1 19.8
Professional occupations 60.7 59.8 58.9 57.8 58.1 57.3
Associate Professional and Technical 46.7 47.7 46.6 44.6 46.0 45.1
Administrative and Secretarial 22.3 22.2 21.4 21.3 21.2 20.0
Skilled Trades Occupations 25.9 16.8 16.6 16.5 17.9 19.4
Personal Service Occupations 28.4 29.2 29.7 30.3 30.9 31.0
Sales and Customer Service Occupations 12.8 13.2 13.7 13.7 13.8 13.5
Process, Plant and Machine Operatives 25.7 26.3 22.7 25.0 21.1 16.2
Elementary Occupations 16.2 16.0 17.4 15.9 15.5 15.4
Table Notes: 1. Year on year changes are subject to rounding error 2. Based on Standard Occupational Classification 2000, figures for 2011 to 2014, using SOC 2010, are shown in table 1.7b
Table Source: Labour Force Survey, Office for National Statistics

Trade Union Membership 2017: Statistical Bulletin
31
Table 1.7b: Trade union membership as a proportion of employees by major occupation group and gender, 2011 to 2017
Per cent, not seasonally adjusted
2011 2012 2013 2014 2015 2016 2017
All employees 26.0 26.1 25.6 25.0 24.7 23.5 23.2
Managers, Directors And Senior Officials 13.8 14.8 14.3 14.1 13.0 12.1 11.9
Professional Occupations 45.5 45.5 45.0 43.7 43.9 41.6 41.4 Associate Professional And Technical Occupations 25.8 25.5 24.4 23.5 23.3 22.2 21.1 Administrative And Secretarial Occupations 21.2 20.4 20.3 20.2 17.6 17 16.7
Skilled Trades Occupations 20.1 19.9 21.3 19.0 18.0 18.4 17.3 Caring, Leisure And Other Service Occupations 28.0 27.7 26.0 27.3 27.4 25.9 25.3
Sales And Customer Service Occupations 15.4 15.4 14.5 15.1 15.7 13.5 14.2
Process, Plant And Machine Operatives 28.6 30.1 28.0 26.9 27.1 24.4 26.5
Elementary Occupations 16.7 16.9 16.5 16.0 16.5 15.3 15.3
Male 23.4 23.5 23.0 22.3 21.7 21.1 20.9
Managers, Directors And Senior Officials 11.6 12.0 12.4 12.4 10.0 10.7 10.6
Professional Occupations 30.4 30.7 29.7 29.8 28.9 27.9 28.6 Associate Professional And Technical Occupations 26.4 25.8 25.1 24.5 25.0 23.5 21.9 Administrative And Secretarial Occupations 23.6 20.7 24.2 22.6 20.0 19.8 16.1
Skilled Trades Occupations 21.0 20.3 21.8 19.0 18.4 18.7 17.8 Caring, Leisure And Other Service Occupations 33.4 26.8 26.3 25.6 28.5 28.4 27.8
Sales And Customer Service Occupations 13.9 15.6 12.7 14.8 14.7 12.8 14.4
Process, Plant And Machine Operatives 30.7 32.2 29.3 28.2 28.1 25.7 27.9
Elementary Occupations 18.4 20.6 20.1 18.3 18.8 18.6 18.5
Female 28.6 28.7 28.3 27.7 27.7 25.9 25.6
Managers, Directors And Senior Officials 18.1 20.1 18.5 17.4 18.1 14.6 14.5
Professional Occupations 60.4 59.9 59.2 57.1 58.3 54.6 53.3 Associate Professional And Technical Occupations 25.0 25.1 23.5 22.1 21.2 20.6 20.2 Administrative And Secretarial Occupations 20.5 20.2 19.2 19.4 16.8 16.2 16.9
Skilled Trades Occupations 12.5 16.6 16.7 18.6 14.6 16.1 13.3 Caring, Leisure And Other Service Occupations 26.8 27.8 26.0 27.7 27.2 25.3 24.7
Sales And Customer Service Occupations 16.3 15.4 15.5 15.3 16.2 13.9 14.2
Process, Plant And Machine Operatives 14.1 16.1 19.3 17.1 20.0 15.3 15.9
Elementary Occupations 14.7 12.7 12.3 13.3 13.8 11.6 11.7
Table Note: 1. Based on Standard Occupational Classification 2010, figures for 2005 to 2010, using Standard Occupational Classification 2000, are shown in table 1.7a
Table Source: Labour Force Survey, Office for National Statistics

Trade Union Membership 2017: Statistical Bulletin
32
Table 1.8: Trade union membership as a proportion of employees, by industry and
gender, 1995 to 2017
Per cent, not seasonally adjusted
1995 2009 2010 2011 2012 2013 2014 2015 2016 2017
All employees 32.4 27.4 26.6 26.0 26.1 25.6 25.0 24.7 23.5 23.2
Agriculture, forestry and fishing 8.0 * * * * * * * 8.5 *
Mining and quarrying 35.5 18.0 20.9 23.5 18.9 20.8 18.4 12.1 * 15.1
Manufacturing 32.8 21.3 19.8 18.7 18.7 18.3 17.9 16.8 17.8 17.6
Electricity, gas, steam and air conditioning supply
71.9 47.4 43.6 43.2 43.4 49.0 40.2 42.2 32.6 44.5
Water supply, sewerage, waste management and remediation activities
57.5 35.1 32.9 28.7 35.0 33.2 28.7 33.2 33.5 30.4
Construction 30.4 14.7 14.7 14.8 15.8 14.2 13.8 13.1 12.1 11.3
Wholesale and retail trade; repair of motor vehicles and motorcycles
11.0 12.4 11.8 11.8 12.7 12.2 11.9 12.7 11.4 12.7
Transportation and storage 50.7 43.6 42.1 38.9 40.0 40.2 37.4 37.6 36.6 35.6
Accommodation and food service activities 7.9 3.9 3.8 3.6 3.5 4.2 3.5 3.5 2.5 2.9
Information and communication 25.5 13.0 12.8 11.7 12.7 11.3 11.4 10.2 10.1 9.5
Financial and insurance activities 37.3 20.3 17.4 16.9 16.0 16.8 16.9 14.0 12.9 13.5
Real estate activities * 17.6 14.2 12.9 11.9 9.5 9.0 11.4 8.1 9.2
Professional, scientific and technical activities 9.4 10.9 8.9 9.3 8.8 8.0 9.3 8.1 8.3 7.8
Administrative and support service activities 12.4 12.2 12.4 11.7 11.1 11.6 12.0 10.3 11.2 9.9
Public administration and defence; compulsory social security
59.1 52.4 51.7 53.4 52.4 50.2 49.8 45.7 44.7 42.9
Education 55.6 53.1 52.4 51.6 52.1 51.8 50.3 51.8 48.0 48.1
Human health and social work activities 48.3 42.0 41.4 41.5 41.0 39.9 39.9 40.6 39.3 38.3
Arts, entertainment and recreation 27.3 18.9 18.7 16.7 14.8 17.8 15.6 15.0 14.7 13.8
Other service activities 12.8 11.3 11.6 10.8 10.2 13.5 11.4 12.1 11.7 11.7
Male 35.0 25.3 23.9 23.4 23.5 23.0 22.3 21.7 21.1 20.9
Agriculture, forestry and fishing * * * * * * * * 10.1 *
Mining and quarrying 38.7 19.7 22.0 27.2 23.2 23.2 21.2 13.3 * 17.3
Manufacturing 36.6 24.7 22.5 21.5 21.8 20.8 20.4 19.1 20.2 20.5
Electricity, gas, steam and air conditioning supply
78.2 51.4 45.4 47.9 48.1 54.4 44.2 44.4 38.5 47.5
Water supply, sewerage, waste management and remediation activities
67.0 37.1 34.3 30.1 39.1 36.0 33.4 36.7 33.5 33.3
Construction 32.0 15.0 15.7 16.0 16.3 15.0 15.0 14.4 12.8 12.6
Wholesale and retail trade; repair of motor vehicles and motorcycles
9.5 12.6 11.1 11.2 11.1 11.5 11.3 11.8 11.0 12.1
Transportation and storage 55.3 45.2 45.7 41.8 42.1 42.5 39.5 39.7 39.5 38.1
Accommodation and food service activities 7.2 3.1 2.5 3.0 3.2 4.5 3.2 2.2 1.7 2.6
Information and communication 29.1 13.7 13.3 12.8 13.1 10.9 10.4 10.5 10.0 9.2
Financial and insurance activities 35.0 15.0 13.2 12.3 11.1 13.2 13.1 10.1 9.8 11.4
Real estate activities * 23.0 12.7 16.3 11.1 * 11.5 12.1 * *
Professional, scientific and technical activities 14.1 12.6 10.4 10.6 10.3 8.6 9.7 8.4 10.2 8.7
Administrative and support service activities 14.6 14.3 12.3 12.0 11.9 13.5 11.6 13.0 12.0 10.1
Public administration and defence; compulsory social security
63.7 54.1 53.9 54.3 54.3 52.1 50.9 46.5 47.5 43.9
Education 67.6 51.8 51.1 50.9 50.8 52.1 50.1 53.1 48.7 48.4
Human health and social work activities 53.6 42.7 40.0 43.0 41.0 37.2 39.5 37.4 37.8 39.3
Arts, entertainment and recreation 28.6 20.6 21.4 17.8 15.0 18.9 18.7 17.2 16.3 17.5
Other service activities 16.1 11.1 13.5 11.7 11.7 16.5 14.5 15.0 18.2 13.4

Trade Union Membership 2017: Statistical Bulletin
33
Per cent, not seasonally adjusted
1995 2009 2010 2011 2012 2013 2014 2015 2016 2017
Female 29.7 29.6 29.4 28.6 28.7 28.3 27.7 27.7 25.9 25.6
Agriculture, forestry and fishing * * * * * * * * * *
Mining and quarrying * * * * * * * * * *
Manufacturing 22.6 10.7 11.3 9.8 9.2 10.7 10.6 9.2 10.4 9.0
Electricity, gas, steam and air conditioning supply
* 36.1 37.4 31.6 31.5 33.8 29.4 35.0 * 36.5
Water supply, sewerage, waste management and remediation activities
* * * * * * * * * *
Construction 24.2 13.3 9.5 8.9 13.3 10.3 7.7 7.2 9.2 5.9
Wholesale and retail trade; repair of motor vehicles and motorcycles
12.3 12.2 12.6 12.5 14.2 13.0 12.5 13.7 11.8 13.4
Transportation and storage 32.9 38.0 30.5 28.3 32.3 31.6 31.4 30.3 27.1 27.7
Accommodation and food service activities 8.3 4.6 4.9 4.1 3.8 3.9 3.7 4.7 3.2 3.1
Information and communication 19.0 11.4 11.5 9.0 11.5 12.3 14.0 9.1 10.3 10.2
Financial and insurance activities 39.3 25.5 22.3 21.8 21.4 21.3 21.3 18.6 16.7 16.1
Real estate activities * 13.5 15.1 * 12.5 9.9 * 10.7 10.8 8.5
Professional, scientific and technical activities 5.2 8.9 7.1 7.7 7.0 7.3 8.7 7.8 6.0 6.7
Administrative and support service activities 10.3 10.1 12.4 11.5 10.2 9.3 12.4 7.3 10.2 9.7
Public administration and defence; compulsory social security
54.2 50.8 49.6 52.6 50.5 48.5 48.7 44.9 42.3 42.0
Education 50.5 53.5 52.9 51.8 52.6 51.7 50.3 51.4 47.7 47.9
Human health and social work activities 47.3 41.8 41.8 41.0 41.0 40.6 40.0 41.4 39.7 38.0
Arts, entertainment and recreation 26.1 17.2 16.1 15.5 14.6 16.6 12.2 12.7 12.8 9.7
Other service activities 11.0 11.5 10.3 10.2 8.9 11.0 9.2 10.2 7.5 10.4
Table source: Labour Force Survey, Office for National Statistics Table notes: 1. Based on Standard Industrial Classification 2007
2. Trade union membership levels by industry are presented in table 2.5

Trade Union Membership 2017: Statistical Bulletin
34
Table 1.9: Average hourly earnings by union status, 2017
£s, Not seasonally adjusted Per cent, not
seasonally adjusted Trade union membership Trade Union Wage
Premium (%) All employees Member Non Member
All employees 14.18 15.63 13.75 13.7%
Gender
Male 15.57 16.61 15.31 8.5%
Female 12.77 14.77 12.10 22.1%
Age bands
16 to 24 8.43 10.66 8.25 29.2%
25 to 34 13.63 15.21 13.26 14.7%
35 to 49 16.26 16.42 16.20 1.4%
50 plus 14.89 15.71 14.52 8.2%
Occupation 1
Managers, Directors And Senior Officials 21.11 22.17 20.95 5.8%
Professional Occupations 20.39 19.48 21.09 7.6%
Associate Professional And Technical Occupations 16.80 16.22 16.98 -4.5%
Administrative And Secretarial Occupations 11.59 12.12 11.50 5.4%
Skilled Trades Occupations 11.56 14.38 10.91 31.8%
Caring, Leisure And Other Service Occupations 9.20 10.25 8.84 16.0%
Sales And Customer Service Occupations 9.05 10.44 8.82 18.4%
Process, Plant And Machine Operatives 10.76 12.98 9.98 30.1%
Elementary Occupations 8.27 10.16 7.95 27.8%
Industry 2
Agriculture, forestry and fishing 10.85 * 10.89 *
Mining and quarrying 22.53 * 22.61 *
Manufacturing 14.98 15.49 14.91 3.9%
Electricity, gas, steam and air conditioning supply 19.40 19.49 19.33 0.8%
Water supply, sewerage, waste management and remediation activities
12.58 12.70 12.58 1.0%
Construction 15.37 15.09 15.46 -2.4%
Wholesale and retail trade; repair of motor vehicles and motorcycles
10.40 9.70 10.52 -7.8%
Transportation and storage 13.06 15.43 11.62 32.8%
Accommodation and food service activities 8.73 11.81 8.66 36.4% Information and communication 21.02 19.30 21.16 -8.8%
Financial and insurance activities 20.40 17.86 20.93 -14.7%
Real estate activities 15.13 * 14.72 *
Professional, scientific and technical activities 18.30 18.37 18.22 0.8%
Administrative and support service activities 11.64 10.69 11.74 -8.9%
Public administration and defence; compulsory social security
16.42 15.97 16.82 -5.1%
Education 14.42 16.37 12.46 31.4%
Human health and social work activities 13.42 15.98 11.87 34.6%
Arts, entertainment and recreation 12.57 17.05 11.83 44.1%
Other service activities 13.59 19.42 12.78 52.0%
Table source: Labour Force Survey, Office for National Statistics Table notes: 1. Based on Standard Occupational Classification 2010.
2. Based on Standard Industrial Classification 2007.

Trade Union Membership 2017: Statistical Bulletin
35
Table 1.10: Trade union membership as a proportion of employees, union presence and coverage of collective agreements between employers and trade unions, 2017
Per cent, not seasonally adjusted
Union density Trade unions present in workplace2,4
Employee’s pay affected by collective agreement3
All employees 23.2 48.9 26.0
Sector
Private 13.5 33.4 15.2
Public 51.8 87.7 57.6
Workplace size
Less than 50 14.4 29.1 14.0
50 or more 31.0 65.0 36.6
Industry 1
Agriculture, forestry and fishing * 11.9 7.2
Mining and quarrying 15.1 50.1 20.4
Manufacturing 17.6 43.2 21.8
Electricity, gas, steam and air conditioning supply 44.5 71.9 51.4
Water supply, sewerage, waste management and remediation activities
30.4 64.6 38.7
Construction 11.3 31.0 13.8
Wholesale and retail trade; repair of motor vehicles and motorcycles
12.7 32.5 14.9
Transportation and storage 35.6 62.1 43.6
Accommodation and food service activities 2.9 9.3 3.8
Information and communication 9.5 28.5 12.3
Financial and insurance activities 13.5 39.2 19.8
Real estate activities 9.2 29.5 11.8
Professional, scientific and technical activities 7.8 23.5 9.6
Administrative and support service activities 9.9 27.7 11.5
Public administration and defence; compulsory social security
42.9 79.7 55.2
Education 48.1 83.5 48.3
Human health and social work activities 38.3 67.9 35.8
Arts, entertainment and recreation 13.8 35.9 19.6
Other service activities 11.7 25.1 10.1
Nation
England 22.0 47.8 24.1
Wales 30.0 58.1 31.7
Scotland 28.1 54.2 34.7
Northern Ireland 34.1 50.0 43.3
Region
North East 28.5 56.6 34.1
North West 29.3 53.4 30.3
Yorkshire and the Humber 27.7 57.2 27.6
East Midlands 19.7 46.5 24.4
West Midlands 22.6 46.7 25.8
East of England 19.1 42.9 20.8
London 17.6 39.7 18.9
South East 19.1 46.2 20.5
South West 21.1 50.3 24.7
Table source: Labour Force Survey, Office for National Statistics Table notes: 1. Based on Standard Industrial Classification 2007.
2. The proportion of employees whose workplace has some employees who are union members
3. Collective agreement coverage is defined as the proportion of employees whose pay and conditions are agreed in negotiations
between the employer and a trade union
4. The method for estimating trade union presence has been revised. This is reflected in higher rates than shown in previous
bulletins.

Trade Union Membership 2017: Statistical Bulletin
36
Table 1.11: Collective agreement between an employer and a union2 by full/ part time and permanent/ temporary status, 2017
Per cent, not seasonally adjusted
Full time/ part time Permanent/temporary All employees Full-time Part-time Permanent Temporary
All employees 26.0 27.2 22.2 26.3 19.7
Gender
Male 24.2 25.1 17.3 24.5 18.3
Female 27.8 30.4 23.7 28.2 21.0
Union membership
Member 65.9 67.3 60.7 66.4 50.4
Non-member 13.2 13.4 12.7 13.1 14.7
Sector
Private 15.2 16.4 11.7 15.6 9.0
Public 57.6 60.7 49.5 58.6 42.7
Workplace size
Less than 50 14.0 14.9 12.2 14.1 12.6
50 or more 36.6 36.5 37.4 37.2 26.3
Industry 1
Agriculture, forestry and fishing 7.2 * * 7.5 *
Mining and quarrying 20.4 20.7 * 21.6 *
Manufacturing 21.8 23.5 6.5 22.0 16.6
Electricity, gas, steam and air conditioning supply
51.4 51.2 * 51.4 *
Water supply, sewerage, waste management and remediation activities
38.7 39.1 * 38.9 *
Construction 13.8 14.6 * 14.0 *
Wholesale and retail trade; repair of motor vehicles and motorcycles
14.9 13.1 17.9 15.2 *
Transportation and storage 43.6 45.6 32.0 45.5 *
Accommodation and food service activities
3.8 4.0 3.6 3.7 *
Information and communication 12.3 12.3 12.5 12.2 *
Financial and insurance activities 19.8 19.3 23.0 20.0 *
Real estate activities 11.8 12.7 * 12.0 *
Professional, scientific and technical activities
9.6 9.6 9.1 8.7 23.4
Administrative and support service activities
11.5 11.9 10.4 11.7 *
Public administration and defence; compulsory social security
55.2 54.7 57.4 56.2 35.9
Education 48.3 52.9 38.9 49.3 38.5
Human health and social work activities 35.8 39.3 29.2 36.2 26.8
Arts, entertainment and recreation 19.6 24.4 11.7 20.9 *
Other service activities 10.1 11.6 7.1 10.7 *
Table source: Labour Force Survey, Office for National Statistics Table notes: 1. Based on Standard Industrial Classification 2007.
2. Collective agreement coverage is defined as the proportion of employees whose pay and conditions are agreed in
negotiations between the employer and a trade union

Trade Union Membership 2017: Statistical Bulletin
37
2. Private and Public Sectors
Table 2.1a: Trade union membership levels by sector and gender, 1995 to 2017
Thousands
Private Sector Public Sector All employees Male Female All employees Male Female
1995 3,391 2,317 1,074 3,722 1,605 2,117
1996 3,297 2,237 1,061 3,664 1,529 2,135
1997 3,265 2,245 1,020 3,635 1,477 2,158
1998 3,352 2,254 1,099 3,579 1,464 2,115
1999 3,311 2,269 1,042 3,667 1,479 2,188
2000 3,308 2,239 1,069 3,810 1,512 2,298
2001 3,276 2,218 1,058 3,767 1,472 2,295
2002 3,193 2,165 1,028 3,837 1,441 2,395
2003 3,216 2,128 1,089 3,903 1,483 2,420
2004 3,063 2,099 964 4,017 1,473 2,544
2005 3,008 1,986 1,022 4,075 1,499 2,576
2006 2,984 1,982 1,002 4,075 1,463 2,612
2007 2,933 1,936 997 4,118 1,459 2,660
2008 2,805 1,823 982 4,124 1,470 2,654
2009 2,628 1,693 935 4,143 1,442 2,701
2010 2,486 1,591 895 4,103 1,397 2,706
2011 2,525 1,623 901 3,923 1,308 2,615
2012 2,589 1,627 962 3,918 1,325 2,594
2013 2,645 1,678 966 3,845 1,255 2,590
2014 2,686 1,663 1,023 3,772 1,238 2,534
2015 2,691 1,676 1,015 3,800 1,223 2,577
2016 2,625 1,629 996 3,591 1,189 2,402
2017 2,695 1,679 1,016 3,540 1,168 2,372
Table source: Labour Force Survey, Office for National Statistics Table notes: 1. Year on year changes are subject to rounding error
2. Membership levels are based on the methodology described in the technical note
3. There was a small data issue with the LFS questionnaire in Northern Ireland in 1997 causing
an undercount of up to 10,000 union members or 0.1 percentage points (see technical note
for an explanation)
Table 2.1b: Trade union non-membership levels by sector and gender, 1995 to 2017

Trade Union Membership 2017: Statistical Bulletin
38
Thousands
Private Sector Public Sector All employees Male Female All employees Male Female
1995 12,466 6,535 5,932 2,349 757 1,591
1996 12,893 6,857 6,035 2,384 737 1,647
1997 13,426 7,257 6,169 2,484 780 1,704
1998 14,037 7,557 6,480 2,363 740 1,623
1999 14,251 7,720 6,531 2,470 761 1,708
2000 14,390 7,845 6,546 2,517 794 1,722
2001 14,604 7,988 6,617 2,559 754 1,805
2002 14,890 8,191 6,699 2,594 829 1,765
2003 14,583 8,002 6,581 2,676 818 1,859
2004 14,842 8,151 6,691 2,840 910 1,929
2005 14,892 8,224 6,668 2,945 980 1,965
2006 15,211 8,443 6,767 2,884 942 1,941
2007 15,515 8,651 6,863 2,880 926 1,954
2008 15,396 8,582 6,814 3,114 1,036 2,078
2009 14,964 8,232 6,732 3,192 1,130 2,063
2010 15,249 8,527 6,722 3,198 1,147 2,051
2011 15,492 8,599 6,893 3,019 1,049 1,970 2012 15,732 8,757 6,975 3,060 1,050 2,011
2013 15,980 8,916 7,065 3,106 1,049 2,057
2014 16,503 9,179 7,324 3,199 1,122 2,077
2015 16,967 9,486 7,481 3,153 1,113 2,040
2016 17,300 9,558 7,742 3,251 1,120 2,131
2017 17,589 9,730 7,858 3,316 1,137 2,179
Table source: Labour Force Survey, Office for National Statistics Table notes: 1. Membership levels are based on the methodology described in the technical note
2. There was a small data issue with the LFS questionnaire in Northern Ireland in 1997
causing an undercount of up to 10,000 union members or 0.1 percentage points (see
technical note for an explanation)

Trade Union Membership 2017: Statistical Bulletin
39
Table 2.2: Trade union membership as a proportion of employees, by sector and gender, 1995 to 2017
Per cent, not seasonally adjusted
All employees Private Sector Public Sector All employees Male Female All employees Male Female All employees Male Female
1995 32.4 35.0 29.7 21.4 26.3 15.3 61.3 68.0 57.0
1996 31.4 33.3 29.5 20.5 24.8 15.1 60.7 67.7 56.6
1997 30.7 32.1 29.3 19.8 23.8 14.5 61.2 68.0 57.3
1998 29.9 31.2 28.6 19.5 23.2 14.7 60.4 66.6 56.8
1999 29.7 30.9 28.4 19.0 22.9 13.9 59.9 66.3 56.3
2000 29.8 30.4 29.1 18.8 22.3 14.1 60.3 65.7 57.3
2001 29.3 29.9 28.6 18.4 21.9 13.9 59.7 66.3 56.2
2002 28.8 28.7 29.0 17.8 21.0 13.4 59.8 63.7 57.7
2003 29.3 29.1 29.6 18.2 21.1 14.4 59.4 64.5 56.7
2004 28.8 28.5 29.2 17.3 20.7 12.8 58.8 62.0 57.1
2005 28.6 27.7 29.6 16.9 19.6 13.4 58.2 60.6 56.9
2006 28.3 27.1 29.6 16.6 19.2 13.1 58.7 61.1 57.5
2007 28.0 26.5 29.6 16.1 18.6 12.9 59.0 61.4 57.8
2008 27.5 25.7 29.3 15.6 17.7 12.7 57.2 58.9 56.3
2009 27.4 25.3 29.6 15.1 17.3 12.4 56.7 56.3 56.9
2010 26.6 23.9 29.4 14.2 16.0 11.9 56.4 55.0 57.1
2011 26.0 23.4 28.6 14.2 16.0 11.7 56.6 55.5 57.2 2012 26.1 23.5 28.7 14.4 16.0 12.4 56.4 56.1 56.5
2013 25.6 23.0 28.3 14.4 16.1 12.2 55.5 54.8 55.9
2014 25.0 22.3 27.7 14.2 15.6 12.5 54.3 52.8 55.1
2015 24.7 21.7 27.7 13.9 15.2 12.2 54.9 52.6 56.0
2016 23.5 21.1 25.9 13.4 14.8 11.6 52.7 51.7 53.2
2017 23.2 20.9 25.6 13.5 14.9 11.6 51.8 50.9 52.3
Table source: Labour Force Survey, Office for National Statistics Table notes:
1. There was a small data issue with the LFS questionnaire in Northern Ireland in 1997 causing an undercount of up to 10,000
union members or 0.1 percentage points (see technical note for an explanation)

Trade Union Membership 2017: Statistical Bulletin
40
Table 2.3: Average hourly earnings by union status and sector, 1995 to 2017
£s, Not seasonally adjusted Per cent, not
seasonally adjusted Trade union membership Trade Union Wage
Premium (%) All employees Member Non Member
All employees 1995 7.11 8.27 6.57 25.9
2004 10.23 11.38 9.75 16.7
2005 10.74 11.94 10.28 16.1
2006 11.15 12.40 10.65 16.4
2007 11.51 12.74 11.02 15.6
2008 12.02 13.07 11.62 12.5
2009 12.35 13.63 11.88 14.7
2010 12.55 14.05 12.02 16.9
2011 12.59 14.19 11.99 18.3
2012 12.92 14.41 12.43 15.9 2013 12.95 14.48 12.42 16.6 2014 13.21 14.78 12.67 16.7 2015 13.49 14.87 13.04 14.1 2016 13.68 15.07 13.25 13.7 2017 14.18 15.63 13.75 13.7
Change from 1995 7.07 7.36 7.18 - Change from 2015 0.50 0.56 0.50 -
Per cent change from 2015 3.7% 3.7% 3.8% -
Private Sector
1995 6.72 7.52 6.52 15.3 2004 9.81 10.33 9.74 6.1
2005 10.33 10.88 10.24 6.3
2006 10.83 11.62 10.66 9.0
2007 11.16 11.86 11.03 7.5
2008 11.62 11.86 11.58 2.4
2009 11.93 12.43 11.84 5.0
2010 12.04 12.65 11.95 5.9
2011 12.01 12.83 11.86 8.2
2012 12.40 13.06 12.31 6.1 2013 12.47 13.22 12.34 7.1 2014 12.81 13.68 12.65 8.2 2015 13.12 13.98 12.98 7.7 2016 13.28 14.15 13.15 7.6 2017 13.84 14.69 13.72 7.1
Change from 1995 7.12 6.56
7.17 7.20 -
Change from 2015 0.56 6
0.54 0.57 0.17
-
Per cent change from 2015 4.2% 3.8% 4.3% -
Public Sector
1995 8.13 8.98 6.89 30.3 2004 11.37 12.22 9.87 23.8
2005 11.81 12.72 10.51 21.0
2006 12.04 13.01 10.63 22.4
2007 12.44 13.40 10.98 22.0
2008 13.06 13.93 11.87 17.4
2009 13.38 14.43 12.07 19.6
2010 13.83 14.89 12.41 20.0
2011 14.11 15.07 12.75 18.2
2012 14.32 15.30 13.10 16.8
2013 14.28 15.41 12.85 19.9
2014 14.31 15.56 12.80 21.6
2015 14.56 15.53 13.38 16.1
2016 14.83 15.76 13.76 14.5
2017 15.21 16.33 13.96 16.9
Change from 1995 7.08 7.35 7.07 -
Change from 2015 0.38 0.57 0.20 -
Per cent change from 2015 2.6% 3.6% 1.5% -
Table source: Labour Force Survey, Office for National Statistics Table notes:
1. Year on year changes are subject to rounding error

Trade Union Membership 2017: Statistical Bulletin
41
Table 2.4a: Trade union presence by sector, 1999 to 2017
Per cent, not seasonally adjusted
All employees All employees Private Sector Public Sector
1999 56.3 41.5 93.0 2000 56.6 41.8 92.8
2001 55.7 40.7 92.8
2002 55.9 40.6 92.9
2003 56.1 41.0 91.9
2004 55.0 38.9 91.7
2005 55.5 39.2 91.2
2006 54.7 38.4 91.4
2007 54.7 38.5 91.0
2008 54.8 37.6 91.7
2009 54.8 37.1 90.9
2010 54.4 36.5 91.2
2011 52.9 35.2 91.6
2012 52.7 35.2 91.2
2013 52.8 35.8 90.9
2014 51.4 34.8 90.3
2015 50.8 34.7 89.4
2016 48.9 33.0 88.4
2017 48.9 33.4 87.7
Table source: Labour Force Survey, Office for National Statistics Table notes: 1. Trade union presence is defined as the proportion of employees whose workplace has a union present
2. The method for estimating trade union presence has been revised. This is reflected in higher percentages in each year.

Trade Union Membership 2017: Statistical Bulletin
42
Table 2.4b: Collective agreement between employer and trade union1 by sector, 1996 to
2017
Per cent, not seasonally adjusted
All employees
All employees Private Sector Public Sector
1995 - - -
1996 36.0 23.2 74.4
1997 37.0 22.0 74.9
1998 35.4 21.7 75.1
1999 36.1 23.0 72.7
2000 36.4 22.5 74.2
2001 35.5 21.9 72.6
2002 35.2 21.1 73.6
2003 35.5 21.9 71.5
2004 34.8 20.5 71.2
2005 35.0 20.6 70.9
2006 33.4 19.6 69.0
2007 34.7 20.0 72.0
2008 33.7 18.7 70.6
2009 32.8 17.8 68.1
2010 30.9 16.9 64.5
2011 31.2 17.0 67.8
2012 29.3 16.1 63.7
2013 29.5 16.6 63.7
2014 27.5 15.4 60.7
2015 27.9 16.1 60.7
2016 26.3 14.9 59.0
2017 26.0 15.2 57.6
Table Notes 1. The proportion of employees whose pay and conditions are agreed in negotiations between the employer and a trade union.
2. Prior to 1999 questionnaire was routed differently – see Annex A of the publication for explanation
Table Source: Labour Force Survey, Office for National Statistics

Trade Union Membership 2017: Statistical Bulletin
43
Table 2.5: Trade union membership levels by Industry, 1995 to 2017
Thousands
1995 2005 2006 2007 2008 2009 2010 2011 2012 2013 2014 2015 2016 2017
Industry 2
Agriculture, forestry and fishing 16 13 16 14 12 * * 11 * * 11 * 15 *
Mining and quarrying 37 23 22 26 23 19 19 24 21 22 24 16 12 15
Manufacturing 1,450 838 732 711 626 556 533 506 495 499 504 459 478 469 Electricity, gas, steam and air conditioning supply 95 60 69 70 78 73 77 78 75 82 65 73 55 76 Water supply, sewerage, waste management and remediation activities 96 74 93 80 71 63 66 64 73 62 60 70 71 69
Construction 335 252 293 280 282 202 194 186 197 176 182 168 158 151 Wholesale and retail trade; repair of motor vehicles and motorcycles 378 414 423 427 455 442 432 432 461 441 438 474 418 489
Transportation and storage 572 596 585 582 585 516 496 453 479 504 455 495 478 453 Accommodation and food service activities 77 45 60 55 58 48 47 47 48 57 49 51 40 44
Information and communication 172 161 171 169 146 113 109 106 121 113 118 108 111 104 Financial and insurance activities 406 296 291 281 238 226 186 188 171 181 181 165 138 156
Real estate activities 12 15 14 17 13 37 34 32 31 26 23 34 24 24 Professional, scientific and technical activities 84 89 93 113 104 154 124 132 127 126 146 130 143 141 Administrative and support service activities 82 94 94 89 86 131 133 123 117 126 129 119 127 116 Public administration and defence; compulsory social security 842 1,116 1,115 1,097 1,129 986 921 940 897 882 860 810 831 821
Education 1,061 1,394 1,408 1,440 1,424 1,540 1,582 1,492 1,557 1,522 1,545 1,624 1,469 1,469 Human health and social work activities 1,225 1,441 1,399 1,428 1,409 1,486 1,462 1,483 1,500 1,493 1,512 1,529 1,493 1,474 Arts, entertainment and recreation 119 108 119 122 137 113 109 98 81 100 95 94 88 88
Other service activities 53 54 61 50 54 58 56 52 50 70 61 64 67 70
Table Notes: 1. Based on Standard Industrial Classification 2017 2. Membership levels are based on the methodology described in the technical note 3. Trade union densities by industry are presented in table 1.8
4. There was a small data issue with the LFS questionnaire in Northern Ireland in 1997 causing an undercount of up to 10,000 union members or 0.1 percentage points (see technical note for an explanation) Source: Labour Force Survey, Office for National Statistics

Trade Union Membership 2017: Statistical Bulletin
44
3. Personal and job characteristics
Table 3.1: Characteristics of union members and non-members, 2017
Per cent, not seasonally adjusted
Union members Non-members All employees
Gender
Male 45.4 51.8 50.5
Female 54.6 48.2 49.5
Age bands
16 to 24 4.3 15.2 13.4
25 to 34 19.3 24.8 24.5
35 to 49 36.6 32.5 33.3
50 plus 39.8 27.5 28.8
Ethnicity
White 91.0 88.3 88.4
Mixed 0.9 1.1 1.1
Asian or Asian British 4.3 5.6 5.6
Black or Black British 2.8 2.7 2.9
Chinese or other ethnic group 1.0 2.3 2.1
Nationality
UK, British 94.4 87.9 89.1
Other 5.6 12.1 10.9
Country of Birth
UK 88.3 81.8 82.9
Other 11.7 18.2 17.1
Disability
Has a disability 16.4 13.7 14.0
Doesn’t have a disability 83.6 86.3 86.0
Highest qualification
Degree or equivalent 43.9 33.1 35.2
Other higher education 12.4 8.5 9.2
A-level or equivalent 19.4 24.1 23.2
GCSE grades A-C or equivalent 15.9 20.8 19.8
Other qualifications 5.5 8.4 7.9
No qualification 2.9 5.0 4.6
Sector
Private 43.2 84.0 75.1
Public 56.8 16.0 24.9
Full-time/ part-time
Full-time 78.5 72.5 74.3
Part-time 21.5 27.5 25.7
Length of service
Less than 1 year 8.0 20.5 17.2
Between 1 and 2 years 6.6 13.3 12.3
Between 2 and 5 years 16.8 23.9 22.7
Between 5 and 10 years 17.1 16.9 17.1
Between 10 and 20 years 30.2 17.6 20.2
20 years or more 21.3 7.8 10.4
Workplace size
Less than 50 28.6 51.8 46.4
50 or more 71.4 48.2 53.6

Trade Union Membership 2017: Statistical Bulletin
45
Per cent, not seasonally adjusted
Union members Non-members All employees
Occupation 1
Managers, Directors And Senior Officials 4.9 10.9 9.5
Professional Occupations 37.9 16.2 20.8
Associate Professional And Technical Occupations 12.8 14.4 14.0
Administrative And Secretarial Occupations 8.6 12.9 11.7
Skilled Trades Occupations 5.7 8.2 7.8
Caring, Leisure And Other Service Occupations 10.7 9.5 9.8
Sales And Customer Service Occupations 5.4 9.9 9.0
Process, Plant And Machine Operatives 6.9 5.8 6.2
Elementary Occupations 7.2 12.1 11.3
Industry 2 3
Agriculture, forestry and fishing * 0.9 0.7
Mining and quarrying * 0.4 0.4
Manufacturing 7.5 10.6 10.0
Electricity, gas, steam and air conditioning supply 1.2 0.5 0.7
Water supply, sewerage, waste management and remediation activities
1.1 0.8 0.8
Construction 2.4 5.7 5.1
Wholesale and retail trade; repair of motor vehicles and motorcycles
7.8 16.2 14.4
Transportation and storage 7.2 4.0 4.8
Accommodation and food service activities 0.7 7.1 5.9
Information and communication 1.6 4.8 3.8
Financial and insurance activities 2.5 4.8 4.3
Real estate activities 0.4 1.2 1.0
Professional, scientific and technical activities 2.2 8.0 6.6
Administrative and support service activities 1.9 5.2 4.5
Public administration and defence; compulsory social security
13.2 5.3 7.0
Education 23.5 7.7 11.1
Human health and social work activities 23.8 11.6 14.3
Arts, entertainment and recreation 1.4 2.7 2.4
Other service activities 1.1 2.6 2.2
Table source: Labour Force Survey, Office for National Statistics Table notes: 1. Based on Standard Occupational Classification 2010.
2. Based on Standard Industrial Classification 2007.
3. Excludes classifications: households as employers, and extraterritorial organisations and bodies

Trade Union Membership 2017: Statistical Bulletin
46
4. Country and Regional Trends
Table 4.1: Trade union membership as a proportion of employees by nation and region,
1995 to 2017
1995 2007 2008 2009 2010 2011 2012 2013 2014 2015 2016 2017
United Kingdom 32.4 28.0 27.5 27.4 26.6 26.0 26.1 25.6 25.0 24.7 23.5 23.2
England 30.8 26.6 26.1 26.2 25.3 24.9 24.8 24.1 23.5 23.0 22.1 22.0
Wales 44.3 37.4 37.4 35.4 34.7 34.9 33.0 35.6 35.9 35.2 35.5 30.0
Scotland 39.0 32.6 32.9 31.8 32.3 29.7 31.6 31.9 30.4 32.0 29.3 28.1
Northern Ireland 42.2 39.8 35.8 39.9 35.8 33.9 36.4 35.5 35.2 34.3 29.1 34.1
England 30.8 26.6 26.1 26.2 25.3 24.9 24.8 24.1 23.5 23.0 22.1 23.2
North East 43.1 35.9 35.5 35.7 32.8 34.5 32.7 30.9 32.1 30.1 27.3 28.5
North West 38.9 34.2 32.3 32.2 31.6 30.4 30.4 30.2 29.1 27.9 28.6 29.3
Yorkshire and the Humber 34.3 30.2 29.8 29.1 28.4 27.2 27.7 27.7 29.3 27.2 25.6 27.7
East Midlands 31.6 26.9 27.0 26.5 26.3 25.4 25.1 26.2 22.4 23.1 22.3 19.7
West Midlands 32.9 28.0 26.5 28.2 27.2 26.6 25.8 24.4 24.4 25.2 23.5 22.6
East of England 25.4 22.4 22.0 22.9 22.7 22.4 21.9 21.9 20.5 20.0 18.6 19.1
London 29.8 24.1 23.6 21.4 21.3 20.6 21.5 20.9 19.9 18.1 18.2 17.6
South East 23.2 21.0 21.6 21.9 21.3 20.7 21.0 20.3 19.4 20.8 18.4 19.1
South West 27.6 24.8 25.0 26.1 23.5 24.8 24.2 22.0 22.7 22.2 22.2 21.1
Table source: Labour Force Survey, Office for National Statistics Table notes: 1. There was a small data issue with the LFS questionnaire in Northern Ireland in 1997 causing an undercount of up to 10,000 union members or 0.1 percentage points (see technical note for an explanation)

Trade Union Membership 2017: Statistical Bulletin
47
Table 4.2: Trade union membership levels by nation and region, employees, 1995 to 2017
1995 2007 2008 2009 2010 2011 2012 2013 2014 2015 2016 2017
United Kingdom 7,113 7,051 6,928 6,770 6,589 6,447 6,508 6,490 6,458 6,491 6,216 6,235
England 5,694 5,638 5,536 5,426 5,258 5,172 5,212 5,134 5,119 5,105 4,939 5,016
Wales 434 433 431 393 396 407 379 420 410 416 422 352
Scotland 766 720 728 695 707 640 673 699 688 730 657 629
Northern Ireland 218 259 233 256 227 228 243 237 241 240 199 237
England 5,694 5,638 5,536 5,426 5,258 5,172 5,212 5,134 5,119 5,105 4,939 5,016
North East 401 372 357 358 327 340 328 301 336 323 289 305
North West 973 966 894 881 866 845 836 816 805 806 839 865
Yorkshire and the Humber 647 637 623 590 574 549 567 583 630 579 555 607
East Midlands 523 494 513 492 470 459 461 488 430 442 438 384
West Midlands 665 624 578 601 580 564 568 527 551 572 532 518
East of England 525 533 527 530 530 535 524 527 509 501 466 485
London 760 737 742 662 677 643 696 707 689 642 664 658
South East 724 751 777 768 745 726 727 728 692 761 677 726
South West 478 524 526 546 489 510 505 456 476 479 480 468
Table source: Labour Force Survey, Office for National Statistics Table notes: 1. Membership levels are based on the methodology described in the technical note
2. There was a small data issue with the LFS questionnaire in Northern Ireland in 1997 causing an undercount of up to 10,000 union members or 0.1 percentage points (see technical note for an explanation)

Trade Union Membership 2017: Statistical Bulletin
48
Table 4.3: Trade union membership as a proportion of employees, trade union presence and collective agreement coverage by regions, 2017
Per cent, not seasonally adjusted
Union
membership Trade unions present
in workplace1,3 Employee’s pay affected by
collective agreement between an employer and
trade union2
Region
Tyne and Wear 30.7 60.1 35.1
Rest of North East 26.8 53.9 33.2
Greater Manchester 25.5 49.1 26.6
Merseyside 38.9 59.9 36.9
Rest of North West 28.8 54.8 31.1
South Yorkshire 31.7 65.1 28.6
West Yorkshire 28.0 55.1 30.0
Rest of Yorkshire & Humberside 24.3 53.6 23.7
East Midlands 19.7 46.5 24.4
West Midlands Metropolitan County 24.7 47.3 26.9
Rest of West Midlands 20.7 46.3 24.7
East of England 19.1 42.9 20.8
Inner London 13.8 33.4 14.8
Outer London 20.3 44.2 21.8
South East 19.1 46.2 20.5
South West 21.1 50.3 24.7
Wales 30.0 58.1 31.7
Strathclyde 29.6 53.6 36.4
Rest of Scotland 27.0 54.7 33.5
Northern Ireland 34.1 50.0 43.3
Table source: Labour Force Survey, Office for National Statistics Table notes:
1. The proportion of employees whose workplace has some employees who are union members 2. Collective agreement coverage is defined as the proportion of employees whose pay and conditions are agreed in
negotiations between the employer and a trade union. 3. The method for estimating trade union presence has been revised. This is reflected in higher rates than shown in previous
bulletins.

Trade Union Membership 2017: Statistical Bulletin
49
Annex: Technical Note
National Statistics
National Statistics is a quality marker applied to the United Kingdom's official statistics outputs. National Statistics are regulated by the UK Statistics Authority, established on 1st April 2008. All official statistics accredited as ‘National Statistics’ are compliant with the UK Statistics Authority’s Code of Practice for Official Statistics.
Concepts and definitions Employee: People who regard themselves as paid wage and salary earners. People with two or more jobs are counted only once. Employment: The number of people with jobs is measured by the Labour Force Survey and includes people aged 16 or over who did paid work (as an employee or self-employed), those who had a job that they were temporarily away from, those on government-supported training and employment programmes. For this publication, the numbers in employment exclude those doing unpaid family work. Labour Force Survey (LFS): The main source for information on the labour market in the United Kingdom. It is a random household survey of approximately 40,000 households conducted every three months by the Office for National Statistics (ONS). As well as private households, the survey includes people living in communal establishments (student halls of residence, National Health Service accommodation, etc.). The survey was conducted once every two years between 1973 and 1983 and annually from 1983 until 1991. It has been conducted quarterly since 1992, with a change to calendar quarters from seasonal quarters made in 2006. The LFS is a sample survey and consequently estimates are subject to both sampling and non-sampling error. Trade union: The Trade Union and Labour Relations (Consolidation) Act 1992 defines a trade union as an organisation which consists wholly or mainly of workers of one or more descriptions and whose principal purposes include the regulation of relations between workers and employers or employers’ associations. Trade union member: A person in employment who self-defines that they belong to a trade union or staff association when asked in the Labour Force Survey (for the question please see table below). Union density: The rate or proportion of employees or those in employment who are a trade union member. Expressed as a percentage. Union presence: Whether or not a trade union or staff association is present within a workplace.
Collective agreement: Whether the pay and conditions of employees are directly affected by
an agreement between their employer and a trade union.
Trade Union Membership 2017: Statistical Bulletin
50
Trade union questions in the Labour Force Survey A question on the LFS on trade union membership has been asked annually since 1989 of all individuals in employment. Questions on trade union presence and recognition were introduced in 1993 and the question on collective agreements was introduced in 1996. The questions relating to trade union membership were reordered and reworded in 1999; these changes affect the time-series for trade union presence and collective agreements. The union questions were altered substantially in the 1999 questionnaire. The exact wording and sequence of the questions as they are now and as they were previously are shown below. The following should be noted:
• The wording of the question that asks respondents whether they are a member of a trade union remains the same, only its place in the sequence has changed.
• The question that asks whether any of the people at the respondent’s place of work are members of a trade union or staff association is designed to measure trade union presence. The wording, routing and sequence of this question have changed. Previously, it was asked of all in employment; now it is only asked to those who say that they are not union members.
• Before 1999, the question on whether the respondent’s pay and conditions were directly affected by collective agreements (TUCOV) was only asked where the respondent first identified unions as being present at the workplace (TUPRES), and then whether or not it was recognised (TUREC). This meant that the number of people whose pay and conditions were affected by collective agreement was an underestimate. For this reason, the routing of the question was changed in the 1999 LFS and is now asked of all in employment. Users must therefore be aware that data derived from the TUCOV variable in the 1999 dataset are not directly comparable with those of previous years due to the change in the question’s coverage.
• It is possible that some non-sampling error arises in the series of questions on trade unions because of measurement problems. Around a third of the sample are proxy respondents, and the data show that this group are less likely to be identified as union members than those responding on their own behalf. An estimate of the extent of bias is provided below.
On the question of coverage of collective agreements, it is known from surveys of employers that only a small proportion of public sector workplaces are not covered, and that these arrangements are generally made at head office level or across many organisations. It is therefore likely that employees who are not union members and who work in small workplaces in the public sector may be unaware that collective bargaining arrangements apply to their organisation. In addition, because sector is self-reported in the LFS, there may be a number of respondents wrongly classifying themselves as public sector workers. Consequently, there may be a downward bias to this measure. Also, it should be noted that the question in the Labour Force Survey specifically refers to negotiations between the employer and a trade union that affect an employee’s pay and conditions.

Trade Union Membership 2017: Statistical Bulletin
51
Table 1: Structure of trade union questions in Labour Force Survey
Previous union questions Current union questions
All in employment: TUPRES At your place of work, are there any unions, staff associations or groups of unions?
All in employment: UNION Are you a member of a trade union or staff association?
If yes: TUREC Is it/are any of them recognised by management for negotiating pay and conditions of employment?
If no: TUPRES Are any of the people at your place of work members of a trade union or staff association?
If yes: TUCOV Are your pay and conditions of employment directly affected by agreements between your employer and any trade union(s) or staff association?
All in employment: TUCOV Are your pay and conditions of employment directly affected by agreements between your employer and any trade union(s) or staff association?
All in employment: UNION Are you a member of a trade union or staff association?
Source: Labour Force Survey, Office for National Statistics
Northern Ireland 1997 data issue In Autumn 1997, incorrect routing of Northern Ireland respondents meant that only those who answered yes to TUPRES were asked UNION. Therefore, there was under-response of unknown size to UNION. Those who should have been asked UNION were instead coded as not having answered the question. BEIS analysis indicates this may mean that there is an undercount of up to 10,000 in 1997 levels or 0.1 percentage points in 1997 proportions.
Variables in the LFS Most of the classifications used to place respondents in different categories are based on a direct question relying on the person’s self-assessment of their circumstances. Some are based on a combination of more than one question, and others are coded by the ONS based on standard conventions. Details are provided below. Gender, age and ethnic group are self-defined. Highest qualification is principally based on a question asking individuals to nominate what qualifications they have from a list of around 50 categories. These have then been aggregated for the purposes of analysis. The categories for ethnic groups have been changed in the LFS in both 2001 and 2011 to be consistent with those used in the 2001 and 2011 Censuses respectively. With the exception of occupation, all classifications used in this publication are self-defined. In particular, it should be noted that the two aspects of employment status – full-time or part-time, and permanent or temporary – are based on direct questions and do not rely on any set criteria (e.g. number of hours worked). The classification for flexible working hours only includes those who work under such arrangements, and the final category of “work mainly at home/same grounds” is taken from a separate question on homeworking. Region and whether an individual is an employee are both self-defined variables.

Trade Union Membership 2017: Statistical Bulletin
52
Revised method for estimating union presence Prompted by correspondence with Rhys Davies of the Wales Institute for Social and Economic Research at Cardiff University, BEIS reconsidered the calculations used to estimate union presence in the workplace from the Labour Force Survey data. Previously, all those who answered ‘no’ to the ‘UNION’ question (about whether the respondent was a union member) were included in the population of employees used to estimate trade union presence, even if they did not provide a valid response to the ‘TUPRES’ question (on whether any people in the workplace were members of a trade union). This included people who said they used their home as their place of work or main base for work. This makes an underlying assumption that those who did not provide a valid response to ‘TUPRES’ would not have others in their workplace who were members of a trade union. After examining the data, on balance BEIS decided that it would be more appropriate to exclude those who did not provide a valid response to the TUPRES question from the population used to estimate union presence. The new method excludes this group from the estimates of union presence. Occupational classifications In 2011, the LFS occupational classifications use the new 2010 Standard Occupational Classification (SOC2010). Between 2001 and 2010, they were defined using SOC2000, while prior to 2000 they were based on SOC90. The 2010 update has resulted in a name change to two of the broad occupation groups: 'Managers and senior officials' has been replaced by 'Managers, directors and senior officials' and 'Personal service occupations' has been replaced by 'Caring, leisure and other service occupations'. The occupation groups are assigned to respondents by ONS staff based on an open-ended question asking people what was their job, and what did they mainly do in their job. A breakdown by managerial status is also given in this publication and this is obtained from a separate LFS question where manager status is self-defined. In previous years the responses were validated against the occupational codes but from 2001 this is no longer undertaken and the manager status is now wholly self-defined by the respondent. This has resulted in the number of managers defined from this question in 2001 onwards being significantly different from and not comparable with data from previous years. The manager and senior officials group in SOC2000 relates to managers who primarily have responsibility for personnel, and this broad occupational group has been further tightened in SOC 2010’s 'Managers, directors and senior officials' to focus on higher level, more strategic management. The self-defined manager variable is more widely defined including management responsibility for work-related activities as well as personnel. This accounts for the large difference in the union density levels for the SOC2000 and SOC2010 manager and senior officials group and the manager group within managerial status, with the latter being significantly higher. It is noted that the densities for foreman or supervisor and not manager or supervisor are in close agreement with data published in previous years.

Trade Union Membership 2017: Statistical Bulletin
53
Public and private sectors
Defining the sector in which people work is based on two questions first introduced in 1993. These ask, first, if they worked in a private firm or business, a limited company, or some other kind of organisation; and second, if other, what kind of non-private organisation. The LFS defines public sector as that owned, funded or run by central or local government and the private sector is everything else. Some respondents may not know whether their industry is in the public or private sector and, for certain types of activity, there may be no clear answer and the interviewers are given some guidelines to help sort out some common confusion. From July 2009 in the regular labour market statistics published by the ONS, Royal Bank of Scotland Group Plc and Lloyds Banking Group plc (until March 2014) were classified to the public sector, previously they were in the private sector. From June 2012 English colleges were classified to the private sector in the ONS’s published statistics, as was Royal Mail plc from December 2013. However in the microdata sets that are used for the analyses in this publication the sector that a respondent is classified remains as they answered the question and no adjustments are made to incorporate the reclassifications described above. Analysis of the fourth quarter microdata from 2006 to 2011 suggests that financial services employees in the public sector has remained consistently low across the period, at below 4% of the total number of financial services employees.
Industry classifications Industry is based on respondents’ answers to a question about what the firm or organisation for which they worked mainly made or did, and coded using the Standard Industrial Classification of economic activities 1992 (SIC92). From 2009, the sectoral breakdown of the LFS data has been collected according to the new Standard Industrial Classification (SIC) 2007. From that point onwards, all cases were coded to a new code, even when the respondent's situation had not changed, due to the introduction of SIC 2007. There was no dual coding. The transition to the new classification was accompanied by the implementation of a new automatic coding tool for LFS interviewers. Prior to 2009, industry had been coded manually, using a paper-based SIC 92 volume. To enable users to compile a consistent back series ONS devised a program that maps SIC 92 codes onto SIC 2007 according to the assumed relationship between the two classifications. The analyses in this publication are based entirely on SIC 2007.
UK Standard Industrial Classification 2007 (UK SIC 2007) ONS undertook some analysis based on comparing Q4 2008 (the last occasion when SIC92 was used) and Q1 2009 (when SIC 2007 was first used) to assess the impact of implementing SIC 2007 on historical series. This showed that some adjustments are required to overcome step changes arising from switching from SIC92 to SIC 2007. For example, manufacturing sector which is traditionally seen as having large union membership showed a contraction of 9%. No attempt has been made to separate out the various different effects on each industry and ONS suggest applying the basic approach of simply scaling the entire back series by the appropriate factor to calculate levels. It should be noted that as trade union membership rates are calculated as a ratio of two levels the effect of scaling cancels out.

Trade Union Membership 2017: Statistical Bulletin
54
Sample size and standard errors The cell sizes in some tables in this publication are too small to provide reliable estimates and have been marked with an asterisk. In this publication data fewer than 10,000 have not been published because standard errors are likely to be larger than the estimates themselves. Although the ONS has lifted its protocol of not releasing data under the 10,000 threshold, it is now the statistician’s discretion whether to release anything under this threshold. As an indication of the standard errors in the trade union estimates, the standard errors around the total employment and employee union membership proportions are likely to be around 0.3 percentage points. Standard errors for union membership proportions by gender are likely to be around 0.4 percentage points. Standard errors for union membership proportions by region average around 0.9 percentage points.
Switch from seasonal to calendar quarters In 2006, the structure of the Labour Force Survey switched from a seasonal quarter basis to a calendar quarter basis. The last set of published LFS seasonal results covered December 2004 to February 2005. In accordance with European Union regulations, all subsequent quarters have been published on a calendar quarter basis. In 2008, the Office for National Statistics carried out an extensive reweighting programme and all quarterly Labour Force
Survey data are now published on a calendar quarter basis back to 1992. This has eliminated the structural break into the trade union membership time series associated with the change from seasonal to calendar quarters. Chart A1 shows the trade union density of UK employees from 1995 to 2007, as shown in Table 1.2b and trade union density from the previous LFS. The chart gives evidence that the reweighting of historic LFS datasets has not materially changed the trade union densities from those that were previously published.
Chart A1: Trade union density of UK employees, 1995-2007
Per cent
Source: Labour Force Survey, Office for National Statistics
5%
10%
15%
20%
25%
30%
35%
1995 1996 1997 1998 1999 2000 2001 2002 2003 2004 2005 2006 2007
Reweighted LFS
Old LFS

Trade Union Membership 2017: Statistical Bulletin
55
Estimating union membership levels Each household agreeing to take part in the LFS is interviewed on five consecutive quarters (or waves). However, there are cases on subsequent waves when households are not contactable or do not agree to continue taking part so further responses cannot be recorded. When this happens, current data may be imputed by carrying forward answers given by them in the previous interview. However, for questions that do not appear every quarter, as on trade union membership, there is no previous response to carry forward, and a ‘does not apply’ (DNA) response is therefore recorded. There are two possible methods of estimating union membership levels. One method relies on calculating an adjusted weight, whereby cases with missing data are assumed to have the same distribution as valid responses. Therefore missing data is included in the estimates by allocation of their weight along the same distribution as valid respondents. Unfortunately, due to the restructuring of the LFS to calendar quarters (described earlier) this produced too much missing data in the seasonal quarter series to produce reliable estimates. Information was lost for September in converting seasonal to calendar quarters and no information was available to be brought forward from December. Therefore it was not possible to display a consistent time series including the data originally collected on a seasonal quarter basis using the adjusted weight method. In order to mitigate these issues a second method was developed to closely approximate the results from an adjusted weights approach (see Table A2) but also allow a consistent time series with the calendar quarter information to be estimated. It consists of union density multiplied by the population (as estimated by the LFS). The method is improved by making the same calculation but by detailed age, gender and regional disaggregations and then aggregating them back up to national and regional levels. Age, gender and region were specifically chosen as they are the basis on which the LFS is weighted (see the Labour Survey User Guide Vol 1.). This approach is further supported by the fact that union density figures, are produced on a valid response basis and do not consider any missing data. Furthermore, union densities show a great deal of robustness under change. These estimates of union membership level are now provided as the headline figures in this publication (see Tables 1.2a, 1.3a, 4.2). To produce trade union membership broken down by public/ private sector a further step was applied. It consists of union density split by public and private sector multiplied by the union membership population (estimated as above). The calculations involved are similar to that of the second method described above apart from the fact that a further breakdown by sector was used. A comparable method was used to calculate membership levels by industry with a breakdown by industry used rather than a breakdown by public/ private sector. The table below gives a comparison of the estimates from the two methods between 2006 and 2010 by gender and employment status.

Trade Union Membership 2017: Statistical Bulletin
56
Table A2: Estimated trade union membership levels, United Kingdom, 2006 to 2010
Thousands, not seasonally adjusted
Employees In employment Density ×
Population Adjusted Weights
Difference Density × Population
Adjusted Weights
Difference
All employees 2006 7,021 6,992 29 7,359 7,315 44 2007 7,005 6,978 27 7,334 7,292 42 2008 6,878 6,857 21 7,219 7,188 31 2009 6,715 6,696 19 7,054 7,017 37 2010 6,536 6,530 6 6,854 6,818 36 Males 2006 3,430 3,400 30 3,649 3,611 38 2007 3,379 3,355 24 3,606 3,574 32 2008 3,278 3,254 24 3,522 3,487 35 2009 3,121 3,099 22 3,344 3,311 33 2010 2,976 2,967 9 3,188 3,162 26 Females 2006 3,591 3,591 - 3,710 3,702 8 2007 3,625 3,621 4 3,728 3,716 12 2008 3,599 3,601 -2 3,697 3,697 - 2009 3,593 3,596 -3 3,709 3,704 5 2010 3,560 3,562 -2 3,666 3,654 12
Table source: Labour Force Survey, Office for National Statistics
To provide the levels estimates in these statistics, BEIS uses the GOVTOR LFS variable for regions. If this variable isn’t available to analysts trying to replicate the results, then GOVTOF, or URESMC would provide a reasonable alternative. However, it would produce marginally different results.
Differences between the LFS and Trade union estimates from administrative data Another official source of trade union membership data is provided by the Certification Officer and can be seen in Table 1.1. Data collected annually from trade unions by the Certification Officer (CO) provide a long and consistent back series of the number of trade unions and the number of union members. The LFS has a shorter back series, from 1989 onwards, but can provide extensive information on the respondent’s individual and workplace characteristics, allowing more detailed analysis. Data from the LFS is mainly presented from 1992 in this publication since re-weighted micro datasets, in line with post-Census 2001 population estimates, are currently only available from 1992. There are differences in how the two sources report union membership. For example, the CO membership count includes all members of unions having their head office in Great Britain (unions that are listed or scheduled by the CO), including those members in Northern Ireland, the Irish Republic and ‘elsewhere abroad’. These figures may also include union members who are unemployed or retired. The LFS asks questions on the union status of all those in employment, thus excluding the unemployed and retired. The LFS also only covers those who are resident in the UK (or in Great Britain for the years 1992 to 1994). The LFS union questions have United Kingdom coverage from 1995 onwards. The LFS estimates the number of individuals who are union members, rather than the individual memberships. Hence those belonging to two unions would appear twice in the CO data, but only once in the LFS data. Also, due to the specific wording of the union question, the LFS, unlike the CO data, could count individuals that were members of a staff association but not members of a trade union.

Trade Union Membership 2017: Statistical Bulletin
57
LFS quality measures
Guidance and methodology on the LFS can be found on the ONS website at: www.ons.gov.uk/employmentandlabourmarket/peopleinwork/employmentandemployeetypes/methodologies/labourforcesurveyuserguidance And, information on LFS quality measures can be found at: www.ons.gov.uk/ons/guide-method/method-quality/specific/labour-market/labour-force-survey-quality-measures/index.html
LFS reweighting In 2014, the ONS published revised LFS data for 2001-2014 to take account of the latest available official population estimates, which reflected the results of the 2011 Census. The microdata based on 2014 weights have been used to update the data from 2001 to 2011 in this publication. The most recent ONS re-weighting of LFS data occurred last year, when datasets from 2012 onwards were provided with updated weights (2017 weights). The 2017 dataset has also been provided with 2017 weights. We use the latest weights available for each year’s dataset for the statistics produced in this publication.

Trade Union Membership 2017: Statistical Bulletin
58
Annual National Statistic reports
Trade Union Membership 2016, Kirsty Chapman Trade Union Membership 2015, Cara Maguire Trade Union Membership 2014, Connor Russell Trade Union Membership 2013, Andrew Rowlinson Trade Union Membership 2012, Andrew Rowlinson Trade Union Membership 2011, Nikki Brownlie Trade Union Membership 2010, James Achur Trade Union Membership 2009, James Achur Trade Union Membership 2008, Craig Barratt Trade Union Membership 2007, Sally Mercer and Richard Notley Trade Union Membership 2006, Heidi Grainger and Martin Crowther Trade Union Membership 2005, Heidi Grainger Trade Union Membership 2004, Heidi Grainger, Heather Holt Trade Union Membership 2003, Tom Palmer, Heidi Grainger, Grant Fitzner
Trade union membership articles in Labour Market Trends 1. Analysis in brief: Trade union membership: estimates from the autumn 2003 Labour Force Survey, by Stephen Hicks and Tom Palmer. March 2004.
2. Labour Market Spotlight: Trade union membership. July 2003.
3. Article: Trade union membership: an analysis of data from the autumn 2001 LFS, by Keith Brook. July 2002.
4. Article: Trade union membership 1999-2000: an analysis of data from the Certification Officer and the Labour Force Survey, by Abby Sneade. September 2001.
5. Article: Trade union membership 1998-99: an analysis of data from the Certification Officer and Labour Force Survey, by Stephen Hicks. July 2000.
6. Article: Trade union membership and recognition 1997-8: an analysis of data from the Certification Officer and the Labour Force Survey, by Paul Bland. July 1999.
Trade union membership: additional analysis 7. Use and users of BIS statistics on trade union membership, April 2013.
8. Trade union membership statistics: Measuring bias in the Labour Force Survey, March 2013
9. Sampling variance in the trade union membership statistics, March 2013
10. Trade union membership statistics: 2012 to 2013 user survey report, March 2013

© Crown copyright 2018
This publication is licensed under the terms of the Open Government Licence v3.0 except where otherwise stated. To view this licence, visit nationalarchives.gov.uk/doc/open-government-licence/version/3 or write to the Information Policy Team, The National Archives, Kew, London TW9 4DU, or email: [email protected] we have identified any third party copyright information you will need to obtain permission from the copyright holders concerned.
This publication available from www.gov.uk/beis
Contact us if you have any enquiries about this publication, including requests for alternative formats, at:
Department for Business, Energy and Industrial Strategy 1 Victoria Street London SW1H 0ET Tel: 020 7215 5000
Email: [email protected]