Embed Size (px)
Citation preview

Trade, Unemployment and Labour MarketInstitutions
Jaewon Kim

c Jaewon Kim, Stockholm, 2011
ISSN 1404-3491
ISBN 978-91-7447-273-8
Printed in Sweden by Universitetsservice, US-AB, Stockholm 2011
Distributor: Department of Economics, Stockholm University

Doctoral DissertationDepartment of EconomicsStockholm University
Abstract
The thesis consists of three papers, summarised as follows.
�The Determinants of Labour Market Institutions: A Panel Data Study�
This paper analyses the argument that labour market institutions can be thought
of as devices for social insurance. It investigates the hypotheses that a country�s
exposure to external risk and ethnic fractionalisation are correlated with labor mar-
ket institutions. Extreme bounds analysis with panel data of fourty years indicates
that countries that are more open to international trade have stricter employment
protection, strong unions, and a more coordinated wage bargaining process. More-
over, there is evidence that union density is negatively associated with the degree
of ethnic fracationalisation.
�Why do Some Studies Show that Generous Unemployment Bene�ts Increase
Unemployment Rates? A Meta-Analysis of Cross-Country Studies�
This paper investigates the hypothesis that generous unemployment bene�ts give
rise to high levels of unemployment by systematically reviewing 34 cross-country
studies. In contrast to conventional literature surveys, I perform a meta-analysis
which applies regression techniques to a set of results taken from the existing lit-
erature. The main �nding is that the choice of the primary data and estimation
method matter for the �nal outcome. The control variables in the primary studies
also a¤ect the results.
�The E¤ects of Trade on Unemployment: Evidence from 20 OECD countries�
This study empirically investigates if international trade has an impact on ag-
gregate unemployment in the presence of labour market institutions. Using data for
twenty OECD countries for the years 1961-2008, this study �nds that an increase
in trade leads to higher aggregate unemployment as it interacts with rigid labour
market institutions, whereas it may reduce aggregate unemployment if the labour
market is characterised by �exibility. In a country with the average degree of the
labour market rigidities, an increase in trade has no signi�cant e¤ect on unemploy-
ment rates.
iii

To my family in Sweden and in Korea
iv

v

Acknowledgments
For some time, I have been thinking about how it would feel to write the last
words in this thesis. Finally, I am standing in that point recalling my entire doctoral
study period. It was a collage of ups and downs. At the beginning of the program,
I felt uncertain about myself surrounded by "highly intelligent" people. It was a
challenging period of my life spending days struggling with assignments and exams
that seemed to be endless. In the middle of my doctoral study, when I �nally
started to my own research, there have been days when I felt so happy with all
those "signi�cant" regression results. In the following days, I felt down, when I
found that some changes like clustering made all those results insigni�cant. The
�nal part of my study was about polishing the essays countless times, which thought
me the virtue of being patient. After all these moments, if someone asks me what I
have learned during my doctorate study, I would answer that besides complicated-
looking economic theories and econometric models, fairly good skills with my beloved
programs, Scienti�c WorkPlace and STATA, and being able to provide detailed,
logical, and sometimes creative answers to some questions, it was about not giving
up and completing what I have started.
There are many people whom I met during the process of completing this thesis.
First and foremost, I would like to express my sincere gratitude towards my advisor,
Ann-So�e Kolm, for her valuable help in structuring my thoughts and being a critical
reader of my paper. I am greatly indebted to Ann-So�e for her patience and constant
support. Sometime we met for discussions on weekends or near my home with my
newborn daughter to save my time. Her support gave me the strength to complete
my dissertation.
I am particularly indebted to my assisting thesis advisor, Matthew Lindquist
and Jonas Vlachos for their excellent advice and for helping me to get started with
my second and third essays. Matthew gave great encouragement as well as practical
help for my second essay. Jonas suggested brilliant ideas for the third essay.
I also would like to mention the advisor for my �rst essay, the late Jonas Agell,
who past away in 2007. He inspired me to �nd the topic of my �rst essay, labour
market institutions, which became the topic for the rest of my thesis. Although the
time that I knew him may not be long, his elegant theoretical models, encourage-
ment, and care for others make me still think of him.
During my PhD program, I had several moments to teach students. That ex-
perience did not only deepen my understanding in economics, but also gave a very
vi

vii
positive feeling to be able to share my knowledge with others. I have enjoyed work-
ing with Michael Lundholm, Ann-So�e Kolm, and Mahmood Arai. I would like to
thank the students as well. I also gratefully acknowledge Hans Wijkander, Jonas
Häckner, and Annika Alexius for their support and their e¤orts to make such a good
program.
Special thanks go to my o¢ ce mate, Gülay. She has been a truly good colleague
who often has great answers and solutions to my econometrics- or STATA-related
questions. I enjoyed stimulating discussions on the issues in her �eld, economics of
integration. I also thank her for sharing complains about the Swedish weather.
I am also grateful to my fellow graduate students for being such supportive col-
leagues and friends. I would like to mention the colleagues who left the department
like Anders Fredriksson, Mirco Tonin, Sara Åhlén, Camilo von Grei¤, Lars Johans-
son, Li-ju Chen, Maria Jakobsson, and Shon Ferguson. Also, Milo Bianchi, Christina
Amado, and Ganesh Munnorcode in SSE to mention just a few. I survived those
�rst years of the program thanks to them. I wish to mention Maria Cheung, Linnea
Wickström Östervall, and Magnus Rödin for sharing their thoughts of being grad-
uate students with children. Also, I thank Anders Åkerman for providing valuable
comments and insights. I thank to the faculty and sta¤ including Anita Karlsson
and Ingela Arvidsson at the Department of Economics, Stockholm University, for
being not only professional, but also making a friendly workplace. It was a bliss to
get to know you all.
The group of friends outside academia who deserve special thanks. They have
played an important part for this thesis, even though they may not have intended to
do so. They are Nadja Moraitis, Jan Ho, Håkan Jonsson, and Margret Tan. Besides
those mentioned above, there are many other friends who have helped me during
this long process. Sorry for not being able to name each of you personally.
I would like to express my thanks to my family in Korea and Sweden. They
have been a source of inspiration and consolation throughout my graduate study. In
particular, I wish to give my deepest gratitude to my mother, Hwa-sun Kong. She
�ew 7775.1 km, between Busan, South Korea to Stockholm, several times to help
me. I also thank my grandmother, Jeong-ok Wang for being very proud of me and
my brother, Tae-jung Kim, for being a good uncle to my children. Finally, I would
like to thank my husband, Andrew Tham, who was willing to move to Stockholm
for my graduate study instead of moving back to Kuala Lumpur. Your support,
understanding, and patience mean everything to me. Without his support, none of
this would have been possible. I thank my children Jun and Joyi for embellishing

viii
my life. To them, I dedicate this thesis.
Stockholm, May 2011
Jaewon Kim
Table of Contents
Chapter 1: Introduction 1
Chapter 2: The Determinants of Labour Market Institutions: 7
A Panel Data Study
Chapter 3: Why do Some Studies Show that Generous 37
Unemployment Bene�ts Increase Unemployment
Rates? A Meta-Analysis of Cross-Country Studies
Chapter 4: The E¤ects of Trade on Unemployment: Evidence 73
from 20 OECD Countries
ix

x

Chapter 1
Introduction
This thesis consists of three essays that study topics in labour economics and trade.
These studies have their roots in the literature that analyses labour market institu-
tions and unemployment. The issue of unemployment has been vigorously studied
by numerous economists with various methods of economic analysis. Jackman et al.
(1990) analyse the e¤ect of a few rather crude measures of labour market institu-
tions on unemployment rates in the 1970s and the 1980s. Since then, economists in
this line of research have put a great focus on the role of so-called rigidities imposed
by the labour market institutions to explain the contrasting unemployment rates in
the U.S. and the European countries. Blanchard and Wolfers (2000) investigate the
rise in European unemployment since the 1960s with the labour market institutions
and the shocks.
The three essays in this thesis shed further light on the literature studying labour
market institutions and unemployment. In the �rst essay, entitled "The Determi-
nants of Labour Market Institutions: A Panel Data Study," I attempt to �nd the
factors that may determine the structure of labour market institutions. Economic
analyses that focus on the endogeneity of institutions have recently received great
attention. Besides analysing how the di¤erent features of labour market institutions
can a¤ect unemployment rates, it is important to study why such features of the
labour market institutions have been shaped the way they are in the �rst place.
According to the CEP-OECD Labour Market Institutions data, which are fre-
quently used in this thesis, the U.S. and Japan have had the least generous unem-
ployment insurance since the 1960s. The generosity of the unemployment insurance
has been increasing over time in the average European countries except the U.K.
The Southern European countries such as Portugal and Spain have the strictest
employment protection, while the Anglo-Saxon countries, the U.S., the U.K., and
1
2 Chapter 1. Introduction
Canada have the least strict employment protection. The measure of the strength
of trade unions, net union density, has been the highest in Sweden and the lowest in
the U.S. since the year 1960, when this measure was created. The wage bargaining
process in the European countries and Japan has been highly centralised, while that
in the U.S. followed by the U.K. has been the least coordinated. Why do some coun-
tries such as the U.S. have lax labour market institutions, while others like many of
the European countries have more extensive labour market institutions?
An increase in external risk as well as the degree of ethnic fractionalisation are
studied as the potential factors that are likely to be associated with the structure
of labour market institutions. Rodrik (1998) argues that an increase in external
risk leads to a greater volatility in domestic income and consumption. Thus, there
is an increasing incentive for a larger public sector which can reduce the income
volatility. Similarly, if exposure to trade increases the volatility in income and
consumption, labour market institutions, which are characterised by the generous
unemployment insurance, stringent employment protection, strong trade unions,
and a centralised wage bargaining process, can serve the purpose of reducing this
volatility and function as social insurance devices against external risk.
Moreover, as argued by Agell (1999), labour market institutions that compress
wages can function as an insurance against income uncertainty, when a country is
more open to international trade. Furthermore, in case higher exposure to trade
increases job turnover or the risk of job loss, labour market institutions can serve as
an insurance device. Hence, increasing openness to trade or volatile terms of trade
may call for more extensive labour market institutions.
The ethnic fragmentation of a country may also a¤ect whether the labour market
institutions are organised along collective lines. Di¤erent ethnic groups often rep-
resent di¤erent income levels and preferences, which makes it more di¢ cult to pool
resources to provide public goods. This means that a homogenous country in terms
of ethnicity is more likely to have extensive labour market institutions as compared
to their largely heterogenous counterparts.
Through the extreme bounds analysis, this study �nds robust evidence for a more
open country in terms of international trade tending to have more stringent employ-
ment protection, stronger unions, and more centralised wage bargaining. Moreover,
the empirical analysis shows that a relatively more homogeneous country is more
prone to have strong unions.
The second essay is entitled "Why do some studies show that generous unem-
ployment bene�ts increase unemployment rates? A Meta-Analysis of Cross-Country

Chapter 1. Introduction 3
Studies". This research question arose while I surveyed the empirical literature
on the e¤ects of labour market institutions on unemployment rates. There was a
notable di¤erence in the coe¢ cient estimates on the unemployment bene�t replace-
ment ratio and those on the unemployment bene�t duration index in the equation
of unemployment rates. For instance, earlier studies such as Nickell et al. (1998)
report coe¢ cient estimates of the unemployment bene�t replacement rate between
0.011 and 0.013, while Belot and van Ours (2001 & 2004) report that they are ap-
proximately between �2.14 and 1.09, where some of the coe¢ cient estimates are
insigni�cant. Why do some empirical studies conclude that generous unemployment
bene�ts raise the unemployment rates, while other studies found no signi�cant as-
sociation between generous unemployment bene�ts and unemployment rates?
By reviewing all comparable previous empirical studies analysing the e¤ect of the
generous unemployment bene�ts on the unemployment rates in the OECD countries,
I investigate whether the characteristics of the empirical studies can systematically
give results that tend to point in a certain direction. Previously, there have been a
few studies dealing with the robustness of the results in the literature of labour mar-
ket institutions and unemployment. The current study is a new attempt to assess
the reasons why some studies have found a positive correlation between the generos-
ity of unemployment bene�ts and the aggregate unemployment rates, while other
studies have found no signi�cant relationship using the method of meta-regression
analysis.1
A total of 34 studies which use cross-country panel data to empirically analyse
the relationship between the generosity of unemployment bene�ts and the aggregate
unemployment rates are reviewed and used in the meta-data set. The meta-data
are estimated using a probit model to identify the factors that produce signi�cant
positive associations between the generosity of unemployment bene�ts and the level
of unemployment. Using OLS, the meta-data are analysed to quantify the factors
that give large correlations between these two variables. The meta-regression analy-
sis suggests that the choice of the primary data and estimation methods a¤ect the
results in the previous studies. Whether some control variables such as labour de-
mand shocks are included in the primary studies or not is also of importance for the
results.
1The meta-analysis is widely used in the natural sciences. Whether the use of the method ofthe meta-regression analysis in studying the current question is suitable or not can be subject todispute. However, I defend this essay as an attempt to more systematically study the empirical�ndings in the literature.

4 Chapter 1. Introduction
The third and �nal essay is entitled "The E¤ects of Trade on Unemployment:
Evidence from 20 OECD countries". This essay focuses on the role of international
trade in explaining the development of the aggregate unemployment rates in OECD
countries. In particular, this essay empirically studies whether an increase in inter-
national trade has any e¤ect on the aggregate unemployment rates in the presence
of labour market institutions.
The theoretical models that attempt to explain the association between trade and
unemployment show that an increase in trade can reduce unemployment, since trade
improves the economy-wide value of the marginal product of labour. Nevertheless,
this relation between trade and unemployment can be a¤ected by the structure of
labour market institutions. Rigidities imposed by the labour market institutions
can a¤ect the cost of labour, the relative factor and good prices.
The measure of openness, total imports, imports from the high-income coun-
tries, and imports from low-income countries as ratios of GDP are used as trade
variables. I use the e¤ect of the stringency of employment protection legislation, the
generosity of unemployment bene�ts, the strength of trade unions, and the degree
of centralisation in the wage bargain process as the control variables or to be in-
teracted with the trade variables. This essay shows that labour market institutions
are important factors in determining the aggregate unemployment rates not only by
themselves as many economists have previously argued, but also through interac-
tions with trade. There is clear evidence that trade is likely to lead to an increase
(decrease) in aggregate unemployment in countries with relatively rigid (�exible)
labour market institutions. Moreover, the results imply that in a country with an
average extent of labour market institutions, an increase in trade has no signi�cant
e¤ect on the unemployment rates.
Bibliography
[1] Agell, J. (1999), "On the Bene�ts from Rigid labour Markets: Norms, Market
Failures, and Social Insurance," The Economic Journal, 109 (453), 143-164.
[2] Belot, M. and J. C. van Ours (2004), "Does the recent success of some OECD
countries in lowering their unemployment rates lie in the clever design of their
labor market reforms?," Oxford Economic Papers, 56 (4), 621-642.
[3] Belot, M. and J. C. van Ours (2001), "Unemployment and Labor Market In-
stitutions: An Empirical Analysis," Journal of the Japanese and International
Economies, 15 (4), 403-418.
[4] Blanchard, O. and J. Wolfers (2000), "The Role of Shocks and Institutions in
the Rise of European Unemployment: the Aggregate Evidence," The Economic
Journal, 110 (462), 1-33.
[5] Jackman, R., C. Pissarides, and S. Savouri (1990), "Labour Market Policies and
Unemployment in the OECD," Economic Policy, 5 (2), 449-490.
[6] Nickell, S. (1998), "Unemployment: Questions and Some Answers," The Eco-
nomic Journal, 108 (448), 802�816.
[7] Rodrik, D. (1998), "Why DoMore Open Economies Have Bigger Governments?,"
Journal of Political Economy, 106 (5), 997-1032.
5

6 Chapter 1. Introduction

Chapter 2
The Determinants of Labour
Market Institutions: A Panel Data
Study�
1 Introduction
There has been a widespread belief that rigidities imposed by labour market institu-
tions cause long-term high unemployment in Europe. In the middle of the 1990s, the
OECD released a series of publications recommending labour market deregulation
as a remedy for the high and persistent unemployment problem.1 Since then, a
large literature has been developed about the e¤ects of labour market institutions
on economic performance. Nickell and Layard (1999) argued that the existence of
strong unions and generous and long-lasting unemployment bene�ts can raise un-
employment and lower economic growth. Elmeskov et al. (1998) argued that strict
regulations on �ring, high tax wedges, and generous unemployment bene�ts can cre-
ate structural unemployment in the OECD countries. However, what they overlook
is the potential endogeneity of those institutions.
This study instead looks at labour market institutions from the opposite direction
and explains why such labour market institutions are created in the �rst place. It
investigates two hypotheses for why some countries have so-called "rigid" labour
market institutions, while others have developed more �exible ones.
� I thank the late Jonas Agell, Ann-So�e Kolm, Helena Svaleryd, and Jonas Vlachos for their ad-vice and support. Financial support from Jan Wallander�s and Tom Hedelius�Research Foundationis gratefully acknowledged.
1 See inter alia "The OECD Jobs Strategy: Enhancing the E¤ectiveness of Active Labor MarketPolicies (1996)" and "Implementing the OECD Jobs Strategy: Member Countries� Experience(1997)."
7

8 Chapter 2. The Determinants of Labour Market Institutions
The �rst hypothesis is that a country�s exposure to external risk a¤ects the struc-
ture of labour market institutions. The idea starts from Rodrik�s (1998) analysis on
the correlation between a country�s exposure to international trade and the size of
its government. According to Rodrik (1998), more open countries tend to develop
larger public sectors, since public sector is relatively safe against external risk. Agell
(1999, 2002) also view labour market institutions as devices to reduce external risk.
He argues that globalisation, on the one hand, increases the e¢ ciency costs asso-
ciated with labour market institutions. On the other hand, it may also lead to an
increased demand for labour market institutions to protect workers from increasing
external risk. Hence, it is not obvious whether a country�s exposure to international
trade leads to more or less rigid labour market institutions.
The second hypothesis is that the degree of ethnic fractionalisation a¤ects the
structure of labour market institutions. Both theoretical implications and empirical
evidence by Alesina et al. (1999) support that ethnic fragmentation of a society is a
determinant of some institutions. Di¤erent ethnic groups often represent diversi�ed
preferences and income levels, which makes it di¢ cult to pool resources together to
provide public goods. This paper examines the similar logic for labour market insti-
tutions. A country with highly heterogenous ethnic groups tends to develop labour
market institutions that follow laissez-faire, while the homogenous counterparts tend
to develop labour market institutions that are organised collectively.
The empirical analysis is based on a panel dataset of 20 OECD countries over 40
years. It contains labour market institutions such as generosity of unemployment
bene�ts, stringency in employment protection legislation, strength of unions, and
the degree of centralisation in wage bargaining. This study enriches Agell�s (2002)
analysis that uses cross-sectional data by having a panel data dimension going back
to the 1960s. Another distinctive contribution of this study is the systematic sensi-
tivity analysis. The results of empirical studies with macroeconomic data are often
sensitive to the set of conditioning variables. To obtain robust results, I use the
extreme bounds analysis (EBA) along the lines of Levine and Renelt (1992).
I �nd robust evidence of a positive association between openness to trade and
several labour market institutions. If countries� exposure to external risk a¤ects
income volatility and job turnover, larger openness to trade can call for more ex-
tensive social insurances through stricter employment protection, more generous
unemployment bene�ts, stronger unions, and more coordinated wage bargaining. I
also present a highly robust negative correlation between the degree of ethnic frac-
tionalisation and union density, which implies that more homogeneous countries in
Chapter 2. The Determinants of Labour Market Institutions 9
terms of ethnicity have stronger unions. The result is in line with Alesina et al.
(1999) and Agell (2002). Ethnic fractionalisation is widely accepted as an exoge-
nous variable. Hence, the correlation between ethnic fractionalisation and union
density can be interpreted as causation. However, as is always the case in studies
using aggregate data, it is almost impossible to make a conclusion of an indisputable
causation.
The remainder of this paper is organised as follows. In the following section, I dis-
cuss theories on the relationship between openness to international trade and labour
market institutions. The section also discusses the role of ethnic fragmentation in
determining the structure of institutions. In section 3, I discuss the econometric
methodology and present the data. Section 4 presents the results from the baseline
regression and the extreme bounds analysis. Section 5 discusses endogeneity issues,
and Section 6 concludes.2
2 Theoretical Background
2.1 The Role of Labour Market Institutions
Rodrik�s (1998) model shows how government spending through �nal good con-
sumption can provide social insurance in an economy subject to external risk. This
follows as government spending can alleviate the volatility in income and consump-
tion following a greater exposure to trade. Similarly, one can argue that labour
market institutions can function as an insurance device for external risk. If expo-
sure to trade increases the volatility in income and consumption, as suggested by
Rodrik�s model, labour market institutions can also serve the purpose of reducing
this volatility. Moreover, if exposure to trade increases job turnover, or the risk of
job loss for employed workers, labour market institutions can serve as a device to re-
duce the risk of job loss. Employment protection legislation can therefore function as
insurance for labour market uncertainty by protection existing jobs. Unemployment
insurance, on the other hand, can reduce income volatility by guaranteeing income
security in the event of unemployment. Also, severance pay can smooth workers�
income if faced with unemployment risk. In fact, as argued by Agell (1999), all
labour market institutions that tend to compress wages can function as an insur-
2 Appendix I and II, which are available from the author upon request, provide detailed resultsfrom the EBA and summarise the EBA results using data between years 1960 and 1994, andbetween years 1960 and 1989.

10 Chapter 2. The Determinants of Labour Market Institutions
ance against income uncertainty. Thus, stronger unions, minimum-wage laws and
generous unemployment insurance can be in demand as the exposure to trade in-
creases.3
In short, provisions of social insurance through various labour market institutions
make it possible to smooth income �uctuations in case of labour market uncertainty
due to increasing openness to trade or volatile terms of trade. Lindbeck (1975)
argued that through extensive labour market policies which include not only unem-
ployment compensation, but also subsidies to �rms to retain and retrain workers, as
well as through large increase in public employment, governments can smooth out
shocks in an open economy. The empirical investigation will thus focus on whether
an increase in openness to trade, volatile terms of trade, and the combination of
these two have any signi�cant e¤ects on determining the structure of labour market
institutions.4
2.2 The Role of Ethnic fractionalisation
Another possible determinant of the structure of labour market institutions is the
degree of ethnic fractionalisation. From a model, where an individual can choose
between non-excludable public good and private good, Alesina et al. (1999) explain
that if there is preference polarization, people would prefer to keep taxes low and
devote more resources to private consumption rather than public consumption.
The authors argue that preference polarization of di¤erent groups is strongly
associated with ethnic fragmentation for two reasons. One is that di¤erent ethnic
groups have di¤erent preferences over how much public goods to be supplied. For
instance, an ethnic group with relatively low economic status would prefer more
extensive public provision of transportation, schools, and health service, while those
with better economic status prefer less public provisions with lower tax. The second
argument is that each ethnic group�s utility level for a given public good is reduced
if other groups also use it. They explained this mechanism as disutility in rivalry.
3 In the contrast to my hypothesis, Boulhol (2009) argues that globalisation reduces labourmarket rigidities. He explains that an increase in international trade makes it more pro�table for�rms to relocate abroad, which becomes a threat to unions and drives labour market institutionsto be more �exible.
4 There are several empirical studies on the e¤ect of globalisation on some of the labour mar-ket institutions. In particular, Dreher and Gaston (2007), Golden and Londregan (1998), Golden(2000), and Scruggs and Lange (2002) found little or no evidence that increasing trade or economicglobalisation have any signi�cant e¤ects on union membership or the degree of unionisation. Fis-cher and Somogyi (2009) found that globalisation has weakened protection of regularly employed,whereas it has an opposite e¤ect on the protection of temporarily employed.

Chapter 2. The Determinants of Labour Market Institutions 11
As a result, more ethnic fragmentation leads to fewer resources pooled together
to provide non-excludable public goods such as social insurances. Likewise, an
ethnically homogenous country is more likely to have stronger support for social
insurances through extensive labour market institutions.
This paper will empirically analyse whether the degree of ethnic fragmentation
has a direct e¤ect on the structure of labour market institutions, as well as how the
e¤ect of openness to trade on determining labour market institutions is dependent
on the degree of ethnic fragmentation through an interaction term.
3 Method and Data
This study will investigate the determinants of labour market institutions using
the method of extreme bounds analysis. There have been a number of empirical
studies that identify determinants of institutions. Most studies of this literature
have predominantly presented results from a few regressions. There is no systematic
sensitivity analysis being done. Reporting the estimates from a few speci�cations
often gives misleading inferences, because the estimated coe¢ cients on explanatory
variables might depend on the selection of control variables.
Systematic sensitivity analysis is essential, since these results are often fragile, in
the sense that they are only valid conditional on a speci�c set of control variables.
Leamer (1985) was the �rst to develop "Global Sensitivity Analysis." Levine and
Renelt (1992) later adopted a particular version of this sensitivity analysis. My
empirical investigation follows their method of the extreme bounds analysis (EBA)
to identify robust determinants of labour market institutions. I �rst describe the
procedure of the EBA, and then turn to discuss the choice of variables.
3.1 Method of Extreme Bounds Analysis
The extreme bounds analysis (EBA) starts from an equation of the form
Y = �II + �MM + �zZ + u, (2.1)
where Y is the dependent variable, M a set of explanatory variables, which are
the variables of interest, I a set of control variables that are always included in
the regression, and Z a subset of conditioning variables taken from the full set of

12 Chapter 2. The Determinants of Labour Market Institutions
potentially relevant variables.5 u is an error term.
The procedure of the EBA is as follows. First, I run a base regression that
includes only the I- and M-variables. Then, I estimate the model including all
possible linear combinations of up to three Z -variables.6 The basic idea of an EBA
is to analyse the consequences of changing the set of conditioning variables Z for the
estimated e¤ect of the M-variables on the dependent variable. Hence, I identify the
highest and lowest values for the coe¢ cient estimates on theM -variables, �M .7 The
extreme upper and lower bounds are de�ned as the maximum value of �̂M + 2�̂M ,
respective, the minimum value of ~�M � 2~�M .8 The M -variable is referred to be
"robust," if the coe¢ cient estimates are signi�cant at the 5% level in all regressions
and of the same sign at the two extreme bounds.
These criteria of robustness are strict. Sala-i-Martin (1997) argues that almost
all hypotheses will be rejected if one applies the strict EBA criteria. He instead sug-
gests to consider the entire distribution of the estimated coe¢ cients. Alternatively,
Widmalm (2001) simply relaxes the level of signi�cance from 5 to 10% level. I assess
the robustness as Widmalm (2001).
3.2 Data
This study examines the hypothesis that a country�s exposure to external risk and
ethnic fractionalisation are correlated with the structure of labour market institu-
tions using panel data. The equation to estimate is
Yit = ci + �t + �IIit + �MMit + �zZit + uit, (2.2)
where Yit is an index of a labour market institution, Iit a vector of the control
variables that are always included, Zit a vector of the conditioning variables that
5 The di¤erence between the I -variables and the Z -variables is that the I -variables are "stan-dard" control variables in aggregate data analysis, while the Z -variables are possible additionaleconomic explanatory variables, which according to the literature may be related to the structureof institutions.
6 Restricting the total number of the R.H.S. variables helps to reduce problems ofmulticollinearity.
7 In Appendix I, which is available from the author upon request, I call the highest and lowestvalues of the beta coe¢ cients as "high" and "low".
8 �̂M and �̂M denote the maximum value of the coe¢ cient estimates and its standard error. ~�Mand ~�M denote the equivalent for the minimum value.

Chapter 2. The Determinants of Labour Market Institutions 13
are selectively included as other potential explanatory variables, Mit a vector of the
variables of my primary interest. �t and ci are a time-speci�c and country-speci�c
e¤ect, respectively. The term uit is a usual residual.
I choose the �xed e¤ects model.9 It is generally more appropriate than a ran-
dom e¤ects model for cross-country data for two reasons. Firstly, if the individual
e¤ect represents omitted variables, it is highly likely that these country-speci�c char-
acteristics, given by ci, are correlated with the other regressors. The �xed e¤ects
estimator is consistent in the presence of time-constant omitted variables that can
be arbitrarily correlated with the observable covariates. Secondly, it is also fairly
likely that a macro panel will contain most of the countries of interest. Thus, it will
be less likely to be a random sample from a much larger universe of countries.
The panel data consist of 20 OECD countries over the period of 1961-2008.
Among them are �fteen European countries, and the rest are Australia, Canada,
Japan, New Zealand, and the United States.10 Since I focus on the long-term factors
that are associated with labour market institutions, all observations are compiled
averages starting from year 1961-65 and ending with 2001-2008, which makes nine
time periods.11
In this paper, several features of labour market institutions are analysed. The
dependent variables are the degree of unemployment bene�ts (UB), employment
protection legislation (EPL), net union density (UDNET), and centralisation in
wage bargaining (COW). These indices are taken from "Labour Market Institutions
Database" by Nickell and Nunziata (2001). Figures 2.1 - 2.4 show the development
of labour market institutions.
Figure 2.1 shows the development of the unemployment bene�t index. It is the
average of before tax unemployment bene�ts across the �rst �ve years of unemploy-
ment for three family situations. The index has been increasing in the European
countries except UK, while UK and Japan�s unemployment bene�ts are decreas-
ing since the 1970s. Sweden�s unemployment bene�t has been decreasing after the
9 I ran the Hausman speci�cation test including all I- and M-variables. For the index of un-employment bene�ts, �2 is 26.53 indicating that there is evidence that supports a �xed e¤ectsmodel above a random e¤ects model. For the indices, EPL, UDNET, and COW, no signi�cantdi¤erences of the zero-correlation of the unobserved heterogeneity ci and the covariates assumptionare observed.10 The �fteen European countries are Austria, Belgium, Denmark, Finland, France, Germany,Ireland, Italy, the Netherlands, Norway, Portugal, Spain, Sweden, Switzerland, and the UnitedKingdom. Up until 1989, Germany refers to West Germany.11 The degree of centralisation in wage bargaining data are available between 1960 and 2000,which gives eight time periods.
14 Chapter 2. The Determinants of Labour Market Institutions
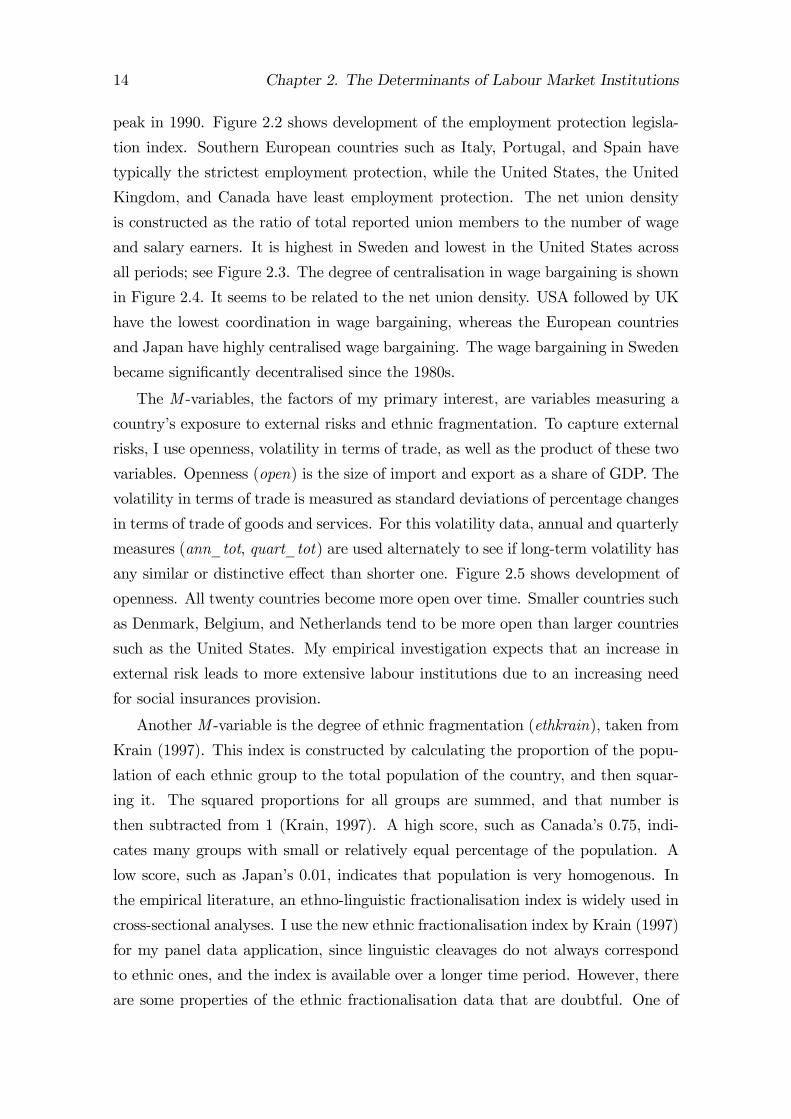
peak in 1990. Figure 2.2 shows development of the employment protection legisla-
tion index. Southern European countries such as Italy, Portugal, and Spain have
typically the strictest employment protection, while the United States, the United
Kingdom, and Canada have least employment protection. The net union density
is constructed as the ratio of total reported union members to the number of wage
and salary earners. It is highest in Sweden and lowest in the United States across
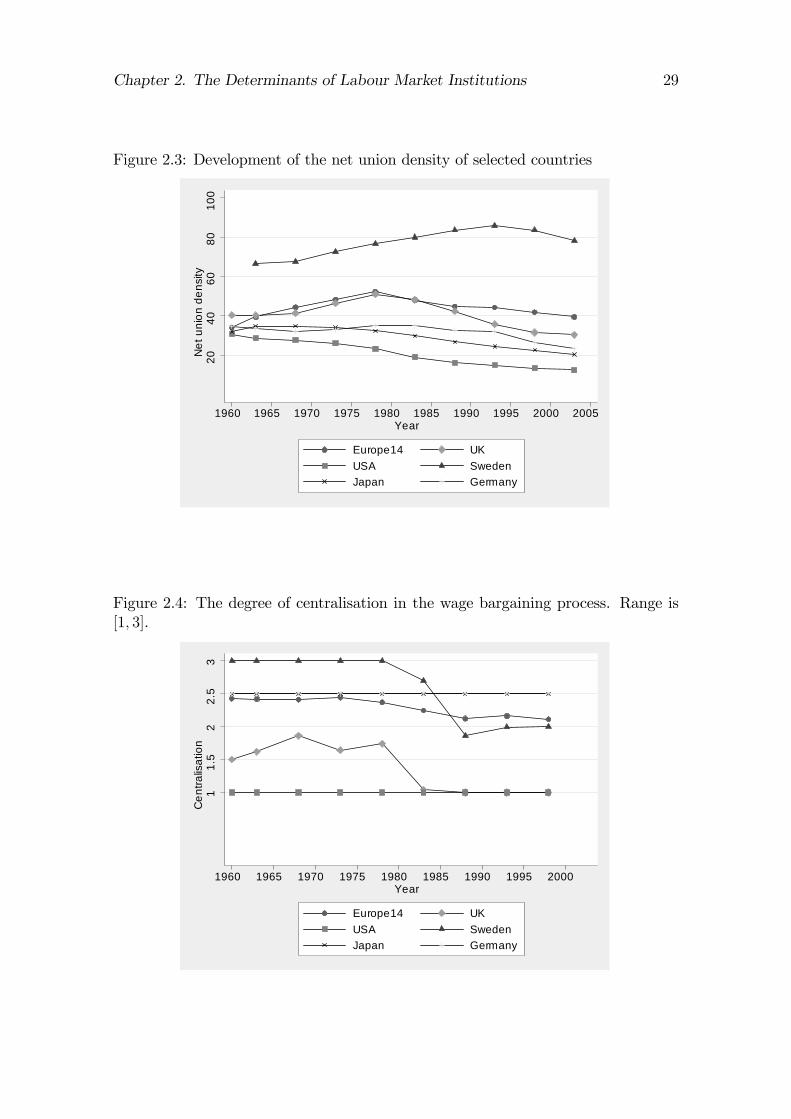
all periods; see Figure 2.3. The degree of centralisation in wage bargaining is shown
in Figure 2.4. It seems to be related to the net union density. USA followed by UK
have the lowest coordination in wage bargaining, whereas the European countries
and Japan have highly centralised wage bargaining. The wage bargaining in Sweden
became signi�cantly decentralised since the 1980s.
The M -variables, the factors of my primary interest, are variables measuring a
country�s exposure to external risks and ethnic fragmentation. To capture external
risks, I use openness, volatility in terms of trade, as well as the product of these two
variables. Openness (open) is the size of import and export as a share of GDP. The
volatility in terms of trade is measured as standard deviations of percentage changes
in terms of trade of goods and services. For this volatility data, annual and quarterly
measures (ann_tot, quart_tot) are used alternately to see if long-term volatility has
any similar or distinctive e¤ect than shorter one. Figure 2.5 shows development of
openness. All twenty countries become more open over time. Smaller countries such
as Denmark, Belgium, and Netherlands tend to be more open than larger countries
such as the United States. My empirical investigation expects that an increase in
external risk leads to more extensive labour institutions due to an increasing need
for social insurances provision.
Another M -variable is the degree of ethnic fragmentation (ethkrain), taken from
Krain (1997). This index is constructed by calculating the proportion of the popu-
lation of each ethnic group to the total population of the country, and then squar-
ing it. The squared proportions for all groups are summed, and that number is
then subtracted from 1 (Krain, 1997). A high score, such as Canada�s 0.75, indi-
cates many groups with small or relatively equal percentage of the population. A
low score, such as Japan�s 0.01, indicates that population is very homogenous. In
the empirical literature, an ethno-linguistic fractionalisation index is widely used in
cross-sectional analyses. I use the new ethnic fractionalisation index by Krain (1997)
for my panel data application, since linguistic cleavages do not always correspond
to ethnic ones, and the index is available over a longer time period. However, there
are some properties of the ethnic fractionalisation data that are doubtful. One of

Chapter 2. The Determinants of Labour Market Institutions 15
the most signi�cant problems is that the last observation for data collection ends
in year 1978. Krain (1997) simply continued the observation until year 1990, which
corresponds to the period 1995-99 in my panel dataset, since I use lagged values on
this variable. Furthermore, since it is observed in every ten years, it fails to describe
short-term variation of ethnic fractionalisation. For example, the data describes
that Sweden becomes more homogenous over time, which does not re�ect the latest
years.12 Despite such weaknesses, the data has been widely used in political science
literature. To avoid problems with missing observations and to increase robustness
of the results, I conduct robustness check with the data of the �rst 35 years and
thirty years. The overall results of this study is una¤ected by the potential problems
of the ethnic fractionalisation data.
Agell (2002) found signi�cant negative correlations between ethno-linguistic frac-
tionalisation and some of the labour market institutions. This supports the hypothe-
sis that countries with homogenous populations are more prone to develop extensive
labour market institutions. Figure 2.6 depicts the changes of ethnic fractionalisa-
tion scores of selected countries over forty years. There is very little variation on
the ethnic fractionalisation score, since a large-scaled migration that change ethnic
proportion is a phenomenon that happens over a much longer period of time than
forty years.
The I -variables, which are always included in the regressions, should be un-
doubtedly argued as basic underpinnings of the institutions. I choose GDP per
capita (gdpc) and total population (popul). The former measures economic a u-
ence of citizen of a country. According to Wagner�s (1883) law, one can expect that a
citizen�s demands for public services are increasing in economic a uence. However,
Cameron (1978) acknowledged that the rate of growth in the economic a uence of
a country does not contribute to the expansion of public economy. Whereas one
cannot expect whether GDP per capita is positively or negatively associated with
labour market institutions, it is necessary to control for the degree of economic
a uence of a country.
The base variable, total population, is a proxy to the size of the country or
the size of total labour force. Alesina and Wacziarg (1998) argued that smaller
countries have a larger share of the public consumption in GDP, and are also more
open to trade. Instead of the direct link between openness and government size,
they argued that the link is mediated by country size. Large countries can a¤ord to
12 According to information from the Swedish Migration Board, the number of foreign nationalsin Sweden has been the highest during years 1990-95.

16 Chapter 2. The Determinants of Labour Market Institutions
have smaller government and get bene�ts from a sizable domestic market. Moreover,
Wallerstein (1989) found a negative relationship between the size of the labour force
and unionisation rates. Extracting the e¤ect of total population on the dependent
variables, is thus necessary in identifying whether the variable of my interest (M -
variable), exposure to external risk, can be a robust determinant of the structure of
labour market institutions.
The potential conditioning variables, Z -variables, are drawn from those argued
by other studies as determinants of labour market institutions. I �rst choose the
dependency ratio (depend), which is equal to the number of persons younger than
age 15 and older than age 65 divided by the number of persons of working age.
Intuitively, provision of social insurances necessarily increases in dependency, since
the recipients of social welfare increase. Rodrik (1998) showed a highly signi�cant
positive correlation between the dependency ratio and the share of government con-
sumption in GDP.
Labour market institutions may also re�ect changes in the economic structure. In
order to capture the changes in industrial structure, I include civilian employment
in industrial sector as a share of total civilian employment (emp_ind). Dreher
and Gaston (2007) included the percentage of workers in industry to capture the
underlying process of de-industrialisation. Blaschke (2000) argued that unionisation
rates are usually higher in industry and the public sector, and lower in agriculture
and private sectors.
Political attitude is controlled by the variable, gov_right. This is the cabinet
composition of right-wing parties as a share of total cabinet posts weighted by days.
Intuitively, right-wing parties are commonly thought of as favouring �exibility in
a labour market, while left-wing parties favouring more regulation; see inter alia.
Botero et al., 2004. Dreher and Gaston (2007) argue that left-wing governments
favour union rights and a legislative environment. Saint-Paul (1996) acknowledged
that the existence of a right-wing government slows down the growth rate of mini-
mum wage. Similarly, Cameron (1978) argued that whether a country�s government
was generally by leftist parties or by non-leftist parties provides a strong clue to the
relative degree of change in the scope of public economy.
In addition, I include the �nancial openness index (�nopen) in the set of Z -
variables. The range of this �nancial openness index is [0, 14] increasing with the
degree of openness in �nancial institutions. Svaleryd and Vlachos (2002) argued that
there exists a signi�cant relationship between �nancial development and openness
to trade. Financial openness might a¤ect labour market institutions due to its risk-

Chapter 2. The Determinants of Labour Market Institutions 17
sharing feature. Other things being equal, a country with highly open �nancial
institutions has a better chance of risk-sharing. It may, therefore, have relatively
less incentive to use labour market institutions as a device of risk-sharing. In other
words, �nancial institutions might work as a substitute to labour market institutions
in risk-sharing. In line with this intuition, Bertola and Prete (2008) show evidence
that more developed �nancial markets weaken the relationship between openness
and government redistribution.
Finally, I introduce unemployment rate as a potential factor that is associated
with labour market institutions. Agell (2002) argued that risks of being unemployed
call for social insurances via labour market institutions. Elmeskov et al. (1998) re-
ported a highly signi�cant evidence of causality from high unemployment to high
unemployment bene�ts. Saint-Paul (1996) remarks that higher exposure to unem-
ployment facilitates a reduction in the level of employment protection. Wallerstein
and Western (2000) argue that a strong economy should bolster union membership.
Thus, low unemployment can be associated with higher union density. On the other
direction of causality, Blanchard and Wolfers (2000) argued that the interaction be-
tween shocks and institutions is crucial to explaining unemployment. To reduce the
obvious problem of reverse causality, I use lagged values of the unemployment rate.
Moreover, the unemployment rate is used only as a conditioning variable, rather
than as a primary explanatory variable. In other words, I am interested in whether
including or excluding the unemployment rate changes the relationship between the
M -variables and the indices of labour market institutions. The direct e¤ect of un-
employment rates on labour market institutions is beyond the scope of this study.
Table 2.1 presents the descriptive statistics for all variables.
4 Results
This section discusses the results from extreme bounds analysis (EBA) of the four
labour market institution variables. First, I estimate the baseline regressions that
include only the I - andM -variables; see Tables 2.2 - 2.5. In column (1) in each table
the M-variables which specify the size of external risk are openness to trade (open),
volatility in annual terms of trade (ann_tot), and the product of these two. The
coe¢ cient estimate of the variable (open) indicates the e¤ect of openness to inter-
national trade on a labour market institution when the volatility in terms of trade
is hypothetically held to zero. That on the interaction term (open)*(ann_tot) indi-
cates how much the e¤ect of openness on the labour market institution changes as

18 Chapter 2. The Determinants of Labour Market Institutions
the volatility in annual terms of trade increases. The coe¢ cient estimates in column
(2) can be interpreted analogously as the volatility in quarterly terms of trade is used
instead of annual ones. In column (3) I introduce an additional variable, the prod-
uct of ethnic fractionalisation and openness, to identify whether the degree of ethnic
heterogeneity a¤ects the association between openness and a labour market insti-
tutions. The positive/negative coe¢ cient estimate on this term (ethkrain)*(open)
implies that the e¤ect of an increase in openness on rigidity of a labour market
institution can be modi�ed/diminished as a country is more fractionalised in terms
of ethnicity.
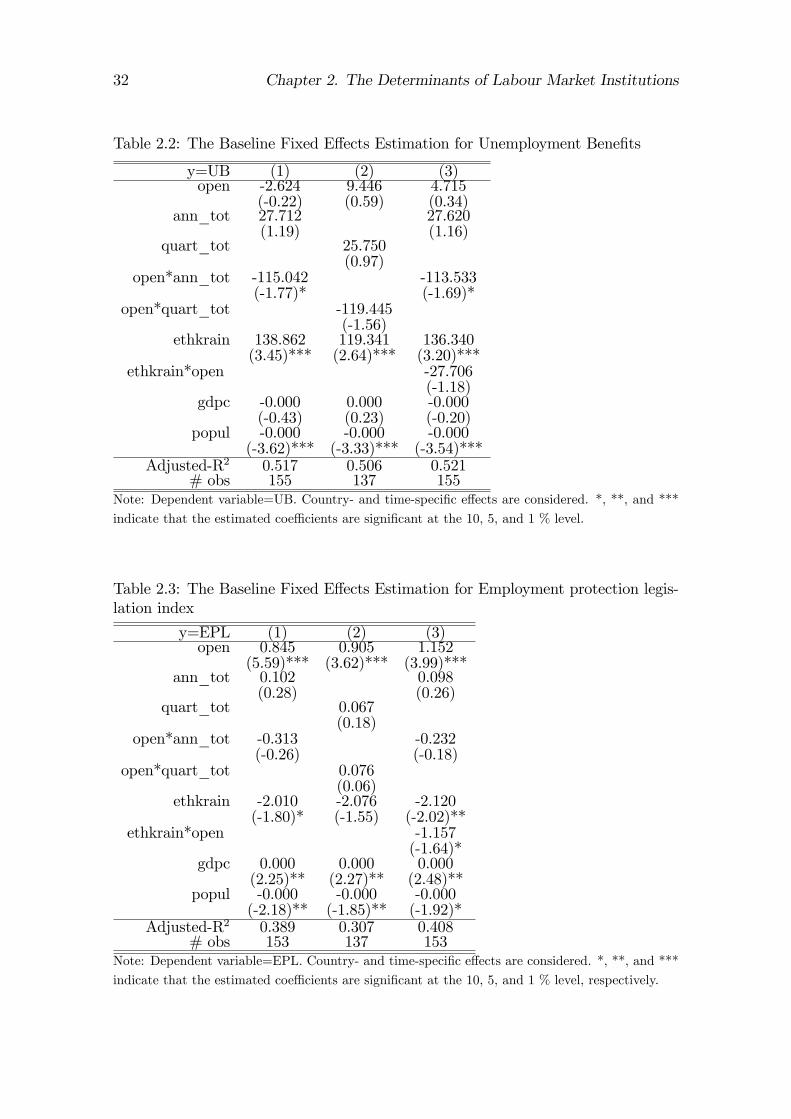
Table 2.2 presents the baseline speci�cation analysis for the generosity of unem-
ployment bene�ts. The insigni�cant coe¢ cient estimates on the variables, openness
and the volatility in terms of trade, and the negative coe¢ cient on the interaction
between openness and the volatility in annual terms of trade in 10% level suggest
that there is some evidence that an increase in external risk is likely to reduce
the generosity of unemployment bene�ts, which is the opposite of my hypothesis.
Also, a highly signi�cant positive coe¢ cient estimate on the degree of ethnic frac-
tionalisation indicates that the more ethnically fractionalised a country, the larger
unemployment bene�ts.
The stringency of employment protection legislation and net union density are
analysed in Table 2.3 and Table 2.4, respectively. The coe¢ cient estimate on open-
ness is highly signi�cant and positive, but the rest of the M -variables that measure
the e¤ect of external risk on the labour market institutions are insigni�cant. This
means that a more open economy is correlated with a stricter employment protec-
tion and stronger unions. A higher degree of ethnic fractionalisation is associated
with a laxer employment protection legislation and a lower union density. However,
the interaction between volatility in terms of trade and openness or the interac-
tion between openness and ethnic fractionalisation score do not seem to have any
signi�cance in determining employment protection or net union density.
As expected, a more a uent economy in term of GDP per capita tends to have
stringent employment protection and net union density. Countries with large pop-
ulation such as the U.S. are likely to have lower unemployment bene�ts, laxer em-
ployment protection, and weaker unions. This �nding con�rms Wallerstein�s (1989)
result of a negative relationship between the size of the labour force and unionisation
rates.
The positive association between openness and labour market institutions con-
tinues for centralisation in wage bargaining; see Table 2.5. As a country is more

Chapter 2. The Determinants of Labour Market Institutions 19
open to international trade, it is highly likely to have more coordinated wage bar-
gaining. This tendency gets stronger, as the country�s terms of trade become more
volatile. However, the degree of ethnic fractionalisation does not seem to a¤ect this
labour market institution directly.
To investigate robust determinants of labour market institutions, the extreme
bounds analysis using the speci�cation in column (1) as the baseline is performed.
Table 2.6 presents the summary of the extreme bounds analysis of the four institu-
tion variables.13 As the generosity of unemployment bene�ts is turned out to be
insigni�cantly correlated with the M -variables that measure exposure to external
risks in the baseline estimation in Table 2.2, I �nd no robust evidence to support
my �rst hypothesis; an increase in exposure to external risk leads to higher unem-
ployment bene�ts. The other M -variable ethkrain also fails to be robust due to the
same reason.
The extreme bounds analysis shows that the other three labour market insti-
tutions, i.e. employment protection, net union density and centralisation in wage
bargaining, are positively correlated with openness. This is robust evidence of that
a country that is more open to international trade is more prone to have stringent
employment protection legislation, higher union density, and more centralised wage
bargaining, which is in line with the theoretical prediction of labour market institu-
tions as social insurances. Moreover, it is robust that more volatile terms of trade
give rise to even larger e¤ect of openness in increasing the degree of centralisation
in wage bargaining. I �nd a robust negative correlation between ethnic fractional-
isation and union density. This is evidence supporting the second hypothesis that
more heterogeneous countries in terms of ethnicity have weaker unions.
To examine if the results depend on the range of countries included, I perform
a sensitivity test with the �fteen European countries. The results of this extreme
bounds analysis are summarised in Table 2.7. The EBA results using only the data
of �fteen European countries are somewhat di¤erent. Openness continues to be a
robust determinant of the stringency of employment protection legislation. However,
as countries like the U.S., Japan, and Canada are excluded, openness to interna-
tional trade is no longer robust determinant of union density and centralisation in
wage bargaining. The degree of ethnic fractionalisation continues to be negatively
correlated with employment protection legislation and union density in the strict
de�nition of robustness. The evidence of that more ethnically heterogeneous coun-
13 The fully detailed results of the EBA is presented in Appendix I, which is available from theauthor upon request.

20 Chapter 2. The Determinants of Labour Market Institutions
tries tend to have lax employment protection or weaker unions is, thus, not driven
by a few highly fractionalised countries such as the U.S. or Canada.
The extreme bounds analysis suggests the following �ndings. First, the countries
with large openness to international trade tend to have strict employment protec-
tion, strong unions, and centralised wage bargaining. In particular, evidence that
higher openness leads to more stringent employment protection legislation is highly
robust. This �nding is in line with the theory that as increasing exposure to exter-
nal risk leads to increasing job turnover and wage volatility, there is an incentive
to have stricter employment protection, stronger unions and more corporative wage
bargaining as social insurance devices. However, other measures of external risks
such as volatility in terms of trade or its interaction with openness do not seem to
have any robust e¤ect on determining the structure of labour market institutions.
This might nevertheless be because standard deviations in percentage changes in
terms of trade are incomplete measures of external risks.
Second, the generosity of unemployment bene�ts is not a¤ected by increases in
countries�openness or in volatility in terms of trade. My empirical analysis rather
suggests the opposite relationship. Countries that are less open to trade seem more
likely to have generous unemployment bene�ts. The reason why unemployment
bene�ts work di¤erently from employment protection might be that while these two
social insurance devices are substitutes in guaranteeing income security, employment
protection does not cover all individuals facing an income risk. The incumbents
have an incentive to support stringent employment protection rather than generous
unemployment bene�ts. In particular, in a country with strong unions, this tendency
might be considerable.
Finally, more homogenous countries in terms of ethnicity have stronger unions,
which is robust in the strict de�nition of robustness. This implication is not a re-
sult of a few highly fractionalised countries. Countries with ethnically homogeneous
populations are prone to develop strong unions that are organised collectively, while
the counterparts with heterogeneous populations tend to have weak unions. This
is another evidence that an institution and ethnic fractionalisation are strongly as-
sociated. Alesina et al. (1999) found a negative relationship between productive
public good provision and ethnic fragmentation in the U.S. local levels. Easterly
and Levine (1997), who used ethnic diversity data as measured by language, also
reported a negative correlation across countries between ethnic diversity and indica-
tors of public goods. Extending the previous studies, my result implies that ethnic
fragmentation is an important determinant of institutions, not only to the matter

Chapter 2. The Determinants of Labour Market Institutions 21
of public �nance and provision, but also to a feature in labour market institutions.
Results from the linear regression analysis are often not su¢ cient enough to
assure a causal relationship. However, the ethno-linguistic fractionalisation score has
been frequently used as an instrument in growth and political economy literature.
It is considered to be exogenous in a relatively short time period such as forty years.
It would, therefore, be less disputable to conclude that the ethnic fractionalisation
score is a determinant of the strength of trade unions.
5 Endogeneity Issues
Endogeneity of the explanatory variables can arise from several sources. Firstly,
there might be omitted variables. By using �xed e¤ects model, unobserved time-
constant country e¤ects are controlled for. It is nevertheless not able to control
for unobserved time-variant e¤ects such as technological change or business cycle
that each country encounters asymmetrically. A possible omitted factor is a "trust"
variable. Algan and Cahuc (2009) point out the importance of moral hazard problem
in unemployment bene�ts. They argue that when the utility loss of guilt feeling of
cheating the system is su¢ ciently large, the government is likely to provide higher
unemployment bene�ts. Another probable omitted factor is a variable that captures
potential e¢ ciency costs of labour market institutions. If labour market institutions
entail not only welfare bene�ts by providing social insurances, but also e¢ ciency
costs as Agell (2002) argues, including a variable that characterises welfare costs
might give di¤erent results.
Secondly, the analysis might contain measurement errors. The measurement er-
rors primarily come from proxy variables. In my analysis, I used various proxies, for
instance, GDP per capita and cabinet composition of right-wing parties to describe
the e¤ects that are not directly observable such as economic a uence of citizen
and tendency of citizen being rightists. Also, the variable describing the interac-
tion between openness and annual terms of trade volatility may not be a su¢ cient
measure of a country�s exposure to external risk. Measurement errors, especially in
explanatory variables, can typically give parameters estimates biased toward zero.
Finally, the variables, openness, volatility in terms of trade and the product of
these two, might be determined simultaneously along with the institutions. Trade
openness may have been a¤ected by regulations in labour markets, because investors
will choose the most appropriate investment locations. For example, Koeniger (2001)
argued that binding minimum wages makes countries produce relatively more in un-

22 Chapter 2. The Determinants of Labour Market Institutions
skilled labour intensive industries. It lowers the comparative advantage in the pro-
duction of the skill-intensive good, which in turn can reduce the countries openness
or terms of trade.
6 Conclusion
In the 1990s, there have been bustling discussions on how various institutions of
labour market a¤ect a country�s economic performance. The discussions often ended
up with comments that deregulation is a panacea to most of the economic problems.
Hardly a decade later, some economists started looking at the question how such
labour market institutions have been formed in the �rst place. Agell (1999 & 2002)
argued that labour market institutions should be understood as social insurance
devices against otherwise uninsurable risks.
This study has shed further light on this literature. For the uninsurable risks,
I focused on international trade risks, which are measured by openness, volatility
in terms of trade, and an interaction between these two variables. Several features
of labour market institutions are analysed. In order to control for unobserved het-
erogeneity and to analyse the long term development of the institutions, this study
used a �xed e¤ects model based on a panel data over 40 years. For robust results,
I used the extreme bounds analysis.
The statistical evidence is simple and clear. I found a robust evidence for the
correlations between openness to trade and stringency in employment protection,
strength of unions, and centralisation in wage bargaining, respectively. This result
implies that as increasing openness to trade gives rise to higher job turnover or
volatile income changes, there is an increasing incentive to have extensive social
insurance through these labour market institutions.
From testing the hypothesis on ethnic fractionalisation as a determinant of the
institutions, I found a highly robust evidence that ethnically homogeneous coun-
tries have strong unions. This negative correlation between the degree of ethnic
fractionalisation and unionisation rate extends the previous implications about the
role of ethnic heterogeneity on public �nance and provision further to labour market
institutional context.
Finally, I would like to stress some of the limitations of this study. The results
of this analysis are only limited to a certain type of external risk and ethnic frac-
tionalisation as potential determinants of labour market institutions. It does not
cover insurance motives based on other types of risks or other potential determinants

Chapter 2. The Determinants of Labour Market Institutions 23
such as moral hazard problem. Also, there might be factors that make "European"
labour market institutions so di¤erent from those of "non-European" countries such
as people�s preference between equity and e¢ ciency. Analysing the relationship be-
tween citizen�s preference and labour market institutions is a topic for the future
research.

24 Chapter 2. The Determinants of Labour Market Institutions

Bibliography
[1] Agell, J. (2002), "On the Determinants of labour Market Institutions: Rent
Seeking vs. Social Insurance," German Economic Review, 3 (2), 107-135.
[2] Agell, J. (1999), "On the Bene�ts from Rigid labour Markets: Norms, Market
Failures, and Social Insurance," The Economic Journal, 109 (453), 143-164.
[3] Alesina, A., R. Baqir, and R. Easterly (1999), "Public Goods and Ethnic Divi-
sions," The Quaterly Journal of Economics, 114 (4), 1243-1284.
[4] Alesina, A. and R. Wacziarg (1998), "Openness, Country Size and the Govern-
ment," Journal of Public Economics, 69 (3), 305-322.
[5] Algan, Y. and P. Cahuc (2009), "Civic Virtue and Labor Market Institutions,"
American Economic Journal: Macroeconomics, 1 (1), 111-145.
[6] Bertola, G. and A. L. Prete (2008), "Openness, Financial Markets, and Policies:
Cross-Country and Dynamic Patterns," CEPR Discussion Paper, DP7048.
[7] Blanchard, O. and J. Wolfers (2000), "The Role of Shocks and Insitutions in
the Rise of European Unemployment: the Aggregate Evidence," The Economic
Journal, 110 (462), 1-33.
[8] Blaschke, S. (2000), "Union Density and European Integration: Diverging Con-
vergence," European Journal of Industrial Relations, 6 (2), 217-236.
[9] Cameron, D. R. (1978), "The Expansionof the Public Economy: A Comparative
Analysis," The American Political Science Review, 72 (4), 1243-61.
[10] Dreher, A. and Gaston, N. (2007), "Has Globalisation Really Had No E¤ect on
Unions?," Kyklos, 60 (2), 165-186.
[11] Easterly, W. and R. Levine (1997), "Africa�s Growth Tragedy: Policies and
Ethnic Divisions," Quaterly Jounal of Eonomics, 112 (4), 1203-1250.
25

26 Chapter 2. The Determinants of Labour Market Institutions
[12] Elmeskov, J., J. P. Martin, and S. Scarpetta (1998), "Key Lessons for Labour
Market Reforms: Evidence from OECD countries�Experiences," Swedish Eco-
nomic Policy Review, 5 (2), 205-252.
[13] Fischer, J. and F. Somogyi (2009), "Globalization and Protection of Employ-
ment," KOF Swiss Economic Institute Working Paper No. 238.
[14] Golden, M. (2000), �Economic Integration and Industrial Relations: is Increas-
ing Openness Bad for Labor?,�University of Berkeley Center for German and
European Studies Working Paper 1.62.
[15] Golden, M. and J. Londregan (1998), "Globalization and Industrial Relations,"
paper delivered at the American Political Science Association. Boston, Massa-
chusetts.
[16] Koeniger, W. (2001), "Trade, labour Market Rigidities, and Government-
Financed Technological Change," Discussion Paper, No. 241, IZA.
[17] Krain, M. (1997), "State-Sponsored Mass Murder: The Onset and Severity of
Genocides and Politicides," Journal of Con�ict Resolution, 41 (3), 331-360.
[18] Leamer, E. (1985), "Sensitivity Analsyses Would Help," American Economic
Review, 75 (3), 308-13.
[19] Levine, R. and D. Renelt (1992), "A Sensitivity Analysis of Cross-Country
Growth Regressions," The American Economic Review, 82 (4), 942-63.
[20] Lindbeck, A. (1975), "Business Cycles, Politics, and International Economic
Dependence," Skandinaviska Enskilden Bank Quarterly Review, 2, 53-68.
[21] Nickell, S., L. Nunziata, W. Ochel, and G. Quintini (2002), "Why Do Jobless
Rates Di¤er?," Research Reports: CESifo Forum, 1/2002.
[22] Nickell, S. and R. Layard (1999), "Labour Market Institutions and Economic
Performance," Handbook of Labour Economics, Vol. 3, Chapter 46, 3029-84.
[23] Nickell, S. (1997), "Unemployment and labour Market Rigidities: Europe versus
North America," Journal of Economic Perspectives, 11 (3), 55-74.
[24] Rodrik, D. (1998), "Why Do More Open Economies Have Bigger Govern-
ments?," Journal of Political Economy, 106, 997-1032.

Chapter 2. The Determinants of Labour Market Institutions 27
[25] Rodrik, D. (1997), "What Drives Public Employment?," Working Paper 6141,
NBER.
[26] Sala-i-Martin, X. (1997), "I Just Run Two Million Regressions," American
Economic Review, 87 (2), 178-183.
[27] Scruggs, L. and P. Lange (2002), "Where Have All the Members Gone? Global-
ization, Institutions, and Union Density," The Journal of Politics, 64 (1), 126-153.
[28] Svaleryd, H. and J. Vlachos (2002), "Markets for Risk and Openness to Trade:
how are they related?," Journal of International Economics, 57 (2), 369-95.
[29] Wagner, A. (1883), "The Nature of the Fiscal Economy," in R. A. Musgrave and
A. R. Peacock, eds., Classics in the Theory of Public Finance. London: Macmillan,
1958, 1-8.
[30] Wallerstein, M. (1989), "Union Organization in Advanced Industrial Democra-
cies," American Political Science Review, 83 (2), 481-501.
[31] Wallerstein, M. and B.Western (2000), "Unions in Decline? What Has Changed
and Why," Annual Review of Political Science, 3 (1), 355-377.
[32] Widmalm, F. (2001), "Tax Structure and Growth: are some taxes better than
others?," Public Choice, 107 (3), 199-219.

28 Chapter 2. The Determinants of Labour Market Institutions
Figure 2.1: Development of the unemployment bene�t index in selected countries
010
2030
40U
nem
ploy
men
t ben
efit
inde
x
1960 1965 1970 1975 1980 1985 1990 1995 2000 2005Year
Europe14 UKUSA SwedenJapan Germany
Figure 2.2: Development of the employment protection legislation index in selectedcountries. Range is [0; 2] :
0.5
11.
5E
mpl
oym
ent p
rote
ctio
n in
dex
1960 1965 1970 1975 1980 1985 1990 1995 2000 2005Year
Europe14 UKUSA SwedenJapan Germany
Chapter 2. The Determinants of Labour Market Institutions 29
Figure 2.3: Development of the net union density of selected countries
2040
6080
100
Net
uni
on d
ensi
ty
1960 1965 1970 1975 1980 1985 1990 1995 2000 2005Year
Europe14 UKUSA SwedenJapan Germany
Figure 2.4: The degree of centralisation in the wage bargaining process. Range is[1; 3].
11.
52
2.5
3C
entra
lisat
ion
1960 1965 1970 1975 1980 1985 1990 1995 2000Year
Europe14 UKUSA SwedenJapan Germany

30 Chapter 2. The Determinants of Labour Market Institutions
Figure 2.5: Trade openness of selected countries
020
4060
8010
0op
enne
ss
1960 1965 1970 1975 1980 1985 1990 1995 2000 2005Year
Europe14 UKUSA SwedenJapan Germany
Figure 2.6: Ethnic fractionalisation score by Krain (1997) of selected countries
0.1
.2.3
Eth
nic
fract
iona
lisat
ion
1960 1965 1970 1975 1980 1985 1990 1995Year
Europe14 UKUSA SwedenJapan Germany

Chapter 2. The Determinants of Labour Market Institutions 31
Table
2.1:Descriptive
StatisticsShortdescription
#Obs
Mean
Min
Max
Std.dev.
UB
Unem
ployment
bene�tindex
20024.052
061.02
13.763Y
EPL
Employm
entprotection
legislationindex
1970.636
01.394
0.380UDNET
Netunion
density182
41.1278.44
85.7818.364
COW
Centralisation
inwage
bargaining180
2.1501
30.607
openOpenness
1980.580
0.0941.684
0.297M
annual_tot
Volatility
inannual
termsoftrade
1960.041
0.0030.284
0.044quart_
totVolatility
inquarterly
termsoftrade
1790.047
0.0080.265
0.046ethkrain
Ethnic
fractionalisationbyKrain
1600.159
0.010.75
0.202I
gdpcGDPper
capita197
13153.66357.057
62533.9212360.53
populPopulation
20036314.75
2258.833293273
53739.43depend
Dependency
ratio200
0.5430.434
0.7360.065
Zemp_ind
Employm
entinindustrial
sector200
0.3290.192
0.4850.067
gov_right
Right-w
ingcabinet
composition
1920.393
01
0.355�nopen
Financial
opennessindex
16010.120
2.8493
14unem
ployUnem
ployment
rate200
5.2440.007
20.9553.915
32 Chapter 2. The Determinants of Labour Market Institutions
Table 2.2: The Baseline Fixed E¤ects Estimation for Unemployment Bene�ts
y=UB (1) (2) (3)open -2.624 9.446 4.715
(-0.22) (0.59) (0.34)ann_tot 27.712 27.620
(1.19) (1.16)quart_tot 25.750
(0.97)open*ann_tot -115.042 -113.533
(-1.77)* (-1.69)*open*quart_tot -119.445
(-1.56)ethkrain 138.862 119.341 136.340
(3.45)*** (2.64)*** (3.20)***ethkrain*open -27.706
(-1.18)gdpc -0.000 0.000 -0.000
(-0.43) (0.23) (-0.20)popul -0.000 -0.000 -0.000
(-3.62)*** (-3.33)*** (-3.54)***Adjusted-R2 0.517 0.506 0.521
# obs 155 137 155Note: Dependent variable=UB. Country- and time-speci�c e¤ects are considered. *, **, and ***
indicate that the estimated coe¢ cients are signi�cant at the 10, 5, and 1 % level.
Table 2.3: The Baseline Fixed E¤ects Estimation for Employment protection legis-lation index
y=EPL (1) (2) (3)open 0.845 0.905 1.152
(5.59)*** (3.62)*** (3.99)***ann_tot 0.102 0.098
(0.28) (0.26)quart_tot 0.067
(0.18)open*ann_tot -0.313 -0.232
(-0.26) (-0.18)open*quart_tot 0.076
(0.06)ethkrain -2.010 -2.076 -2.120
(-1.80)* (-1.55) (-2.02)**ethkrain*open -1.157
(-1.64)*gdpc 0.000 0.000 0.000
(2.25)** (2.27)** (2.48)**popul -0.000 -0.000 -0.000
(-2.18)** (-1.85)** (-1.92)*Adjusted-R2 0.389 0.307 0.408
# obs 153 137 153Note: Dependent variable=EPL. Country- and time-speci�c e¤ects are considered. *, **, and ***
indicate that the estimated coe¢ cients are signi�cant at the 10, 5, and 1 % level, respectively.

Chapter 2. The Determinants of Labour Market Institutions 33
Table 2.4: The Baseline Fixed E¤ects Estimation for Net union density
y=UDNET (1) (2) (3)open 23.662 37.807 34.964
(2.24)** (2.75)*** (2.52)**ann_tot -21.601 -20.869
(-0.81) (-0.77)quart_tot -20.379
(-0.81)open*ann_tot -28.957 -27.624
(-0.43) (-0.38)open*quart_tot -9.965
(-0.14)ethkrain -150.362 -183.040 -163.731
(-3.40)*** (-3.39)*** (-3.82)***ethkrain*open -41.454
(-1.45)gdpc 0.001 0.001 0.001
(2.13)** (2.15)** (2.37)**popul -0.000 -0.000 -0.000
(-3.00)*** (-2.99)*** (-2.86)***Adjusted-R2 0.436 0.449 0.448
# obs 140 126 140Note: Dependent variable=UDNET. Country- and time-speci�c e¤ects are considered. *, **, and
*** indicate that the estimated coe¢ cients are signi�cant at the 10, 5, and 1 % level, respectively.
Table 2.5: The Baseline Fixed E¤ects Estimation for Centralisation in wage bar-gaining
y=COW (1) (2) (3)open 1.590 1.577 1.414
(2.88)*** (2.06)** (1.82)*ann_tot -2.143 -2.141
(-1.84)* (-1.84)*quart_tot -1.767
(-1.22)open*ann_tot 6.370 6.334
(1.94)* (1.94)*open*quart_tot 3.505
(1.03)ethkrain -1.658 -0.883 -1.598
(-0.91) (-0.48) (-0.88)ethkrain*open 0.666
(0.48)gdpc 0.000 0.000 0.000
(1.35) (0.43) (1.15)popul 0.000 0.000 0.000
(2.98)*** (2.66)*** (2.91)***Adjusted-R2 0.286 0.239 0.288
# obs 155 137 155Note: Dependent variable=COW. Country- and time-speci�c e¤ects are considered. *, **, and
*** indicate that the estimated coe¢ cients are signi�cant at the 10, 5, and 1 % level, respectively.

34 Chapter 2. The Determinants of Labour Market Institutions
Table 2.6: The Summary of Extreme Bounds Analysis
M-variable UB EPL UDNET COWopen Fragile (0) Robust (+)*** Robust (+)** Robust (+)*
ann_tot Fragile (0) Fragile (0) Fragile (0) Fragile (0)ann_tot*open Fragile (0) Fragile (0) Fragile (0) Robust (+)*
ethkrain Fragile (0) Fragile (1) Robust (-)*** Fragile (0)Note: This table summarises the extreme bounds analysis results in Table A1 -Table A4 in Appen-
dix I, which is available from the author upon request. The estimates of the I-variables, gdpc andpopul, are omitted in the table. Fragile/robust indicates whether the M-variable is a robust orfragile regressor for the institutional variables according to Levine and Renelt�s (1992) criteria. If
fragile, the number in the parenthesis indicates how many additional Z-variables need to be added
before the M-variable is insigni�cant or of the wrong sign. *** All the estimated coe¢ cients of the
M-variable are signi�cant at the 1 % level, and of the same sign. ** and * are equivalent at the
5%, and 10 % level, respectively.
Table 2.7: The Summary of Extreme Bounds Analysis, for the 15 European coun-tries,
15 EU UB EPL UDNET COWopen Fragile (0) Robust(+)** Fragile (0) Fragile (2)
ann_tot Fragile (0) Fragile (0) Fragile (0) Fragile (0)ann_tot*open Fragile (0) Fragile (0) Fragile (0) Fragile (1)
ethkrain Fragile (0) Robust(-)*** Robust(-)** Fragile (0)Note: The observations from �fteen European countries only. See note in Table 2.6.

Chapter 2. The Determinants of Labour Market Institutions 35
Descriptions and Sources of DataThe L.H.S. variables
UB: Unemployment bene�t replacement rate data published by the OECD. It is de-�ned as the average across the �rst �ve years of unemployment for three familysituations and two money levels and interpolated. Source: The CEP_OECDInstitutions data set.
EPL: Employment protection legislation data from the OECD labour market sta-tistics database using version 1 of the indicator. Range is [0,2] increasing withstrictness of employment protection. Source: The CEP_OECD Institutionsdata set.
UDNET: Net union density extended by Visser. This is union membership as ashare of employment calculated using administrative and survey data from theOECD labour market statistics database. It is extended by splicing in datafrom Visser. Source: The CEP_OECD Institutions data set.
COW: Index of bargaining centralisation/coordination with a range [1,3] takenfrom Ochel (2000). It is based on the data reported in OECD (1994, 1997),Traxler and Kittel (1999), Wallerstein (1999), Windmuller et al. (1987), andBamber and Lansbury (1998). It is interpolated by Nickell and Nunziata.Source: The CEP_OECD Institutions data set.
The R.H.S. variables
depend : The number of individuals aged below 15 or above 64 divided by thenumber of individuals aged 15 to 64, 1960-2000. Source: World DevelopmentIndicators (WDI) 2004, World Bank.
emp_ind : Civilian employment in industrial sector as a share of total civilian em-ployment, 1960-2000 for all countries except Belgium and Netherlands (1960-97). Source: labour Force Statistics OECD.
ethkrain: New ethnic fractionalisation score by Krain (1997). Krain (1997) im-proved the accuracy of this variable slightly by recording the variable as strictlyan ethnic fractionalisation variable (see the paper for details) and by codingit at four years in the study, each separated by a decade: 1948, 1958, 1968,1978. Note: The data end at year 1990. Source: Krain, Matthew (1997).
ann_tot : Volatility in annual terms of trade. Volatility in terms of trade is stan-dard deviations of percentage changes in terms of trade of goods and ser-vices, annual data between 1955-1995. Source: International Financial Sta-tistics. Note: Missing data for Belgium, Denmark, France, and Portugal arefrom Global Development Network Growth Database, which is originally fromGlobal Development Finance & World Development Indicators, World Bank.
quart_tot : Volatility in quarterly terms of trade.

36 Chapter 2. The Determinants of Labour Market Institutions
�nopen: Financial openness index. This index is the sum of index for restric-tions on payments and receipts of goods and invisible, index for restrictions onpayments and receipts of capital, and an index for legal international agree-ments that constrain a nation�s ability to restrict exchange and capital �ows.The result is a 0-14 measure of �nancial openness. The data are averageof the annual �nancial openness index from Comparative Political Data Set1960-1993. Source: "Comparative Political Data Set" by Klaus Armingeon,Michelle Beyer, Sarah Menegale.
gdpc: GDP per capita in real GDP per capita (constant prices: Laspeyres). Sources:PWT6.1. Note: Real GDP per capita, 1993 EKS Benchmark (United States= 100) of "Comparative levels of GDP per capita" from United States Bureauof labour Statistics. Prior to 1991, the data refer to West Germany.
open: Openness in constant prices. The total trade, i.e. exports and imports, aspercentage of CGDP. Source: Penn World Tables (PWT ) 6.1. Note: Data forWest Germany between 1955-1969 are taken from OECD National Accounts& Historical Statistics.
popul : Size of population in thousands. 1960-2000. Note: Data for Germany areWest Germany population (1960-90) and the uni�ed Germany (1991-2000).Source: OECD National Accounts Main Aggregate Vol. 1.
gov_right : Cabinet composition of right-wing parties as a share of total cabinetposts, weighted by days, 1960-2002. Source: "Comparative Political Data Set"by Klaus Armingeon, Michelle Beyer, Sarah Menegale.
unemploy: Unemployment rate. The percentage of the people classi�ed as unem-ployed as a share of the total labour force, 1955-2000. Source: Yearbook oflabour statistics (ILO) in various years.

Chapter 3
Why Do Some Studies Show thatGenerous Unemployment Bene�tsIncrease Unemployment Rates? AMeta-Analysis of Cross-CountryStudies�
1 Introduction
There has been a popular belief held by many economists and in�uential organi-
sations that generous unemployment bene�ts and other labour market institutions
are responsible for high and persistent unemployment. In particular, the OECD
argued in the OECD Employment Outlook (1996, 1997, 1999) and the OECD Jobs
Strategy (1996) that so-called rigidities imposed by labour market institutions in-
creased unemployment. It suggested labour market deregulation as a remedy for
unemployment problems in the member countries. The IMF also argued that gen-
erous unemployment insurance systems have contributed to high unemployment
(World Economic Outlook, 2003). More recently, Jean-Claude Trichet, president of
the European Central Bank, acknowledged the need of labour market �exibility in
his speech.1
Over the last two decades, economists have analysed the relationship between
labour market institutions and unemployment using cross-country regression meth-
ods. It appears, however, that no clear consensus over the empirical evidence has
been reached. For example, Nickell et al. (2001) and Nunziata (2002) found a highly
� I thank Ann-So�e Kolm, Matthew Lindquist, and Helena Svaleryd for their advice and support.I also thank seminar participants at Stockholm University, Uppsala University, and SOFI forvaluable comments and suggestions.
1 The speech by Jean-Claude Trichet, Amsterdam, 15 February 2007.
37

38 Chapter 3. A Meta-Analysis of Cross-Country Studies
signi�cant positive correlation between the unemployment bene�ts and the unem-
ployment rate, while Baker et al. (2003) found no clear relationship. Moreover,
Belot and van Ours (2001, 2004) reported that the generosity of the unemployment
bene�ts is negatively correlated with unemployment in several speci�cations. What
is it that leads these economists to such di¤erent results? Can we explain variation
in the results by their di¤erent choices of data, estimation methods, and model spec-
i�cations? Will these studies reach an unanimous conclusion once one takes account
of the di¤erences in the empirical settings?
To answer these questions, this paper presents a meta-analysis of existing cross-
country studies which look at the impact of labour market institutions on the aggre-
gate unemployment rate. More speci�cally, it focuses on the question of whether or
not generous unemployment bene�ts, in terms of high replacement rate and lengthy
durations of bene�ts, create high unemployment. There are a few forerunners who
evaluate the robustness of the results of the e¤ects of labour market institutions.
Baker et al. (2003) compared seven papers and acknowledged the lack of robustness
in the estimates. Bassanini and Duval (2006) showed how the estimates can vary
depending on empirical speci�cations and the choice of the data.
This paper is the �rst to assess the link between generosity of unemployment
insurance systems and the level of unemployment using a meta�analysis. A meta-
analysis enables us to probe whether the variation in empirical outcomes found across
the studies relies on the use of di¤erent regression methods, how the data are de�ned
or organised, or which control variables are used in the primary studies. Identifying
the e¤ects of di¤erent empirical settings is essential for applied economists and policy
makers when discussing the disputed issue of the e¤ect of unemployment bene�ts
on the aggregate unemployment rate.
The meta-analysis is based on a specially constructed meta-data set by reviewing
34 studies that empirically analyse the relationship between measures of unemploy-
ment bene�ts and the level of unemployment. This paper �nds that the choice of
the primary data, data de�nition of unemployment bene�ts variables, and empiri-
cal speci�cation have a considerable in�uence on the �nal outcomes. The included
control variables in the primary studies also a¤ect the results whether the studies
reached a positive or no relationship between unemployment bene�ts and unemploy-
ment rates.
The remainder of this paper is organised as follows. In the following section, I
discuss the existing theoretical and microdata-based empirical literature concern-
ing the relationship between unemployment bene�ts and unemployment. Section

Chapter 3. A Meta-Analysis of Cross-Country Studies 39
3 describes the methodology of meta-regression analysis. In section 4, I present
the meta-data set. The results from the baseline estimations and their sensitivity
analysis are discussed in section 5. Section 6 concludes.
2 Theories and Empirical Studies based on Mi-
crodata
Before beginning the meta-analysis of the cross-country studies which use aggregate
data, I take a brief look at the existing theoretical as well as micro-empirical litera-
ture on the relationship between the generosity of unemployment insurance systems
and unemployment rate.
A highly in�uential theoretical work on how the generous unemployment insur-
ance systems a¤ect individual unemployment spells was done by Mortensen (1977).
He argues that since unemployment compensation reduces the income foregone while
currently unemployed but does not a¤ect future income, the expected search dura-
tion increases with the bene�t rate. At the same time, a worker either currently
employed or unemployed and not receiving bene�ts will be eligible to receive the
bene�ts during any future employer initiated unemployment spell. Consequently,
an improvement in either the bene�t rate or the maximum bene�t period makes
current employment relatively more attractive. In response, an individual who is
unquali�ed to receive the bene�t such as new entrants, exhaustees and those who
quit will �nd employment more quickly by both lowering his/her reservation wage
and by searching more intensively. There is, thus, no strong theoretical reason to ex-
pect an unambiguous relationship between the generosity of unemployment bene�ts
and individual unemployment spells.
Thanks to the development of rich micro-data, a large number of empirical stud-
ies have been done. The results in these studies are mixed. To name a few, Jones
(1995) found from the Canadian unemployment insurance system that the cut in
wage replacement rates is associated with longer individual unemployment spells.
Carling et al. (2001) found that a decrease in the replacement rate in the Swedish
unemployment insurance from 80% to 75% caused an increase in the transition rate
from unemployment of roughly 10%. Similarly, Roed and Zhang (2003) show using
Norwegian data that a marginal increase in compensation reduces the escape rate
from unemployment signi�cantly.
Despite the large number, these empirical studies based on micro-data have some

40 Chapter 3. A Meta-Analysis of Cross-Country Studies
weakness. The fundamental limitation is due to their partial equilibrium nature. As
Holmlund (1998) acknowledged, the micro-data analyses on unemployment duration
are of only limited use, as they do not capture the general-equilibrium e¤ects. From
a policy perspective, it is valuable to identify how di¤erent unemployment bene�t
regimes may result in the di¤erence in the level of unemployment over a longer time
period. Theoretically, for example, we know that more generous unemployment
bene�ts may a¤ect wage formation and induce higher wage demands, which can
increase the long-run unemployment rate. Here is where the cross-country studies
reviewed in this paper have an important role to play. However, as we shall see,
these studies have not yet reached a consensus.
3 Methodology
In this section, I describe the meta-analysis method. In contrast to conventional
literature surveys, a meta-analysis applies regression techniques to a set of results
taken from the existing literature to summarise the results on particular topics, to
provide an aggregate overview of a subject, and to allow an analysis of factors that
may in�uence the results. The main idea of this meta-analysis is that the coe¢ cient
estimates of unemployment bene�ts in unemployment regressions are constant across
the studies if one successfully controls for the di¤erent settings found in the empirical
studies. It enables us to quantify the e¤ects of particular choices of data, estimation
methods, or model speci�cations for the outcomes in the primary studies.
The procedure of this meta-analysis is as follows. First, I search for empiri-
cal papers that investigate the e¤ect of unemployment bene�ts on unemployment
rate with cross-country data. Second, I review the selected papers and construct
a meta-data set that consists of meta-dependent and meta-independent variables.
The meta-dependent variables are the coe¢ cient estimates of unemployment ben-
e�ts in unemployment equations drawn from regressions reported in the primary
studies. The meta-independent variables are the binary variables that characterise
the empirical settings of each regression. Third, I conduct meta-regression analysis
using probit models and OLS.
The meta-observations are obtained from existing journal articles and other pub-
lished or unpublished papers. I search for published articles using the search engine,
googlescholar, with search words "labour market institutions" & "unemployment"
or "unemployment bene�t j unemployment insurance" & "unemployment". Un-
published working papers, dissertations, essays, and mimeographs are found by the

Chapter 3. A Meta-Analysis of Cross-Country Studies 41
search engine google.2 References in each paper are cross searched until no new
studies are found. I consider only the papers that are from the year 1988 and up
until march, 2007, when this study was started. This restriction, however, does not
exclude any earlier relevant studies because most of the studies are done after the
year 1996, when the extensive panel data set of labour market institutions became
available.
To be an observation point in this meta-analysis, a study is required to have
(1) an empirical analysis of the cross-country data of the OECD countries, (2)
well-de�ned and well-reported source of the data, and (3) the estimates derived
from a regression analysis with a dependent variable measuring the level of the
aggregate unemployment rate and independent variables any among three measures
of generosity of unemployment bene�ts, i.e. unemployment bene�t replacement
ratio, bene�t duration, or an interaction of these two. I also include regressions
when their dependent variables are long-term or youth unemployment rate.3 A
large fraction of articles were either theoretical or micro-data analyses and discarded
from this analysis. Studies that analysed only one or a few countries, or each
country separately are excluded. Finally, 34 papers that ful�ll the requirement
are included in this meta-analysis. When more than one regression is reported, I
use all estimates that meet the above requirements. Taking multiple estimates from
an article is preferable to collecting a single value only from each study, because
procedures representing each study by a single value result in a serious bias and a
loss of information (Bijmolt and Pieters, 2001).4
The meta-data are �rst estimated using a probit model. Employing a probit
model for a meta-analysis in this fashion is novel. The goal of the �rst experiment
is to identify the factors that produce signi�cant positive correlations between the
generosity of unemployment bene�ts and the level of unemployment. For this experi-
ment, I construct the binary meta-dependent variables.5 The probit meta-regression
2 Although previous meta-studies in other topics used other computerised data bases as IDEASand RePEc, EconLit, in recent years, googlescholar comprises all above databases.
3 The studies that analysed male and female unemployment rate separately such as Jimeno &Rodriguez-Palenzuela (2002) are not included in this meta-analysis.
4 The e¤ect of publication bias is partially mitigated by sampling all estimates in each primarystudy and by including both published and unpublished studies.
5 If the reported estimate of the measures of unemployment bene�ts from the primary equationsis signi�cantly positive at the 10% level, the binary meta-dependent variable gets the value 1.Otherwise, it gets the value 0. I also conducted the probit meta-analysis with the binary meta-dependent variables with the signi�cant level of 5% and 1%. The estimated results are consistentwith those of the 10% level.

42 Chapter 3. A Meta-Analysis of Cross-Country Studies
is
Pr(bj = 1jZj1; Zj2; :::; ZjK) = G(� +KXk=1
�kZjk); j = 1; 2; :::L,
where bj is the binary meta-dependent variable constructed from the reported es-
timates in the jth regression in the literature comprised of L regressions, � is the
summary value of the marginal e¤ect b, the Zjk�s are the meta-independent variables
which measure relevant characteristics of the observation, and the �k�s are the meta-
regression coe¢ cients which re�ect the e¤ect of particular regression characteristics.
G is the standard normal c.d.f. Since the observations within paper are more likely
to share similar characteristics, the data are estimated with robust standard errors
for clustered samples by paper.
Following this, I run an experiment in which I use the coe¢ cient estimates them-
selves as the dependent variables. The goal of this second experiment is to quantify
factors that give rise to large correlations between the generosity of unemployment
bene�ts and the level of aggregate unemployment. The meta-regression model is
estimated using OLS,
bj = � +KXk=1
�kZjk + ej; j = 1; 2; :::L,
where bj is the reported estimate and � the summary value of the e¤ect of generosity
of unemployment bene�ts in unemployment rate. The meta-regression coe¢ cient �kre�ects the marginal e¤ect of particular regression characteristics. The error term
ej is robust for clustered samples by paper.6 In the sensitivity analysis, I include
the estimation by weighted least squares (WLS), where each coe¢ cient estimate is
weighted by the inverse of its standard error.7
6 Jeppesen et al. (2002) and Disdier & Head (2008) suggest random e¤ects panel speci�cationto deal with the multiple estimates from each paper. The random e¤ects model places greateremphasis on within-paper variation than cross paper variation. The Breusch-Pagan tests implythat the researcher random e¤ects are insigni�cant for the coe¢ cient estimates of duration ofunemployment bene�ts (BD) and the interaction (BRRBD). The existence of the random e¤ectsis ambiguous for those of bene�t replacement rate (BRR). This suggests that researchers in thisliterature are not conducting research in a manner fundamentally di¤erent from one another.Hence, I use the OLS and probit model for the baseline regressions.
7 The WLS is one of the common practice in meta-regression analysis, when one is interestedin the particular e¤ect size. Since the purpose of this paper is to assess the factors that give riseto signi�cant positive coe¢ cient estimates or larger estimates rather than to �nd the e¤ect size, Iinclude the WLS estimation as robustness check.
Chapter 3. A Meta-Analysis of Cross-Country Studies 43
4 Data
This section presents the meta-data in detail. In primary studies, the generosity
of unemployment bene�ts is often de�ned as the level of bene�t replacement rate,
its duration, or the interaction of replacement rate and duration of unemployment
bene�ts. Hence, I conduct the meta-analysis on these three dependent variables;
the coe¢ cient estimates of bene�t replacement rate (BRR), those of duration of
unemployment bene�ts (BD), and those of the interaction of these two (BRRBD)
in the unemployment equations. For probit estimation, I construct the binary vari-
ables from these coe¢ cient estimates. The binary meta-dependent variable BRR10
is equal to 1 if the coe¢ cient estimate of the bene�t replacement rate in a pri-
mary equation is signi�cantly positive at the 10% level. The 34 papers give 382
observations for bene�t replacement rate, 111 for bene�t duration, and 40 for the
interaction of these two. About half of the observations of the bene�t replacement
rate and its duration are signi�cantly positive at the 10% level. About 80% of the 40
observations of the interaction term BRRBD are signi�cantly positive. A substan-
tial number of the observations is from the primary equations where the left-hand
side variable is the natural logarithm of unemployment rate. For more comparable
results, I antilog the values from these primary equations by multiplying the nat-
ural logarithm base e. The descriptive statistics of the respective meta-dependent
variables are presented in Table 3.1.
Figures 3.1 and 3.2 illustrate how the reported estimates of the bene�t replace-
ment rate and the duration of unemployment bene�ts are scattered over years of
publication.8 The dispersion in the literature on the relationship between the gen-
erosity of unemployment bene�ts and the level of unemployment seem to have in-
creased over time. Although the positive estimates dominate, there appear more
negative estimates in the recent papers.
The meta-independent variables Zjk are dummy variables which characterise
each observation; see Table 3.2. I divide these variables into four groups; variables
for (A) data, (B) estimation methods, (C) model speci�cations of the primary stud-
ies, and (D) others. The �rst category of the meta-independent variables de�nes
di¤erences in the data used in the primary studies. Across the meta samples, two
measures of bene�ts replacement rate are used. The �rst measure de�nes bene�t re-
placement rate as the �rst year of unemployment bene�ts, averaged over three family
8 For working papers and other unpublished papers, I use the year when the latest version iswritten.

44 Chapter 3. A Meta-Analysis of Cross-Country Studies
situations (single, with dependent spouse, with spouse in work) and two earnings
level (100% and 67% of APW earnings). The data are provided by Nickell, who
modi�ed and completed the OECD data set. A large fraction of the primary studies
used the data with this de�nition. The other is the OECD summary measure of
bene�t entitlements, which also takes unemployment durations into account.9 The
latter is used in Elmeskov et al. (1998), Belot and van Ours (2001, 2004), Boone
and van Ours (2004), Macculloch and di Tella (2002), and Kenworthy (2002) and
partly in Scarpetta (1996) and Bassanini and Duval (2006). The meta-independent
variable ubsum=1 is for the paper that used the OECD summary data of bene�t
entitlements, and ubsum=0 for the paper that used the bene�t replacement rate
data by Nickell.
The second meta-independent variable for data is bdyear, which is used for the
meta-dependent variables, bene�t duration (BD) and the interaction between re-
placement rate and duration (BRRBD). Throughout the literature, unemployment
bene�t duration is quanti�ed either as the maximum duration of the unemployment
insurance bene�ts in months or years, or as an index constructed by Nickell.10 The
studies done after the year 2002 often use the index, while earlier studies used bene-
�t duration expressed in years. The variable avg5 is equal to 1 if �ve-year averaged
data instead of yearly data are used.11 About one third of the primary studies used
�ve-year averaged data.
The variables, lterm and youthun, indicate whether the primary regressions
analyse long-term respective youth unemployment rates. Besides total unemploy-
ment rate, Nickell (1997 & 1998) analyses long- and short-term unemployment
rates. Scarpetta (1996) analyses long-term and youth unemployment rates. Esping-
Andersen and Regini (2000) also use youth unemployment rate as their dependent
variable.
The meta-independent variable for data, timinvinst, is for if the studies used
time-invariant data of labour market institutions. Blanchard and Wolfers (2000),
Chen et al. (2003), Algan et al. (2002), as well as, earlier studies such as Jackman
et al. (1990) and Burda (1988) used time-invariant labour market institutions data.
9 It is de�ned as the average unemployment bene�t replacement rate across two income situa-tions, three family situations, and three di¤erent unemployment durations (1st year, 2nd and 3rdyears, and 4th and 5th years of unemployment).10 The bene�t duration index by Nickell is de�ned as bd = 0:6 � brr23
brr1 + 0:4 �brr45brr1 , where brr1,
brr23; and brr45 refer to the �rst, second- and third-, and 4th- and 5th-year of gross bene�treplacement rates.11 I code four observations that use 6-year averages to avg5=1.

Chapter 3. A Meta-Analysis of Cross-Country Studies 45
The number of the countries that are included in the primary studies is lim-
ited to eighteen to twenty throughout the literature due to the availability of the
data.12 The exceptions are Macculloch and Di Tella (2005) which has 21 countries
by including Greece, and Jackman et al. (1990) that have only fourteen countries.13
The country dummy variables portugal and spain in the baseline equations and aus-
tria, ireland, newzealand, spain, and switzerland in the robustness tests control for
inclusiveness of the respective countries. These countries have been occasionally dis-
regarded in the analyses due to the unavailability of earlier data. About one third
of the primary studies do not include Portugal.
The variable year6090 de�nes if the primary study uses the data of the time
period between the year 1960 and the 1990s. Many studies written after the year
1999 used data from 1960 to the 1990s, because the CEP-OECD Institutions Data
Set became available. Earlier studies such as Nickell (1997 & 1998), Scarpetta
(1996), and the OECD (1999) take the time period of the 1980s and 1990s. The
variables, time60, time70, time80, and time90 indicate if the respective decades are
included in the primary analyses. About 40% of the selected primary studies used
the time periods from 1960 to sometime in the 1990s.
The second category of the meta-independent variables is estimation method.
Over 90% of the observations are estimated by the linear regression models such
as OLS, random-e¤ects, and �xed-e¤ects model. Non-linear least squares are used
only in a few studies, e.g. in Blanchard and Wolfers (2000), partly in Bertola et al.
(2001), Bassanini and Duval (2006), and Macculloch and Di Tella (2005). The ols,
re, fe, and nonlinear control for the use of the respective regression methods in the
primary studies.
The third group is the variables that describe model speci�cation. All primary
equations are unique in their choice of the explanatory and the control variables.
In general, labour market institutions such as union density, degree of coordination
between union and employer in wage bargaining, employment protection legislation,
as well as tax on labour and tax wedges are often included. The meta-independent
variables, ud , coord, ep, tax, and twedge describe the inclusiveness of these explana-
tory variables.
The control variables vary from study to study. The macroeconomic variables
12 These twenty countries are Australia, Austria, Belgium, Canada, Denmark, Finland, France,Germany, Ireland, Italy, Japan, Netherlands, New Zealand, Norway, Portugal, Spain, SwedenSwitzerland, United Kingdom and United States.13 The studies that had a smaller number of countries such as Stockhammer (2004) which hadthe data of �ve countries are discarded from the meta sample.

46 Chapter 3. A Meta-Analysis of Cross-Country Studies
that can be argue to a¤ect aggregate unemployment are often included in the pri-
mary studies. For instance, an adverse labour shock such as a decline in the gap
between the wage rate and the marginal product of labour, or a shift in production
techniques away from labour and towards capital may raise unemployment. A rise in
real interest rates a¤ects negatively capital accumulation and productivity, thereby
reduces labour demand at a given wage level and increases unemployment (Blan-
chard & Wolfers, 2000). Thus, I include the use of the macroeconomic controls such
as the changes in in�ation, labour demand shocks, total factor productivity shock,
home occupation rate, and real interest rate in the primary literature. The meta
explanatory variables in�a, lds, tfps, home, and rinterest indicate whether these
variables are controlled.
Moreover, �rstdi¤=1 signi�es the use of the �rst-di¤erence of unemployment
rate. Baccaro and Rei (2005), Fitoussi (2000), Daveri and Tabellini (2000), and
Macculloch and Di Tella (2005) had several speci�cations of �rst-di¤erence model.
There is no observation of bene�t duration that has the �rst-di¤erence model. Also,
lagun indicates the use of an auto-regressive model. The studies that use annual
observations often allow for an auto-correlation of one-period.
Finally, I control for the quality of the results by adding a dummy "rank" which
equals to 1 if the study was published in the journals with the rank 3 or above
in "Keele Four-Four-Two list: Ranking of Economics Journals" and 0 otherwise.
Among the quality journals with the rank 4 the primary studies are published in
European Economic Review or Journal of Economics Perspectives. Some studies
are published in the rank 3 journals such as Economic Journal, Oxford Economics
Paper, Brookings Paper of Economic Activity, and Economic Policy. The idea is
that the standard for methodological rigor could be higher at quality journals and
this could correct biases present in other estimates (Disdier and Head, 2008).
5 Meta-Regression Analysis
This section presents the results of the meta-regression analysis. Section 5.1 presents
the baseline estimation results. Section 5.2 reports the results of the sensitivity
analysis. In section 5.3, I discuss the �ndings from this meta-regression analysis.14
14 The issue of publication bias, which is the tendency among editors of academic journals topublish results that are statistically signi�cant, is beyond the scope of the current study.

Chapter 3. A Meta-Analysis of Cross-Country Studies 47
5.1 The Baseline Results
Table 3.3 presents the baseline probit estimation for the binary variables of bene�t
replacement rate (BRR10) and bene�t duration (BD10).15 The choice of data
a¤ects whether or not the primary studies obtain signi�cantly positive estimates
on both bene�t replacement rate and bene�t duration. The studies that used the
OECD summary measure of bene�t entitlements (ubsum) and the bene�t duration
measured in years (bdyear) have a higher probability of getting signi�cantly positive
estimates. Studies that use �ve-year averaged data (avg5 ) are less likely to have
positive estimates on unemployment bene�t replacement rate, but more likely to
have positive estimates on bene�t duration.
The estimation method and the choice of the control variables also matter. Fixed
e¤ects model (fe) tends to give more signi�cantly positive estimates of the bene�t
duration. The primary equations that control for labour demand shocks (lds) are
more likely to obtain positive correlations for the bene�t replacement rate, but this
probability decreases for the bene�t duration estimates. The owner occupation rate
(home), which Oswald (1999) argued as an important control in the unemployment
rate-labour market institutions equations, works in opposite direction that it gives
lower probability of the positive and signi�cant bene�t replacement rate estimates,
while the bene�t duration estimates are more likely to be signi�cant and positive in
the primary unemployment equations.
Table 3.4 shows the OLS estimation for the coe¢ cient estimates of bene�t re-
placement rate (BRR), bene�t duration (BD), and the interaction between these
two (BRRBD). As a baseline approach, the size of the reported coe¢ cient estimates
are analysed regardless of their signi�cance or sign. Using the OECD summary data
gives a negative biasing e¤ect to the size of the coe¢ cient estimates of BRR.16 The
studies that use the bene�t duration measured in years tend to relatively overesti-
mate the e¤ect of BD and underestimate that of BRRBD. Moreover, using the data
15 The results of the probit estimation with BRR5, BRR1, BD5, and BD1, which are the binarymeta-dependent variables indicating 1 for signi�cant positive estimate in 5% level, respective 1%and 0 for otherwise, are similar to those in Table 3. Due to the small number of observations,the probit estimation of the interaction meta-dependent variable (BRRBD10) is excluded. I alsoapplied linear probability model on these binary data. The results are consistent with those bythe probit model. The linear probability model neither gives any meaningful results for BRRBD10due to the small number of observations.16 Unlike the conventional de�nition of bias in the econometric literature, in this paper "posi-tive/negative bias" implies that the particular meta-independent variable contributes to the resultsabove/below the average, which is predicted probability in the probit estimation or the constantin the OLS estimation.

48 Chapter 3. A Meta-Analysis of Cross-Country Studies
that are organised in �ve-year averages has a negative bias on the BRR and BRRBD
estimates, while this e¤ect is insigni�cant for BD.
When long-term unemployment rate or youth unemployment rate are analysed
in the primary equations, the e¤ect size of the bene�ts on the level of unemployment
prones to be smaller. This implies that youth population or long-term unemployed
are less likely a¤ected by generous unemployment replacement rate. It re�ects the
fact that in most countries the unemployment insurance systems are often directed
to the incumbents of the labour market who have recently lost job, but not for those
who newly entered the labour market or who are unemployed for longer period.
Similar to the baseline probit estimation, the macroeconomic controls or other in-
stitutional variables have considerable e¤ects. For example, labour demand shocks
give positive bias on the coe¢ cient estimates of BRR, but negative bias on the
interaction term (BRRBD).
The highly signi�cant positive intercepts of BRR and BRRBD can be interpreted
as the summary for the primary studies that have all meta-independent variables
equal to zero. However, these constant terms are relatively small, which means
that they are likely to be zero or negative once one starts adding alternative meta-
independent variables. The primary studies that found a positive correlation be-
tween unemployment bene�ts and unemployment rate can, hence, easily be altered
by choosing alternative empirical speci�cations.
In all baseline equations of the probit and OLS models the dummy variable
"rank" is insigni�cant except in the OLS model of the interaction BRRBD. It sug-
gests that the signi�cance or the size of how the overall generosity of unemployment
bene�ts a¤ects the aggregate unemployment rate do not seem to be dependent on
whether the studies are published in the quality journals or not. The high values
on the diagnostic statistics, Wald test �2 and pseudo-R2 in the probit model and F-
statistic and R2 in the OLS model, indicate that these baseline models are signi�cant
and performwell.
5.2 Sensitivity Analysis
To test the robustness of the baseline results, a number of alternative meta explana-
tory variables describing the use of the primary data, estimation methods, and con-
trol variables are introduced. Various speci�cations and subsets of the observations
are also probed. Besides the probit model and the OLS, I run the meta-regressions
using the weighted least squares (WLS) with weights equal to the inverse of the

Chapter 3. A Meta-Analysis of Cross-Country Studies 49
standard errors of each observation. Overall the baseline results are robust un-
der the alternative meta explanatory variables, model speci�cations, and estimation
method.
Table 3.5 presents the sensitivity analysis for the coe¢ cient estimates of bene�t
replacement rate. In columns (1) and (3), I introduce additional country dummies,
austria, ireland, newzealand, spain, and switzerland. The dummy for time period of
the data, year6090, is divided into ten-year as time60, time70, and time80. In column
(2), I use additional meta-independent variables describing estimation methods, re,
ols, and nonlinear, as well as, control for other labour market institution variables,
employment protection (ep) and union coverage (uc). I also control for the year of
publication of each study, which is non-binary and centred (publication). The highly
signi�cant negative coe¢ cient estimate on the publication year re�ects what we saw
earlier in Figures 3.1 and 3.2; namely that this literature tends to deviate more as
time progresses from the early consensus concerning the positive correlation between
the generosity of unemployment bene�ts and unemployment rate. In column (4),
only the observations that are signi�cant at the 5% level are considered. In column
(5), the baseline speci�cation is estimated by the WLS. The sensitivity analysis
results of the BRR estimates are robust, except the constant term became marginally
insigni�cant when the WLS model is used.
Table 3.6 shows the sensitivity analysis for the bene�t duration (BD) and the
interaction (BRRBD). In columns (1) and (3), the alternative dummy variables
describing inclusiveness of countries, time period of the data and estimation methods
of the primary regressions are used. In column (2), I control for the use of other
labour market institutions in the primary equations, as well as, publication year.
In column (4), only the reported BD estimates that are signi�cant at the 5% level
are considered. The baseline speci�cation for the BD is estimated by the WLS
model in column (5). Column (6) and (7) are the results of the robustness checks
for the BRRBD. In column (6), the alternative variables for time of the data and
publication year are speci�ed. The last column is the meta-regression results for the
BRRBD coe¢ cient estimates using the WLS model.
Throughout the sensitivity tests, the biasing e¤ect of the use of long-term and
youth unemployment rates, �ve-year averaged data, �xed e¤ects model, and the con-
trol variables such as labour demand shocks, total factor productivity shocks, the
degree of coordination, and the owner occupation rate remain to be highly signi�-
cant. The choice of primary variable, bdyear, may become marginally insigni�cant
in a few speci�cations. The negative coe¢ cient estimates on the publication year

50 Chapter 3. A Meta-Analysis of Cross-Country Studies
again indicate the dissension in the literature over time.
The sensitivity analysis can be summarised as follows. First, the biasing ef-
fects of di¤erent data choice are in general robust except in a few cases of marginal
insigni�cance. Second, the e¤ects of using �xed e¤ects model and some control
variables remain highly robust for the bene�t duration (BD) and the interaction
between replacement rate and duration (BRRBD). Third, over time the literature
of the e¤ects of generous unemployment insurance systems on unemployment rates
seems to diverge from the positive correlation to the negative or no signi�cant corre-
lation. As can be seen in Figures 3.1 and 3.2, the literature is actually moving away
from a consensus. This is one of the main motivation for the type of meta-analysis
presented in this paper.
5.3 Discussions
The meta-analysis of the e¤ects of unemployment insurance system on unemploy-
ment rates suggests the following �ndings. First, the choice of the primary data
a¤ects the size of the reported estimates and the probability of obtaining signi�-
cantly positive estimates. For example, the OECD summary measure of unemploy-
ment bene�t entitlement and the bene�t duration measured in years bias downward,
respective, upwards. These two increase the probability of obtaining signi�cant pos-
itive estimates in the primary equations. Comparsion across the OLS and the probit
estimation results is, however, not straightforward, since signi�cance is a function
of two parameters, i.e. point estimates and standard errors, whereas magnitude is a
fuction of one. A positive coe¢ cient in Table 3.3 and a positive coe¢ cient in Table
3.4 are roughly consistent in the sense of unambiguously producing evidence in favor
of the unemployment increasing e¤ect of the generosity of unemployment bene�ts.
Can we assess whether or not one of these data sets is better than the other?
When we compare the bene�t replacement rate data by Nickell and the summary
bene�t entitlements data by OECD, the values of the later data are lower than the
former except the case of Australia. The studies that used Nickell�s bene�t replace-
ment rate alone contain insu¢ cient information on the generosity of unemployment
insurance system, since the OECD summary data takes information about the dura-
tion of the bene�ts into account. When it comes to the data for bene�t duration, the
index by Nickell captures the level of bene�ts available in the later years of a spell
relative to those available in the �rst year, while the bene�t duration expressed in
years only tells the length of the duration. The BD-index by Nickell is, thus, able to

Chapter 3. A Meta-Analysis of Cross-Country Studies 51
distinguish the situation in which the level of the unemployment bene�ts decreases
over time from that when the bene�ts do not change over time. The duration index
by Nickell contains more information about the generosity of unemployment bene-
�ts. Neverthless, these indices are far from perfect in describing reality, as Blanchard
(2007) acknowledged, "The problem is with the crude measures of institutions, not
with in unemployment".
Second, for the bene�t duration and the interaction between bene�t duration and
bene�t replacement rate, �xed e¤ects model increases the probability of obtaining
signi�cantly positive estimates as well as the size of the estimates. In other words,
the studies that estimated by �xed e¤ects model prone to show stronger evidence
in support of the positive association between generous unemployment bene�ts and
high unemployment rates. A large number of the selected studies used panel data,
which are often estimated by �xed e¤ects model, random e¤ects model, or pooled
OLS. While the �xed e¤ects model only allow time-variant independent variables,
the pooled OLS can have time-invariant labour market institution variables, which
are used in earlier studies. However, with the pooled OLS, the country-speci�c
e¤ects are restricted to zero, which is an unreasonable assumption for the cross-
country studies. In addition, the �xed e¤ects model is better than the random
e¤ects model for cross-country studies, because the former is able to control for
country-speci�c unobserved heterogeneity. For a random e¤ects model, one needs
to make an additional assumption that the individual country e¤ects are randomly
distributed. With a small number of observations, such as twenty countries, all
within the OECD, this assumption is unlikely to hold. The �xed e¤ects model is,
hence, arguably more suitable for analysing this question.
Finally, the meta-data shows that whether the primary studies are published in
the quality journals or not does not determine if the primary estimates are signi�-
cantly positive or have higher coe¢ cient estimates. It instead seems to depend on
di¤erent choices of empirical setting. There could be certain estimation methods
and data sets that are argued to be better than others. The current meta-study,
however, does not assess an analysis on which empirical choice is made in the quality
journals.
6 Conclusion
The purpose of this study has been to explain why the numerous cross-country
studies on the relationship between the generosity of the unemployment insurance

52 Chapter 3. A Meta-Analysis of Cross-Country Studies
system and the level of unemployment have reached such di¤erent conclusions. Us-
ing a meta-regression analysis, it is demonstrated how previous studies that use a
particular set of data, estimation methods, or model speci�cations have a higher
probability of obtaining signi�cantly positive results or larger coe¢ cient estimates.
Based on the �ndings from this meta-analysis, can we now say something more
about why these studies have reached such di¤erent results?
Since the empirical results of the primary studies are the product of several po-
tentially biasing factors, it is not always easy to see how the outcome of a study is
directly related to the empirical setting which it adopts. For example, Nickell et al.
(2001 & 2005) and Nunziata (2002) conclude that generous unemployment bene�ts
give rise to higher unemployment. They use �ve-year averaged data of the period
1960-95 for twenty countries and control for changes in in�ation. These choices
are likely to reduce the probability of obtaining a positive relationship between un-
employment bene�ts and unemployment rates. However, they include Portugal and
control for total factor productivity shocks. These two factors can give a higher prob-
ability of obtaining a positive association between generous unemployment bene�ts
and unemployment rates.
On the other hand, several studies that produce negative or insigni�cant associ-
ations can be more readily explained by the �ndings from this meta-analysis. Baker
et al. (2003) use the twenty-country data set with �ve-year averages. They estimate
the data using random e¤ects models. They also add a control for changes in in-
�ation. According to the meta-analysis, the combination of these choices may have
contributed to their negative or insigni�cant estimates. A similar line of reasoning
can be applied to the studies of Belot and Van Ours (2001 & 2004). Excluding
Portugal, controlling for in�ation, and a use of �ve-year averaged data can have
increased the probability of obtaining negative and/or insigni�cant results.
This thought-experiment leads us to a corollary. The positive relationship be-
tween generous unemployment bene�ts and the level of unemployment found in the
studies reported here is not readily explained using so-called the biasing factors un-
covered by this meta-analysis, while the negative and/or insigni�cant relationship
is more readily explained by these factors. This may indicate that generous unem-
ployment bene�ts in terms of high wage replacement ratio may indeed increase the
level of unemployment in cross-country studies considered in this meta-analysis.
Despite increasing dissent in the empirical results in the literature on the rela-
tionship between labour market institutions and unemployment, there are still needs
of more studies. The future research may involve not only the idea that unemploy-

Chapter 3. A Meta-Analysis of Cross-Country Studies 53
ment rate is determined by labour market institutions, but also how the structure
of labour market institutions are a¤ected over time by the level of unemployment,
as well as other economic factors. To do so, improvement of the labour market
institutions data should be preceded.

54 Chapter 3. A Meta-Analysis of Cross-Country Studies

Bibliography
[1] Bijmolt, T. and R. Pieters (2001), "Meta-analysis in marketing when studies
contain multiple measurements," Marketing Letters, 12 (2), 157-169.
[2] Blanchard, O. (2007), "A Review of Richard Layard, Stephen Nickell, and
Richard Jackman�s Unemployment: Macroeconomic Performance and the Labour
Market," Journal of Economic Literature, 45 (2), 410-418.
[3] Carling K., B. Holmlund, and A. Vejsiu (2001), "Do Bene�t Cuts Boost Job
Finding? Swedish Evidence from the 1990s," The Economic Journal, 111 (474),
766-790.
[4] Disdier, A-C. and K. Head (2008), "The Puzzling Persistence of the Distance
E¤ect on Bilateral Trade," The Review of Economics and Statistics, 90 (1), 37-48.
[5] Holmlund B. (1998), "Unemployment Insurance in Theory and Practice," Scan-
dinavia Journal of Economics 100 (1), 113-141.
[6] Jeppesen, I., J. A. List, and H. Folmer (2002), "Environmental Regulations
and New Plant Location Decisions: Evidence from a Meta-Analysis," Journal of
Regional Science, 42 (1), 19-39.
[7] Jones, S. (1995), "E¤ects of Bene�t Rates Reduction and Changes in Entitlement
(Bill C-113) on Unemployment, Job Search Behaviour and New Job Quality,"
Human Resource Development Canada, August.
[8] Mortensen, D. T. (1977), "Unemployment Insurance and Labor Supply Deci-
sions," Discussion Papers 271, Northwestern University, Center for Mathematical
Studies in Economics and Management Science.
[9] Roed K. and T. Zhang (2003), "Does Unemployment Compensation A¤ect Un-
employment Duration?," The Economic Journal 113 (484), 190-206.
55

56 Chapter 3. A Meta-Analysis of Cross-Country Studies
[10] Stanley, T. D. (2005), "Beyond Publication Bias," Journal of Economic Sur-
veys, 19 (3), 309-345.
[11] Stanley T. D. and S. B. Jarrell (1989), "Meta-regression Analysis: A Quantita-
tive Method of Literature Surveys," Journal of Economic Survey, 19 (3), 161-171.
[12] World Economic Outlook (April, 2003), Growth and Institutions, World Eco-
nomic and Financial Surveys, International Monetary Fund.
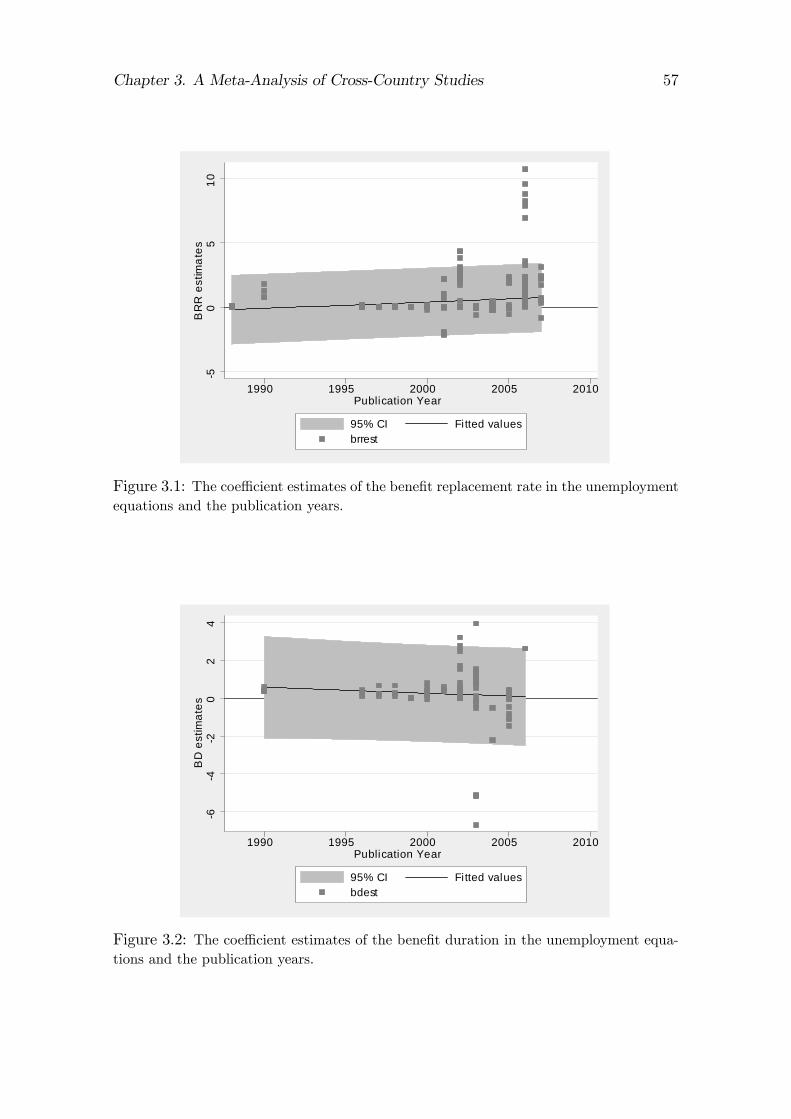
Chapter 3. A Meta-Analysis of Cross-Country Studies 57
50
510
BR
R e
stim
ates
1990 1995 2000 2005 2010Publication Year
95% CI Fitted valuesbrrest
Figure 3.1: The coe¢ cient estimates of the bene�t replacement rate in the unemploymentequations and the publication years.
64
20
24
BD
est
imat
es
1990 1995 2000 2005 2010Publication Year
95% CI Fitted valuesbdest
Figure 3.2: The coe¢ cient estimates of the bene�t duration in the unemployment equa-tions and the publication years.
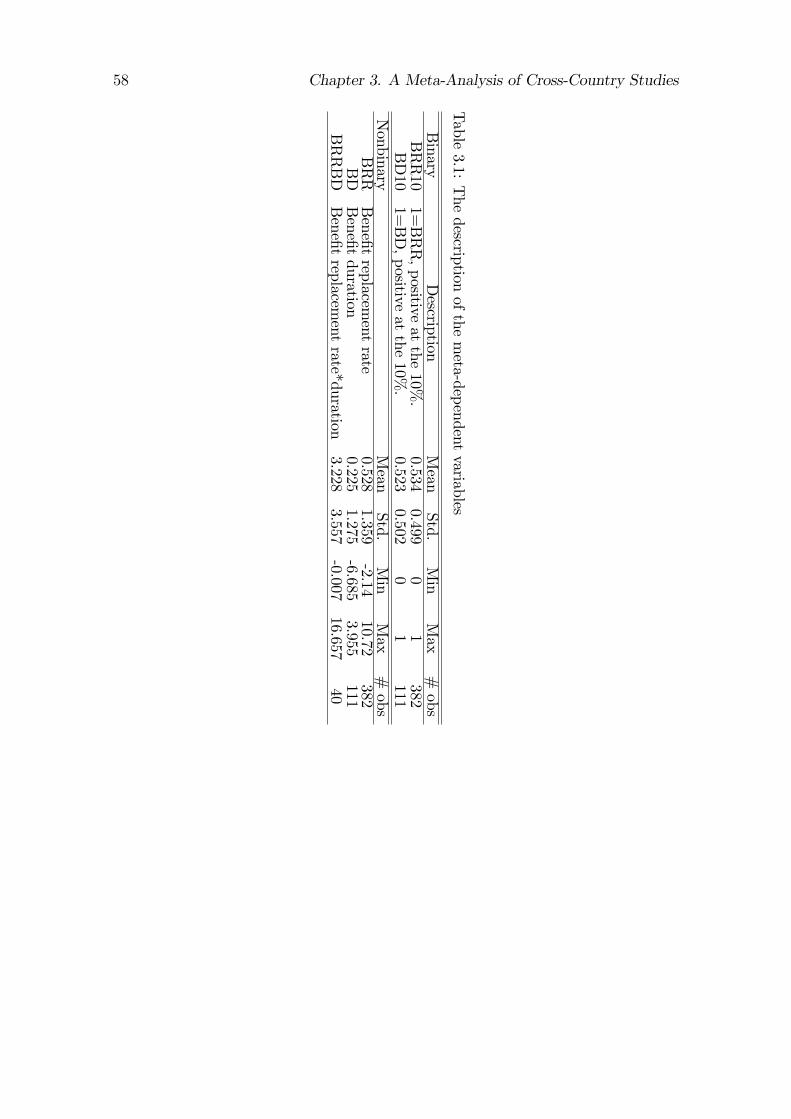
58 Chapter 3. A Meta-Analysis of Cross-Country Studies
Table
3.1:Thedescription
ofthe
meta-dependent
variables
Binary
Description
Mean
Std.Min
Max
#obs
BRR10
1=BRR,positive
atthe
10%.
0.5340.499
01
382BD10
1=BD,positive
atthe
10%.
0.5230.502
01
111Nonbinary
Mean
Std.Min
Max
#obs
BRR
Bene�t
replacement
rate0.528
1.359-2.14
10.72382
BD
Bene�t
duration0.225
1.275-6.685
3.955111
BRRBD
Bene�t
replacement
rate*duration3.228
3.557-0.007
16.65740
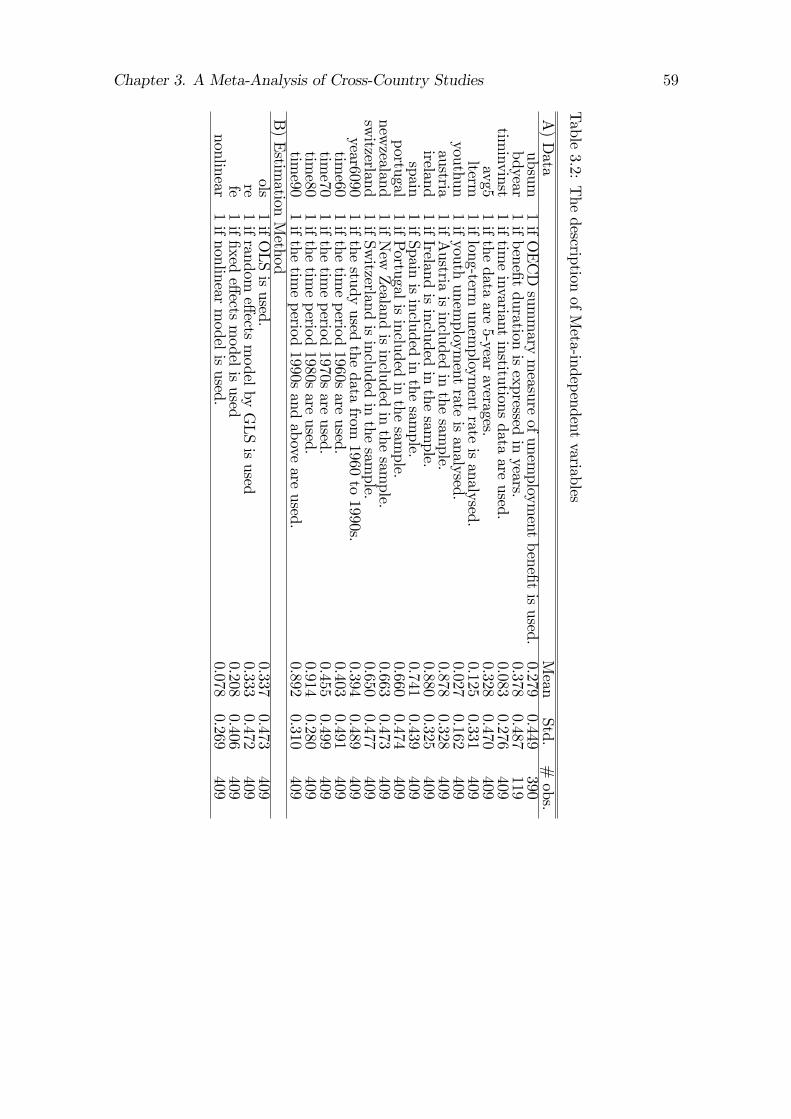
Chapter 3. A Meta-Analysis of Cross-Country Studies 59
Table
3.2:Thedescription
ofMeta-independent
variables
A)Data
Mean
Std.#obs.
ubsum1ifOECDsum
mary
measure
ofunem
ployment
bene�tisused.
0.2790.449
390bdyear
1ifbene�t
durationisexpressed
inyears.
0.3780.487
119timinvinst
1iftimeinvariant
institutionsdata
areused.
0.0830.276
409avg5
1ifthe
dataare
5-yearaverages.
0.3280.470
409lterm
1iflong-term
unemploym
entrate
isanalysed.
0.1250.331
409youthun
1ifyouth
unemploym
entrate
isanalysed.
0.0270.162
409austria
1ifAustria
isincluded
inthe
sample.
0.8780.328
409ireland
1ifIreland
isincluded
inthe
sample.
0.8800.325
409spain
1ifSpain
isincluded
inthe
sample.
0.7410.439
409portugal
1ifPortugal
isincluded
inthe
sample.
0.6600.474
409new
zealand1ifNewZealand
isincluded
inthe
sample.
0.6630.473
409switzerland
1ifSwitzerland
isincluded
inthe
sample.
0.6500.477
409year6090
1ifthe
studyused
thedata
from1960
to1990s.
0.3940.489
409time60
1ifthe
timeperiod
1960sare
used.0.403
0.491409
time70
1ifthe
timeperiod
1970sare
used.0.455
0.499409
time80
1ifthe
timeperiod
1980sare
used.0.914
0.280409
time90
1ifthe
timeperiod
1990sand
aboveare
used.0.892
0.310409
B)Estim
ationMethod
ols1ifOLSisused.
0.3370.473
409re
1ifrandom
e¤ectsmodel
byGLSisused
0.3330.472
409fe
1if�xed
e¤ectsmodel
isused
0.2080.406
409nonlinear
1ifnonlinear
model
isused.
0.0780.269
409
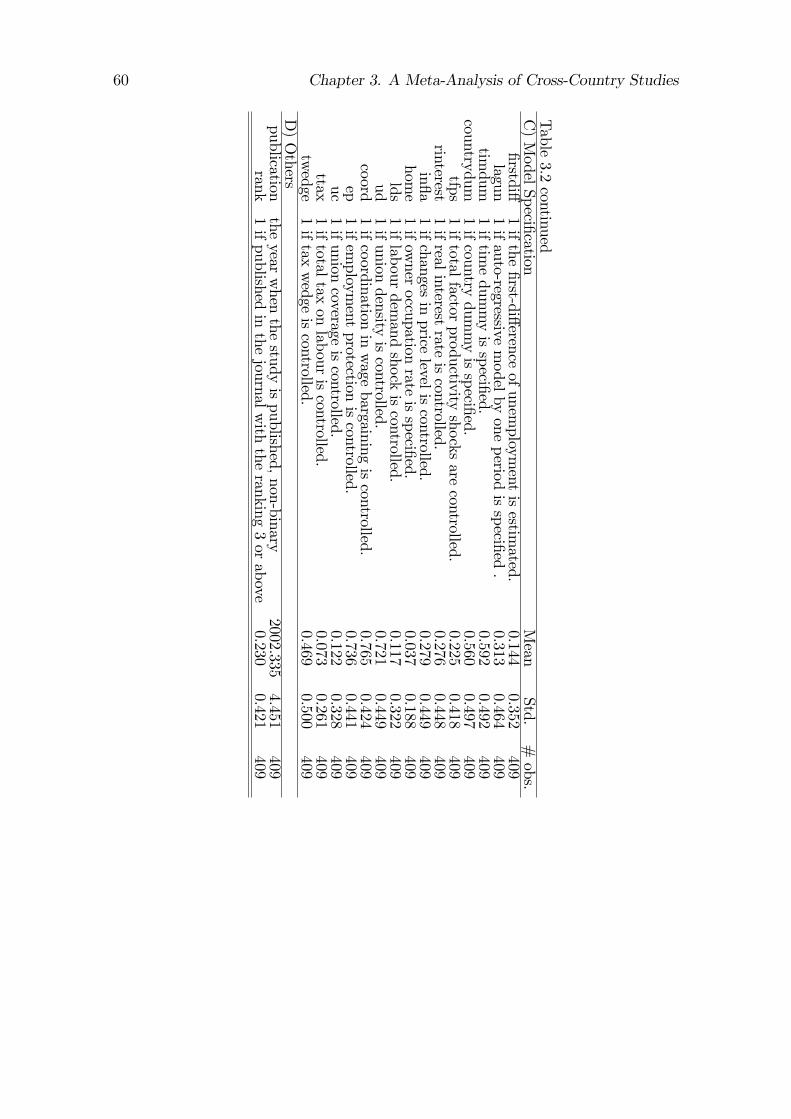
60 Chapter 3. A Meta-Analysis of Cross-Country Studies
Table
3.2continued
C)Model
Speci�cationMean
Std.#obs.
�rstdi¤1ifthe
�rst-di¤erenceofunem
ployment
isestim
ated.0.144
0.352409
lagun1ifauto-regressive
model
byone
periodisspeci�ed
.0.313
0.464409
timdum
1iftimedum
myisspeci�ed.
0.5920.492
409countrydum
1ifcountry
dummyisspeci�ed.
0.5600.497
409tfps
1iftotal
factorproductivity
shocksare
controlled.0.225
0.418409
rinterest1ifreal
interestrate
iscontrolled.
0.2760.448
409in�a
1ifchanges
inprice
leveliscontrolled.
0.2790.449
409hom
e1ifowner
occupationrate
isspeci�ed.
0.0370.188
409lds
1iflabour
demand
shockiscontrolled.
0.1170.322
409ud
1ifunion
densityiscontrolled.
0.7210.449
409coord
1ifcoordination
inwage
bargainingiscontrolled.
0.7650.424
409ep
1ifemploym
entprotection
iscontrolled.
0.7360.441
409uc
1ifunion
coverageiscontrolled.
0.1220.328
409ttax
1iftotal
taxonlabour
iscontrolled.
0.0730.261
409twedge
1iftax
wedge
iscontrolled.
0.4690.500
409D)Others
publicationthe
yearwhen
thestudy
ispublished,
non-binary2002.335
4.451409
rank1ifpublished
inthe
journalwith
theranking
3orabove
0.2300.421
409

Chapter 3. A Meta-Analysis of Cross-Country Studies 61
Table 3.3: The Baseline Probit Estimation of the Binary Dependent Variables.
BRR10 BD10portugal 0.011 0.510
(0.159) (0.228)*avg5 -0.248 0.350
(0.113)** (0.125)***ubsum/bdyear 0.331 0.667
(0.134)** (0.197)**lterm -0.226 0.297
(0.112)* (0.181)youthun 0.376 dropped
(0.143)*timinvinst 0.511 0.431
(0.102)** (0.177)fe 0.088 0.886
(0.133) (0.085)***lds 0.332 -0.022
(0.127)** (0.001)***home -0.318 0.424
(0.122)** (0.120)**lagun -0.231 -0.816
(0.101)** (0.262)rank -0.349 -0.168
(0.211) (0.395)# of obs. 382 96obs. prob. 0.534 0.552
pred. prob. (at x) 0.515 0.577pseudo-R2 0.346 0.502
Note: The numbers in the parentheses are robust standard errors for clustered samples by paper.
***, **, and * denote signi�cance of 1%, 5%, and 10%, respectively. The explanatory variables
year6090, �rstdi¤, in�a, rinterest, tfps, ud, coord, twedge, and ttax are not presented in the table.
In the regression of BD10, variables year6090, youthun, �rstdi¤, and coord are dropped because
they predict the failure perfectly.

62 Chapter 3. A Meta-Analysis of Cross-Country Studies
Table 3.4: The Baseline OLS Estimation.
BRR_OLS BD_OLS BRRBD_OLSportugal 0.118 0.390 1.091
(0.223) (0.265) (0.054)***avg5 -0.757 0.196 -8.911
(0.425)* (0.174) (0.171)***ubsum/bdyear -0.883 0.757 -14.354
(0.349)** (0.309)** (0.673)***lterm -0.643 0.010 dropped
(0.355)* (0.193)youthun -0.632 -0.364 dropped
(0.316)* (0.527)timinvinst -0.221 0.117 dropped
(0.289) (0.482)fe -0.030 1.667 1.411
(0.293) (0.430)*** (0.327)***lds 1.561 -1.460 -2.695
(0.402)*** (1.049) (1.149)*home -0.092 0.552 0.879
(0.322) (0.247)** (0.396)*lagun -0.478 -0.663 -10.427
(0.478) (0.442) (0.054)*rank -0.266 -0.146 -1.184
(0.344) (0.270) (0.330)**constant 1.385 0.068 11.759
(0.521)** (0.766) (0.638)***# of obs. 382 111 40F-stat. 24.25 . .
R2 0.459 0.346 0.962Note: The numbers in the parentheses are robust standard errors for clustered samples by paper.
***, **, and * denote signi�cance of 1%, 5%, and 10%, respectively. The explanatory variables
year6090, �rstdi¤, in�a, rinterest, tfps, ud, coord, twedge, and ttax are not presented in the table.

Chapter 3. A Meta-Analysis of Cross-Country Studies 63
Table 3.5: The Sensitivity Analysis for Bene�t Replacement Rate.
Probit (BRR) OLS (BRR) WLS (BRR)(1) (2) (3) (4) (5)
portugal 0.258 0.467 1.094(0.158) (0.438) (0.384)***
austria -0.530 0.650(0.097)*** (0.271)**
ireland -0.576 -0.962(0.084)*** (0.729)
newzeland 0.511 0.157(0.131)*** (0.438)
spain 0.360 -1.000(0.126)** (0.707)
switzerland -0.485 -0.936(0.143)*** (0.470)*
avg5 -0.272 -0.188 -0.662 -1.257 -1.693(0.100)*** (0.123) (0.321)** (0.695)* (0.318)***
ubsum 0.559 0.460 -0.452 -1.777 -2.971(0.088)*** (0.093)*** (0.256)* (0.679)** (0.590)***
year6090 -0.008 -0.681 -0.815(0.167) (0.397)* (0.426)*
time60 -0.009 0.241(0.236) (0.382)
time70 0.131 -0.834(0.163) (0.469)*
time80 0.082 -0.036(0.156) (0.362)
lterm -0.312 -0.457 -0.332 -1.879 -0.225(0.093)*** (0.093)*** (0.280) (0.826)** (0.711)
youthun 0.455 0.192 -0.028 -1.300 -2.386(0.107)** (0.229) (0.255) (0.709)* (0.743)***
timinvinst 0.425 0.101 -0.903 -0.653 -0.513(0.09)*** (0.218) (0.452)* (0.369)* (0.965)
fe 0.288 -0.259 -1.051(0.162)* (0.379) (0.162)***
re -0.102 0.018(0.121) (0.253)
ols 0.186 -0.060(0.142) (0.235)
nonlinear -0.025 0.373(0.161) (0.445)

64 Chapter 3. A Meta-Analysis of Cross-Country Studies
Table 3.5 continued�rstdi¤ -0.621 -0.529 -0.326 -0.106 0.057
(0.055)*** (0.083)*** (0.187)* (0.557) (0.633)in�a 0.055 -0.223 0.556 1.821 2.666
(0.180) (0.165) (0.357) (0.791)** (0.646)***rinterest -0.037 -0.242 0.154 -0.198 0.392
(0.213) (0.176) (0.202) (0.223) (0.996)lds 0.334 0.334 1.774 2.014 1.669
(0.125)** (0.129)** (0.573)*** (0.650)*** (0.453)***home -0.352 -0.381 -0.083 0.590 1.245
(0.133)* (0.121)** (0.350) (0.668) (0.295)***tfps 0.104 0.186 -0.580 -1.315 -0.327
(0.148) (0.174) (0.429) (0.515)** (1.291)ud 0.019 0.106 -0.888 -2.071 -0.615
(0.133) (0.159) (0.373)** (0.806)** (0.426)coord 0.394 0.361 0.660 0.266 0.091
(0.104)*** (0.118)*** (0.305)** (0.267) (0.343)twedge 0.053 0.131 0.671 0.783 1.726
(0.126) (0.139) (0.306)** (0.419)* (0.504)***ttax 0.443 0.535 0.498 -0.707 0.424
(0.140)** (0.051)*** (0.484) (0.615) (0.513)lagun -0.034 -0.040 -0.435 -0.844 -1.665
(0.096) (0.114) (0.295) (0.911) (0.697)ep -0.035
(0.114)uc -0.088
(0.132)bd -0.279
(0.174)brrbd 0.428
(0.140)*publication -0.083
(0.017)***constant 2.488 2.580 1.761
(1.277)* (0.940)** (1.099)# of obs. 382 382 382 175 352obs. prob. 0.534 0.534
pred. prob. (at x) 0.477 0.521pseudo-R2 0.441 0.434 0.575 0.694 0.721
Note: The numbers in the parentheses are robust standard errors for clustered samples by paper.
***, **, and * denote signi�cance of 1%, 5%, and 10%, respectively. In column (4), only the
observations that are signi�cant at the 5% level are considered. Column (5) is the weighted
least squares (WLS) estimation with weights equal to the inverse of the standard errors of each
observation.

Chapter 3. A Meta-Analysis of Cross-Country Studies 65Table
3.6:TheSensitivity
Analysis
forBene�t
Duration
andthe
InteractionofBene�t
Replacem
entRate
andBene�t
Duration.
Probit
(BD)
OLS(BD)
WLS(BD)OLS(BRRBD)WLS(BRRBD)
(1)(2)
(3)(4)
(5)(6)
(7)portugal
0.399-0.182
0.4321.107
0.741(0.329)
(0.113)(0.544)
(0.199)***(0.309)*
ireland0.305
0.044(0.264)
(0.012)spain
0.508-0.538
(0.290)(0.202)***
avg50.228
0.112-0.371
0.202-0.504
-8.812-8.905
(0.199)(0.036)***
(0.560)(0.539)
(0.488)(0.096)***
(0.062)***year6090
-0.1960.056
-2.6171.339
(0.103)***(0.223)
(2.318)(0.603)*
time60
-0.219-0.120
2.022(0.099)**
(0.481)(0.199)***
time70
-0.094-1.015
-0.954(0.275)
(0.598)(1.847)
time80
0.456dropped
(0.460)time90
0.351(0.128)
bdyear0.315
10.213
0.0880.410
-13.153-15.673
(0.184)(0.000)***
(0.545)(0.329)
(0.452)(1.005)***
(0.553)***lterm
0.1790.258
-0.0350.083
0.040dropped
dropped(0.211)
(0.209)*(0.312)
(0.333)(0.303)
youthundropped
dropped-0.418
dropped1.418
droppeddropped
(0.628)(2.044)
�rstdi¤dropped
dropped-0.311
dropped0.583
dropped-1.129
(0.813)(0.282)*
(0.945)timinvinst
-0.646-0.232
-0.491-0.538
2.382dropped
dropped(0.193)
(0.066)***(0.866)
(0.310)(2.208)
fe1
1.7372.658
1.5920.525
(0.000)***(0.392)***
(0.797)***(0.433)***
(0.644)re
-0.937-2.661
(0.048)***(1.124)**
ols-0.640
-1.492(0.213)**
(0.912)nonlinear
-0.228-1.737
(0.577)(1.003)*

66 Chapter 3. A Meta-Analysis of Cross-Country StudiesTable
3.6continued
in�a
-0.152-1
-1.002-0.523
1.173-4.183
-2.418(0.321)
(0.000)***(0.735)
(0.676)(1.027)
(1.083)***(1.014)*
rinterest-0.739
11.277
-.01311.872
-3.114-5.793
(0.136)***(0.000)***
(1.323)(0.193)
(2.474)(0.790)***
(0.217)***lds
0.957-1
-0.647dropped
1.697-4.578
-0.260(0.016)***
(0.000)***(2.254)
(1.697)(1.480)**
(0.883)**hom
e0.372
0.9140.244
0.0720.941
-0.1850.960
(0.116)**(0.046)***
(0.198)(0.132)
(0.728)(0.530)
(0.359)**tfps
-0.6191
0.618dropped
-0.7655.907
4.269(0.009)***
(0.000)***(1.962)
(2.143)(0.963)***
(0.688)***ud
0.6550.081
0.4050.843
0.528-0.426
0.445(0.259)*
(0.047)***(0.364)
(0.406)*(0.654)
(0.350)(0.175)**
coorddropped
dropped0.697
-1.0420.875
droppeddropped
(0.614)(0.500)*
(1.872)twedge
0.012-1
0.113-0.340
-1.4220.199
-0.021(0.277)
(0.000)***(0.463)
(0.238)(0.778)*
(0.199)(0.309)
ttax0.152
0.6900.856
-0.012-0.538
1.181-0.699
(0.303)(0.119)***
(0.548)(0.605)
(0.949)(0.554)
(0.492)lagun
-0.390-0.305
-0.540-0.927
-0.915-10.559
-10.777(0.417)
(0.147)***(0.688)
(0.605)(0.894)
(0.199)***(0.309)***
publication-0.235
-0.043-0.480
(0.097)***(0.101)
(0.150)**ep
-0.016dropped
(0.079)uc
1dropped
(0.000)***brr
0.2521.358
-0.062(0.075)***
(0.585)**(0.616)
brrbd1.000
-1.453(0.002)***
(2.457)constant
85.0281.251
-0.892973.300
14.074(202.287)
(0.371)***(1.722)
(301.649)(1.8314)***
#obs.
9696
11150
11140
40obs.
prob.0.552
0.552pred.
prob.(at
x)0.592
0.658(Pseudo)-R
20.430
0.7240.485
0.7020.345
0.9580.977
Note:
Thenum
bers
inthe
parenthesesare
robuststandard
errorsfor
clusteredsam
plesbypap
er.***,
**,and
*denote
signi�canceof1%,5%,and
10%,
respectively.
Incolum
n(4),
onlythe
observationsthat
aresigni�cant
atthe
5%level
areconsidered.

Chapter 3. A Meta-Analysis of Cross-Country Studies 67
Table
3.7:Sum
mary
ofthe
Characteristics
ofthe
Papers
Includedinthe
Meta-A
nalysis
ID.
Paper
#Countries
Period
Data
Est.
method
1Nickell
(1997)20,
191983-1994
6-yravg
RE
2Nickell
(1998)20,
191983-1994
6-yravg
RE
3Nickell
etal(2001)
15,20,
191960-95
yearlyRE
4Nunziata
(2002)18-20
1960-95,1970-95
yearlyFE,OLS
5Nickell
etal(2005)
20,19
1961-95yearly
RE,NLS
6Blanchard
&Wolfers
(2000)20
1960-955-yr
avgNLS
7Elmeskov
etal(1998)
18,19
1983-95yearly
RE
8Belot
&van
Ours
(2001)18
1960-945-yr
avgFE,OLS
9Belot
&van
Ours
(2004)17
1960-995-yr
avgFE,OLS
10Scarp
etta(1996)
171983-93
yearlyFGLS
11Bertola
etal(2001)
201960-96
5-yravg
OLS,NLS
12Baccaro
&Rei(2005)
181960-98
yearly,5-yr
avgRE,OLS,NLS
13Baker
etal(2003)
20,19
1985-94,1960-99
5-yravg
RE
14IMF(2003)
201960-98
yearlyRE
15OECD(1999)
191985-90,
1992-976-yr
avgRE
16Esping-A
ndersen&Regini
(2000)20
19961year
OLS
17Amable
etal(2006)
181980-2004
yearlyOLS,FE,RE
18Gri¢
thetal(2006)
141986-2000
yearlyOLS,IV
19Fitoussi
(2000)19
1980s-1990s1period
OLS
20Jackm
anetal(1996)
20,19
1983-946-yr
avgOLS
21Daveri
&Tabellini
(2000)14
1965-955-yr
avgOLS
22Chen
etal(2003)
191960-99
10-yravg
OLS
23Jackm
anetal(1990)
141971-88
yearlyIV
24Baker
etal(2004)
201960-98
yearly,5-yr
avgRE
25Bassanini
&Duval
(2006)20
1982-2003yearly,
5-yravg
FE,RE,OLS,NLS
26Boone
&van
Ours
(2004)20
1985-99yearly,
5-yravg
RE,FE
27Macculloch
&DiTella
(2005)21
1984-90yearly
RE,LSVDV,GMM,FE
28Algan
etal(2002)
171960-2000
5-yravg
OLS,GLS
29Burda
(1988)11
1985,1979
1year
OLS
30Howell(2003)
201989-94,
1995,2001
5-yravg,
1period
OLS
31Kenw
orthy(2002)
161980-97
yearlyOLS
32Amable
etal(2007)
181980-94
yearlyRE,FE,OLS
33Garibaldi
&Violante
(2005)17
1960-20005-yr
avgFE
34Addison
&Teixeira
(2005)20
1956-996-yr
avg,5-yr
avgRE,NLS

68 Chapter 3. A Meta-Analysis of Cross-Country Studies
Table
3.8:Sum
mary
ofthe
Meta-O
bservationsforBene�t
Replacem
entRatio
andBene�t
Duration
BRR
BRR10
BD
BD10
Id.Paper
Mean
Min
Max
#obs.
Mean
Mean
Min
Max
#obs.
Mean
1Nickell
(1997)0.011
0.0110.011
31
0.1270.043
0.253
0.6672
Nickell
(1998)0.012
0.0110.013
30.667
0.1320.045
0.253
06673
Nickell
etal(2001)
1.480.3
2.213
0.6670.363
0.220.47
31
4Nunziata
(2002)2.548
0.1934.356
201
0.9010.006
3.22820
0.855
Nickell
etal(2005)
2.1241.88
2.45
10.39
0.340.47
50.6
6Blanchard
&Wolfers
(2000)0.096
0.0060.025
110.818
0.2120.157
0.2677
17
Elmeskov
etal(1998)
0.0960.08
0.117
1.
..
0.
8Belot
&van
Ours
(2001)-0.617
-2.141.09
70.286
..
.0
.9
Belot
&van
Ours
(2004)-0.074
-0.240.06
70.286
..
.0
.10
Scarpetta
(1996)0.109
0.020.18
300.833
..
.0
.11
Bertola
etal(2001)
0.0010.001
0.0012
1.
..
0.
12Baccaro
&Rei(2005)
-0.007-0.03
0.02163
0.048-0.485
-1.4330.225
90
13Baker
etal(2003)
-0.108-0.61
0.0645
0-2.628
-6.6853.955
50
14IMF(2003)
-0.008-0.044
0.0124
0.25.
..
0.
15OECD(1999)
0.0110.01
0.027
0.5710
00
70
16Esping-A
ndersen&Regini
(2000)0.004
-0.0030.012
30
0.077-0.02
0.1383
0.66717
Amable
etal(2006)
1.4630.464
3.58033
0.364.
..
0.
18Gri¢
thetal(2006)
7.8002.36
10.727
0.857.
..
0.
19Fitoussi
(2000)-0.023
-0.20.12
30.667
0.5330.2
0.793
0.66720
Jackmanetal(1996)
0.0080.004
0.0113
0.3330.097
0.040.16
30.333
21Daveri
&Tabellini
(2000)0.109
0.050.18
140.643
..
.0
.22
Chen
etal(2003)
0.050.01
0.126
0.50.203
-0.51.3
60.333
23Jackm
anetal(1990)
0.4350.28
0.674
0.50.165
0.140.22
41
24Baker
etal(2004)
0.007-0.019
0.03410
0.4-1.340
-2.197-.482
20
25Bassanini
&Duval
(2006)0.106
0.040.21
401
2.642.64
2.641
126
Boone
&van
Ours
(2004)0.242
0.0830.512
61
..
.0
.27
Macculloch
&DiTella
(2005)-0.021
-0.5550.202
170
..
.0
.28
Algan
etal(2002)
0.0060.005
0.0074
0.50.002
-0.0040.005
40
29Burda
(1988)0.065
0.030.14
160.938
..
.0
.30
Howell(2003)
0.053-0.011
0.1110
0.21.108
0.541.53
100.9
31Kenw
orthy(2002)
..
.0
.0.09
0.040.19
50.2
32Amable
etal(2007)
1.559-0.83
3.12913
0.615.
..
0.
33Garibaldi
&Violante
(2005)-0.03
-0.03-0.03
40
..
.0
.34
Addison
&Teixeira
(2005)0.001
-0.0310.036
120.417
0.005-0.016
0.0328
0.25

Chapter 3. A Meta-Analysis of Cross-Country Studies 69
Meta-Analysis References
1. Nickell, S. (1997), "Unemployment and Labor Market Rigidities: Europe ver-sus North America," Journal of Economic Perspectives, 11 (3), 55-74.
2. Nickell, S. (1998), "Unemployment: Questions and Some Answers," The Eco-nomic Journal, 108 (448), 802�816.
3. Nickell, S., L. Nunziata, W. Ochel, and G. Quintini (2001), "The BeveridgeCurve, Unemployment and Wages in the OECD from the 1960s to the 1990s,"CEP Discussion Papers 0502.
4. Nunziata, L. (2002), "Unemployment, LabourMarket Institutions, and Shocks,"Economics Papers W16, Economics Group, Nu¢ eld College, University of Ox-ford.
5. Nickell, S., L. Nunziata, and W. Ochel: "Unemployment in the OECD Sincethe 1960s. What Do We Know?," Economic Journal, 115 (500), 1-27.
6. Blanchard, O. and J. Wolfers (2000), "The Role of Shocks and Institutions inthe Rise of European Unemployment: the Aggregate Evidence,"The EconomicJournal, 110 (462), 1�33.
7. Elmeskov, J., J. P. Martin, and S. Scarpetta (1998), "Key Lessons For LabourMarket Reforms: Evidence From OECD Countries�Experience," Swedish Eco-nomic Policy Review, 5 (2), 205-258.
8. Belot, M. and J. C. van Ours (2001), "Unemployment and Labor Market In-stitutions: An Empirical Analysis," Journal of the Japanese and InternationalEconomies, 15 (4), 403-418.
9. Belot, M. and J. C. van Ours (2004), "Does the recent success of some OECDcountries in lowering their unemployment rates lie in the clever design of theirlabor market reforms?," Oxford Economic Papers, 56 (4), 621-642.
10. Scarpetta, S. (1996), "Assessing the Role of Labour-Market Policies and In-stitutional Factors on Unemployment: A Cross-Country Study�, OECD Eco-nomic Studies No. 26, Paris.
11. Bertola, G., F. D. Blau, and L. M. Kahn (2001), "Comparative Analysis ofLabor Market Outcomes: Lessons for the Us from International Long-RunEvidence," NBER Working Paper 8526.
12. Baccaro, L. and D. Rei (2005), "Institutional Determinants of Unemploy-ment in OECD Countries: A Time Series Cross-Section Analysis (1960-98),"DP/160/2005, International Institute for Labour Study, Geneva.
13. Baker, D., A. Glyn, D. Howell, and J. Schmitt (2003), "Labor Market Insti-tutions and Unemployment: A Critical Assessment of the Cross-Country Evi-dence," CEPA Working Paper 2002-17, Center for Economic Policy Analysis,New School University.

70 Chapter 3. A Meta-Analysis of Cross-Country Studies
14. Chapter 4, "Unemployment and Labor Market Institutions: Why Reform Payo¤,"World Economic Outlook (2003), World Economic and Financial Surveys:Growth and Institutions, International Monetary Fund.
15. Chapter 2, "Employment Protection and Labour Market Performance,"OECDEmployment Outlook (1999), Paris.
16. Esping-Andersen, G. and M. Regini (2000), "Who is Harmed by Labour Mar-ket Regulations? Quantitative Evidence," Chapter 3, Why Deregulate LabourMarkets?, Oxford University Press.
17. Amable, B., L. Demmou, and D. Gatti (2006), "Institutions, Unemploymentand Inactivity in the OECD countries," Working Paper N� 2006 - 16, Paris-Jourdan Sciences Economiques.
18. Gri¢ th R., R. Harrison, and G. Macartney (2006), "Product Market Re-forms, Labour Market Institutions and Unemployment," IFS Working Papers,W06/06, The Institute for Fiscal Studies.
19. Fitoussi, J-P., D. Jestaz, E. S. Phelps, and G. Zoega (2000), "Roots of the Re-cent Recoveries : Labor Reforms or Private-Sector Forces?" Brookings Paperson Economic Activity, 2000 (1), 237-311.
20. Jackman R., R. Layard, and S. Nickell (1996), "Combating Unemployment:Is Flexibility Enough?" CEP-Discussion Paper No. 293, Centre for EconomicPerformance.
21. Daveri, F. and G. Tabellini (2000), "Unemployment, Growth and Taxation inIndustrial Countries," Economic Policy, 15 (3), 49-90.
22. Chen, Y-F., D. Snower, and G. Zoega (2002), "Labour Market Institutions andMacroeconomic Shocks," IZA Discussion Papers 539, Institute for the Studyof Labor (IZA).
23. Jackman, R., C. Pissarides, and S. Savouri (1990), �Labour Market Policiesand Unemployment in the OECD,�Economic Policy 11, October.
24. Baker, D., A. Glyn, D. Howell, and J. Schmitt (2004), "Unemployment andLabor Market Institutions: the Failure of the Empirical Case of Deregula-tion," CEPA Working Paper 2004-4, Center for Economic Policy Analysis,New Shool University.
25. Bassanini, A. and R. Duval (2006), "Employment Pattern in OECD Coun-tries: Reassessing the Role of Policies and Institutions," DELSA/ELSA/WDSEM(2006)4, OECD Social, Employment, and Migration Working Papers,No.35.
26. Boone, J. and J. C. van Ours (2004), "E¤ective Active Labor Market Policies,"IZA Discussion Papers No.1335, Institute for the Study of Labor (IZA).

Chapter 3. A Meta-Analysis of Cross-Country Studies 71
27. Di Tella, R. and R. MacCulloch (2005), "The Consequences of Labor Mar-ket Flexibility: Panel Evidence Based on Survey Data," European EconomicReview, 49 (5), 1225-1259.
28. Algan Y., P. Cahuc, and A. Zylberberg (2002), "Public Employment andL-labour Market Performance," Economic Policy, 17 (34), 7-66.
29. Burda, M. (1988), "Wait Unemployment in Europe," Economic Policy, 3 (7),391-416.
30. Howell, D. R. (2003), "The Micro-Foundations of High Unemployment in De-veloped Countries: Are Labor Market Rigidities the Problem?," Chapter 7 inHarris and Goodwin, eds. New Thinking in Macroeconomics: Social, Institu-tional, and Environmental Perspectives (Elgar, 2003).
31. Kenworthy, L. (2002), "Corporatism and Unemployment in the 1980s and1990s," American Sociological Review, 67 (3), 367-388.
32. Amable, B., L. Demmou, and D. Gatti (2007), "Employment Performance andInstitutions: New Answers to an Old Question," Discussion Paper No.2731,Institute for the Study of Labor (IZA).
33. Garibaldi, P. and G. L. Violante (2005), "The Employment E¤ects of Sev-erance Payments with Wage Rigidities," The Economic Journal, 115 (506),799-832.
34. Addison, J. T. and P. Teixeira (2005), "What Have We Learned about the Em-ployment E¤ects of Severance Pay? Further Iterations of Lazear et al.," Empir-ica, 32 (2), 345-368, Economic and Financial Surveys, International MonetaryFund.

72 Chapter 3. A Meta-Analysis of Cross-Country Studies

Chapter 4
The E¤ects of Trade onUnemployment: Evidence from 20OECD Countries�
1 Introduction
The e¤ects of globalisation have received great attention in economic research. In
the last two decades, economists have studied how increases in trade, foreign direct
investments, and immigration can a¤ect labour market outcomes such as income
distribution and unemployment. The theoretical models and the empirical investi-
gations in these topics are so voluminous that frequent literature surveys are required
to grasp the updated research �ndings.
One of the very recent questions in focus is whether, and if so how, the impact
of trade on labour market outcomes depends on labour market institutions. Krug-
man (1995) acknowledges that trade seems to have reduced the relative wage of
low-skilled workers in the United States and the United Kingdom, whereas in most
European countries, trade seems to have resulted in higher unemployment. Di¤er-
ences in labour market institutions are emphasized as one of the main factors for
the divergent e¤ects of trade in these countries.
The aim of this study is to empirically investigate the link between trade and ag-
gregate unemployment in the presence of labour market institutions. First, I analyse
whether international trade has any direct e¤ect on aggregate unemployment. Sec-
ond, I explore how the interaction between trade and labour market institutions may
a¤ect the unemployment rate. The analysis is based on cross-country panel data
for twenty OECD countries from the 1960s to the 2000s. In general, cross-country
� I thank Ann-So�e Kolm, Jonas Vlachos, Anders Åkerman and Helena Svaleryd for their adviceand support.
73
74 Chapter 4. The E¤ects of Trade on Unemployment
data analyses may involve some weakness. Nevertheless, it is a plausible method for
empirically identifying the general equilibrium evidence of how international trade
is related to the level of aggregate unemployment, especially when one wants to take
di¤erences of labour market institutions across countries into consideration.
Besides looking at the e¤ects of total trade and total imports, I also investigate
whether the imports from low-income economies will have any distinctive e¤ects
on the aggregate unemployment rate as compared to imports from high-income
economies. Since the size of trade is likely to be endogenous, I use a set of constructed
import and export variables, respectively, as instruments for the trade variables.
The following is found in this study. First, when the interaction between trade
and labour market institutions is accounted for, trade is likely to lead to an increase
(decrease) in aggregate unemployment in countries with relatively rigid (�exible)
labour market institutions. Second, as only the direct e¤ect of trade is considered,
an increase in imports from high-income economies leads to higher unemployment,
while total trade, total imports, or imports from low-income economies tend to have
no signi�cant e¤ect on the unemployment rate. The result of the direct e¤ect of
trade on the unemployment rate should, nevertheless, be considered with caution,
since the model with only the direct e¤ect of trade can be misspeci�ed.
In general, previous empirical studies have found that the employment e¤ects
of trade in OECD countries are weak or their magnitudes are small. Just to name
a few studies, Wacziarg and Wallack (2004), who used data for the manufacturing
sector, found that no data support the hypothesis that trade liberalisation leads to
intersectoral labour shifts. Similarly, Dewatripont, Sapir and Sekkat (1999) found
no signi�cant hardship from LDC import penetration in terms of long-term unem-
ployment at the individual or sectoral level in four European countries. Revenga
(1997) concludes that there is no reduction in overall �rm-level employment due to
a reduction in the tari¤ level. Papageorgiou, Michaely and Choksi (1991) acknowl-
edge from the nineteen case studies of trade liberalisation episodes that there are
no signi�cantly large employment e¤ects following trade liberalisation.
Studies that analyse the impact of trade on aggregate unemployment are scarce,
however. Moreover, the previous studies in the trade literature often neglect the
importance of labour market institutions for understanding the impact of trade on
labour market outcomes. This is surprising, since di¤erences in labour market insti-
tutions are known to be one of the important factors in explaining unemployment.
Dutt et al. (2009) analyse the e¤ect of trade policies on the aggregate unem-
ployment rate in a heterogeneous group of countries. They �nd robust evidence

Chapter 4. The E¤ects of Trade on Unemployment 75
that open trade policies lead to lower unemployment. In contrast to their work, the
present paper concentrates on twenty relatively homogenous OECD countries. This
makes it more suitable for comparing the extent of labour market institutions, and
improves the analysis by having panel data over 40 years, which can control for un-
observable heterogeneity among countries. In addition, Dutt et al. (2009) account
for the extent to which labour market institutions, i.e. employment law index, only
serve as a control, while the current paper focuses on the role of di¤erent labour
market institutions as it interacts with trade in explaining aggregate unemployment.
The working paper by Boulhol (2008) shares a similar spirit as the present study.
He also stresses the importance of labour market institutions when it comes to the ef-
fect of trade on unemployment. As is done in the present study, Boulhol accounts for
the interaction between labour market institutions and trade. However, the present
paper also investigates if the e¤ects of trade on aggregate unemployment are di¤erent
across types of trading partners by separating imports from low-income economies
from imports from high-income economies. Moreover, this paper uses trade instru-
ments to alleviate the potential endogeneity problems of the trade variables.
The paper is organised as follows. In the next section, I provide the theoreti-
cal backgrounds for the study. Section 3 presents the econometric model and the
data. Section 4 discusses the baseline estimation results. In section 5, I discuss the
robustness of the �ndings. Section 6 concludes the paper.
2 Theoretical Background
The �rst part of this section presents previous theoretical studies that have explored
the direct e¤ect of trade on unemployment. The second part presents the theoret-
ical studies that have analysed how trade may a¤ect unemployment through the
interaction with labour market institutions.
2.1 Trade and Unemployment
There is a number of theoretical models that analyse the e¤ect of trade on aggregate
unemployment. However, there is no consensus on whether an increase in trade will
lead to a higher or lower aggregate unemployment rate. The general intuition for
the negative association between trade and unemployment is that trade improves
the economy-wide value of the marginal product of labour. Dutt et al. (2009) argue
that trade openness, which improves aggregate labour productivity, will reduce un-
76 Chapter 4. The E¤ects of Trade on Unemployment
employment as it leads to more job creation and job search. Similarly, based on their
search-unemployment model with heterogeneous �rms, Felbermayr et al. (2011) also
argue that trade liberalization reduces unemployment as long as it improves aggre-
gate productivity. This happens through crowding-out of the least productive �rms
and labour reallocation into more productive �rms. Matusz (1996) also agrees with
the fact that trade may improve economy-wide productivity and thereby reduce the
unemployment rate. The reason is that trade results in a greater division of labour
due to an increase in the variety of available intermediates.
In contrast, Helpman and Itskhoki (2010) argue that lower trade barriers can lead
to an increase in unemployment. This follows as reduced trade barriers improve the
pro�tability of exporting �rms, thus leading to an expansion of the trading sector.
Unemployment will increase when workers reallocate towards the exporting sector,
if this sector is to a larger extent characterized by labour market frictions. Janiak
(2006) also shows that higher trade exposure is associated with a higher level of
equilibrium unemployment. The reason is that job destruction by the exit of small
low-productivity �rms exceeds job creation by large high-productivity �rms as large
�rms will extract higher rents by limiting the amount of job creation.
There are also theoretical studies that conclude that the e¤ect of trade on ag-
gregate unemployment is ambiguous. Sener (2001) and Moore and Ranjan (2005)
argue that trade liberalization leads to an increase in the unemployment of unskilled
workers, but has theoretically ambiguous e¤ects on aggregate unemployment. The
former study argues that trade liberalization increases the pro�tability of innovation
activity by raising the pro�t margin of the exporting �rms. Consequently, more �rms
will be engaged in R&D and there is an increase in the demand for skilled labour.
On the other hand, the higher frequency of innovations increases the turnover rate
of unskilled workers by speeding up the creative destruction process, and increases
the frictional unemployment rate of unskilled workers. Hence, the e¤ect of trade lib-
eralization on the aggregate unemployment rate is ambiguous. For similar reasons,
Moore and Ranjan (2005) argue that aggregate unemployment is likely to decrease
in a skilled-labour abundant country and increase in an unskilled-labour abundant
country.

Chapter 4. The E¤ects of Trade on Unemployment 77
2.2 Interaction between Trade and Labour Market Institu-
tions and Unemployment
Besides the direct e¤ect of trade on aggregate unemployment, this paper explores
how so-called rigidities imposed by labour market institutions can contribute to this
e¤ect. One of the earliest theoretical studies that analyses how the interaction be-
tween trade and labour market institutions can a¤ect unemployment is Davis (1998).
He argues that the opening of international trade can raise European unemployment
signi�cantly due to Europe�s commitment to maintain the minimum wage. Based on
the stylized model of minimum wage Europe and �exible wage U.S., he argues that
the product price, which re�ects the European minimum wage, de�nes the world
trade price.1 As trade commences, the U.S. wage level will gradually increase to
the European wage level, while the U.S. can maintain the zero unemployment rate
due to their �exible wage. He acknowledges that Europe, in fact, bears all the costs
of a trade shock such as a sudden increase in imports from developing countries
in the form of unemployment, while the U.S. labour market is fully insulated as a
result of the European rigidity.
Boulhol (2008) shows that Davis� (1998) main idea can be generalized to a
broader set of labour market institutions than just minimum wage setting. Labour
market institutions, such as minimum wages, unemployment bene�ts, union density,
employment protection legislation, etc. can be viewed as devices to push up the wage
costs at the lower end of the wage distribution. Labour market institutions a¤ect
the cost of labour and thus, relative factor and good prices. Therefore, imports from
low-income economies are potentially expected to be more likely to lead to higher
unemployment.
Moore and Ranjan (2005) argue that an economy with a greater degree of labour
market rigidity will experience a greater quantitative e¤ect of globalisation on un-
employment. Thus, these studies argue that labour market institutions may amplify
the increase in unemployment as a consequence of more trade.2
In contrast, Helpman and Itskhoki (2010) show that lower trade barriers can in-
crease unemployment in the country with the relatively more �exible labour market,
but potentially reduce unemployment in the country with the relatively more �exi-
ble labour market. Unemployment increases in the more �exible country as workers
1 This holds as long as Europe is not completely driven out of the industry that uses the low-skilled worker whose wage is bound by the minimum wage.
2 Moore and Ranjan (2005) de�ne labour market rigidity as any factor that tends to increasethe reservation utility of workers.

78 Chapter 4. The E¤ects of Trade on Unemployment
are reallocated towards the export sector where labour market frictions are assumed
to be higher. This may also be the case for a country with a more rigid labour
market. However, if a country has a very rigid labour market, the trading sector
in this country will start to contract, instead of expand, as trade increases. This
leads to a lower unemployment rate in the country with the rigid labour market as
workers are reallocated towards the non-trading sector which is assumed to have no
labour market frictions.
The empirical evidence that depicts how the interaction between trade and labour
market institutions a¤ects aggregate unemployment is limited. The only exception
is Boulhol (2008).3 His empirical investigation �nds evidence for the interactions
between increases in bilateral trade and relative labour market institutions having
raised aggregate unemployment rates. He argues that Canada, where labour market
institutions are fairly �exible in absolute terms, can be negatively a¤ected because
its main trading partner, the U.S., is even less regulated. Germany, whose labour
market is highly regulated in absolute terms, tends to be moderately a¤ected by
trade, since its major trading partners, i.e. other European countries, are even more
regulated.
3 Empirical Setup and Data
3.1 Empirical Setup
The aim of this study is to identify the e¤ects of trade on the aggregate unemploy-
ment rate in the presence of labour market institutions. First, I test if the size of
trade is directly correlated with the unemployment rate. Second, I test if the in-
teraction between trade and the degree of labour market institution is signi�cantly
associated with the unemployment rate. The baseline econometric model of the
reduced-form unemployment rate includes the explanatory variable that is related
to the extent of international trade, labour market institutions and macroeconomic
controls. Since a measure of labour market institutions may covary with other in-
stitutions within a country, this study analyses various institutions separately.
Equation (1) is the econometric speci�cation for the unemployment rate to iden-
3 For empirical studies that analyse how the interaction between shocks and institutions cana¤ect unemployment, see inter alia the in�uential study by Blanchard and Wolfers (2000).

Chapter 4. The E¤ects of Trade on Unemployment 79
tify the direct e¤ect of trade.
Uit = �(tradeit) + �(LMIit � LMI) +Xs
s(controlsit) + ci + �t + uit, (4.1)
where i and t denote country and time, respectively. The dependent variable U is
the standardized aggregate unemployment rate. The explanatory variable, trade,
is the size of total trade, total imports, imports from low-income and high-income
economies as ratios of GDP, which are used alternately. (LMIit�LMI) denotes thecentred measure of the labour market institutions, i.e. stringency of employment
protection, generosity of unemployment bene�ts, the power of trade unions, and the
degree of coordination in the wage bargaining process, where LMI is the sample
mean of labour market institutions across countries and over time. control are the
control variables, i.e. the population aged between 15 and 64 as a share of the total
population and GDP per capita. ci and �t denote country- and time-�xed e¤ects,
respectively, and uit is an error term. This study will test if a, the coe¢ cient of the
direct e¤ect of trade on the unemployment rate, di¤ers signi�cantly from zero.
Equation (2) analyses the e¤ect of the interaction between trade and labour
market institutions on the unemployment rate. The interaction term is de�ned as
the product of the trade variable and the centred labour market institution variable.
Uit = �(tradeit) + �(LMIit � LMI) + �(LMIit � LMI)(tradeit)
+Xs
s(controlsit) + ci + �t + uit. (4.2)
The total e¤ect of a marginal increase in trade on aggregate unemployment is � +
�(LMIit � LMI). Thus, whether trade actually increases or decreases aggregateunemployment does not only depend on the signs of the coe¢ cient estimates � and
�, but also on whether the country�s labour market institution is relatively rigid
or �exible. The coe¢ cient on the trade variable � is the so-called "constituent"
e¤ect of trade and can be interpreted as the marginal unemployment e¤ect of trade,
when the labour market institution is at its sample mean. The coe¢ cient on the
product term � depicts the extent of the additional e¤ect of trade on aggregate
unemployment depending on the extent of the country�s labour market institution.
The current study will investigate whether the total e¤ect of trade on aggregate
unemployment di¤ers signi�cantly from zero by identifying the signs of the con-
stituent e¤ect � and the interaction e¤ect � of trade. A positive � implies that an

80 Chapter 4. The E¤ects of Trade on Unemployment
increase in international trade gives rise to higher unemployment in the relatively
rigid labour market country, whereas an increase in trade will reduce unemployment
in the relatively �exible country. The combinations of a positive � and a negative �,
or of a negative � and a positive �; imply that rigidities in the labour market may
mitigate the e¤ect of trade on aggregate unemployment. Then, Davis�(1998) theo-
retical model indicates the positive sign on the interaction term �, where an increase
in trade is expected to raise unemployment in the country that is committed to the
minimum wage. In contrast, Helpman and Itskhoki (2010) argue for the negative
sign on the interaction term �, implying that trade leads to higher unemployment
in the relatively �exible country, but to lower unemployment in the relatively rigid
country.
3.2 Data
This section discusses the data. In the baseline regressions, I analyse to which extent
an increase in international trade a¤ects the aggregate unemployment rate using
the cross-country panel data of twenty OECD countries over the period 1961-2008.4
The annual data are arranged to �ve-year averages.5 Using �ve-year averages of
the data helps us smooth out short-term �uctuations and highlight the long-term
development of the variables, in which this study is interested. Moreover, it can
reduce some measurement error that might be problematic for the indices of labour
market institutions and other proxies. The data are analysed by the �xed-e¤ects
model. Besides twenty country dummies, I use three additional dummies for �xed
e¤ects of Finland, Germany, and Sweden since 1991.6
The dependent variable is the standardised aggregate unemployment rate, which
is unemployed workers as a share of the civilian labour force of the age group 15-64.
Figure 4.1 shows the development of the unemployment rate of selected countries
over the last �fty years. The U.S. had the highest unemployment rate from the
second half of the 1950s until the end of the 1970s. After that, the unemployment
4 The twenty OECD countries are Australia, Austria, Belgium, Canada, Denmark, Finland,France, Germany, Ireland, Italy, Japan, Netherlands, Norway, New Zealand, Portugal, Spain,Sweden, Switzerland, the United Kingdom and the United States.
5 The �rst observation is the unweighted average of the annual data between 1961 and 1965.The last observation is the average of the annual data between 2001 and 2007.
6 This method was �rst used in Bassanini and Duval (2006) as a way of solving the signi�canthistorical events such as the fall of the Soviet Union, which may have a¤ected Finland, the uni-�cation of Germany, and the large banking crisis in Sweden in the early 1990s. However, usingtwenty-three country dummies instead of twenty does not notably change the estimates.

Chapter 4. The E¤ects of Trade on Unemployment 81
rates of the U.K. and the European countries surged to above 8%. Since the early
2000s, the average unemployment rates tend to converge to between 4% and 7%.
The explanatory variables are a country�s total trade (tottrade), total imports
(totimport), imports from low-income economies (importlow) and imports from high-
income economies (importhigh), all as ratios of GDP. Total trade is found to be
negatively correlated with aggregate unemployment in the cross-sectional analysis
of 55 countries by Dutt et al. (2009). However, the simple covariance matrix that is
adjusted for the panel data shows that total trade is positively correlated with the
unemployment rate; see Table 4.2. Small European countries such as the Nether-
lands and Belgium have the largest trade as a ratio of GDP. The U.S. has the lowest,
which does not exceed 20% of its GDP except in the last decade; see Figure 4.2.
Apart from a few exceptions, total trade as a ratio of GDP has been increasing over
time for all countries. Figure 4.6, a simple scatter graph, depicts a positive relation
between the total trade ratio and the unemployment rate.
The development of total imports closely follows total trade due to the balanced
trade in most OECD countries; see Table 4.2 and Figure 4.3. The data of imports
from low- and high-income economies, respectively, come from the COMTRADE
database and cover the years 1962 to 2000. The low-income economies are de�ned
as all countries except the OECD and the OPEC member countries. The high-
income economies are de�ned as the OECD countries. The largest proportion of
total imports is imports from high-income economies; see Figures 4.4 and 4.5. In the
average European countries, only between 6% and 10% of total imports are from the
low-income economies. Imports from low-income economies in the U.S. and Japan
are even smaller such that they hardly exceed 5% of the GDP of these countries.
The U.K. has the highest proportion of imports from low-income economies since
the 1960s, but it falls sharply until the mid 1980s. However, it tends to have been
increasing in most of the twenty OECD countries since the 1990s. Figures 4.7 and 4.8
are the scatter graphs between imports from low-income economies and high-income
economies, respectively, and the aggregate unemployment rate. There is a tendency
to a positive association between these two types of trade and unemployment, though
their magnitudes are fairly small.
Nevertheless, the trade variables are likely to be endogenous. Suppose that high
unemployment makes voters support protective trade policy through increased taxes
on imported goods, which would lead to a decrease in international trade. Then,
the OLS estimates of both a direct e¤ect and an interaction with trade would be
negatively biased. If trade is, in fact, negatively correlated with unemployment as

82 Chapter 4. The E¤ects of Trade on Unemployment
found by Dutt et al. (2009), the absolute size of IV-estimates on these e¤ects would
be smaller. Furthermore, suppose that there are two countries that are identical in
all aspects except that one country has extensive labour market institutions that
protect workers in case of job loss and the other has no labour market institutions
that provide security during unemployed. In this case, the voters in the country
with extensive labour market institutions would have less incentives to support the
protective trade policy as compared to the counterpart with no security during
unemployment. As a result, the country with lax labour market institutions would
experience a larger decrease in trade in case of high unemployment. Estimating
the interaction between trade and labour market institution using the OLS could
therefore be downward-biased as compared to that obtained by the IV.
Hence, this study uses instrumental variables for trade. In the baseline regres-
sions, the export instrument (exportinstr) and the import instrument (importinstr)
which are constructed by the author are used for all four trade-related variables.
The export and import instruments, respectively, are constructed as
(tradeinstr)jt =Xi
��tradeittradei;1962
�� (trade shareij;1962)
�,
where trade = fexport; importg ,
and i, j, and t denote sector, country, and time, respectively. tradeit means global
exports or imports in sector i at time t. Equivalently, tradei;1962 is global exports
or imports in sector i at the base year, 1962.7 (trade shareij;1962) is sector i�s share
of total exports or imports in country j at the base year. The instruments are
based on the idea that no single country is su¢ ciently large to have a substantial
impact on global country trends. Moreover, the changes in transportation costs or
trade liberalization a¤ect each sector di¤erently. Thus, the extent of how a country
is a¤ected by globalisation does not only depend on to what extent each sector is
a¤ected by globalisation, but also on what a country�s trade consists of. These
constructed variables are proper instruments, since the impact of the development
of transportation method or globalisation on each sector can hardly be argued to
be correlated with aggregate unemployment, but it may be strongly associated with
the volume of total trade, total imports, or imports from low- and high-income
economies, respectively.
The R.H.S. variables that measure the structure of labour market institutions
7 The sectoral COMTRADE data start in the year 1962.

Chapter 4. The E¤ects of Trade on Unemployment 83
(LMI ) are the stringency of employment protection (epl), generosity unemployment
bene�ts (brr), unionisation rate (udnet) and coordination/centralisation in wage
bargaining (cow). The stringency of employment protection is the employment pro-
tection legislation index by OECD with the range [0, 2] increasing with strictness.
The generosity of the unemployment insurance system is captured by the unem-
ployment bene�t replacement rates by OECD. This institution is known to a¤ect
the supply of labour by in�uencing the reservation wages of the unemployed. The
unionisation rate of labour markets is given as the net union density rate constructed
by OECD and extended by Visser (2006). The structure of collective wage bargain-
ing is given as the bargaining coordination index with a range [1,3] increasing with
the strength of coordination. To reduce the potential endogeneity problem of these
institutions, each labour market institution of the interaction term is instrumented
by the initial value of the respective labour market institution, LMI60.8
Finally, the macroeconomic control variables are GDP per capita and the working
age population rate. GDP per capita is a measure of the level of economic develop-
ment and controls for the e¤ect of the business cycle. Fagerberg et al. (1997) argue
that regions with a low level of GDP per capita tend to have higher unemployment.
The working age population rate is measured as the size of the population at ages 15-
64 as a share of the total population. Japan has the highest working age population
rate over all periods. Table 4.1 provides the summary statistics of all variables.
4 Results
4.1 Baseline Estimation Results
This section discusses the baseline regression results.9 The e¤ects of trade on unem-
ployment with di¤erent labour market institutions are presented in separate tables;
see Tables 4.3-4.6. In each table, the e¤ects of four trade variables are presented.
In the �rst four columns, trade is measured as total trade and total imports rel-
ative to GDP. In the last four columns, imports from low-income economies and
high-income economies, respectively, are considered. Column (1) is the estimates of
the baseline speci�cation (1) where only the direct e¤ect of trade and the control
8 The endogeneity of labour market institutions is extensively discussed in several studies, i.e.Agell (2002) and Saint-Paul (1996).
9 The baseline equations are estimated by the �xed-e¤ects model, where the country-�xed e¤ectci is allowed to be correlated with other regressors, which commonly occurs in this type of studies.
84 Chapter 4. The E¤ects of Trade on Unemployment
variables are included. Column (2) presents the estimates of the baseline speci�-
cation (2) where the interaction e¤ect is also involved. The results are estimated
by the IV-method where the trade variables are instrumented by the constructed
export/import instrument. The interaction between the trade variables and labour
market institutions is instrumented by the product of the constructed instruments
and the initial values of the respective labour market variable. The OLS estimates
of two baseline speci�cations are presented in columns (1) and (2) in Table 4.8 and
Table A1-Table A3 in the separate appendix as part of the sensitivity analysis.
Table 4.3 presents the baseline IV-estimations that show how trade may a¤ect the
aggregate unemployment rate when the strictness of employment protection legisla-
tion is involved. High values on the F-statistics of the �rst-stage regressions and the
Hansen�s J-statistics with high P-values indicate that the constructed instruments,
exportinstr and importinstr, are proper.10
Imports from high-income economies are signi�cantly positive, when only the
direct e¤ect of trade is considered as in the baseline equation (1). It implies that as
imports from high-income economies as a ratio of GDP increase by one percentage
point, the aggregate unemployment rate will increase by about 0.6 of a percentage
point. As speci�cation (2) is considered, the estimate of the interaction term is
highly signi�cant and positive for all trade variables. It indicates that the size of the
trade e¤ect on unemployment increases when a country�s employment protection
is more strict. However, none of the constituent e¤ects of the trade variables are
signi�cantly di¤erent from 0 in this speci�cation. Trade may not have any signi�cant
impact on aggregate unemployment if the country�s employment protection is on the
average. Trade is likely to raise (reduce) unemployment as the country�s employment
protection is relatively more stringent (lax). The magnitude of the trade e¤ect is
the largest when imports from low-income economies are used, implying that an
increase in imports from low-income economies as a ratio of GDP by one percentage
point will increase the unemployment rate by 3.3 percentage points for the country
for which the centred employment protection index is 1. For example, for Portugal
in the years 1981-85 (centred epl�0.76), an increase in its imports from low-incomecountries as a ratio of GDP by one percentage point raises the unemployment rate
by approximately 2.5 percentage points, while that for the U.S. in the most recent
years (centred epl� �0.57) can reduce the unemployment rate by approximately1.9 percentage points. The magnitude of the IV-estimates is larger than that of the
10 One exception where the �rst-stage F-statistic does not exceed the critical value 10 is whenimports from low-income economies are used in column (1).
Chapter 4. The E¤ects of Trade on Unemployment 85
OLS-estimates, which will be further discussed in the next section.
Table 4.4 shows the baseline IV-estimation results when the generosity of the
unemployment bene�t is involved. The estimate on imports from high-income
economies is signi�cantly positive in column (1) as only the direct e¤ect of trade is
introduced. This implies that, on average, an increase in imports from high-income
economies as a ratio of GDP by one unit raises the unemployment rate by 0.4 per-
centage points. As speci�cation (2) is considered, the interaction terms between the
trade variables and the unemployment bene�t continue to be signi�cantly positive
except when imports from low-income economies are included. The estimate on
the interaction term in the last column 0.018 implies that an increase in imports
from OECD countries by one percentage point can reduce the unemployment rate
by approximately 0.43 percentage points for a country like Portugal, where the un-
employment bene�t index is the lowest. For Denmark, whose unemployment bene�t
is the highest, in the second half of the 1990s an increase in imports from OECD
countries by one percentage point can raise the unemployment rate by about 0.67
percentage points.
When the strength of trade unions is used as a measure of labour market rigidity,
the pattern continues for fewer trade variables; see Table 4.5. As speci�cation (1)
is tested, the direct e¤ect of imports from high-income economies is still positive.
When the interaction term is included, the direct e¤ect of imports from low-income
economies is signi�cantly positive. Increasing imports from low-income economies
in a country with relatively strong trade unions can raise the unemployment rate.
When the degree of centralisation in the wage bargaining process is considered in
Table 4.6, the signs of the estimates are consistent with the previous estimates, but
the level of signi�cance increases. In the speci�cation that includes the interaction
term, the estimates of total trade as well as imports from high-income economies
are positive at the 10% signi�cance level.
Throughout the baseline regressions, GDP per capita is negatively associated
with unemployment. This shows the business cycle e¤ect, which implies that more
a uent countries or periods tend to have lower unemployment. Meanwhile, the
share of the working age population does not explain much of the variation in the
aggregate unemployment rate.
The results from the baseline models estimation can be summarised as follows.
First, when only the direct e¤ect of trade is speci�ed, imports from high-income
economies are likely to increase aggregate unemployment, while imports from low-
income economies show the opposite direction in a few regressions. This �nding

86 Chapter 4. The E¤ects of Trade on Unemployment
is in line with that of Dutt et al. (2009). However, the signi�cant interaction
terms indicate that the model with only the direct e¤ect of trade may have been
misspeci�ed.
Second, when both the constituent e¤ect and the interaction e¤ect of trade are
modelled in speci�cation (2), there is clear evidence that an increase in trade is likely
to lead to higher (lower) aggregate unemployment as it interacts with relatively rigid
(�exible) labour market institutions. This �nding roughly con�rms Davis�(1998)
theory that unemployment in the rigid north country is likely to increase as it trades
with the southern or the northern counterpart. The pattern is most signi�cant when
employment protection is involved followed by the generosity of the unemployment
bene�t. The constituent e¤ects of trade are mostly insigni�cant, which implies that
for a country with the average labour market institution, trade has no e¤ect on the
unemployment rate. Table 4.7 summarises how trade may a¤ect the unemployment
rate depending on a country�s labour market institutions.
In addition, the size of the e¤ect of imports from low-income economies in in-
creasing unemployment rates when interacted with each labour market institution
is larger than that of imports from high-income economies. This is due to the fact
that labour market institutions tend to raise the wage costs at the lower end of the
wage distribution and therefore a¤ect the labour demand of low-skilled workers who
are readily replaced by imports from low-income economies.
Finally, the signi�cant interaction terms indicate that the baseline equation (2)
is more properly speci�ed than equation (1). The estimates obtained by the baseline
speci�cation (1) can thus be biased. Hence, the empirical evidence in Dutt et al.
(2009), where only the direct e¤ect of trade or trade policy is considered, might
su¤er from the bias of the omitted interaction variable.11 In contrast with Boulhol
(2008), the current study includes the constituent e¤ect of trade, even though it
turns out to be insigni�cant in most of the equations.12
11 However, including the interaction between trade and the structure of labour market institu-tions for a larger set of countries might be di¢ cult since the panel data of labour market institutionsfor non-OECD countries are hard to obtain.12 Although most of the estimates on the trade variables are insigni�cant, these terms shouldbe included, since the insigni�cance, in fact, only means that the e¤ect of trade on aggregateunemployment is likely to be zero when the labour market institution is on its sample average.Besides, it is a better strategy than excluding a potentially important variable.

Chapter 4. The E¤ects of Trade on Unemployment 87
4.2 Simulation of the Baseline Results
This section presents simulations illustrating how the aggregate unemployment rate
changes as the volume of imports from low-income economies varies in di¤erent
countries. It is particularly interesting to look at this, since there has been a dra-
matic increase in imports from low-income economies, especially from China, in the
two recent decades. According to the CRS report, China is the second largest source
of U.S. imports of merchandise ($243 billion in 2005) after Canada ($287 billion).
Moreover, China runs a trade surplus with the world�s three major economics cen-
tres, the U.S., the EU-15 and Japan (Lum and Nanto, 2007). To identify how the
trade e¤ect on unemployment is a¤ected by the structure of labour market institu-
tions, the unemployment rate of three countries with a fairly di¤erent stringency of
employment protection (EPL) for the years 1991-1995 is simulated; the U.S with
the lowest epl-index, Sweden with the sixth highest epl-index and the unweighted
average of Portugal, Italy, and Spain (IPS), whose epl-indices are the highest among
the twenty countries. Except for a variation in the size of imports from low-income
economies as a ratio of GDP around the actual value, all other variables are the
same as what is found in the original data.
Figure 4.9 presents the simulated unemployment rates with a 95% prediction
interval for the U.S. The actual size of imports from low-income economies is 3.15%
of its GDP in the years 1991-1995 and the unemployment rate is about 6.6%. As the
U.S. imports from low-income economies increase from the actual level to 3.5% of
the U.S. GDP, the unemployment rate decreases from 6.59% to 5.46%. Figure 4.10
shows the simulated unemployment rates of Sweden where employment protection is
relatively stringent in the same period. When its imports from low-income economies
increase from the actual level of 2.46% to 4%, the unemployment rate is predicted
to decrease from 7.52% to 7.36%. Finally, Figure 4.11 shows the simulated unem-
ployment rates of the hypothetical country (IPS), which is the unweighted average
of Italy, Portugal, and Spain, where the epl-indices are the highest. The slope of the
graph is positive indicating that an increase in imports from low-income economies
leads to a higher unemployment rate. In particular, as its imports from low-income
economies increase from the actual value of 2.74% to 3.25%, the unemployment rate
is predicted to increase from 12.5% to 13.06%.
This simulation exercise points out the baseline �ndings from the empirical analy-
sis in the previous section. Countries with high stringency in employment protection
can experience a surge of unemployment rates as there is an increase in imports from

88 Chapter 4. The E¤ects of Trade on Unemployment
low-income economies such as China. In contrast, a country with low employment
protection such as the U.S. may instead experience a decrease in the unemployment
rates. In countries with moderate employment protection, the magnitude of the
e¤ect of imports from low-income countries might be fairly small.
5 Sensitivity Analysis
This section presents the sensitivity analysis. To check the robustness of the baseline
estimation results, di¤erent speci�cations of the unemployment equations (1) and
(2) and choice of the data are tested. Table 4.8 presents the sensitivity analysis
when the stringency of employment protection is involved. Tables A1-A3, which
are available in the separate appendix, contain the sensitivity analysis results when
the measures of generosity of unemployment bene�t, strength of trade unions, and
centralisation in wage bargaining are included. In part A of each table, trade is
measured as the sum of imports and exports, in part B, the size of total imports is
included, in part C and part D, respectively, the size of imports from low-income
and high-income economies, respectively, is included.
Columns (1) and (2) in part A in Table 4.8 are the OLS estimates of baseline
equations (1) and (2). The interaction between total trade and employment protec-
tion is still highly signi�cant and positive. The size of the trade e¤ect by OLS is
about half of that by the IV-estimation. This implies that the OLS estimates of the
e¤ect of trade on unemployment are likely to be negatively biased which, in turn,
reveals that unemployment and trade are, in fact, negatively correlated. In columns
(3) and (4), an additional set of instruments, international transport cost, is intro-
duced besides the constructed export/import instrument for the trade variable.13
Since these additional instruments are only available over the period 1973-2005, the
observations of the 1960s are dropped. The �rst-stage F-statistics as well as the
Hansen J-statistics imply that these two sets of the instruments are proper. The
interaction term is still positive in the high con�dence level. In contrast with the
baseline estimates, the coe¢ cient estimates on employment protection became sig-
ni�cantly negative, which indicates that the stringent employment protection leads
to a lower aggregate unemployment rate. However, this change is due to the fact
that the observations in the 1960s are excluded rather than to an inclusion of the
13 The international transport costs are the country- and time-speci�c international transportcosts of three methods of transportation, road (tr1), maritime (tr2) and air (tr3), which are esti-mated by Golub and Tomasik (2008).

Chapter 4. The E¤ects of Trade on Unemployment 89
additional set of instruments.
When the highly signi�cant control variable, GDP per capita, is excluded from
the baseline IV-regression with the interaction term in column (5), the interaction
between total trade and employment protection is still highly positive. Employment
protection is once more negatively correlated with aggregate unemployment. This
indicates that the baseline results do not depend on the e¤ect of the business cycle
on unemployment rates. Moreover, the signi�cance of the interaction term is robust
to dropping the observations of Portugal and Spain, which have some missing values
in the 1960s and the 1970s due to the political turbulence. This implies that the
positive interaction e¤ect does not seriously depend on a few outliers or missing
observations; see column (6) in Table 4.8.
Part B in Table 4.8 presents the sensitivity analysis results when the size of total
imports and the stringency of employment protection are used. The baseline IV-
estimation showed that the interaction with employment protection is signi�cantly
positive in the highest level of con�dence. The OLS estimation of the baseline
models suggests the same direction but the magnitude is now smaller; see column
(2), Part B, Table 4.8. The negative biasedness of the OLS estimates suggests
that unemployment rates and total imports are likely to be negatively correlated.
When the additional set of the instruments is introduced, the interaction e¤ect is
still signi�cantly positive. In addition, the estimates on employment protection also
become signi�cant, which implies that strict employment protection is associated
with a lower level of unemployment; see columns (3) and (4), Part B, Table 4.8.
The interaction term is robust to dropping the highly signi�cant control variable,
GDP per capita, in column (5) and dropping the observations of Portugal and Spain
in column (6).
Parts C and D in Table 4.8 present the equivalent sensitivity analysis results
when the size of imports from low- and high-income economies, respectively, is used
as the trade variable. The e¤ect of the interaction between imports from low-income
economies and employment protection is robust throughout the tests. The interac-
tion between imports from high-income economies and employment protection is
robust to the omission of the control variable, GDP per capita, and the elimination
of the observations of Portugal and Spain; see columns (5) and (6), Part D, Table
4.8.
The sensitivity analysis suggests the following. First, the interaction between
the trade variable and employment protection is highly robust. The positive inter-
action e¤ect implies that an increase in trade in the country with relatively strict

90 Chapter 4. The E¤ects of Trade on Unemployment
employment protection leads to an increase in unemployment. Second, the positive
direct e¤ect of imports from high-income economies is fragile. However, most of
the estimates indicate that trade is associated with lower unemployment with the
exception of when imports from high-income economies are involved. In addition,
the OLS estimates are downward biased as compared to the baseline IV-estimates.
This is evidence that the unemployment rate and the trade variables are, in fact,
likely to be negatively associated. Finally, these implications are the strongest when
the stringency of employment protection is involved as compared to other measures
of labour market institutions. In summary, there is substantially robust evidence
that trade is likely to raise (reduce) unemployment as it interacts with relatively
extensive (lax) labour market institutions.
6 Conclusion
This study begins with the popular belief that globalisation and increasing interna-
tional trade with the developing economies in particular may have a negative impact
on the labour market in developed countries. Although this question has been ex-
plored in several studies using the data of di¤erent categories of labour, industry,
or sector, few studies have been made to analyse the impact of trade on aggre-
gate unemployment. The purpose of this study is to provide empirical evidence of
whether international trade has any signi�cant impact on aggregate unemployment
in the presence of labour market institutions. Using data for twenty OECD coun-
tries and the years 1961-2008, this paper investigates two hypotheses; that trade
has a direct e¤ect on the aggregate unemployment rate and that trade in interac-
tion with labour market institutions has an e¤ect on aggregate unemployment. The
size of total trade, total imports and imports from low- and high-income economies,
respectively, as ratios of GDP are alternately used as the explanatory variables.
Since these trade variables are likely to be endogenous, this study employed a set of
constructed export and import instruments, respectively.
In contrast with the popular belief about job robbing, this study found that only
imports from high-income economies are likely to increase aggregate unemployment,
when the direct e¤ect of trade is considered. However, there is no clear evidence that
other trade variables such as total trade, total imports, or imports from low-income
economies have any signi�cant e¤ect on unemployment. When the interaction be-
tween the trade variables and di¤erent labour market institutions, which is likely
to be more correct, is speci�ed, there is substantially robust evidence that the role

Chapter 4. The E¤ects of Trade on Unemployment 91
of the country�s labour market institution is important for identifying the e¤ect
of trade on unemployment. In particular, an increase in trade leads to high (low)
aggregate unemployment as it interacts with relatively rigid (�exible) employment
protection, generous unemployment bene�ts, strong unions, as well as centralised
wage bargaining.
Given the limitation of the labour market institution indices and the macroeco-
nomic data, the �ndings in this study are a mere description of the pattern for how
the size of international trade can be related to aggregate unemployment in the
presence of di¤erent labour market institutions. Moreover, another issue of endo-
geneity in labour market institutions remains. In particular, Agell (2002) and Kim
(2006) argued that a country�s exposure to an international shock is closely related
to how extensive the country�s labour market institutions become. The current
study attempted to alleviate the potential endogeneity of labour market institutions
by using the initial value of the institutions. However, identifying how international
trade, labour market institutions, and unemployment are intercorrelated remains a
challenging topic for future study.

92 Chapter 4. The E¤ects of Trade on Unemployment

Bibliography
[1] Agell, J. (2002), "On the Determinants of labour Market Institutions: Rent
Seeking vs. Social Insurance," German Economic Review, 3 (2), 107-135.
[2] Blanchard, O. and J. Wolfers (2000), "The Role of Shocks and Institutions in
the Rise of European Unemployment: the Aggregate Evidence," The Economic
Journal, 110 (462), 1�33.
[3] Boulhol, H. (2008), "Unemployment and Interactions between Trade and labour
Market Institutions," CES Working Papers, Centre d�Economie de la Sorbonne.
[4] Davis, D. R. (1998), "Does European Unemployment Prop up American Wages?
National labour Markets and Global Trade," American Economic Review, 88 (3),
478-494.
[5] Dewatripont, M., A. Sapir, and K. Sekkat (1999), �Labour Market E¤ects of
Trade with LDCs in Europe�in Dewatripont, M.; Sapir, A. and Sekkat, K. eds.
Trade and Jobs in Europe: Much Ado About Nothing?, Oxford: Oxford University
Press.
[6] Dutt, P., D. Mitra, and P. Ranjan (2009), �International Trade and Unemploy-
ment: Theory and Cross-National Evidence,�Journal of International Economics,
78 (1), 32�44.
[7] EEAG Report on the European Economy (2008), "The E¤ect of Globalisation
on Western European Jobs: curse or blessing?," Chapter 3, European Economic
Advisory Group (EEAG): CESifo.
[8] Fagerberg, J., B. Verspagen, and M. Caniëls (1997), "Technology, Growth, and
Unemployment across European Regions", Regional Studies, 31 (5), 457-466.
93

94 Chapter 4. The E¤ects of Trade on Unemployment
[9] Felbermayr, G., J. Prat, and H. Schmerer (2011), "Globalisation and Labour
Market Outcomes: Wage Bargaining, Search Frictions, and Firm Heterogeneity,"
Journal of Economic Theory, 146 (1), 39-73.
[10] Helpman E. and O. Itskhoki (2010), "Labour Market Rigidities, Trade and
Unemployment," Review of Economic Studies, 77 (3), 1100-1137.
[11] Janiak, A. (2006), "Does Trade liberalisation Lead to Unemployment? Theory
and Some Evidence", ECARES, Université Libre de Bruxelles.
[12] Krugman P. (1995), "GrowingWorld Trade: Causes and Consequences," Brook-
ings Papers on Economic Activity (1), 25th Anniversary Issue, 327-377.
[13] Lum, T. and D. K. Nanto (2007), "China�s Trade with the United States and the
World," CRS Report for Congress, Order Code RL31403, Congressional Research
Service.
[14] Matusz, S. J. (1996), "International Trade, the Dividion of Labour, and Unem-
ployment," International Economic Review, 37 (1), 71-83.
[15] Moore, M. P. and P. Ranjan (2005), "Globalisation vs Skill-Biased Technolog-
ical Change: Implications for Unemployment and Wage Inequality," Economic
Journal, 115 (503), 391-422.
[16] OECD (1997), "Trade, Earnings and Employment: Assessing the Impact of
Trade with Emerging Economies on OECD Labour Markets," ch. 4, Employment
Outlook.
[17] Papageorgiou, D., M. Michaely, and A. Choksi (1991), Liberalizing foreign trade,
Basil Blackwell Publishers for the World Bank; cambridge, MA. 7 volumes.
[18] Saint-Paul, G., C. R. Bean, and G. Bertola (1996), "Exploring the Political
Economy of Labour Market Institutions," Economic Policy, 11 (23), 265-315.
[19] Sener, F. (2001), "Schumpeterian Unemployment, Trade and Wages," Journal
of International Economics, 54 (1), 119-148.
[20] Visser, J. (2006), �Union Membership Statistics in 24 Countries,�Monthly
Labour Review, 129. 38-49.
[21] Wacziarg R. and J. S. Wallack (2004), "Trade Liberalisation and Intersectoral
Labour Movements," Journal of International Economics, 64 (2), 411-439.

Chapter 4. The E¤ects of Trade on Unemployment 95
Figure 4.1: The development of the aggregate unemployment rate in the selectedcountries
24
68
10A
ggre
gate
une
mpl
oym
ent r
ate
(%)
1960 1965 1970 1975 1980 1985 1990 1995 2000 2005Year
Avg of 14 European countries USUK Japan
Figure 4.2: The development of total trade as a ratio of GDP in the selected coun-tries.
020
4060
8010
0To
tal t
rade
as
a ra
tio o
f GD
P (%
)
1960 1965 1970 1975 1980 1985 1990 1995 2000 2005Year
Avg of 14 European countries USUK Japan

96 Chapter 4. The E¤ects of Trade on Unemployment
Figure 4.3: The development of total imports as a ratio of GDP in the selectedcountries
010
2030
40To
tal i
mpo
rts a
s a
ratio
of G
DP
(%)
1960 1965 1970 1975 1980 1985 1990 1995 2000 2005Year
Avg of 14 European countries USUK Japan
Figure 4.4: The development of imports from low-income economies as a ratio ofGDP, Note: The low-income economies are de�ned as all countries except the OPECand the OECD member countries.
02
46
8Im
ports
from
low
inco
me
econ
omie
s, a
ratio
of G
DP
(%)
1965 1970 1975 1980 1985 1990 1995 2000Year
Avg of 14 European countries USUK Japan
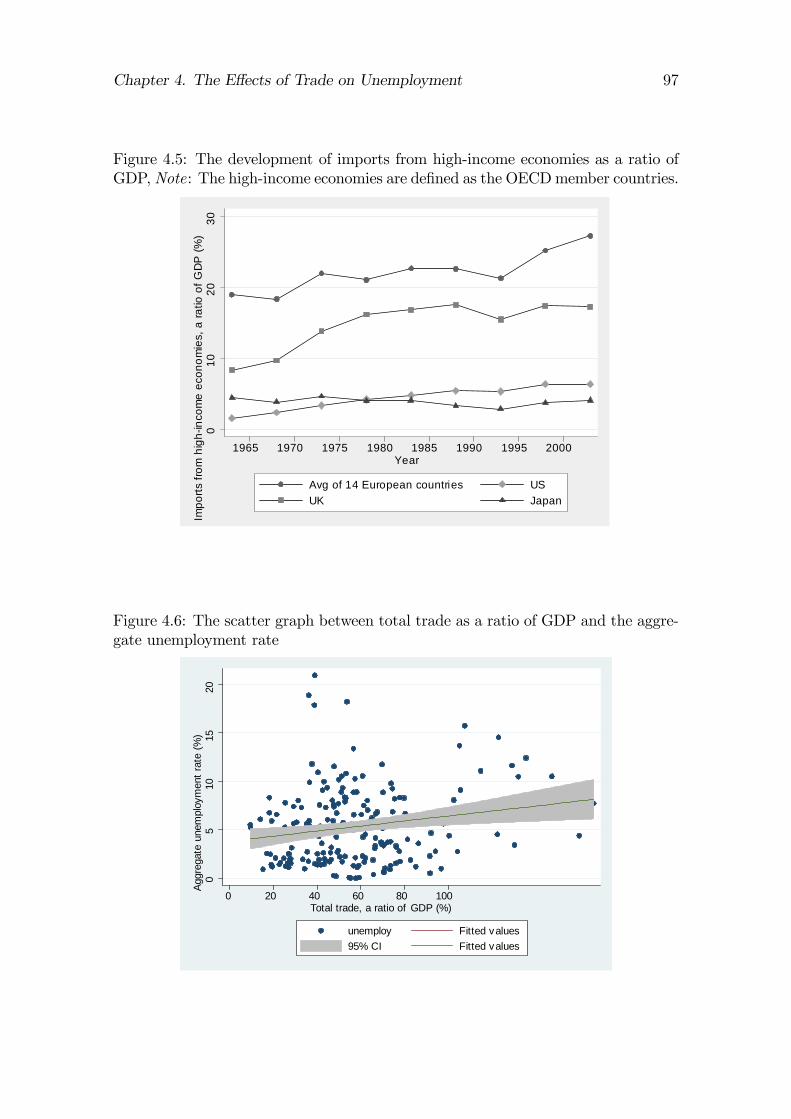
Chapter 4. The E¤ects of Trade on Unemployment 97
Figure 4.5: The development of imports from high-income economies as a ratio ofGDP, Note: The high-income economies are de�ned as the OECDmember countries.
010
2030
Impo
rts fr
om h
igh
inco
me
econ
omie
s, a
ratio
of G
DP
(%)
1965 1970 1975 1980 1985 1990 1995 2000Year
Avg of 14 European countries USUK Japan
Figure 4.6: The scatter graph between total trade as a ratio of GDP and the aggre-gate unemployment rate
05
1015
20Ag
greg
ate
unem
ploy
men
t rat
e (%
)
0 20 40 60 80 100Total trade, a ratio of GDP (%)
unemploy Fitted values95% CI Fitted values

98 Chapter 4. The E¤ects of Trade on Unemployment
Figure 4.7: The scatter graph between imports from low-income economies as aratio of GDP and the aggregate unemployment rate
05
1015
20A
ggre
gate
une
mpl
oym
ent r
ate
(%)
0 20 40 60 80 100Total trade, a ratio of GDP (%)
unemploy Fitted values95% CI Fitted values
Figure 4.8: The scatter graph between imports from high-income economies as aratio of GDP and the aggregate unemployment rate
05
1015
20A
ggre
gate
une
mpl
oym
ent r
ate
(%)
0 10 20 30 40 50 60 70 80Imports from highincome economies, a ratio of GDP (%)
Unemployment rate Fitted values95% CI Fitted values

Chapter 4. The E¤ects of Trade on Unemployment 99
Figure 4.9: Simulation of an unemployment rate for the U.S. for the years 1991-1995as imports from low-income economies vary as a ratio of GDP. The stringency ofemployment protection is controlled for.
05
1015
Sim
ulat
ed u
nem
ploy
men
t rat
e in
the
US
( % )
2 2.5 3 3.154 3.5 4Imports from low income economies as a ratio of GDP ( % )
Simulated unemployment rate of the US Lower bound of the predictionUpper bound of the prediction
Figure 4.10: Simulation of an unemployment rate for Sweden for the years 1991-1995as imports from low-income economies vary as a ratio of GDP. The stringency ofemployment protection is controlled for.
02.
55
79
Sim
ulat
ed u
nem
ploy
men
t rat
e of
Sw
eden
(%)
2 2.46 3 3.5 4Imports from low income economies as a ratio of GDP(%)
Simulated unemployment rate of Sweden Lower bound of the predictionUpper bound of the prediction

100 Chapter 4. The E¤ects of Trade on Unemployment
Figure 4.11: Simulation of an unemployment rate for the average of Italy, Portugal,and Spain (IPS) for the years 1991-1995 as imports from low-income economies varyas a ratio of GDP. The stringency of employment protection is controlled for.
05
1011
1315
Sim
ulat
ed u
nem
ploy
men
t rat
e of
IPS(
%)
2 2.5 2.74 3 3.5 4Imports from low income economies as a ratio of GDP(%)
Simulated unemployment rate of IPS Lower bound of the predictionUpper bound of the prediction
Table 4.1: The Summary Statistics
R.H.S. variable # Obs Mean Std. dev. Min MaxUnemployment 200 5.244 3.915 0.007 20.955
L.H.S. variablesTotal trade� 196 58.048 29.789 9.439 166.460
Total imports� 195 28.998 14.277 4.295 81.294Imports from low-income countries� 179 3.916 1.813 0.961 11.845Imports from high-income countries� 179 18.818 11.514 1.577 75.444
Employment protection 197 0.636 0.380 0 1.394Unemployment bene�ts 200 24.052 13.763 0 61.02
Net union density 182 41.127 18.364 8.44 85.78Centralisation in wage bargaining 180 2.150 0.607 1 3
GDP per capita 197 13.154 12.361 0.357 62.534Total population 200 36314.75 53739.43 2258.833 293273
Share of population between 15-64 200 65.089 2.684 57.613 69.946� as a ratio of GDP.
Table 4.2: The Covariance Matrix for panel data
Correlation UNEMPLOY tottrade totimport importhigh importlowUNEMPLOY 1 0.445��� 0.442��� 0.300�� 0.052
tottrade 1 0.978��� 0.578�� 0.427��totimport 1 0.668��� 0.441���importhigh 1 0.403���importlow 1
This table is the correlation coe¢ cient of the �xed-e¤ects model of the panel data. Standard errors
are corrected for clustering at the country level . *** and ** denote that the correlation coe¢ cient
is signi�cant at the 1% and 5% level, respectively.

Chapter 4. The E¤ects of Trade on Unemployment 101
Table
4.3:TheIVestim
ationforthe
e¤ectoftrade
onunem
ployment
with
employm
entprotection
with
epl(1)
(2)(1)
(2)(1)
(2)(1)
(2)R.H.S.
trade=tottrade
trade=totim
port
trade=importlow
trade=importhigh
epl-2.835
-10.042-4.299
-10.642-1.740
-12.762-7.315
-9.202(-0.77)
(-3.06)***(-1.01)
(-3.09)**(-0.47)
(-4.12)***(-2.16)**
(-2.55)**trade
-0.013-0.092
0.158-0.211
-4.515-1.382
0.576-0.160
(-0.08)(-0.94)
(0.40)(-1.46)
(-1.10)(-1.33)
(1.97)**(-1.37)
(trade)*epl0.170
0.3623.336
0.408(4.10)***
(4.37)***(4.82)***
(3.17)***gdp
c-0.369
-0.368-0.300
-0.373-.4702
-0.297-0.036
-0.378(-2.29)**
(-2.69)***(-1.57)
(-2.69)***(-1.79)*
(-2.08)**(-0.18)
(-2.60)***populshare1564
-0.1630.070
-0.2870.033
0.4100.274
-0.279-0.181
(-0.52)(0.35)
(-0.93)(0.20)
(0.73)(1.16)
(-1.13)(-1.06)
IVyes
yesyes
yesyes
yesyes
yes1-stg
F-stat
53.37529.70/6305.80
51.821301.62/4889.28
8.2515.08/645.04
46.64329.35/3581.00
Hansen
J-stat2.133
2.0382.927 x
2.4870.556
0.0230.924
1.965#obs.
156156
156156
157157
157157
Note:
Thedep
endentvariable
isthe
unemploym
entrate.
TheIV-regressions
usethe
constructedinstrum
ents,exp
ortinstrand
importinstr.
Thenum
bers
inparentheses
aret-values.
Standarderrors
areclustered
bycountry.
***,**,
and*denote
asigni�cance
of1%,5%,and
10%,resp
ectively.1-stg
F-stat
andHansen
J-statare
theF-statistic
ofthe
�rst-stageregression
andthe
Hansen
overidenti�cationtest
ofallinstrum
ents,resp
ectively.epl
iscentred.
tradeand
(trade)*eplindicates
thecoe¢
cientestim
ateofthe
respective
tradevariable
andthe
interactionterm
between
epland
theresp
ectivetrade
variable.Thetrade
variablesand
theirinteraction
with
eplare
instrumented
bythe
constructedinstrum
ents,exp
ortinstr,importinstr,
epl60exportinstr,
andepl60im
portinstr,
which
arethe
productofthe
valueofthe
initialepl,
epl60.The�rst
andthe
secondvalue
of1stg
F-stat
incolum
n(2)
arethe
F-statistics
ofthe
�rst-stageregressions
forthe
tradevariables
andthe
interactionterm
s,resp
ectively.§denotes
thatHansen�s
J-statisticissigni�cant
at
the10%
level.

102 Chapter 4. The E¤ects of Trade on Unemployment
Table
4.4:TheIVestim
ationforthe
e¤ectoftrade
onunem
ployment
with
unumploym
entbene�t
with
brr(1)
(2)(1)
(2)(1)
(2)(1)
(2)R.H.S.
trade=tottrade
trade=totim
port
trade=importlow
trade=importhigh
brr0.018
-0.7150.025
-0.690-0.073
-0.6730.028
-0.337(0.43)
(-2.05)**(0.55)
(-1.66)*(-0.63)
(-1.19)(0.55)
(-1.76)*trade
0.045-0.414
0.225-0.787
-2.980-2.483
0.404-0.423
(0.33)(-1.37)
(0.91)(-1.24)
(-1.04)(-1.23)
(2.23)**(-1.25)
(trade)*brr
0.0120.023
0.1610.018
(2.24)**(1.83)*
(1.13)(2.08)**
gdpc
-0.274-0.796
-0.215-0.751
-0.376-0.303
-0.068-0.615
(-1.66)*(-2.06)**
(-1.21)(-1.94)*
(-1.73)*(-1.03)
(-0.38)(-2.43)**
populshare1564
-0.1420.046
-0.190-0.766
0.3500.098
-0.80-0.178
(-0.61)(0.13)
(-0.85)(-0.26)
(0.81)(0.20)
(-0.37)(-0.93)
IVyes
yesyes
yesyes
yesyes
yes1-stg
F-stat
22.99803.23/3373.13
16.80829.15/2798.80
6.205.51/8638.77
21.70590.29/8049.14
Hansen
J-stat2.629
0.6492.561
0.0591.181
0.5041.201
1.431#obs.
158158
158158
159159
159159
Note:
Seenote
inTable
4.3.brr
iscentred.
Theinteraction
between
tradeand
brrisinstrum
entedbythe
constructedinstrum
ents,exportinstr,im
portinstr,
brr60exportinstr,
andbrr60im
portinstr,
which
arethe
productofthe
valueofthe
initialbrr,
brr60.

Chapter 4. The E¤ects of Trade on Unemployment 103
Table
4.5:TheIVestim
ationforthe
e¤ectoftrade
onunem
ployment
with
netunion
density
with
udnet(1)
(2)(1)
(2)(1)
(2)(1)
(2)R.H.S.
trade=tottrade
trade=totim
port
trade=importlow
trade=importhigh
udnet0.017
-0.595-0.002
-0.3790.138
-0.293-0.006
-0.023(0.32)
(-1.35)(-0.04)
(-0.93)(1.06)
(-2.17)**(-0.11)
(-0.10)trade
0.060-0.380
0.266-0.250
-0.745-1.515
0.4120.179
(0.45)(-1.05)
(1.15)(-0.60)
(-0.99)(-1.60)
(2.38)**(0.95)
(trade)*udnet
0.0130.015
0.0860.010
(1.45)(0.97)
(2.65)***(0.18)
gdpc
-0.199-0.591
-0.128-0.372
-0.471-0.319
-0.006-0.146
(-1.27)(-1.31)
(-0.82)(-1.55)
(-1.78)*(-2.92)***
(-0.04)(-1.20)
populshare1564
-0.1211.248
-0.1940.546
0.7410.221
-0.023-0.027
(-0.45)(1.00)
(-0.77)(0.77)
(0.99)(0.86)
(-0.12)(-0.17)
IVyes
yesyes
yesyes
yesyes
yes1-stg
F-stat
13.58257.45/165.09
14.91387.46/303.64
7.53 x24.81/1031.44
11.56345.79/1031.44
Hansen
J-stat2.571
0.2862.344
1.0620.803
2.3540.975
3.121#obs.
148148
148148
148148
148148
Note:
Seenote
inTable
4.3.udnet
iscentred.
Theinteraction
between
tradeand
udnetisinstrum
entedbythe
constructedinstrum
ents,exp
ortinstr,
importinstr,
udnet60exportinstr,
andudnet60im
portinstr,
which
arethe
productofthe
valueofthe
initialudnet,
udnet60.§denotes
thatHansen�s
J-statisticissigni�cant
atthe
10%level.

104 Chapter 4. The E¤ects of Trade on Unemployment
Table
4.6:TheIVestim
ationforthe
e¤ectoftrade
onunem
ployment
with
centralisationinwage
bargaining
with
cow(1)
(2)(1)
(2)(1)
(2)(1)
(2)R.H.S.
trade=tottrade
trade=totim
port
trade=importlow
trade=importhigh
cow-0.850
-6.700-1.381
-5.4021.749
-1.385-2.808
-5.477(-0.66)
(-1.70)*(-0.90)
(-1.74)*(0.85)
(-0.59)(-1.68)*
(-2.06)**trade
-0.037-0.230
0.092-0.249
-3.125-1.503
0.528-0.088
(-0.24)(-1.51)
(0.24)(-0.91)
(-1.67)*(-1.80)*
(1.95)*(-0.48)
(trade)*cow
0.1030.149
0.3930.218
(1.65)*(1.60)
(0.81)(1.81)*
gdpc
-0.323-0.376
-0.255-0.350
-0.378-0.331
0.034-0.270
(-1.93)*(-2.18)**
(-1.22)(-1.98)**
(-1.78)*(-2.05)**
(0.17)(-1.71)*
populshare1564
0.0340.157
-0.0110.063
0.1970.134
0.157-0.024
(0.17)(0.66)
(-0.06)(0.31)
(0.65)(0.76)
(0.64)(-0.01)
IVyes
yesyes
yesyes
yesyes
yes1-stg
F-stat
34.72289.08/2544.92
14.13186.44/3483.94
3.9931.28/153.32
9.9878.44/2119.56
Hansen
J-stat2.061
1.7242.961 x
2.5060.538
2.2881.533
1.698#obs.
158158
158158
159159
159159
Note:
Seenote
inTable
4.3.cow
iscentred.
Theinteraction
between
tradeand
cowisinstrum
entedbythe
constructedinstrum
ents,exportinstr,im
portinstr,
cow60exp
ortinstr,and
cow60im
portinstr,
which
arethe
productofthe
valueofthe
initialcow
,cow
60.§denotes
thatHansen�s
J-statisticissigni�cant
at
the10%
level.

Chapter 4. The E¤ects of Trade on Unemployment 105
Table 4.7: The summary of the sign of the coe¢ cient estimates
� � if�LMI it�LMI
� @(unemploy)@(trade)
mostly 0 (+) (+); rigid (+)0; average 0(�); �exible (�)
Note: This table summarises the signs of the coe¢ cient estimates of the baseline speci�cation
(2). �it and �it indicate the constituent e¤ect and the interaction e¤ect of trade, respectively.@(unemploy)@(trade)
is the total e¤ect of trade on the aggregate unemployment rate.

106 Chapter 4. The E¤ects of Trade on Unemployment
Table
4.8:Sensitivity
Analysis
ofthe
Unem
ployment
Regression
with
Employm
entProtection
andTrade
Variables
(1)(2)
(3)(4)
(5)(6)
R.H.S.
A.trade=
tottradeepl
-1.908-6.696
-6.126-19.303
-9.350-8.035
(-0.83)(-1.72)*
(-2.22)**(-3.53)***
(-2.74)***(-2.69)***
trade0.008
0.007-0.023
-0.0030.050
-0.072(0.40)
(0.55)(-0.53)
(-0.06)(0.75)
(-0.82)trade*epl
0.0980.243
0.1160.162
(2.32)**(3.01)***
(3.52)***(4.04)***
gdpc
-0.235-0.197
-0.265-0.187
-0.337(-2.51)**
(-2.51)**(-2.49)**
(-1.87)*(-3.43)***
populshare1564
-0.167-0.088
0.005-0.025
-0.0210.212
(-1.23)(-0.65)
(0.02)(-0.09)
(-0.10)(1.08)
IVno
noyes
yesyes
yes(within)-R
20.653
0.6771-stg
F-stat.
-17.30
127.55/506.33221.6/3582.43
439.12/5047.52Hansen
J-stat.-
3.6295.747
2.3432.017
#obs.
192192
120120
156142
Note
OLS
OLS
additionalIV
additionalIV
nogdp
cnoPrt,Esp
R.H.S.
B.trade=
totimport
epl-1.781
-7.139-6.170
-19.943-9.126
-8.374(-0.78)
(-1.77)*(-2.24)**
(-3.38)***(-2.62)***
(-2.78)***trade
var.-0.002
-0.023-0.026
0.0000.083
-0.155(-0.05)
(-0.71)(-0.22)
(0.00)(0.76)
(-1.22)trade*epl
0.2190.490
0.2210.335
(2.48)**(2.92)***
(2.91)***(4.42)***
gdpc
-0.239-0.201
-0.261-0.183
-0.330(-2.64)**
(-2.62)**(-2.20)**
(-1.75)*(-3.62)***
populshare1564
-0.154-0.079
-0.032-0.121
-0.0180.160
(-1.16)(-0.59)
(-0.10)(-0.43)
(-0.11)(1.08)
IVno
noyes
yesyes
yes(within)-R
20.653
0.6801-stg
F-stat.
12.55172.39/865.76
619.10/3161.281221.87/3288.16
Hansen
J-stat.3.658
5.4882.307
2.397#obs.
192192
120120
156142

Chapter 4. The E¤ects of Trade on Unemployment 107Table
4.8continued
(1)(2)
(3)(4)
(5)(6)
R.H.S.
C.trade=
importlow
epl-2.176
-7.181-6.246
-19.588-14.733
-11.155(-1.08)
(-2.91)***(-2.18)**
(-3.52)***(-4.03)***
(-4.47)***trade
-0.295-0.280
0.147-0.013
0.110-0.916
(-1.97)*(-1.59)
(0.17)(-0.02)
(0.15)(-1.13)
trade*epl1.634
4.9533.903
3.486(3.37)***
(2.98)***(4.39)***
(5.36)***gdp
c-0.234
-0.210-0.247
-0.242-0.224
(-2.73)**(-2.74)**
(-1.91)*(-2.74)***
(-3.04)***populshare1564
-0.130-0.034
-0.0860.081
0.2760.433
(-1.05)(-0.27)
(-0.23)(0.30)
(1.62)*(2.20)**
IVno
noyes
yesyes
yes(within)-R
20.666
0.6991-stg
F-stat.
17.61122.04/296.05
5.93/780.6527.55/815.13
Hansen
J-stat.4.707
6.3321.099
0.212#obs.
177177
120120
157143
R.H.S.
D.trade=
importhigh
epl-2.228
-4.690-6.354
-13.735-7.664
-6.530(-1.08)
(-1.24)(-2.42)**
(-2.12)**(-2.12)**
(-2.03)**trade
var.0.025
0.0000.028
-0.1110.044
-0.101(1.30)
(0.01)(0.14)
(-0.64)(0.53)
(-0.84)trade*epl
0.1440.397
0.2500.352
(1.17)(1.45)
(2.23)**(2.72)***
gdpc
-0.204-0.200
-0.239-0.245
-0.314(-2.30)**
(-2.35)**(-1.35)
(-1.90)*(-3.29)***
populshare1564
-0.145-0.169
-0.070-0.219
-0.024-0.021
(-1.17)(-1.15)
(-0.23)(-0.84)
(-0.16)(-0.13)
IVno
noyes
yesyes
yes(within)-R
20.659
0.6661-stg
F-stat.
29.47276.58/3734.91
126.19/2644.87439.12/5047.54
Hansen
J-stat.4.139
4.6931.902
2.032#obs.
177177
120120
157143
Note:
Thedep
endentvariable
isthe
unemploym
entrate.
Allregressions
include�xed
e¤ects
fortimeand
countries.Thenum
bers
inparentheses
are
t-values.Standard
errorsare
clustered-robustbycountry.
***,**,
and*denote
asigni�cance
of1%,5%,and
10%,resp
ectively.F-stat
andHansen
J-stat
arethe
F-statistic
ofthe
�rst-stageand
theHansen
overidenti�cationtest
ofallinstrum
ents,resp
ectively.The�rst
andsecond
valueofF-statatistics
are
theF-statistics
ofthe
�rst-stageregressions
forthe
tradevariables
andthe
interactionterm
s,resp
ectively.Hansen
J-statisthe
Hansen
overidenti�cation
testresult
ofallinstrum
ents.Thetrade
variablesand
theinteraction
termare,
ingeneral,
instrumented
bythe
constructedexp
ort/import
instruments
andthe
productofthe
valueofthe
initialepl60
andthe
constructedexp
ort-and
import-instrum
ent.

108 Chapter 4. The E¤ects of Trade on Unemployment
Description of Dataunemploy (%): Rate of aggregate unemployed as a share of the civilian labour
force. 1956-2007. Source: OECD Annual labour Force Statistics (ALFS).
tottrade: sum of total exports and imports as a ratio of GDP, expressed as apercentage. Source: World Development Index (WDI).
totimport : Total imports of goods and services as a ratio of GDP, expressed as apercentage. Source: WDI.
importlow : A country�s imports from low-income economies as a ratio of GDP,expressed as a percentage. The low-income economies are de�ned as all coun-tries except the OECD and the OPEC member countries of that year. Thedisaggregated bilateral import data are summed. Source: COMTRADE.
importhigh: A country�s imports from high-income economies as a ratio of GDP,expressed as a percentage. The high-income economies are the OECD mem-ber countries. The disaggregated bilateral import data are summed. Source:COMTRADE.
epl : Employment protection legislation data from the OECD labour market statis-tics database using version 1 of the indicator. Range is [0,2] increasing with thestrictness of employment protection. Source: The CEP_OECD Institutionsdata set.
brr : Unemployment bene�t replacement rate data published by the OECD. It is de-�ned as the average across the �rst �ve years of unemployment for three familysituations and two money levels and interpolated. Source: The CEP_OECDInstitutions data set.
udnet (%): Net union density extended by Visser. This is union membership as ashare of employment calculated using administrative and survey data from theOECD labour market statistics database. It is extended by splicing in datafrom Visser. Source: The CEP_OECD Institutions data set.
cow : Index of bargaining coordination with a range [1,3] taken from Ochel (2000).It is based on the data reported in OECD (1994, 1997), Traxler and Kit-tel (1999), Wallerstein (1999), Windmuller et al. (1987), and Bamber andLansbury (1998). It is interpolated by Nickell and Nunziata. Source: TheCEP_OECD Institutions data set.
gdpc: Real gross domestic product per capita in current US $, 1960-2008 Source:World Development Index.
gdp_wdi : Gross domestic product in current US $, unit, 1960-2008. Source: WorldDevelopment Index.
populshare1564 : Population aged between 15 and 64 as a share of total population.1955-2007. Source: ALFS-OECD.
popul : Total population in thousands, 1955-2008 Source: ALFS-OECD.


![The Optimal Timing of Unemployment Bene–ts: Theory and ......KLNS [ 14] (LSE) Timing of Unemployment Bene–ts December, 2014 1 / 44 Motivation Social Insurance/Transfer Programs](https://img.pdfslide.us/doc/110x75/60de6f3f8ec5843a891110f5/the-optimal-timing-of-unemployment-beneats-theory-and-klns-14-lse.jpg)