Embed Size (px)
Citation preview
Trade, Trade Policy and
the Global Crisis
Marco FugazzaDivision on International Trade
UNCTAD
The Virtual Institute, June 2010
Outline
• The great Trade Collapse• The causes (emerging consensus)• References
The great trade collapse
• 2008 third quarter (Q3) to 2009 Q2:• Steepest trade drop in recorded history.• Deepest since WWII.
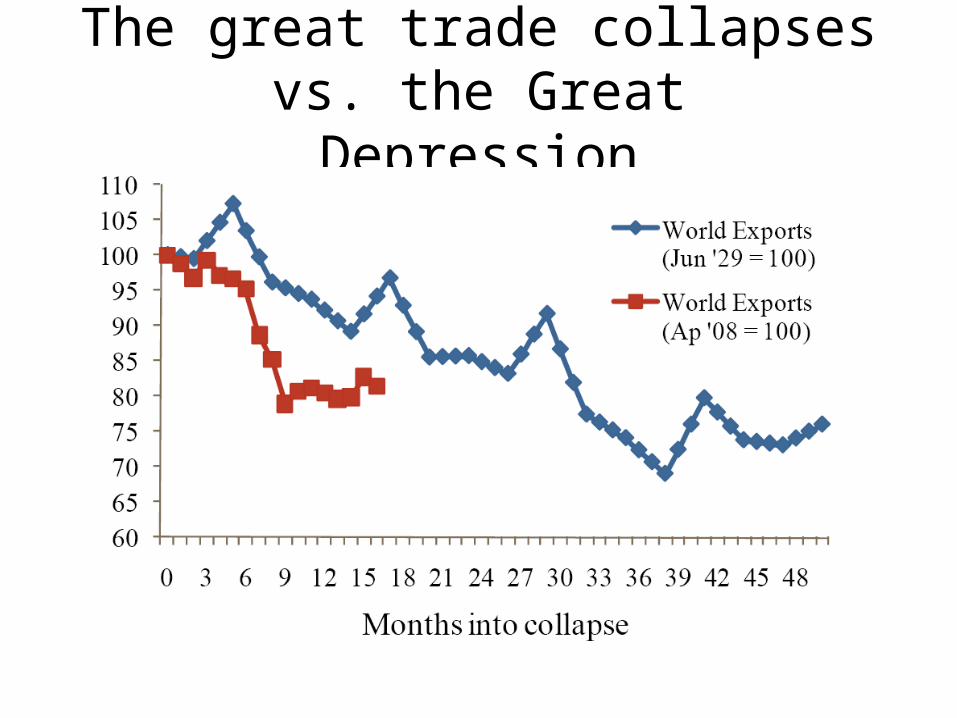
The great trade collapses vs. the GreatDepression
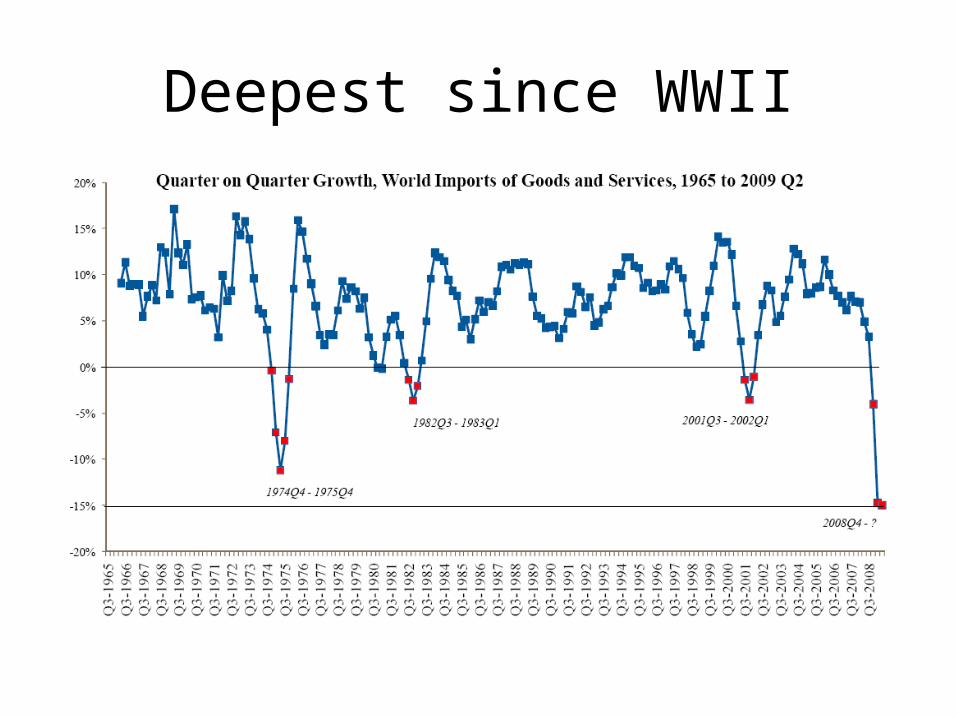
Deepest since WWII
• The 7 worst months for trade growth since 1965 have occurred since November 2008
• All 104 nations in WTO data experiences drops
Sudden and Synchronised
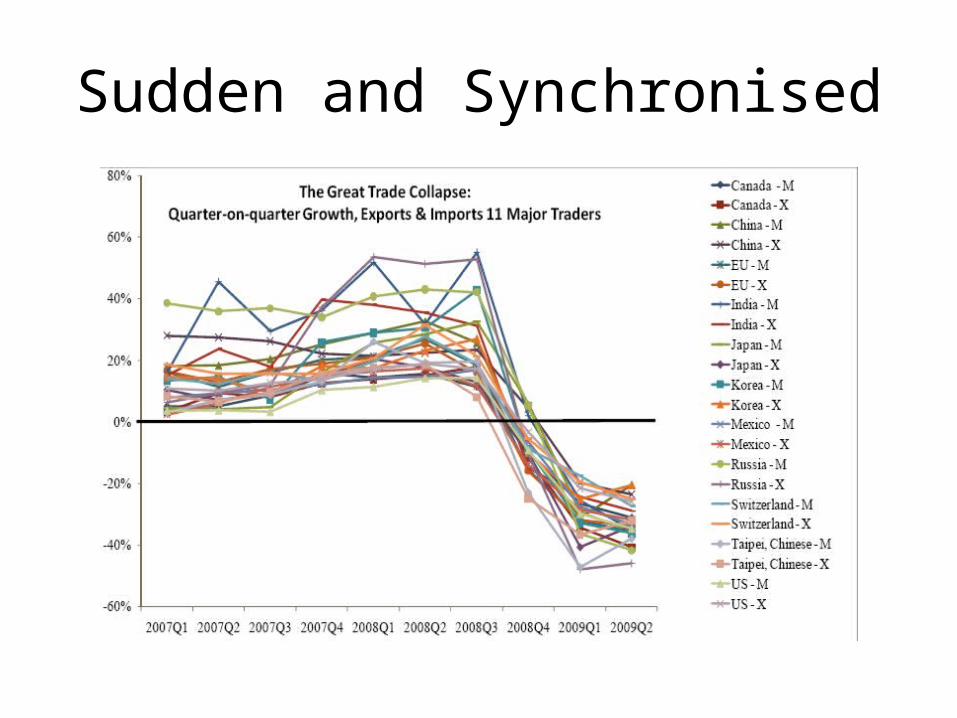
Sudden and Synchronised
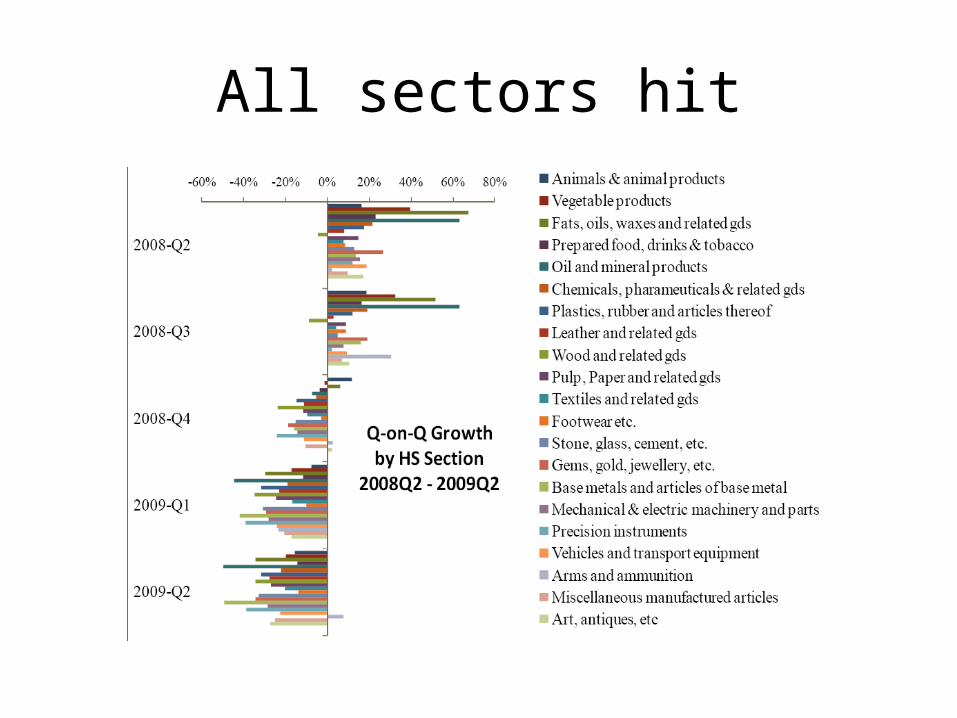
All sectors hit
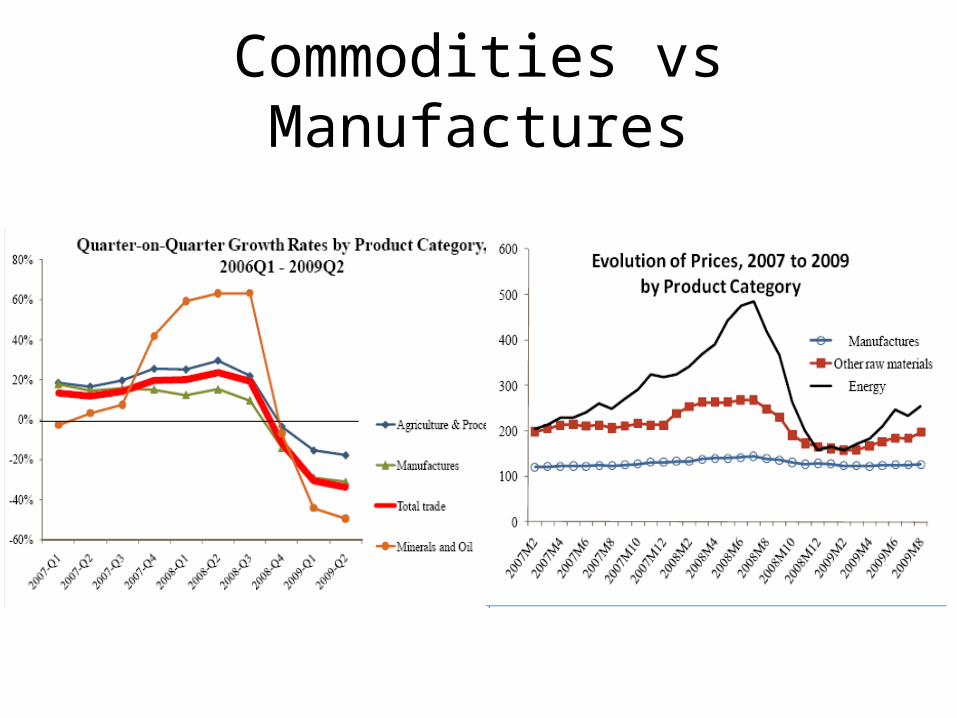
Commodities vs Manufactures
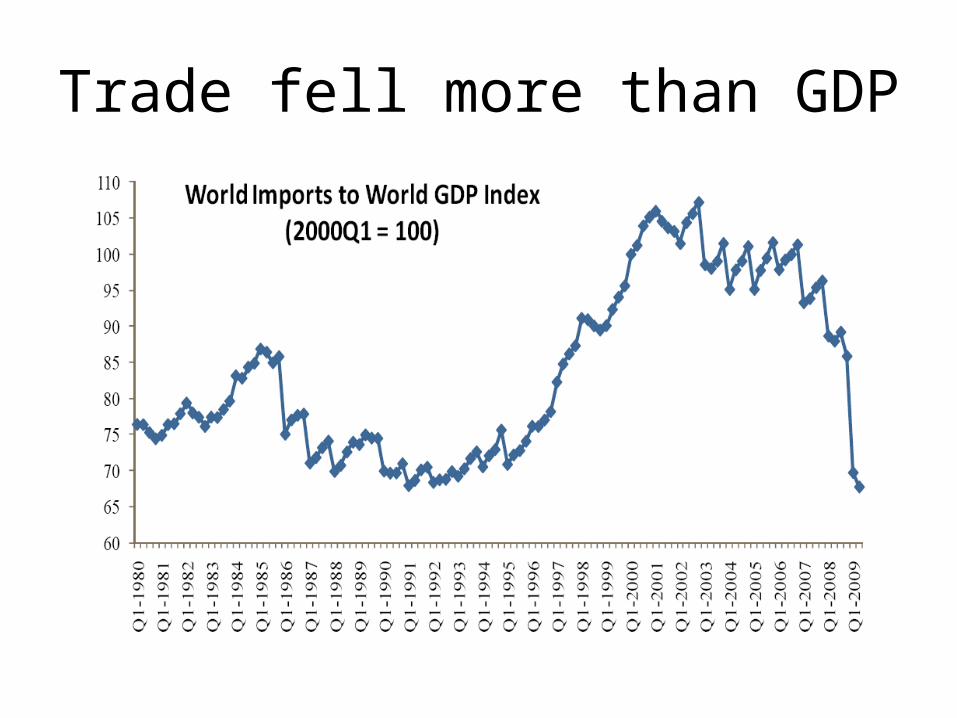
Trade fell more than GDP
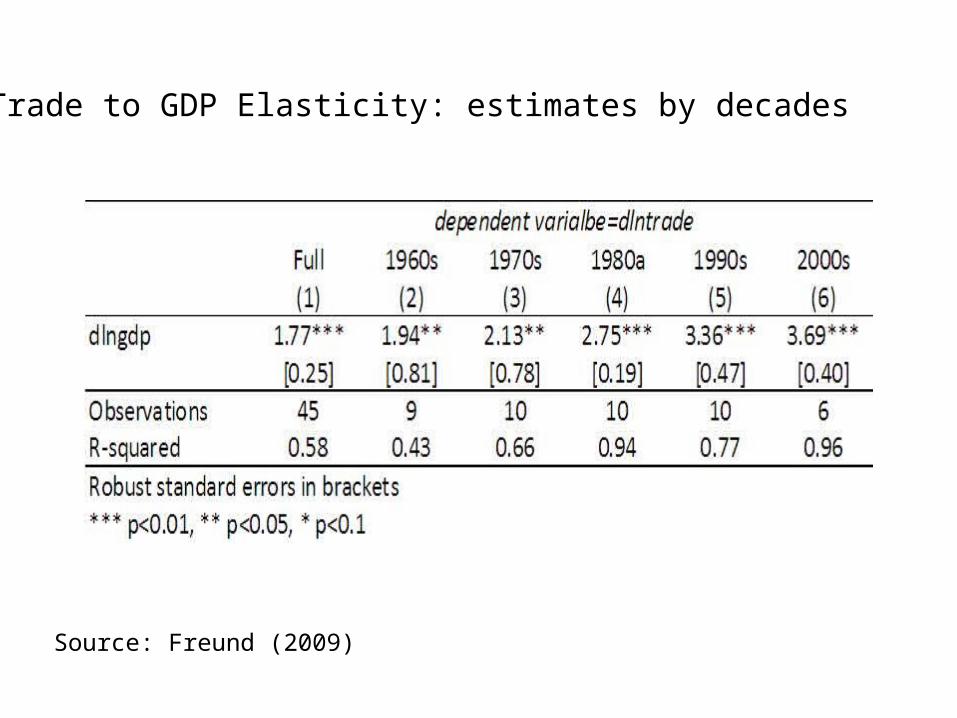
Source: Freund (2009)
Trade to GDP Elasticity: estimates by decades
Emerging Consensus on the causes
• Supply or demand shock?• Consensus: Demand amplified by
– “Compositional effect”– “Synchronicity effect”
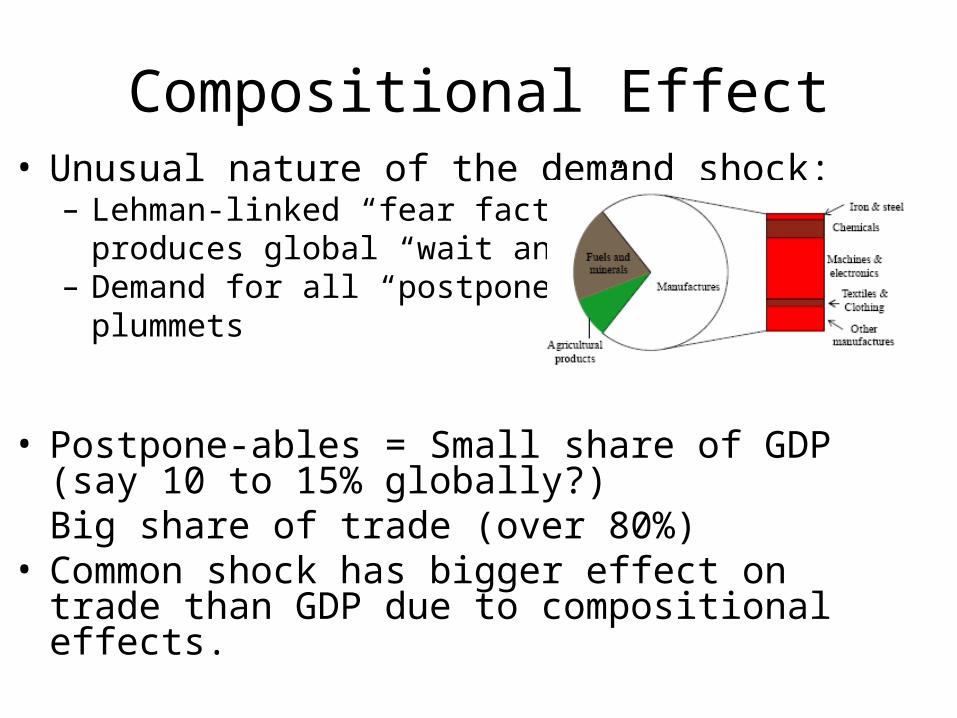
Compositional Effect• Unusual nature of the demand shock:
– Lehman-linked “fear factor” produces global “wait and see”
– Demand for all “postponeables” plummets
• Postpone-ables = Small share of GDP (say 10 to 15% globally?) Big share of trade (over 80%)
• Common shock has bigger effect on trade than GDP due to compositional effects.
Synchronicity effect
• Unusual nature of the demand shock implies– 1. Fear-factor demand shock is transmitted
instantly and globally– 2. International supply chains & “just in time”
trade collapse
Supply Side Factors
• Bankruptcy-linked supply chain disruptions• Credit problems, especially trade credit• Protectionism
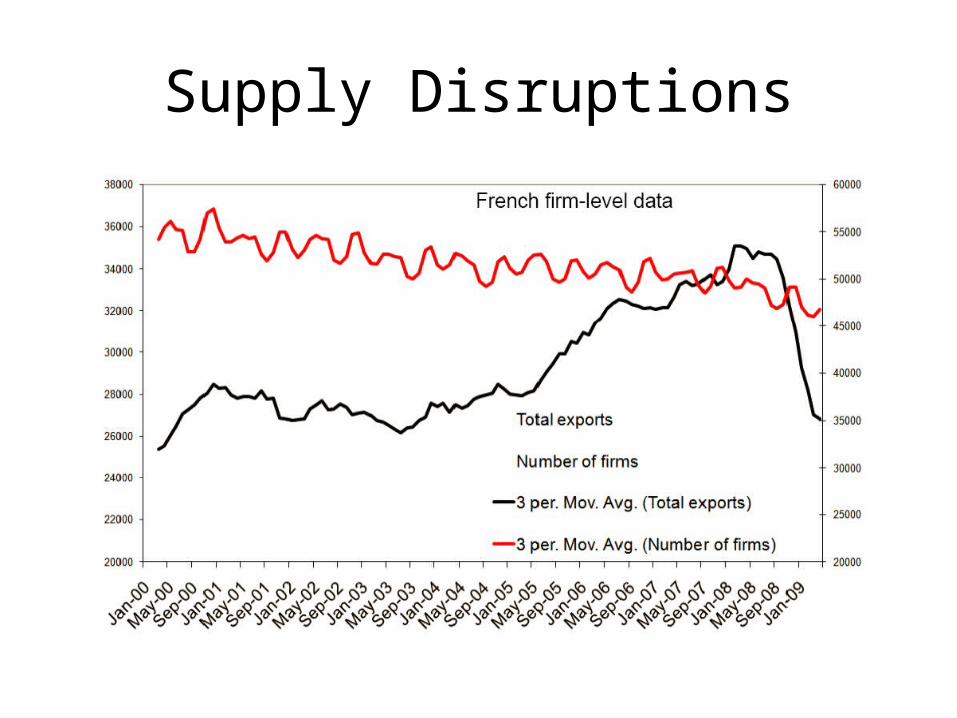
Supply Disruptions
Supply Disruptions?
• Evidence from Japan, France, and US:– Most adjustment was “intensive margin”
• US firm-level data also showed this for Asian crisis.
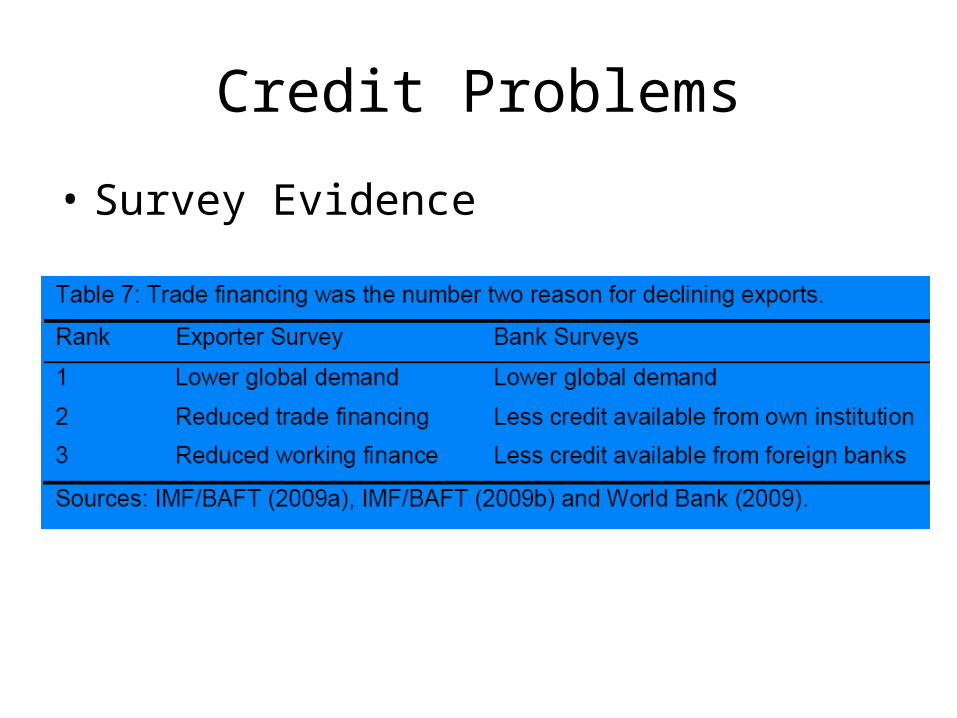
Credit Problems
• Survey Evidence
Credit Problems
• Direct evidence from Japanese firm-level data for the 1990s Japanese banking crisis.
• Direct evidence for historical banking crisis and general exposure to financing (but not trade credit per se).
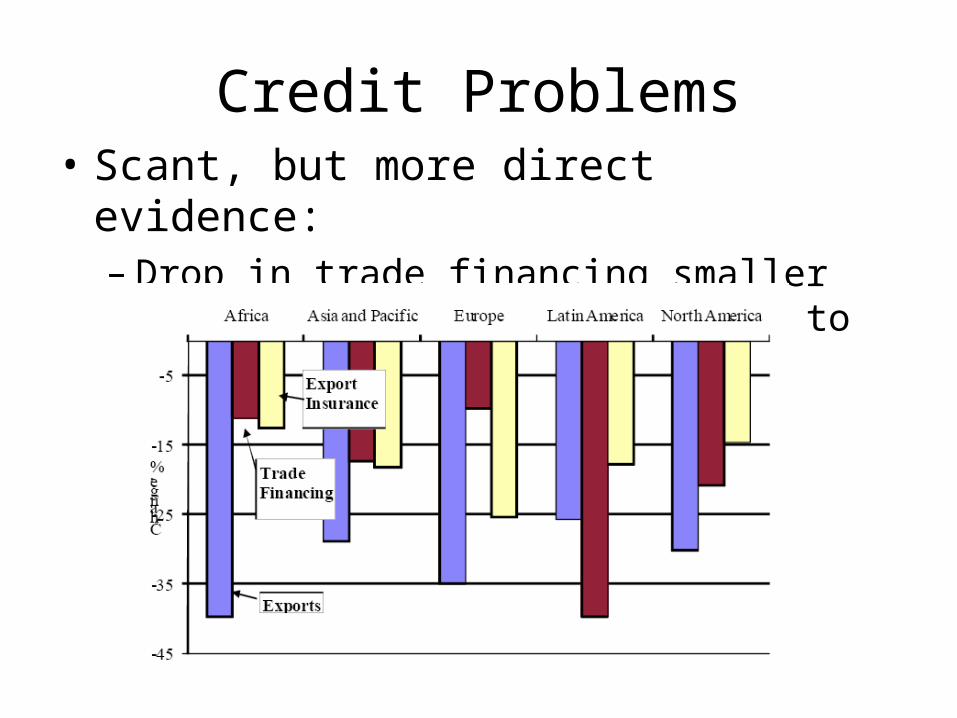
Credit Problems• Scant, but more direct evidence:
– Drop in trade financing smaller than drop in exports, 2008:Q2 to 2009:Q2
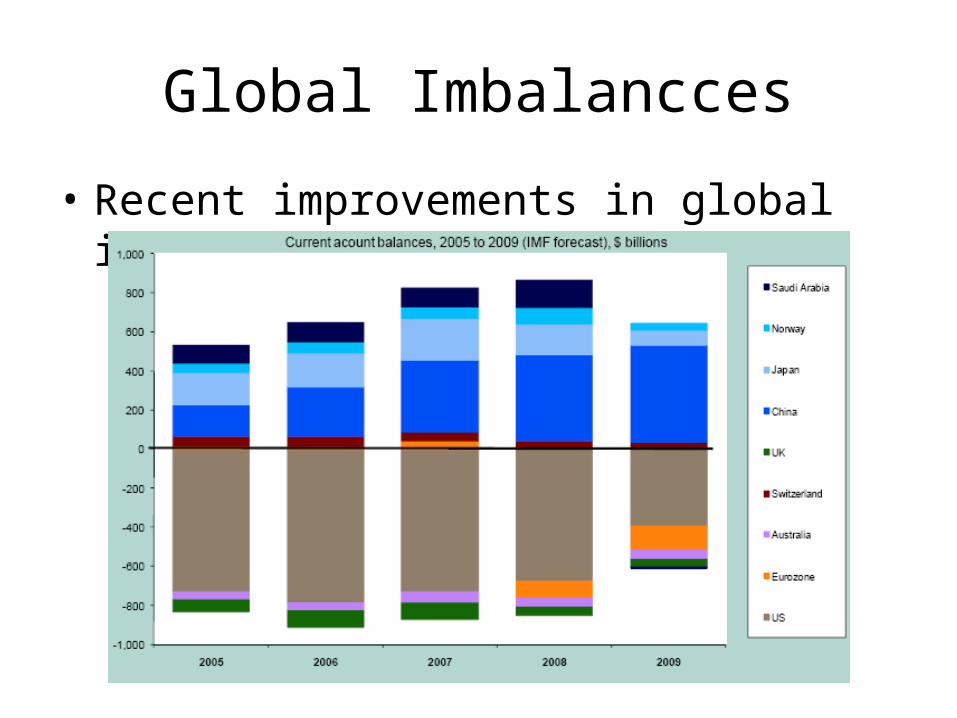
Global Imbalancces
• Recent improvements in global imbalances
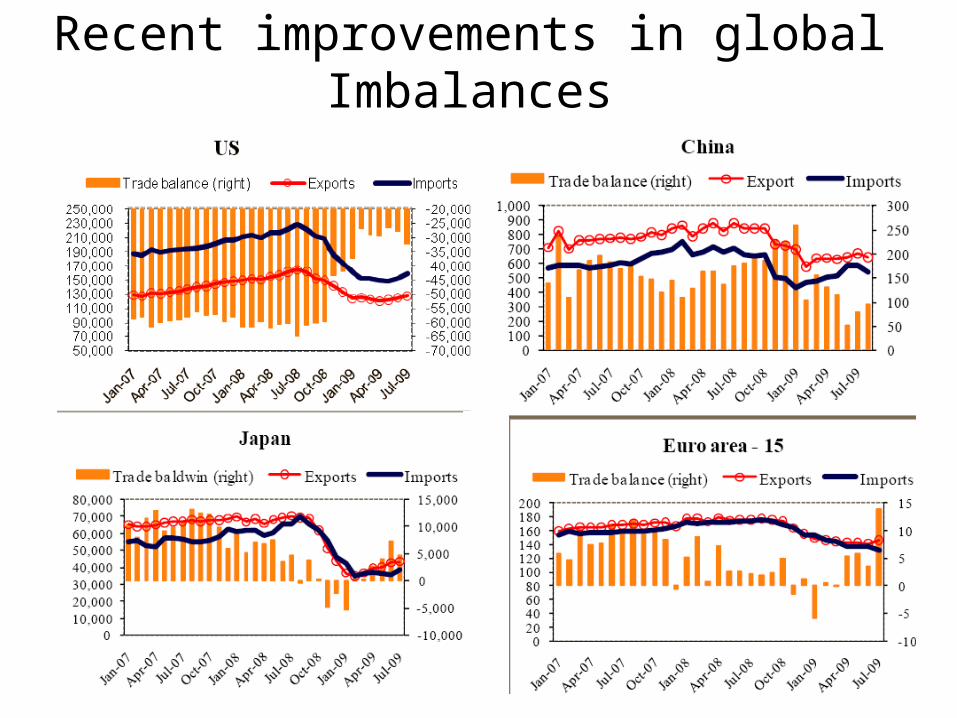
Recent improvements in global Imbalances
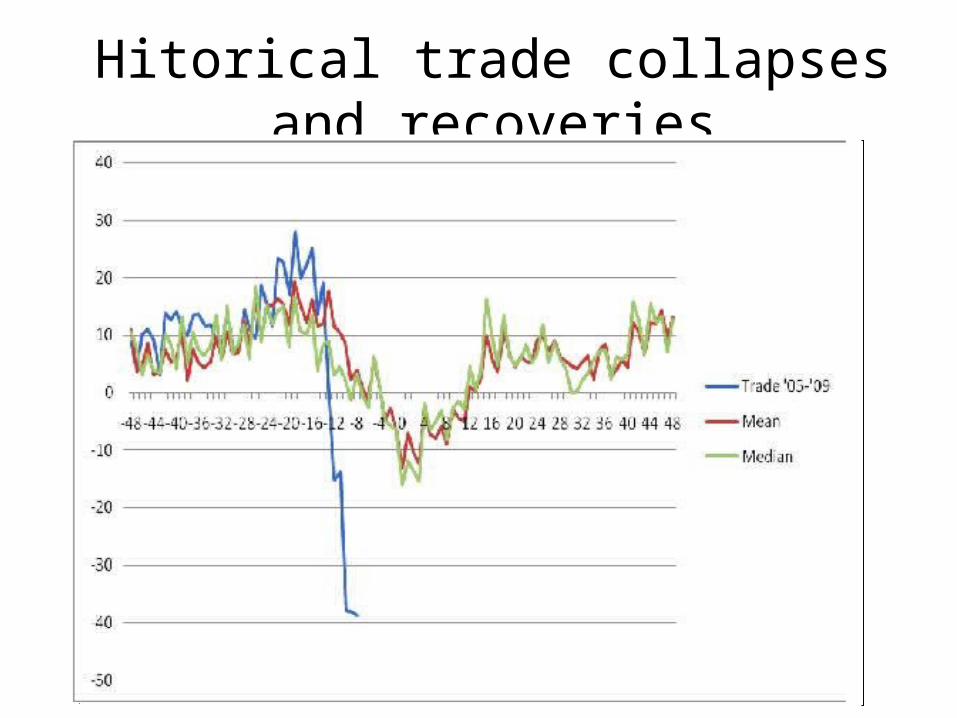
Hitorical trade collapses and recoveries
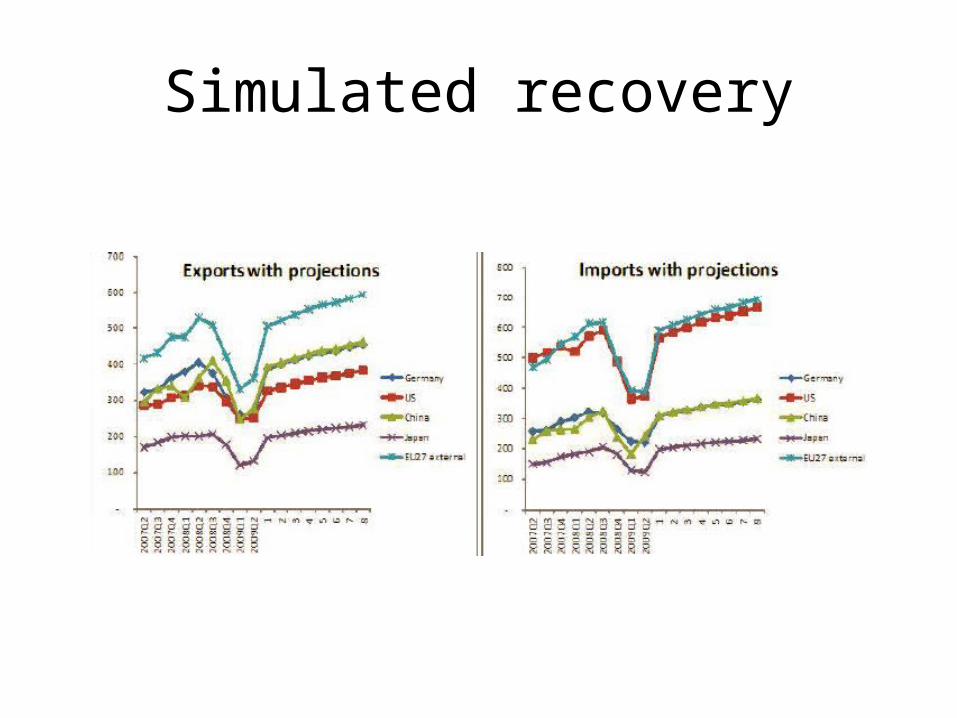
Simulated recovery
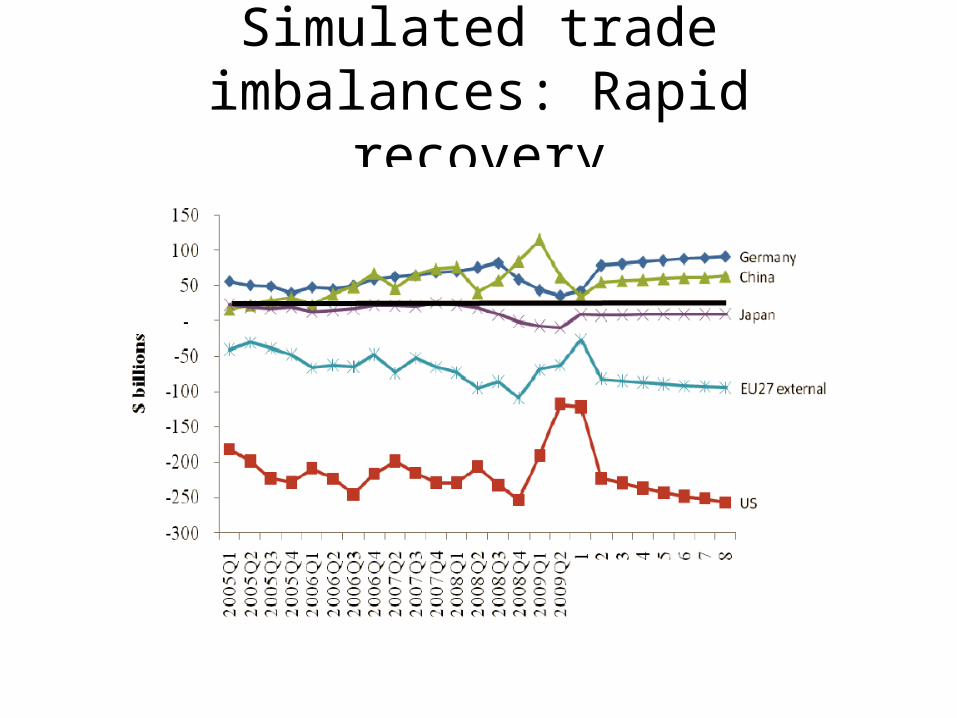
Simulated trade imbalances: Rapidrecovery
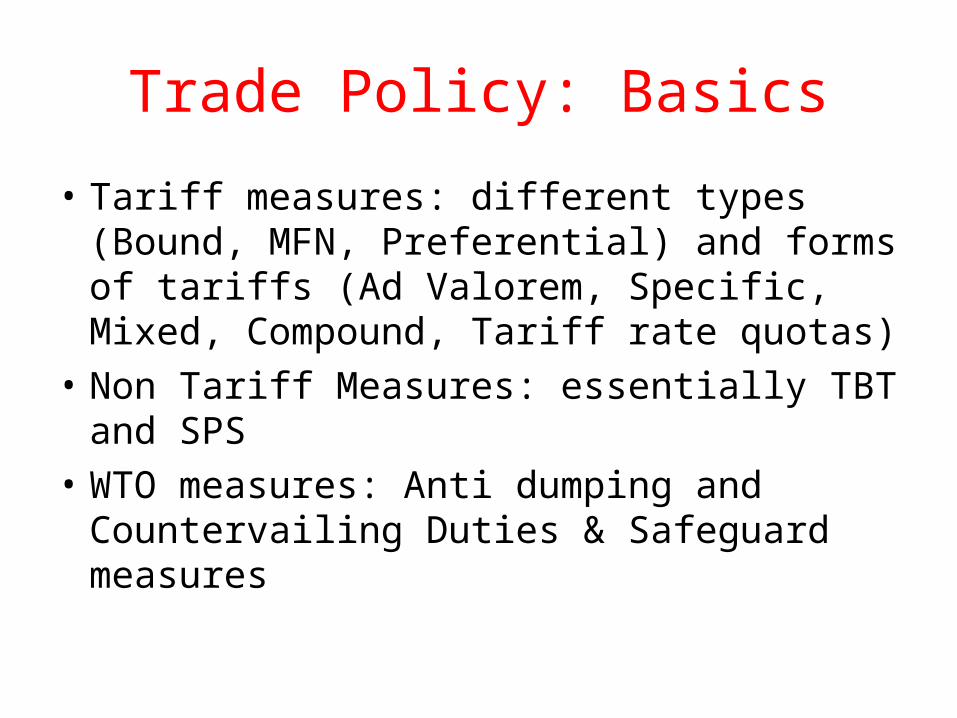
Trade Policy: Basics
• Tariff measures: different types (Bound, MFN, Preferential) and forms of tariffs (Ad Valorem, Specific, Mixed, Compound, Tariff rate quotas)
• Non Tariff Measures: essentially TBT and SPS• WTO measures: Anti dumping and
Countervailing Duties & Safeguard measures
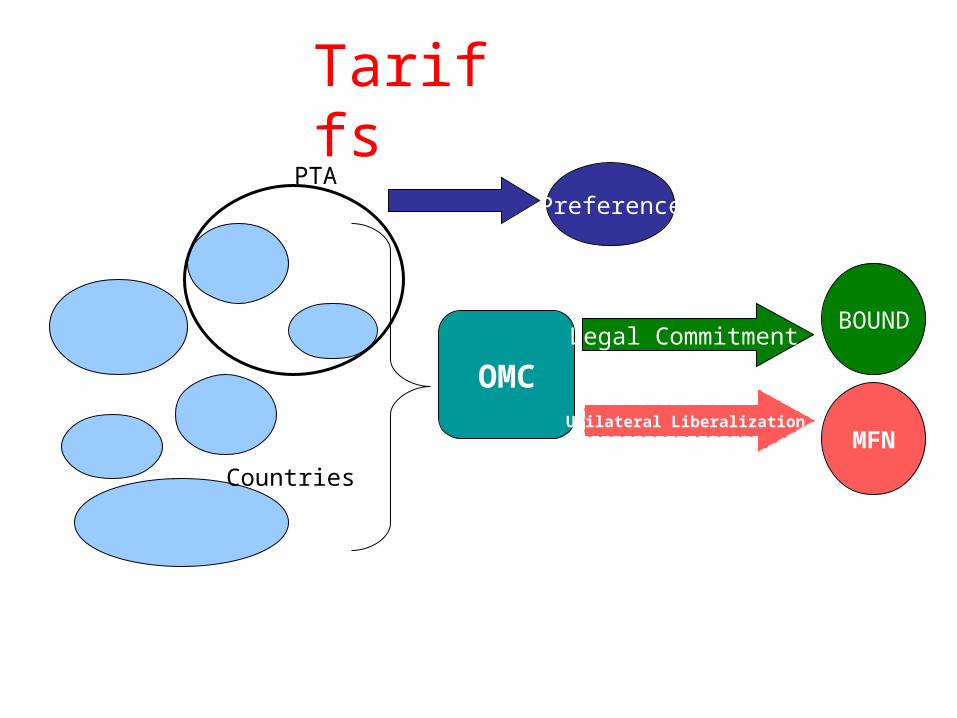
OMCLegal Commitment
BOUND
Unilateral LiberalizationMFN
Countries
PTAPreference
Tariffs
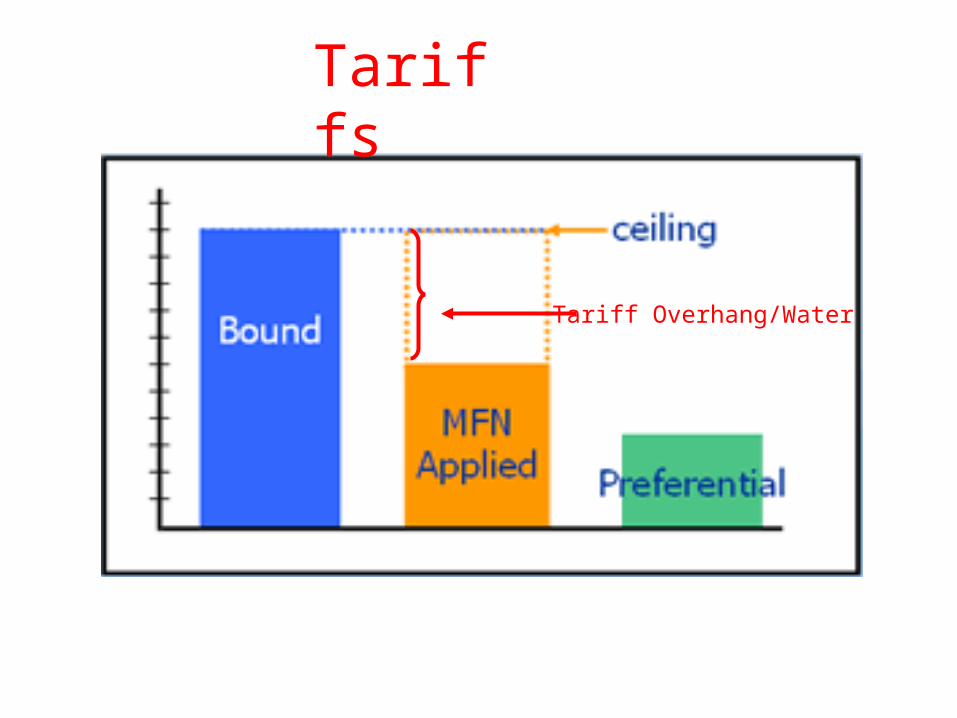
Tariff Overhang/Water
Tariffs
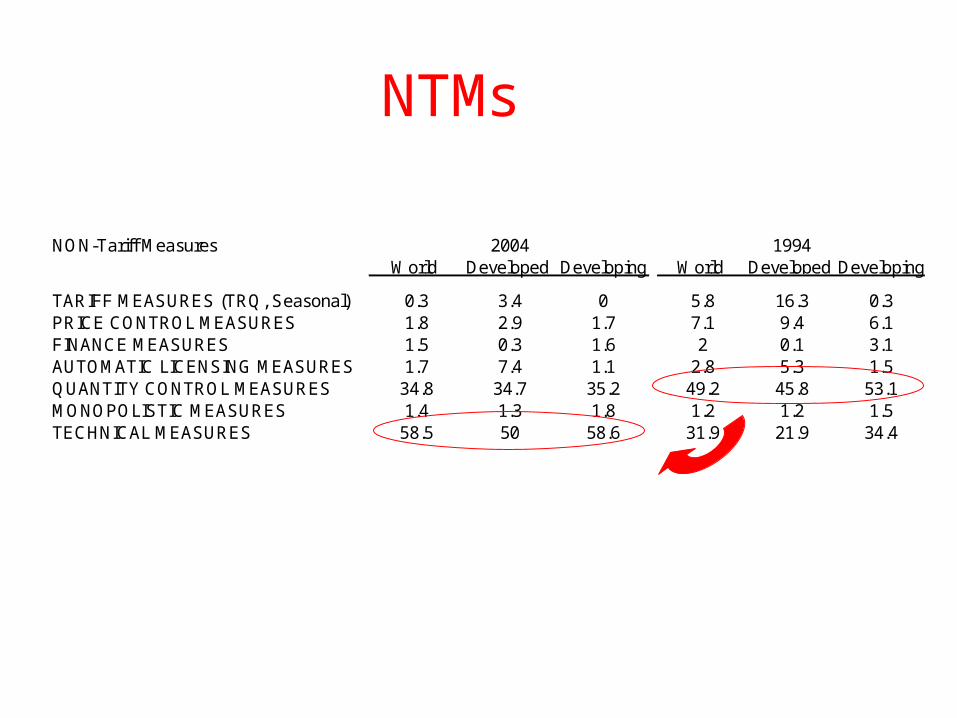
NON-Tariff MeasuresWorld Developed Developing World Developed Developing
TARIFF MEASURES (TRQ, Seasonal) 0.3 3.4 0 5.8 16.3 0.3PRICE CONTROL MEASURES 1.8 2.9 1.7 7.1 9.4 6.1FINANCE MEASURES 1.5 0.3 1.6 2 0.1 3.1AUTOMATIC LICENSING MEASURES 1.7 7.4 1.1 2.8 5.3 1.5QUANTITY CONTROL MEASURES 34.8 34.7 35.2 49.2 45.8 53.1MONOPOLISTIC MEASURES 1.4 1.3 1.8 1.2 1.2 1.5TECHNICAL MEASURES 58.5 50 58.6 31.9 21.9 34.4
19942004
NTMs
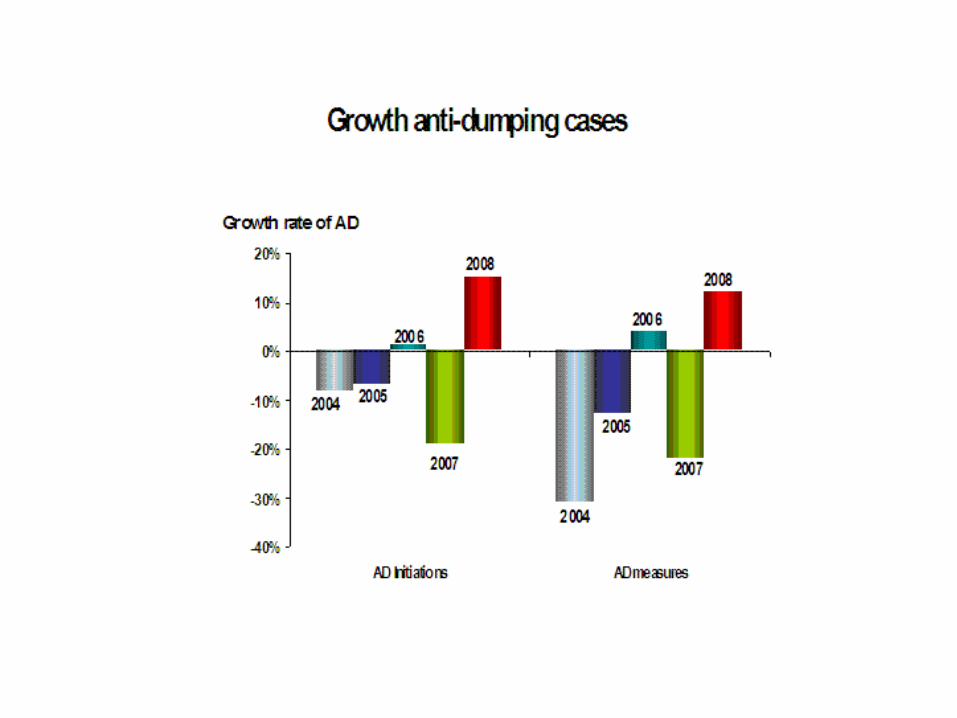
Protectionism
• During the great depression protectionism spread rapidly
• By 1933 world trade was only a third of what it was in 1929
• Part of this slump had to do with the decline in economic activity, but several studies estimate the contribution of protectionist forces somewhere between 25 to 50 percent of the total decline in world trade
• The protectionist response started in the United States with the Smoot-Hawley Tariff Act passed in June 1930, which raised tariffs by 23 percent
• Many countries retaliated• The world average effective tariff (the ratio of the
value of import duties and import value) increased from 9 percent in 1929 to 20 percent by 1933, with values as high as 30 percent in Germany and the UK
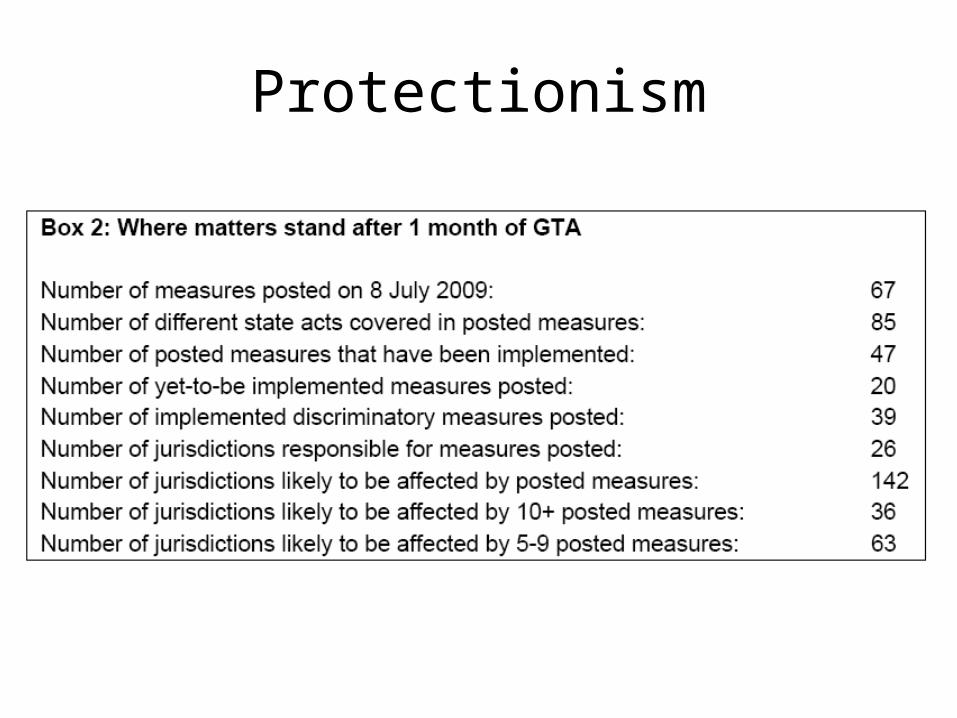
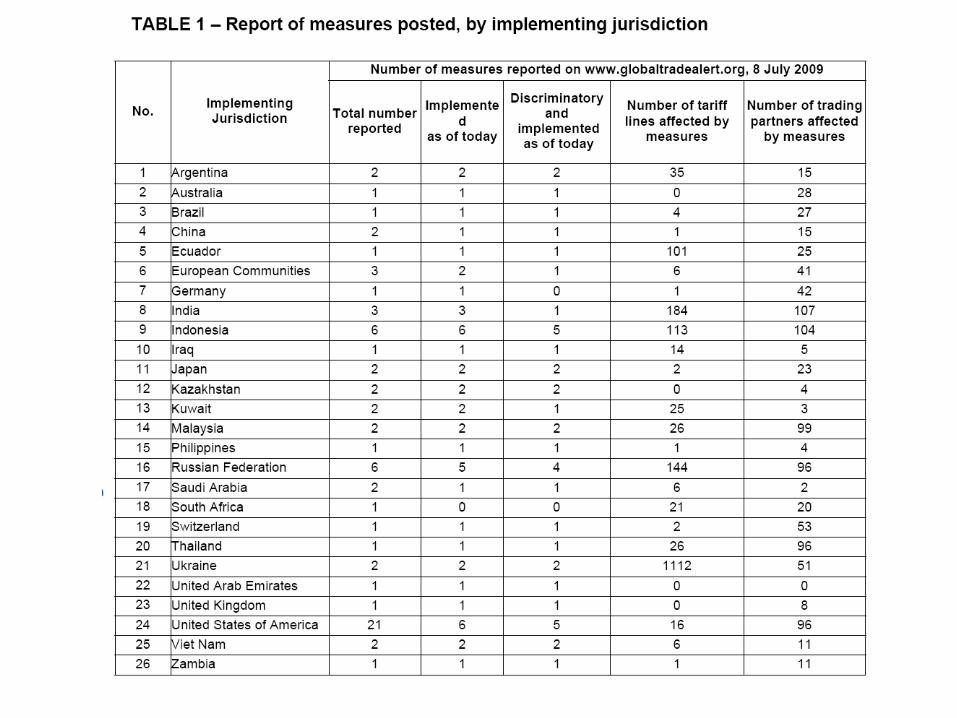
Protectionism
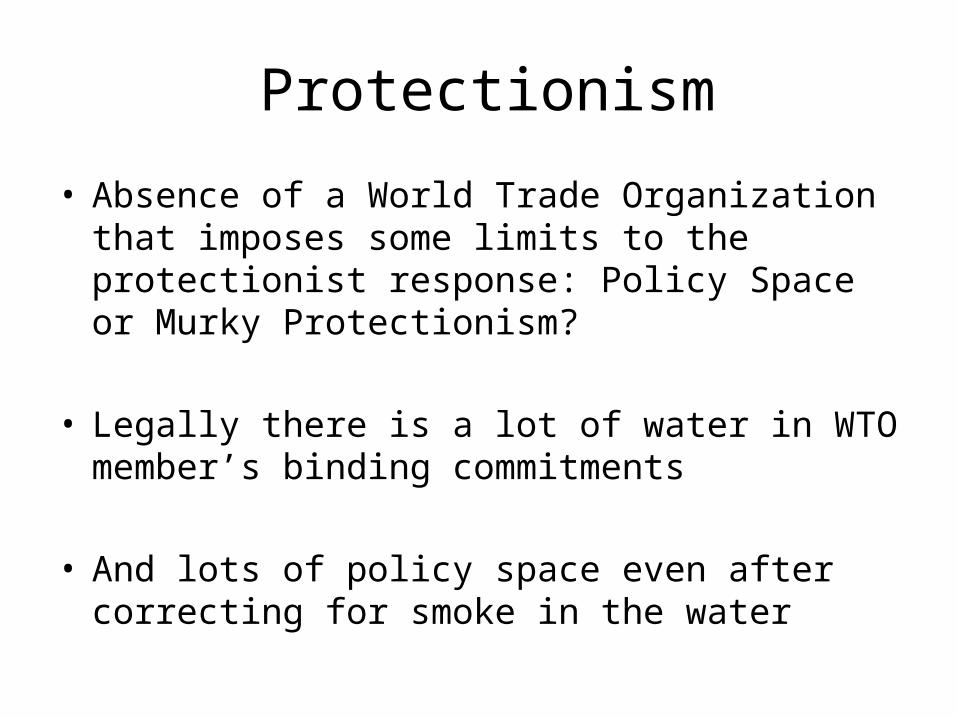
• Absence of a World Trade Organization that imposes some limits to the protectionist response: Policy Space or Murky Protectionism?
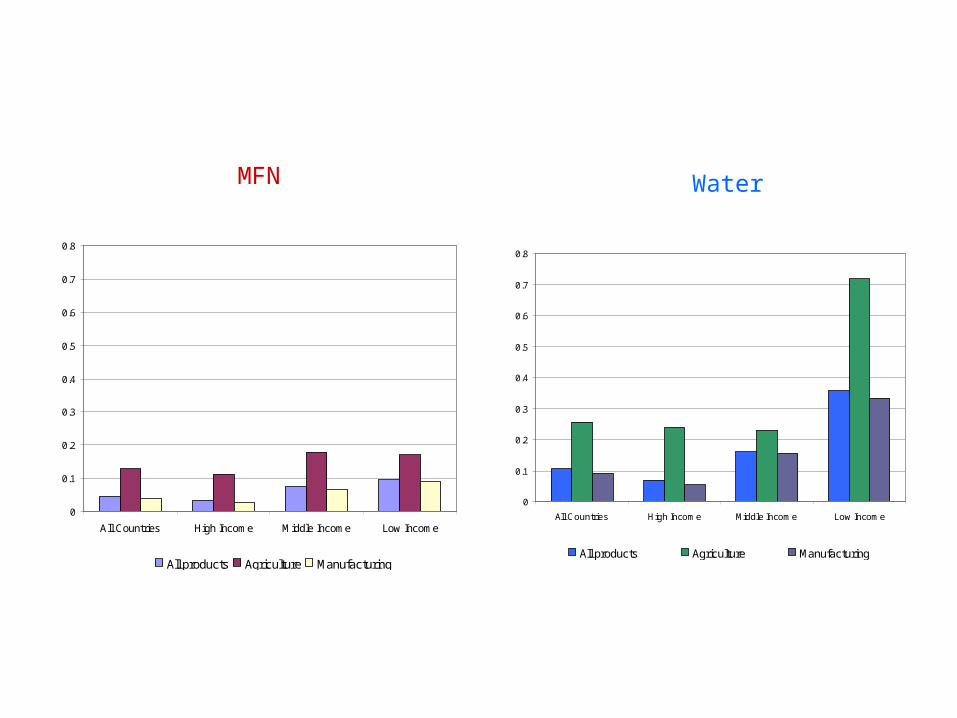
• Legally there is a lot of water in WTO member’s binding commitments
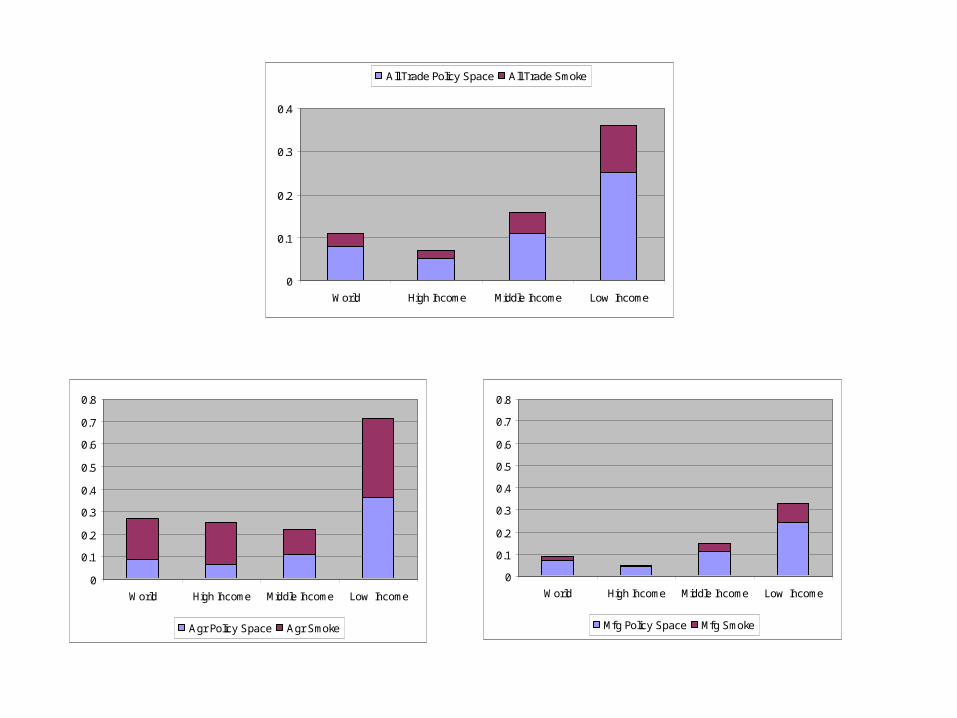
• And lots of policy space even after correcting for smoke in the water
Protectionism
0
0.1
0.2
0.3
0.4
0.5
0.6
0.7
0.8
All Countries High Income Middle Income Low Income
All products Agriculture Manufacturing
0
0.1
0.2
0.3
0.4
0.5
0.6
0.7
0.8
All Countries High Income Middle Income Low Income
All products Agriculture Manufacturing
MFN Water
0
0.1
0.2
0.3
0.4
World High Income Middle Income Low Income
All Trade Policy Space All Trade Smoke
0
0.1
0.2
0.3
0.4
0.5
0.6
0.7
0.8
World High Income Middle Income Low Income
Agr Policy Space Agr Smoke
0
0.1
0.2
0.3
0.4
0.5
0.6
0.7
0.8
World High Income Middle Income Low Income
Mfg Policy Space Mfg Smoke
• But member countries do not seem to have used this policy space during economic crisis after the creation of the WTO (1994-2008)
Protectionism
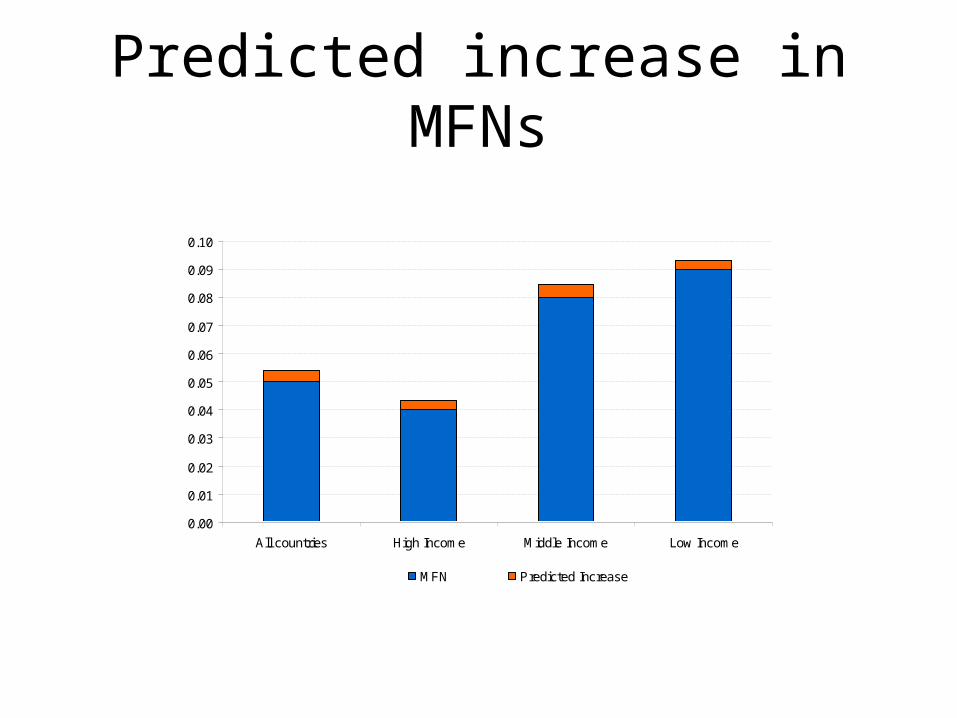
Predicted increase in MFNs
0.00
0.01
0.02
0.03
0.04
0.05
0.06
0.07
0.08
0.09
0.10
All countries High Income Middle Income Low Income
MFN Predicted Increase
Protectionism
• Is it because it may be counterproductive?
• Or because they are using other murkier forms?
Protectionism
References• Freund, C (2009) “The Trade Response to Global Crises:
Historical Evidence” World Bank• The collapse of global trade, murky protectionism, and the
crisis: Recommendations for the G20, edited by Richard Baldwin and Simon Evenett, VoxEU e-book
• The fateful allure of protectionism: Taking stock for the G8 , Edited by Simon J. Evenett, Bernard M. Hoekman and Olivier Cattaneo, VoxEU e-book
• www.voxeu.org• http://www.globaltradealert.org/• www.unctad.org
Appendix: Trade Negotiations and Tariff Cutting Formulas
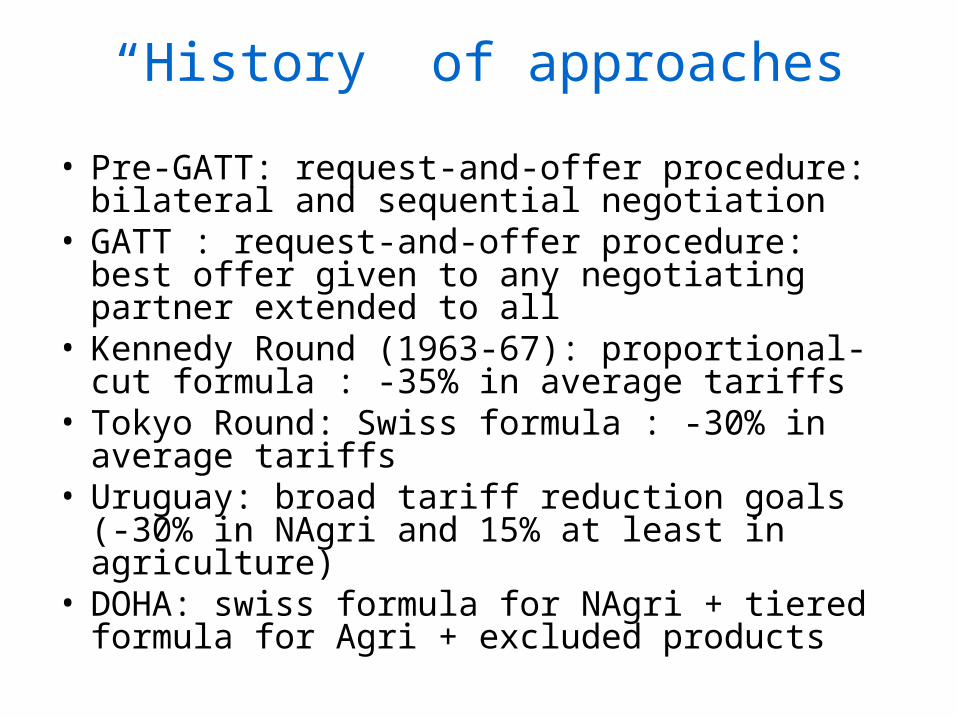
“History” of approaches
• Pre-GATT: request-and-offer procedure: bilateral and sequential negotiation
• GATT : request-and-offer procedure: best offer given to any negotiating partner extended to all
• Kennedy Round (1963-67): proportional-cut formula : -35% in average tariffs
• Tokyo Round: Swiss formula : -30% in average tariffs
• Uruguay: broad tariff reduction goals (-30% in NAgri and 15% at least in agriculture)
• DOHA: swiss formula for NAgri + tiered formula for Agri + excluded products
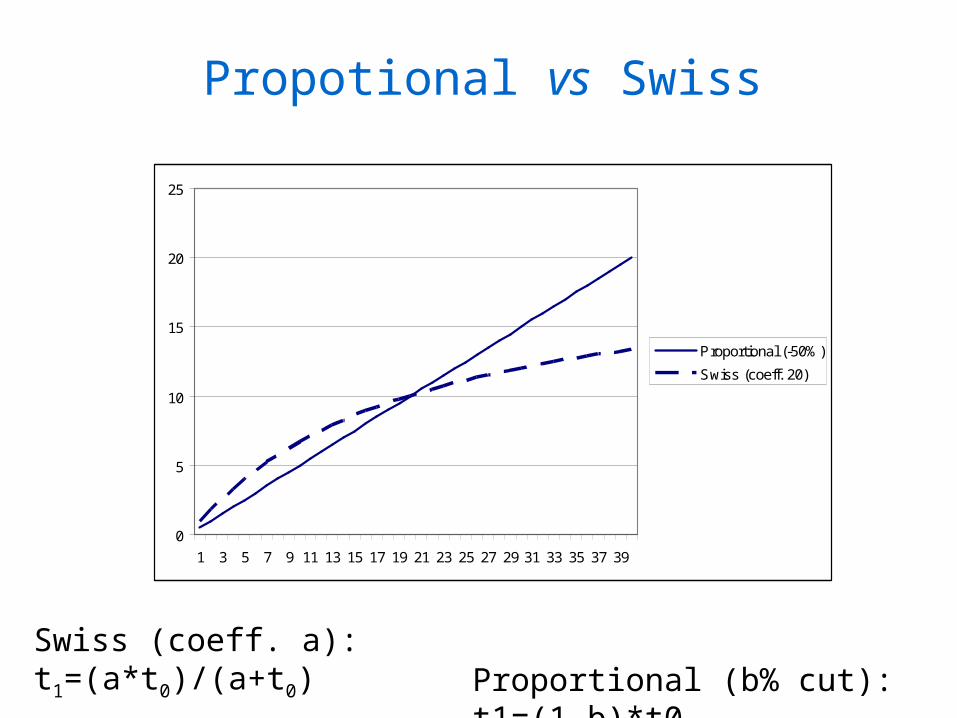
Propotional vs Swiss
0
5
10
15
20
25
1 3 5 7 9 11 13 15 17 19 21 23 25 27 29 31 33 35 37 39
Proportional (-50%)
Swiss (coeff. 20)
Swiss (coeff. a): t1=(a*t0)/(a+t0) Proportional (b% cut): t1=(1-
b)*t0
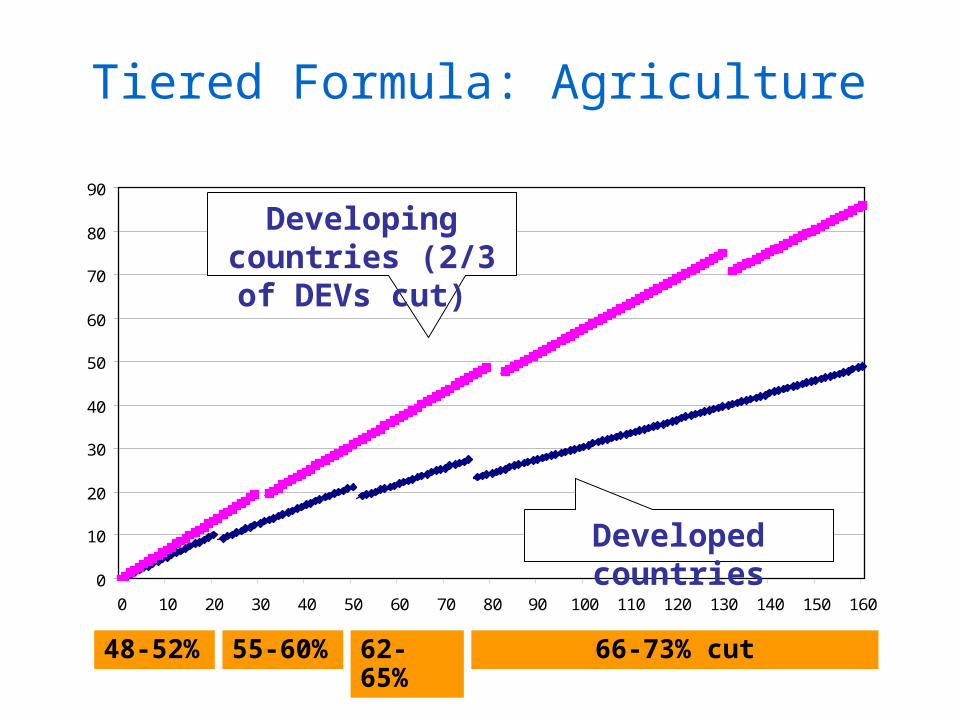
Tiered Formula: Agriculture
0
10
20
30
40
50
60
70
80
90
0 10 20 30 40 50 60 70 80 90 100 110 120 130 140 150 160
Developing countries (2/3 of DEVs cut)
Developed countries
48-52% 55-60% 62-65% 66-73% cut