Embed Size (px)
Citation preview

Trade Competition and Migration: Evidence from the Quartz Crisis
Tate Twinam
Department of EconomicsCollege of William & Mary
Abstract. Foreign competition and technological change can both present threats to es-tablished domestic industries. When these industries are spatially agglomerated, negativeshocks can have sizable effects on local economies, resulting in out-migration and regionaldecline. In this paper, I study the migration effects of one such shock: The quartz cri-sis, which devastated the globally dominant Swiss watch industry in the 1970s. Using adifferences-in-differences strategy, I show that this trade shock led to a rapid loss of popula-tion in affected areas, and a long-run change in growth patterns. This contrasts with manyother studies of large trade shocks, which find little migration response. I highlight threekey factors that distinguish this shock from others and may explain the divergence: 1.) thecrisis negatively impacted a key export industry while generating no offsetting gains, 2.) theaffected labor markets were highly non-diversified, and 3.) the affected workers were highlymobile.
1. Introduction
Economists have long recognized that the gains from international trade are not evenly
distributed. Some firms and industries benefit from expanded export markets and lower
cost intermediate goods, and competition can be efficiency enhancing, benefiting consumers.
However, trade can also threaten the survival of competing domestic industries, as well as
the livelihoods of the workers who depend on them. Much recent work has examined how
the effects of trade competition may vary across space; some regions, specializing in newly-
threatened industries, may bear a disproportionate burden of the costs of trade expansion.
One key potential margin of response to industry decline resulting from trade competition is
migration. Displaced workers may relocate from declining regions towards more prosperous
ones. However, many recent studies documenting trade-induced job losses in Brazil, Europe,
and the United States find little migration response. This naturally invites the question
E-mail address: [email protected]: January 27, 2022.JEL classification. F14, O47, R12.
1

of when and where we should expect to see workers relocate in response to trade-driven
employment loss.
To shed light on this question, I examine the consequences of one particular trade shock
driven by both foreign competition and technological innovation: The quartz crisis, which led
to the dramatic decline of the Swiss watch industry. From its roots in 16th century Geneva,
this industry had experienced tremendous growth, becoming a major employer concentrated
in many cities and towns across the Swiss Jura Arc; with some exceptions, the industry was
completely absent in other areas of the country. Refinement of craftsmanship transmitted
over hundreds of years eventually led the Swiss to dominate the global mechanical timepiece
industry by the mid-20th century. This dominance was challenged in the mid-1970s by a surge
in export competition from Japan and Hong Kong and, most enduringly, the invention of low-
cost electronic quartz watch movements, which rendered mechanical timepieces functionally
obsolete. This crisis affords an opportunity to study how cities and regions adapt to a sudden
trade-induced economic dislocation.
I begin by discussing the geographic agglomeration of the watch industry. Using industry
histories, employment data, and a nearly-exhaustive inventory of registered watchmakers and
trademarks, I map its pattern of spatial concentration across Switzerland at the municipality
level. I illustrate how the adverse shocks in the 1970s led to a sharp decline in exports,
employment, and wage growth in the industry. Using a differences-in-differences approach,
I then examine the growth of watchmaking areas compared to other areas of Switzerland
before and after the crisis. I find evidence of only a modest growth rate differential before the
crisis; during the crisis, municipalities involved in watchmaking experienced a sharp decline
in population, followed by decades of stagnant growth.
To explore the mechanisms behind this population change, I exploit microdata from the
Swiss Federal Census to document worker flows at the canton level. I show that cantons
which were more exposed to the crisis saw a sizable reduction in their labor forces, and
that this was largely driven by a decline in manufacturing workers. There is little evidence
to suggest a shift towards non-manufacturing employment. The decline was largest among
2

workers who were young, spoke German as a first language, were not homeowners, and had
recently moved. Both native and foreign-born workers were affected similarly during the
crisis, but the impact on the foreign workforce was larger in later decades, suggesting a
long-run shift in immigrant location choices. None of these results are sensitive to a canton’s
share of non-watch manufacturing activity, suggesting that the impacts are industry-specific
and not driven by general declines in manufacturing or export competitiveness. I also show
that the labor market areas in which watchmaking was embedded were generally remote and
highly non-diversified, with a significant share of their populations engaged in watchmaking,
and with few other major industries.
This paper connects to a large literature on the effects of trade disruptions on local labor
markets, as well as the literature that has extended this to examine how these labor market
changes affect migration patterns. Similar in spirit to this study, Hanlon (2017) analyzes the
effect of a transitory shock to the British textile industry due to cotton shortages stemming
from the U.S. Civil War. He finds that this trade shock led to a temporary decline in growth
rates for textile-producing cities, but not a sizable absolute population loss. Growth rates for
these cities then increased following the war, approach their previous trend. The disruption I
study reflected a more permanent demand shock and resulting reorganization of production,
which led to a much larger absolute decline in both the population level and growth rate of
affected areas.
This study is also closely related to recent work on the impact of trade liberalization and
the rise of trade between the West, China, and Eastern Europe. Dix-Carneiro and Kovak
(2019) study the regional effects of trade liberalization in Brazil, finding that workers in
some areas were exposed to a much greater reduction in import tariffs than others. Despite
the associated declines in employment and earnings, they find no substantial inter-regional
migration response. Looking at the China shock in the U.S., Autor, Dorn and Hanson (2013)
found that the sharp rise in imports between 1990 and 2007 had a substantial negative
impact on employment and wages in regions vulnerable to Chinese competition. However,
this shock did not translate into a sizable population decline in affected areas, suggesting
3

that the geographic mobility of displaced workers may be quite low. Greenland, Lopresti and
McHenry (2019) extend the work of Autor et al. (2013) to account for pre-existing growth
trends and additional years of data, finding that the China shock did result in a negative shift
in growth rates in affected areas, but with a considerable lag. Research in other contexts has
found similar results. Analyzing the China shock in Norway, Balsvik, Jensen and Salvanes
(2015) find a substantial impact on unemployment and labor force participation, but little
mobility response. Donoso, Martın and Minondo (2015) likewise find little mobility response
in Spain.
Why do we observe such a small migration effect in these settings? Some evidence from
Feenstra, Ma and Xu (2019) provides a possible answer. They examine the China shock in the
US and document job losses due to increased competition, as in previous work. They also find
that much of the losses are offset by job gains in export-oriented industries that benefit from
both a larger export market and lower input prices. Likewise, Caliendo, Dvorkin and Parro
(2019) show that, at least in the long run, employment losses due to manufacturing decline
are partially offset by the expansion of non-manufacturing industries. Dauth, Findeisen
and Suedekum (2014) find results similar to those of Feenstra et al. (2019) in Germany:
Overall job losses in Germany due to Chinese import competition were substantial, but they
were offset by employment gains due to export-oriented industries, primarily those aimed
at Eastern Europe. Donoso et al. (2015) find that manufacturing workers displaced by
import competition from China were generally absorbed into non-manufacturing industries,
resulting in little impact on unemployment or labor force participation. Dix-Carneiro and
Kovak (2019) found that Brazilian workers displaced by trade were more likely to transition
into the nontradable informal and service sectors.
This can help reconcile my findings in Switzerland with those of this recent literature.
These studies have focused on broad increases in import competition, which negatively im-
pact those affected by greater foreign competition, but which also generate benefits through
lower-cost intermediate goods and exposure to larger export markets. This can facilitate
sectoral mobility within different geographic areas, obviating the need for out-migration. In
4

contrast, my study focuses on an industry-specific export shock with no associated gains
from trade. Amplifying the effect of this shock is the composition of these local labor
markets. They tended to be highly non-diversified, with a large share of the affected work-
ers being relatively mobile. These results strongly suggest that the presence or absence of
trade-induced migration will depend on both the composition of the trade shock itself, the
industrial diversity of the affected regions, and the characteristics of the workforce.
The paper proceeds as follows. Section 2 reviews the data sources used in the analysis.
Section 3 describes the growth and spread of the watch industry in Switzerland and its
interactions with global competitors, outlining the economic forces that led to the decline of
the industry. Section 4 examines the implications of this crisis for regional growth. Section 5
outlines the demographic composition of the affected workforce, compares mobility responses
across different demographic groups, and examines the characteristics of their local labor
markets. Section 6 concludes.
2. Data
The empirical analysis is based on data from numerous sources and can be divided into
three broad categories: Locational information for the areas involved in watchmaking, eco-
nomic data on the scale of the watch industry in Switzerland and competitor nations, and
disaggregated, geographically-harmonized population data. I discuss each of these in further
detail below.
2.1. Geography of the watch industry. Watchmaking emerged in many cities and towns
across the country, and no complete inventory is available at the municipal level.1 To deter-
mine what municipalities were engaged in the production of watches, I consulted a number of
historical works on the development of the watch industry in Switzerland, including Jaquet
and Chapuis (1970), Landes (1983), Glasmeier (2000), Trueb (2005), Marti (2007), Donze
(2011), and Donze (2014). From these, most centers of watch production were identified.
1The share of the industrial workforce engaged in watchmaking at the canton level (up to 1965) is available;see panel (H) of appendix figure A4.
5

Pritchard (1997) has compiled the most complete historical inventory of Swiss watchmak-
ers to date, covering the entire period from 1775 to 1975. To supplement my initial inventory,
I digitized the cities and towns recorded for the 5,578 watchmakers for which this informa-
tion was available. The frequency of appearances here along with supplemental research was
used to determine the final list of 90 municipalities substantially engaged in watchmaking
prior to the crisis. Figure 1 illustrates the locations of these municipalities.
Figure 1. Watchmaking Areas of Switzerland
#
#
#
#
#
#
#
#
#
#
#
#
#
#
#
#
#
#
#
#
##
#
#
#
#
#
#
#
#
##
#
#
##
#
#
# #
#
#
#
#
##
#
#
#
#
#
#
#
#
#
#
###
#
#
#
#
#
#
#
#
#
#
#
#
#
#
#
#
#
#
#
#
#
##
Map depicts Switzerland divided into 16 distinct large labor market areas, as defined by theSwiss Federal Statistical FSO (2018). Municipalities involved in watchmaking are denotedby triangles.
2.2. Exports, exchange rates, and labor market outcomes. Data on exports of watches
from Switzerland is drawn from HSSO (2012d) and table 10 of Landes (1983).2 The HSSO
data covers the period 1960-1986 and is drawn from the Statistisches Jahrbuch der Schweiz,
Bde. 1931-1987. Landes’s export data is sourced from a 1980 report by the Chambre Suisse
2Much of the data utilized here comes from the Historical Statistics of Switzerland (HSSO), which aggregatessocial and economic data from a large array of historical sources. See Leimgruber (2018) for a history of thisproject.
6

d’Horlogerie, and covers the period from 1926 to 1980. Where they overlap, both series
report the same export figures. This data is presented in figure 2. Export data for Japan
comes from table 8.4 of Glasmeier (2000), sourced from the Japanese Ministry of Trade and
Industry; it is shown alongside the Swiss data in figure 3. Exchange rates for the Swiss franc
and Japanese yen (relative to the US dollar) are drawn from FRED (2020a,b).
Estimates of total employment in the Swiss watch industry are drawn from Bedat (1992),
Glasmeier (2000), Donze (2011), and HSSO (2012a,b,e). The estimates from each source
differ in the time span covered; some are drawn from official government statistics while
others are based on information from trade groups.3 Some provide different estimates for
the same years, likely due to differences in the extent to which they capture part-time and
home workers. Appendix figure A2 plots the raw data from each series, revealing a generally
high level of agreement and the same trend of expansion followed by decline. To construct
a single estimated time series for employment covering the entire period of interest, 1900 to
2000, I linearly interpolate each series over the range it covers, then average these interpolated
series. This estimated series is plotted in figure 4. HSSO (2012e) provides a breakdown of
employment across cantons and nine different secondary-sector industries over the period
1895 to 1965. This is used to estimate the share of manufacturing workers employed in
watchmaking and other sectors for each canton as of 1965 (appendix figure A4).
Data on wages in the industrial sector is taken from HSSO (2012c), which reports average
nominal wages for all male secondary-sector workers and separate averages for twelve sub-
sectors.4 This data was sourced from statistical yearbooks and Federal Office of Industry,
Commerce, and Labor publications. Appendix figure A3 illustrates the evolution of mens’
wages in each subsector relative to the average.
3The data from Donze (2011) was sourced from the Convention Patronale de l’Industrie Horlogere’s Re-censement 2007, page 13. Glasmeier’s (2000) table 7.5 data is from the Suisse Recensement Federal desEntreprises, Annee 1929, II, pages 2-5. Glasmeier’s (2000) table 9.3 data is taken from the Federation del’Industrie Horlogere Suisse and includes (self-employed) homeworkers, who were a sizable share of the totalworkforce.4The subsectors included are chemicals, clothing, construction, electricity, food, graphic arts, metals andmachines, paper, stone and earth, textiles, watches and jewelry, and wood. I exclude the clothing and paperindustry wage data from the individual-subsector analysis, as the definition of both subsectors was changedsubstantially in 1974, so it is not clear if the wage series is comparable pre- and post-crisis. However, bothare included in the overall average by necessity.
7

2.3. Population. To track regional growth over time, a geographically-harmonized popula-
tion time series is needed. Switzerland is subdivided into 26 cantons, each with substantial
political autonomy.5 Some cantons are further subdivided into districts, and all cantons
record the municipality as the smallest official administrative subdivision.6 In the year 2000,
there were 2,896 municipalities; population characteristics for these can be found in table
1. Mergers of municipalities are very common; divisions occur as well, but they are rela-
tively rare. The Federal Statistical Office of Switzerland has provided a decadal population
data series that harmonizes merged municipalities over the entire period from 1880 to 2000;
divided municipalities are reported separately, and controls are added to each model to ac-
count for population changes due to secessions.7 Additional microdata comes from the 5
percent sample of the Swiss population from each decadal census from 1970 to 2000 avail-
able through IPUMS (MPC 2019); while this data contains more detail, it only covers the
period after 1970 and only reports geographic location at the canton level. This will allow
for an exploration of heterogeneous effects across demographics, as well as the calculation of
industry concentration measures. To compare such measures with those in the US, similar
data was obtained from NHGIS (Manson, Schroeder, Van Riper, Kugler and Ruggles 2021).
3. Historical context
3.1. Watchmaking before the crisis. The watch industry in Switzerland initially rose to
international prominence in Geneva during the 16th century, later expanding throughout the
Jura Mountain Arc. Watchmaking became a major industry in cities like La Chaux-de-Fonds,
5Prior to 1979, there were only 25 cantons; the canton of Jura seceded from Bern in 1979, hence its absencefrom appendix figure A4. In the population time series, municipalities that are part of Jura are recorded assuch over the entire time span.6All areas of Switzerland are part of a municipality; some municipalities are proper cities and towns, othersare entirely rural.7While the boundaries have been largely harmonized in this data series, there are occasional populationchanges due to land/building exchanges or changes in recorded municipality for individual villages/hamlets.Of the 2,896 municipalities, 193 were identified as possibly subject to boundary changes that may haveaffected population levels. Most of these changes occurred in the late 19th or early 20th century. Onlyfive affected watchmaking municipalities, including Vevey (1892), La Chaux-de-Fonds (1900), Les Ponts-de-Martel (1910), Biel (1919), Geneva (1982), and Sion (1989,1900). The first four of these boundary changesoccurred far before the crisis period I focus on. The last three affected only a handful of individuals.Excluding all 193 municipalities with possible boundary changes yields results that are virtually identical tothose presented below.
8

Table 1. Summary Statistics
Watch-producing
municipalitiesOther municipalities
Average population:
. 19007,804 936
(22,164) (2,667)
. 197016,606 1,705
(52,669) (5,484)
. 198014,980 1,792
(46,514) (5,090)
. 200015,053 2,114
(46,091) (5,065)
Median population:
. 1900 1,423 489
. 1970 1,962 591
. 1980 1,961 635
. 2000 2,281 829
Share of total Swiss
population:
. 1900 21% 79%
. 1970 24% 76%
. 1980 21% 79%
. 2000 19% 81%
Total number 90 2,806
Standard deviations are reported in parentheses.
Le Locle, and Neuchatel, and the surrounding area would come to be known as the “Watch
Valley.” This can be seen in the upper left portion of figure 1; most of Switzerland’s watch
industry concentrated in this largely French-speaking region of the country. Some outposts in
German-speaking areas developed in the 19th century, particularly in Grenchen, Solothurn,
and Schaffhausen, while in the south, some watchmaking emerged in the predominantly
Italian-speaking canton of Ticino (Landes 1983). The industry grew substantially throughout
the 19th and early 20thcentury. Between 1910 and 1940, the industry experienced instability
due to trade disruptions stemming from World War I, the Bolshevik Revolution (which
closed off the important Russian market to trade), and the Great Depression (Donze 2011,
Glasmeier 1991). Following World War II, exports began to grow rapidly (figure 2). Post-war
demand was high, and Switzerland’s main European rivals had seen their industrial capacity9

decimated. By the 1950s, the Swiss had achieved a position of global dominance, accounting
for over half of global watch exports (Landes 1983). Swiss exports reached a peak of around
84 million units in 1974.
Figure 2. Exports of Swiss Watches, 1926-19860
2040
6080
Exp
orts
of W
atch
es (i
n m
illio
ns
of u
nit
s)
1926 1932 1938 1944 1950 1956 1962 1968 1974 1980 1986Year
3.2. The quartz crisis. The spectacular growth in Swiss watch exports over the 1950s
and 1960s was matched by an equally spectacular decline beginning in the mid-1970s. This
period is often referred to as the quartz crisis.8 Two major factors led to this decline. The
first was the rise of competition from Japan. Japanese companies, such as Seiko, Citizen,
Orient, and Casio, began to hone their ability to mass produce mechanical watch movements
that were both high quality and affordable (Glasmeier 2000). Exports from Japan expanded
rapidly throughout the 1970s, and finally exceeded those of Switzerland by 1981 (figure 3).
By 1985, the Japanese were exporting three times as many watches as the Swiss, whose
exports declined by over 50 percent from a peak of 84 million in 1974 to around 30 million
in the early 1980s. This represented a major competition shock.
The second and most important factor in this decline was the result of a crucial technology
shock: The development of quartz wristwatches. In contrast to purely mechanical timepieces,
8It is also variously referred to as the crise horlogere (watchmaking crisis) and the quartz revolution.10

Figure 3. Watch Exports from Japan and Switzerland, 1950-1986
050
100
150
Exp
orts
of W
atch
es (i
n m
illio
ns
of u
nit
s)
1950 1954 1958 1962 1966 1970 1974 1978 1982 1986Year
Switzerland Japan
these kept time using an electronic quartz oscillator, with much greater accuracy than any
mechanical watch.9 In December 1969, Seiko released the Astron, the first production quartz
wristwatch. Priced at around the cost of a new car, it posed little threat to the existing
mechanical industry. However, the technology developed rapidly, and by the end of the
1970s the cost of producing a reliable quartz watch had declined to a small fraction of
the cost of a quality mechanical timepiece. This shift towards easy-to-manufacture quartz
movements allowed both Japan and (especially) Hong Kong to greatly expand their watch
industries. Employment in Hong Kong’s watch and clock industry rose from around 10,000
in 1970 to almost 50,000 in 1980 (Donze 2012). By then, Hong Kong was the world’s fastest
growing watch producer (Thompson 2017). With the development and mass marketing of
quartz watches, Swiss mechanical timepieces were rendered functionally obsolete.
The shocks outlined above had a rapid and sizable impact on the Swiss watch industry.
Overall employment in watchmaking fell sharply (figure 4). From its 1970 peak of almost
90,000, employment declined to less than 50,000 over the course of the decade; by 1990,
9The first quartz-based wall clocks had been proposed at Bell Labs in the 1920s; however, it took muchlonger to practically miniaturize the technology (Marrison 1948, Stephens and Dennis 2000).
11

employment would reach 34,000. Only five of the twenty-six cantons experienced an ab-
solute decline in employed workers between 1970 and 1980, and three of them (Neuchatel,
Solothurn, and Bern) were centers of watchmaking, with over 20 percent of their secondary-
sector workforce engaged in the watch industry prior to the crisis. The canton of Neuchatel
was hit particularly hard. 24 percent of its workers (and almost 60 percent of its secondary-
sector workers) were employed in watchmaking prior to the crisis (Garufo 2015). By 1990,
only 11 percent of workers remained in the watch trade. Neuchatel’s total employed popula-
tion declined by 9 percent between 1970 and 1980, and its employment to population ratio
declined by 7 percent.
Figure 4. Employment in Watchmaking, 1900-2000
2040
6080
100
Nu
mbe
r of
Wor
kers
(in
th
ousa
nds
)
1900 1910 1920 1930 1940 1950 1960 1970 1980 1990 2000Year
Nominal wage growth also suffered relative to other industries. Panel (I) of appendix figure
A3 shows the growth of nominal hourly wages for men in the watch industry, plotted against
an average across all industrial sectors. The wage series are virtually identical until the early
1970s, when a clear divergence begins. Between 1970 and 1983, the average wages across
all industries increased by 132 percent; this increase was only 87 percent for the watches
and jewelry subsector. The overall price index for the Swiss franc increased approximately
88 percent over this period, suggesting stagnant wages in watchmaking despite growing real12

wages in other industries. Appendix figure A3 also shows the evolution of wages for nine other
secondary-sector industries. For eight of these industries, there is essentially no divergence
from the average for the entire period for which I have data.10
3.3. Industry response. With the rise of foreign competition and quartz technology, the
Swiss were forced to substantially reorganize production. Many firms responded by shrinking
employment and output; others closed entirely. In 1970, there were 1,618 enterprises involved
in watchmaking in Switzerland, but by 1980 that number had declined by nearly half to 861;
by 1990, there were only 572 enterprises remaining (Donze 2011). Many of the remaining
companies slowly consolidated under the umbrella of several large watchmaking groups, such
as the Swatch Group (1983) and Richemont (1988). Many large companies, such as Longines
and Omega, ceased producing watch movements in house. The production of movements
was increasingly consolidated within ETA, which adopted mass production methods that
reduced the required labor input. Additionally, the production of some watch components
(such as cases) was increasingly outsourced abroad.11 Instead of focusing on production,
brands instead pivoted to a reliance on marketing, using standardized and outsourced move-
ments packaged in different ways to target different audiences and price points.12 The shift
towards centralized production and a branding-centered approach to sales can be seen in the
employment numbers. Between 1970 and 1980, the number of industrial and home workers
in the watch industry declined by 49% and 79%, respectively, while the number of manage-
rial employees declined by only 18% (Glasmeier 2000). The Swatch Group also marketed
quartz watches, including the famous Swatch.
10The one exception is the textiles sector, which saw a similar decline. However, the clothing industrycontributed relatively little to employment in the major watchmaking cantons, and was virtually absent inNeuchatel. The share of industrial workers in watchmaking at the canton level was negatively correlatedwith the share in the clothing sector (appendix table A1).11Switzerland was already quite open to trade by the 1960s, with the lowest tariff rates on imports amongadvanced industrial countries, and this remained the case throughout the 1970s as part of their strategy ofexport promotion (Katzenstein 1980). Switzerland had been part of the European Free Trade Associationsince 1960, and party to the GATT since 1966 (Church and Head 2013). The approval of the 1972 Free TradeAgreement with the European Community may have modestly lowered the cost of outsourcing productionto Germany, Italy, and France, who were major suppliers of watch cases.12This is very similar to the evolution of manufacturing that Bernard, Smeets and Warzynski (2017) doc-ument for Denmark. They find that manufacturing companies frequently shifted out of production, butmaintained the marketing, sales, and distribution aspects of their core businesses.
13

Despite this consolidation, the Swiss still lost considerable market share, as Japan and
Hong Kong were able to scale output much faster. Why were the Swiss slow to respond to
their new competitors? Several factors come into play here, with one of the most important
being the highly decentralized nature of the Swiss industry initially. One of the key factors
behind Japanese success was standardization and mass production. On the eve of the crisis,
the Swiss industry was in the opposite position - most firms were small, and products were
highly diverse in terms of quality, materials, and price. In 1970, there were 1,618 different
firms, averaging only 55 employees each. Additionally, a substantial amount of components
were produced by self-employed home workers, accounting for around 15% of the workforce
(Glasmeier 2000).
This organization of production was partly due to historical factors that encouraged de-
centralization. In the early 20th century, the vast majority of watchmaking firms were family-
owned, averaging only 35 employees each in 1923 (Donze 2011). These owners preferred to
maintain control over their firms, supporting a cartel-like arrangement to prevent consoli-
dation; this also prevented the standardization that would allow for more mass production.
The Swiss government supported this organization of production. The Jura region during
this time was heavily dependent on watchmaking, and had few alternative industries (Bas-
sand 1975, Donze 2011). The centralization of production in major urban centers, or its
outsourcing to other countries, would represent a major threat to the economy of the region.
The government also believed that centralization of production would be conducive to trade
unions and communist activism, a major concern in the aftermath of the 1918 general strike
(Donze 2011). This led them to support many policies aimed at keeping production within
Switzerland and concentrated in small and medium enterprises, including restrictions on
exports and factory expansions and the legalization of price floors. Donze (2011) suggests
that this decentralization delayed the rationalization of production necessary for the Swiss
to become competitive on the world market, giving other countries a chance to establish a
firm foothold.13
13One additional factor may have helped Japan and other countries out-compete the Swiss in the early daysof the crisis. Donze (2011, 2014) argues that the impact of Japanese competition was magnified by exchange
14

Additionally, the shift towards quartz eliminated much of the lower-price end of the market
for Swiss watches. While the Swatch was a successful product, this was largely based on
marketing, and its popularity eventually declined. In a world where analog quartz watches
could be cheaply produced anywhere, there was limited opportunity for profit given the
costs of production in Switzerland. Quartz was also associated with the use of digital watch
displays utilizing inexpensive LCD screens. The popularity of these watches arguably put
Switzerland at a structural disadvantage (Glasmeier 2000). Japan and the United States had
developed a substantial electronics industry as a byproduct of World War II; Switzerland,
however, lagged in this area as a result of its neutrality. Hong Kong benefited greatly from
trade and technology transfer with Japan and the U.S., and they were easily able to expand
their digital watch industry (Donze 2011). Due to the highly decentralized nature of the
Swiss system at the start of the crisis, they were unable to quickly enter this market.
4. Implications for regional growth
The results in section 3 suggest a large and rapid economic shock to a highly spatially-
concentrated industry. What impact did this have on the growth of the affected cities and
regions? Figure 5 documents the average decadal change in log population for municipalities
engaged in watchmaking compared to other municipalities between 1888 and 2000. Prior to
the crisis, watchmaking municipalities tended to have relatively high growth rates. However,
a stark divergence emerged during the period of the crisis in the 1970s. Between 1970
and 1980, watchmaking areas saw population declines of 0.08 log points on average, while
non-watchmaking areas grew by 0.05 log points.14 Overall, watchmaking municipalities
lost almost 150,000 residents over this period. The rest of Switzerland saw an increase
in population of almost 250,000. This was the largest decadal divergence between these two
rate dynamics. The 1970s collapse of the Bretton Woods system and ensuing inflation in the United Statesgreatly increased the demand for safe currencies, including the Swiss franc (Baltensperger and Kugler 2017).This flight to safety led to a dramatic appreciation of the franc relative to the US dollar (figure A1). Whilethe Japanese yen also appreciated relative to the dollar, this appreciation was much less severe. As the U.S.accounted for 36 percent of Swiss watch exports prior to the crisis, this change in relative exchange rateslikely accelerated the Japanese takeover of the watch market.14I use the change in log population growth as the main outcome variable, following Autor et al. (2013) andothers in this literature. Using raw growth rates provides very similar results.
15

groups over the entire period examined, and a decline without precedent in the previous
100 years. Following that decline, growth in watchmaking areas was anemic amidst strong
overall population growth in Switzerland. Appendix figure A5 shows the entire distribution
of municipal growth rates for the pre-crisis, crisis, and post-crisis decades, illustrating that
these results are not driven by outliers, but reflect a sizable shift in the entire distribution
of growth rates for watchmaking municipalities.
Figure 5. Average Municipal Growth Rates
0.14
0.03
0.09
0.040.03
0.010.00
0.01
-0.00
0.01
0.09
0.04
0.14
0.03
0.10
0.07
-0.08
0.05
0.04
0.13
0.04
0.10
-.1
-.05
0.0
5.1
.15
Ave
rage
Log
Pop
ula
tion
Gro
wth
1900 1910 1920 1930 1941 1950 1960 1970 1980 1990 2000
Watch-producing municipalities Other municipalities
Average of decadal change in log population across municipalities, computed separately forwatchmaking and non-watchmaking areas.
As is clear from figure 1 and table 1, municipalities involved in the watch trade differed
systematically from others. Geographically, they were more likely to be located in the
mountainous northern and western areas of the country, close to the borders with France
and Germany. Culturally, they tended towards French-speaking areas. They were also larger
on average, and exhibited greater variance in population size. Differences in size and loca-
tion could result in differential growth patterns.15 This motivates the use of a standard
differences-in-differences approach, where we can compare the relative decadal change in log
15Leuba (2019) shows that natural amenities strongly influence the spatial distribution of income in Switzer-land, providing further evidence on the importance of accounting for local fixed effects.
16

population (∆ ln(populationmt) = ln(populationmt) − ln(populationmt−10)) between watch-
making and non-watchmaking municipalities, accounting for year and municipality fixed
effects. Equation 4.1 presents the general estimating equation.
∆ ln(populationmt) = β′γt × λm + γt + δm + φ ln(populationmt−10)
+ ϕ ln(populationmt−10)2 + η′Xmt + εmt
(4.1)
This empirical specification includes municipality (δm) and year (γt) fixed effects, as well
as a quadratic for the lagged level of log population; this allows for a systematic relationship
between city size and growth. The year fixed effects are interacted with an indicator λm
for municipalities that were engaged in watchmaking prior to the crisis.16 In the most basic
specification, presented in column (1) below, the only other predictors included in Xmt are
indicators for municipal secession (where necessary). Additional predictors are added in
other regressions. In my preferred specification, nonparametric canton-level time trends
are included in Xmt to account for growth fluctuations at the regional level. Cantons have
significant policymaking autonomy, and canton-level policy changes may affect municipal
growth rates.17 The estimated βs from this regression, representing the average difference in
16Typically, studies of trade-induced disruption use a measure of employment intensity, rather than theindicator approach I use here (see, e.g., Autor et al. (2013)). In that case, the main term of interest would
take the form β′γt × Empmtw
Empmt, where Empmtw is the number of workers employed in watchmaking in a given
year/municipality and Empmt is the total number of workers, so that Empmtw
Empmtmeasures the share of the
working population employed in watchmaking. This is not feasible to implement in this setting, as there isno comprehensive record of municipality-level employment in different industrial sectors. Thus, I follow theapproach of Hanlon (2017), measuring exposure to the shock using an indicator for pre-crisis involvement inwatchmaking. Given the relatively small size of most affected cities (averaging fewer than 20,000 residentsin 1970, with a median of 2,000), the presence of watchmaking at scale likely made the sector an importantpart of the local economy for most of these cities. Across the entire district of Courtelary, home to 18municipalities (11 engaged in watchmaking), 56% of the working population were engaged in watchmakingin 1970 (Marti 2007).17For example, both cantons and municipalities set their own tax rates, and research has found sizablemobility responses to both (Brulhart, Gruber, Krapf and Schmidheiny 2019, Feld and Kirchgassner 2001,Schmidheiny 2017). Appendix figure A6 illustrates how these changed over the period 1965-1989 for cantonalcapitals. Rates for five cantons where watchmaking was a major industrial sector are plotted; all of thesecapitals were watchmaking cities, and were generally also among the largest of these in each canton. I alsoinclude the average rates across all other cantons. For the 25,000 and 50,000 CHF tax brackets, rates inwatchmaking cantons were similar to or slightly higher than average, but declined at the same pace overthis period. Rates in the 200,000 CHF bracket tended to be substantially higher than average, thoughthis likely affected relatively few watchmaking workers. Wealth tax rates varied considerably more, with
17
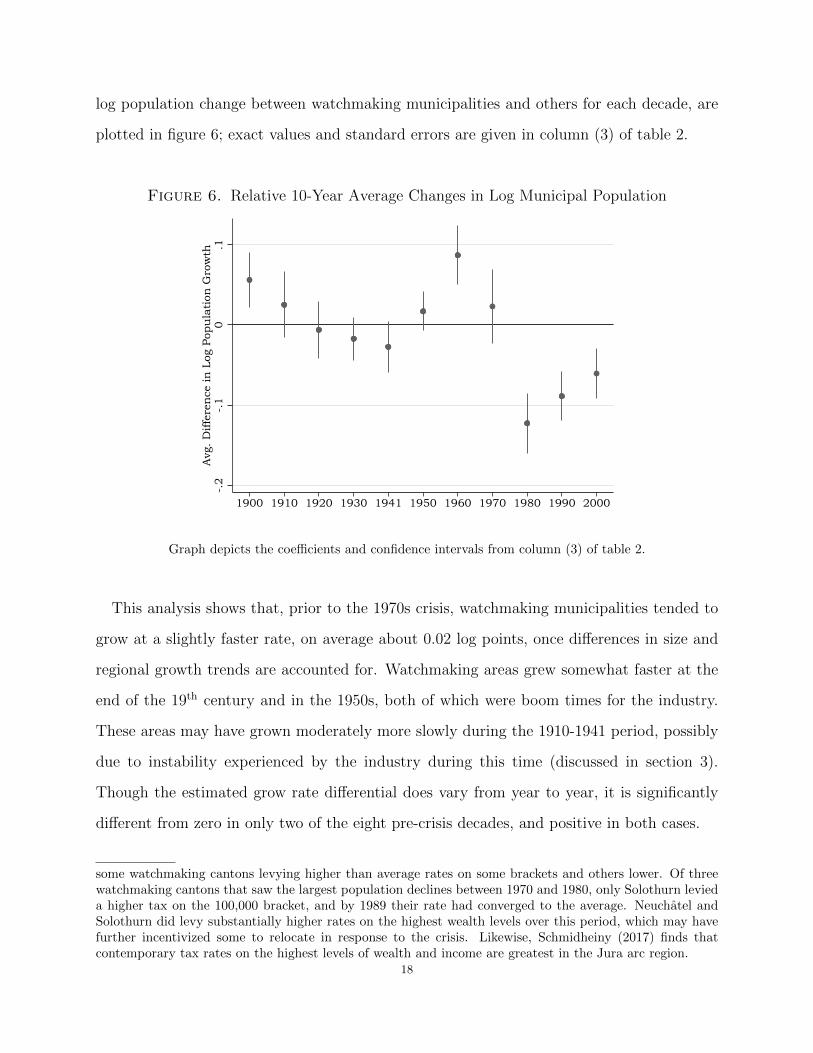
log population change between watchmaking municipalities and others for each decade, are
plotted in figure 6; exact values and standard errors are given in column (3) of table 2.
Figure 6. Relative 10-Year Average Changes in Log Municipal Population
-.2
-.1
0.1
Avg
. Diff
eren
ce in
Log
Pop
ula
tion
Gro
wth
1900 1910 1920 1930 1941 1950 1960 1970 1980 1990 2000
Graph depicts the coefficients and confidence intervals from column (3) of table 2.
This analysis shows that, prior to the 1970s crisis, watchmaking municipalities tended to
grow at a slightly faster rate, on average about 0.02 log points, once differences in size and
regional growth trends are accounted for. Watchmaking areas grew somewhat faster at the
end of the 19th century and in the 1950s, both of which were boom times for the industry.
These areas may have grown moderately more slowly during the 1910-1941 period, possibly
due to instability experienced by the industry during this time (discussed in section 3).
Though the estimated grow rate differential does vary from year to year, it is significantly
different from zero in only two of the eight pre-crisis decades, and positive in both cases.
some watchmaking cantons levying higher than average rates on some brackets and others lower. Of threewatchmaking cantons that saw the largest population declines between 1970 and 1980, only Solothurn levieda higher tax on the 100,000 bracket, and by 1989 their rate had converged to the average. Neuchatel andSolothurn did levy substantially higher rates on the highest wealth levels over this period, which may havefurther incentivized some to relocate in response to the crisis. Likewise, Schmidheiny (2017) finds thatcontemporary tax rates on the highest levels of wealth and income are greatest in the Jura arc region.
18

This changes substantially after the onset of the crisis. Between 1970 and 1980, watch-
making areas grew almost 0.12 log points slower than non-watchmaking areas. This large
relative growth disparity persists through the following two decades. Between 1990 and 2000,
growth in watchmaking cities was 0.06 log points lower than in others, a relative decline not
seen in any decade in the 80 years preceding the crisis. The estimated growth disparities,
accounting for year/municipality fixed effects, differences in population size, and variation in
regional growth trends, are strikingly similar to those seen in the raw data. The differences
in growth rates shown in figure 6 are numerically almost identical to those found in figure
5. This strongly suggests that the crisis led to a substantial population decline, followed by
decades of stagnant growth, and that this is not an artifact of broader regional trends.
Table 2 provides results from several alternative specifications. Results from the most basic
analysis, including only year/municipality fixed effects and secession indicators, are shown in
column (1). Column (2) add linear canton-specific time trends. Both of these specifications
yield results very similar to those of the primary specification with nonparametric trends,
shown in column (3). In column (4), I replicate (3) while excluding all municipalities that
may have experienced boundary changes; this yields virtually identical results. In column
(5), I include canton-level lagged employment shares in eight non-watch industrial sectors,
interacted with year fixed effects to allow their impact to vary over time. This should
capture growth changes due to changes in the relative performance of different industries.
This approach yields even larger estimates for the impact of the crisis. Overall, all of these
models show a substantial decline in the population of watchmaking municipalities (in both
relative and absolute terms) during the quartz crisis, and the growth disparities persisted
for at least two decades. The size of the 1970-80 decline in watchmaking areas was without
precedent in the previous 100 years.
The possibility remains that the decline in watchmaking cities and towns was due to other
microregional factors, such as proximity to national borders or changes in transportation
infrastructure.18 To test for this, I employ a placebo-type approach using municipalities that
18Both Fretz, Parchet and Robert-Nicoud (2017) and Buchel and Kyburz (2020) have illustrated the impor-tance of infrastructure development for regional growth in Switzerland.
19

Table 2. Relative Changes in Log Municipal Population Growth
Change in log total population
(1) (2) (3) (4) (5)
1900 × λm0.050*** 0.054*** 0.056*** 0.051***(0.0170) (0.0166) (0.0172) (0.0182)
1910 × λm-0.008 0.003 0.025 0.026 -0.028*
(0.0210) (0.0209) (0.0210) (0.0228) (0.0146)
1920 × λm-0.020 -0.005 -0.006 -0.005 -0.057***
(0.0176) (0.0172) (0.0180) (0.0197) (0.0199)
1930 × λm-0.051*** -0.034** -0.017 -0.017 -0.068***(0.0135) (0.0133) (0.0136) (0.0146) (0.0137)
1941 × λm-0.061*** -0.042*** -0.027* -0.031* -0.078***(0.0148) (0.0152) (0.0160) (0.0173) (0.0141)
1950 × λm0.002 0.022** 0.017 0.015 -0.033**
(0.0114) (0.0111) (0.0123) (0.0131) (0.0132)
1960 × λm0.069*** 0.093*** 0.087*** 0.088*** 0.038**(0.0199) (0.0195) (0.0189) (0.0202) (0.0188)
1970 × λm0.002 0.031 0.023 0.030 -0.023
(0.0229) (0.0227) (0.0236) (0.0247) (0.0224)
1980 × λm-0.154*** -0.122*** -0.123*** -0.121*** -0.168***
(0.0181) (0.0186) (0.0192) (0.0199) (0.0211)
1990 × λm-0.129*** -0.100*** -0.089*** -0.086*** -0.137***
(0.0156) (0.0153) (0.0158) (0.0165) (0.0198)
2000 × λm-0.102*** -0.073*** -0.061*** -0.057*** -0.110***
(0.0169) (0.0162) (0.0161) (0.0171) (0.0184)
Year FEs Yes Yes Yes Yes YesMunicipality FEs Yes Yes Yes Yes YesCanton-level trends None Linear Nonparametric Nonparametric NonparametricOmit boundary changes No No No Yes NoLagged industry shares No No No No Yes
Observations 34,643 34,643 34,643 32,334 31,770Adjusted R2 0.203 0.230 0.277 0.274 0.290
*** p<0.01, ** p<0.05, * p<0.1
Regressions of decadal change in log municipal population on various predictors for theperiod 1888 to 2000. All regressions include a quadratic of the log municipal populationlevel in the previous decade and indicators for municipal secession (if necessary). All re-gressions also include year fixed effects interacted with an indicator (λm) for involvementin watchmaking; these coefficients are reported in the table. Bold indicates growth ratesin the post-crisis period. Column (2) adds canton-specific linear time trends. Column (3)replaces the linear time trends with year-canton fixed effects (these coefficients are plottedin figure 6). Column (4) repeats (3), but excludes any municipality that may have experi-enced a boundary change. Column (5) repeats (3) with the inclusion of lagged canton-levelemployment shares in eight non-watch industrial sectors; employment shares are interactedwith year fixed effects to allow their impact to vary over time. Standard errors are clusteredat the municipality level.
20

were located proximate to watchmaking areas.19 If regional factors independent of watch-
making are driving out-migration decisions, then we would expect to see relative population
declines in these adjacent municipalities as well. If we do not, this would provide further
evidence that the crisis was indeed the cause of decline.
The interpretation of this exercise is complicated by two other possible factors. The reason
that this is not a true placebo exercise is precisely because these adjacent municipalities may
be indirectly affected by the watchmaking crisis. If economic activity in these municipalities
tended to serve watchmaking areas, then they may experience a relative decline due to a
reduction in the value of their target markets. So, observing that adjacent municipalities are
also negatively affected does not necessarily imply that the crisis is not driving out-migration;
it might simply be evidence of spillover effects. Alternatively, we may observe relatively high
growth rates in these adjacent areas, as individuals from watchmaking areas may switch
occupations and relocate to these areas. Despite these possibilities, the comparative exercise
is still informative. If it is the case that watchmaking-adjacent areas grow at a rate similar
to (or faster than) other non-watchmaking areas, this does provide evidence that the crisis is
driving out-migration. If they grow faster, this is positive evidence of spillover effects. This
latter possibility illustrates the value of the highly localized data used here; data at a more
aggregate level (e.g., districts or cantons) would miss this local migration effect.
To generate this comparison, I use the main specification from column (3) of table 2
and estimate it on two samples. The first sample includes only watchmaking municipalities
and municipalities outside of districts containing watchmaking activity. The second sample
replaces watchmaking municipalities with non-watchmaking municipalities located within a
watchmaking district; these act as a placebo group whose growth can then be compared to
19Since historic municipality-level geospatial data is not available, I treat municipalities as proximate if theyare located in the same district. Districts tend to be fairly small; currently, the median district land areais 66 mi2 (171 km2), with an average of 104 mi2 (269 km2). This is roughly the land area of Brooklyn andQueens, respectively. While most municipalities are associated with a district, some areas do not have districtsubdivisions. I group non-districted municipalities together by canton; the largest of these non-districts is inthe canton of Neuchatel, with a land area of approximately 309 mi2 (800 km2, about the size of New YorkCity proper).
21

that of municipalities outside these districts (and uninvolved in watchmaking). The results
can be see in figure 7.
Figure 7. Relative 10-Year Average Changes in Log Municipal Population
-.2
-.1
0.1
Avg
. Diff
eren
ce in
Log
Pop
ula
tion
Gro
wth
1900 1910 1920 1930 1941 1950 1960 1970 1980 1990 2000
Watch-producing municipalities Adjacent municipalities
Graph depicts the coefficients and confidence intervals from two regressions. The first com-pares growth in the 90 watch-producing municipalities to that of the 2,174 other municipal-ities outside of watchmaking districts. The second compares growth in the 632 non-watch-producing municipalities located in watchmaking districts to the same set of municipalitiesoutside of watchmaking districts.
What we see here is that municipalities engaged in watchmaking and those adjacent to
them had very similar relative growth patterns prior to 1970. The relative growth rates
of these two groups of municipalities were, statistically, almost indistinguishable between
1888 and 1970. This changes considerably after 1970; while the growth rates of adjacent
municipalities were, on average, slightly higher than those of other non-watchmaking areas,
the watchmaking municipalities experienced sharp relative declines. This large gap persists
through the end of the sample period. This provides additional support for the hypothesis
that the presence of watchmaking specifically was the key driver behind these population
losses; it also serves to highlight the extremely localized effect of this economic shock. The
fact that adjacent municipalities tended to grow slightly faster than other non-watchmaking22

areas also further justifies the small-area approach here, as it suggests that some may have re-
located from watchmaking areas to adjacent non-watchmaking areas. The estimated impact
of the crisis would be attenuated if a larger unit of geography were used.20
5. Mechanisms
The results in section 4 show substantial out-migration from watchmaking cities and towns
as a result of the quartz crisis. On average, these cities experienced both an immediate decline
in population as well as persistently low growth rates (in relative and absolute terms) decades
later. These findings differ substantially from many previous studies of trade competition,
which either found little migration response or modest declines in growth rates. What makes
the Swiss case different? As discussed earlier, the character of this particular trade shock
differed from many others studied in the literature. Trade competition stemming from broad
trade liberalization or rising imports across many sectors (as in, e.g., the China shock) has
the potential to generate both winners and losers. While some industries may decline as a
result of competition, others may benefit from lower cost inputs or a more robust export
market. If an area is economically diversified, workers may be able to switch from declining
industries to growing ones without a long-distance move; Feenstra et al. (2019) document
precisely this phenomenon in the US over the period 1991-2011. The quartz crisis provided
no such opportunities for Switzerland.
There are also two other potential factors that merit further analysis. The first involves
the composition of the watchmaking workforce. There may be substantial heterogeneity in
migration responses across different demographic groups. If some types workers are more
mobile than others, and if these workers constituted a significant share of the watch indus-
try, then we may expect to see a larger migration response as a result of the crisis. The
second important factor involves the availability of alternative employment opportunities. If
watchmaking areas are in isolated, highly non-diversified labor markets, there may be fewer
local opportunities for job-switching, a point made by Caliendo et al. (2019) with regards to
20I discuss this further in section 5.2.23

the impact of the China shock in the US. This may also generate a large migration elasticity.
I present evidence for the significance of each mechanism below.
5.1. Workforce characteristics and heterogeneous migration elasticities across
groups. To understand the characteristics of the watchmaking workforce, I exploit the
Swiss federal census microdata available through IPUMS (MPC 2019). This 1-in-20 ran-
dom sample of the population contains information on individual labor force participation,
employment, and demographics. However, it has two important limitations: The data only
extends from 1970 to 2000, and the finest unit of geography available is the canton.21 I first
replicate the main result from section 4 at the canton level. Then, I look at how this effect
varied across different groups. To do this, I re-estimate a simpler version of equation (4.1),
including only year fixed effects interacted with a lagged measure of watchmaking intensity
(θc) and a separate measure of the importance of non-watch industrial production (θc). This
allows me to explore how different segments of the population evolved during and after the
crisis, and how the intensity of watchmaking involvement affected these trends (controlling
for overall employment in industrial activity). The estimating equation is given in (5.1).
∆ ln(populationct) = α + β′γt × θc + η′γt × θc + γt + εct(5.1)
I consider a number of outcome variables for populationct. I first look at total population,
population in the labor force, and manufacturing and non-manufacturing employment. I then
compare effects across population groups defined by individual demographic characteristics,
such as gender, age, nativity, citizenship, schooling, and language. Lastly, I look at two
circumstantial factors that may affect mobility, namely whether or not an individual owns
their home or has moved recently.
The measure of exposure to the quartz crisis is θc, computed as the share of a canton’s
population in 1960 that was employed in watchmaking. For ease of interpretation, I nor-
malize θc to range from zero to one, with zero representing a canton with no watchmaking
21Two cantons, Appenzell Innerrhoden and Appenzell Ausserrhoden, are combined in the IPUMS data.24

industry, and one representing the canton with the highest share of the population engaged
in watchmaking. To mitigate the concern that these results may be driven by export sensitiv-
ity in general, rather than the watch industry in particular, I include additional interactions
between the year fixed effects and θc, which measures the share of a canton’s 1960 population
employed in the industrial sector excluding watchmaking. Bergier (1984) notes that during
this time period, the industrial sector accounted for approximately 90 percent of Swiss ex-
ports, so this measure should effectively capture the extent to which cantons were exposed
to non-watch-related export shocks. It will also help distinguish between declines driven
by the watch industry and declines due to general deindustrialization, which was common
among developed countries during this period (Bernard et al. 2017). Like θc, this measure is
normalized to lie within the unit interval. The correlation between θc and θc is quite low at
0.05, suggesting that the watch industry was not concentrated in areas that would be rela-
tively sensitive to export shocks for other reasons. Nonetheless, I include the θc interactions
in all models; the results are not sensitive to excluding them.
Table 3 shows the results of this analysis, and figure 8 presents the θc interaction coefficients
graphically. Using the IPUMS data supplemented with 1960 canton population counts from
the municipality series, the regression in column (1) shows no difference in overall population
growth between more or less exposed cantons over the 1960-1970 period; this is similar to
the result found using the municipality-level data. Between 1970 and 1980, overall Swiss
growth was low, but substantially lower for watch-intensive cantons. The effect estimated at
the canton level is around 2/3rds the size of the estimated effect at the municipality level,
illustrating that within-canton moves somewhat attenuate the impact of the crisis when
measured at this coarser geography. This lower relative growth persists until 1990, after
which the growth differential shrinks to zero. This again differs from the municipality-level
results, which showed slower relative growth during the 1990s, further highlighting the value
of estimates based on a finer geography.
Column (2) shows a substantial relative decline in the employed population in watchmak-
ing areas after 1970; like the overall population decline, this persists up to the 1990s. Turning
25
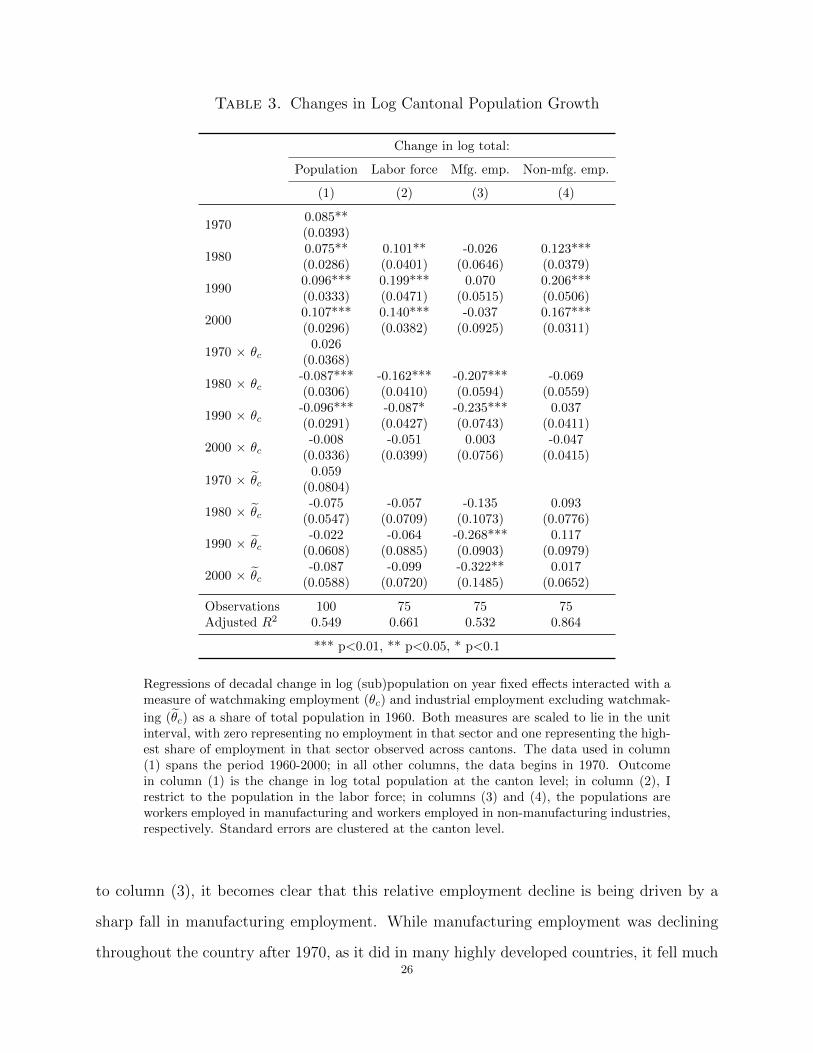
Table 3. Changes in Log Cantonal Population Growth
Change in log total:
Population Labor force Mfg. emp. Non-mfg. emp.
(1) (2) (3) (4)
19700.085**(0.0393)
19800.075** 0.101** -0.026 0.123***(0.0286) (0.0401) (0.0646) (0.0379)
19900.096*** 0.199*** 0.070 0.206***(0.0333) (0.0471) (0.0515) (0.0506)
20000.107*** 0.140*** -0.037 0.167***(0.0296) (0.0382) (0.0925) (0.0311)
1970 × θc0.026
(0.0368)
1980 × θc-0.087*** -0.162*** -0.207*** -0.069(0.0306) (0.0410) (0.0594) (0.0559)
1990 × θc-0.096*** -0.087* -0.235*** 0.037(0.0291) (0.0427) (0.0743) (0.0411)
2000 × θc-0.008 -0.051 0.003 -0.047
(0.0336) (0.0399) (0.0756) (0.0415)
1970 × θc0.059
(0.0804)
1980 × θc-0.075 -0.057 -0.135 0.093
(0.0547) (0.0709) (0.1073) (0.0776)
1990 × θc-0.022 -0.064 -0.268*** 0.117
(0.0608) (0.0885) (0.0903) (0.0979)
2000 × θc-0.087 -0.099 -0.322** 0.017
(0.0588) (0.0720) (0.1485) (0.0652)
Observations 100 75 75 75Adjusted R2 0.549 0.661 0.532 0.864
*** p<0.01, ** p<0.05, * p<0.1
Regressions of decadal change in log (sub)population on year fixed effects interacted with ameasure of watchmaking employment (θc) and industrial employment excluding watchmak-
ing (θc) as a share of total population in 1960. Both measures are scaled to lie in the unitinterval, with zero representing no employment in that sector and one representing the high-est share of employment in that sector observed across cantons. The data used in column(1) spans the period 1960-2000; in all other columns, the data begins in 1970. Outcomein column (1) is the change in log total population at the canton level; in column (2), Irestrict to the population in the labor force; in columns (3) and (4), the populations areworkers employed in manufacturing and workers employed in non-manufacturing industries,respectively. Standard errors are clustered at the canton level.
to column (3), it becomes clear that this relative employment decline is being driven by a
sharp fall in manufacturing employment. While manufacturing employment was declining
throughout the country after 1970, as it did in many highly developed countries, it fell much26

faster in watch-intensive cantons. This is not the case for non-manufacturing employment,
which continued to grow across cantons after 1970. Areas specializing in non-watch indus-
trial activity also see a decline in manufacturing employment, but this does not become
significant until the 1980s.
Figure 8. Relative Changes in Log Cantonal Population
-.4
-.2
0.2
Avg
. Diff
eren
ce in
Log
Gro
wth
1970 1980 1990 2000
Population In labor forceMfg. workers Non-mfg. workers
Graph depicts the coefficients and confidence intervals for the θc interaction terms fromtable 3.
I turn now to the demographic breakdown of watchmaking workers, as different types
of workers may be more or less mobile, and the composition of the workforce may partly
explain the high observed out-migration rates. The data available through IPUMS does not
have a category specifically for all employees in watchmaking. It does identify individuals
involved in “clock making,” which captures about 94% of the watchmaking workforce. 4,200
individuals are identified as employed in “clock making” in the 1970 census data; since this is
a 5% sample, that implies 84,000 watchmaking workers. The estimate of total employment
I derived from other industry and government sources suggests the total number is around
89,000. The missing 5,000 workers were likely categorized differently.22 Since the census
22Some working in sales or warehousing probably fell into the broad industry defined as “Precision instru-ments, optical, radio, TV, musical instruments, clock making in wholesale and retail businesses.”
27

data identifies the overwhelming majority of workers correctly, it is sufficient to perform the
demographic analysis.
Table 4 reports the share of the watchmaking workforce falling into different groups. Close
to half of workers were young (aged 15-34), and more than half were women. Most workers
were citizens and/or native to Switzerland, however, significant minorities were not. These
individuals might also be more inclined to relocate (or may be forced to, as I discuss further
below). Most watchmaking workers had general-track secondary education, but around a
third had technical-track education, and virtually none had failed to complete secondary
education. Slightly more than half of all workers spoke French as their first language, which
is unsurprising given the location of the industry. However, a sizable minority spoke German
as their first language. These workers may have been more mobile given that German is the
predominant language in Switzerland.
Table 4. Demographics of watchmaking workers in 1970
Characteristic Percentage
Age 15-34 43.8Female 54.5Non-citizen 20.6Foreign-born 23.9Secondary education, technical track 35.6Post-secondary education, technical track 3.4University eduction 0.5German language 29.5Italian language 16.3Other language 3.9Homeowner 23.0Moved within canton, last 5 years 22.9Moved across cantons/countries, last 5 years 12.9
Observations: 4,200
Table 4 also shows that many in the watchmaking sector may have lacked strong locational
anchors. Almost 80% were not homeowners. As Glaeser and Gyourko (2005) have pointed
out, homeowners may suffer greater relocation costs when trying to leave areas experiencing
population decline, as the durability of housing leads to a market asymmetry that generates
large price declines in such areas. Both Notowidigdo (2020) and Dix-Carneiro and Kovak28

(2017) have suggested that this could slow the process of interregional migration; Switzer-
land’s notoriously low homeownership rate may be an important factor in explaining higher
worker mobility. Lastly, we see that around a third of workers in the industry had moved
within the previous five years. Workers who had relocated only recently may have had a
weaker attachment to their new location, and perhaps stronger ties to a different area.
In figure 9, I compare relative growth rates across different demographic groups using the
specification from equation (5.1). In the first panel, I separately examine men and women by
age group. All four groups saw considerably lower growth rates in watch-intensive cantons,
but the impact of the crisis was more than twice as large for younger workers, suggesting
higher mobility for this group. Men and women were affected similarly, which is unsurprising
as they were roughly equally represented in the watchmaking industry. Somewhat surpris-
ingly, the second panel shows that the initial impact of the crisis on citizens and non-citizens
was very similar; the same is true for foreign-born and native workers. The relative decline in
the growth rate of the native-born and citizen population extends until 1990 and disappears
thereafter, while the relative decline for foreign-born workers increases and continues up to
2000.23 In the third panel, breaking down groups by education, we see declines for those with
secondary education and post-secondary technical education, though the standard errors are
large. It is difficult to infer much from the increase for university graduates, as they made
up a very small share of the population at this time, less than 1.5% (and only 0.5% in the
watch industry). Moving to the fourth panel, we do see a fairly large immediate decline in
the relative growth rate of German-speakers, in line with expectations.24 Both the German
and Italian speaking populations also grow more slowly over the following decade.
In the final two panels of figure 9, I examine two other important factors that may influ-
ence mobility. In the first panel, we see a substantial relative decline in the population of
non-homeowners in watchmaking areas, while we see almost no change in the homeowner
23This may partly reflect policy changes due to the recessionary environment of the mid-1970s. Restrictionson temporary workers were imposed during this period, as the Swiss government tried to use the size of theimmigrant population to regulate the unemployment rate of native workers (Baltensperger and Kugler 2017,Kuhn 1978).24Note that the standard errors are large here, exaggerating the y-axis.
29

Figure 9. Relative Changes in Log Cantonal Subpopulations-.
3-.
2-.
10
.1A
vg. D
iffer
ence
in L
og G
row
th
1980 1990 2000
Men, aged 15-34 Men, aged 35-64Women, aged 15-34 Men, aged 35-64
-.4
-.3
-.2
-.1
0.1
Avg
. Diff
eren
ce in
Log
Gro
wth
1980 1990 2000
Citizen Non-citizenNative Foreign-born
-.4
-.2
0.2
.4A
vg. D
iffer
ence
in L
og G
row
th
1980 1990 2000
Secondary, general Secondary, technicalPost-secondary, technical University
-1-.
50
.5A
vg. D
iffer
ence
in L
og G
row
th
1980 1990 2000
French-speaking German-speakingItalian-speaking
-.3
-.2
-.1
0.1
.2A
vg. D
iffer
ence
in L
og G
row
th
1980 1990 2000
Homeowners Not homeowners
-.6
-.4
-.2
0.2
Avg
. Diff
eren
ce in
Log
Gro
wth
1980 1990 2000
No recent move Recent move within cantonRecent move cross-canton/abroad
population. As shown earlier, most watch workers (and most Swiss residents in general)
are not homeowners, so this result is suggestive of the possibility that low homeownership
rates may increase worker mobility. This may partly explain why we see more migration30

in response to this shock relative to that observed in other contexts. Previous work find-
ing little migration response has looked at Brazil, Germany, Norway, Spain, and the United
States, countries with considerably higher homeownership rates that Switzerland (Hirt 2015).
Lastly, the final panel shows estimates of relative growth rates for the subpopulations who
have either not moved in the past five years, moved within a canton, or moved across can-
tons or from another country. Here, we see a large and immediate relative decline in the
population that has recently made a within-canton move or (especially) a cross-canton/cross-
national move. This could be driven by highly mobile individuals being more likely to leave
watchmaking cantons; they may also have been more likely to avoid moves to such cantons.
Taking these results as a whole, the overall picture is one of an industry where a large
share of workers tended to be relatively mobile. This could be due to their age, education,
nativity, citizenship, or language skills. It could also be due to a lack of attachments to place,
stemming from a lack of homeownership, or the fact that they had not been in their location
for a particularly long time. Thus, they would be more likely to exercise a migration option
if displaced from their industry. This would be especially true if their local labor markets
presented few alternative employment possibilities, a topic I turn to next.
5.2. Local labor market characteristics. In this section, I consider aspects of the local
labor markets surrounding watchmaking areas that may have influenced migration decisions
in response to the crisis. Figure 1 (in section 2.1) depicts the location of watchmaking
municipalities across Switzerland’s 16 large labor market areas (LMAs). 78% of these mu-
nicipalities were located in the Jura mountain arc, with an average linear distance to the
nearest major city of 17 miles (27 km).25 Looking across all watchmaking areas that were
not themselves major cities, the typical linear distance is around 20 miles (32 km). This
is the first characteristic of potential importance: Remoteness. A large majority of watch-
making municipalities are located in labor market areas that do not include a major city
25I define “major city” here as all cities with a contemporary city-proper population of over 100,000. Thisincludes Zurich, Geneva, Basel, Lausanne, Bern, and Winterthur. The first five of these were also the onlycities to have more than 100,000 residents in 1970, and the only cities with more than 250,000 residents intheir contemporary metro agglomeration.
31

or metro, including the 65% that are located in either the Biel-Jura or Neuchatel LMAs.
Workers displaced from a job by trade competition are more likely to remain in their current
location if they can easily switch jobs. If instead they are faced with limited opportunities
nearby and substantial commutes to access major metros, the prospect of relocation is more
attractive.26
What about the (relatively) large cities that were located in watchmaking labor market
areas? The Biel-Jura and Neuchatel LMAs are useful cases to examine, as each contained
about a third of the watchmaking municipalities. In Biel-Jura, the largest cities (those
with at least 10,000 residents) were Biel/Bienne, Grenchen, Solothurn, and Delemont. All
four of these cities were centers of watch production. In Neuchatel, the largest cities were
La Chaux-de-Fonds, Neuchatel city, and Le Locle, also major centers of the watch industry.
These urban areas also tended to be fairly small; the two largest, Biel/Bienne and La Chaux-
de-Fonds, had populations of 64,333 and 42,347 in 1970, respectively. Delemont and Le Locle
had populations of 11,797 and 14,452. Thus, both of these labor markets were distant from
major cities and centered around urban areas that were small and highly specialized in
watchmaking. This strongly suggests that displaced workers had far fewer local options for
alternative employment, especially given the level of industrial concentration, which I discuss
next.
How concentrated were these local labor markets? Some insight can be gleaned by ex-
amining the employment data available from the 5% sample of the Swiss census. This data
includes the general economic sector in which an employed individual works (divided into 14
categories) as well as the individual’s specific industry (91 different industries within manu-
facturing). This allows me to compute standard market concentration indices for both the
overall economy and the manufacturing sector specifically. Unfortunately, this data is not
available at the LMA level, only the canton level, and these boundaries do not always match
26Historical data on commuting behavior is not available, but currently, the typical one-way commute inSwitzerland is 8.7 miles (14 km), about half the typical linear distance from watchmaking areas to thenearest major city (FSO 2019). Linear distance of course understates the total distance via road or rail dueto mountainous character of the area; for example, La Chaux-de-Fonds is about 30 linear miles (48 km) fromBern, but around 42 miles (68 km) by road. Thus, regular commutes from many of these municipalities toa major city would entail substantial costs.
32

closely. However, this exercise is still valuable, as the concentration of watchmaking activity
in the northwestern area of the country results in 84% of watchmaking municipalities (and
93% of employment) lying in just 7 cantons, which in total largely lie within or coincide with
a contiguous arc of 6 LMAs.27 I proceed by calculating the standard Herfindahl-Hirschman
index (HHI) for each canton, separately measuring concentration across the 14 broad sectors
of the economy (manufacturing, agriculture, wholesale and retail trade, etc.) and concen-
tration specifically within the manufacturing sector. The results can be seen in table 5.
In the top panel and first column of table 5, we see that cantons are typically characterized
by moderately high levels of concentration across broad sectors.28 Looking specifically at
the seven cantons where watchmaking was prominent, this rises to the threshold of highly
concentrated, with manufacturing being the key sector, on average accounting for 43% of
total employment in these cantons. Moving specifically to Jura and Neuchatel, we see very
high levels of concentration in manufacturing. These two cantons are useful to examine not
only because they were the most heavily engaged in watchmaking, but also because of their
relationship with their respective labor markets. Neuchatel canton is located entirely within
the Neuchatel LMA, with the remainder of that LMA as a part of Jura. The rest of Jura
is part of the Biel-Jura LMA, which additionally contains almost all of the watchmaking
municipalities from the cantons of Bern and Solothurn. Given how close these areas are to
each other, it appears reasonable to suggest that the industrial structure of the Biel-Jura
and Neuchatel LMAs, containing 65% of watchmaking cities, are probably fairly close to
that of Jura and Neuchatel cantons.
These results imply a high degree of dependence on manufacturing in areas with substantial
watchmaking activity. This is shown in the first column of the bottom panel of table 5. Here,
we see a lower level of concentration, likely to be due in part to the fact that there are many
27The largest divergence involves watchmaking in the northern portion of the canton of Bern, which mostlylies in the Biel-Jura LMA. Since all of the major cities and towns in this area were devoted to watchmaking, itis reasonable to suspect that the structure of the local economy was more similar to that of Jura and Neuchatelthan the rest of the canton of Bern, which also includes the Bern LMA and the Bernese Highlands, wherewatchmaking was absent.28An HHI less than 0.15 indicates an unconcentrated market, an HHI between 0.15 and 0.2 indicates amoderately concentrated market, and one above 0.25 indicates a highly concentrated market.
33

Table 5. Industrial Concentration
Switzerland United States(cantons) (metro areas)
Concentration across 14 broad sectors
HHI:
. Mean 0.22 0.14
. Median 0.19 0.13
HHI (watchmaking cantons only):
. Mean 0.24 0.14
. Median 0.25 0.13
HHI (main watchmaking cantons):
. Jura 0.29 0.14
. Neuchatel 0.33 0.13
Average share in manufacturing(watchmaking cantons only forSwitzerland):
0.43 0.25
Concentration within manufacturing sector
HHI:
. Mean 0.13 0.07
. Median 0.10 0.05
HHI (watchmaking cantons only):
. Mean 0.15 0.07
. Median 0.10 0.05
HHI (main watchmaking cantons):
. Jura 0.26 0.07
. Neuchatel 0.26 0.05
Herfindahl–Hirschman index (HHI) calculated as∑n
i=1 si, where si represents (upper panel)the share of the workforce employed in each of 14 broad sectors covering the whole economy(e.g., manufacturing, construction, healthcare, etc.) or (lower panel) the share of the manu-facturing workforce in each of 91 manufacturing subsectors (90 for the United States). HHIis calculated at the canton level for Switzerland using the 1970 5% census sample. HHI iscalculated at the metro area level for the United States using the 1970 1% form 1 sample.
more possible industry classifications. Moving to the main watchmaking cantons, the HHI
rises considerably, implying a high level of concentration. This is only partly due to the high
share of watchmaking in manufacturing, as this would not be sufficient on its own to generate
such a high value. In all seven of the watch-producing cantons, one of the largest industries34

(often second to watchmaking) was the production of machinery.29 As watchmaking involves
a substantial amount of specialized machinery, it’s reasonable to expect that this industry
may have been negatively affected by the crisis as well, as it was likely geared towards
providing such machinery in watchmaking areas.
How does the level of concentration in the Swiss labor market compare to that in other
developed countries? A comparison with the United States is informative here; as discussed
earlier, the China shock had a considerably smaller and more delayed impact on migration,
which may be due to differences in labor market characteristics. The second column of table
5 replicates the first column, but for US metro areas in 1970. The data available for the US
defines 227 distinct industries; I crosswalked these to the 14 broad industry classifications
used in Switzerland to get a consistent measure of concentration across broad sectors. These
measures are presented in the top panel of table 5. Concentration was substantially lower
across US metros than Swiss cantons, and this difference was even larger when focusing
on watchmaking cantons. Concentration levels in Jura and Neuchatel were 2-2.5 times
larger than they were in the typical US metro. US metros also had a substantially smaller
manufacturing share. Looking specifically at the manufacturing sector, concentration in
Switzerland was about twice as high as the US on average. In Jura and Neuchatel specifically,
concentration was five times higher than in the typical US metro.
Taking all of these results together, we see that watchmaking in Switzerland generally
took place in highly non-diversified labor markets where the largest cities and towns were
heavily specialized in manufacturing vulnerable to foreign competition. These areas also
tended to be fairly distant from major cities that may have provided alternative employment
opportunities. This suggests that the most mobile workers would have a substantial incentive
towards out-migration.
29This industry is technically classified as “Machine and vehicle construction, electrical, electronic and opticalconstruction.” As this classification is quite broad, it tended to be a major industry in almost every canton.
35

6. Conclusion
This study has examined the impact of a large trade shock to an important, geographically-
concentrated local export industry. After rising to a position of global dominance in the
mid-20th century, the Swiss watch industry rapidly contracted during the quartz crisis of
the 1970s. Due to historical factors dating back centuries, this industry had developed and
agglomerated in a relatively small number of cities and towns, and was an important part
of these local economies. Using a long panel of municipality-level population records, I show
that these cities and towns tended to have modestly larger growth rates in the decades prior
to the crisis. During the crisis, these places experienced a rapid loss of population. In the
decades following, their growth was anemic. Switzerland’s population increased by over 38
percent between 1970 and 2018; despite this, most of the major centers of watch production
(such as Biel/Bienne, Grenchen, La Chaux-de-Fonds, Le Locle, Neuchatel, and St. Imier)
are smaller today than they were in 1970. These local population declines were large enough
to affect the balance of population across Swiss cantons, an effect that is independent of
general changes in the competitiveness of the Swiss manufacturing sector.
These results contrast which much of the literature on trade and migration in other con-
texts. Studies of the impact of rising trade with China have found that it resulted in substan-
tial employment dislocations in Germany (Dauth et al. 2014), Norway (Balsvik et al. 2015),
Spain (Donoso et al. 2015), and the U.S. (Autor et al. 2013), however, none of these studies
found a sizable migration response. The reanalysis of the China shock in the U.S. by Green-
land et al. (2019) did find that growth patterns shifted towards less import-exposed areas,
but that this was not associated with a sizable absolute population loss. I argue that the very
different results I find here can be explained by several factors. First, this particular shock
greatly reduced the export competitiveness of the watch industry, but was not associated
with any sort of broad trade liberalization or increase in imports to other sectors. In the case
of the China shock, Feenstra et al. (2019) document job losses due to increased competition,
but also find that these losses are generally offset by job gains in export-oriented industries
that benefit from both a larger export market and lower input prices. Dauth et al. (2014)
36

similarly finds that increased trade between Germany and China/Eastern Europe led to job
losses in import-competing industries, but sizable job gains in export-oriented industries,
generating only small migration effects. In both cases, changing patterns of trade generated
winners and losers among different industries, and when labor markets are diversified, job
switching across these industries can occur with little long-distance migration. The quartz
crisis was a sector-specific negative shock with no associated opportunities for gains from
trade.
The second important factor, which arguably exacerbated the first, was the fact that the
labor market areas associated with watchmaking were highly non-diversified. These cities
and towns were also located largely in more remote mountain areas not adjacent to major
cities. This meant that there were fewer local opportunities for sectoral reallocation. This
contrasts with US metros, which tended to be much more diversified during this time period.
This may again explain the divergence between the Swiss case and the China shock in the
US; Caliendo et al. (2019) find that within-state sectoral mobility was vastly higher than
geographic mobility. Another potential explanation for this divergence hinges on the third
factor of importance: The mobility characteristics of the affected workers themselves. Many
workers in the watch industry were young, had technical education, and spoke German.
Many also may have lacked strong attachments to place; a large share of workers were
foreign-born (working in Switzerland only temporarily), had recently relocated, and were
not homeowners. These workers were much more likely to move in response to the crisis.
Mobility was much lower in the US despite high and persistent unemployment, suggesting
higher costs of moving (in line with Caliendo et al.’s (2019) interpretation).
These results have general implications for thinking about the impact of trade policy and
changes in trade patterns due to the emergence of new industrialized economies. When
attempting to understand how foreign competition will affect cities or regions, it is key to
understand both what industries will be affected, and how. It is also crucial to understand
the composition of the local economy and the workers within. Migration responses may be
especially large when employment losses due to trade competition are not offset by gains in
37

industries that benefit from expanded trade. This is especially likely to occur when areas
are highly specialized in a few sectors. Out-migration may also depend on the composition
of the workforce. When moving costs are higher, perhaps due to age, wealth, language
barriers, or family ties, one might expect to see smaller out-migration responses. This could
also have implications for the regional welfare effects of trade. If specialized regions see
disproportionate negative impacts on employment, and their workers are less mobile, they
may disproportionately suffer from trade. This could be an important consideration for
policymakers when constructing measures to mitigate the potential impacts of increased
trade exposure.
38

References
Autor, David, David Dorn, and Gordon H Hanson (2013). The China syndrome: Local labormarket effects of import competition in the United States. American Economic Review,103(6), pp. 2121–68.
Balsvik, Ragnhild, Sissel Jensen, and Kjell G Salvanes (2015). Made in China, sold in Nor-way: Local labor market effects of an import shock. Journal of Public Economics, 127,pp. 137–144.
Baltensperger, Ernst and Peter Kugler (2017). Swiss monetary history since the early 19thcentury. Cambridge University Press.
Bassand, Michel (1975). The Jura problem. Journal of Peace Research, 12(2), pp. 139–150.Bedat, Jacqueline Henry (1992). Une region, une passion: l’horlogerie: une entreprise:
Longines. Saint-Imier: Compagnie des Montres Longines SA.Bergier, Jean Francois (1984). Histoire economique de la Suisse. Payot.Bernard, Andrew B, Valerie Smeets, and Frederic Warzynski (2017). Rethinking deindustri-
alization. Economic Policy, 32(89), pp. 5–38.Brulhart, Marius, Jonathan Gruber, Matthias Krapf, and Kurt Schmidheiny (2019). Be-
havioral responses to wealth taxes: Evidence from Switzerland.Technical report, CESifoWorking Paper.
Buchel, Konstantin and Stephan Kyburz (2020). Fast track to growth? Railway access, pop-ulation growth and local displacement in 19th century Switzerland. Journal of EconomicGeography, 20(1), pp. 155–195.
Caliendo, Lorenzo, Maximiliano Dvorkin, and Fernando Parro (2019). Trade and labor mar-ket dynamics: General equilibrium analysis of the china trade shock. Econometrica, 87(3),pp. 741–835.
Church, Clive H and Randolph C Head (2013). A concise history of Switzerland. CambridgeUniversity Press.
Dauth, Wolfgang, Sebastian Findeisen, and Jens Suedekum (2014). The rise of the Eastand the Far East: German labor markets and trade integration. Journal of the EuropeanEconomic Association, 12(6), pp. 1643–1675.
Dix-Carneiro, Rafael and Brian K Kovak (2017). Trade liberalization and regional dynamics.American Economic Review, 107(10), pp. 2908–46.
(2019). Margins of labor market adjustment to trade. Journal of International Eco-nomics, 117, pp. 125–142.
Donoso, Vicente, Vıctor Martın, and Asier Minondo (2015). Do differences in the exposureto Chinese imports lead to differences in local labour market outcomes? An analysis forSpanish provinces. Regional Studies, 49(10), pp. 1746–1764.
Donze, Pierre-Yves (2011). History of the Swiss watch industry: from Jacques David toNicolas Hayek. Peter Lang.
(2012). The changing comparative advantages of the Hong Kong watch industry,1950-2010. Kyoto Economic Review, 81(1), pp. 28–47.
(2014). A business history of the swatch group: The rebirth of Swiss watchmakingand the globalization of the luxury industry. Springer.
Feenstra, Robert C, Hong Ma, and Yuan Xu (2019). US exports and employment. Journalof International Economics, 120, pp. 46–58.
Feld, Lars P and Gebhard Kirchgassner (2001). Income tax competition at the state andlocal level in Switzerland. Regional Science and Urban Economics, 31(2-3), pp. 181–213.
39

FRED (2020a). Board of Governors of the Federal Reserve System (US), Japan / U.S.Foreign Exchange Rate [DEXJPUS], retrieved from FRED, Federal Reserve Bank of St.Louis. https://fred.stlouisfed.org/series/DEXJPUS.
(2020b). Board of Governors of the Federal Reserve System (US), Switzerland / U.S.Foreign Exchange Rate [DEXSZUS], retrieved from FRED, Federal Reserve Bank of St.Louis. https://fred.stlouisfed.org/series/DEXSZUS.
Fretz, Stephan, Raphael Parchet, and Frederic Robert-Nicoud (2017). Highways, marketaccess, and spatial sorting.Technical report.
FSO, Federal Statistical Office (2018). Labour market areas 2018: Explanatory report.(2019). Commuting. https://www.bfs.admin.ch/bfs/en/home/statistics/mobility-
transport/passenger-transport/commuting.html.Garufo, Francesco (2015). L’emploi du temps. L’industrie horlogere suisse et l’immigration
(1930-1980). Antipodes.Glaeser, Edward L and Joseph Gyourko (2005). Urban decline and durable housing. Journal
of political economy, 113(2), pp. 345–375.Glasmeier, Amy (1991). Technological discontinuities and flexible production networks: The
case of Switzerland and the world watch industry. Research policy, 20(5), pp. 469–485.(2000). Manufacturing Time: Global Competition in the Watch Industry, 1795-2000.
Guilford Press.Greenland, Andrew, John Lopresti, and Peter McHenry (2019). Import competition and
internal migration. Review of Economics and Statistics, 101(1), pp. 44–59.Hanlon, W Walker (2017). Temporary shocks and persistent effects in urban economies:
Evidence from British cities after the US Civil War. Review of Economics and Statistics,99(1), pp. 67–79.
Hirt, Sonia A (2015). Zoned in the USA. Cornell University Press.HSSO (2012a). Historical Statistics of Switzerland Table F.0. hsso.ch/2012/f/0.
(2012b). Historical Statistics of Switzerland Table F.10. hsso.ch/2012/f/10.(2012c). Historical Statistics of Switzerland Table G.4. hsso.ch/2012/g/4.(2012d). Historical Statistics of Switzerland Table K.12abc. hsso.ch/2012/k/12a.(2012e). Historical Statistics of Switzerland Table K.22b. hsso.ch/2012/k/22b.(2012f). Historical Statistics of Switzerland Table U.37a. hsso.ch/2012/u/37a.(2012g). Historical Statistics of Switzerland Table U.37b. hsso.ch/2012/u/37b.
Jaquet, Eugene and Alfred Chapuis (1970). Technique and history of the Swiss Watch. SpringBooks.
Katzenstein, Peter J (1980). Capitalism in one country? Switzerland in the internationaleconomy. International Organization, 34(4), pp. 507–540.
Kuhn, WE (1978). Guest workers as an automatic stabilizer of cyclical unemployment inSwitzerland and Germany. International Migration Review, 12(2), pp. 210–224.
Landes, David S (1983). Revolution in time: Clocks and the making of the modern world.Belknap Press of Harvard University Press Cambridge, MA.
Leimgruber, Matthieu (2018). The Historical Statistics of Switzerland, 1978-2018: A shorthistory.Technical report.
Leuba, Josephine (2019). Natural amenities and the spatial distribution of Swiss in-come.Technical report.
Manson, Steven, Jonathan Schroeder, David Van Riper, Tracy Kugler, and Steven Rug-gles (2021). IPUMS National Historical Geographic Information System: Version 16.0
40

[dataset]. http://doi.org/10.18128/D050.V16.0. Minneapolis, MN: IPUMS.Marrison, Warren A (1948). The evolution of the quartz crystal clock. The Bell System
Technical Journal, 27(3), pp. 510–588.Marti, Laurence (2007). A region in time: A socio-economic history of the Swiss valley of
St. Imier and the surrounding area, 1700-2007. Saint-Imier: Editions des Longines.MPC (2019). Minnesota Population Center: Integrated Public Use Microdata Series, Inter-
national: Version 7.2 [dataset]. https://doi.org/10.18128/D020.V7.2.Notowidigdo, Matthew J (2020). The incidence of local labor demand shocks. Journal of
Labor Economics, 38(3), pp. 687–725.Pritchard, Kathleen H (1997). Swiss Timepiece Makers 1775-1975, 2 vols. .Schmidheiny, Kurt (2017). Emerging lessons from half a century of fiscal federalism in
Switzerland. Swiss Journal of Economics and Statistics, 153(2), pp. 73–101.Stephens, Carlene and Maggie Dennis (2000). Engineering time: inventing the electronic
wristwatch. British Journal for the History of Science, 33(4), pp. 477–497.Thompson, Joe (2017). Four Revolutions Part 1: A Concise History Of The Quartz Rev-
olution. https://www.hodinkee.com/articles/four-revolutions-quartz-revolution. Accessed:01-20-2020.
Trueb, Lucien F. (2005). The world of watches: history, technology, industry. Ebner Pub-lishing International.
41

7. Appendix
Figure A1. CHF/USD and JPY/USD Exchange Rates
4060
8010
0E
xch
ange
Rat
e pe
r U
SD
(In
dex:
197
1=10
0)
1971 1973 1975 1977 1979 1981 1983 1985Year
CHF JPY
Figure A2. Employment in Watchmaking, 1900-2000
2040
6080
100
Nu
mbe
r of
Wor
kers
(in
th
ousa
nds
)
1900 1910 1920 1930 1940 1950 1960 1970 1980 1990 2000Year
Constructed HSSO Table K.22bGlasmeier Table 9.3 Donze Table 19Glasmeier Table 7.5 HSSO Table F.00HSSO Table F.10 Bedat
Data from multiple sources; see section 2.2.
42

Figure A3. Nominal Hourly Wages for Men across Industries, 1926-19830
510
1520
Nom
inal
Hou
rly
Wag
es fo
r M
en (C
HF)
1929 1935 1941 1947 1953 1959 1965 1971 1977 1983Year
All Industries Chemicals
(a) Chemicals.
05
1015
20N
omin
al H
ourl
y W
ages
for
Men
(CH
F)
1929 1935 1941 1947 1953 1959 1965 1971 1977 1983Year
All Industries Construction
(b) Construction.
05
1015
20N
omin
al H
ourl
y W
ages
for
Men
(CH
F)
1929 1935 1941 1947 1953 1959 1965 1971 1977 1983Year
All Industries Electricity
(c) Electricity.
05
1015
20N
omin
al H
ourl
y W
ages
for
Men
(CH
F)
1929 1935 1941 1947 1953 1959 1965 1971 1977 1983Year
All Industries Food
(d) Food.
05
1015
20N
omin
al H
ourl
y W
ages
for
Men
(CH
F)
1929 1935 1941 1947 1953 1959 1965 1971 1977 1983Year
All Industries Graphic Arts
(e) Graphic arts.
05
1015
20N
omin
al H
ourl
y W
ages
for
Men
(CH
F)
1929 1935 1941 1947 1953 1959 1965 1971 1977 1983Year
All Industries Metals and Machines
(f) Metals and machines.
05
1015
20N
omin
al H
ourl
y W
ages
for
Men
(CH
F)
1929 1935 1941 1947 1953 1959 1965 1971 1977 1983Year
All Industries Stone and Earth
(g) Stone and earth.
05
1015
20N
omin
al H
ourl
y W
ages
for
Men
(CH
F)
1929 1935 1941 1947 1953 1959 1965 1971 1977 1983Year
All Industries Textiles
(h) Textiles.
05
1015
20N
omin
al H
ourl
y W
ages
for
Men
(CH
F)
1929 1935 1941 1947 1953 1959 1965 1971 1977 1983Year
All Industries Watches and Jewelry
(i) Watches and jewelry.
05
1015
20N
omin
al H
ourl
y W
ages
for
Men
(CH
F)
1929 1935 1941 1947 1953 1959 1965 1971 1977 1983Year
All Industries Wood
(j) Wood.
Data from HSSO (2012c).
43

Figure A4. Distribution of Industrial Employment across Cantons, 19650
.1.2
.3.4
.5
% o
f Mfg
. Wor
kers
Em
ploy
edin
Ch
emic
al I
ndu
stry
AargauAppenzell (IR
)Appenzell (O
R)
Basel-Landschaft
Basel-Stadt
Berne
FribourgG
enevaG
larusG
risonsLucerneN
euchâtelN
idwalden
Obw
aldenSchaffhausenSchw
yzSolothurnSt. G
allenThurgauTicinoU
riV
alaisV
audZugZürich
(a) Chemicals.
0.1
.2.3
.4
% o
f Mfg
. Wor
kers
Em
ploy
edin
Clo
thin
g In
dust
ry
AargauAppenzell (IR
)Appenzell (O
R)
Basel-Landschaft
Basel-Stadt
Berne
FribourgG
enevaG
larusG
risonsLucerneN
euchâtelN
idwalden
Obw
aldenSchaffhausenSchw
yzSolothurnSt. G
allenThurgauTicinoU
riV
alaisV
audZugZürich
(b) Clothing.
0.1
.2.3
% o
f Mfg
. Wor
kers
Em
ploy
edin
Foo
d In
dust
ry
AargauAppenzell (IR
)Appenzell (O
R)
Basel-Landschaft
Basel-Stadt
Berne
FribourgG
enevaG
larusG
risonsLucerneN
euchâtelN
idwalden
Obw
aldenSchaffhausenSchw
yzSolothurnSt. G
allenThurgauTicinoU
riV
alaisV
audZugZürich
(c) Food, beverages, tobccco.
0.2
.4.6
.8
% o
f Mfg
. Wor
kers
Em
ploy
edin
Mac
hin
e In
dust
ry
AargauAppenzell (IR
)Appenzell (O
R)
Basel-Landschaft
Basel-Stadt
Berne
FribourgG
enevaG
larusG
risonsLucerneN
euchâtelN
idwalden
Obw
aldenSchaffhausenSchw
yzSolothurnSt. G
allenThurgauTicinoU
riV
alaisV
audZugZürich
(d) Machines and instruments.
0.1
.2.3
.4
% o
f Mfg
. Wor
kers
Em
ploy
edin
Met
al I
ndu
stry
AargauAppenzell (IR
)Appenzell (O
R)
Basel-Landschaft
Basel-Stadt
Berne
FribourgG
enevaG
larusG
risonsLucerneN
euchâtelN
idwalden
Obw
aldenSchaffhausenSchw
yzSolothurnSt. G
allenThurgauTicinoU
riV
alaisV
audZugZürich
(e) Metals.
0.0
5.1
.15
% o
f Mfg
. Wor
kers
Em
ploy
edin
Pri
nti
ng
Indu
stry
AargauAppenzell (IR
)Appenzell (O
R)
Basel-Landschaft
Basel-Stadt
Berne
FribourgG
enevaG
larusG
risonsLucerneN
euchâtelN
idwalden
Obw
aldenSchaffhausenSchw
yzSolothurnSt. G
allenThurgauTicinoU
riV
alaisV
audZugZürich
(f) Printing.
0.1
.2.3
.4
% o
f Mfg
. Wor
kers
Em
ploy
edin
Sto
ne
& E
arth
In
dust
ry
AargauAppenzell (IR
)Appenzell (O
R)
Basel-Landschaft
Basel-Stadt
Berne
FribourgG
enevaG
larusG
risonsLucerneN
euchâtelN
idwalden
Obw
aldenSchaffhausenSchw
yzSolothurnSt. G
allenThurgauTicinoU
riV
alaisV
audZugZürich
(g) Stone and earth.
0.2
.4.6
% o
f Mfg
. Wor
kers
Em
ploy
edin
Wat
chm
akin
g In
dust
ry
AargauAppenzell (IR
)Appenzell (O
R)
Basel-Landschaft
Basel-Stadt
Berne
FribourgG
enevaG
larusG
risonsLucerneN
euchâtelN
idwalden
Obw
aldenSchaffhausenSchw
yzSolothurnSt. G
allenThurgauTicinoU
riV
alaisV
audZugZürich
Watches and jewelry.
0.1
.2.3
.4.5
% o
f Mfg
. Wor
kers
Em
ploy
edin
Woo
d In
dust
ry
AargauAppenzell (IR
)Appenzell (O
R)
Basel-Landschaft
Basel-Stadt
Berne
FribourgG
enevaG
larusG
risonsLucerneN
euchâtelN
idwalden
Obw
aldenSchaffhausenSchw
yzSolothurnSt. G
allenThurgauTicinoU
riV
alaisV
audZugZürich
(h) Wood.
Data from HSSO (2012e).
Figure A5. Distribution of Municipal Growth Rates
01
23
4D
ensi
ty
-.5 0 .5Log Growth Rate
kdensity growth kdensity growth
(a) 1880-1970.
01
23
4
-.5 0 .5Log Growth Rate
Watch-producing municipalities Other municipalities
(b) 1970-1980.
01
23
4
-.5 0 .5Log Growth Rate
kdensity growth kdensity growth
(c) 1980-2000.
44

Figure A6. Income and Wealth Tax Rates across Cantonal Capitals, 1965-1989
05
10In
com
e Ta
x R
ate
(25k
)
196519701975198019851990Year
810
1214
16In
com
e Ta
x R
ate
(50k
)
196519701975198019851990Year
1820
2224
26In
com
e Ta
x R
ate
(200
k)
196519701975198019851990Year
01
23
45
Wea
lth
Tax
Rat
e (1
00k)
196519701975198019851990Year
34
56
7W
ealt
h T
ax R
ate
(500
k)
196519701975198019851990Year
45
67
8W
ealt
h T
ax R
ate
(100
0k)
196519701975198019851990Year
Neuchâtel SolothurnBern GenevaVaud All other cantons
Data from HSSO (2012f) and HSSO (2012g). Top three panels depict changes in income taxburdens (in percentage terms) for employed persons married without children across cantonalcapitals, assuming total incomes of 25,000 CHF, 50,000 CHF, and 200,000 CHF, respectively.Bottom three panels depict changes in wealth taxes (per thousand) for employed personsmarried without children across cantonal capitals, assuming total assets of 100,000 CHF,500,000 CHF, and 1,000,000 CHF, respectively.
45

Table A1. Cross-correlation table
% Watches % Chem. % Cloth % Food % Mach. % Metals % Print % Stone % Wood
% Watches 1.00% Chem. -0.16 1.00% Cloth -0.26 -0.20 1.00% Food -0.06 0.07 0.17 1.00% Mach. -0.13 -0.38 -0.42 -0.29 1.00% Metals -0.07 0.06 0.04 -0.41 -0.06 1.00% Print -0.08 0.30 0.07 0.17 -0.21 -0.25 1.00% Stone -0.22 -0.14 -0.22 -0.07 0.04 -0.29 -0.26 1.00% Wood -0.38 -0.21 0.11 0.08 -0.22 -0.32 0.02 0.29 1.00
Canton-level secondary-sector employment share correlations, 1965.
46