Embed Size (px)
Citation preview

Southern Illinois University CarbondaleOpenSIUC
Research Papers Graduate School
7-2014
Trade Policy Reforms in PakistanShahid KarimShahid Karim, [email protected]
Follow this and additional works at: http://opensiuc.lib.siu.edu/gs_rp
This Article is brought to you for free and open access by the Graduate School at OpenSIUC. It has been accepted for inclusion in Research Papers byan authorized administrator of OpenSIUC. For more information, please contact [email protected].
Recommended CitationKarim, Shahid. "Trade Policy Reforms in Pakistan." ( Jul 2014).
TRADE POLICY REFORMS IN PAKISTAN
by
Shahid Karim
BBA., Shaheed Zulfiqar Ali Bhutto Institute of Science and Technology, 2007
MBA., Shaheed Zulfiqar Ali Bhutto Institute of Science and Technology, 2010
A Research Paper
Submitted in Partial Fulfillment of the Requirements for the
Master of Science
Department of Economics
in the graduate school
Southern Illinois University Carbondale
December 2014

RESEARCH PAPER APPROVAL
TRADE POLICY REFORMS IN PAKISTAN
by
Shahid Karim
A Research Paper Submitted in Partial
Fulfillment of the Requirements
for the degree of
Master of Science
in the field of Economics
Approved by:
Dr. Sajal Lahiri
Graduate School
Southern Illinois University Carbondale
July 07, 2014

i
AN ABSTRACT OF THE RESEARCH PAPER OF
SHAHID KARIM, for the MASTER OF SCIENCE degree in ECONOMICS, at Southern Illinois
University Carbondale.
TITLE: TRADE POLICY REFORMS IN PAKISTAN
MAJOR PROFESSOR: Dr. Sajal Lahiri
This paper examines the trade policy reforms in both import and export sectors of
Pakistan and provides a critical analysis of the measures undertaken during various regimes to
liberalize the economy. The paper discusses the relevant theoretical and empirical research and
attempts to evaluate the existing tariff structure under various trade liberalization regimes and
substantiate, with the statistics in view of the trade theory, relevant reports and research papers.
Alongside it also discusses the tax reforms relevant to trade policy, while briefly discussing key
concerns and challenges faced by the policy makers in both formulation and implementation of
tariff reforms, such as, lobbying of special interest groups, government revenue constraints and
illegal trade across the borders. Finally, it gives an account of export sector and discusses reasons
for its weak performance despite government interventions.

ii
ACKNOWLEDGEMENTS
I would like express my sincere gratitude to my research adviser Professor Sajal Lahir for
the invaluable guidance before and during the completion of my Master's research paper. I am
privileged to having worked under his tutelage and developing a deep appreciation for the
subject, which I hope will guide me at every stage in my academic and professional career.
Finally, I would like to remember my late father for his love, affection and for everything
that he has done for me.
iii
TABLE OF CONTENTS
CHAPTER PAGE
ABSTRACT .................................................................................................................................... i
ACKNOWLEDGEMENTS ........................................................................................................... ii
LIST OF TABLES ........................................................................................................................ iv
LIST OF FIGURES ........................................................................................................................ v
CHAPTERS
CHAPTER 1 - INTRODUCTION ......................................................................................1
CHAPTER 2 - LITERATURE REVIEW ...........................................................................3
CHAPTER 3 - TARIFF REFORMS.................................................................................. 5
CHAPTER 4 - EXPORT PROMOTION POLICIES ...................................................... 12
CHAPTER 5 - CONCLUSION ........................................................................................17
REFERENCES ..............................................................................................................................19
VITA ..............................................................................................................................................21

iv
LIST OF TABLES
TABLE PAGE
Table 1 .............................................................................................................................................7
Table 2 .............................................................................................................................................8
Table 3 ...........................................................................................................................................10
Table 4 ...........................................................................................................................................11
Table 5 ...........................................................................................................................................14

v
LIST OF FIGURES
FIGURE PAGE
Figure 1 ............................................................................................................................................9

1
1. INTRODUCTION
International trade has been an increasingly important tool for achieving economic
growth. Pakistan, among many developing countries has already embarked on policies for trade
liberalization inter alia economic reforms to minimize both the direct and indirect barriers to
trade and pave way for the economic development . Historically, Pakistan adopted protectionist
and import substitution policies with objective to achieve self-sufficiency and shelter its
domestic industry from foreign competition. Major policy reforms were introduced in 1988 in
the name of Structural Adjustment and Stabilization Programs (SAP) to rationalize the tariff
structure and improving the efficiency of domestic manufacturing. By 2003 the maximum tariff
were brought down to 25 percent1; while owing to the WTO obligations all traditional
quantitative restriction were eliminated by the same year.
The liberalization reforms continued and drastic changes were made in agricultural sector
to eliminate government monopolies and interventions to boost the exports. This was followed
by real exchange devaluation of about 20 percent between 2003-2007 which caused exports to
grow at 110 percent in nominal USD in 2008 compared to 2002 level. However, some of the
reforms, notably of agriculture, wheat, sugar and fertilizers were retracted after the financial
crises of 2008. The list also includes rigorously implementing anti-dumping and local content
requirement policies. (Pursell et al: 2011).
The challenges for trade reforms generally come from the concern for the loss of tariff
revenue from reduction of trade taxes and this issue has been addressed by proportionately
increasing the direct taxes to offset the revenue loss. The paper also aims at discussing the issue
1 This excludes the outliers, such as automobile and alcoholic beverages.

2
of smuggling and illegal trade in Pakistan due to porous borders with neighboring countries, such
as Afghanistan, Iran and India.

3
2. LITERATURE REVIEW
Pakistan like many other developing countries started to move away from the ISI strategy
and embarked on trade liberalization programs starting in late 1980s and efforts to reduce tariffs
and other indirect trade taxes continued till 2006. Significant efforts were ensured to liberalize
trade during this period and maximum tariff of 225 percent in 1990-1991 was slashed down to 25
percent by 2003 resulting in average tariff rate of 11 percent compared to 65 percent in 1990-
1991. However, the pace of these reforms have been relatively sluggish and in 2008 there was a
backtracking on some of the policies, and as a result, a number of Regulatory Duties (RDs) were
introduced on top of the Custom Duties (CDs). Pursell et al (2011) believe that Pakistan started
relying more and more on Statutory Regulatory Orders (SROs) from 2006 that provided
exemptions and partial exemptions from normal tariffs, while they increased tariffs on other
tariff lines to complicated the tariff structure. Moreover, the authors believe that preferential
trade agreements, especially with China and other South Asian Countries under SAFTA, both
implemented from January 2006 resulted in further complication of the tariff structure. Other key
factors obstructing the way for trade liberalization include, the concern for impact of tariff
revenue and effect on special interest groups that lobby for protectionist policies. However,
subsequent studies2 have showed that under certain conditions reducing tariffs would be welfare
improving rather than welfare reducing and these studies have provided rationale for reduction of
tariffs.
Lahiri et al (2000) calculated the optimal tariffs for intermediate input of steel in
industrial manufacturing and noted that the then existing tariffs were very high. Based on the
findings of their theoretical model the authors believed that further reduction in tariffs on steel
2 Kenzo Abe. (1992), Lahiri and Nasim. (2005), Lahiri et al. (2000), Naito (2005), Keen and Ligthart. (2002
Woodland (1982), Hatzipanayotou et al. (1994)

4
was desirable to stimulate the manufacturing sector and preventing the cross-border smuggling.
In a similar paper Lahiri and Nasim (2005) discuss the welfare effects of replacing tariffs by
consumption tax in a revenue-neutralizing way and suggest that reducing tariffs on intermediate
goods and increasing consumption tax is welfare improving. Similarly, Naito (2005) suggests
that growth, revenue and welfare gains could be attained by combining consumer-price-neutral
tariff and tax reforms for growth enhancement with additional rise in the consumption tax on the
less distorted good. These results hint that many of the tariff rates fall on the decreasing (right)
side of the Laffer curve3. According to an estimate, for example a 10 percent reduction in tariff
on sheet steel would increase the imports of sheet steel by 18 percent; hence a reduction of tariffs
would unambiguously increases the tariff revenue rather than decreasing the tariff revenue.4
The results of theoretical findings related to the loss of tariff revenue are further
substantiated by the empirical study of Pritchett and Sethi (1993) which shows that tariff rates
and tariff revenues were unrelated. The authors compared the official tariff rates with collected
rate of tariffs (import tax revenue to import value) and noted that differences in official tariff
rates only explain a quarter of the variation in collected rates and increase in official tariff rate
above a certain level shows no increase in the collected rate, rather it decreased in some cases
when tested for Pakistan, Jamaica and Keyna. The paper noted that for Pakistan the mean
collected rate for the 899 items with a tariff rate of 80 percent is 51 percent with a standard
deviation of 31. Strikingly, one quarter of the 80 percent tariff rate items paid duty less than 21
percent whereas for 495 items having 100 percent tariff rate paid less than 7 percent. The authors
explain that import value decreases with increase in tariff rates because of under-
invoicing/smuggling and due to presence of exemptions. Pursell et al. (2011) argue that
3 The Khaldun-Laffer curve is a graphical representation of the relationship between possible rates of taxation and
the resulting levels of government revenue 4 S. Lahiri at al. (2000)
5
smuggling and under-invoicing in Pakistan is stronger for consumer durable goods due to lack of
provision for sales tax credit that is applied to the use or resale of imported intermediate goods.
M. Pitt (1981) showed that smuggling is welfare-increasing vis-a-vis the non-smuggling
situation. However, in Pakistan smuggling is prevalent also because of the porous borders that
are practically impossible control on a full scale, especially, with Afghanistan that historically
remained a free-trade economy.5
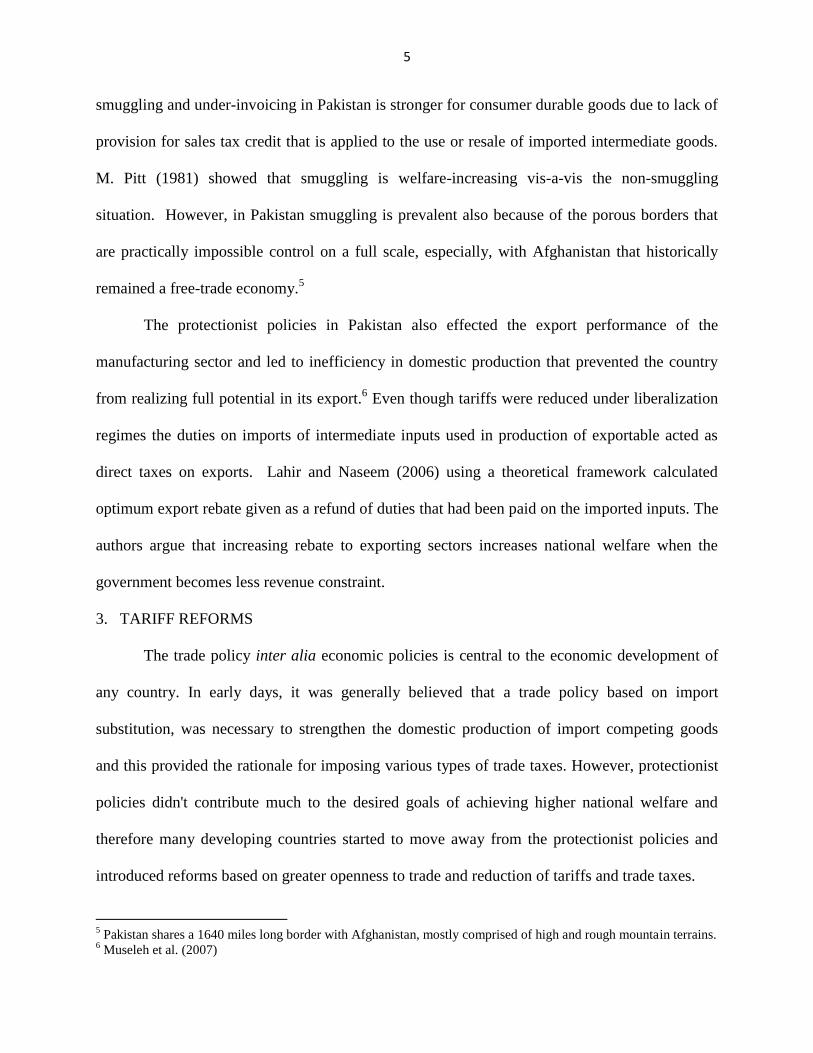
The protectionist policies in Pakistan also effected the export performance of the
manufacturing sector and led to inefficiency in domestic production that prevented the country
from realizing full potential in its export.6 Even though tariffs were reduced under liberalization
regimes the duties on imports of intermediate inputs used in production of exportable acted as
direct taxes on exports. Lahir and Naseem (2006) using a theoretical framework calculated
optimum export rebate given as a refund of duties that had been paid on the imported inputs. The
authors argue that increasing rebate to exporting sectors increases national welfare when the
government becomes less revenue constraint.
3. TARIFF REFORMS
The trade policy inter alia economic policies is central to the economic development of
any country. In early days, it was generally believed that a trade policy based on import
substitution, was necessary to strengthen the domestic production of import competing goods
and this provided the rationale for imposing various types of trade taxes. However, protectionist
policies didn't contribute much to the desired goals of achieving higher national welfare and
therefore many developing countries started to move away from the protectionist policies and
introduced reforms based on greater openness to trade and reduction of tariffs and trade taxes.
5 Pakistan shares a 1640 miles long border with Afghanistan, mostly comprised of high and rough mountain terrains.
6 Museleh et al. (2007)
6
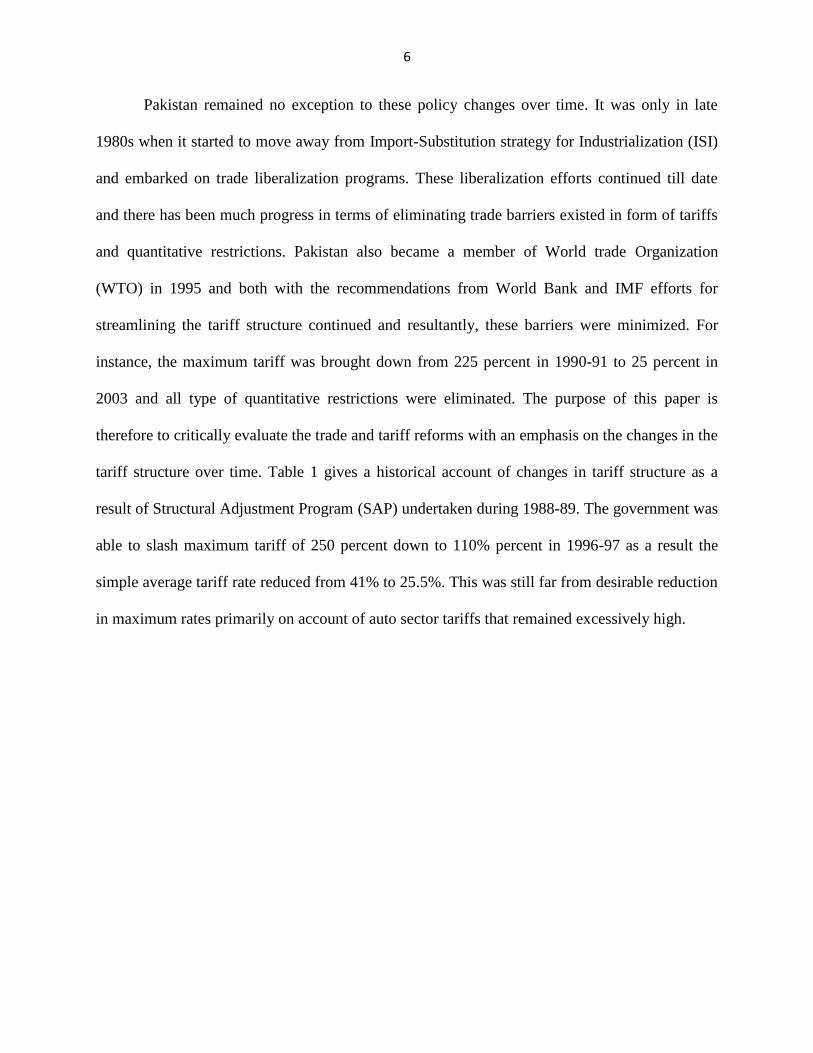
Pakistan remained no exception to these policy changes over time. It was only in late
1980s when it started to move away from Import-Substitution strategy for Industrialization (ISI)
and embarked on trade liberalization programs. These liberalization efforts continued till date
and there has been much progress in terms of eliminating trade barriers existed in form of tariffs
and quantitative restrictions. Pakistan also became a member of World trade Organization
(WTO) in 1995 and both with the recommendations from World Bank and IMF efforts for
streamlining the tariff structure continued and resultantly, these barriers were minimized. For
instance, the maximum tariff was brought down from 225 percent in 1990-91 to 25 percent in
2003 and all type of quantitative restrictions were eliminated. The purpose of this paper is
therefore to critically evaluate the trade and tariff reforms with an emphasis on the changes in the
tariff structure over time. Table 1 gives a historical account of changes in tariff structure as a
result of Structural Adjustment Program (SAP) undertaken during 1988-89. The government was
able to slash maximum tariff of 250 percent down to 110% percent in 1996-97 as a result the
simple average tariff rate reduced from 41% to 25.5%. This was still far from desirable reduction
in maximum rates primarily on account of auto sector tariffs that remained excessively high.

7
Table 1
Changes in Pattern of Tariff Structure7
Tariff Rate (%)
Year Minimum Maximum
Average (Un-
weighted)
1987-88 13.3 250 40.7
1988-89 16.1 155.2 36
1989-90 10 128.6 39.7
1990-91 12.6 151.2 39
1991-92 12.1 181 32.6
1992-93 17.7 270.1 35.3
1993-94 13.4 166.7 34.7
1994-95 0.3 128.6 21.6
1995-96 0.5 110.3 25.5
The period between 1996-97 to 2003-04 marks a crucial epoch of drastic trade
liberalization in the history of Pakistan. The simple average rate of industrial tariffs steadily
decreased over time from 20.2 percent in 2001-02 to 17.9 percent in 2004-05 followed by a
reduction of maximum tariff slabs to 5. However, the normal maximum tariff was raised to 50 %
(excluding automobile sector) and the maximum tariff slabs increased to 9 during 2009-10. As a
result of these further reforms tariff rates continuously along with import restrictions. Table 2
exhibits the disaggregated tariff structure measured in terms of Effectively Applied Rate. It can
been seen that the tariff rates decreased over time. Also, it is evident that mostly the consumer
goods and manufacturing sector enjoyed a higher protection.
7 Iqbal and Siddiqui (2001) based on CBR Year Book, 1995-96.

8
Table 2
Sector-wise changes in Tariff Structure
PRODUCT CAT.
Effectively Applied Rate (%)
2001 2002 2003 2004 2005 2006 2007 2008 2009
Manufactured goods, ores
and metals 20.34 17.25 16.86 16.16 14.6 14.76 14.85 14.09 14.63
Ores and metals 12.93 11.52 10.67 10.5 10.1 10.07 9.66 8.11 7.82
Manufactured goods 20.62 17.46 17.08 16.37 14.75 14.91 15.01 14.29 14.86
Chemical products 17.05 15.55 15.14 13.75 11.48 11.55 11.2 10.74 11.78
Machinery and transport
equipment 20.19 16.64 16.2 15.51 14.09 14.36 13.75 13.06 13.45
Other manufactured goods 23.1 19.22 18.9 18.58 16.88 16.94 17.52 16.7 17.2 Source: UNCTAD Statistics
The most important of the trade taxes on imports is the custom duty levied on the foreign
goods coming into a home country. Besides acting as an important tool for import substitution
custom duty remains a key source of revenue and despite rationalization of tariff structure and
broad-basing of taxation in Pakistan in the recent year, the customs duty still shares a major
chunk in revenue generation for the country. The share of custom duties in direct and indirect tax
revenue remained as high as 12 percent and 19 percent (39 percent in 1990-91), respectively, for
the year 2011-12.8 On the other hand the governments reliance on direct taxes, such as, sales tax
remained increasing over time to recompense the government from the loss of revenue
associated with reduction of tariffs. Moreover, there is also an increasing trend in collection of
direct taxes that historically remained very low. The total revenue from direct taxes from as low
as Rs.100 billion in 1999-00 exceeded the mark of Rs.700 billion in 2012-13 (38.2 percent share
in total revenue). Figure 1 juxtaposes the change in relative shares of custom duties and sales tax
in total tax revenue.
8 FBR Year Book, 2012

9
Figure 1
Relative Share of Custom Duty and Sales Tax in Total Tax Revenue
Source: Handbook of Statistics on Pakistan Economy, SBP
A careful analysis of the structure of custom duties reveal that only fifteen commodities
forms the majority share in total gross receipts, with automobile sector at top of the list followed
by the POL products. This situation raises concerns regarding the concentration of tariffs in few
industries exhibiting stronger protection and lack of implementation of the liberalization reforms
in these sectors. This could be further substantiated from the existing maximum custom duty on
vehicles which to date remains as high as 100 percent.9 In terms of tariff rates there were total
6969 number of tariff lines for the year 2013 whose range wise distribution is given in Table 3.
9 Source: Pakistan tariff budget 2013-14, Federal Board of Revenue.
-
5.00
10.00
15.00
20.00
25.00
30.00
35.00
40.00
FY7
9
FY8
2
FY8
5
FY8
8
FY9
1
FY9
4
FY9
7
FY0
0
FY0
3
FY0
6
FY0
9
Custom Duty Share
Sale Tax Share

10
Table 3
Range Wise Distribution of Tariff Structure
Duty Range (Percent) No of Lines Percent of Lines
Duty Free 441 6
Less than 0.1 0 0
0.1 - 05 2358 34
5.1 - 10 955 14
10.1 - 15 494 7
15.1 - 20 884 13
20.1 - 25 1113 16
25.1 - 30 369 5
30.1 - 35 267 4
Over 35 88 1
Total 6969 100
Historically, the distribution of tariff rates remained varying for each duty range. In 2001-
02 about 10 percent tariff lines were in the range of less than 5 percent which steadily increased
to 17 percent in 2002-03 and 25 percent during the year 2004-05. Similarly, about 32 percent of
the tariff lines fell in the duty range between 5 to 10 percent in 2001-02 which due to reduction
of tariffs over time decreased to 26 percent and 21 percent for the years 2002-03 and 2004-05,
respectively. Consequently, the tariff range over 25 percent also showed a steady decline from
more than 39 percent in 2001-02 to about 36 percent in 2004-05
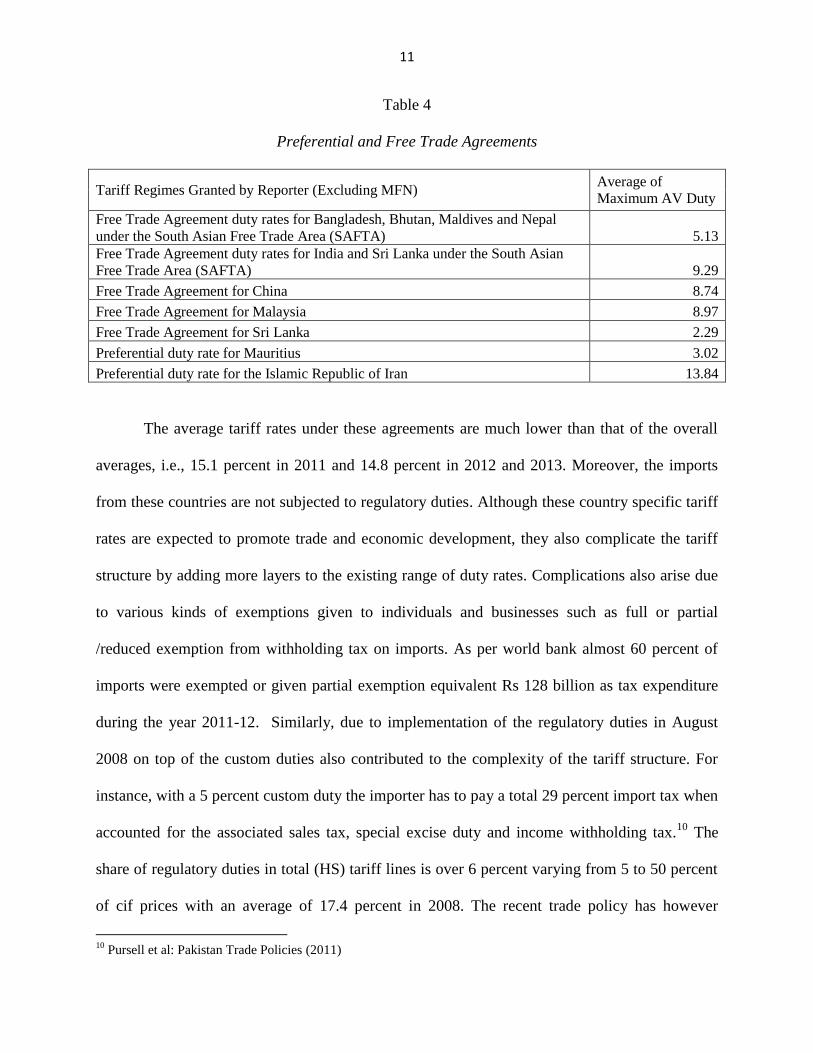
Pakistan also signed various preferential trade agreements with different regional
organizations such SAFTA and free trade agreements with China, Sri Lanka, Iran etc. Table 4
summarizes the average tariff rates as a result of these trade agreements based on WTO's tariff
data for the year 2011.
11
Table 4
Preferential and Free Trade Agreements
Tariff Regimes Granted by Reporter (Excluding MFN) Average of
Maximum AV Duty
Free Trade Agreement duty rates for Bangladesh, Bhutan, Maldives and Nepal
under the South Asian Free Trade Area (SAFTA) 5.13
Free Trade Agreement duty rates for India and Sri Lanka under the South Asian
Free Trade Area (SAFTA) 9.29
Free Trade Agreement for China 8.74
Free Trade Agreement for Malaysia 8.97
Free Trade Agreement for Sri Lanka 2.29
Preferential duty rate for Mauritius 3.02
Preferential duty rate for the Islamic Republic of Iran 13.84
The average tariff rates under these agreements are much lower than that of the overall
averages, i.e., 15.1 percent in 2011 and 14.8 percent in 2012 and 2013. Moreover, the imports
from these countries are not subjected to regulatory duties. Although these country specific tariff
rates are expected to promote trade and economic development, they also complicate the tariff
structure by adding more layers to the existing range of duty rates. Complications also arise due
to various kinds of exemptions given to individuals and businesses such as full or partial
/reduced exemption from withholding tax on imports. As per world bank almost 60 percent of
imports were exempted or given partial exemption equivalent Rs 128 billion as tax expenditure
during the year 2011-12. Similarly, due to implementation of the regulatory duties in August
2008 on top of the custom duties also contributed to the complexity of the tariff structure. For
instance, with a 5 percent custom duty the importer has to pay a total 29 percent import tax when
accounted for the associated sales tax, special excise duty and income withholding tax.10
The
share of regulatory duties in total (HS) tariff lines is over 6 percent varying from 5 to 50 percent
of cif prices with an average of 17.4 percent in 2008. The recent trade policy has however
10
Pursell et al: Pakistan Trade Policies (2011)

12
announced its commitment that by the end of 2016-17 it will implement MFN tariff rate of four
slabs and eliminate SROs to stimulate to stimulate growth and competition.
Another concern for the policy making was the tariffs on intermediate which cause anti-
export bias by hampering the economic efficiency of the domestic industry. In order to tackle
this problem reducing the import taxes on machinery has been one of the prime objectives of the
trade policies. Except for the imports related to fresh fruits (HS 08) most intermediate products
are given exemption from the regulatory duties and range of tariffs on these intermediate inputs
is between 0 to 5 percent. This could be one of the reasons why consumer durable goods are
subject to higher tariffs than industrial inputs. Although the cuts in import taxes on raw inputs
increases domestic competition and discourages the local production and the government has to
weigh associated costs and benefits from such a policy initiative. According to a study11
published by Ministry of Commerce (2007) it is believed that consequent to the changes in tariff
structure the cost structure of all industrial sectors have undergone drastic change, especially,
from reducing input tariffs, that is, productivity gains from reducing input tariffs is higher than
that of reducing output tariffs. However the report does not specify any relevant study to
substantiate the claim but it appears plausible according to the economic theory that lower costs
lead to higher production efficiency.
4. EXPORT PROMOTION POLICIES
Export promotion has been at the heart of the trade liberalization policies in Pakistan.
Historically, the exports have been performing poorly on account of inter-alia import
substituting policies, including over-valued exchanged which caused anti-export biases. The
protectionist policies have provided strong disincentives to exports by increasing the profitability
of import substitutes relative to exports and induced shift of recourse from export sector. Another
11
Study on Effective Protection of Manufacturing Industries In Pakistan, Ministry of Commerce 2007.

13
type of anti-export biases existed due to the escalation of tariff structure - lower tariffs on
intermediate inputs and higher tariffs on processed goods has led to an increase in the effective
protection of import substitutes. For instance, the maximum tariff rate for intermediate goods is
05 percent compared to 25 percent tariff rate on intermediate goods that are locally
manufactured. The presence of these policies have continuously deteriorated the balance of trade
over time. At a broader level it can be observed that exports share in total trade increased from
35 percent in 1985-86 to 48 percent in 2002-03 which eventually reverted back to 35 percent in
2012-13. However, in value terms the gap between imports and exports kept widening and
peaked to USD 21.3 billion in 2011-2012 which decreased to USD 20.5 billion in 2012-2013.
Exports grow at an average of 4.6 percent annually from 1987-88 to 2012-13 compared to 6.6
percent growth in imports.
The structure of Pakistan's exports is highly concentrated in just three sectors, with cotton
related exports alone contributing to the about 50 percent in the total exports, followed by rice
and leather exports each having a share in total exports of 8.8 and 4.8 percent, respectively, for
the year 2011-12. The government's statistics indicate that the share of these three items has been
declining over time from 71.5 percent in 2006-07 exhibiting some degree of diversification in
overall exports. The intense competition from China, India and Bangladesh in world market for
Pakistan's textile products coupled with domestic issues of law and order, power shortages and
exchange rate fluctuations are key challenges for Pakistan's exports making diversification more
desirable in the long run. One of the avenues for enriching the structure of exports is through
promoting services exports and so far services export has not been encouraging even though it
contributes to 55 percent of the country's GDP.
14
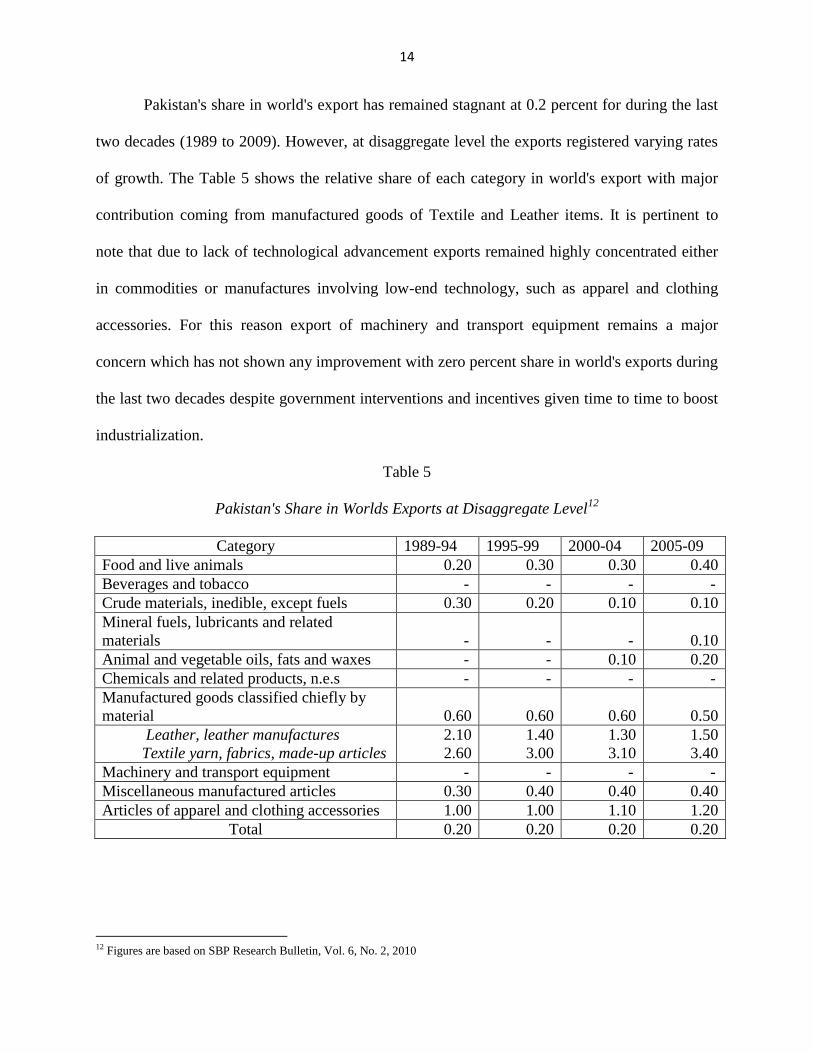
Pakistan's share in world's export has remained stagnant at 0.2 percent for during the last
two decades (1989 to 2009). However, at disaggregate level the exports registered varying rates
of growth. The Table 5 shows the relative share of each category in world's export with major
contribution coming from manufactured goods of Textile and Leather items. It is pertinent to
note that due to lack of technological advancement exports remained highly concentrated either
in commodities or manufactures involving low-end technology, such as apparel and clothing
accessories. For this reason export of machinery and transport equipment remains a major
concern which has not shown any improvement with zero percent share in world's exports during
the last two decades despite government interventions and incentives given time to time to boost
industrialization.
Table 5
Pakistan's Share in Worlds Exports at Disaggregate Level12
Category 1989-94 1995-99 2000-04 2005-09
Food and live animals 0.20 0.30 0.30 0.40
Beverages and tobacco - - - -
Crude materials, inedible, except fuels 0.30 0.20 0.10 0.10
Mineral fuels, lubricants and related
materials - - - 0.10
Animal and vegetable oils, fats and waxes - - 0.10 0.20
Chemicals and related products, n.e.s - - - -
Manufactured goods classified chiefly by
material 0.60 0.60 0.60 0.50
Leather, leather manufactures
Textile yarn, fabrics, made-up articles
2.10
2.60
1.40
3.00
1.30
3.10
1.50
3.40
Machinery and transport equipment - - - -
Miscellaneous manufactured articles 0.30 0.40 0.40 0.40
Articles of apparel and clothing accessories 1.00 1.00 1.10 1.20
Total 0.20 0.20 0.20 0.20
12 Figures are based on SBP Research Bulletin, Vol. 6, No. 2, 2010

15
Historically, the weak performance of exports and growing burden of foreign debt have
been key concern for the policy making. Incentives were given the industrial sector in order to
deal with these issues and promoting industrialization to achieve economic growth. One of the
first major incentives was the Export Bonus Scheme started during 1960s to subsidize
manufactured goods by providing bonus vouchers and which also introduced multiple exchange
rates. One study estimates that this scheme accounted for more than 80 percent of total subsidies
(Kemal: 1978). This scheme was discontinued in 1972 after devaluation of the Pak rupee.
Meanwhile, preferential credit was also made available to exporters on case to case basis to help
meet their financing needs. The major policy initiatives were introduced in form of the rebate
scheme started during 1960s and Export Refinance Scheme (ERS) which kicked off in 1973 to
facilitate the non-traditional and emerging commodities. Later on all manufactured goods were
included in 1977 to allow exporters avail credit facility at subsidized rates that were lower than
the market rates by 0.5 percent in 1994 and 7.4 percent in 1994; the gap however reduced to a
fixed rate of 2 percent in 2004.13
Similarly, rebates and refunds are given mainly on account of
duties paid the exporters on raw inputs used in manufacturing of exportable goods.
According to Lahir and Nasim (2006) these duties have acted as a direct tax on exports
and caused anti-export biases. The authors observed that when government is less revenue
concerned increasing rebates is welfare improving. Despite the tariff rationalization reforms
started in 1987-88 the rebates were expected to decline; however their share as a fraction of total
exports remained increasing till 1992-93 and reaching as high as 5.82 percent of exports.
However, the impact of these incentives on exports remains a still a concern. In their time series
analysis Haque and Kemal (2007) investigated impact of these subsidy schemes in Pakistan and
13
These figures are based on the study of Haque and Kemal (2007).

16
noted that the results were insignificant and recommended to policy reforms should reassess the
existing export promotion schemes.
Among various other challenges for promoting exports the menace of over-invoicing in
export sector remained customary in Pakistan, which exploited these incentives given to the
exporters. Mahmood and Azhar (2001) discusses the associated financial loss caused by the
illicit practice of over-invoicing and undermined the effectiveness of the export promotion
policies in Pakistan. The study recommends that in order to safeguard other exporters who are
not involved in the illegal practice of over-invoicing the government should take appropriate
steps in form of increasing scrutiny and documentation of individual cases entitled for rebate
scheme.
The creation of Export Promotion Zones (EPZs) via EPZ ordinance in 1980 was another
effort to accelerate the pace of industrialization in Pakistan and to enhance the volume of the
exports by providing an enabling environment to both domestic and foreign investors. The major
incentives give to businesses operating in these zones included: Duty-free import of machinery,
equipment and material; exemption from national import and exchange control regulations and
exemption from sales tax on input goods including gas and electricity. These special zones also
enjoy certain facilities such as, availability of water, gas, electricity and peaceful environment
(which are basics for any industrial unit in Pakistan). Currently, there are 10 EPZs out of which
08 are operational.
In line with above export promotion policy adopted from time to time the Strategic Trade
Policy Framework 2012-15 highlights further commitment to improve the country's export
performance. The major aspects of this framework include, facilitating the development of e-
commerce, establishment of Export Import Bank (EXIMBANK) and providing full (100 percent)

17
and partial (50 percent) subsidies on cost of plants and machinery to improve the cost efficiency
of firms operating in Pakistan. Moreover, the government also aims at exploring new markets to
export its manpower which historically has been contributing significantly in form of foreign
remittances. Pakistan ranks 7th
in terms of largest recipient of officially recorded remittances in
the world where remittances cover more than 30 percent of exports. However, the success of
these initiatives would depend however on the effectiveness and timeliness of implementation of
the framework in order to achieve the desired goals.
5. CONCLUSION
Pakistan adopted ISI strategy for industrialization and enforced various kind of trade
barriers to provide protection to the domestic industry. The protectionist policies remained in
place for a very long period until it was realized that openness to trade was necessary to achieve
the desirable goals of economic development and prosperity. The protectionist policies were
observed but they did not contribute much in terms of economic growth and instead resulted in
anti-export biases that negatively affected the export sector. The liberalization reforms started in
1980s and subsequently in late 1990s with efforts from donor agencies, such as World Bank,
IMF and WTO stirred growth in many sectors, especially during the period from 1997-98 till
2002-03. These efforts led to rationalization of tariff structure and implementation of policies
related export promotion; however, Pakistan is still far from full liberalization. Despite these
efforts the existing tariff structure remains complicated and requires serious considerations to
streamline the trade policy, especially, the existing maximum tariff should be reduced and
protectionist policies in automobile sector should be revised to enhance competition and growth
of the sector. Furthermore, the trade policy also needs to be reassessed in terms of high tariff

18
rates on consumer goods compared to intermediate industrial inputs so that undue burden of high
consumer prices could be reduced.

19
REFERENCES
Abe, K. (1992). “Tariff Reform in a Small Open Economy with Public Production” International
Economic Review 33, 209–222.
Alan D. Woodland. (1982.) "International Trade and Resource Allocation" North-Holland,
Amsterdam and New York.
Government of Pakistan. CBR Year Book (various issues). Islamabad: Central Board of Revenue.
Government of Pakistan. Economic Survey (various issues). Islamabad: Finance Division.
Government of Pakistan. "Effective Protection of Manufacturing Industries In Pakistan"
Islamabad: The Ministry of Commerce.
Government of Pakistan. Pakistan Statistical Survey 2013. Islamabad: Federal Bureau of
Statistics.
Government of Pakistan. Trade Policy speeches (various issues). The Trade Development
Authority of Pakistan.
Hatzipanayotou, Panos, Michael S. Michael and Stephen M. Miller, “Win-Win Indirect Tax
Reform: A Modest Proposal,” Economics Letters 44 (1994):147-51.
Hussain, F. (2010), Pakistan’s Exports Demand: A Disaggregated Analysis. SBP Research
Bulletin, Vol. 6, No. 2.
Kemal, A. R. (1978) An Analysis of Industrial Efficiency in Pakistan: 1959-60 to 1969-70.
Unpublished Ph.D. Thesis, University of Manchester.
Keen, M. and J. E. Ligthart. (2002). “Coordinating Tariff Reduction and Domestic Tax Reform,”
Journal of International Economics 56, 489–507.
Lahiri, S., A. Nasim and J. Ghani. (2000). “Optimal Second-Best Tariffs on an Intermediate
Input with Particular Reference to Pakistan,” Journal of Development Economics 61, 393–416.

20
Lahiri, S., & Nasim, A. (2005). Commercial policy reform in Pakistan: Opening up the economy
under revenue constraints. International Tax and Public Finance, 12, 723–739.
Lahiri, S., & Nasim, A. (2005). Export-promotion under revenue constraints The case of tariff-
rebate on intermediate inputs in Pakistan. Journal of Asian Economics 17 (2006) 285–293.
Mahmood, Z., and M. Azhar (2001) On Overinvoicing of Exports in Pakistan. The Pakistan
Development Review 40:3, 173–85.
Museleh et al. (2007). Recent Experience and Future Prospects of Pakistan's Trade with China.
Lahore Journal of Economics.
Nadeem Ul Haque & M. Ali Kemal, 2007. "Impact of Export Subsidies on Pakistan's Exports,"
PIDE-Working Papers 2007:26, Pakistan Institute of Development Economics.
Pitt, Mark M., 1981. "Smuggling and price disparity," Journal of International Economics,
Elsevier, vol. 11(4), pages 447-458, November.
Pritchett, Lant & Sethi, Geeta, 1993. "Tariff rates, tariff revenue, and tariff reform : some new
facts," Policy Research Working Paper Series 1143, The World Bank.
Pursell, Garry, Ashraf Khan, and Saad Gulzar (2011). “Pakistan’s trade policies: future
directions.” International Growth Center Working Paper.
Siddiqui, Rizwana, and Zafar Iqbal (1999). "Tariff Reduction and Functional Income
Distribution in Pakistan: A CGE Model. Paper presented at the workshop on Micro Impact of
Macroeconomic Adjustment Policies," November 9, 1999, Islamabad, Pakistan.

21
VITA
Graduate School
Southern Illinois University
Shahid Karim
Shaheed Zulfiqar Ali Bhutto Institute of Science and Technology
Bachelor of Business Administration, May 2007
Shaheed Zulfiqar Ali Bhutto Institute of Science and Technology
Master of Business Administration, May 2010
Special Honors and Awards:
Fulbright Scholarship, 2012-2014
Research Paper Title: Trade Policy Reforms in Pakistan
Major Professor: Dr. Sajal Lahiri