Embed Size (px)
Citation preview
ECONOMISTS HAVE LONG RECOG-nized the gains from internationaltrade; the study of these gains is
where modern economics began. Over centuries,international trade has brought together remoteparts of the world and different civilizations, helpeddisseminate knowledge and ideas, and shaped thecourse of regions and nations. Rapid reductions intransport and communications costs accelerated thistrend in the 19th century, and international tradereached unprecedented levels at the beginning ofthe 20th century.Trade declined, however, follow-ing the two World Wars, the 1929 crisis, and theworldwide increase in protectionism.
A reversal in protectionism started after WorldWar II among the industrialized countries, andspread to the developing countries in the 1970s.Trade reforms were further expanded and consoli-dated in the 1980s and 1990s across the developingworld: in South Asia, East Asia, Latin America, East-ern Europe, and, to a lesser extent, in Africa and theMiddle East.Yet in the 1990s, the results of tradereform have varied and sometimes fallen short ofexpectations. Critics of the economic and socialeffects of globalization have also become morevocal. Why have some trade liberalizations beenreversed, and why have others brought prosperity,opportunities, and economic diversification? Isthere still a role for the protection of infant indus-tries in growth strategies? Does trade liberalizationlead to economic growth? Finally, does trade liber-alization improve or reduce poverty?
Drawing on the experience and academicresearch of the 1990s, this chapter identifies fivelessons:
• Openness to trade has been a central element ofsuccessful growth strategies. In all countries thathave sustained growth the share of trade in grossdomestic product (GDP) has increased,and tradebarriers have been reduced.
• Trade is an opportunity, not a guarantee.Whiletrade reforms can help accelerate integration inthe world economy and strengthen an effectivegrowth strategy, they cannot ensure its success.Other elements that address binding constraintsto growth are needed, possibly including soundmacroeconomic management, trade-relatedinfrastructure and institutions, and economy-wide investments in human capital and infra-structure.
• There are many possible ways to open an econ-omy.The challenge for policy makers is to iden-tify which best suits their country’s politicaleconomy, institutional constraints, and initialconditions.As these vary from country to coun-try, it is not surprising that there is a striking het-erogeneity in country experiences regarding thetiming and pace of reforms. Different countrieshave opened up different sectors at differentspeeds (for example Bangladesh and India); oth-ers have achieved partial liberalization throughthe establishment of export processing zones (for
Trade Liberalization:Why So Much Controversy?
133
Chapter 5
measured as a share of exports in GDP—is nowlarger in developing than in developed countries.Another important trend is the shift in the compo-sition of developing-country exports toward man-ufactures. Countries whose incomes were low in1980 have managed to raise their exports of manu-factures from about 20 percent of their total exportsto more than 80 percent.1
Virtually all successful economies have increasedtheir openness to trade. In part because successfultrade reforms have been introduced in conjunctionwith other policy initiatives, it is difficult empiri-cally to identify the growth effect of trade policyalone, compared with the growth effect of otherpolicy initiatives, and to disentangle whether tradecauses growth or growth causes trade.As an econ-omy accumulates physical and human capital, shiftsits comparative advantage toward more capital-intensive activities, and becomes internationallycompetitive in a wider range of goods and services,it will inevitably trade more. But is higher trade theresult or the cause of its growth? Most likely bothprocesses are at work.This section reviews the evi-dence on these questions and then argues for theneed to pursue trade reform as part of a compre-hensive growth strategy. Openness to the globaleconomy has helped efficiency and growth in manycases (East and South Asian countries, Botswana,Chile, Mauritius,Tunisia), but it has failed to do soin many others.These experiences do not necessar-ily imply that less trade reform would have beendesirable, but that trade reform must be done andsequenced sensibly, as part of an effective growthstrategy.
The 1990s:An OverviewReforms in the 1980s and 1990s were the origin ofa strong expansion in international trade (box 5.1).As detailed in chapter 3, developing countries arenow more integrated with the world economy thanare high-income countries.
The integration of labor emerged as anotherimportant issue on the globalization agenda duringthe 1990s. In 2001, developing countries received
E C O N O M I C G ROW T H I N T H E 1 9 9 0 s134
example China and Mauritius); and yet othershave combined unilateral trade reforms withparticipation in regional trade agreements (forexample Estonia).
• The distributive effects of trade liberalization arediverse, and not always pro-poor.Trade reformswere expected to increase the incomes of theunskilled in countries with a comparative advan-tage in producing unskilled-intensive goods.Yetevidence from the 1990s suggests that even ininstances where trade policy has reducedpoverty, there are still distributive issues. Oneimportant policy lesson is that countries need tohelp workers affected move out of contracting(import-competing) sectors into expanding(exporting) sectors.This is an issue relevant toboth developing and industrialized countries.
• The preservation and expansion of the worldtrade system hinges on its ability to strike a bet-ter balance between the interests of industrial-ized and developing countries. Global marketsare the most hostile to the products produced bythe world’s poor—such as agricultural productsand textiles and apparel.The problems of escalat-ing tariffs, tariff peaks, and quota arrangementssystematically deny the poor market access andskew the incentives against adding value in poorcountries. These problems can be addressedthrough collective action, best pursued throughthe Doha Round and the World Trade Organi-zation.Although there is a role for nonreciprocalpreferences and for reciprocal regionalapproaches, this comes at a cost to excludedcountries, is arbitrary and political, and thus isnot first best in terms of generating the rightincentives for investment.
1. Trade Reform As a Componentof a Successful Growth Strategy
This chapter begins by reviewing key changes intrade policy, trade volumes, and the composition oftrade in the 1990s. One striking fact is that trade—
T R A D E L I B E R A L I Z AT I O N : W H Y S O M U C H C O N T ROV E R S Y ? 135
BOX 5.1
Trade Policy over the Centuries
Protection of domestic industries has a long his-tory. In the 12th century, for example, to main-tain the competitive edge of their textile
industries, Flanders and England restricted the move-ment of experienced weavers. In the 13th century, Eng-land enacted laws restricting the types and origin offabrics certain individuals could wear. In 16th and 17thcentury France, the state promoted selected industries,through import protection, direct ownership, or subsi-dies, as did Japan later during the Meiji period. Whilethe protection of domestic industries took variousforms—such as subsidized capital, or monopoly ormonopsony rights—protection from imports was themost widely used and became particularly importantafter the start of the industrial revolution. During the1800s and first half of the 1900s, tariffs on imports inindustrial countries were as high as 30–50 percent(World Bank, World Development Report 1991).
Many developing countries pursued import substitu-tion industrialization strategies in the three decadesthat followed World War II, but by the mid-1980s, mostdeveloping countries were seeking to reduce theirimport protection and liberalize trade. Three develop-ments had raised doubts about the long-run effective-ness of strategies based on import protection. First, inthe 1960s, the Republic of Korea and Taiwan (China)had begun adopting export-oriented growth strategiesthat not only yielded superior economic performance,but also helped these two economies to withstand thesevere interest rate and oil price shocks of the 1970s.Second, high tariffs, administrative restrictions, andrationing of foreign exchange and of import licensescreated high returns to rent seeking, reinforcing vestedinterests and an environment that stimulated corrup-tion and weakened national institutions. The results,including state capture by vested interests and the mis-use of government discretion, discredited import sub-stitution strategies even among economists whobelieved in the strategic importance of import substi-
tution in the initial phases of industrialization. Third,growth strategies based on import substitution proveddifficult to implement in practice, and the practical andpolitical aspects of implementation often negated mostof the expected gains (Balassa 1971; Little, Scitovsky,and Scott 1970). High nominal tariffs often providednegative protection to emerging activities and protec-tion to activities with negative value added, and con-tributed to misallocation and underutilization ofcapital in capital-scarce economies. Overvaluation ofthe exchange rate resulting from import restrictionsdiscouraged exports and penalized agriculture—furtherreducing the size of the market for import-competingindustries.
As a result, during the 1980s and 1990s virtually alldeveloping countries followed the examples set by Sin-gapore, Hong Kong (China), Korea, and Taiwan (China):encouraging exports and reducing levels of protection.Industrialization based on import protection was grad-ually discredited and, starting in the mid-1980s, mostdeveloping countries sought to reduce levels of importprotection and liberalize trade. Chile and Sri Lanka wereamong the first liberalizers, having started already inthe 1970s. Argentina and Uruguay followed shortlythereafter. By the early 1990s, researchers and policymakers generally accepted the superiority of outwardorientation over import substitution as a developmentstrategy.a Trade liberalization expanded in the 1990s,leading to increased integration of developingeconomies in world trade. The fall of communism inCentral and Eastern Europe, together with the collapseof the former Soviet Union, reinforced this view. Coun-tries that had not already embarked on liberalizationbegan to do so now, while others scaled up theirefforts. They included hitherto very highly protectedand inward-looking economies such as India, and coun-tries in Sub-Saharan Africa that looked to integrationwith the world economy as a key instrument for revers-ing hitherto dismal growth performance.
(Box continues on the following page.)
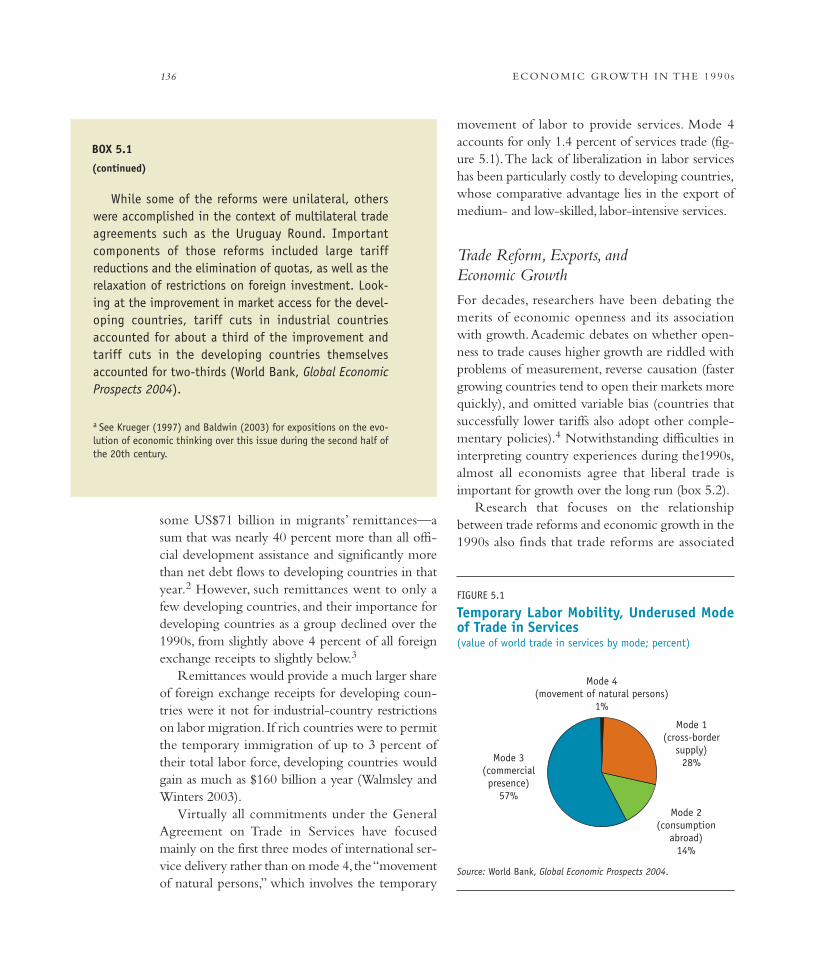
movement of labor to provide services. Mode 4accounts for only 1.4 percent of services trade (fig-ure 5.1).The lack of liberalization in labor serviceshas been particularly costly to developing countries,whose comparative advantage lies in the export ofmedium- and low-skilled, labor-intensive services.
Trade Reform, Exports, and Economic GrowthFor decades, researchers have been debating themerits of economic openness and its associationwith growth.Academic debates on whether open-ness to trade causes higher growth are riddled withproblems of measurement, reverse causation (fastergrowing countries tend to open their markets morequickly), and omitted variable bias (countries thatsuccessfully lower tariffs also adopt other comple-mentary policies).4 Notwithstanding difficulties ininterpreting country experiences during the1990s,almost all economists agree that liberal trade isimportant for growth over the long run (box 5.2).
Research that focuses on the relationshipbetween trade reforms and economic growth in the1990s also finds that trade reforms are associated
E C O N O M I C G ROW T H I N T H E 1 9 9 0 s136
some US$71 billion in migrants’ remittances—asum that was nearly 40 percent more than all offi-cial development assistance and significantly morethan net debt flows to developing countries in thatyear.2 However, such remittances went to only afew developing countries, and their importance fordeveloping countries as a group declined over the1990s, from slightly above 4 percent of all foreignexchange receipts to slightly below.3
Remittances would provide a much larger shareof foreign exchange receipts for developing coun-tries were it not for industrial-country restrictionson labor migration. If rich countries were to permitthe temporary immigration of up to 3 percent oftheir total labor force, developing countries wouldgain as much as $160 billion a year (Walmsley andWinters 2003).
Virtually all commitments under the GeneralAgreement on Trade in Services have focusedmainly on the first three modes of international ser-vice delivery rather than on mode 4, the “movementof natural persons,” which involves the temporary
BOX 5.1
(continued)
While some of the reforms were unilateral, otherswere accomplished in the context of multilateral tradeagreements such as the Uruguay Round. Importantcomponents of those reforms included large tariffreductions and the elimination of quotas, as well as therelaxation of restrictions on foreign investment. Look-ing at the improvement in market access for the devel-oping countries, tariff cuts in industrial countriesaccounted for about a third of the improvement andtariff cuts in the developing countries themselvesaccounted for two-thirds (World Bank, Global EconomicProspects 2004).
a See Krueger (1997) and Baldwin (2003) for expositions on the evo-lution of economic thinking over this issue during the second half ofthe 20th century.
Mode 4(movement of natural persons)
1%
Mode 1(cross-border
supply)28%Mode 3
(commercialpresence)
57%
Mode 2(consumption
abroad)14%
FIGURE 5.1
Temporary Labor Mobility, Underused Modeof Trade in Services(value of world trade in services by mode; percent)
Source: World Bank, Global Economic Prospects 2004.
T R A D E L I B E R A L I Z AT I O N : W H Y S O M U C H C O N T ROV E R S Y ? 137
BOX 5.2
The Trade and Growth Debate
The debate among economists and policy mak-ers over the relationship between trade andgrowth has risen to prominence during the
last few years, owing on the one hand to the mixedgrowth outcomes of developing countries that haveundergone extensive trade liberalization and, on theother hand, to differences over data, econometrictechniques, and model specifications among profes-sional economists.
The resurgence of interest in the 1990s amongeconomists on the impact of trade on growth can beattributed to the significant improvements that havetaken place in endogenous growth theory as well asto the availability of more comprehensive data andnew econometric techniques. According to the newgrowth theory (attributed to Romer 1986; Lucas1987; and Grossman and Helpman 1992), whetherimport protection raises or lowers the growth ratedepends on the pattern of imports and exports. Econ-omists on both sides of the debate accept that as amatter of theory the relationship between trade andgrowth is ambiguous. The issue is hence an empiricalone, which has become the focus of the debate in thelast few years.
The launching of the debate can be attributed toRodriguez and Rodrik (2000) (RR) and Harrison andHanson (1999) (HH) who reviewed a number of empir-ical studies in the 1990s. While HH showed that theSachs and Warner (1995) study reflected the gains frommacroeconomic stability rather than trade reform, RRreviewed a number of studies, including Dollar (1992),Sachs and Warner (1995), and Edwards (1998). RRexpressed doubt “that there is a strong negative rela-tionship in the data between trade barriers and eco-nomic growth, at least for levels of trade restrictionsobserved in practice,” viewing “the search for such a
relationship futile.” A unique feature of the HH and RRanalyses was their use of the various authors’ actualdata sets in testing the robustness of their results. HHand RR criticized the empirical studies on datagrounds, on model-specification grounds, and ongrounds of econometric techniques. Data problemsincluded, among others, the use of poor measures oftrade barriers (including the World Bank’s classifica-tion of trade regimes, which they criticized as subjec-tive in Edwards’ paper), and the use of measures thatare highly correlated with other sources of bad eco-nomic performance such as poor exchange rate man-agement (as in Dollar’s and Sachs and Warner’s papers).Separately, Rodrik also criticized one of the morerecent papers on the topic, Dollar and Kraay (2001) ondata and model-specification grounds. The data prob-lem arises from the combination of policy measures(tariff averages) with outcome measures (imports as ashare of GDP). The model specification problem arisesfrom regressing income on trade shares when both areendogenous (outcome variables).
• Notwithstanding these criticisms, it would be safeto say that most authors agree on the following:First, that trade protection is not good for economicgrowth. Even RR themselves state in their paper thatthey have seen no credible evidence to support thenotion that trade protection is good for economicgrowth, at least for the post-1945 period.
• Second, that trade openness by itself is not suffi-cient for growth. RR argue in their paper thatresearchers and policy makers have been overstat-ing the systematic evidence in favor of trade open-ness, when what is really necessary is to furtheridentify the connection between trade and eco-nomic growth.
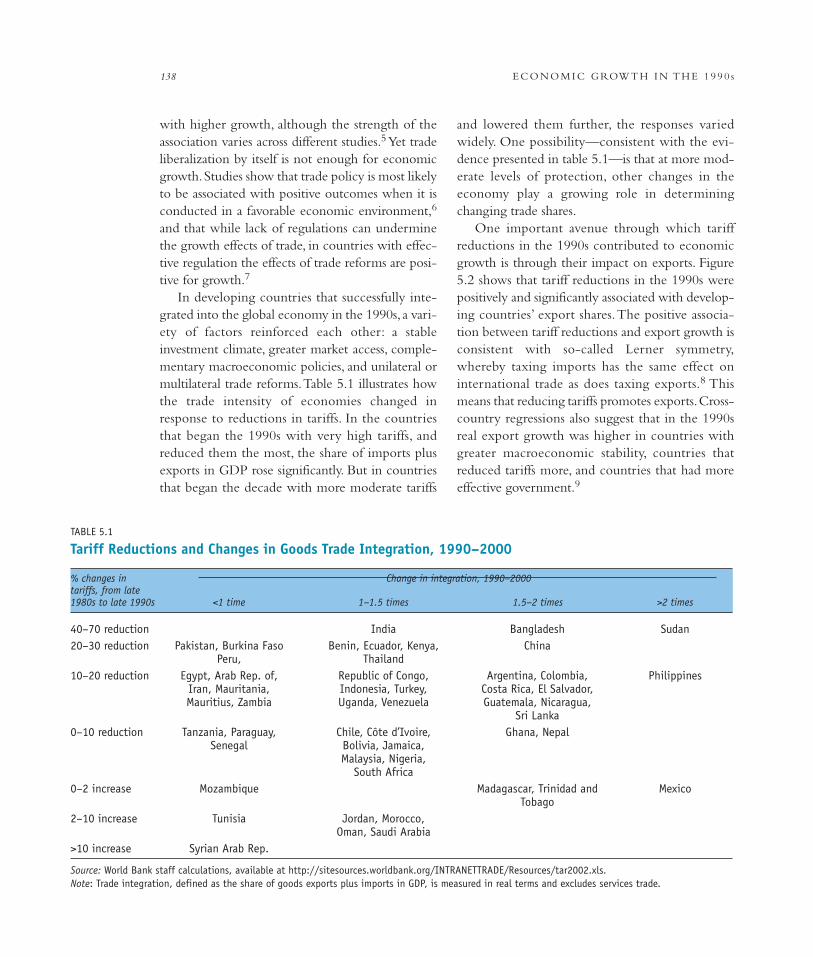
and lowered them further, the responses variedwidely. One possibility—consistent with the evi-dence presented in table 5.1—is that at more mod-erate levels of protection, other changes in theeconomy play a growing role in determiningchanging trade shares.
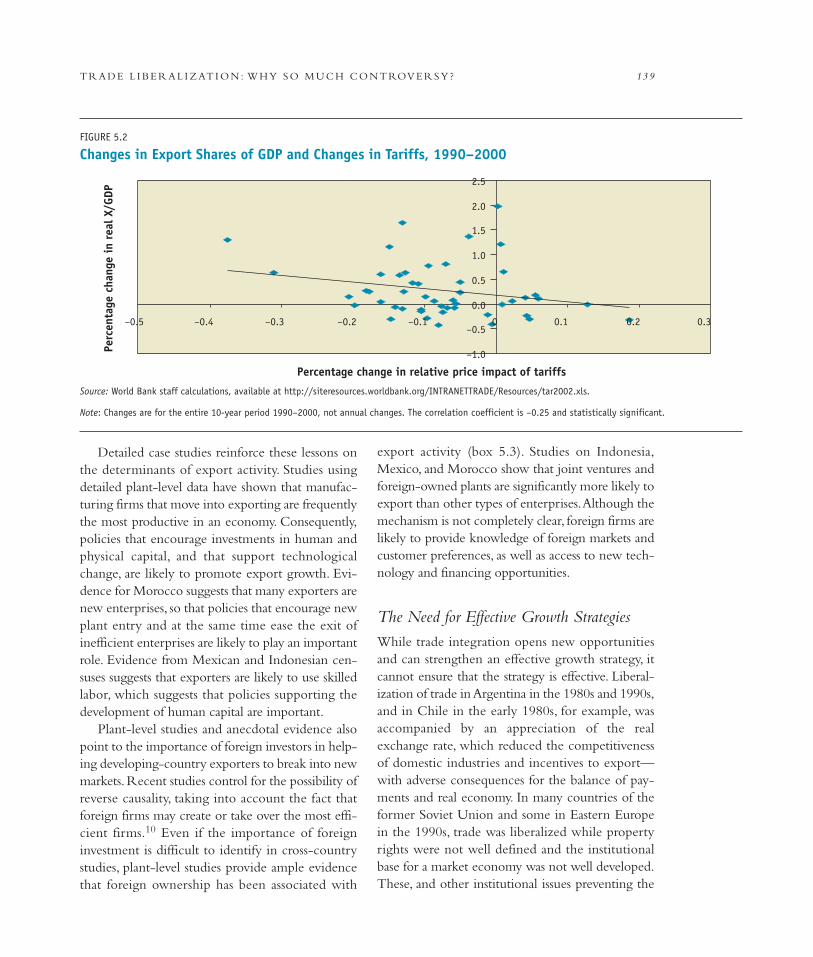
One important avenue through which tariffreductions in the 1990s contributed to economicgrowth is through their impact on exports. Figure5.2 shows that tariff reductions in the 1990s werepositively and significantly associated with develop-ing countries’ export shares.The positive associa-tion between tariff reductions and export growth isconsistent with so-called Lerner symmetry,whereby taxing imports has the same effect oninternational trade as does taxing exports.8 Thismeans that reducing tariffs promotes exports.Cross-country regressions also suggest that in the 1990sreal export growth was higher in countries withgreater macroeconomic stability, countries thatreduced tariffs more, and countries that had moreeffective government.9
with higher growth, although the strength of theassociation varies across different studies.5 Yet tradeliberalization by itself is not enough for economicgrowth.Studies show that trade policy is most likelyto be associated with positive outcomes when it isconducted in a favorable economic environment,6
and that while lack of regulations can underminethe growth effects of trade, in countries with effec-tive regulation the effects of trade reforms are posi-tive for growth.7
In developing countries that successfully inte-grated into the global economy in the 1990s, a vari-ety of factors reinforced each other: a stableinvestment climate, greater market access, comple-mentary macroeconomic policies, and unilateral ormultilateral trade reforms.Table 5.1 illustrates howthe trade intensity of economies changed inresponse to reductions in tariffs. In the countriesthat began the 1990s with very high tariffs, andreduced them the most, the share of imports plusexports in GDP rose significantly. But in countriesthat began the decade with more moderate tariffs
E C O N O M I C G ROW T H I N T H E 1 9 9 0 s138
TABLE 5.1
Tariff Reductions and Changes in Goods Trade Integration, 1990–2000
% changes in Change in integration, 1990–2000tariffs, from late 1980s to late 1990s <1 time 1–1.5 times 1.5–2 times >2 times
40–70 reduction India Bangladesh Sudan 20–30 reduction Pakistan, Burkina Faso Benin, Ecuador, Kenya, China
Peru, Thailand10–20 reduction Egypt, Arab Rep. of, Republic of Congo, Argentina, Colombia, Philippines
Iran, Mauritania, Indonesia, Turkey, Costa Rica, El Salvador, Mauritius, Zambia Uganda, Venezuela Guatemala, Nicaragua,
Sri Lanka0–10 reduction Tanzania, Paraguay, Chile, Côte d’Ivoire, Ghana, Nepal
Senegal Bolivia, Jamaica, Malaysia, Nigeria,
South Africa0–2 increase Mozambique Madagascar, Trinidad and Mexico
Tobago 2–10 increase Tunisia Jordan, Morocco,
Oman, Saudi Arabia>10 increase Syrian Arab Rep.
Source: World Bank staff calculations, available at http://sitesources.worldbank.org/INTRANETTRADE/Resources/tar2002.xls.Note: Trade integration, defined as the share of goods exports plus imports in GDP, is measured in real terms and excludes services trade.
T R A D E L I B E R A L I Z AT I O N : W H Y S O M U C H C O N T ROV E R S Y ? 139
Detailed case studies reinforce these lessons onthe determinants of export activity. Studies usingdetailed plant-level data have shown that manufac-turing firms that move into exporting are frequentlythe most productive in an economy. Consequently,policies that encourage investments in human andphysical capital, and that support technologicalchange, are likely to promote export growth. Evi-dence for Morocco suggests that many exporters arenew enterprises, so that policies that encourage newplant entry and at the same time ease the exit ofinefficient enterprises are likely to play an importantrole. Evidence from Mexican and Indonesian cen-suses suggests that exporters are likely to use skilledlabor, which suggests that policies supporting thedevelopment of human capital are important.
Plant-level studies and anecdotal evidence alsopoint to the importance of foreign investors in help-ing developing-country exporters to break into newmarkets.Recent studies control for the possibility ofreverse causality, taking into account the fact thatforeign firms may create or take over the most effi-cient firms.10 Even if the importance of foreigninvestment is difficult to identify in cross-countrystudies, plant-level studies provide ample evidencethat foreign ownership has been associated with
export activity (box 5.3). Studies on Indonesia,Mexico, and Morocco show that joint ventures andforeign-owned plants are significantly more likely toexport than other types of enterprises.Although themechanism is not completely clear, foreign firms arelikely to provide knowledge of foreign markets andcustomer preferences, as well as access to new tech-nology and financing opportunities.
The Need for Effective Growth StrategiesWhile trade integration opens new opportunitiesand can strengthen an effective growth strategy, itcannot ensure that the strategy is effective. Liberal-ization of trade in Argentina in the 1980s and 1990s,and in Chile in the early 1980s, for example, wasaccompanied by an appreciation of the realexchange rate, which reduced the competitivenessof domestic industries and incentives to export—with adverse consequences for the balance of pay-ments and real economy. In many countries of theformer Soviet Union and some in Eastern Europein the 1990s, trade was liberalized while propertyrights were not well defined and the institutionalbase for a market economy was not well developed.These, and other institutional issues preventing the
–1.0
–0.5
0.0
0.5
1.0
1.5
2.0
2.5
–0.5 –0.4 –0.3 –0.2 –0.1 0 0.1 0.2 0.3
Percentage change in relative price impact of tariffs
Perc
enta
ge c
hang
e in
rea
l X/G
DP
FIGURE 5.2
Changes in Export Shares of GDP and Changes in Tariffs, 1990–2000
Source: World Bank staff calculations, available at http://siteresources.worldbank.org/INTRANETTRADE/Resources/tar2002.xls.
Note: Changes are for the entire 10-year period 1990–2000, not annual changes. The correlation coefficient is –0.25 and statistically significant.
building of trade-related infrastructure and institu-tions, economywide investments in physical andhuman capital, greater access to developed- anddeveloping-country markets, and maintenance of asound rule of law. Because these elements are oftendifficult to implement, there has been excessiveemphasis on trade policy alone, rather than as a com-
E C O N O M I C G ROW T H I N T H E 1 9 9 0 s140
free movement of resources, often meant that tradereforms did not expand economic opportunities butrestricted them instead (Bolaky and Freund 2004).
Trade reforms are most likely to stimulate growthwhen they are part of a comprehensive strategy.Important elements of an effective growth strategycan include sound macroeconomic management,
BOX 5.3
The Impact of Foreign Direct Investment on Growth
Foreign direct investment (FDI) has been animportant force in the global integration ofnational economies. Countries welcome FDI for
many reasons. Capital-scarce countries benefit from theinfusion of a less volatile source of capital. Greaterinvestment financed by incoming FDI should also trans-late into higher growth. Foreign investors are expectedto provide employment opportunities, better wages andworking conditions, and more training. Many countriesgive foreign firms and joint ventures special treatmentin the expectation that these firms will transfer newtechnology and knowledge to domestic workers andfirms.
The cross-country evidence on the relationshipbetween FDI and growth is mixed, in part becauseincoming FDI as a share of GDP is typically quite small.A cross-country study using data for 72 countries for1960–95 (Carkovic and Levine 2002) finds no evidencethat FDI exerts a positive impact on economic growthindependent of other growth determinants (openness,black market premium, financial development, initialincome, years of schooling). However, Bosworth andCollins (1999) find that FDI, by raising total factor pro-ductivity, raises a country’s rate of output growth.Borenzstein et al. (1998) find that FDI adds to capitalaccumulation and raises the efficiency of investment,but only where the host country has a minimum level ofhuman capital—an indicator of absorptive capacity.The Borenzstein study is consistent with evidence thatsuggests FDI can promote growth if the country hascomplementary institutions such as developed financial
markets (Alfaro et al. 2000) or is open to trade (Bala-subramanyam, Salisu, and Dapsoford 1996).
A number of studies use micro-data to analyze therole of FDI in promoting technology transfer and rais-ing host country wages (see, for example, World Bank,Global Development Finance 2000; Aitken and Harrison1999; Haddad and Harrison 1993; Djankov and Hoek-man 2000; Konings 2000; and Damijan et al. 2003).They provide a mixed picture. However, they all agreethat affiliates of foreign firms are more productive thanindigenous firms. While part of these results couldreflect the fact that foreign firms acquire more efficientdomestic enterprises, anecdotal evidence also suggeststhat local firms acquired by foreign investors undergorestructuring and improve their performance as a resultof the takeover. This direct effect should not beignored, because its magnitude may be significant.Other evidence also suggests that foreign enterprisespay higher wages (Aitken, Hanson, and Harrison 1997)and are more likely to comply with local labor standards(Harrison and Scorse 2003).
In sum, while quite a lot of evidence suggests thatFDI is positively associated with growth, there is noconsensus on the issue, and in particular no consensuson the direction of causality. Regardless of whether FDIindependently contributes to growth, it is clear thatpolicies and institutions that are important for growthwould also be the ones that would attract FDI as wellas enhance the impact of FDI on growth. Therefore,countries should focus on such policies and institutionsrather than narrowly on how to attract FDI.
ponent of an overall growth strategy. In addition tofreeing markets and ensuring the institutional foun-dation of a market economy, governments may alsoneed to address market failures that impede a supplyresponse. Identifying which industries warrant spe-cial treatment is highly risky, and the experience ofthe last few decades is riddled with attempts to cor-rect market failures that became more costly than thefailures themselves.At the same time, however, gov-ernments have learned how to structure interven-tions in a manner that can reduce the risks of captureand failure.
Although many factors contributed to the risein trade integration in the 1990s, as discussed above,for brevity the following discussion is selective. Itfocuses on two critical complementary areas:macroeconomic stability and trade-related infra-structure and institutions.
Macroeconomic StabilityMacroeconomic stability is an important elementin successful outcomes from trade reforms.11
Macroeconomic stability entails low levels of infla-tion and a stable and competitive exchange rate.Exchange rate volatility creates a risky businessenvironment in which future profits and paymentsare uncertain,and these risks are higher in the manydeveloping countries that have not developedfinancial instruments for hedging against foreignexchange risk.
Successful exchange rate management requires,among other things,appropriate sequencing of tradereforms and capital account liberalization. Experi-ence has shown that capital account liberalizationshould follow, not precede, the liberalization oftrade, because the large inflows of capital that gen-erally follow the freeing of the capital account couldcause a large appreciation of the real exchange rate,leading to large import surges that destabilizedomestic industries and the balance of payments.
India’s appropriate sequencing of trade reforms,as well as its maintenance of a stable macroeco-nomic framework, contributed to its impressiveexport and growth performance in the 1990s(World Bank 1994b). Before starting to liberalize
T R A D E L I B E R A L I Z AT I O N : W H Y S O M U C H C O N T ROV E R S Y ? 141
trade, in the early 1990s India allowed a significantdepreciation of the real exchange rate,which servedto increase export incentives and cushion theimpact of lower import barriers on domestic indus-try.Trade liberalization preceded the opening of thecapital account. Since 1992, India’s real effectiveexchange rate has remained at more or less the samelevel, facilitating trade reforms.
In Zambia, by contrast,macroeconomic instabil-ity undermined the potentially positive effects ofstructural reforms. Trade and other structuralreforms in the early 1990s gave Zambia one of themost liberal trade regimes in Africa, but export per-formance has been lackluster.An important reason ismacroeconomic instability, with high inflation andhigh real interest rates, as well as a highly volatile realexchange rate.The latter reflected Zambia’s unsuc-cessful management of the large declines that tookplace in 1995 and 1997 in the prices of copper, itsmain export (World Bank 2003n). In Malawi, too,macroeconomic instability undermined export andgrowth performance. During the 1990s, high andvolatile inflation,averaging 31 percent, resulted in anovervalued and highly volatile real exchange rate,seriously undermining domestic production, invest-ment, and exports. Malawi’s manufacturing sectorcontracted by 9 percent during 1995–96. Thesedevelopments hindered Malawi’s efforts to diversifyits exports out of tobacco,where they remain highlyconcentrated (World Bank 2003h).
Trade-Related Infrastructure and InstitutionsSuccessful trade integration requires supportiveinfrastructure and institutions—the so-calledbehind-the-border agenda.12 A comparison ofJamaica and Mauritius illustrates the importance ofinstitutions, as well as macroeconomic stability (box5.4).Two other important constraints are transportinfrastructure and institutional capacity for meetingproduct standards. Globally, improvements in trans-port and communications, in conjunction withdeveloping-country reforms, have allowed the pro-duction chain to be broken up into components,with some developing countries playing a key rolein global production sharing, as noted in chapter 3.
growth potential of the poorest countries, whereagriculture supplies 15 to 52 percent of GDP. Inaddition, since most of the poor reside in rural areas,these constraints have serious negative effects onpoverty. For exporters in some developing coun-tries, transport is the single most important compo-
E C O N O M I C G ROW T H I N T H E 1 9 9 0 s142
In many other countries, however, transportremains a key bottleneck. Markets that are isolatedmay feature little competition and may fail to real-ize economies of scale or scope.The result is typi-cally a vicious cycle of low productivity and lowprofitability. Such constraints severely limit the
BOX 5.4
Jamaica and Mauritius: Institutions and Macroeconomic Stability Make the Difference
Jamaica and Mauritius had nearly the same per capitaGDP in 1984. But between 1984 and 2000, real percapita GDP grew at about 4.8 percent a year in Mau-
ritius, compared with only 0.7 percent in Jamaica. Thisis a dramatic difference in performance, given the manysimilarities between the two countries.
Both countries have similar natural endowments andhistorical legacies. Both are island economies, have trop-ical climates, are subject to natural shocks (hurricanes inJamaica and cyclones in Mauritius), and are former Britishcolonies with English as the official language. Their eco-nomic structures are similar, with about 6 percent of GDPfrom agriculture, about one-third from industry, and theremaining 60 percent or so from services. Sugarcane iswidely grown in both countries, and both enjoy preferen-tial access to the European Union and the United Statesfor sugar exports. Both established export-processingzones centered on garment manufacturing, with the pri-mary impetus provided by East Asian investors.
The disparate growth performance cannot be attrib-uted to differences in trade: between 1985 and 2000,real annual growth of exports was 3.9 percent in Mau-ritius and 3.6 percent in Jamaica, and by 2000, tradeaccounted for a larger share of GDP in Jamaica than inMauritius. Jamaica has geographic advantages fortrade, being much closer to the United States and theEuropean Union than Mauritius is to either. Jamaicasurpasses Mauritius in education enrollment indicators.And through the 1990s, Jamaica enjoyed higher FDI asa share of GDP than Mauritius.
Two factors that may explain the difference ingrowth performance are institutional quality and
macroeconomic stability. Subramanian and Roy (2001)point to Mauritius’s superior institutions (democracyand strong participatory institutions), and ethnic diver-sity, which provided important links to the rest of theworld (68 percent of the population is Indian), and theneed for participatory political institutions that wereimportant for maintaining stability, rule of law, andmediating conflict. Looking at indicators of institu-tional quality (Kaufman, Kraay, and Zoido-Lobaton2002), Mauritius outperforms Jamaica in all but one(regulatory quality): Mauritius does better in govern-ment effectiveness, political stability, rule of law, con-trol of corruption, and voice. The rule of law is aparticular problem in Jamaica, with crime and violencecosting at least 4 percent of GDP (excluding dynamiccosts) (World Bank 2003g). Unlike Mauritius, Jamaicahas lacked a social/political compact; though recentlythe labor unions have agreed with the government tolimit their wage increases in response to the grave eco-nomic situation.
Mauritius outperformed Jamaica in macroeconomicstability for the two decades from 1980 to 2000, interms of the level of inflation and the stability and com-petitiveness of the real exchange rate. In the 1990s,Jamaica’s poor management of adverse macroeconomicdevelopments seemed to more than offset the poten-tially positive effects of a substantial trade (and capitalaccount) liberalization. Financial crisis in the mid-1990sworsened the already deteriorating fiscal performance,and dramatically enlarged the ratio of debt to GDP. Thishas dampened private sector confidence, governmentinvestment, interest rates, and growth.
nent of cost.13 The main issues related to transportare lack of competition and inadequate invest-ments.Transport costs are further raised by formaland informal fees and checkpoints. Poor transportparticularly affects agricultural producers (mainlysmallholder farmers and herders) who have diffi-culty accessing markets both domestic and exter-nal. In Malawi, for example, high transport costshave weakened the competitiveness and profitabil-ity of firms and farmers. Malawi is an efficient pro-ducer of sugar,but domestic transport costs accountfor 15 percent or more of local consumer prices,and for sugar exports, regional and internationaltransport costs add nearly 50 percent to the ex-millproduction costs (World Bank 2003i).Lack of com-petition in road transport (where Malawi hasrestrictions on foreign operators) and high trans-port taxes add substantially to transport costs.
Product standards in international trade haveproliferated and become more stringent in recentyears. Consumers in developed countries aredemanding stricter food standards, while majorfood retailers, food manufacturers, and restaurantchains have been adopting codes of practice, stan-dards, and other forms of supply-chain governanceas part of their commercial strategies of differentia-tion. Increasingly, middle-income and some low-income countries are also raising their productstandards, in part through the investments under-taken by multinational supermarket or restaurantchains and competitive responses by local firms.
Prospects are dim for “special and differentialtreatment” that would require less stringent stan-dards from poorer countries (Jaffee and Henson2004). Developing countries need to develop andimprove their food safety and agricultural healthmanagement systems to position themselves com-petitively and to enhance their export perform-ance. Building such capacity is not beyond thereach of developing countries, and some very poorcountries are meeting exacting international stan-dards.Examples include Peruvian exports of aspara-gus to the United States and the European Union,and low-income African countries’ exports of fishproducts that meet EU hygiene standards. Coun-
T R A D E L I B E R A L I Z AT I O N : W H Y S O M U C H C O N T ROV E R S Y ? 143
tries that meet strict export standards are generallythose where the private sector is well organized andthe public sector well focused to meet exporters’needs, such as through outgrower programs forsmallholder farmers, systems of training and over-sight for small and medium-size enterprises throughassociations and groups, and twinning and regionalnetworking for small countries.
2. Different Paths to Trade Reform
This section discusses issues related to the path ofliberalization, including the success of different par-tial approaches to trade liberalization, managing thepolitical economy of trade reform, whether there isa limited role for infant industry protection, and thepros and cons of regional trade agreements.
One element is common to almost all of thesuccess stories:despite the diversity of approaches totrade reform, all successful liberalizations eitherexplicitly or implicitly promoted export growth.Exporters were given incentives to ensure that sell-ing on international markets was as attractive asdomestic sales.This required establishing a regimethat offset the anti-export bias. In turn, this requiredan effectively functioning bureaucracy to imple-ment the offsetting regulation—as with the “indi-rect duty drawbacks” in Korea. This proactiveapproach is not generally prescribed. Since mostcountries lack the institutional capacity that isrequired to implement offsetting regulation, classictrade liberalization—through low, uniform tariffsand the elimination of quantitative restrictions—has been the more conventional recommendation.
Partial Trade Liberalization:China and IndiaChina opted for partial trade liberalization, pursuedthrough a dual-track approach. Special economiczones (SEZs)—one of the drivers in China’s exportand growth success—were set up in the 1980s togive the firms established within them access toduty-free imported inputs. Firms outside the SEZsfaced much higher tariffs on imports, at 56 percent
eral years later. It was not until 2001 that all con-sumer goods imports were liberalized.19
India’s sequencing of trade liberalization, whichentailed earlier liberalization of capital and inter-mediate goods than for consumer goods, and muchsteeper reduction in tariffs for some of them, wasintended to discourage the deferment of invest-ments that might occur if domestic producersexpected further reductions in capital goods tar-iffs.20 The response was rapid: in dollar terms,exports were growing by 20 percent annuallywithin three years of the start of the reform pro-gram.The strong export supply response providedimpetus for a continued response, not least becausethe new export receipts alleviated the pressures onthe balance of payments.
Factors that were clearly important for the tradereforms adopted by China and India were the cred-ibility of reforms and the importance of stronginstitutions. Some ways to achieve reform credibil-ity are discussed below.
Political Economy of Trade ReformsThe success of trade reforms is not automatic.Polit-ical economy considerations need to be taken intoaccount at the design stage if reforms are to be sus-tainable.The key elements on the political econ-omy front are ensuring that the costs of adjustmentarising from reforms are eased, and that reforms arecredible.
Easing the Costs of AdjustmentEasing the costs of adjustment is clearly important togenerate social and political support for reforms.One way to ease adjustment costs is to ensure thatsafety nets are adequate to compensate losers.But, asdiscussed earlier, a more efficacious way is to designa reform program that minimizes adjustment costs.
China and Mauritius provide good examples inthis regard, by creating new profit opportunities atthe margin while leaving old opportunities undis-turbed.The upshot was that there were no identifi-able losers. In China, few vested interests opposedthe SEZs because these were set up outside the
E C O N O M I C G ROW T H I N T H E 1 9 9 0 s144
in 1982, falling to 44 percent in 1991and 16 per-cent in 2000 (Lardy 2002).
China established its first four SEZs in 1980 intwo coastal provinces (Guangdong and Fujian),selected for their location.14The success of the ini-tial zones led to the addition four years later of 14coastal cities (including Shanghai) as “coastal opencities,” with authority similar to that of the SEZs.By 1992, most cities along the Yangtze River andthe borders of China had been granted specialprivileges as coastal cities, with Shanghai beinggranted even more autonomy.These developments,in turn, spurred the establishment of “developmentzones” in many inland cities that extended tax ben-efits and autonomy to foreign and domestic invest-ments. In many cases, such zones were establishedwithout the approval of the central government.15
In 1993 China became the world’s second-largestdestination for FDI, next to the United States.Compared with other regions, the SEZs enjoylower tax rates and greater authority in approvingforeign investment projects.The removal of admin-istrative barriers had nearly as great an effect inspurring trade as China’s tariff reductions, whichdid not really begin until the 1990s. Exports grewat an annual average of 15 percent in the 1980s,and at 19 percent in the 1990s.16
India followed a different model of partial liberal-ization, liberalizing trade across all regions of thecountry but relaxing protection one sector at a time.After piecemeal efforts at liberalizing trade duringthe 1980s, India launched a coherent trade reformprogram in 1991, with some faltering during1997–2001.17 The reforms entailed concurrentreductions of some of the highest tariff and nontariffbarriers (NTBs) in the world.A large reduction inNTBs and the streamlining of a very compleximport licensing regime came early in the reformprogram,while tariffs were reduced in a phased man-ner, with reductions continuing today. Currently, themaximum customs tariff for nonagricultural goods is30 percent, scheduled to be reduced to 20 percent orless in the near future.18 Capital and intermediategoods imports were liberalized first, and consumergoods (which were effectively banned) not until sev-
scope of central planning and did not disruptplanned production and allocation. China’sapproach also maximized political support for thereforms as the number of winners grew over time.Mauritius partially liberalized trade by establishingexport processing zones (EPZs) and segmenting thelabor market (Subramanian and Roy 2001). Labormarket rules were much less stringent in the EPZsthan elsewhere in the economy. Until the mid- tolate 1980s, employers had greater flexibility in dis-missing workers in the EPZ sector, and in the1980s,EPZ wages were about 36–40 percent lowerthan wages in the rest of the economy,with the dif-ferentials narrowing to 7–20 percent in the 1990s.Aside from acting as a subsidy to exports, the seg-mentation of the labor market also prevented theexpansion of the EPZs from driving up wages inthe rest of the economy and disadvantaging theimport-substituting industries.
Ensuring CredibilityAt the very least, reforms should be publicly com-municated so that economic agents are aware ofthem and can respond accordingly. Mozambiquelifted export restrictions on cashew nuts but withvery little communication to those directly affectedby the reforms, so that few cashew nut farmers wereaware that substantial reforms had been under-taken.21 As a result, much of the price increase thatresulted from the reforms went to the traders, andthe supply response was constrained. Had farmersbeen told of the reforms, they could have strength-ened their bargaining power in relation to thetraders, making it difficult for the latter to pay lowprices. Public communication of reforms alsodiminishes the possibility of reform reversals,boost-ing their credibility.
Another way to boost the credibility of reformsis to undertake measures that are less easy to reversethan price changes. In Mozambique, another rea-son why the supply response was poor was thatcashew nut processors did not make investments toimprove their efficiency, in part because theyexpected the reforms to be reversed.The overallreform program would have been more credible
T R A D E L I B E R A L I Z AT I O N : W H Y S O M U C H C O N T ROV E R S Y ? 145
had the price reforms been accompanied by non-price reforms, such as government investment intransport, better access to credit, promotion ofcompetition in cashew marketing, and the creationof incentives to adopt improved technologies forcashew growing. Such nonprice interventionsstrengthen credibility by signaling to the public agovernment’s commitment to the reforms.
Further ways to promote credibility include theestablishment of institutions such as India’s TariffCommission, which is charged with the design andimplementation of the trade reform program andhas a tenure that outlasts governments. Such longtenure helps to enhance the credibility of reforms,as it diminishes private sector expectations that thereform program will be reversed by successive gov-ernments. Finally, credibility can also be achievedthrough signing on to regional trade arrangementsthat lock in reforms.
Should Emerging Industries Be Protected?Although import substitution policies have beenlargely discredited, the need to address market fail-ures that prevent the development of internation-ally competitive industries has continued toprovoke debate. Suggestions have been made togrant temporary modest levels of import protectionwhere there is a demonstrated need (Williamson2004a). Other authors have focused on choosingthe right form of protection, advocating subsidiesto the initial entrants rather than the use of importduties (Baldwin 2003).
Another suggestion is to approach developmentas a process of “self discovery,” since the key chal-lenge that a modernizing economy faces is learningwhat it is good at producing (Hausmann andRodrik 2002).The entrepreneur who first discoverswhat the country should specialize in can captureonly a small part of the social value that this knowl-edge generates, because other entrepreneurs willquickly emulate such discoveries.Thus this type ofentrepreneurship will typically be undersuppliedand economic transformation delayed.There maybe a role for government involvement to provideincentives to induce such investments, as well as to
importance of creating an institutional architecturethat resists the pull of special interests, and theimportance of political leadership from the top.Whatever institutions are employed to support newactivities, they must be transparent and accountable,or selective support is likely to evolve into a newmechanism for supporting private interests in thename of public gain.The promotion of new activi-ties should conform to a set of design principlesthat include the following: (1) incentives should beprovided only for new,“sunrise” activities, not sun-set ones; (2) there should be clear benchmarks forsuccess or failure; (3) support must have a predeter-mined end (a so-called sunset clause); (4) publicsupport should target activities such as worker train-ing or infrastructure investment, rather than sectorssuch as electronics; (5) subsidized activities shouldprovide clear potential for externalities; and (6)agencies involved in these activities should beautonomous enough to avoid capture by privateinterests, but should maintain links with the privatesector to maximize economywide gains.This is nota prescription for creating new state enterprises,promoting existing activities, or giving govern-ments authority to expand their bureaucratic reach.Clearly, the institutional and administrative require-ments for success are formidable.
A Role for Regional Agreements? Some countries have achieved greater integrationand strong growth by adopting unilateral or multilat-eral trade reforms combined with participation inregional trade agreements. Signing on to regionaltrade agreements provides countries with access tothe markets of fellow members,and can help improvetheir domestic institutions. But evidence suggeststhat as many as half of regional trade agreements aresubstantially trade-diverting.Trade and investmentdiversion cause significant economic losses to thecountries excluded from the agreements.
Regional integration has yielded good resultsfor Central and Eastern European countries thatsigned Europe Agreements in the 1990s with theEuropean Union, and for Mexico,which joined the
E C O N O M I C G ROW T H I N T H E 1 9 9 0 s146
exert discipline in pruning investments that turnout to be costly.
A key challenge for countries that choose to pur-sue such a strategy is to structure the right combina-tion of incentives (inducements) and discipline(competitive pressures, resistance against specialinterests). Some of the world’s most successfuleconomies during the last four decades (Korea andTaiwan,China since the early 1960s;China since thelate 1970s) prospered by pursuing policies that gaveinducements for investment and risk taking whileexpanding competitive pressures that ensured effi-cient allocation by investors. During their industrialdrives in the 1960s and the 1970s,Korea and Taiwan(China) provided export subsidies contingent onexport performance.This strategy allowed policymakers to distinguish firms and sectors that werehighly productive from those that were not.Thesubsidies included supplying inputs, providingworking capital, imposing import restrictions, and—in Taiwan’s (China) textile industry in the 1950s—buying the resulting output. Local production grewspectacularly as a result. But the government alsopruned nonproductive firms subsequently.
Asia’s successful experiences in this regard con-trast with the generally failed experiences of LatinAmerica. Pursuing import substitution strategies inthe 1960s and the 1970s, Latin American govern-ments provided incentives without sufficient disci-pline, with the result that too manylow-productivity firms operated alongside the highperformers. When trade openness and domesticcompetition brought discipline in the 1990s, pro-ducers received too little support (Hausmann andRodrik 2002).Without a good balance betweenpromotion and discipline, Latin American coun-tries’ industrial performance fell short of that in EastAsian countries during these decades.
Chile has often been touted as a miracle of free-market economics. In fact, public-private collabo-ration strategies have played a key role in fosteringstructural change and stimulating nontraditionalactivities (box 5.5).Yet identifying the conditionsfor successfully assisting new activities is not easy.Rodrik and Hausmann (2003) emphasize the
North American Free Trade Agreement (NAFTA).For the Central and Eastern European countries,the institutional harmonization aspect of theEurope Agreements has been very important forsuccessful trade integration and growth (WorldBank 2000d); agreements on harmonization ofinvestment policies, regulatory rules, and institu-tions with those of EU members have encouragedexport-oriented foreign direct investment into theCentral and Eastern European countries. In Mex-ico, NAFTA has had positive effects on trade, for-eign direct investment, technology transfer, andgrowth, and is also associated with productivityimprovements in manufacturing. But althoughNAFTA has contributed to institutional harmo-nization between Mexico and the United States inthe areas that it covers—in particular intellectualproperty rights, investor protection, and environ-
T R A D E L I B E R A L I Z AT I O N : W H Y S O M U C H C O N T ROV E R S Y ? 147
mental standards—it has not helped to narrowother institutional gaps, especially in the areas ofrule of law and corruption, which are nonethelessimportant for income convergence between thetwo countries (Perry et al. 2003).
Evidence suggests that for developing countries,signing on to regional trade agreements with devel-oped countries, particularly large developed coun-tries, is most useful.Agreements should also strive toensure that barriers that apply to nonagreementcountries are kept low.Signing such agreements willnot generate positive export and growth responsesunless the countries themselves also pursue othernecessary economic, political, and social reforms.Among the EU accession countries in the 1990s,benefits only accrued to those countries that werealso undertaking the necessary economic, political,and institutional reforms to transform their
BOX 5.5
Behind Chile’s Success: A Less than Orthodox Approach
Chile appears to be the exception among LatinAmerican countries by striking the right bal-ance of inducements and discipline in promot-
ing domestic industry.Fruits and salmon, Chile’s two largest export items
after copper, have both benefited from private-publicsector partnerships. The foundations of the fruit indus-try were laid in the early 1960s through the efforts ofthe Corporacion de Fomento, the University of Chile,and the National Institute of Agricultural Research(INIA). INIA, established in 1964 with highly-paidskilled researchers, initiated the fruit research pro-gram. The public sector carried out much of the devel-opment of scientific personnel and knowledge toachieve technological transfer; identification, andplanting of new varieties suitable for export to foreignmarkets; improvements in orchard and postharvestmanagement; and the development of the infrastruc-
ture necessary to export fruit to foreign markets. Pri-vate investment and exports took off after the reformsof the mid-1970s once uncertainties regarding landreform, macroeconomic stability, and labor militancywere resolved. These investments and exports were fur-ther boosted by the sharp real depreciation of the cur-rency in the mid-1980s.
The salmon industry, which generates $600 millionin annual exports and provides jobs for more than100,000 people in this country of 15 million, also ben-efited significantly from public interventions. It wascreated single-handedly by Fundacion Chile, a nonprofitinstitution created by the Chilean Government in 1976.Fundacion Chile brought the technology of salmon farm-ing to Chile, adapted it and made it commerciallyviable, formed private sector businesses to use it, andeventually sold its participation to Japanese investorsat a great profit.
Sources: Rodrik and Hausmann 2003; Ocampo 2004; and Washington Post, January 21, 2004.
How much of the decline in poverty rates andincreasing within-country inequality can be attrib-uted to the trade reforms of the 1990s?
Effects of Trade Reform on Aggregate Growth and Poverty
Direct EffectsIf opening up to trade is associated with highergrowth, it may be associated with a decline inpoverty as well.This argument rests on two assump-tions: first that opening up to trade leads to highergrowth and second, that growth raises the incomesof the poor as much as the incomes of the rich.
What actually occurred? There is widespreadevidence that GDP growth reduces poverty.25 Inother words, evidence suggests that growth benefitsthose at the lower end of the income distribution.If trade liberalization contributes to growth—asdiscussed earlier in this chapter—it should be asso-ciated with reductions in poverty. China and India,for example, have both experienced tremendousincreases in trade integration and growth, as well aslarge reductions in poverty.From 1980 to 2000, realper capita GDP grew at an annual average of 8.3percent in China and 3.6 percent in India, whiletrade integration (trade in goods and services in realterms as a share of GDP) rose from 23 to 46 percentof GDP in China, and from 19 to 30 percent inIndia. Over this period, both countries massivelyreduced the incidence of poverty—from 28 to 9percent between 1978 and 1998 in China, and from51 to 27 percent between 1977–78 and 1999–2000in India.26 Since a large share of the world’s poorlives in these two countries, these large reductionshave served to reduce or mitigate overall inequalityin the world, even though inequality has risenwithin both countries (Ravallion 2003b; Sala-i-Martin 2003).
Nevertheless, Harrison (2005) suggests that pol-icy makers need to be cautious about expectinglarge gains in poverty reduction from tradereforms.27 Many economists expected that devel-oping countries with a comparative advantage in
E C O N O M I C G ROW T H I N T H E 1 9 9 0 s148
economies into market-based ones.22 For example,Bulgaria and Romania signed Europe Agreementsin 1993, in advance of several other accession coun-tries,but they lagged behind in the transition processand fared much worse in economic performancecompared to Estonia and Slovenia, which signedsuch agreements in 1995 and 1996, respectively.
Most important, regional trade agreements candivert attention away from the multilateral WorldTrade Organization (WTO) process, and result inhigher costs than benefits for developing coun-tries.23 This will be especially true if the agreedupon protection relative to third parties remainshigh. Recent experience with the Free Trade Areaof the Americas, the Central American Free TradeAgreement, and the U.S.-Australia Free TradeAgreements suggests that regionalism will not helpthe developing countries much with their marketaccess priorities: trade-distorting agricultural sup-port in the North, contingent protection, and liber-alization of temporary migration of labor. Further,the high costs of negotiating such agreements divertresources away from such larger multilateral issues.
3. Trade Liberalization, Poverty,and Income Distribution
Despite expected gains for the economy in thelonger term, trade reform generates both winnersand losers in the short run.24 The critical questionis whether the short-run costs of trade reform falldisproportionately on the poor. Economists in the1990s expected trade and foreign investmentreforms to help developing countries reducepoverty. Trade liberalization was expected toincrease demand for goods produced by developingcountries’ poor or low-skilled workers, leading tohigher wages for unskilled workers and ameliorat-ing poverty.Trade reforms were also expected toraise the prices of the agricultural products pro-duced by the poor and to reduce prices of goodsthat the poor consume. Is the emerging evidencefrom the 1990s consistent with these expectations?
unskilled labor would benefit from liberalization oftrade through increased demand for their unskilledlabor–intensive goods,which in turn should reduceinequality and poverty. However, the evidence inthis volume—which includes 15 separate studies ofthe links between poverty and globalization—sug-gests that the story is more complex. One reason isthat labor is not nearly as mobile as simple trademodels assume. If comparative advantage is toincrease the incomes of unskilled workers, theyneed to be able to move out of contracting sectorsand into expanding ones. A second reason is thatdeveloping countries have historically protectedtheir unskilled-intensive sectors, so that tradereforms may lead to less protection for unskilledworkers relative to skilled. A third reason is thateven firms in countries with a comparative advan-tage in producing goods that use unskilled laborneed to use skilled workers in order to compete inglobal markets.
Indirect EffectsTrade reforms can also affect poverty indirectly, forexample by influencing (1) the job opportunities andwages of the poor,(2) the prices that poor consumerspay for the goods that they buy, (3) government rev-enues and in turn social expenditures that particu-larly affect the poor,and (4) income instability as wellas workers’chances of becoming poor (Winters et al.2004).Even if aggregate poverty falls or remains con-stant, many households may move into or out ofpoverty as a result of trade liberalization.
Effects on jobs and wages. Some studies have foundthat trade reforms reduce employment in the shortrun, but others have found that trade reformsincrease employment over the long run, as expand-ing sectors create new employment opportunities.Trade explains much of the decline in Singapore’sunemployment rate, from more than 9 percent inthe 1960s to close to 2 percent in the late 1990s.Astudy of 18 countries in Latin America and theCaribbean over the period 1970–96 found thattrade liberalization had a negative, though small,direct effect on employment.28 The negative effectwas greater in countries where the real exchange
T R A D E L I B E R A L I Z AT I O N : W H Y S O M U C H C O N T ROV E R S Y ? 149
rate appreciated as a result of capital inflows thatfollowed the economic reforms. Similarly, in Brazilduring 1990–97, trade liberalization slightlyreduced employment in the short run,but the morelabor-intensive output mix that resulted over thelong run increased employment.29 Much largernegative effects on output and employment havebeen found in some African countries. One studyfor Kenya, Tanzania, and Zimbabwe found thatmost firms responded to import competition pres-sure by contracting rather than upgrading aggres-sively.30 Among the suggested reasons for suchbehavior are the firms’ lack of preparation for com-petition, absence of policies to promote technolog-ical improvement (especially among small andmedium enterprises), and poor technological andhuman infrastructure.
Trade reforms of the 1990s in Latin America andthe Caribbean reduced employment in previouslyprotected industries and augmented it in others (DeFerranti et al. 2001).Argentina lost much of its auto-mobile industry while seeing an expansion in moresophisticated chemicals and capital- and labor-intensive manufactures. Brazil lost much of its cere-als industry to Argentina under Mercosur, and itsmanufacturing industry suffered more generally.Costa Rica lost much of its labor-intensive manu-facturing to Mexico after NAFTA, but it also sub-stantially increased its manufacturing of computerchips. In each case, substantial numbers of workerslost their jobs,and some experienced very long peri-ods of unemployment or large wage losses, or both.
As emphasized by De Ferranti et al. (2001), suchdislocations are transitional and do not imply a per-manent increase in the unemployment rate. Chile,for example, experienced double-digit rates ofunemployment for several years after liberalization,but from 1986 to 1997 its unemployment rateswere among the lowest in the region. Mexico’spresent rate of unemployment is roughly at its tra-ditional level, despite that country’s dramatic eco-nomic integration with the United States.
Although most studies find that the unemploy-ment effects of trade liberalization tend to be tempo-rary, even short-term costs can be high in human
alternative sources of revenues—though cautionneeds to be exercised to ensure that replacementtaxes do not hurt the poor.And, with political will,social spending, particularly that oriented towardthe poor, may be shielded.
Effects on vulnerability and income volatility. WhenIndonesia, Korea, and Thailand opened up to tradein the late 1980s and early 1990s,no strong negativeeffects on poverty and vulnerability resulted.33 Itremains an open question whether openness madethe 1997–98 Asian financial crisis much more seri-ous than the shocks that had hit the three countriesin the 1980s. It is clear, however, that financial crisesare very costly to the poor. In Indonesia, the finan-cial crisis of 1997 led to a 50 percent reduction inreal wages.34 In Mexico, the peso crisis of the mid-1990s led to a stagnation in real wages that lastednearly a decade.A recent study of financial deregu-lation across countries emphasizes the need forcomplementary policies, such as the creation of reli-able institutions and macroeconomic stabilizationpolicies (Prasad et al. 2004).While financial crisesresulting from unrestricted capital flows are associ-ated with a higher likelihood of poverty, foreigndirect investment inflows are associated with areduction in poverty.The poverty-reducing effectsof FDI are clearly documented in several recentstudies on India and Mexico.
Summarizing the Links between Trade Reformsand PovertyWhat lessons emerge from cross-country and moredetailed case studies using household data? First, thepoor are more likely to share in the gains from glob-alization where complementary policies in place.Case studies of India and Colombia in Harrison(2005) suggest that globalization is more likely tobenefit the poor if trade reforms are implementedin conjunction with labor market deregulation.35
In Zambia, poor farmers are only expected to ben-efit from greater access to export markets if theyalso have access to credit, technical know-how, andother complementary inputs.36 The same volumealso points to the importance of social safety nets. InMexico, trade reforms in the 1990s hurt the poor-
E C O N O M I C G ROW T H I N T H E 1 9 9 0 s150
terms.Such costs must be addressed through a varietyof policy approaches, including stronger social safetynets, in order to ensure that trade reforms succeed.
Effects on prices. An emerging literature usinghousehold-level data suggests that, via changes infactor and goods prices, trade liberalization can leadto poverty reduction. For instance, a recent study oftrade liberalization in Argentina using householdsurvey data found that Mercosur has benefited theaverage Argentine household across the spectrum ofincome distribution.31The same study also finds thatMercosur has had a pro-poor bias, benefiting poorhouseholds more than middle-income households,and that its impact on rich families is positive butnot statistically significant.The reason behind theseresults is that Argentine trade policy protected therich over the poor prior to the reforms, and grantedsome protection to the poor after the reforms.
Effects on social spending. Social spending isanother avenue through which liberalization mayaffect income distribution, but there is no directevidence for such a relationship.The available evi-dence, relating mostly to the 1980s,32 suggests thatmany trade reforms had no revenue costs. Some ofthe main reasons were that temporary tariff sur-charges were introduced when quantitative restric-tions were removed, and that changes in theimport/export base arising from the trade reformsenhanced revenues. For example, Kenya’s trade lib-eralization between 1989 and 1999 (which entailedhalving the simple average import duty rate overthe period and abolishing import licensing require-ments and foreign exchange controls) led toincreases both in duty as a share of imports, and inimport duty revenues as a share of GDP. Theincrease in revenues reflected the expansion of therevenue base, tighter exemption management,higher duty rates on certain products, a shift inimports to the higher duty classes, and possibly alsoimprovements in customs administration and theintroduction of a preshipment program (Glenday2000, cited in Winters et al. 2004).
Even in cases in which revenues are cut, avail-able evidence suggests that public spending impor-tant to the poor can be protected. There are
est corn farmers;without support from the govern-ment, these farmers’ real incomes would have beenhalved.37 The same result has been found morerecently in Ethiopia.38
Second,while financial crises are associated withincreasing poverty, reforms in trade and foreigninvestment in a number of countries have helped toreduce poverty. In Mexico, the poor in the mostglobalized regions have weathered the macroeco-nomic crises the best.39 In India,opening up to for-eign investment was associated with a decline inpoverty.In Colombia, increasing export activity wasassociated with an increase in compliance withlabor legislation and a fall in poverty. In Poland,unskilled workers—who are the most likely to bepoor—have gained from the country’s accession tothe European Union.40
Clearly, globalization produces both winnersand losers among the poor.Winters, McCulloch,and McKay (2004); Ravallion and Lokshin (2004);and Harrison (2005) all emphasize this heterogene-ity in outcomes. It should not be surprising that theresults defy easy generalization.The poor can gainfrom one set of policy reforms, if those lower theprices they pay for consumption goods, and losefrom other trade reforms that lower the prices ofthe goods they produce. Poor wage earners inexporting sectors or in sectors with incoming for-eign investment gain from trade and investmentreforms;conversely,workers in previously protectedsectors are likely to lose.
This emerging evidence on the links betweentrade reforms and poverty points to the need forcarefully targeted social safety nets and comple-mentary policies to ease the transition of workersfrom contracting to expanding sectors.
Trade Liberalization and InequalityThough inequality has been increasing in both richand poor countries we still lack a comprehensiveunderstanding of why.A popular explanation is thattechnological change—which may or may not beassociated with opening up to trade—has ledemployers to demand more skilled labor.This phe-
T R A D E L I B E R A L I Z AT I O N : W H Y S O M U C H C O N T ROV E R S Y ? 151
nomenon, referred to as skill-biased technicalchange, has occurred in both developed and devel-oping countries. Some economists argue that thedemand for more skilled workers is unrelated totrade liberalization, since the same trend has beendocumented in services that are not traded on worldmarkets, but others argue that skill-biased technicalchange is itself an outcome of globalization.
One reason why trade reforms may be associ-ated with increasing inequality is that many coun-tries—Colombia, Mexico, Morocco, and Poland,for example—have traditionally protected the sec-tors that use mainly unskilled labor.
Another possible reason is that exporters—whobenefit from trade reforms—need to hire skilledworkers to succeed in world markets.A number ofstudies have shown that exporters are more likely touse a high proportion of skilled workers, suggestingthat as countries turn to exporting, the demand forskilled workers will rise, pushing up their wages rel-ative to those of unskilled workers.41 Foreign firmsin developing countries tend to hire more skilledworkers than do domestic firms.In Mexico, increas-ing inequality is most evident in the borderregion—the region most affected by increasingtrade with the United States.
Nevertheless, the evidence on trade liberaliza-tion and wage inequality remains inconclusive. InArgentina, Brazil, Costa Rica, the DominicanRepublic, and Mexico, the industries that are mostexposed to international competition pay the high-est wages. It is difficult to distinguish the impact ofglobalization from that of technical change, sincethe adoption of new technologies could be stimu-lated by external competition via trade. In Mexico,for example, the tripling of manufactured exportsduring the 1990s has been associated with increasedrates of adoption of modern production technolo-gies, an acceleration of productivity growth, a rela-tive increase in the demand for skilled labor, and anincrease in inequality.
There is no evidence that trade liberalization per-manently worsens income distribution. As notedabove,however, there is evidence that trade liberaliza-tion has been associated with—at times significant
in agriculture, rich-country subsidies combinedwith trade protection to domestic agricultureworsen world poverty. Farm production subsidies inthe United States, for example, are distributed over-whelmingly to the richest farmers, exacerbatingincome inequality in agriculture and favoringwealthy landowners. Developed countries imposehigher tariffs on agricultural imports from develop-ing countries than from other industrial countries(table 5.2). Developed countries impose an averagetariff of 15 percent on agricultural imports fromother industrial countries, but average tariffs rangingfrom 20 percent (for Latin America) to 35 percent(for Europe and Central Asia) on agriculturalimports from developing countries. The issue ofagricultural protection, in particular in cotton, hasrisen in prominence in multilateral trade talks, andwas one of the main reasons for the failure of themost recent round of WTO talks in Cancun in Sep-tember 2003. Since then, Brazil has gone to theWTO with charges that U.S. subsidies on cotton areinconsistent with WTO obligations, and the WTOruling on April 2004 affirmed Brazil’s charges.42
On manufactured goods, tariffs are on averagelower in developed than in developing countries,but the types of goods exported by poor countriesface higher tariffs in the rich countries. For exam-ple,while exporters of manufactures from industrialcountries face, on average, a tariff of 1 percent ontheir sales to other industrial countries, exportersfrom developing countries pay anywhere from 2percent if they are from Latin America (whereNAFTA weighs heavily) to 8 percent if they arefrom South Asia.
Overall, rich countries collect from developingcountries about twice the tariff revenues per dollarof imports that they collect from other rich coun-tries.Protection also takes forms other than tariffs—among them quotas, specific duties, and contingentprotection measures such as antidumping duties.Aswith tariffs, these measures tend to be used morefrequently against labor-intensive products fromdeveloping countries. Antidumping duties are onaverage 7 to 10 times higher than tariffs in indus-trial countries, and around 5 times higher in devel-
E C O N O M I C G ROW T H I N T H E 1 9 9 0 s152
and prolonged—adjustment costs in the form ofemployment losses. In Mexico, trade integrationthrough NAFTA, while reducing poverty, has alsoincreased income inequality between regions: regionswith lower per capita GDP and higher telephonedensity grew faster, while regions with high publicemployment grew more slowly (Perry et al. 2003).
Governments need to help the disadvantaged bystrengthening social safety nets and by providingeducation and training for the unskilled.As attestedby the industrialized countries, it is a daunting taskto build up the administrative and institutionalcapacity required to design and implement safetynets that are well targeted and that avoid leakages.More innovative approaches to trade reforms andtrade reform assistance packages may be needed.
4. Issues of Differential MarketAccess
After the reforms of the 1990s the world trade systemhas been more supportive of development. But itremains strongly biased against the poor.Global mar-kets are most hostile to the products the world’s poorproduce—agriculture, textiles, and labor-intensivemanufactures.Escalating tariffs, tariff peaks, and quotaarrangements maintained by both developed anddeveloping countries systematically deny the poormarket access and skew incentives against addingvalue in poor countries. In both rich and poor coun-tries, protection remains heavily concentrated in themost politically sensitive areas—textiles, clothing,other labor-intensive manufactures, and agriculture.
Differential treatment by developed countriesstill constrains the expansion of trade by developingcountries, particularly the poorest. In developedcountries, the relatively low average tariffs mask thesometimes high protection in the form of tariffpeaks, tariff escalation, specific duties, and produc-tion subsidies.
Developed-country protection is much morepronounced in agriculture than in manufacturing(World Bank, Global Economic Prospects 2004). Sincemost of the world’s poor live in rural areas and work
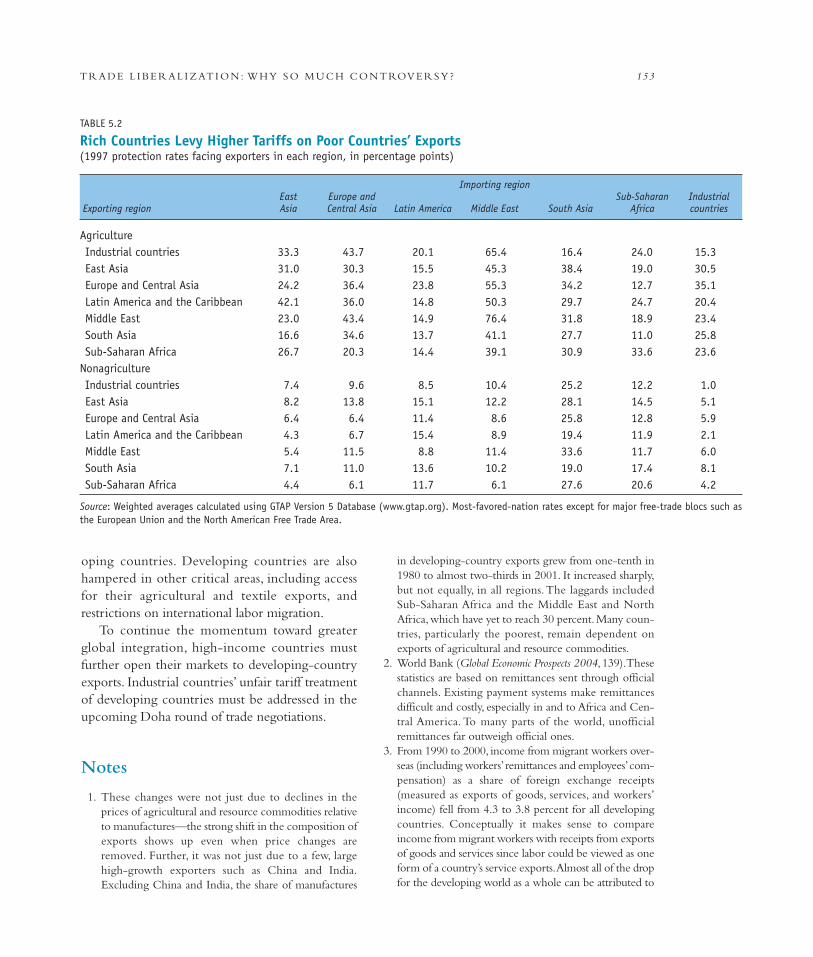
oping countries. Developing countries are alsohampered in other critical areas, including accessfor their agricultural and textile exports, andrestrictions on international labor migration.
To continue the momentum toward greaterglobal integration, high-income countries mustfurther open their markets to developing-countryexports. Industrial countries’ unfair tariff treatmentof developing countries must be addressed in theupcoming Doha round of trade negotiations.
Notes
1. These changes were not just due to declines in theprices of agricultural and resource commodities relativeto manufactures—the strong shift in the composition ofexports shows up even when price changes areremoved. Further, it was not just due to a few, largehigh-growth exporters such as China and India.Excluding China and India, the share of manufactures
T R A D E L I B E R A L I Z AT I O N : W H Y S O M U C H C O N T ROV E R S Y ? 153
in developing-country exports grew from one-tenth in1980 to almost two-thirds in 2001. It increased sharply,but not equally, in all regions.The laggards includedSub-Saharan Africa and the Middle East and NorthAfrica,which have yet to reach 30 percent.Many coun-tries, particularly the poorest, remain dependent onexports of agricultural and resource commodities.
2. World Bank (Global Economic Prospects 2004, 139).Thesestatistics are based on remittances sent through officialchannels. Existing payment systems make remittancesdifficult and costly, especially in and to Africa and Cen-tral America. To many parts of the world, unofficialremittances far outweigh official ones.
3. From 1990 to 2000, income from migrant workers over-seas (including workers’remittances and employees’com-pensation) as a share of foreign exchange receipts(measured as exports of goods, services, and workers’income) fell from 4.3 to 3.8 percent for all developingcountries. Conceptually it makes sense to compareincome from migrant workers with receipts from exportsof goods and services since labor could be viewed as oneform of a country’s service exports.Almost all of the dropfor the developing world as a whole can be attributed to
TABLE 5.2
Rich Countries Levy Higher Tariffs on Poor Countries’ Exports (1997 protection rates facing exporters in each region, in percentage points)
Importing regionEast Europe and Sub-Saharan Industrial
Exporting region Asia Central Asia Latin America Middle East South Asia Africa countries
AgricultureIndustrial countries 33.3 43.7 20.1 65.4 16.4 24.0 15.3East Asia 31.0 30.3 15.5 45.3 38.4 19.0 30.5Europe and Central Asia 24.2 36.4 23.8 55.3 34.2 12.7 35.1Latin America and the Caribbean 42.1 36.0 14.8 50.3 29.7 24.7 20.4Middle East 23.0 43.4 14.9 76.4 31.8 18.9 23.4South Asia 16.6 34.6 13.7 41.1 27.7 11.0 25.8Sub-Saharan Africa 26.7 20.3 14.4 39.1 30.9 33.6 23.6
NonagricultureIndustrial countries 7.4 9.6 8.5 10.4 25.2 12.2 1.0East Asia 8.2 13.8 15.1 12.2 28.1 14.5 5.1Europe and Central Asia 6.4 6.4 11.4 8.6 25.8 12.8 5.9Latin America and the Caribbean 4.3 6.7 15.4 8.9 19.4 11.9 2.1Middle East 5.4 11.5 8.8 11.4 33.6 11.7 6.0South Asia 7.1 11.0 13.6 10.2 19.0 17.4 8.1Sub-Saharan Africa 4.4 6.1 11.7 6.1 27.6 20.6 4.2
Source: Weighted averages calculated using GTAP Version 5 Database (www.gtap.org). Most-favored-nation rates except for major free-trade blocs such asthe European Union and the North American Free Trade Area.
trade shares) are offset by excessive regulations in themost regulated economies in the 1990s.
8. Lerner symmetry in the two-good case can be illus-trated as follows: Px/Pm(1+t) = [Px/(1+t)]/Pm, wherePx=price of exports; Pm=price of imports; t=tariff.
9. Macroeconomic stability refers to the stability of thereal effective exchange rate, as measured by the standarddeviation, and average inflation. Government effective-ness refers to combined perceptions of the quality ofpublic service provision, the quality of the bureaucracy,the competence of civil servants, the independence ofthe civil service from political pressures, and the credi-bility of the government’s commitment to policies.Thegovernment effectiveness indicator is taken from Kauf-man, Kraay, and Mastruzzi (2003), and based on 17 sep-arate sources of subjective data on perceptions ofgovernance constructed by 15 different organizations.
10. See Aitken, Hanson, and Harrison (1997).11. See Thomas and Nash (1992);and Nash and Takacs (1998).12. Tsikata (2003).This study summarizes the findings of
diagnostic trade integration studies undertaken during2001–03 for 12 least developed countries (Burundi,Cambodia, Ethiopia, Guinea, Lesotho, Madagascar,Malawi, Mali, Mauritania, Nepal, Senegal, and theRepublic of Yemen).
13. The discussion in this paragraph is based on Jaffee andSutherland (2003).
14. Information in this paragraph is from Qian (2000).15. The autonomy given to local governments in China is
a very important factor in this development.This auton-omy is provided in the form of the “fiscal contractingsystem” introduced between 1980 and 1993, underwhich provincial governments are provided incentivesto build up local economies and their own revenuebases. Specifically, the incentives arise from allowing theprovinces to keep the lion’s share of the increases in rev-enues at the margin. Data from the reform period of1982–91 show that the correlation coefficient betweenthe provincial budgetary revenue and expenditure is0.75, compared to 0.17 in the prereform period of1970–79 (Qian 2002). Another study (Jin, Qian, andWeingast 2001) found that such incentives were indeedsignificant—for the growth of employment of nonstateenterprises and in the reform of state enterprises.
16. Qian (2002); Jin, Qian, and Weingast (2001).17. A result of the increasing import competition from East
and Southeast Asian countries that devalued their cur-rencies in the aftermath of the Asian financial crisis.
18. These tariffs underestimate true import competitionsince there are also specific tariffs.
19. However, imports of several agricultural goods, makingup 40 percent of Indian agricultural GDP, continue tobe controlled by state trading enterprises.
E C O N O M I C G ROW T H I N T H E 1 9 9 0 s154
the decline in migrant workers’ income in the ArabRepublic of Egypt,which in 1990 had enjoyed the largestamount of this income in nominal terms in the develop-ing world.The decline in migrant workers’ income inEgypt during the 1990s was related to the Gulf War.Excluding Egypt, the ratio fell from 3.7 to 3.6 percentover the decade.Countries where incomes from migrantworkers have become quite important—rangingbetween 20 to 46 percent of total foreign exchangereceipts in 2000—and where such income increased sig-nificantly over the 1990s (increases ranging from 10 to 46percent) include Albania, Ecuador, Jamaica, Jordan,Nicaragua, Sudan, and Uganda.At the same time, how-ever, countries including Benin, Cape Verde, Egypt,Lesotho, and Pakistan experienced declines in suchincomes, ranging from 10 to 30 percent.
4. Properly identifying the causal impact of changes intrade policies on growth needs to take into accountother factors associated with GDP growth, and the pos-sibility of reverse causality (that is, if GDP growth causeschanges in trade policies).This means that the variablefor trade policy should be “instrumented” or repre-sented with measures that affect trade policy but are notcorrelated with GDP growth. Since most reforms aredriven by initial protection levels,one way to get aroundthe problem is to instrument the changes in tariffs in the1990s with the initial tariffs that prevailed during1986–90.The initial tariffs were found to explain 36percent of the changes in tariffs during the decade:countries with high tariffs in the late 1980s and early1990s reduced tariffs by a higher percentage, whilecountries with already low tariffs reduced them less.Theresults also control for some other policies that affectedgrowth in the 1990s, including exchange rate policies,government consumption, and inflation.
5. For example,Dollar and Kraay (2001, 2003); Lee,Ricci,and Rigobon (2004); and Alcala and Ciccone (2004) allshow a positive relationship between trade and growth,whereas Rigobon and Rodrik (2004) get mixed results.Wacziarg and Welch (2003) find a positive relationshipbetween a composite measure of economic reforms andeconomic growth,but that relationship is not significantfor the 1990s; nor do they isolate the role of trade pol-icy per se, but look at the composite measure includingexchange rate reforms.Their analysis is done in a panelcontext, since they measure the impact of changes intrade policy on economic growth.
6. See Wacziarg and Welch (2003) and Baldwin’s (2003)summary of the recent debate on the topic.
7. See Bolaky and Freund (2004).The authors measureexcessive regulation using a World Bank survey on laborregulations and business entry regulations.They findthat the benefits of expanding trade (as measured by
20. World Bank (1994b).21. See McMillan, Rodrik, and Welch (2002).22. Much of the benefits came in the form of export-ori-
ented FDI from the EU member countries (WorldBank 2000d).
23. This discussion is taken from World Bank (2004d); seealso Stiglitz and the Initiative for Policy Dialogue (2004).
24. See Harrison (forthcoming);Winters, McCulloch, andMcKay (2004); Goldberg and Pavcnik (2005, forth-coming) for comprehensive surveys.
25. See, for example, the survey papers by Berg and Krueger(2003);Winters, McCulloch, and McKay (2004); andpapers by Dollar and Kraay (2001, 2003).The generalconclusion of these papers is that growth increases theincomes of the poor, although whether or not the effectis neutral across different incomes is subject to debate.
26. Asian Development Bank (2000), cited by Bhagwatiand Srinivasan (2002).
27. Papers from this volume, which was commissioned bythe National Bureau of Economic Research, can beviewed online at www.nber.org.
T R A D E L I B E R A L I Z AT I O N : W H Y S O M U C H C O N T ROV E R S Y ? 155
28. Marques and Pagés (1998).28. Moreira and Najberg (2000).The appreciation of the
real exchange rate during the period contributed to thenegative employment effect by encouraging importsand undermining exports.
30. Lall (1999).31. Porto (2003).32. See Winters et al. (2004) for studies cited.33. World Bank (2003e).34. See Thomas (2004).35. For the study on India, see Topalova (2005). For the
study on Colombia, see Goldberg and Pavcnik (2005).36. Balat and Porto (2004).37. Ashraf, McMillan, and Peterson-Zwane (2005).38. Levinsohn and McMillan (2004).39. Hanson (2004).40. Goh and Smarzynska Javorcik (2004).41. For a review of recent evidence on these links, see Han-
son (2004); Goldberg and Pavcnik (2004a).42. U.S. subsidies on cotton amounted to $3.7 billion in
2002 (three times the U.S. aid to Africa).
[also listed as a2005 publica-tion; pleaseupdate]