Embed Size (px)
Citation preview
Trade, Inequality, and Populism
Caroline FreundDirector of Macro, Trade and Investment
Global Lecture
The Vienna Institute for International Economic Studies
October 1, 2018
Themes from research on trade, growth, and inequality
• Trade and Inequality• Trade and poverty reduction
• Trade and the middle class
• Superstar firms, trade, and extreme wealth creation
• Backlash against globalization• Policy
• Identity politics
Common narrative on trade and inequality
• Globalization allowed poor countries to export more labor intensive goods
• Less skilled workers in rich countries lost their jobs
• Bottoming out of the middle class and rise in inequality
• Leading to a backlash against globalization
• Suggests development of poor countries has come at the expense of low skilled workers in developed countries
3
True narrative is more nuanced
• Trade contributed significantly to drop in global inequality• Trade helps poor countries grow, as resources shift to productive uses
• Less evidence that trade contributed significantly to increase in within-country income inequality• Trade helped create a class of superrich, but also lowers prices
disproportionately helping the poor
• Populism/Protectionism responds to confluence of factors, among which rhetoric on trade exceeds the reality
4
Trade helped poor countries grow
5
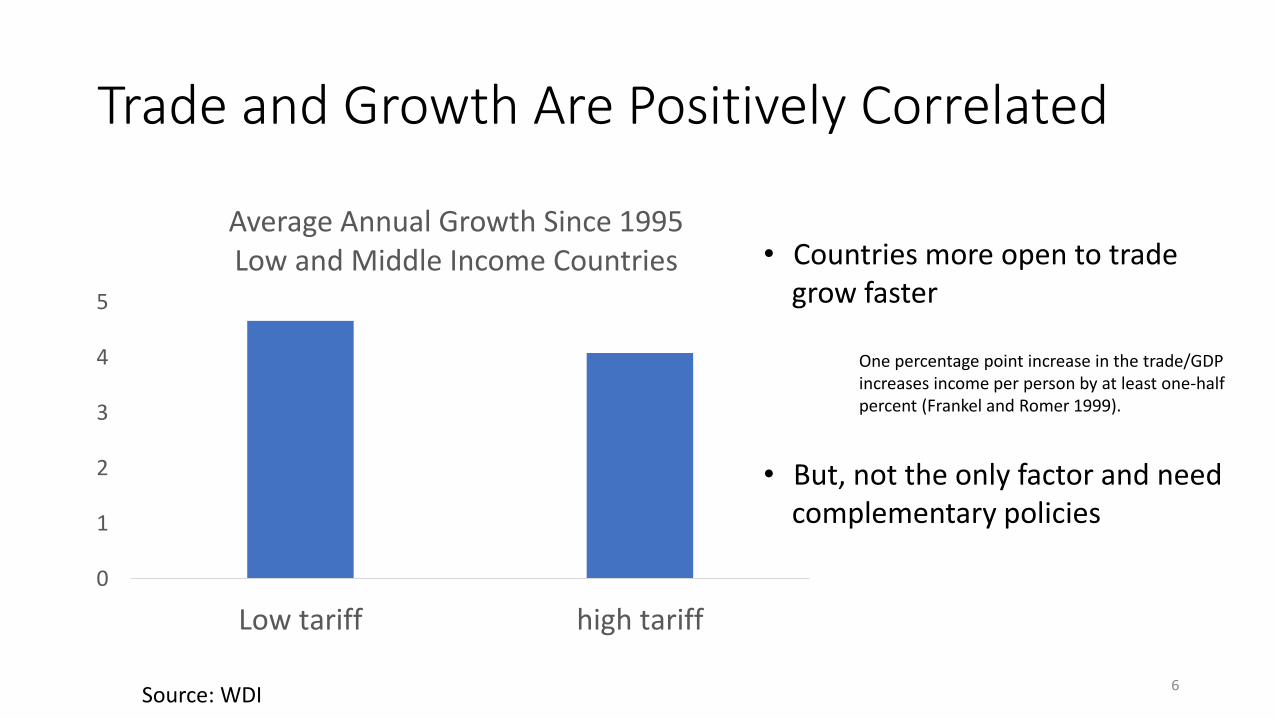
Trade and Growth Are Positively Correlated
0
1
2
3
4
5
Low tariff high tariff
Average Annual Growth Since 1995 Low and Middle Income Countries • Countries more open to trade
grow faster
One percentage point increase in the trade/GDP increases income per person by at least one-half percent (Frankel and Romer 1999).
• But, not the only factor and need complementary policies
Source: WDI6
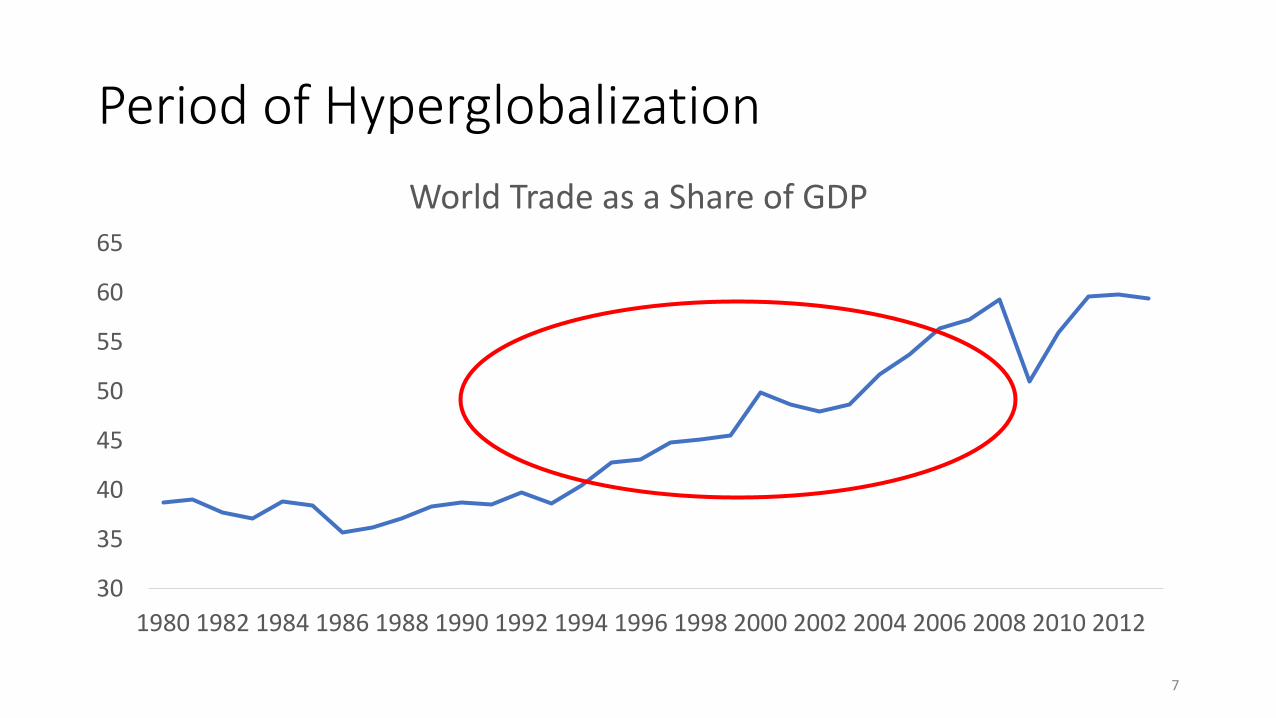
Period of Hyperglobalization
30
35
40
45
50
55
60
65
1980 1982 1984 1986 1988 1990 1992 1994 1996 1998 2000 2002 2004 2006 2008 2010 2012
World Trade as a Share of GDP
7
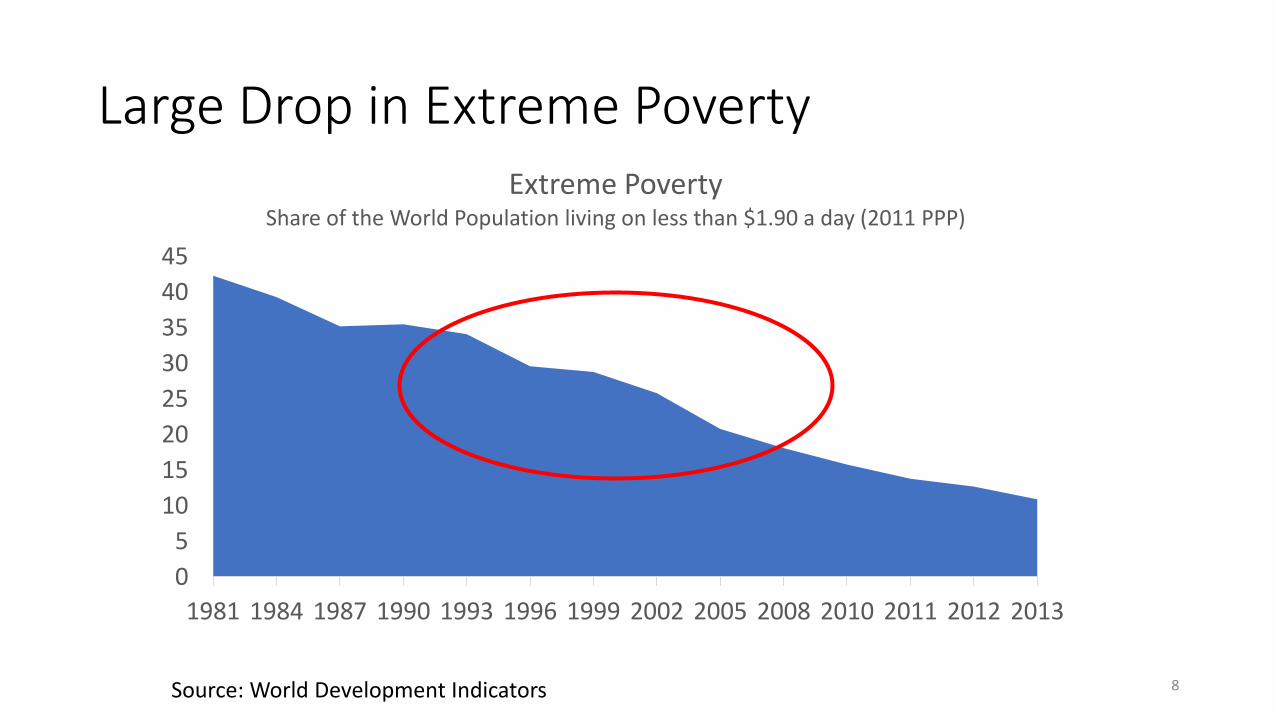
Large Drop in Extreme Poverty
0
5
10
15
20
25
30
35
40
45
1981 1984 1987 1990 1993 1996 1999 2002 2005 2008 2010 2011 2012 2013
Extreme PovertyShare of the World Population living on less than $1.90 a day (2011 PPP)
Source: World Development Indicators 8
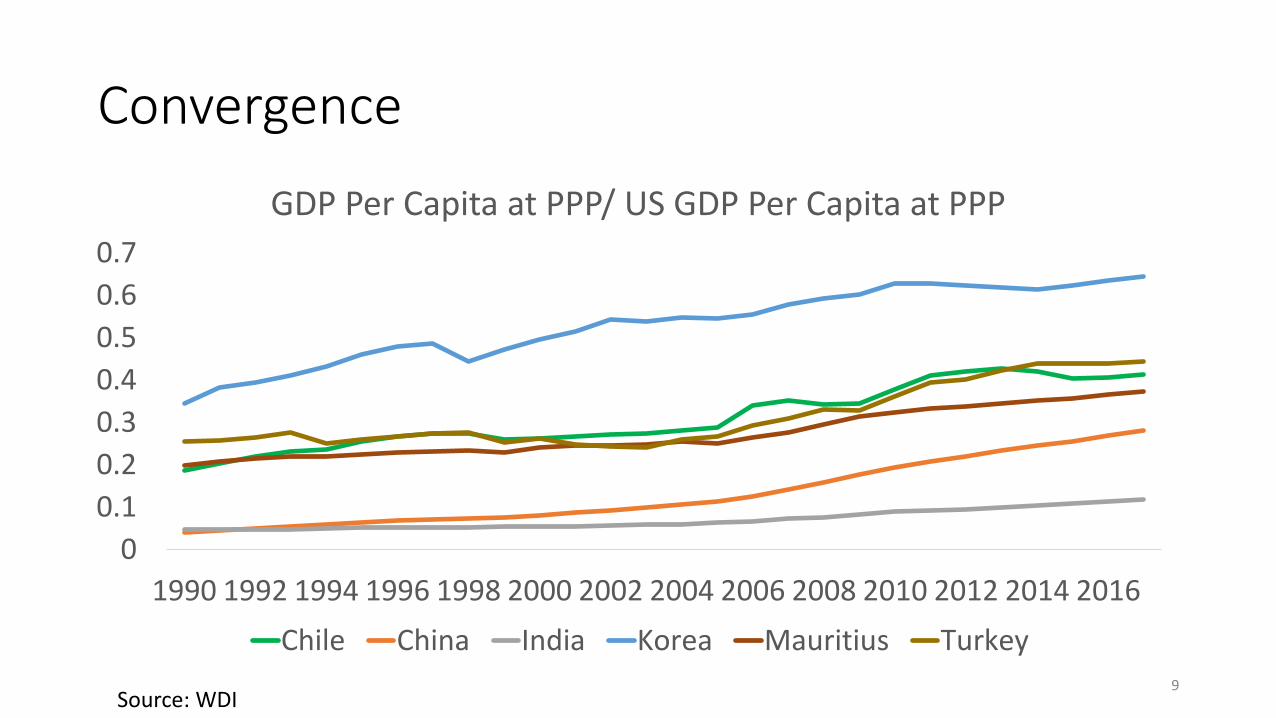
Convergence
0
0.1
0.2
0.3
0.4
0.5
0.6
0.7
1990 1992 1994 1996 1998 2000 2002 2004 2006 2008 2010 2012 2014 2016
GDP Per Capita at PPP/ US GDP Per Capita at PPP
Chile China India Korea Mauritius Turkey
Source: WDI9
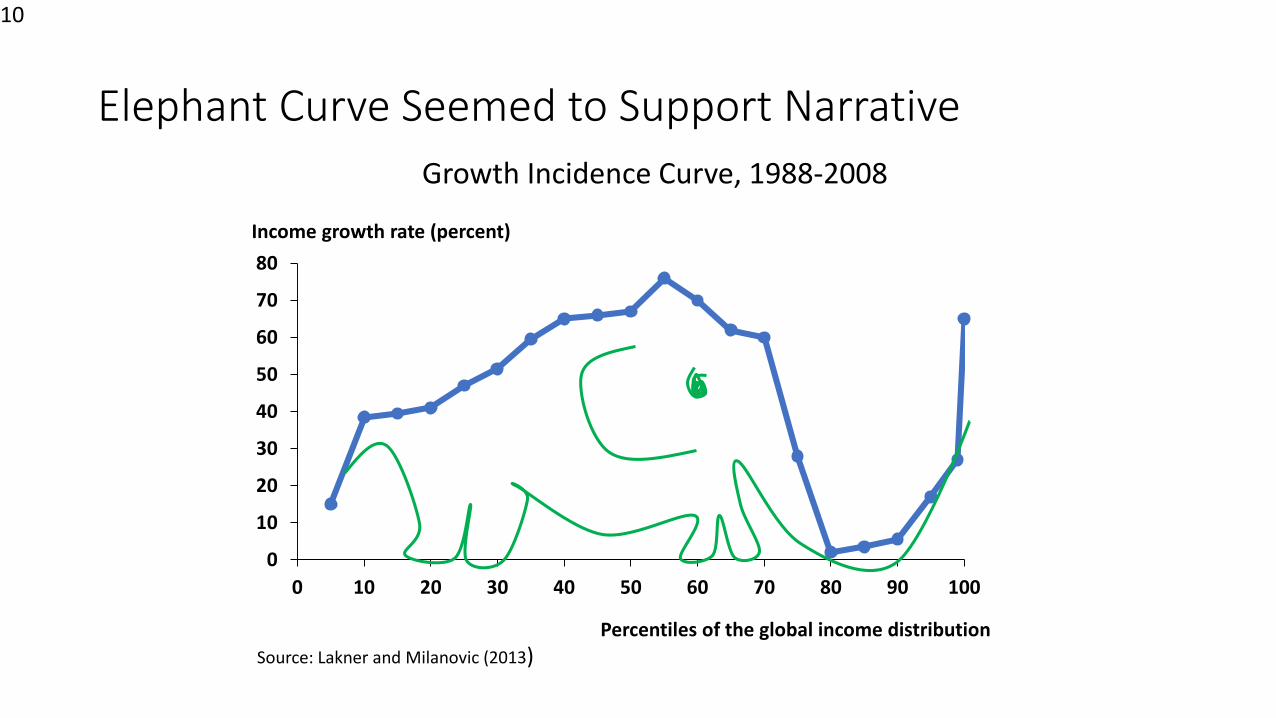
Elephant Curve Seemed to Support Narrative
10
Source: Lakner and Milanovic (2013)
0
10
20
30
40
50
60
70
80
0 10 20 30 40 50 60 70 80 90 100
Percentiles of the global income distribution
Income growth rate (percent)
Growth Incidence Curve, 1988-2008
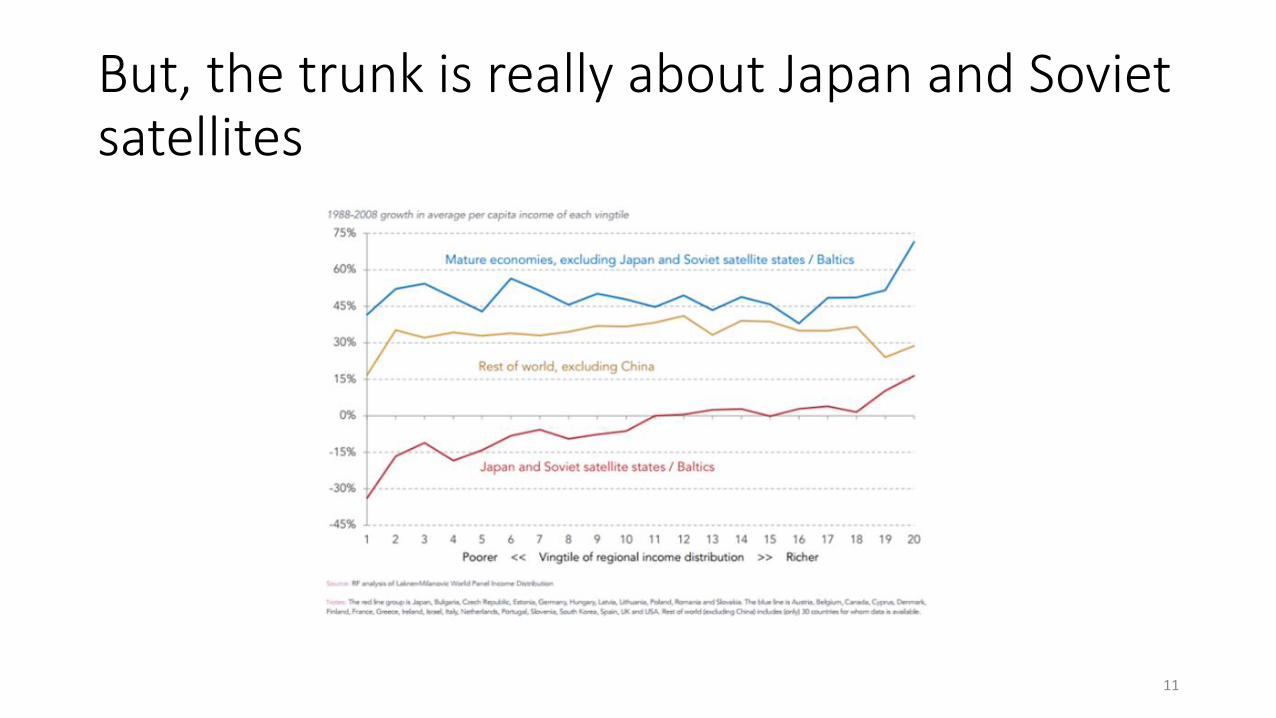
But, the trunk is really about Japan and Soviet satellites
11

What about within-country inequality?
12
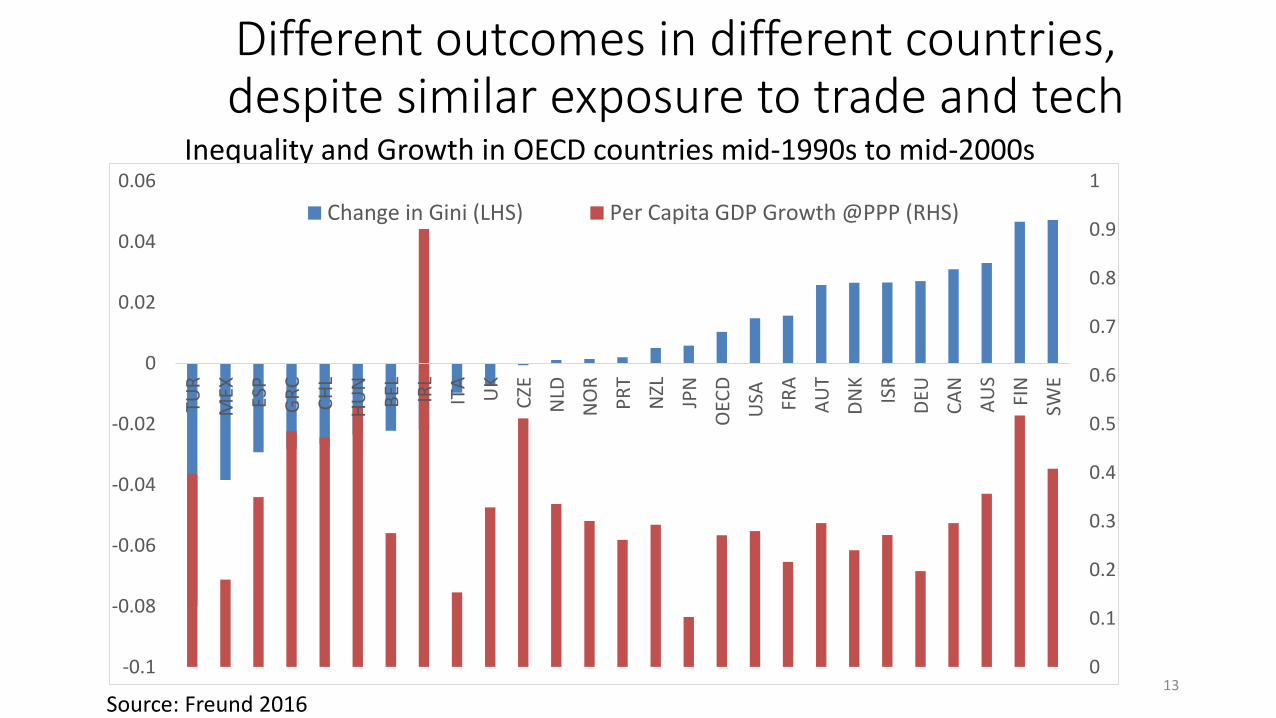
Different outcomes in different countries, despite similar exposure to trade and tech
Inequality and Growth in OECD countries mid-1990s to mid-2000s
13
Source: Freund 2016
0
0.1
0.2
0.3
0.4
0.5
0.6
0.7
0.8
0.9
1
-0.1
-0.08
-0.06
-0.04
-0.02
0
0.02
0.04
0.06TU
R
MEX ES
P
GR
C
CH
L
HU
N
BEL IR
L
ITA
UK
CZE
NLD
NO
R
PR
T
NZL
JPN
OEC
D
USA FR
A
AU
T
DN
K
ISR
DEU
CA
N
AU
S
FIN
SWE
Change in Gini (LHS) Per Capita GDP Growth @PPP (RHS)
The common narrative is Heckscher-Ohlin, but the evidence is not• Heckscher-Ohlin & Stolper-Samuelson
• Trade raises inequality in labor scarce countries
• Trade reduces inequality falls in labor rich countries
• Inequality rises in developed and developing countries in response to liberalization (Goldberg and Pavcnik 2007)
• Change in the relative demand for skilled workers in developed countries has occurred across firms within sectors rather than across sectors (Katz and Murphy 1992 and Berman, Bound, and Griliches1994)
14

The Role of Superstar Firms
15
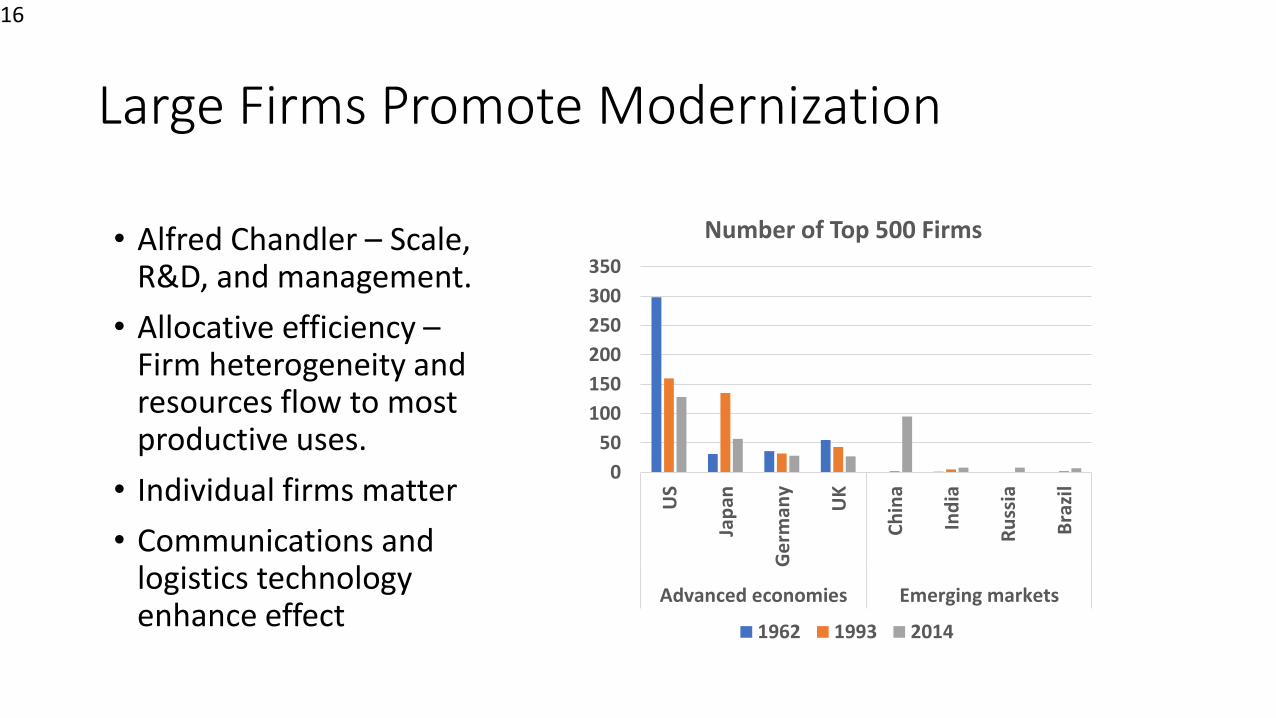
Large Firms Promote Modernization
• Alfred Chandler – Scale, R&D, and management.
• Allocative efficiency –Firm heterogeneity and resources flow to most productive uses.
• Individual firms matter
• Communications and logistics technology enhance effect
16
0
50
100
150
200
250
300
350
US
Jap
an
Ge
rman
y
UK
Ch
ina
Ind
ia
Ru
ssia
Bra
zil
Advanced economies Emerging markets
Number of Top 500 Firms
1962 1993 2014
Allocative Efficiency
• Trade affects productivity through reallocation across firms• As market access abroad expands, most efficient firms export more and grow
• As openness to imports expands, least efficient firms exit
• As countries trade and grow, superstar firms are created
• Increasing trades raises incomes, especially in poor countries, with inefficient allocation of resources
• Increasing trade also creates a class of superrich
17
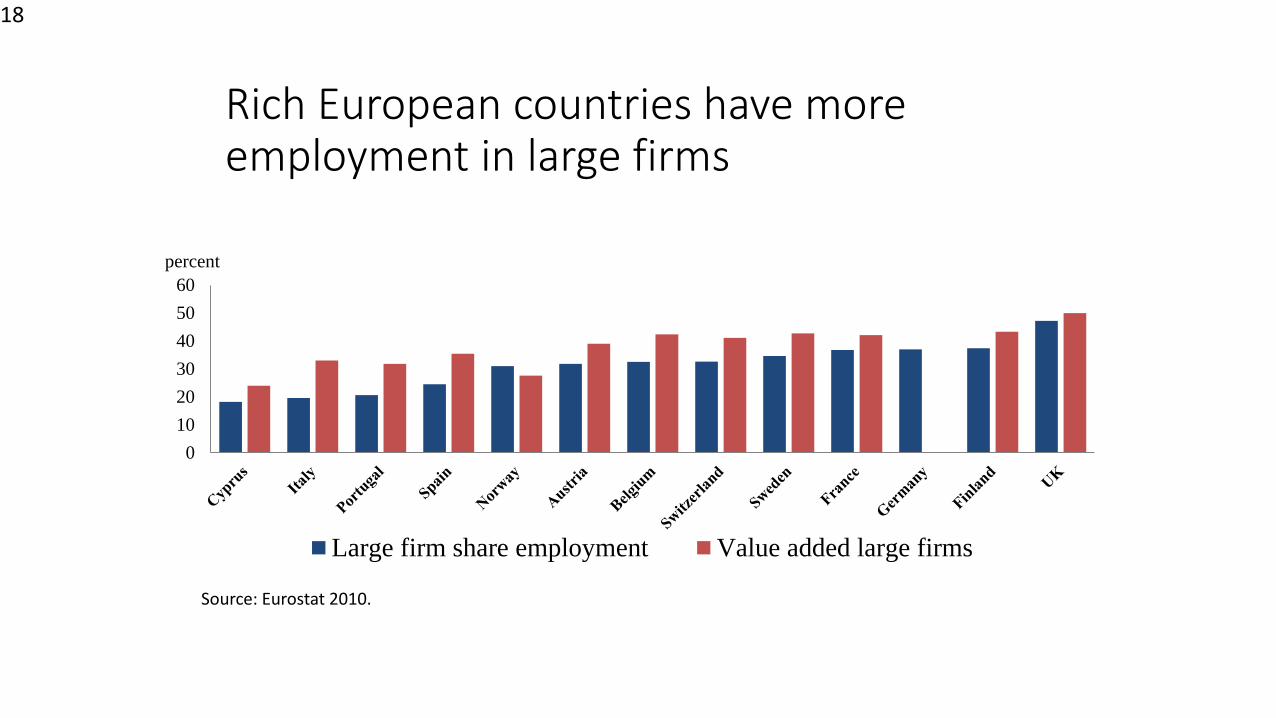
Rich European countries have more employment in large firms
0
10
20
30
40
50
60
percent
Large firm share employment Value added large firms
18
Source: Eurostat 2010.
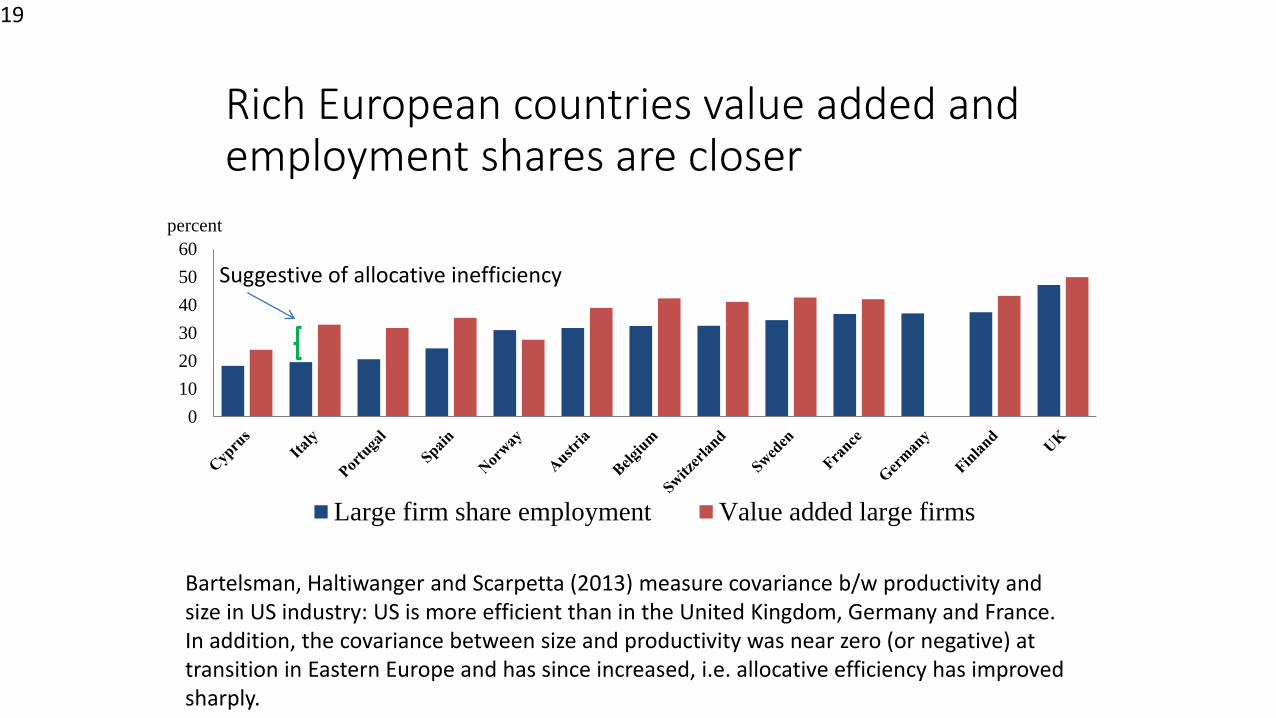
Rich European countries value added and employment shares are closer
0
10
20
30
40
50
60
percent
Large firm share employment Value added large firms
19
Suggestive of allocative inefficiency
Bartelsman, Haltiwanger and Scarpetta (2013) measure covariance b/w productivity and size in US industry: US is more efficient than in the United Kingdom, Germany and France. In addition, the covariance between size and productivity was near zero (or negative) at transition in Eastern Europe and has since increased, i.e. allocative efficiency has improved sharply.
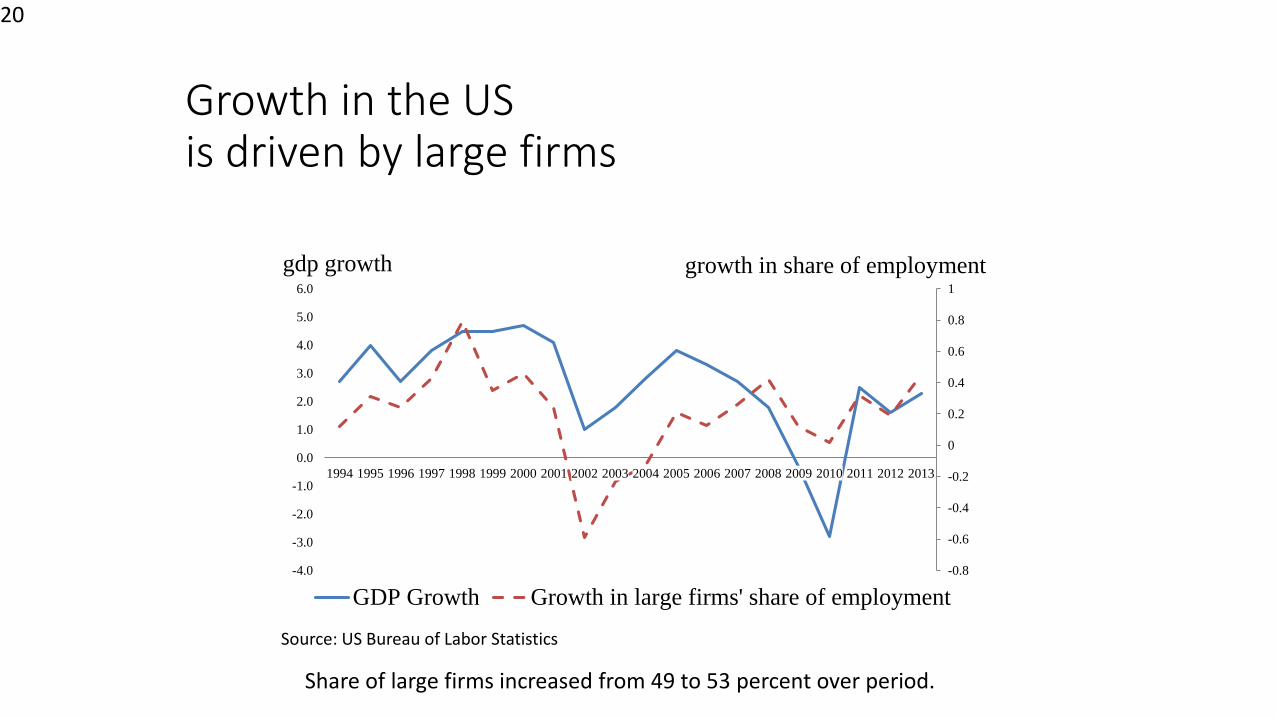
Growth in the US is driven by large firms
-0.8
-0.6
-0.4
-0.2
0
0.2
0.4
0.6
0.8
1
-4.0
-3.0
-2.0
-1.0
0.0
1.0
2.0
3.0
4.0
5.0
6.0
1994 1995 1996 1997 1998 1999 2000 2001 2002 2003 2004 2005 2006 2007 2008 2009 2010 2011 2012 2013
growth in share of employmentgdp growth
GDP Growth Growth in large firms' share of employment
20
Share of large firms increased from 49 to 53 percent over period.
Source: US Bureau of Labor Statistics
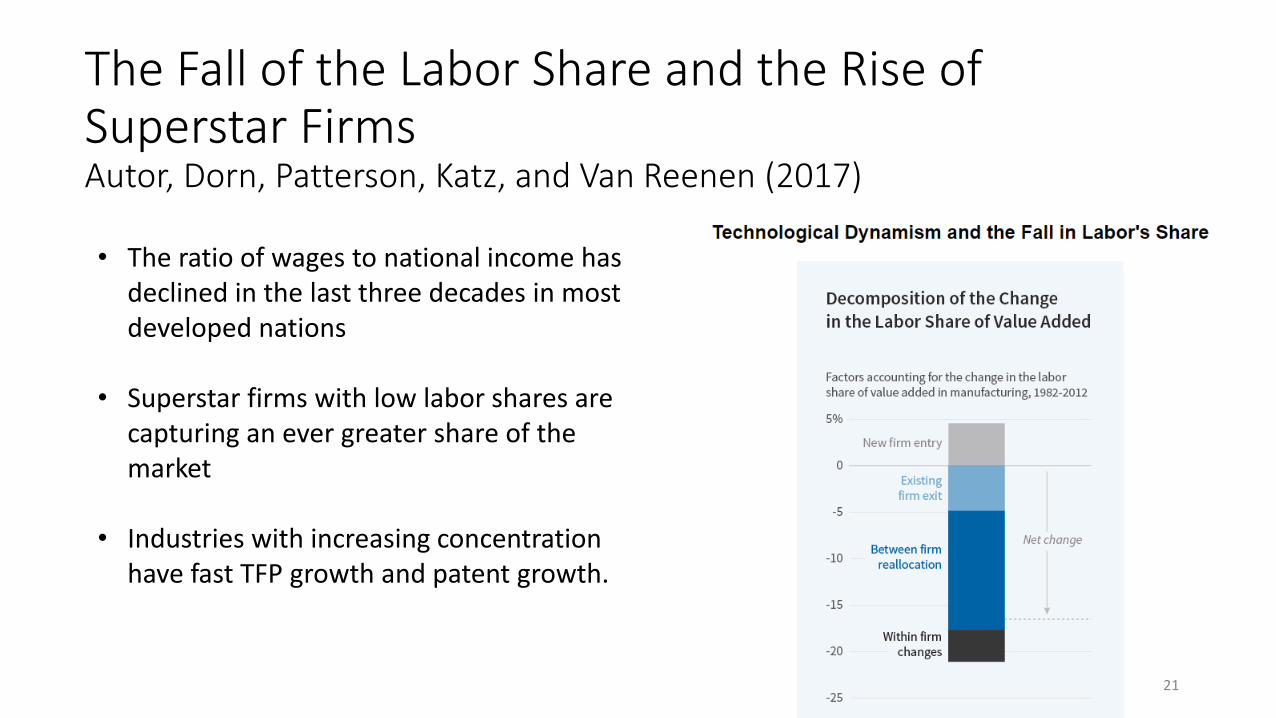
The Fall of the Labor Share and the Rise of Superstar FirmsAutor, Dorn, Patterson, Katz, and Van Reenen (2017)
• The ratio of wages to national income has declined in the last three decades in most developed nations
• Superstar firms with low labor shares are capturing an ever greater share of the market
• Industries with increasing concentration have fast TFP growth and patent growth.
21
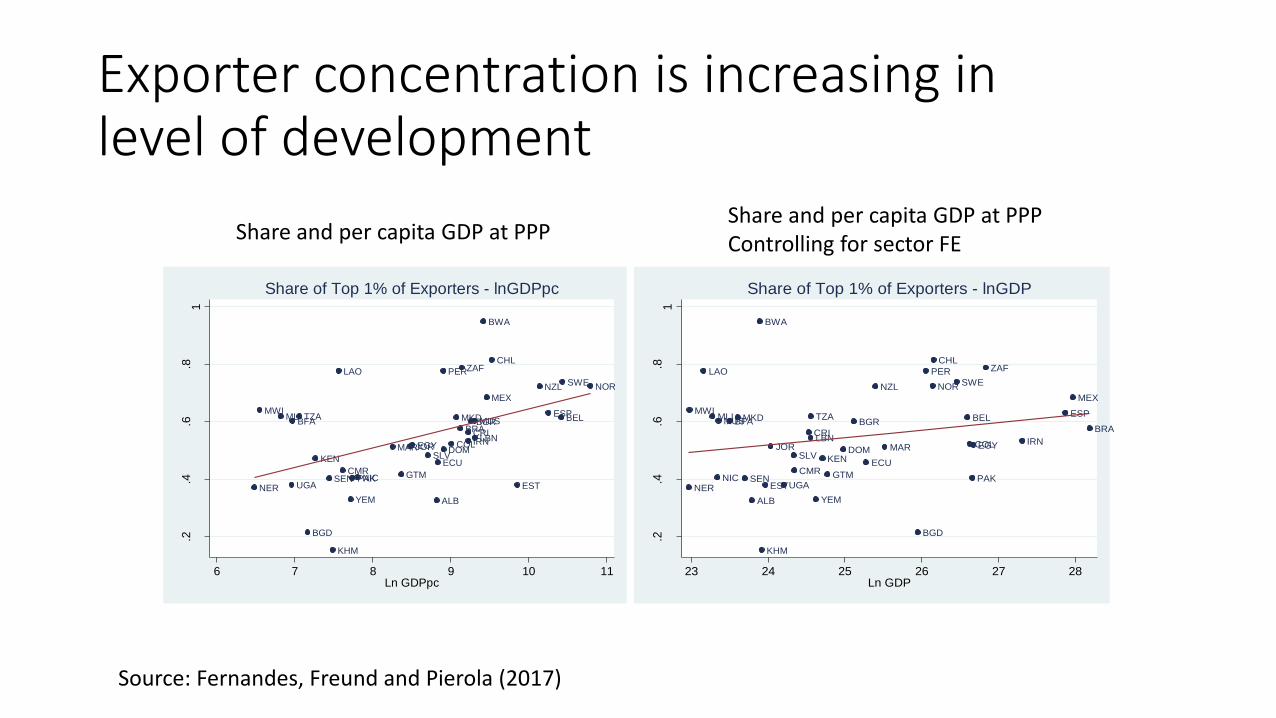
Exporter concentration is increasing in level of development
ALB
BELBFA
BGD
BGRBRA
BWA
CHL
CMR
COL
CRI
DOM
ECU
EGY
ESP
EST
GTM
IRNJOR
KEN
KHM
LAO
LBNMAR
MEX
MKDMLIMUS
MWI
NERNIC
NORNZL
PAK
PER
SEN
SLV
SWE
TZA
UGA
YEM
ZAF
.2.4
.6.8
1
Sh
are
Top
1%
6 7 8 9 10 11Ln GDPpc
Share of Top 1% of Exporters - lnGDPpc
ALB
BELBFA
BGD
BGRBRA
BWA
CHL
CMR
COL
CRI
DOM
ECU
EGY
ESP
EST
GTM
IRNJOR
KEN
KHM
LAO
LBNMAR
MEX
MKDMLIMUS
MWI
NERNIC
NORNZL
PAK
PER
SEN
SLV
SWE
TZA
UGA
YEM
ZAF
.2.4
.6.8
1
Sh
are
Top
1%
23 24 25 26 27 28Ln GDP
Share of Top 1% of Exporters - lnGDP
Share and per capita GDP at PPPShare and per capita GDP at PPPControlling for sector FE
Source: Fernandes, Freund and Pierola (2017)
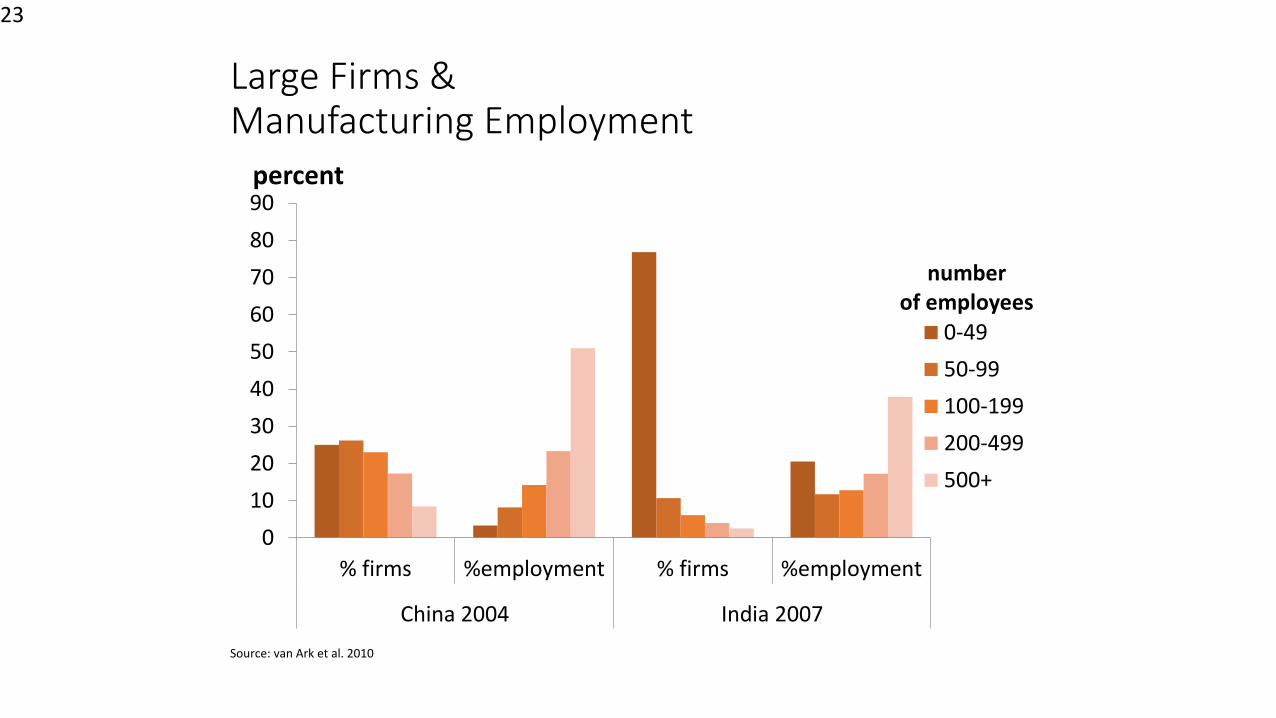
Large Firms & Manufacturing Employment
0
10
20
30
40
50
60
70
80
90
% firms %employment % firms %employment
China 2004 India 2007
number of employees
percent
0-49
50-99
100-199
200-499
500+
23
Source: van Ark et al. 2010
Research confirms importance of large firms
• Cross country research: Average firm size increases with development: 10 percent increase in per capita income associated with a 2.6 percent increase in average firm size. (Bento and Restuccia 2014).
• The myth of the missing middle--Large firms have higher average productivity and that the fraction of missing firms is increasing in firm size (Hsieh and Olken 2014).
• Developing countries export less because they are missing the largest superproductive firms—the firm-size distribution is truncated at the top. Fernandes, Freund, and Pierola (2015).
24
Superstar firms are good for growth, but create extreme wealth
The force of trade is present in North & South
25
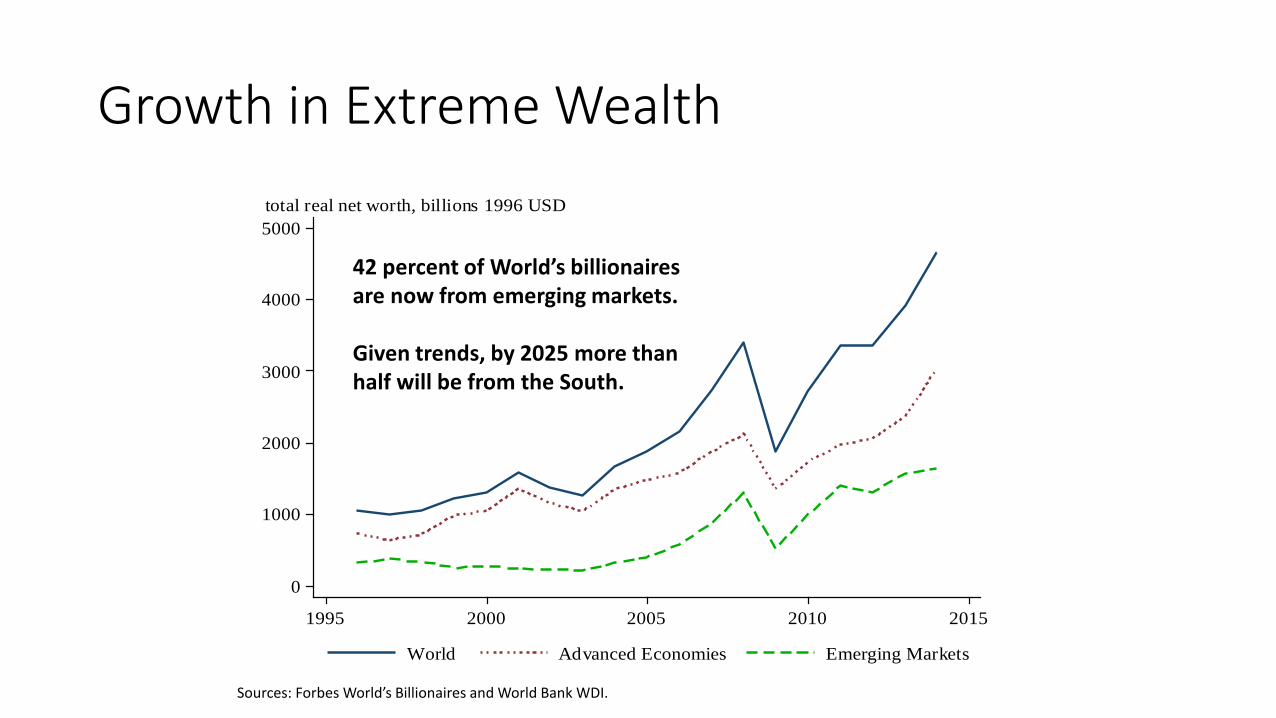
Growth in Extreme Wealth
0
1000
2000
3000
4000
5000
1995 2000 2005 2010 2015
World Advanced Economies Emerging Markets
total real net worth, billions 1996 USD
42 percent of World’s billionaires are now from emerging markets.
Given trends, by 2025 more than half will be from the South.
Sources: Forbes World’s Billionaires and World Bank WDI.
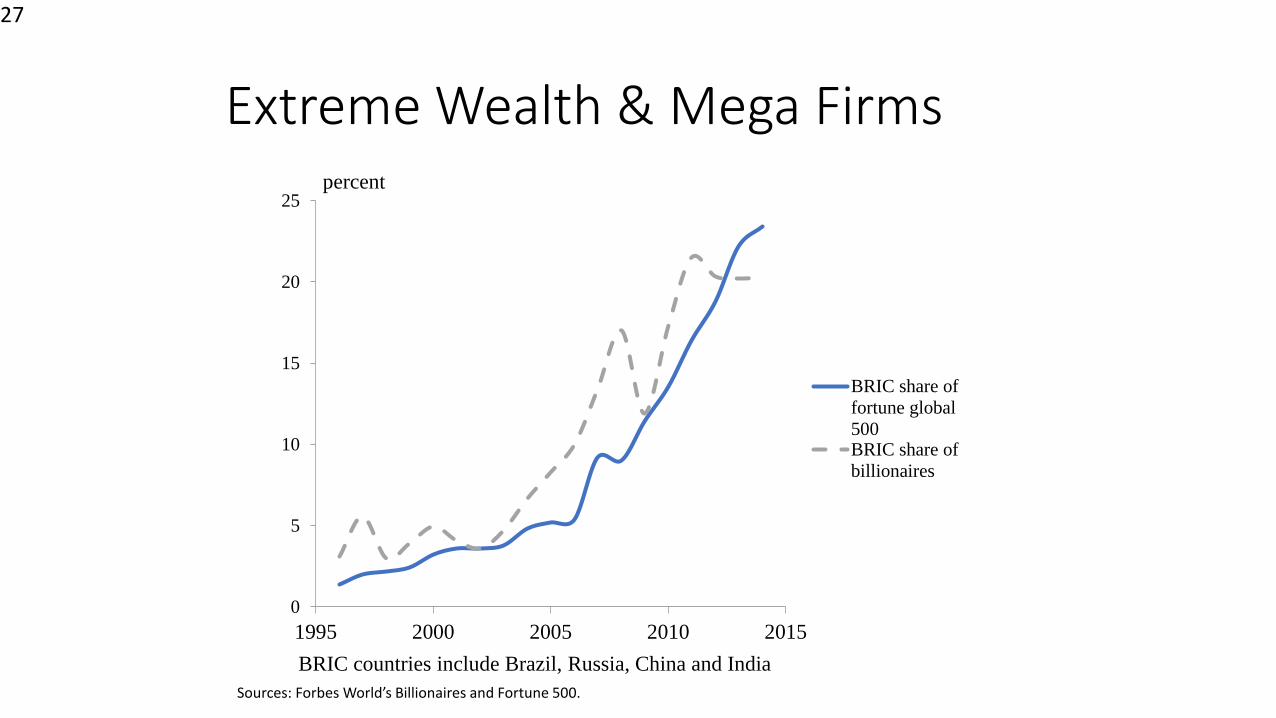
Extreme Wealth & Mega Firms
27
0
5
10
15
20
25
1995 2000 2005 2010 2015
percent
BRIC share of
fortune global
500BRIC share of
billionaires
BRIC countries include Brazil, Russia, China and India
Sources: Forbes World’s Billionaires and Fortune 500.
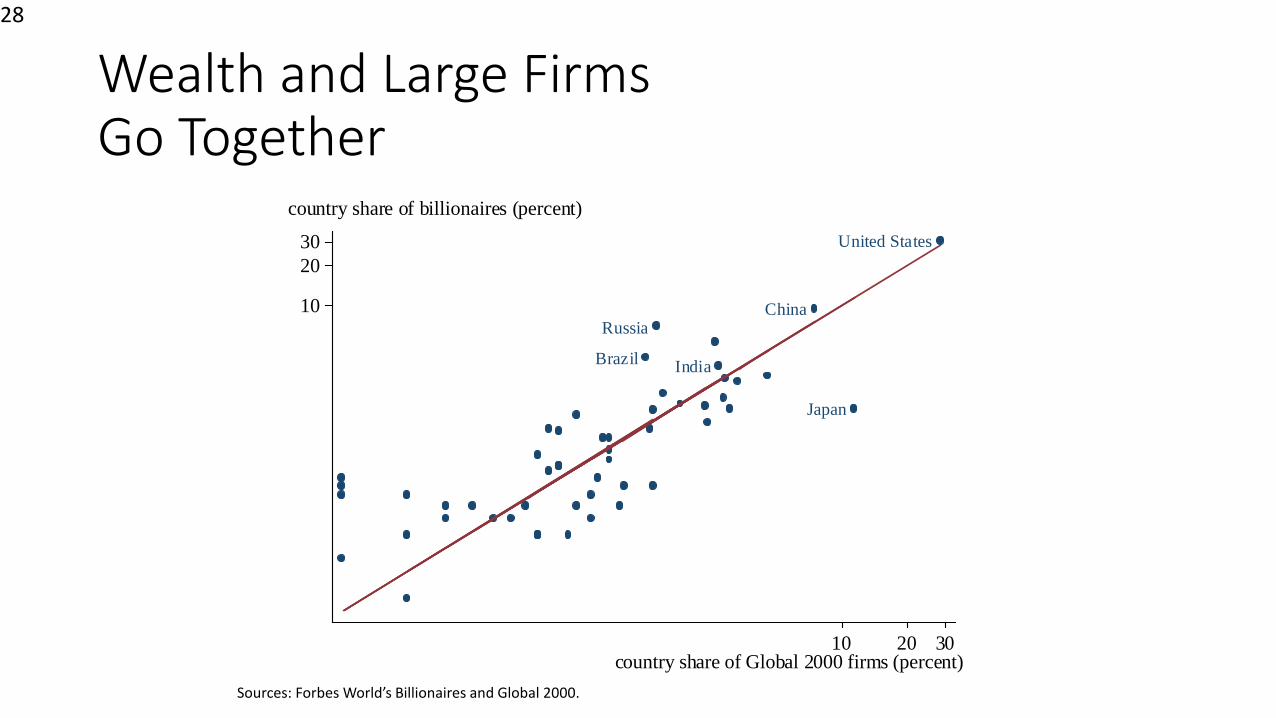
Wealth and Large Firms Go Together
28
Brazil
China
India
Japan
Russia
United States
10
20
30
10 20 30country share of Global 2000 firms (percent)
country share of billionaires (percent)
Sources: Forbes World’s Billionaires and Global 2000.

Where does extreme wealth come from?
29

Who are the Superrich?
• Inheritors
• Self-made• Company founders
• Executives
• Politically connected/resource based
• Finance/real estate
30
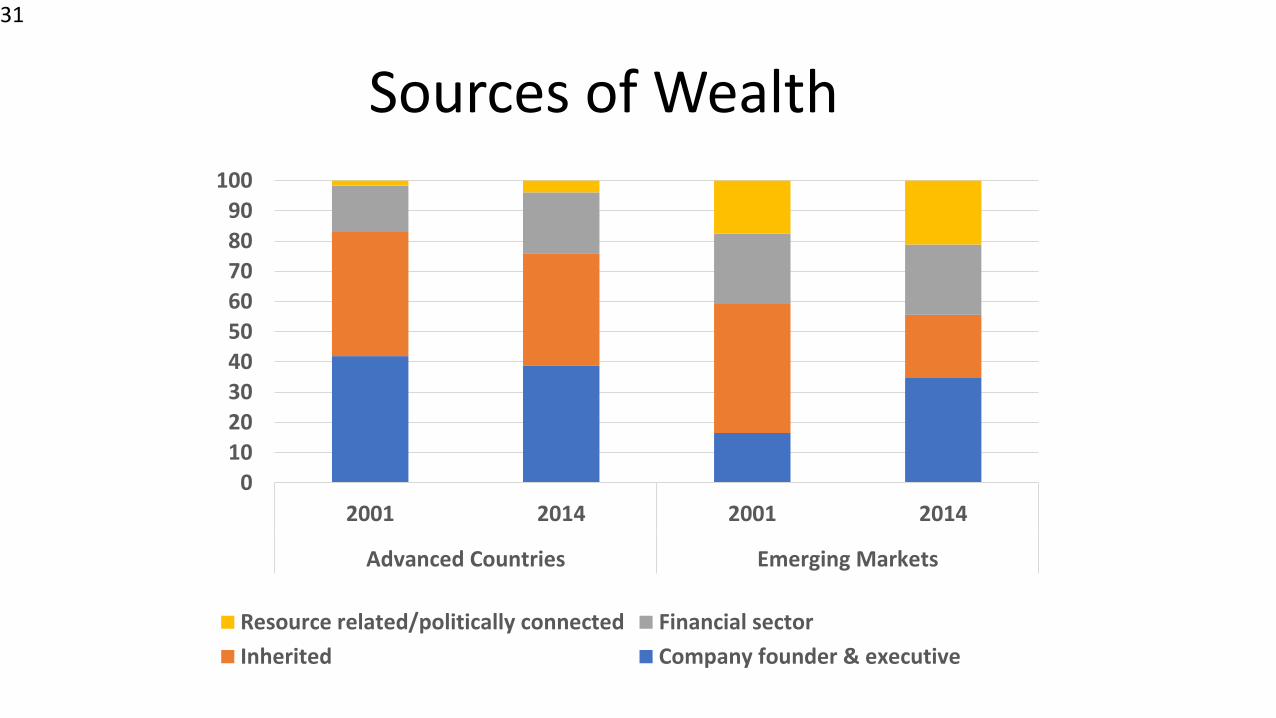
Sources of Wealth
31
0
10
20
30
40
50
60
70
80
90
100
2001 2014 2001 2014
Advanced Countries Emerging Markets
Resource related/politically connected Financial sector
Inherited Company founder & executive
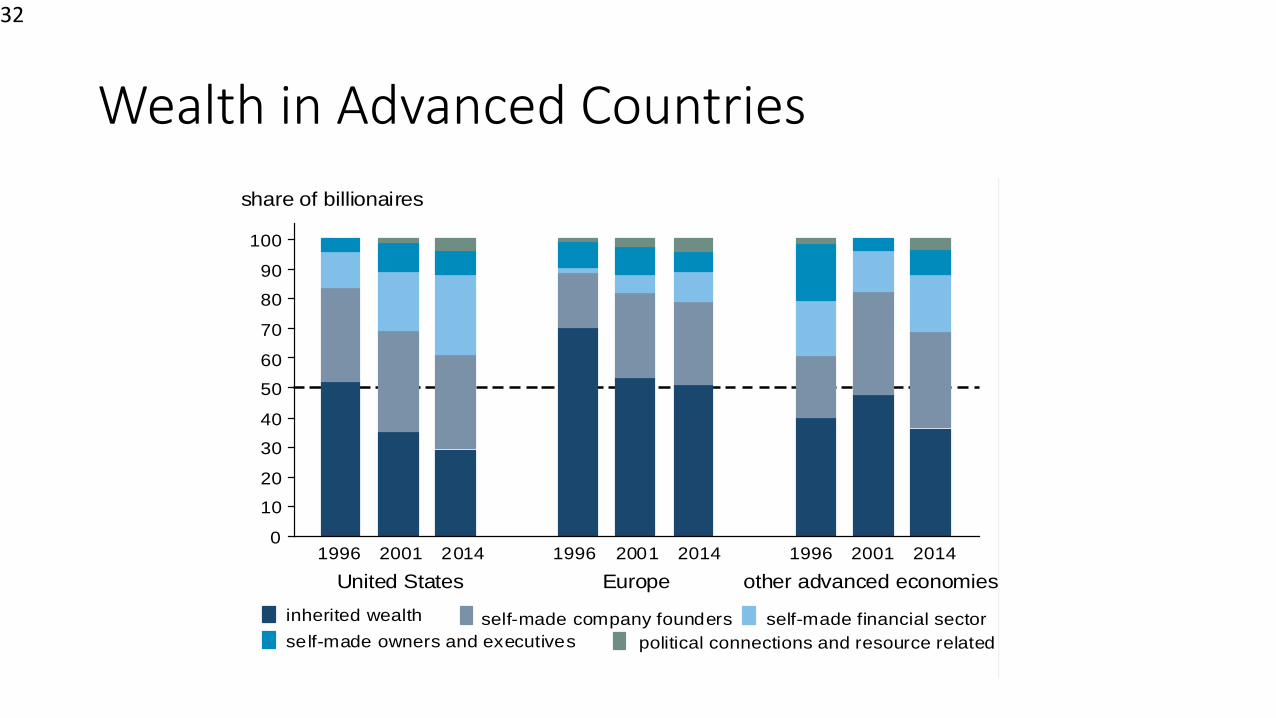
Wealth in Advanced Countries
32
0
10
20
30
40
50
60
70
80
90
100
United States Europe other advanced economies
1996 2001 2014 1996 2001 2014 1996 2001 2014
share of billionaires
inherited wealth self-made company founders self-made financial sector
self-made owners and executives political connections and resource related
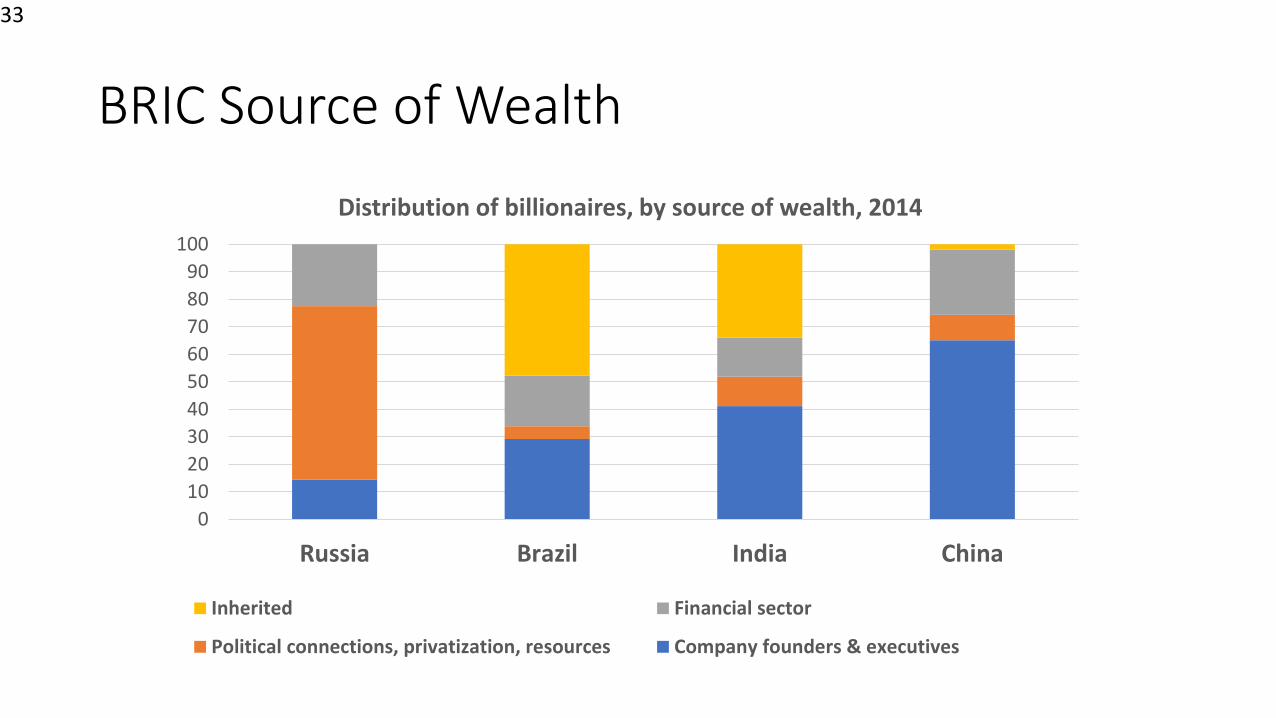
BRIC Source of Wealth
33
0
10
20
30
40
50
60
70
80
90
100
Russia Brazil India China
Distribution of billionaires, by source of wealth, 2014
Inherited Financial sector
Political connections, privatization, resources Company founders & executives
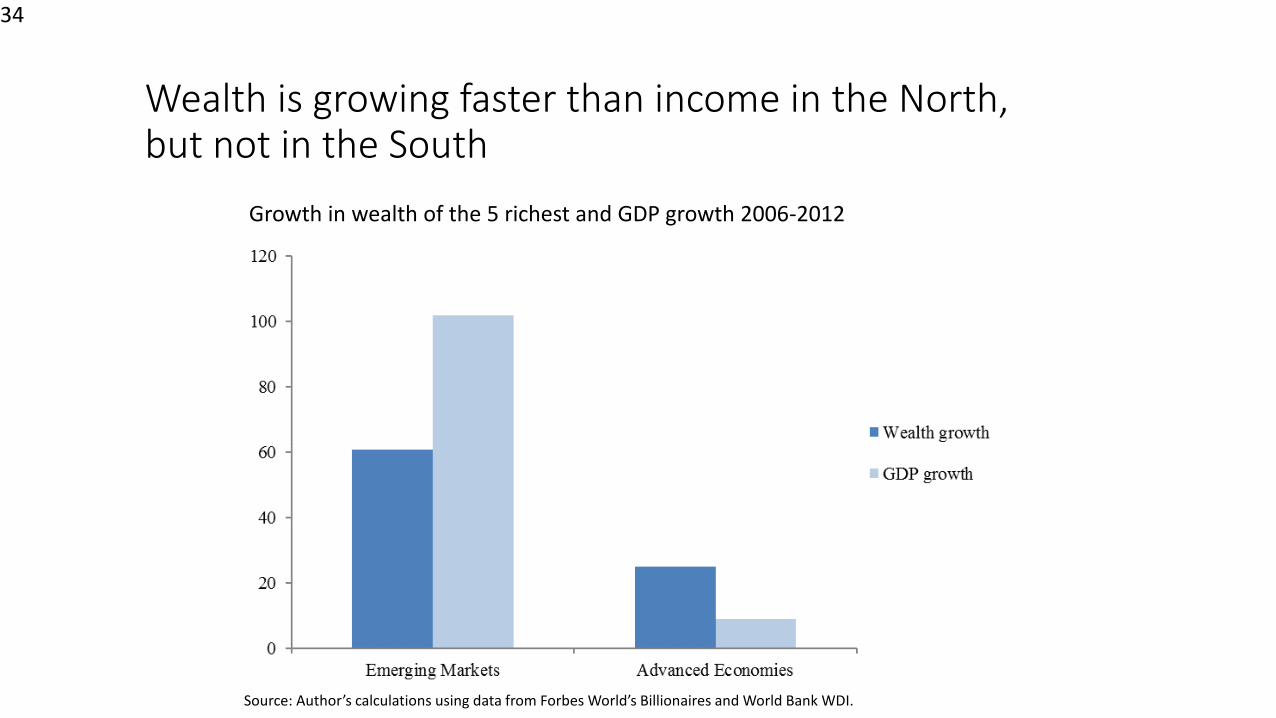
Wealth is growing faster than income in the North, but not in the South
34
Growth in wealth of the 5 richest and GDP growth 2006-2012
Source: Author’s calculations using data from Forbes World’s Billionaires and World Bank WDI.
Policy Implications
• Promote entrepreneurship • Property rights, free entry and openness to trade and foreign investment
• Limit cronyism • Transparent privatization & government procurement, competition policy
• Tax more heavily less productive sources of wealth• Inheritance & (some) finance
35

Why the backlash against globalization now?
36
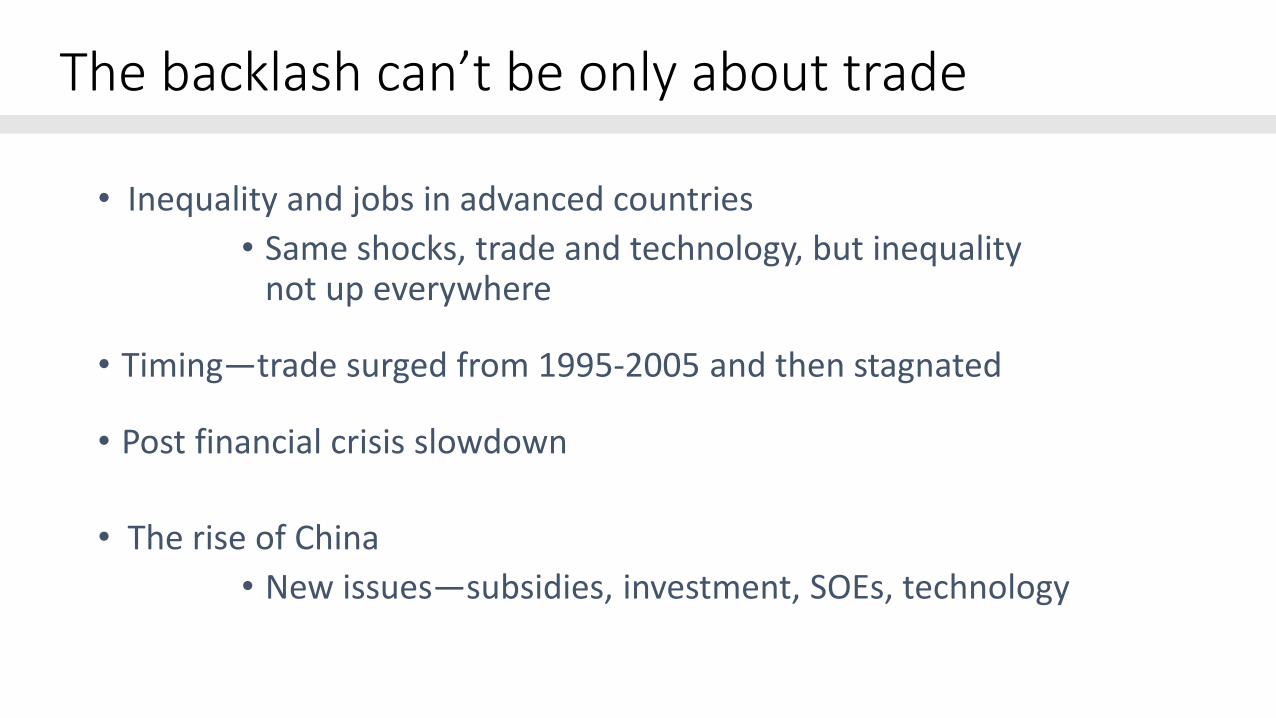
The backlash can’t be only about trade
• Inequality and jobs in advanced countries
• Same shocks, trade and technology, but inequality not up everywhere
• Timing—trade surged from 1995-2005 and then stagnated
• Post financial crisis slowdown
• The rise of China
• New issues—subsidies, investment, SOEs, technology

Other pressures on inequality in Anglo countries• Policies: Tax cuts, deregulation, de-unionization, rise of finance,
lower spending on labor adjustment
• Social: Assortative mating, private schools, tutoring
• Fear around immigration and terrorism
38
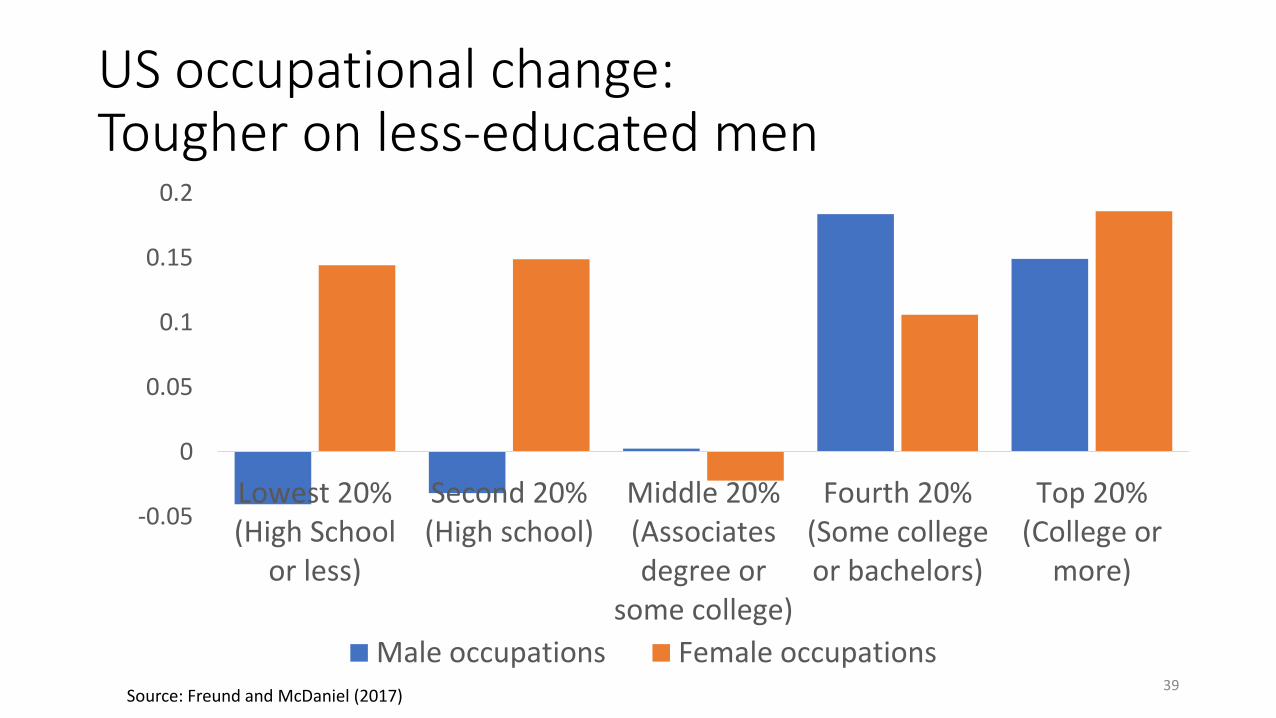
US occupational change: Tougher on less-educated men
-0.05
0
0.05
0.1
0.15
0.2
Lowest 20%(High School
or less)
Second 20%(High school)
Middle 20%(Associatesdegree or
some college)
Fourth 20%(Some collegeor bachelors)
Top 20%(College or
more)
Male occupations Female occupationsSource: Freund and McDaniel (2017)
39
Structural change is difficult
Discontent among workers
But, do workers really blame trade?
40
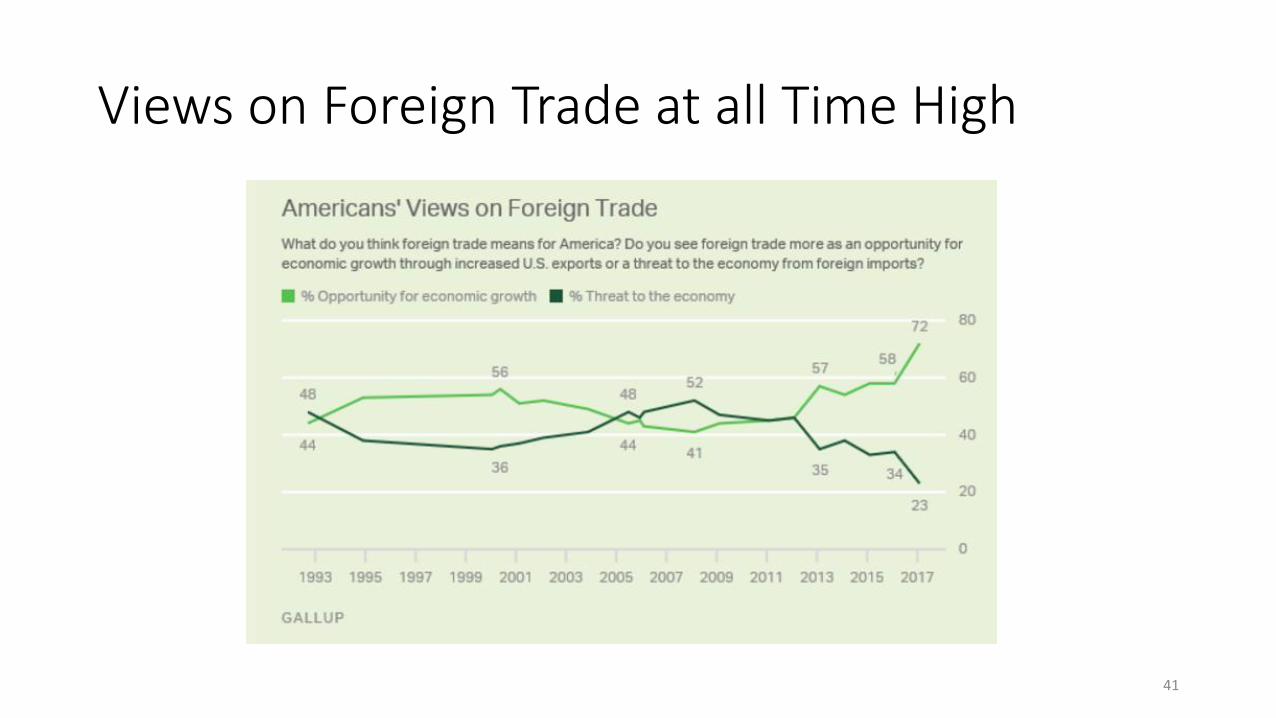
Views on Foreign Trade at all Time High
41
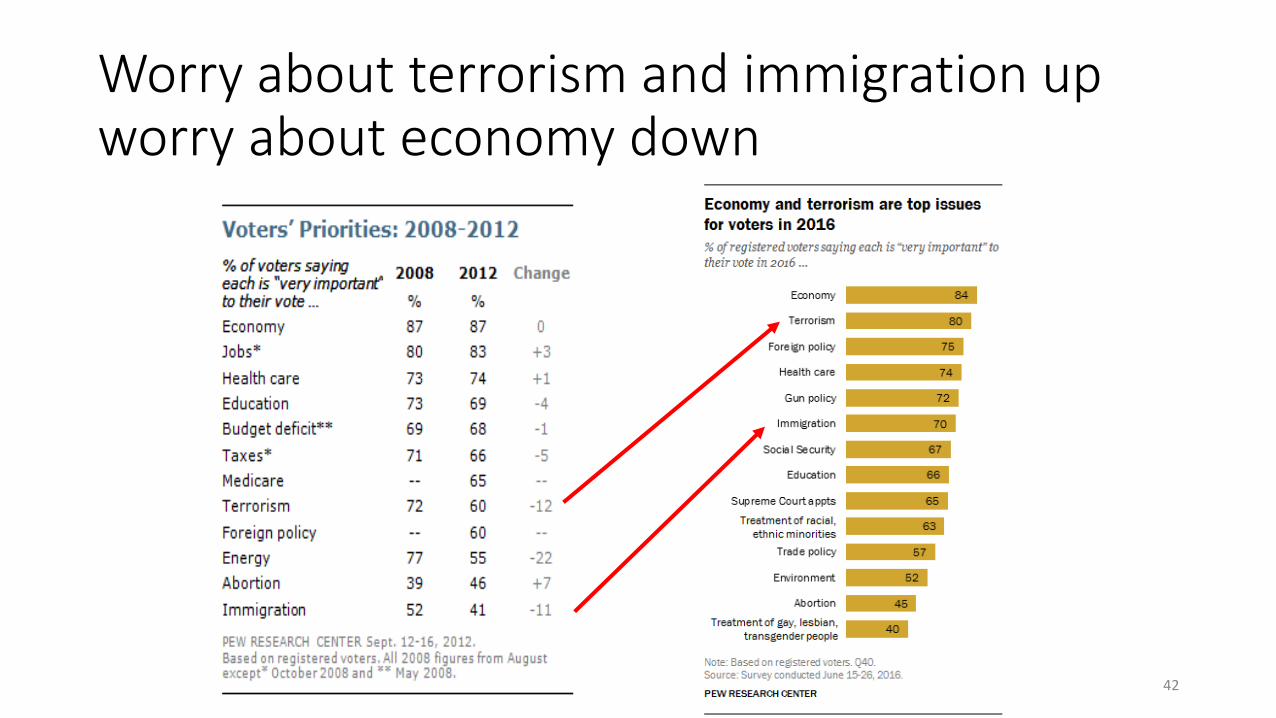
Worry about terrorism and immigration up worry about economy down
42
Moving Forward
• Education, skills and labor adjustment policies• A backlash against the backlash against globalization may be coming
• Anti-Brexit rallies & pro-EU rallies, TPP 11, EU-Japan, Pacific Alliance etc.
• Media’s negative bias is helpful• Trade bashing raged in 2016, not so much now
• Export industries are organizing & gaining voice• International organizations, think tanks and academics offer data and
evidence• Reforming WTO to handle new issues• All countries should continue liberalization programs, avoid resorting to
restrictions, and use the WTO or dispute settlement bodies of regional trading arrangements to bring disputes

Thank you!
Follow me on twitter
@carolinefreund
44

Extras…
45
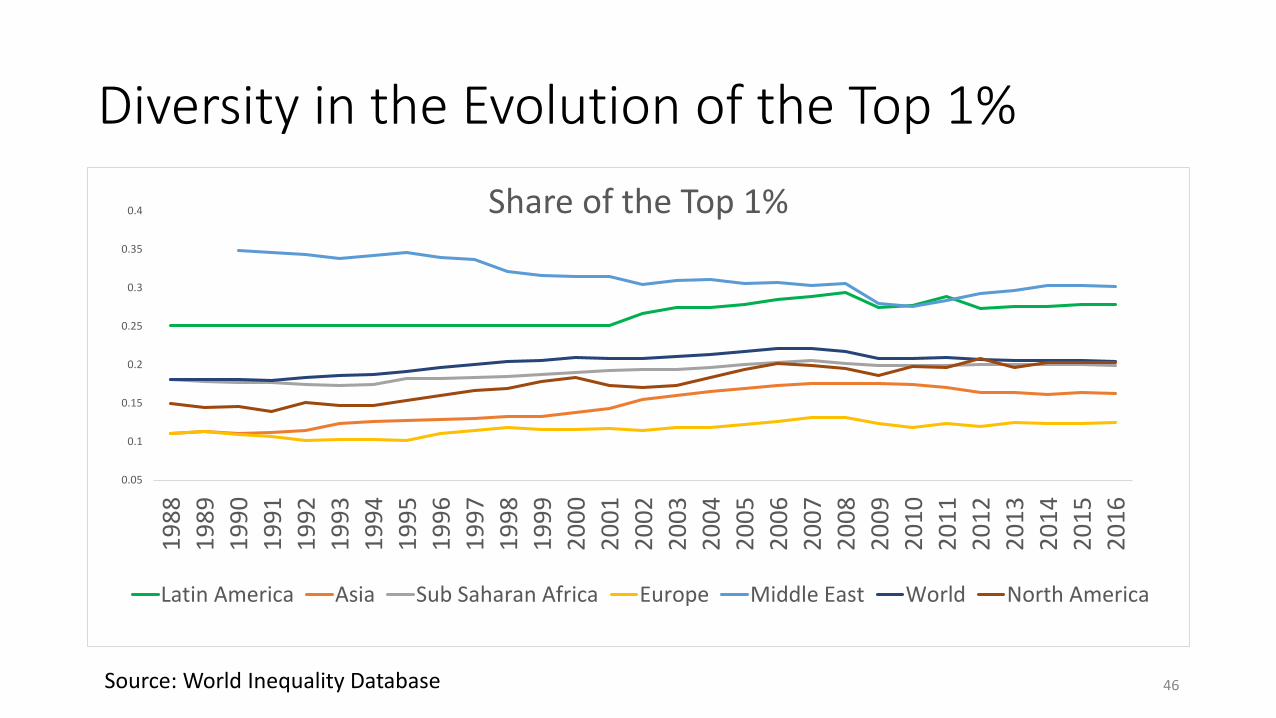
Diversity in the Evolution of the Top 1%
Source: World Inequality Database
0.05
0.1
0.15
0.2
0.25
0.3
0.35
0.4
19
88
19
89
19
90
19
91
19
92
19
93
19
94
19
95
19
96
19
97
19
98
19
99
20
00
20
01
20
02
20
03
20
04
20
05
20
06
20
07
20
08
20
09
20
10
20
11
20
12
20
13
20
14
20
15
20
16
Share of the Top 1%
Latin America Asia Sub Saharan Africa Europe Middle East World North America
46
0
0.05
0.1
0.15
0.2
0.25
19
88
19
89
19
90
19
91
19
92
19
93
19
94
19
95
19
96
19
97
19
98
19
99
20
00
20
01
20
02
20
03
20
04
20
05
20
06
20
07
20
08
20
09
20
10
20
11
20
12
20
13
20
14
20
15
20
16
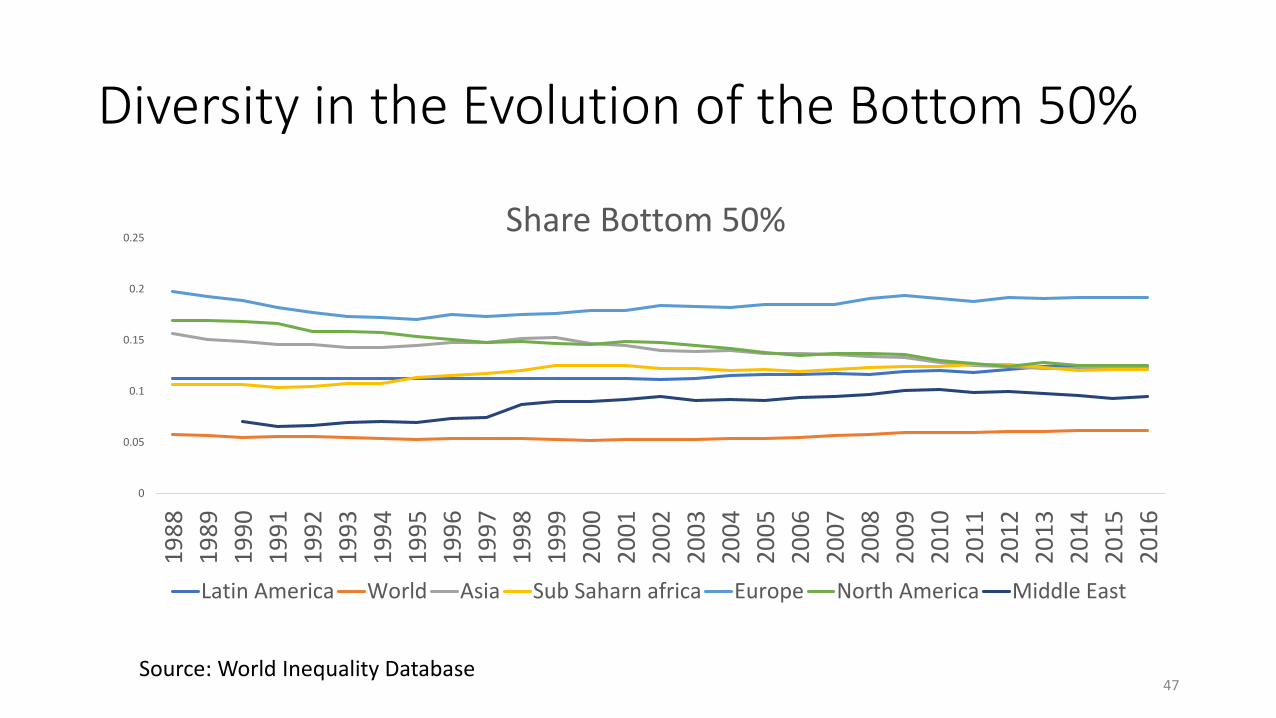
Share Bottom 50%
Latin America World Asia Sub Saharn africa Europe North America Middle East
Diversity in the Evolution of the Bottom 50%
Source: World Inequality Database47
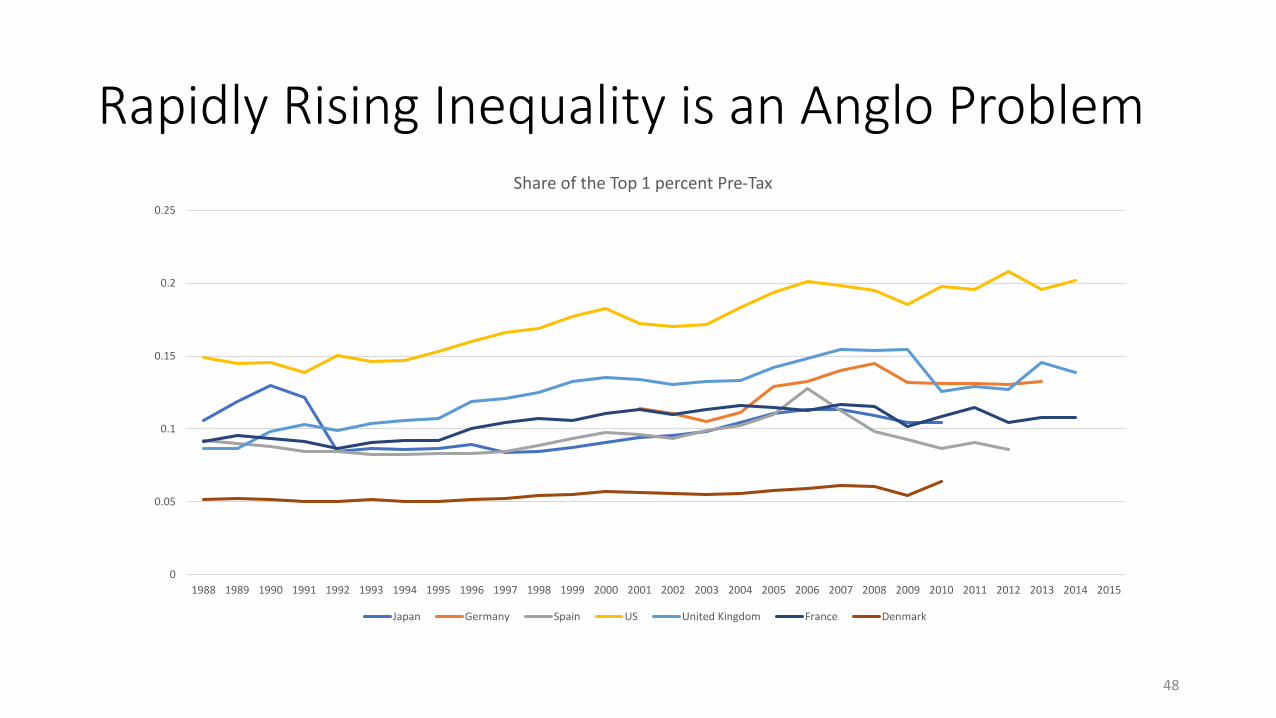
Rapidly Rising Inequality is an Anglo Problem
0
0.05
0.1
0.15
0.2
0.25
1988 1989 1990 1991 1992 1993 1994 1995 1996 1997 1998 1999 2000 2001 2002 2003 2004 2005 2006 2007 2008 2009 2010 2011 2012 2013 2014 2015
Share of the Top 1 percent Pre-Tax
Japan Germany Spain US United Kingdom France Denmark
48