Embed Size (px)
Citation preview
UNITED NATIONS CONFERENCE ON TRADE AND DEVELOPMENT
POLICY ISSUES IN INTERNATIONAL TRADE AND COMMODITIES
STUDY SERIES No. 19
TRADE IN SERVICES – MARKET ACCESS OPPORTUNITIES AND THE BENEFITS OF LIBERALIZATION FOR DEVELOPING
ECONOMIES
by
Greg McGuire
Senior Economist Economic Insights Pty Ltd.
1st Floor, 50 Leichhardt St., Spring Hill Brisbane, Queensland, 4000
Australia
UNITED NATIONS
New York and Geneva, 2002
ii
NOTE
The views expressed in this study are those of the author and do not necessarily reflect the views of the United Nations.
The designations employed and the presentation of the material do not imply the expression of any opinion whatsoever on the part of the United Nations Secretariat concerning the legal status of any country, territory, city or area, or of its authorities, or concerning the delimitation of its frontiers or boundaries.
Material in this publication may be freely quoted or reprinted, but acknowledgement is requested, together with a reference to the document number. A copy of the publication containing the quotation or reprint should be sent to the UNCTAD secretariat:
Chief Trade Analysis Branch
Division on International Trade in Goods and Services, and Commodities United Nations Conference on Trade and Development
Palais des Nations CH-1211 Geneva
UNCTAD/ITCD/TAB/20
UNITED NATIONS PUBLICATION
Sales No. E.02.II.D.9
ISBN 92-1-112556-1
ISSN 1607-8291
© Copyright United Nations 2002 All rights reserved
iii
ABSTRACT
The service sector is the most important sector for most developing economies. It is the largest contributor to gross domestic product, production and employment. Since it is such an important sector, developing economies need to identify their comparative advantage in services and potential export markets.
Developing economies have a comparative advantage in labour services. They have an
abundance of low and semi-skilled labour that is a major input into tourism, construction and transport services. New potential export opportunities are also emerging in communications and computer services. However, the export of many of these services is limited by many restrictions on the temporary movement of labour imposed by their trading partners through domestic regulation. Developing economies can improve their export revenues by specifically identifying these restrictions and, where a movement of labour is required, promote the benefits to potential export markets of services trade liberalization.
Developing economies are projected to be better off by US$ 130 billion from services
trade liberalization. Consistent with similar modelling exercises for trade in goods, while there are some benefits from improving market access to foreign markets, most of the benefits come for liberalizing one’s own market. As developing economies remove their restrictions, their service sectors develop, primarily funded by foreign direct investment, and they become major exporters of services. The main restrictions on service suppliers that are preventing developing economies from realizing these benefits are limits on foreign direct investment, stringent licensing requirements and restrictions on expanding operations.
iv
ACKNOWLEDGEMENTS
I would like to thank UNCTAD for inviting me to write a paper on a topic that is a major issue for developing economies in the new round of WTO negotiations. I am grateful to UNCTAD for their valuable comments, particularly Sam Laird, and Jenifer Tacardon-Mercado for organizing the final publication of the paper. Dr. John Fallon from Economic Insights Pty Ltd also provided some extremely useful comments. I originally presented the paper at the Workshop on Market Access at the United Nations in New York on 8-9 January 2002 and the comments provided by the participants are also gratefully acknowledged.
The paper draws heavily on the work of the Australian Productivity Commission who, in recent years, have been at the forefront in measuring and modelling the benefits of services trade liberalization.
v
CONTENTS
INTRODUCTION............................................................................................................1 I. AN OVERVIEW OF INTERNATIONAL TRADE IN SERVICES...................2 II. MARKET ACCESS FOR DEVELOPING ECONOMIES.................................4 A. Developing economies and comparative advantage ........................................4
B. Market access and the movement of natural persons ......................................4 C. Market access and tourism services................................................................6 D. Market access and new export opportunities ..................................................7
III. WHAT’S AT STAKE FOR DEVELOPING ECONOMIES?............................9 IV. WHAT ARE THE RESTRICTIONS AND THEIR EFFECTS?......................13
A. Measuring restrictions on trade in services ...................................................13 1. Trade restrictiveness index results for developing economies...............16 2. Restrictions on services and GDP per capita .......................................19 B. The effect of restrictions on the price and cost of services ............................21 1. Results from price and cost estimations...............................................22 2. Benefits of removing restrictions on market access..............................26 V. LIBERALIZATION, EFFICIENCY AND THE DOMESTIC SERVICE SECTOR...........................................................................................27 A. The importance of the financial services sector.............................................30 B. Unilateral and multilateral liberalization........................................................31 VI. CONCLUSION...................................................................................................32 REFERENCES ..............................................................................................................33
vi
Tables
1. Effects of liberalizing trade in services...................................................................10 2. Effects of partial liberalization on world real income .............................................11 3. An example of classifying trade restrictions on banking services ............................14 4. Price and cost raising effect of restrictions for developing economies ....................24 5. Price and cost raising effect of restrictions for developed economies .....................25
Figures 1. World exports and imports of services for selected regions, 2000............................2 2. An illustration of the results from the trade restrictiveness index............................15 3. Banking services ...................................................................................................16 4. Distribution services..............................................................................................17 5. Maritime services..................................................................................................18 6. Professional services .............................................................................................19 7. Telecommunications services ................................................................................20 8. GDP per capita at PPP and average foreign trade restrictiveness index scores for the service sector ..................................................................................21 9. GDP per capita at PPP and foreign trade restrictiveness index scores for banking services ..............................................................................................22 10. GDP per capita at PPP and foreign trade restrictiveness index scores for telecommunications services............................................................................23
Boxes
1. How are services traded? ........................................................................................3 2. Developing economies, market access and the GATS..............................................7 3. Foreign direct investment and developing economies.............................................29
1
The economic and trade performanceof an economy is dependent on the efficiencyof its service sector. Not only do economiesderive the bulk of their employment and in-come from the service sector, but also manyservices � financial, telecommunicationsand transport � are vital intermediate inputsfor other sectors. The international competi-tiveness of traditional sectors of developingeconomies is heavily dependent on access toservices at world prices. The best guaranteethat services will be supplied at world pricesis to open an economy to the pressures andopportunities of international competition ortrade and investment liberalization.
Developing economies benefit fromliberalization by gaining market access andexporting those services in which they havea relative strength or comparative advantage.Access to foreign services markets is impor-tant for developing countries to enable themto improve their export earnings and the em-ployment opportunities of their nationals, aswell as increase the efficiency in their owneconomies so as to mobilize resources fordevelopment. Global economic integrationand technological developments have in-creased international trade in services and areproviding many export opportunities for de-veloping economies.
Developing economies have the po-tential to reap greater benefits from liberali-zation than developed economies, primarilyby liberalizing their own service sector. Do-mestic liberalization permits resources to beallocated to their most efficient uses. A moreefficient allocation of resources improves the
price, choice and quality of services, andoverall economic capacity, which facilitatestrade in agriculture and manufacturing � atraditional export earner for developingeconomies. Central to building economiccapacity and progressing development is anefficient financial services sector. Liberal andappropriately regulated financial servicessectors efficiently mobilize savings for in-vestment, provide payment mechanisms forbusiness transactions and improve the stabil-ity of financial institutions.
Sophisticated general equilibriummodelling of liberalizing trade in servicesprovide insights into the projected real-in-come gains from a more efficient allocationof resources for development. The resultsestablish a framework for negotiating priori-ties when the gains from liberalizing tradein services are compared with those for agri-culture and manufacturing. They also providevaluable information to negotiators andpolicy makers on the potential gains fromimproved market access as well as on ap-proaches to liberalization.
The greatest benefits will come fromliberalizing all services markets � domesticand foreign. Politically, this is extremely dif-ficult, but a multilateral framework thatachieves market access in foreign marketscan be an impetus for liberalizing one�s ownmarket. While this paper covers market ac-cess in foreign markets, results from empiri-cal research indicate that most of the gainsare from domestic liberalization � what youdo for yourself is more important than whatothers do for you.
INTRODUCTION
2
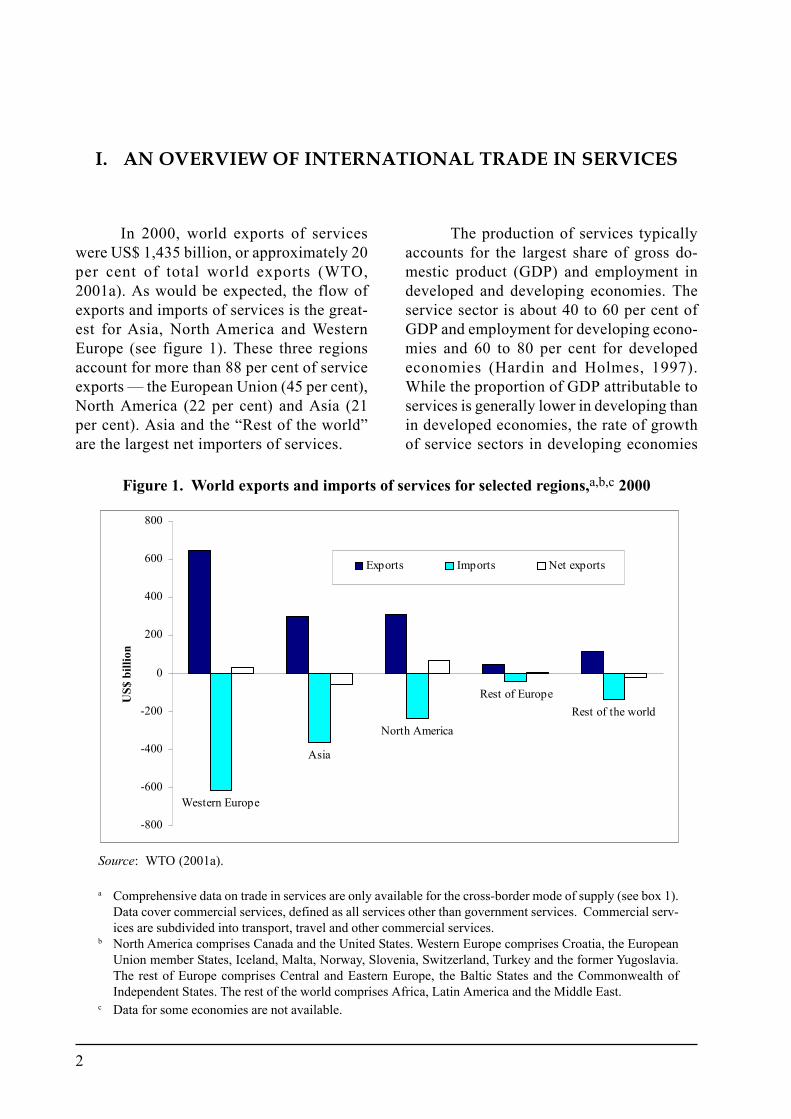
In 2000, world exports of serviceswere US$ 1,435 billion, or approximately 20per cent of total world exports (WTO,2001a). As would be expected, the flow ofexports and imports of services is the great-est for Asia, North America and WesternEurope (see figure 1). These three regionsaccount for more than 88 per cent of serviceexports � the European Union (45 per cent),North America (22 per cent) and Asia (21per cent). Asia and the �Rest of the world�are the largest net importers of services.
The production of services typicallyaccounts for the largest share of gross do-mestic product (GDP) and employment indeveloped and developing economies. Theservice sector is about 40 to 60 per cent ofGDP and employment for developing econo-mies and 60 to 80 per cent for developedeconomies (Hardin and Holmes, 1997).While the proportion of GDP attributable toservices is generally lower in developing thanin developed economies, the rate of growthof service sectors in developing economies
I. AN OVERVIEW OF INTERNATIONAL TRADE IN SERVICES
Figure 1. World exports and imports of services for selected regions,a,b,c 2000
Source: WTO (2001a).
a Comprehensive data on trade in services are only available for the cross-border mode of supply (see box 1).Data cover commercial services, defined as all services other than government services. Commercial serv-ices are subdivided into transport, travel and other commercial services.
b North America comprises Canada and the United States. Western Europe comprises Croatia, the EuropeanUnion member States, Iceland, Malta, Norway, Slovenia, Switzerland, Turkey and the former Yugoslavia.The rest of Europe comprises Central and Eastern Europe, the Baltic States and the Commonwealth ofIndependent States. The rest of the world comprises Africa, Latin America and the Middle East.
c Data for some economies are not available.
Western Europe
Asia
North America
Rest of EuropeRest of the world
-800
-600
-400
-200
0
200
400
600
800
US$
bill
ion
Exports Imports Net exports
3
is faster than that in developed economies(OECD, 1999).
The importance of services to aneconomy is even greater than that reflectedin direct sectoral shares of GDP and employ-ment because services are important inputsfor all aspects of processing and production.The growth of an economy�s service sectoris strongly associated with product speciali-zation, income growth and economic mod-ernization. Services provide much of the nec-essary infrastructure for investment and eco-nomic growth, ensuring that their efficientdelivery is an important means of improvingan economy�s overall productivity.
Global economic integration and tech-nological developments have led to a con-tinual expansion of a range of traded serv-ices which are defined as including bothtransactions between residents and non-resi-dents, and transactions across geographicalborders. International transactions, which inearlier times would have been impossible orprohibitively expensive, have now becomecommonplace because of the ease with whichpeople can move and communicate acrossinternational borders. For example, the fallin the cost of international air services in re-cent decades has made many tourist servicestradable. These services were previouslyavailable only to domestic consumers. Box1 outlines how services are traded.
The major distinction between interna-tional trade in goods and international trade inservices lies in the movement of the factors ofproduction � mainly, labour and capital. Fortrade in goods, the factors of production aretypically fixed in a specific location and theproduct is transported to the foreign market.For example, a motor vehicle manufacturingplant is usually located in the domestic marketand motor vehicles are transported to the for-eign market.
For trade in services, the factors of pro-duction move such that services can be sup-plied in four ways. The World Trade Organi-zation�s General Agreement on Trade in Serv-ices (GATS) describes the four ways or modesof supply for trade in services � cross-border,consumption abroad, commercial presence andthe movement of people.
Mode 1: Cross-borderIn the same way as goods are traded, servicescan be traded across borders. There is thus aclear geographical separation between thebuyer and the seller. For example, a UnitedStates stockbroking firm may buy or sell sharesfor a Japanese resident over the Internet. TheUnited States is exporting financial servicesacross the border to Japan and Japan is import-ing financial services from the United States.
Mode 2: Consumption abroadServices can be traded by the consumer mov-ing or travelling to the foreign market. For ex-ample, a United States fee-paying student maytravel to Japan to study at a Japanese univer-sity. Japan is exporting its education servicesto the United States and the United States isimporting education services from Japan.
Mode 3: Commercial presenceServices can be traded by the capital of theexporter moving to the foreign market. For ex-ample, a United States telecommunicationscompany may establish a company in Japan.The sale of telecommunications services inJapan is an export from the United States toJapan and Japan is importing telecommunica-tions services from the United States. Mostservices are traded in this way.
Mode 4: Presence of natural persons (or move-ment of people)Services can be traded by the producer or serv-ice supplier moving to the foreign market. Forexample, an accountant who is a United Statescitizen may temporarily work for a Japanesecompany in Japan. The United States account-ant is exporting professional services to Japanand Japan is importing professional servicesfrom the United States.
Box 1. How are services traded?
4
Market access in services is inherentlymore complex than market access for tradein goods. For trade in goods, market accessis about reducing mainly border measuressuch as tariffs that are imposed on goods asthey enter a market. For trade in services,market access is about reducing governmentpolicy interventions which are less visibleand may be applied after a service supplierhas entered the market. These measures takethe form of government regulations that areusually aimed at domestic policy objectivesrather than trade policy objectives. There isusually little consideration of the effects ofsuch measures on trade and market accessfor foreign service suppliers.
Exploiting market access in services,as for trade in goods, requires identificationof the relative strength or comparative ad-vantage and specialization in the productionand export of those services. Developingeconomies can assess comparative advantageindependently of others, but maximizing theirexport revenues requires identification ofrestrictions in foreign markets and skillfulnegotiation of their reduction or removal.
A. Developing economies and compara-tive advantage
The modern economy fundamentallydepends on specialization and trade betweeneconomies. The principle of comparativeadvantage is the fundamental analytical ex-planation of the �gains from trade�. Thetheory states that an economy should special-ize in the production and export of servicesin which it has a relative advantage and im-port services in which it has a relative disad-
vantage. International trade on this basis willmean that services will be produced by therelatively least cost world producer and thequantity of services consumed will be opti-mal.
The determinants of an economy�scomparative advantage are the endowmentsof the factors of production and technology.Factor endowment is the amount of resources� land, labour or capital � held by aneconomy that can be used for production.Technology entails the productive use of re-sources. An economy may have abundantfactor endowments of unskilled labour and acomparative advantage in labour-intensiveservices � construction and tourism serv-ices. On the other hand, an economy mayhave a small quantity of highly skilled laboursuch that it has a comparative advantage inlegal services.
Developing economies clearly have acomparative advantage in labour services orservices where labour is a major input, suchas tourism. Some developing economies alsohave a comparative advantage in construc-tion and transport services, although this ismore variable between economies. New ex-port opportunities are also emerging for de-veloping economies in communications andcomputer services.
B. Market access and the movement ofnatural persons
Developing economies� comparativeadvantage and the export potential of theirservices predominantly lie in the movementof low- and semi-skilled labour services or
II. MARKET ACCESS FOR DEVELOPING ECONOMIES
5
the movement of people. Statistics on themovement of people, although imperfect,suggest that developing economies are netexporters and developed economies are netimporters of labour services (WTO, 2001b).
Trade conditions for the movement ofpeople tend to be more restrictive than forany other mode of supply (Drabek and Laird,2001). Many developed economies are capi-tal-intensive and permit the entry of highlyskilled labour, but not the entry of low-skilledworkers from labour-abundant developingeconomies. Developed economies permit theentry of highly skilled personnel and profes-sionals for a limited duration but not the en-try of unskilled and low-skilled workers suchas construction workers (Stewart, 1993).
The restrictiveness of this mode ofsupply is also reflected in GATS commit-ments. Market access conditions tend to besignificantly more restrictive for the move-ment of natural persons mode of supply thanfor any other mode (WTO, 2001b). Most ofthe commitments apply to all service sectors;and, rather than aiming to expand marketaccess, commitments are usually less than thestatus quo. Commitments also specify thetype of person that can enter a market � ex-ecutive, manager or specialist � and the pur-pose of the entry � business networking, ne-gotiating sales or establishing a commercialpresence.
There are many constraints on thetemporary migration of labour that are im-posed through domestic regulations, and aremainly administrative in nature. There arefour main types of restrictions on the move-ment of natural persons:
� Immigration regulation on the entry.These restrictions include eligibility con-ditions for the granting of work permits,cumbersome application procedures, andlimitations on the length of stay andtransferability of employment.
� Regulation on the recognition of quali-fications, work experience and training.Recognition requirements prevent mar-ket access for foreign service suppliersor limit the scope of work that can beperformed. There is also some discretionin granting recognition for certificationor licensing of foreign persons.
� Differential treatment of domestic andforeign service personnel. There are usu-ally stringent qualification and eligibil-ity conditions � citizenship or residencyrequirements � imposed on foreign serv-ice suppliers.
� Entry conditional on commercial pres-ence. The entry of foreign personnel isusually conditional on some form of es-tablishment. Developing economies usu-ally have limited resources to enterthrough commercial presence and arethus, unable to provide labour services.
Improved market access for develop-ing economies will increase export earningsand improve employment opportunities fortheir nationals. The temporary nature of tradein the movement of people also improvesdomestic human capital. People returningfrom a foreign services market have acquireda new range of skills and knowledge that canbe used to build capacity in the domesticeconomy.
In gaining market access, primarilyfrom developed economies, developingeconomies need to promote the benefits andaddress the concerns of such trade for devel-oping economies. Developed economies canacquire similar skills and knowledge fromless expensive foreign personnel, which canalleviate pressures on inflation through de-mands from nationals for higher wages.Wages are around 80 per cent of the cost ofproduction and lower labour costs providedeveloped economy firms with larger profitmargins, which in a competitive market couldbe reinvested in research and developmentto produce more innovative products.
6
Economies often have many, mainlypolitical, concerns about the liberalization oftheir labour services markets. It is difficultfor Governments to embrace the benefits ofimporting less expensive labour in the faceof vocal domestic lobby groups describingsuch a policy as a �threat� to domestic jobs.The fears of a few from the importing Gov-ernment need to be weighed against the sub-stantial benefits for the overall economy.Governments and lobby groups may need tobe educated about the benefits. As in the caseof any liberalization, short-term adjustmentcosts will also occur as resources in a previ-ously protected labour market are reallocated,but in the long term substantial benefits willaccrue to the economies importing (and ex-porting) labour services.
Governments and lobby groups alsoraise concerns about employment and per-manent migration. Measures affecting natu-ral persons seeking access to the employmentmarket or measures regarding citizenship,residence or employment on a permanentbasis are not covered under the GATS. Thelatter aims to promote liberalization of la-bour services but at the same time gives WTOMembers the freedom to regulate the entryand temporary stay of natural persons, whichincludes the implementation of measuresnecessary to protect the integrity and ensurethe orderly movement of natural personsacross their borders.
Restrictions on the movement of peo-ple in some economies may prohibit the en-try of foreign persons. However, market ac-cess can still be achieved by switching to thenext best alternative, and usually less effi-cient, mode of supply. In recent years, Indiahas developed a growing software servicesindustry that delivers services over theInternet or via the cross-border mode of sup-ply. The industry competes internationallyeven though developed economies continueto impose restrictions on the movement ofIndian nationals (Chadha, 2001). Developedeconomies may also be more amenable with
labour being embodied in a service suppliedto the domestic market rather than labourentering directly and supplying a servicewithin the domestic market.
The GATS also provides provisionsaimed at enhancing market access for devel-oping economies (see box 2).
C. Market access and tourism services
Tourism generates the largest exportrevenues for developing economies. It is oneof the largest and fastest-growing servicesectors, accounting for over 35 per cent ofworld services exports (WTO, 2001b). It ishighly labour-intensive and is an importantemployer in developing economies.
Natural attractions and inexpensivedestinations are the determinants of compara-tive advantage in tourism for developingeconomies. Foreigners are drawn to devel-oping economies by their differences in termsof natural attractions and culture. Most of thelargest exporters of tourist services are smallisland nations. Foreigners from developedeconomies also find visiting a developingeconomy relatively inexpensive and a �valuefor money� holiday.
Market access for tourist services isprimarily the responsibility of a developingeconomy. Tourists travel to the foreign (orexport) market to consume such services.Market access for tourist services is aboutpermitting foreign persons� access to thecountry. Measures imposed by developingeconomies that limit their ability to maximizetheir export revenues from tourism are re-strictions on the issuing and length of visasand currency movements for individual tour-ists.
Maximizing export revenues fromtourism is very dependent on the necessaryand efficient infrastructure being in place.Tourists rely on efficiently operating trans-
7
port, telecommunications and financial serv-ices. The domestic economy requires reliabletransport services for tours and sightseeing,telecommunications services for organizingtours and financial services for currency ex-change. Many developing economies need todevelop these essential input services for thebenefit of tourism and other sectors.
D. Market access and new export oppor-tunities
Developing economies also have anopportunity to expand their service exportbases. These include semi-skilled knowl-edge-based services in a range of communi-cation and computer services. Advances ininformation technology and electronic com-merce have created these opportunities. Forexample, India has in recent years developeda high-quality and low-cost software devel-opment industry (Chadha, 2001).
Potential comparative advantage fordeveloping economies lies in a number ofbusiness services. These include a wide rangeof:
� Computer services, including softwareprogramming, database management,online support services, and Internet sitedesign and management;
� Professional services, including low-costarchitecture, consulting engineering, le-gal research and market research serv-ices;
� Technical assistance for other develop-ing economies, including low-tech andmedium-tech production processes, in-dustrial engineering, industrial design,and research and development; and
� Cultural or linguistic services, includingmultilingual offshore call centre services(UNCTAD, 1998, 2001).
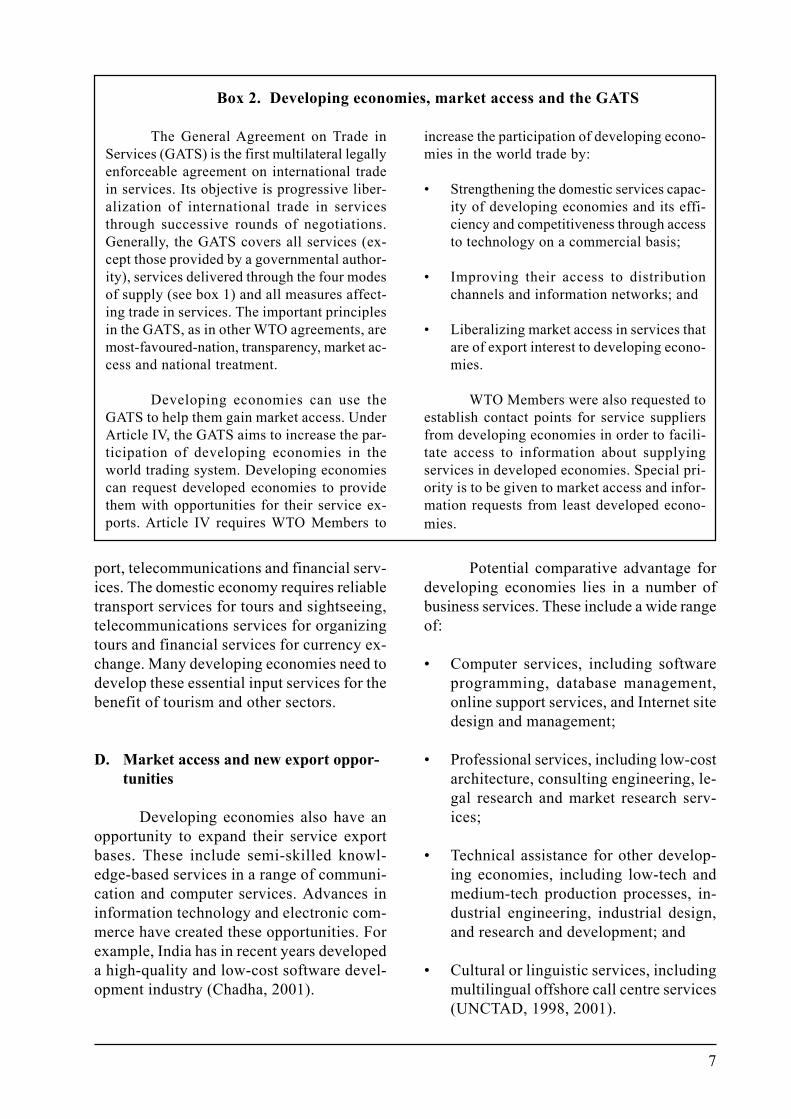
The General Agreement on Trade inServices (GATS) is the first multilateral legallyenforceable agreement on international tradein services. Its objective is progressive liber-alization of international trade in servicesthrough successive rounds of negotiations.Generally, the GATS covers all services (ex-cept those provided by a governmental author-ity), services delivered through the four modesof supply (see box 1) and all measures affect-ing trade in services. The important principlesin the GATS, as in other WTO agreements, aremost-favoured-nation, transparency, market ac-cess and national treatment.
Developing economies can use theGATS to help them gain market access. UnderArticle IV, the GATS aims to increase the par-ticipation of developing economies in theworld trading system. Developing economiescan request developed economies to providethem with opportunities for their service ex-ports. Article IV requires WTO Members to
increase the participation of developing econo-mies in the world trade by:
� Strengthening the domestic services capac-ity of developing economies and its effi-ciency and competitiveness through accessto technology on a commercial basis;
� Improving their access to distributionchannels and information networks; and
� Liberalizing market access in services thatare of export interest to developing econo-mies.
WTO Members were also requested toestablish contact points for service suppliersfrom developing economies in order to facili-tate access to information about supplyingservices in developed economies. Special pri-ority is to be given to market access and infor-mation requests from least developed econo-mies.
Box 2. Developing economies, market access and the GATS

8
Developing economies have a poten-tial comparative advantage in these services� as in many other services � because oftheir low-cost labour services, and thus mar-ket access is dependent on the movement ofpeople. These new opportunities are also sub-stantial generators of new employment.There are worldwide labour shortages insome of these services, in particular software
development. Restrictions on work permitsand visas limit the ability of the shortages tobe addressed via the importation of labourfrom developing economies (WTO, 1998).As mentioned above, developing economiescan take advantage, to a lesser extent, of someof these opportunities by supplying theseservices via a mode of supply other than themovement of people.
9
Measuring the economy-wide impactof trade liberalization requires a global gen-eral equilibrium framework, which capturesintersectoral effects for an economy and linksbetween economies. This enables an assess-ment to be made of the impact of sector-spe-cific policies on an economy as a whole.
Numerous general equilibrium stud-ies analyse the economic impacts of policiesaffecting trade in goods, but relatively littlework has been completed on assessing thepotential gains from alternative liberalizationscenarios in services. The past difficultiesarise from inadequate information about in-ternational service transactions and a lack ofcomprehensive measures of restrictions ontrade in services. Modelling of services tradealso requires the development of a differentmodelling structure from that used for goodstrade in order to incorporate the variousmodes through which services are supplied,that is, to account for the movement of fac-tors of production (OECD, 2000a, 2000b).
A significant amount of methodologi-cal thinking is still required on modellingservices trade liberalization, but a number ofstudies have analyzed the effects (Benjaminand Diao, 1998, 2000; Brown et al., 1996;Chadha, 2001; Chadha et al., 2000; Dee andHanslow, 2000; DFAT, 1999; Hertel et al.,1999; and Robinson et al., 1999). The resultsare similar in a number of respects:
� There are always substantial global real-income gains from services liberaliza-tion. In many studies, the gains in termsof real income are similar to or greaterthan those derived from liberalization oftrade in agriculture and manufacturingcombined.
� Developing economies gain more thandeveloped economies. Economies withgreater restrictions or, mainly, develop-ing economies reap the greatest benefitsfrom liberalization.
� Liberalization of trade in services haspowerful impacts on agriculture andmanufacturing through intersectoral link-ages in an economy. Services are essen-tial inputs to other sectors, and substan-tial productivity gains accrue to othersectors when liberalization improves theefficiency of the service sector.
Dee and Hanslow (2000) use one ofthe most sophisticated general equilibriummodels to analyse the effects of liberalizingtrade in services. The model simulates thebenefits of liberalizing restrictions on allservices and indirectly incorporates the ben-efits from liberalizing restrictions on themovement of natural persons. It also has thecapability to simulate the effect of removingcertain types of restrictions. It can examinethe impact of full and partial multilateral lib-eralization of services trade. It is a 19-region(covering Asia, North and South America andthe European Union) by 3-sector (agriculture,manufacturing and services) computable gen-eral equilibrium model of the world economyknown as the FTAP model. It was developedfrom the Global Trade Analysis Project(GTAP) model (Hertel, 1997), with the ad-dition of the structure necessary to supportthe analysis of services liberalization.
One of the distinguishing features ofFTAP is the inclusion of foreign direct in-vestment (FDI). The treatment of FDI allowsfor examination of the comprehensive re-moval of restrictions on all modes of service
III. WHAT�S AT STAKE FOR DEVELOPING ECONOMIES?
10
supply, including restrictions on servicesdelivered via FDI. Hanslow et al. (1999) fullydocuments the structure of the FTAP model.
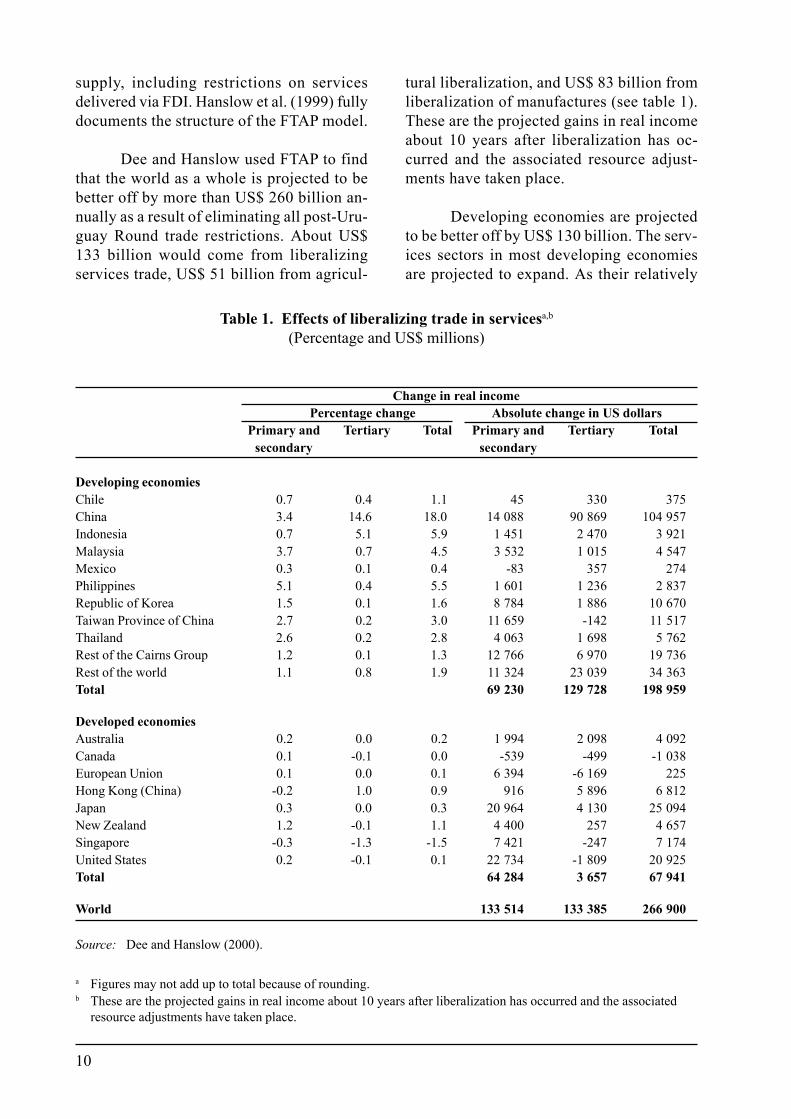
Dee and Hanslow used FTAP to findthat the world as a whole is projected to bebetter off by more than US$ 260 billion an-nually as a result of eliminating all post-Uru-guay Round trade restrictions. About US$133 billion would come from liberalizingservices trade, US$ 51 billion from agricul-
tural liberalization, and US$ 83 billion fromliberalization of manufactures (see table 1).These are the projected gains in real incomeabout 10 years after liberalization has oc-curred and the associated resource adjust-ments have taken place.
Developing economies are projectedto be better off by US$ 130 billion. The serv-ices sectors in most developing economiesare projected to expand. As their relatively
Change in real incomePercentage change Absolute change in US dollars
Primary and Tertiary Total Primary and Tertiary Totalsecondary secondary
Developing economiesChile 0.7 0.4 1.1 45 330 375China 3.4 14.6 18.0 14 088 90 869 104 957Indonesia 0.7 5.1 5.9 1 451 2 470 3 921Malaysia 3.7 0.7 4.5 3 532 1 015 4 547Mexico 0.3 0.1 0.4 -83 357 274Philippines 5.1 0.4 5.5 1 601 1 236 2 837Republic of Korea 1.5 0.1 1.6 8 784 1 886 10 670Taiwan Province of China 2.7 0.2 3.0 11 659 -142 11 517Thailand 2.6 0.2 2.8 4 063 1 698 5 762Rest of the Cairns Group 1.2 0.1 1.3 12 766 6 970 19 736Rest of the world 1.1 0.8 1.9 11 324 23 039 34 363Total 69 230 129 728 198 959
Developed economiesAustralia 0.2 0.0 0.2 1 994 2 098 4 092Canada 0.1 -0.1 0.0 -539 -499 -1 038European Union 0.1 0.0 0.1 6 394 -6 169 225Hong Kong (China) -0.2 1.0 0.9 916 5 896 6 812Japan 0.3 0.0 0.3 20 964 4 130 25 094New Zealand 1.2 -0.1 1.1 4 400 257 4 657Singapore -0.3 -1.3 -1.5 7 421 -247 7 174United States 0.2 -0.1 0.1 22 734 -1 809 20 925Total 64 284 3 657 67 941
World 133 514 133 385 266 900
Source: Dee and Hanslow (2000).
a Figures may not add up to total because of rounding.b These are the projected gains in real income about 10 years after liberalization has occurred and the associated
resource adjustments have taken place.
Table 1. Effects of liberalizing trade in servicesa,b
(Percentage and US$ millions)
11
high restrictions on entry are removed, theirservices sectors develop, primarily funded byFDI, and they become major exporters ofservices. China is expected to benefit by US$91 billion from the removal of particularlystringent restrictions.
While developing economies will re-ceive a greater share of the expanding globalservices market, services sectors in econo-mies with moderate restrictions will expandbut their share of the global services mar-kets in the long run will be smaller. Australia,New Zealand, Canada and the United States,as well as the European Union, are expectedto gain but relatively less than developingeconomies. In part, this is because of in-creased competition via cross-border tradefrom the newly expanded Asian service sec-tors.
For some economies � the EuropeanUnion, the United States, Canada, Singaporeand the Taiwan Province of China � thecontribution of multilateral services trade lib-eralization is expected to be negative (Deeand Hanslow, 2000). There are a number ofreasons that contribute to this result, but oneof the more interesting insights is the effectsof liberalization on foreign direct investment(Productivity Commission and the Austral-ian National University, 2000). FDI can lead
to an expansion or contraction in the capitalstock located within a region, leading to apositive or negative contribution to incomegenerated within a region from this changein national endowments. For many countries,after the restrictions on FDI in foreign econo-mies are removed, the owners of the foreigncapital receive a lower return.
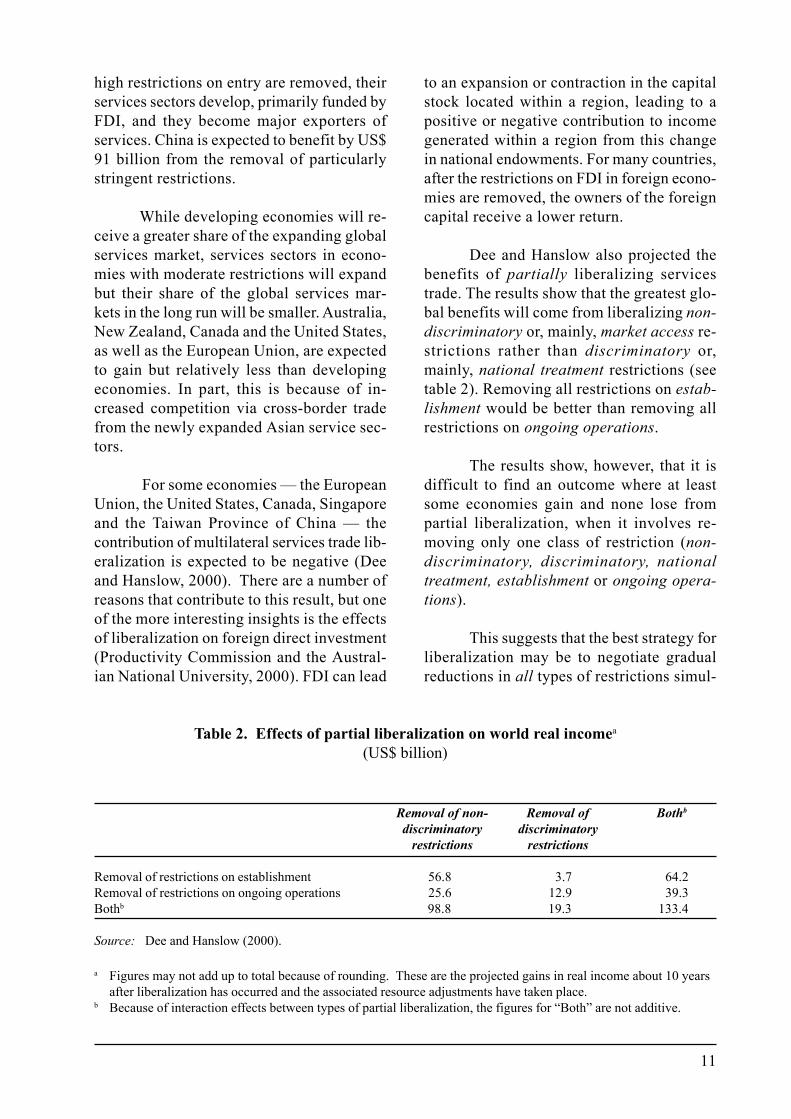
Dee and Hanslow also projected thebenefits of partially liberalizing servicestrade. The results show that the greatest glo-bal benefits will come from liberalizing non-discriminatory or, mainly, market access re-strictions rather than discriminatory or,mainly, national treatment restrictions (seetable 2). Removing all restrictions on estab-lishment would be better than removing allrestrictions on ongoing operations.
The results show, however, that it isdifficult to find an outcome where at leastsome economies gain and none lose frompartial liberalization, when it involves re-moving only one class of restriction (non-discriminatory, discriminatory, nationaltreatment, establishment or ongoing opera-tions).
This suggests that the best strategy forliberalization may be to negotiate gradualreductions in all types of restrictions simul-
Table 2. Effects of partial liberalization on world real incomea
(US$ billion)
Removal of non- Removal of Bothb
discriminatory discriminatoryrestrictions restrictions
Removal of restrictions on establishment 56.8 3.7 64.2Removal of restrictions on ongoing operations 25.6 12.9 39.3Bothb 98.8 19.3 133.4
Source: Dee and Hanslow (2000).
a Figures may not add up to total because of rounding. These are the projected gains in real income about 10 yearsafter liberalization has occurred and the associated resource adjustments have taken place.
b Because of interaction effects between types of partial liberalization, the figures for �Both� are not additive.
12
taneously. Non-discriminatory restrictions onall service suppliers should be reduced oreliminated before the removal of discrimi-natory restrictions on foreign service suppli-ers. Dee et al. (2000) argue that reducing non-discriminatory restrictions on all service sup-pliers is a better approach than only reduc-ing discriminatory restrictions on foreignservice suppliers. Reducing discriminatoryrestrictions on foreigners alone can have anegative impact on the level of services sup-plied by domestic firms. This will result inlower prices and higher total sales, but do-mestic service suppliers will end up with asmaller share of the service sector. However,if restrictions that affect foreign and domes-tic service suppliers equally are reduced, allservice suppliers will have the same oppor-
tunities to increase the amount of servicesthey supply in an expanding market.
Verikios and Zhang (2001) also usedthe FTAP model to analyse the sectoral im-pacts of removing all restrictions on trade infinancial and communications services. Theyfound that the total gain in world incomefrom liberalizing both sectors is US$ 48 bil-lion. About US$ 24 billion of this wouldcome from liberalizing communications serv-ices, with most of the gains coming from re-moving non-discriminatory restrictions. US$24 billion is likely to accrue to financial serv-ices, with almost all the gains coming fromremoving discriminatory restrictions. How-ever, the gains from most regions are thehighest when all restrictions are removed.
13
The modelling results show greaterbenefits from liberalization for developingeconomies than for developed economies.Most of these gains arise from liberalizingthe domestic service sector, not from seek-ing better market access to foreign servicesmarkets. This raises the question of the na-ture and extent of restrictions on trade inservices that are preventing developingeconomies from achieving these gains.
Identifying and measuring restrictionsshows the extent of restrictiveness of differ-ent economies and which economies, poten-tially, have the most to gain. Convertingqualitative information on restrictions to aquantitative index measure of trade restric-tiveness, based on coverage and some initialjudgements about the relative stringency ofthe different sorts of restrictions, provides forease of comparison for economies. Theseresults can then be used to estimate the ef-fect of restrictions on the prices and costs ofservices.
Measuring the effects of restrictionson trade in services has, until recently, beenconsidered too difficult. This has mainly beenbecause of the difficulty in identifying restric-tions on services. Restrictions on trade ingoods usually take the form of a tariff, whilerestrictions on trade in services usually takethe form of government regulation and a cer-tain level of regulation is usually justified formeeting regulatory objectives. These diffi-culties have, to a certain extent, been over-come with advances in economic thinkingand the collection of information on restric-tions. In recent years, researchers have de-veloped a methodology that generally in-volves:
� Measuring how restrictive a service sec-tor is in an economy by using a trade re-strictiveness index; and
� Estimating the effect of restrictions, asmeasured by the trade restrictiveness in-dex, on the economic performance �price, cost and/or price-cost margins �of service suppliers (McGuire, 2000).
These estimates of the effects on re-strictions can be used to project the economy-wide and global benefits of removing restric-tions on services using a computable generalequilibrium model. Dee and Hanslow (2000)used some of these measures to model thebenefits of liberalizing trade in services.
A. Measuring restrictions on trade inservices
Restrictions on trade in services canbe measured using a trade restrictiveness in-dex. This index is a sophisticated frequencymeasure that estimates the restrictiveness ofan economy�s trading regime for services onthe basis of the number and severity of re-strictions.
Information on restrictions is firstgathered and then classified. The informa-tion on restrictions is drawn from a numberof sources, including material produced byAsia-Pacific Economic Cooperation (APEC),the OECD, the WTO and the United StatesTrade Representative. A comprehensive da-tabase of restrictions can be compiled fromthese sources, but it is possible that someservice sector regulation and developmentsare not captured. That said, the information
IV. WHAT ARE THE RESTRICTIONS AND THEIR EFFECTS?
14
compiled on restrictions is significantly morecomprehensive than that provided in theGATS schedules of WTO Members. Theprocess also highlights the types of restric-tions that are imposed on services which isvery helpful for negotiators.
Restrictions can be classified in twoways. The first is by whether a restrictionapplies to:
� Establishment � the ability of servicesuppliers to establish physical outlets inan economy and supply services throughthose outlets; or
� Ongoing operations � the operations ofa service supplier after it has entered themarket.
Restrictions on establishment ofteninclude licensing requirements for servicesuppliers or firms, restrictions on direct in-vestment in existing firms and restrictions onthe permanent movement of people. Restric-tions on ongoing operations often includerestrictions on firms conducting their corebusiness, the pricing of services and the tem-porary movement of people.
The second way a restriction can beclassified is by whether it is:
� Non-discriminatory � restricting do-mestic and foreign service suppliersequally; or
� Discriminatory � restricting only for-eign service suppliers.
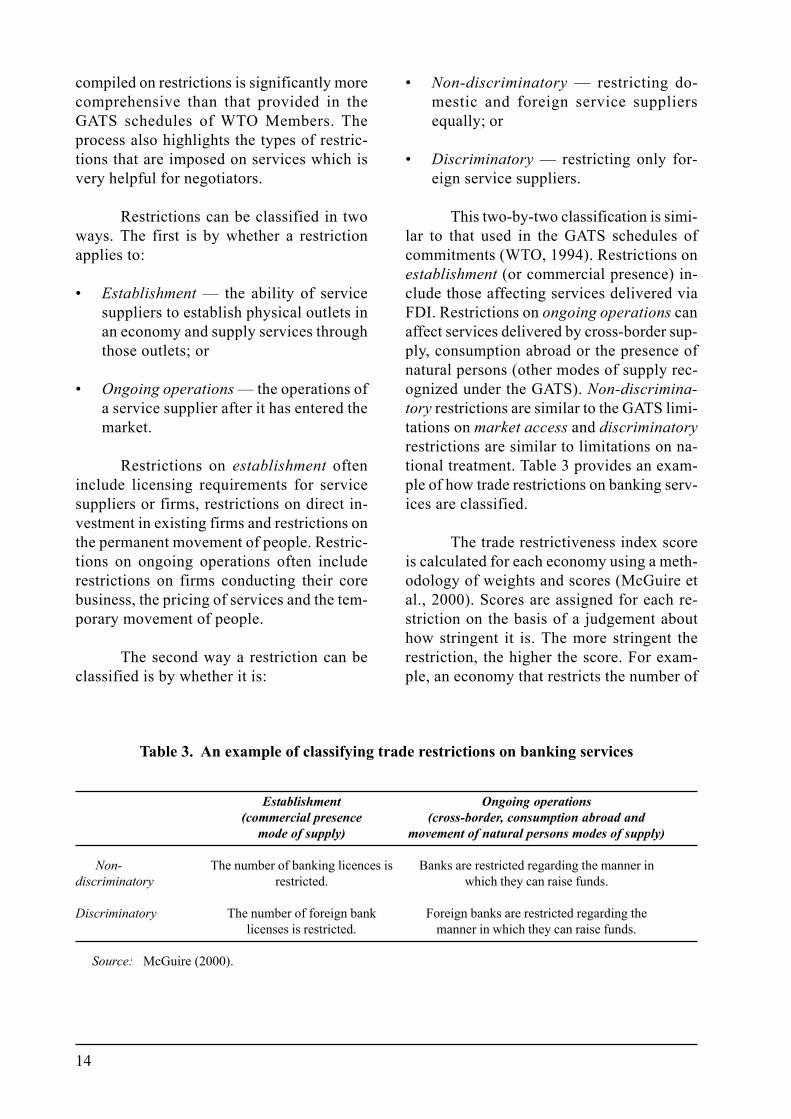
This two-by-two classification is simi-lar to that used in the GATS schedules ofcommitments (WTO, 1994). Restrictions onestablishment (or commercial presence) in-clude those affecting services delivered viaFDI. Restrictions on ongoing operations canaffect services delivered by cross-border sup-ply, consumption abroad or the presence ofnatural persons (other modes of supply rec-ognized under the GATS). Non-discrimina-tory restrictions are similar to the GATS limi-tations on market access and discriminatoryrestrictions are similar to limitations on na-tional treatment. Table 3 provides an exam-ple of how trade restrictions on banking serv-ices are classified.
The trade restrictiveness index scoreis calculated for each economy using a meth-odology of weights and scores (McGuire etal., 2000). Scores are assigned for each re-striction on the basis of a judgement abouthow stringent it is. The more stringent therestriction, the higher the score. For exam-ple, an economy that restricts the number of
Table 3. An example of classifying trade restrictions on banking services
Establishment Ongoing operations(commercial presence (cross-border, consumption abroad and
mode of supply) movement of natural persons modes of supply)
Non- The number of banking licences is Banks are restricted regarding the manner indiscriminatory restricted. which they can raise funds.
Discriminatory The number of foreign bank Foreign banks are restricted regarding thelicenses is restricted. manner in which they can raise funds.
Source: McGuire (2000).
15
banking licences is assigned a higher scorethan an economy that issues new banking li-cences with only prudential requirements.
The restriction categories are thenweighted together according to a judgementabout their relative economic cost subject toreasonably available information. For exam-ple, restrictions on banking licences areweighted more heavily than restrictions onthe temporary movement of people. Theweights are generally chosen so that the to-tal restrictiveness index score ranges from 0to 1.
In calculating an overall economyscore, it is not determined which restrictionsmight be justified for enhancing the effi-ciency of a service sector and which mightnot. In general, trade restrictions, by reduc-ing competition in a services market, willreduce the efficiency of that market. How-ever, sometimes regulation which limits com-petition is necessary to deal with �marketfailure� and to meet particular social objec-tives. No assessment is made of the meritsor otherwise of the restrictions covered by
the trade restrictiveness index. It is extremelydifficult to make an assessment about themerits of regulation for economies with dif-ferent regulatory objectives and structures.Furthermore, multilateral trading agree-ments, such as the GATS, aim to reduce re-strictions while recognizing the freedom oftrading agreement members to regulate tomeet national policy objectives. Govern-ments generally set their own regulation ob-jectives � efficiency, transparency, stabilityand adequate disclosure.
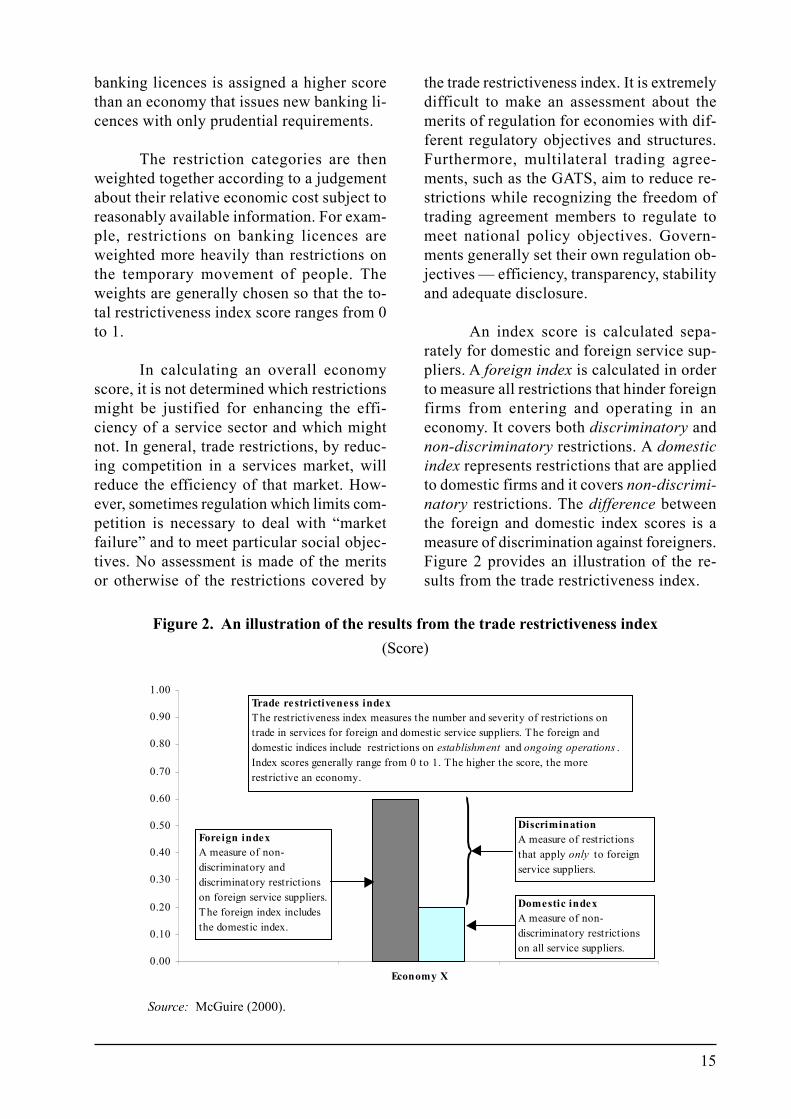
An index score is calculated sepa-rately for domestic and foreign service sup-pliers. A foreign index is calculated in orderto measure all restrictions that hinder foreignfirms from entering and operating in aneconomy. It covers both discriminatory andnon-discriminatory restrictions. A domesticindex represents restrictions that are appliedto domestic firms and it covers non-discrimi-natory restrictions. The difference betweenthe foreign and domestic index scores is ameasure of discrimination against foreigners.Figure 2 provides an illustration of the re-sults from the trade restrictiveness index.
Figure 2. An illustration of the results from the trade restrictiveness index(Score)
0.00
0.10
0.20
0.30
0.40
0.50
0.60
0.70
0.80
0.90
1.00
Economy X
Trade restrictiveness indexThe restrictiveness index measures the number and severity of restrictions on trade in services for foreign and domestic service suppliers. The foreign and domestic indices include restrictions on establishment and ongoing operations . Index scores generally range from 0 to 1. The higher the score, the more restrictive an economy.
Foreign indexA measure of non-discriminatory and discriminatory restrictions on foreign service suppliers. The foreign index includes the domestic index.
Domestic indexA measure of non-discriminatory restrictions on all service suppliers.
DiscriminationA measure of restrictions that apply only to foreign service suppliers.
Source: McGuire (2000).
16
1. Trade restrictiveness index results fordeveloping economies
The results from the trade restrictive-ness indices show that developing economiestend to have higher trade restrictiveness in-dex scores than developed economies. Manyof the economies experiencing financial dif-ficulties in recent years, mainly Asian andSouth American economies, have medium tohigh restrictiveness index scores. Theseeconomies were also found to be the mostdiscriminatory against foreign service sup-pliers.
Figures 3 to 7 show the results for se-lected service sectors from the trade restric-tiveness indices for low- and middle-incomeeconomies (LMIEs) (or developing econo-mies) and the average for high-incomeeconomies (HIEs) (or developed economies).The World Bank (2001) provides the group-ings for LMIEs and HIEs.
The Productivity Commission (2001a)provides data for each service sector with
greater economy coverage and data disaggre-gation for the trade restrictiveness indices.Insufficient information is available for cal-culating trade restrictiveness indices for anumber of developing economies.
The commentary on each service sec-tor for each economy provides an overviewof the type of restrictions imposed. Morespecific details are available from the rel-evant identified papers.
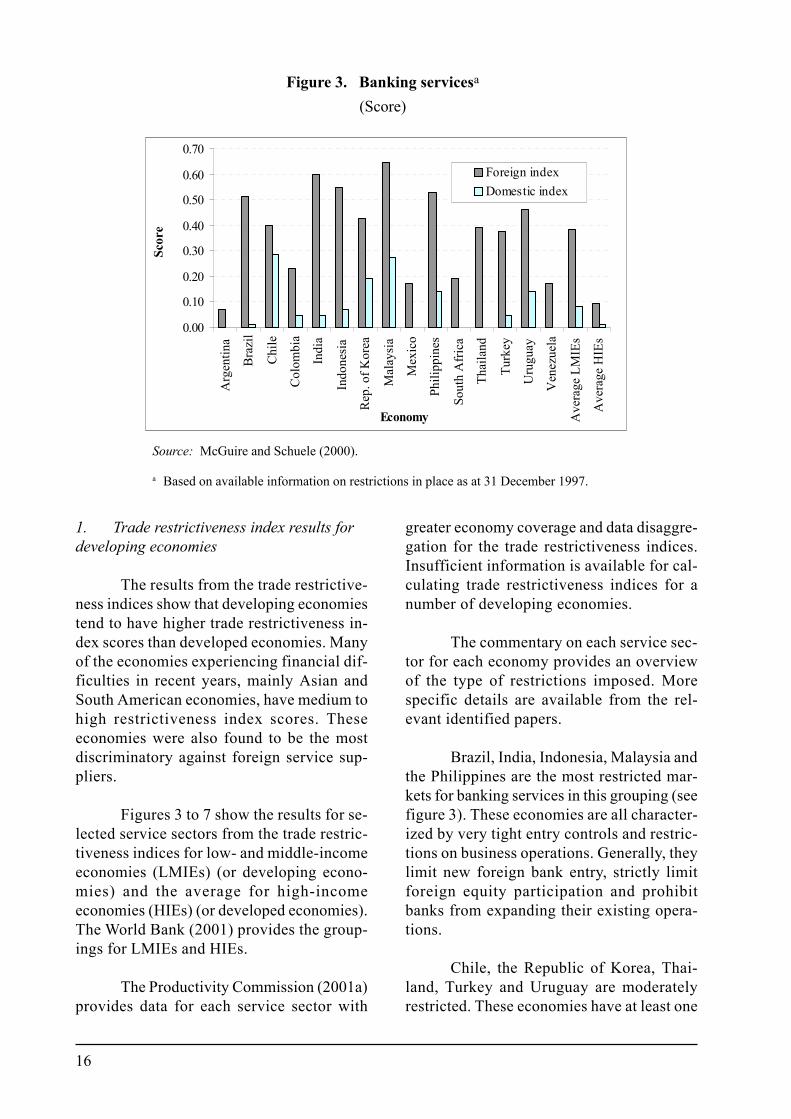
Brazil, India, Indonesia, Malaysia andthe Philippines are the most restricted mar-kets for banking services in this grouping (seefigure 3). These economies are all character-ized by very tight entry controls and restric-tions on business operations. Generally, theylimit new foreign bank entry, strictly limitforeign equity participation and prohibitbanks from expanding their existing opera-tions.
Chile, the Republic of Korea, Thai-land, Turkey and Uruguay are moderatelyrestricted. These economies have at least one
Figure 3. Banking servicesa
(Score)
Source: McGuire and Schuele (2000).
a Based on available information on restrictions in place as at 31 December 1997.
0.00
0.10
0.20
0.30
0.40
0.50
0.60
0.70
Arg
entin
a
Bra
zil
Chi
le
Col
ombi
a
Indi
a
Indo
nesi
a
Rep
. of K
orea
Mal
aysi
a
Mex
ico
Phili
ppin
es
Sout
h A
fric
a
Thai
land
Turk
ey
Uru
guay
Ven
ezue
la
Ave
rage
LM
IEs
Ave
rage
HIE
s
Economy
Scor
eForeign indexDomestic index
17
significant restriction that limits foreign ac-cess to their markets. This includes either arestriction on licensing foreign equity par-ticipation in domestic banks or restrictionson their operations, such as opening newoutlets and street branches.
Argentina, Colombia, South Africaand Venezuela are the least restricted in thisgrouping. They have fewer restrictions onlicensing, and foreign equity participation.
Brazil, India and Indonesia have themost discriminatory restrictions against for-eigners for banking services as measured bythe large difference between the foreign anddomestic index scores.
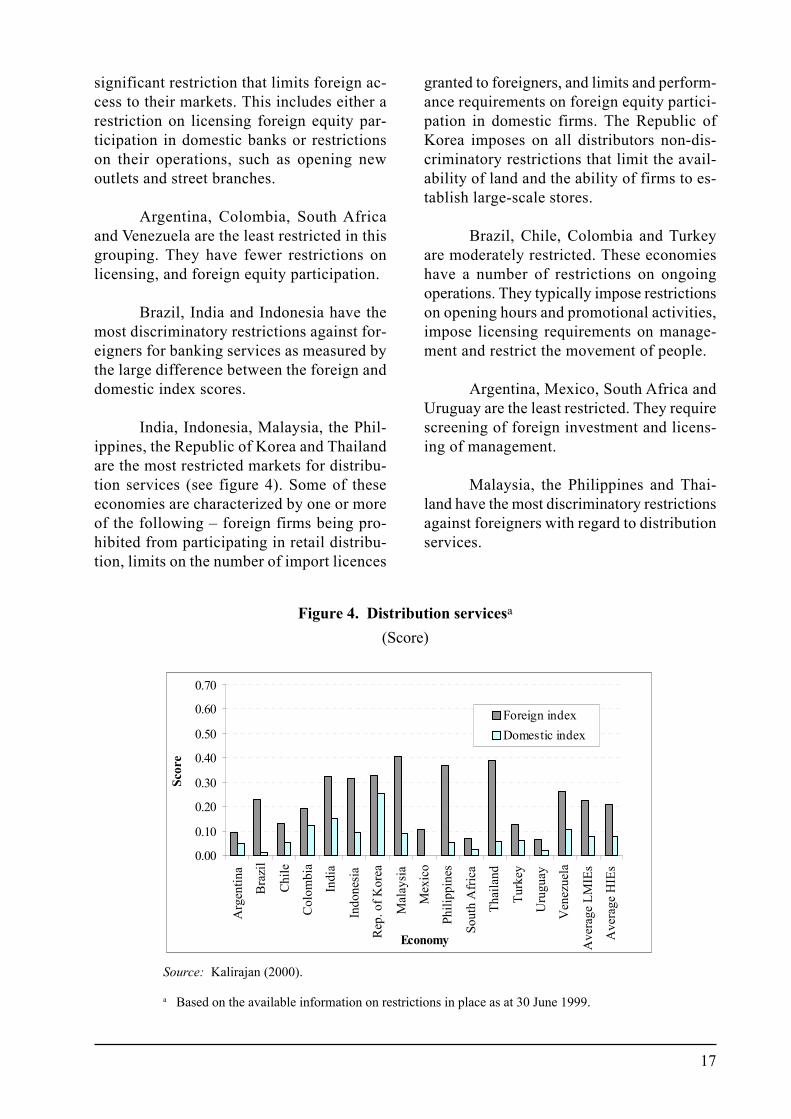
India, Indonesia, Malaysia, the Phil-ippines, the Republic of Korea and Thailandare the most restricted markets for distribu-tion services (see figure 4). Some of theseeconomies are characterized by one or moreof the following � foreign firms being pro-hibited from participating in retail distribu-tion, limits on the number of import licences
granted to foreigners, and limits and perform-ance requirements on foreign equity partici-pation in domestic firms. The Republic ofKorea imposes on all distributors non-dis-criminatory restrictions that limit the avail-ability of land and the ability of firms to es-tablish large-scale stores.
Brazil, Chile, Colombia and Turkeyare moderately restricted. These economieshave a number of restrictions on ongoingoperations. They typically impose restrictionson opening hours and promotional activities,impose licensing requirements on manage-ment and restrict the movement of people.
Argentina, Mexico, South Africa andUruguay are the least restricted. They requirescreening of foreign investment and licens-ing of management.
Malaysia, the Philippines and Thai-land have the most discriminatory restrictionsagainst foreigners with regard to distributionservices.
Figure 4. Distribution servicesa
(Score)
0.00
0.10
0.20
0.30
0.40
0.50
0.60
0.70
Arg
entin
a
Bra
zil
Chi
le
Col
ombi
a
Indi
a
Indo
nesi
a
Rep
. of K
orea
Mal
aysi
a
Mex
ico
Phili
ppin
es
Sout
h A
fric
a
Thai
land
Turk
ey
Uru
guay
Ven
ezue
la
Ave
rage
LM
IEs
Ave
rage
HIE
s
Economy
Scor
e
Foreign indexDomestic index
Source: Kalirajan (2000).
a Based on the available information on restrictions in place as at 30 June 1999.
18
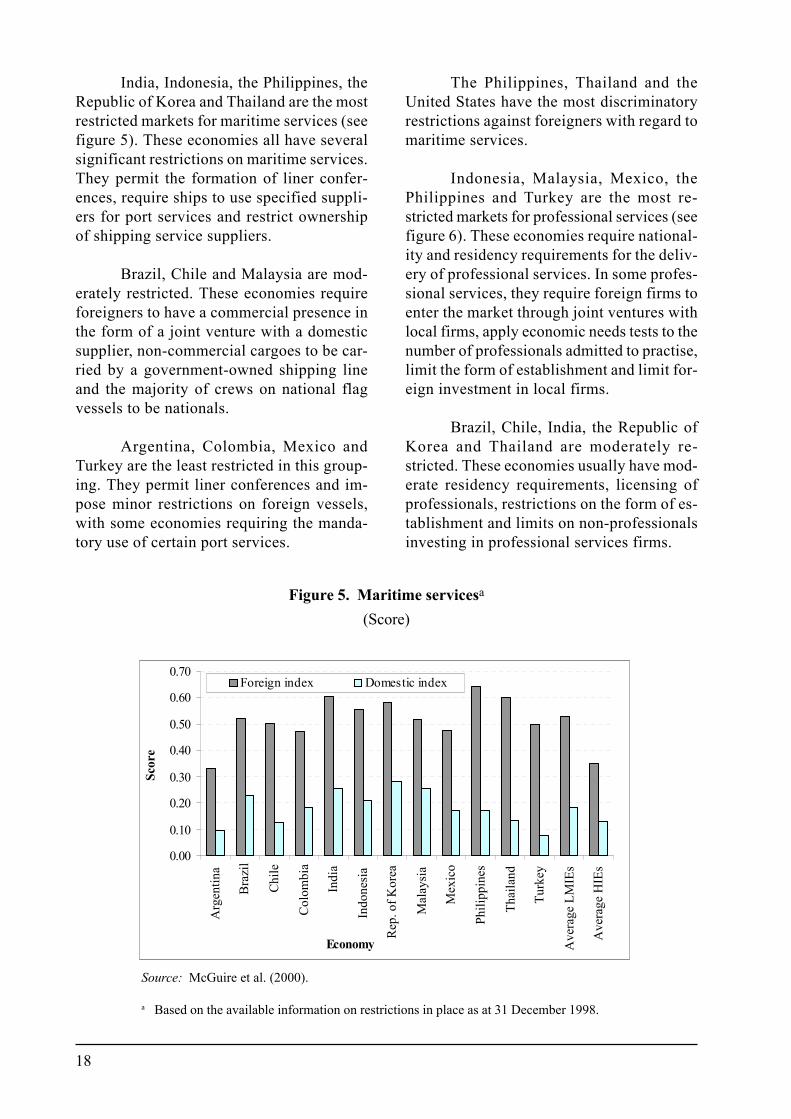
India, Indonesia, the Philippines, theRepublic of Korea and Thailand are the mostrestricted markets for maritime services (seefigure 5). These economies all have severalsignificant restrictions on maritime services.They permit the formation of liner confer-ences, require ships to use specified suppli-ers for port services and restrict ownershipof shipping service suppliers.
Brazil, Chile and Malaysia are mod-erately restricted. These economies requireforeigners to have a commercial presence inthe form of a joint venture with a domesticsupplier, non-commercial cargoes to be car-ried by a government-owned shipping lineand the majority of crews on national flagvessels to be nationals.
Argentina, Colombia, Mexico andTurkey are the least restricted in this group-ing. They permit liner conferences and im-pose minor restrictions on foreign vessels,with some economies requiring the manda-tory use of certain port services.
The Philippines, Thailand and theUnited States have the most discriminatoryrestrictions against foreigners with regard tomaritime services.
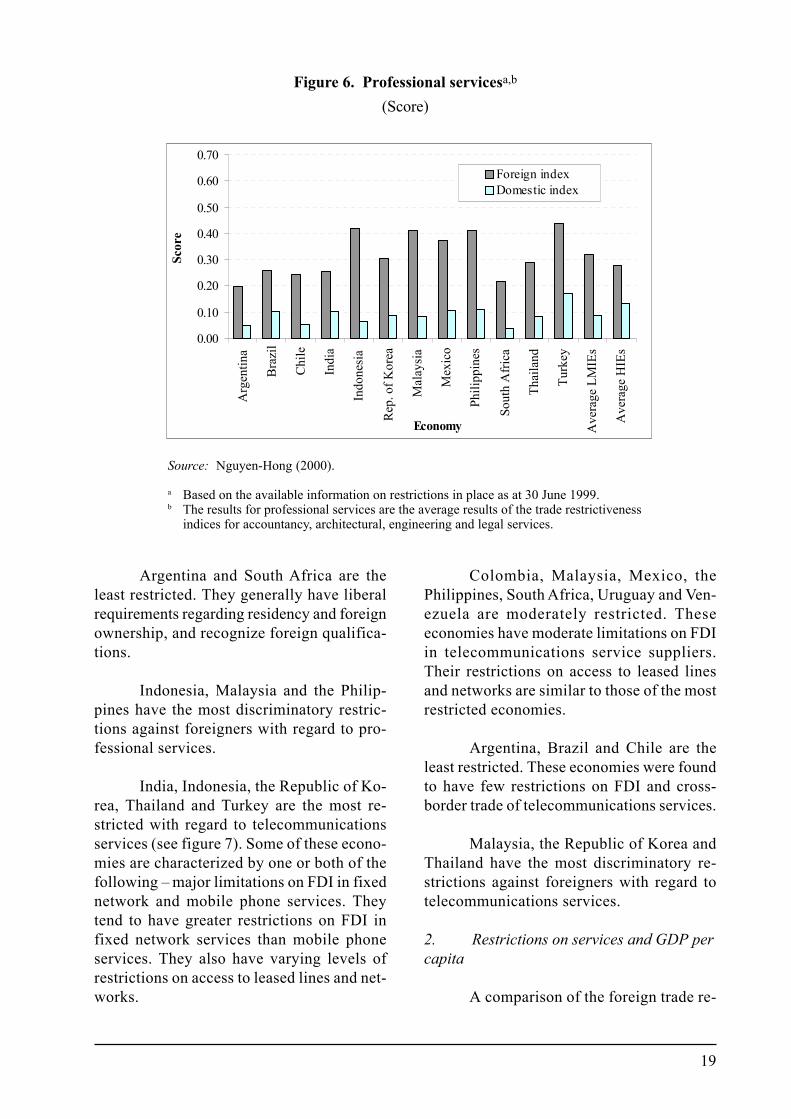
Indonesia, Malaysia, Mexico, thePhilippines and Turkey are the most re-stricted markets for professional services (seefigure 6). These economies require national-ity and residency requirements for the deliv-ery of professional services. In some profes-sional services, they require foreign firms toenter the market through joint ventures withlocal firms, apply economic needs tests to thenumber of professionals admitted to practise,limit the form of establishment and limit for-eign investment in local firms.
Brazil, Chile, India, the Republic ofKorea and Thailand are moderately re-stricted. These economies usually have mod-erate residency requirements, licensing ofprofessionals, restrictions on the form of es-tablishment and limits on non-professionalsinvesting in professional services firms.
Figure 5. Maritime servicesa
(Score)
Source: McGuire et al. (2000).
a Based on the available information on restrictions in place as at 31 December 1998.
0.00
0.10
0.20
0.30
0.40
0.50
0.60
0.70
Arg
entin
a
Bra
zil
Chi
le
Col
ombi
a
Indi
a
Indo
nesi
a
Rep
. of K
orea
Mal
aysi
a
Mex
ico
Phili
ppin
es
Thai
land
Turk
ey
Ave
rage
LM
IEs
Ave
rage
HIE
s
Economy
Scor
e
Foreign index Domestic index
19
Argentina and South Africa are theleast restricted. They generally have liberalrequirements regarding residency and foreignownership, and recognize foreign qualifica-tions.
Indonesia, Malaysia and the Philip-pines have the most discriminatory restric-tions against foreigners with regard to pro-fessional services.
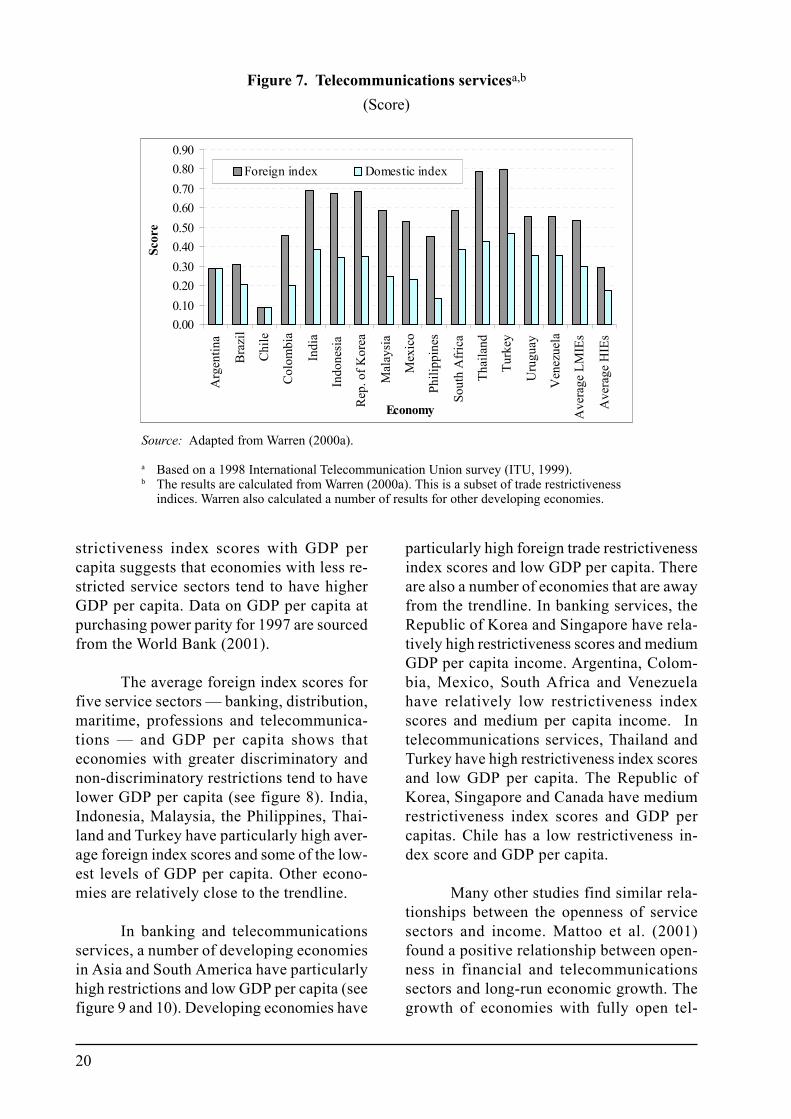
India, Indonesia, the Republic of Ko-rea, Thailand and Turkey are the most re-stricted with regard to telecommunicationsservices (see figure 7). Some of these econo-mies are characterized by one or both of thefollowing � major limitations on FDI in fixednetwork and mobile phone services. Theytend to have greater restrictions on FDI infixed network services than mobile phoneservices. They also have varying levels ofrestrictions on access to leased lines and net-works.
Colombia, Malaysia, Mexico, thePhilippines, South Africa, Uruguay and Ven-ezuela are moderately restricted. Theseeconomies have moderate limitations on FDIin telecommunications service suppliers.Their restrictions on access to leased linesand networks are similar to those of the mostrestricted economies.
Argentina, Brazil and Chile are theleast restricted. These economies were foundto have few restrictions on FDI and cross-border trade of telecommunications services.
Malaysia, the Republic of Korea andThailand have the most discriminatory re-strictions against foreigners with regard totelecommunications services.
2. Restrictions on services and GDP percapita
A comparison of the foreign trade re-
Figure 6. Professional servicesa,b
(Score)
0.00
0.10
0.20
0.30
0.40
0.50
0.60
0.70
Arg
entin
a
Bra
zil
Chi
le
Indi
a
Indo
nesi
a
Rep
. of K
orea
Mal
aysi
a
Mex
ico
Phili
ppin
es
Sout
h A
fric
a
Thai
land
Turk
ey
Ave
rage
LM
IEs
Ave
rage
HIE
s
Economy
Scor
eForeign indexDomestic index
Source: Nguyen-Hong (2000).
a Based on the available information on restrictions in place as at 30 June 1999.b The results for professional services are the average results of the trade restrictiveness
indices for accountancy, architectural, engineering and legal services.
20
strictiveness index scores with GDP percapita suggests that economies with less re-stricted service sectors tend to have higherGDP per capita. Data on GDP per capita atpurchasing power parity for 1997 are sourcedfrom the World Bank (2001).
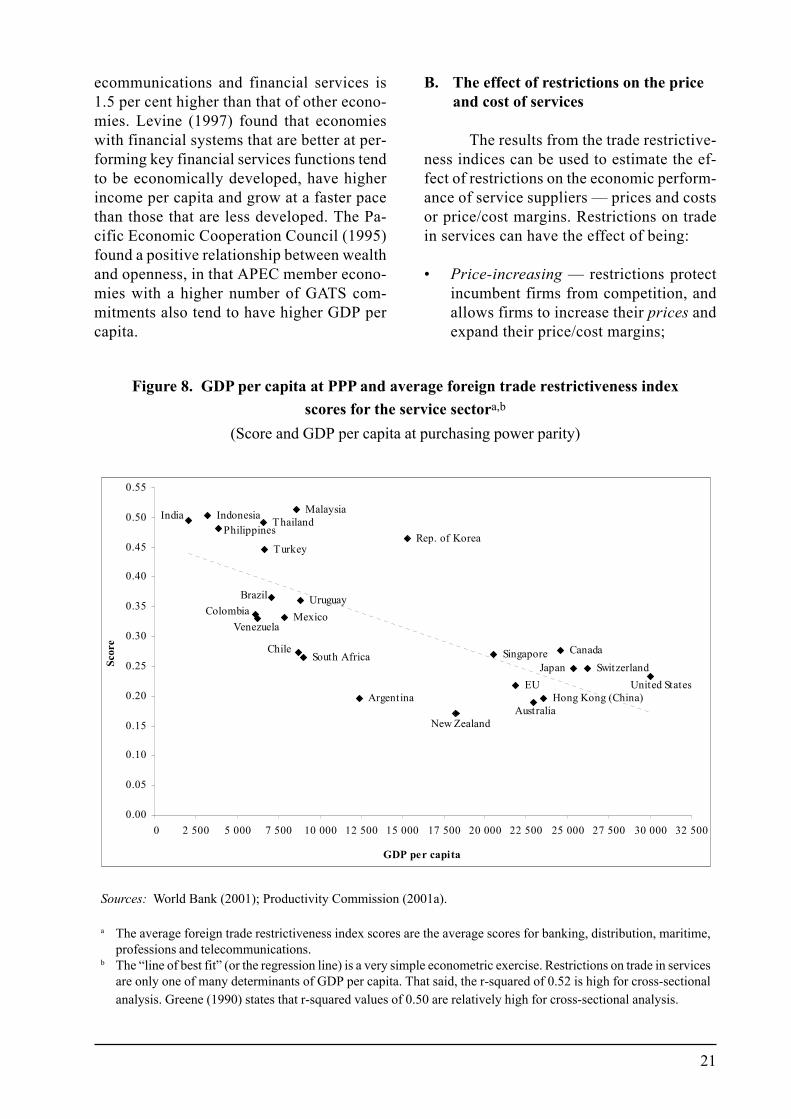
The average foreign index scores forfive service sectors � banking, distribution,maritime, professions and telecommunica-tions � and GDP per capita shows thateconomies with greater discriminatory andnon-discriminatory restrictions tend to havelower GDP per capita (see figure 8). India,Indonesia, Malaysia, the Philippines, Thai-land and Turkey have particularly high aver-age foreign index scores and some of the low-est levels of GDP per capita. Other econo-mies are relatively close to the trendline.
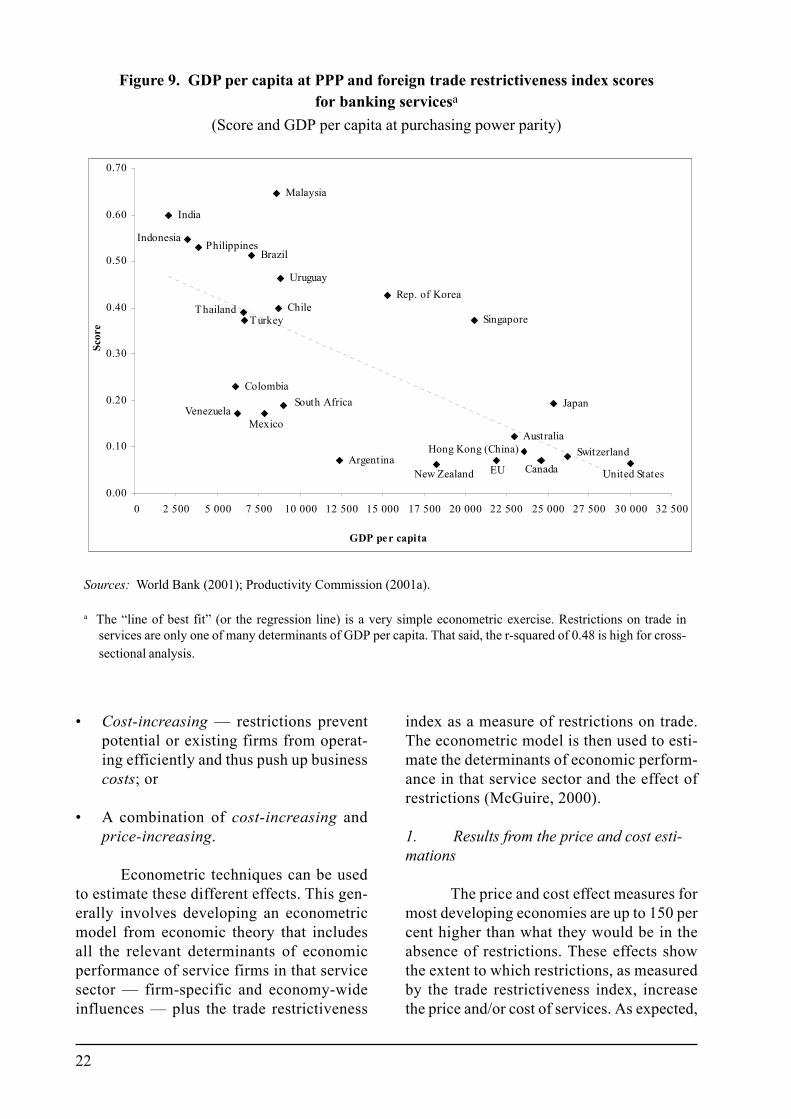
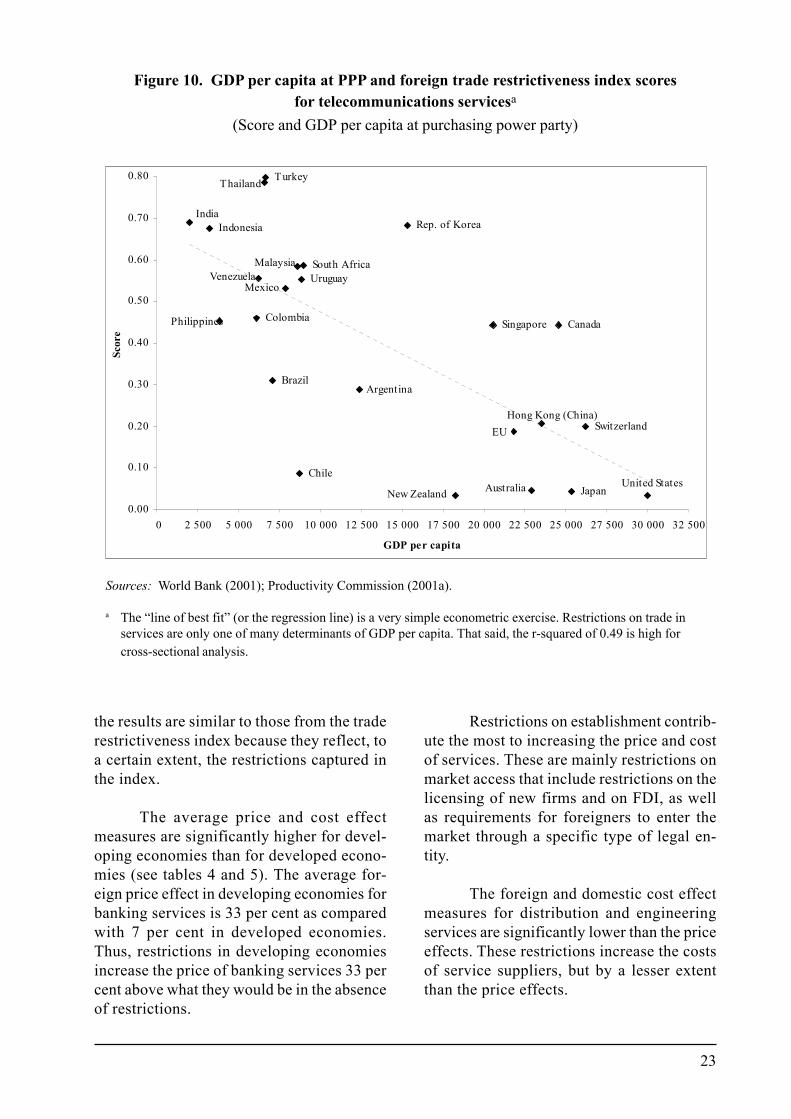
In banking and telecommunicationsservices, a number of developing economiesin Asia and South America have particularlyhigh restrictions and low GDP per capita (seefigure 9 and 10). Developing economies have
particularly high foreign trade restrictivenessindex scores and low GDP per capita. Thereare also a number of economies that are awayfrom the trendline. In banking services, theRepublic of Korea and Singapore have rela-tively high restrictiveness scores and mediumGDP per capita income. Argentina, Colom-bia, Mexico, South Africa and Venezuelahave relatively low restrictiveness indexscores and medium per capita income. Intelecommunications services, Thailand andTurkey have high restrictiveness index scoresand low GDP per capita. The Republic ofKorea, Singapore and Canada have mediumrestrictiveness index scores and GDP percapitas. Chile has a low restrictiveness in-dex score and GDP per capita.
Many other studies find similar rela-tionships between the openness of servicesectors and income. Mattoo et al. (2001)found a positive relationship between open-ness in financial and telecommunicationssectors and long-run economic growth. Thegrowth of economies with fully open tel-
Figure 7. Telecommunications servicesa,b
(Score)
0.000.100.200.300.400.500.600.700.800.90
Arg
entin
a
Bra
zil
Chi
le
Col
ombi
a
Indi
a
Indo
nesi
a
Rep
. of K
orea
Mal
aysi
a
Mex
ico
Phili
ppin
es
Sout
h A
fric
a
Thai
land
Turk
ey
Uru
guay
Ven
ezue
la
Ave
rage
LM
IEs
Ave
rage
HIE
s
Economy
Scor
eForeign index Domestic index
Source: Adapted from Warren (2000a).
a Based on a 1998 International Telecommunication Union survey (ITU, 1999).b The results are calculated from Warren (2000a). This is a subset of trade restrictiveness
indices. Warren also calculated a number of results for other developing economies.
21
ecommunications and financial services is1.5 per cent higher than that of other econo-mies. Levine (1997) found that economieswith financial systems that are better at per-forming key financial services functions tendto be economically developed, have higherincome per capita and grow at a faster pacethan those that are less developed. The Pa-cific Economic Cooperation Council (1995)found a positive relationship between wealthand openness, in that APEC member econo-mies with a higher number of GATS com-mitments also tend to have higher GDP percapita.
B. The effect of restrictions on the priceand cost of services
The results from the trade restrictive-ness indices can be used to estimate the ef-fect of restrictions on the economic perform-ance of service suppliers � prices and costsor price/cost margins. Restrictions on tradein services can have the effect of being:
� Price-increasing � restrictions protectincumbent firms from competition, andallows firms to increase their prices andexpand their price/cost margins;
Figure 8. GDP per capita at PPP and average foreign trade restrictiveness indexscores for the service sectora,b
(Score and GDP per capita at purchasing power parity)
Sources: World Bank (2001); Productivity Commission (2001a).
a The average foreign trade restrictiveness index scores are the average scores for banking, distribution, maritime,professions and telecommunications.
b The �line of best fit� (or the regression line) is a very simple econometric exercise. Restrictions on trade in servicesare only one of many determinants of GDP per capita. That said, the r-squared of 0.52 is high for cross-sectionalanalysis. Greene (1990) states that r-squared values of 0.50 are relatively high for cross-sectional analysis.
United StatesSwitzerlandJapan
Canada
Hong Kong (China)Australia
EU
Singapore
New Zealand
Rep. of Korea
Argentina
South AfricaChile
Malaysia
UruguayBrazil
Turkey
India IndonesiaPhilippines
VenezuelaColombia Mexico
Thailand
0.00
0.05
0.10
0.15
0.20
0.25
0.30
0.35
0.40
0.45
0.50
0.55
0 2 500 5 000 7 500 10 000 12 500 15 000 17 500 20 000 22 500 25 000 27 500 30 000 32 500
GDP per capita
Scor
e
22
� Cost-increasing � restrictions preventpotential or existing firms from operat-ing efficiently and thus push up businesscosts; or
� A combination of cost-increasing andprice-increasing.
Econometric techniques can be usedto estimate these different effects. This gen-erally involves developing an econometricmodel from economic theory that includesall the relevant determinants of economicperformance of service firms in that servicesector � firm-specific and economy-wideinfluences � plus the trade restrictiveness
index as a measure of restrictions on trade.The econometric model is then used to esti-mate the determinants of economic perform-ance in that service sector and the effect ofrestrictions (McGuire, 2000).
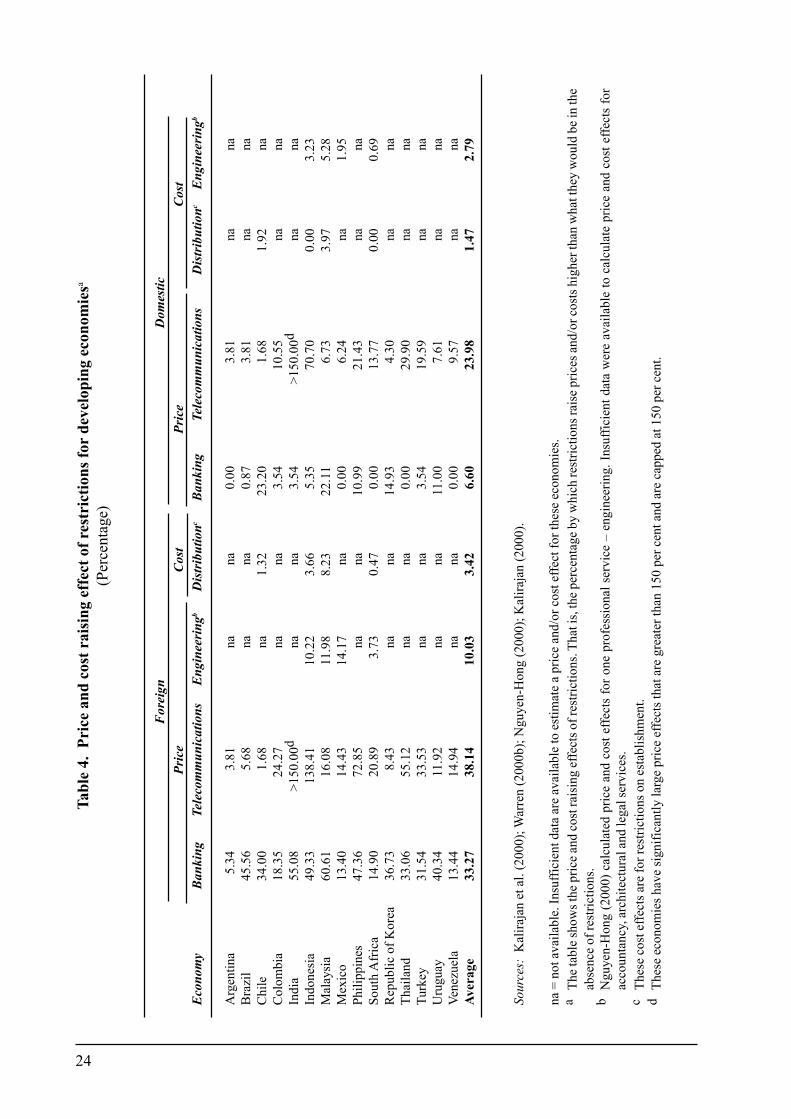
1. Results from the price and cost esti-mations
The price and cost effect measures formost developing economies are up to 150 percent higher than what they would be in theabsence of restrictions. These effects showthe extent to which restrictions, as measuredby the trade restrictiveness index, increasethe price and/or cost of services. As expected,
Figure 9. GDP per capita at PPP and foreign trade restrictiveness index scoresfor banking servicesa
(Score and GDP per capita at purchasing power parity)
Sources: World Bank (2001); Productivity Commission (2001a).
a The �line of best fit� (or the regression line) is a very simple econometric exercise. Restrictions on trade inservices are only one of many determinants of GDP per capita. That said, the r-squared of 0.48 is high for cross-sectional analysis.
Singapore
New Zealand
Rep. of Korea
Argentina
India
IndonesiaPhilippines
Colombia
Venezuela
TurkeyThailand
Brazil
Mexico
South Africa
Chile
Uruguay
Malaysia
EU
AustraliaHong Kong (China)
Canada
Japan
Switzerland
United States
0.00
0.10
0.20
0.30
0.40
0.50
0.60
0.70
0 2 500 5 000 7 500 10 000 12 500 15 000 17 500 20 000 22 500 25 000 27 500 30 000 32 500
GDP per capita
Scor
e
23
the results are similar to those from the traderestrictiveness index because they reflect, toa certain extent, the restrictions captured inthe index.
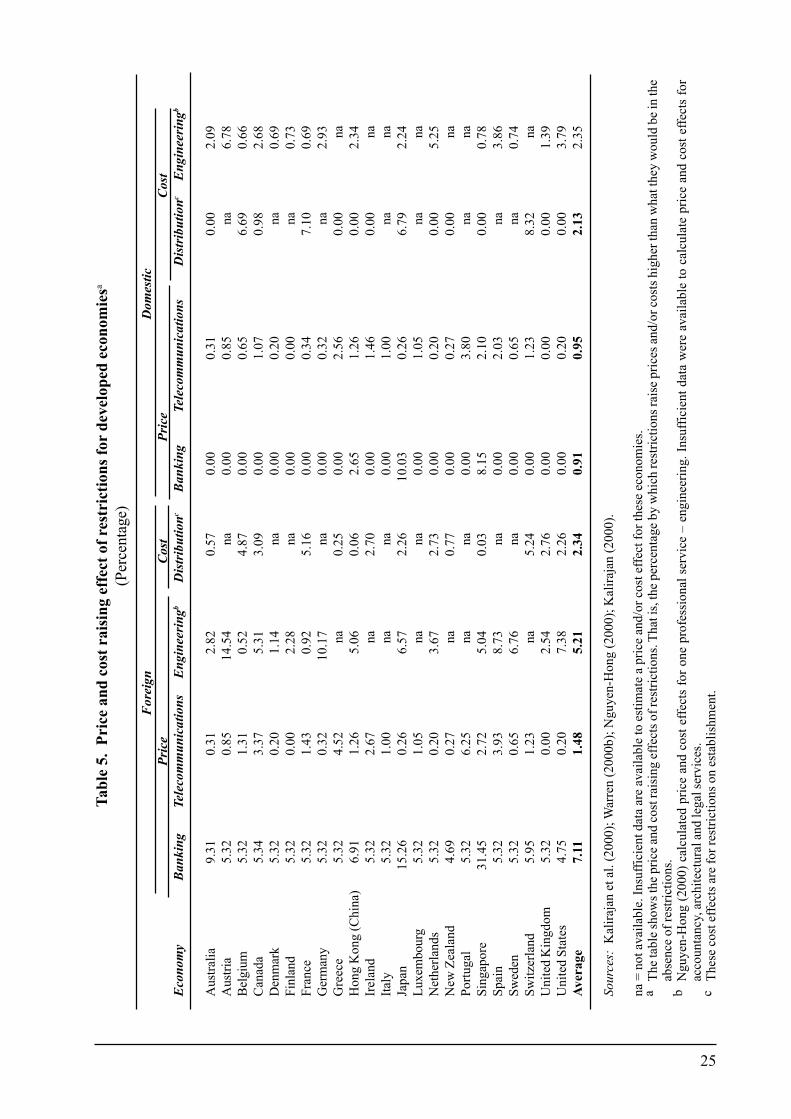
The average price and cost effectmeasures are significantly higher for devel-oping economies than for developed econo-mies (see tables 4 and 5). The average for-eign price effect in developing economies forbanking services is 33 per cent as comparedwith 7 per cent in developed economies.Thus, restrictions in developing economiesincrease the price of banking services 33 percent above what they would be in the absenceof restrictions.
Restrictions on establishment contrib-ute the most to increasing the price and costof services. These are mainly restrictions onmarket access that include restrictions on thelicensing of new firms and on FDI, as wellas requirements for foreigners to enter themarket through a specific type of legal en-tity.
The foreign and domestic cost effectmeasures for distribution and engineeringservices are significantly lower than the priceeffects. These restrictions increase the costsof service suppliers, but by a lesser extentthan the price effects.
Figure 10. GDP per capita at PPP and foreign trade restrictiveness index scoresfor telecommunications servicesa
(Score and GDP per capita at purchasing power party)
IndiaIndonesia
Philippines Colombia
United States
EU
Australia
Venezuela
TurkeyThailand
South AfricaMalaysiaUruguay
Mexico
Brazil
Chile
Argentina
Rep. of Korea
New Zealand
Singapore
Hong Kong (China)
Canada
Switzerland
Japan
0.00
0.10
0.20
0.30
0.40
0.50
0.60
0.70
0.80
0 2 500 5 000 7 500 10 000 12 500 15 000 17 500 20 000 22 500 25 000 27 500 30 000 32 500
GDP per capita
Scor
e
Sources: World Bank (2001); Productivity Commission (2001a).
a The �line of best fit� (or the regression line) is a very simple econometric exercise. Restrictions on trade inservices are only one of many determinants of GDP per capita. That said, the r-squared of 0.49 is high forcross-sectional analysis.
24
Tabl
e 4.
Pri
ce a
nd c
ost r
aisi
ng e
ffec
t of r
estr
ictio
ns fo
r de
velo
ping
eco
nom
iesa
(Per
cent
age)
Fore
ign
Dom
estic
Pric
eCo
st
Pric
eCo
stEc
onom
yBa
nkin
gTe
leco
mm
unic
atio
ns E
ngin
eerin
gbD
istrib
utio
ncBa
nkin
gTe
leco
mm
unic
atio
nsD
istrib
utio
ncEn
gine
erin
gb
Arg
entin
a5.
343.
81na
na0.
003.
81na
naB
razi
l45
.56
5.68
nana
0.87
3.81
nana
Chi
le34
.00
1.68
na1.
3223
.20
1.68
1.92
naC
olom
bia
18.3
524
.27
nana
3.54
10.5
5na
naIn
dia
55.0
8>1
50.0
0dna
na3.
54>1
50.0
0dna
naIn
done
sia
49.3
313
8.41
10.2
23.
665.
3570
.70
0.00
3.23
Mal
aysi
a60
.61
16.0
811
.98
8.23
22.1
16.
733.
975.
28M
exic
o13
.40
14.4
314
.17
na0.
006.
24na
1.95
Phili
ppin
es47
.36
72.8
5na
na10
.99
21.4
3na
naSo
uth
Afr
ica
14.9
020
.89
3.73
0.47
0.00
13.7
70.
000.
69R
epub
lic o
f Kor
ea36
.73
8.43
nana
14.9
34.
30na
naTh
aila
nd33
.06
55.1
2na
na0.
0029
.90
nana
Turk
ey31
.54
33.5
3na
na3.
5419
.59
nana
Uru
guay
40.3
411
.92
nana
11.0
07.
61na
naVe
nezu
ela
13.4
414
.94
nana
0.00
9.57
nana
Aver
age
33.2
738
.14
10.0
33.
426.
6023
.98
1.47
2.79
Sour
ces:
Kal
iraja
n et
al.
(200
0); W
arre
n (2
000b
); N
guye
n-H
ong
(200
0); K
alira
jan
(200
0).
na =
not
ava
ilabl
e. In
suffi
cien
t dat
a ar
e av
aila
ble
to e
stim
ate
a pr
ice
and/
or c
ost e
ffect
for t
hese
eco
nom
ies.
aTh
e tab
le sh
ows t
he p
rice a
nd co
st ra
isin
g ef
fect
s of r
estri
ctio
ns. T
hat i
s, th
e per
cent
age b
y w
hich
rest
rictio
ns ra
ise p
rices
and/
or co
sts h
ighe
r tha
n w
hat t
hey
wou
ld b
e in
the
abse
nce
of re
stric
tions
.b
Ngu
yen-
Hon
g (2
000)
cal
cula
ted
pric
e an
d co
st e
ffect
s fo
r one
pro
fess
iona
l ser
vice
� e
ngin
eerin
g. In
suffi
cien
t dat
a w
ere
avai
labl
e to
cal
cula
te p
rice
and
cost
effe
cts
for
acco
unta
ncy,
arc
hite
ctur
al a
nd le
gal s
ervi
ces.
cTh
ese
cost
effe
cts a
re fo
r res
trict
ions
on
esta
blis
hmen
t.d
Thes
e ec
onom
ies h
ave
sign
ifica
ntly
larg
e pr
ice
effe
cts t
hat a
re g
reat
er th
an 1
50 p
er c
ent a
nd a
re c
appe
d at
150
per
cen
t.
25
Tabl
e 5.
Pri
ce a
nd c
ost r
aisi
ng e
ffec
t of r
estr
ictio
ns fo
r de
velo
ped
econ
omie
sa
(Per
cent
age)
Fore
ign
Dom
estic
Pric
eCo
stPr
ice
Cost
Econ
omy
Bank
ing
Tele
com
mun
icat
ions
Engi
neer
ingb
Dist
ribut
ionc
Bank
ing
Tele
com
mun
icat
ions
Dist
ribut
ionc
Engi
neer
ingb
Aus
tralia
9.31
0.31
2.82
0.57
0.00
0.31
0.00
2.09
Aus
tria
5.32
0.85
14.5
4na
0.00
0.85
na6.
78B
elgi
um5.
321.
310.
524.
870.
000.
656.
690.
66C
anad
a5.
343.
375.
313.
090.
001.
070.
982.
68D
enm
ark
5.32
0.20
1.14
na0.
000.
20na
0.69
Finl
and
5.32
0.00
2.28
na0.
000.
00na
0.73
Fran
ce5.
321.
430.
925.
160.
000.
347.
100.
69G
erm
any
5.32
0.32
10.1
7na
0.00
0.32
na2.
93G
reec
e5.
324.
52na
0.25
0.00
2.56
0.00
naH
ong
Kon
g (C
hina
)6.
911.
265.
060.
062.
651.
260.
002.
34Ir
elan
d5.
322.
67na
2.70
0.00
1.46
0.00
naIta
ly5.
321.
00na
na0.
001.
00na
naJa
pan
15.2
60.
266.
572.
2610
.03
0.26
6.79
2.24
Luxe
mbo
urg
5.32
1.05
nana
0.00
1.05
nana
Net
herla
nds
5.32
0.20
3.67
2.73
0.00
0.20
0.00
5.25
New
Zea
land
4.69
0.27
na0.
770.
000.
270.
00na
Portu
gal
5.32
6.25
nana
0.00
3.80
nana
Sing
apor
e31
.45
2.72
5.04
0.03
8.15
2.10
0.00
0.78
Spai
n5.
323.
938.
73na
0.00
2.03
na3.
86Sw
eden
5.32
0.65
6.76
na0.
000.
65na
0.74
Switz
erla
nd5.
951.
23na
5.24
0.00
1.23
8.32
naU
nite
d K
ingd
om5.
320.
002.
542.
760.
000.
000.
001.
39U
nite
d St
ates
4.75
0.20
7.38
2.26
0.00
0.20
0.00
3.79
Aver
age
7.11
1.48
5.21
2.34
0.91
0.95
2.13
2.35
Sour
ces:
Kal
iraja
n et
al.
(200
0); W
arre
n (2
000b
); N
guye
n-H
ong
(200
0); K
alira
jan
(200
0).
na =
not
ava
ilabl
e. In
suffi
cien
t dat
a ar
e av
aila
ble
to e
stim
ate
a pr
ice
and/
or c
ost e
ffect
for t
hese
eco
nom
ies.
aTh
e tab
le sh
ows t
he p
rice a
nd co
st ra
isin
g ef
fect
s of r
estri
ctio
ns. T
hat i
s, th
e per
cent
age b
y w
hich
rest
rictio
ns ra
ise p
rices
and/
or co
sts h
ighe
r tha
n w
hat t
hey
wou
ld b
e in
the
abse
nce
of re
stric
tions
.b
Ngu
yen-
Hon
g (2
000)
cal
cula
ted
pric
e an
d co
st e
ffect
s fo
r one
pro
fess
iona
l ser
vice
� e
ngin
eerin
g. In
suffi
cien
t dat
a w
ere
avai
labl
e to
cal
cula
te p
rice
and
cost
effe
cts
for
acco
unta
ncy,
arc
hite
ctur
al a
nd le
gal s
ervi
ces.
cTh
ese
cost
effe
cts a
re fo
r res
trict
ions
on
esta
blis
hmen
t.
26
2. Benefits of removing restrictions onmarket access
The price and cost effect measures canshow the benefits of removing certain typesof market access restrictions for developingeconomies.1 The most common types of re-strictions on market access are:
� Restrictions on foreign direct investment;
� Licensing requirements for foreign serv-ice suppliers; and
� Restrictions on the form of establishmentor type of legal entity for foreign servicesuppliers.
Restrictions on FDI are estimated toincrease the price of services in developingeconomies by up to 13 per cent for bankingand up to 56 per cent for telecommunications(Productivity Commission, 2001a). In addi-tion to the direct reductions in price, liberal-izing FDI regimes will bring many dynamicbenefits to developing economies. FDI is amajor source of capital, technology transferand improved managerial skills which sig-
nificantly contributes to building economiccapacity in developing economies.
Restrictions on the number of licencesfor foreign service suppliers are estimated toincrease the price of services in developingeconomies by up to 15 per cent for bankingand up to 5 per cent for engineering services(Productivity Commission, 2001a). Remov-ing these restrictions contributes to a greaternumber of service suppliers, innovation andwider consumer choice.
Restrictions on the form of establish-ment of a foreign service supplier are esti-mated to increase the price of services indeveloping economies by up to 5 per cent forbanking and by up to 2 per cent for engineer-ing services (Productivity Commission,2001a). Permitting service suppliers to entera market via the most suitable legal entityprovides them with the ability to structuretheir business and supply services in the mostefficient way. Restrictions usually requireforeign service suppliers to enter only as arepresentative office, branch, partnership,subsidiary or through a joint venture with adomestic service supplier.
1 There are implications in the sequence of remov-ing certain restrictions. Dee and Hanslow (2000) notethat some approaches to partial liberalization canworsen disparities in protection and real income bymoving resources further away from a pattern in aworld free of distortions.
27
The greatest benefits from liberaliza-tion are achieved through domestic reformor liberalizing one�s own service sector, ir-respective of the efforts of other Govern-ments to liberalize their service sectors. Thisis reflected in the empirical research on theeffect of restrictions on the prices and costsof service suppliers and the real-income gainsfor developing economies. The processes thatproduce these gains are complex, but mainlyinvolve removing restrictions so that re-sources can be mobilized or allocated to theirmost productive uses.
The most gains from trade reformcome from the economic efficiencies createdwhen an economy opens itself to the pres-sures and opportunities of international com-petition, irrespective of the trade restrictionswhich may prevail abroad (ProductivityCommission, 2001b). McKibbin (1997) es-timated that the gains to Australia from uni-laterally meeting its own APEC commit-ments would account for almost 90 per centof the gains which would accrue to it if allAPEC countries met their commitments.
As mentioned above, liberalizingtrade in services is about reforming regula-tion that restricts trade, so as to improve na-tional welfare. While it is necessary for Gov-ernments to maintain regulation to meet so-cial and economic objectives, certain regu-lation may intentionally or unintentionallyrestrict trade in services. Such restrictions arelikely to reduce economic efficiency andhence national welfare by limiting the extentto which economies specialize in providingservices according to their comparative ad-vantage.
There is substantial empirical evi-dence to show that significant benefits ac-crue to those economies undergoing trade lib-eralization, whether it is in the traditionalarea of goods or the important growth areaof services. Sachs and Warner (1995) founda close association between trade opennessand economic growth in developing econo-mies. From 1970 to 1989, �open� develop-ing economies grew at an average annual rateof 4.5 per cent, while �closed� economiesgrew at a rate of 0.7 per cent. Dollar andKraay (2001) found a strong positive effectof trade on growth. Srinivasan and Bhagwati(2001) found that, after accounting for nu-merous economy-specific factors, �trade doesseem to create, even sustain, higher growth�.
Liberalization increases competition,lowers prices and improves the quality ofservices. Competition, especially interna-tional competition, is the best guarantee thatdomestic service suppliers are and will re-main efficient. Competition forces servicesuppliers to reduce waste, improve manage-ment and become more efficient. Costly rent-seeking activities, for the purpose of gainingor maintaining preferential access to a serv-ices market, are also less feasible in a liber-alized environment. These pressures reducethe operational costs of providing services.Competition then forces service suppliers topass on cost savings to consumers in the formof lower prices. The excess profits of serv-ice suppliers are reduced and the number ofservice suppliers is increased.
An increase in the number of servicesuppliers increases the choice of services forconsumers and businesses. More service sup-pliers are attentive to the needs or demands
V. LIBERALIZATION, EFFICIENCY ANDTHE DOMESTIC SERVICE SECTOR
28
of consumers, and provide services in linewith these demands. Innovations producenew services where existing services previ-ously met consumer demands inadequately.Also, consumers will be more attentive topurchasing �value for money� services andthe quality of services supplied will improve.
FDI plays a key role in services tradeand development. Establishing a commercialpresence in an economy, often through di-rect investment, is an important mode of de-livery for most services, particularly whereongoing contact with consumers is importantor the nature of the services means that othermodes of supply are not feasible or viable.FDI is a major source of capital, technologytransfer and improved managerial skill inhost developing economies (see box 3).
Liberalization not only introducescompetition and improves the quality of serv-ices in developing economies, but also im-proves their economic capacity and facilitatestrade in goods � a traditional export earnerfor developing economies.
The prosperity of many developingeconomies is hampered by inefficient, unre-liable and expensive service sectors. Someservice sectors � telecommunications, fi-nancial and transport � not only provide fi-nal consumer services, but also are essentialinputs for the production of other goods andservices. Financial services facilitates an ef-ficient transformation of savings into invest-ment, ensuring that those resources are de-ployed to their most productive uses. Tel-ecommunication services disseminate infor-mation and knowledge. Transport servicesdistribute goods within an economy and withinternational trade partners. Developingeconomies often supply these essential serv-ices through government monopolies. Suchservices are provided at extremely high pricesand cripple the ability of other sectors of aneconomy to compete internationally. Liber-alization of services, including institutionalchanges, promotes the competitiveness of
many downstream activities while improv-ing overall economic performance.
Services also complement goodstrade. Inefficiencies in the service sector ofa developing economy impact negatively onthe export competitiveness of its agricultureand manufacturing sectors, and thus contrib-ute to an unfavourable balance of trade. In-ternational trade in goods depends on theperformance of a number of essential serv-ices. Telecommunications services are re-quired in order to communicate with the im-porter on prices and quantities of goods toexport, financial services are required to ar-range payment and insurance, and transportservices are required to transport goods tothe foreign market. A competitive and effi-cient transport service sector is particularlyimportant for international trade in goods �approximately 95 per cent of goods for in-ternational trade are transported via maritimeservices.
In reducing protection, economiesexpose their service sectors and employeesto short-term adjustment and transition costs.Less efficient service suppliers with highoperating costs are likely to suffer from com-petition, and domestic production may de-cline in the previously protected service sec-tor as resources are reallocated. There maybe strong resistance by some minority groups,but the resistance of a few should not limitor deprive the whole community of the sub-stantial benefits from liberalization.
There is clearly a role for governmentto balance the benefits of liberalizationagainst these costs and to provide appropri-ate assistance to those adversely affected.Adjustment costs from changing interna-tional competitiveness can only be delayedor shifted to others within the economy, theycannot be avoided. By strengthening theoverall economy, trade liberalization adds toan economy�s ability to maintain and improveliving standards while dealing with pressuresfor change (Productivity Commission,
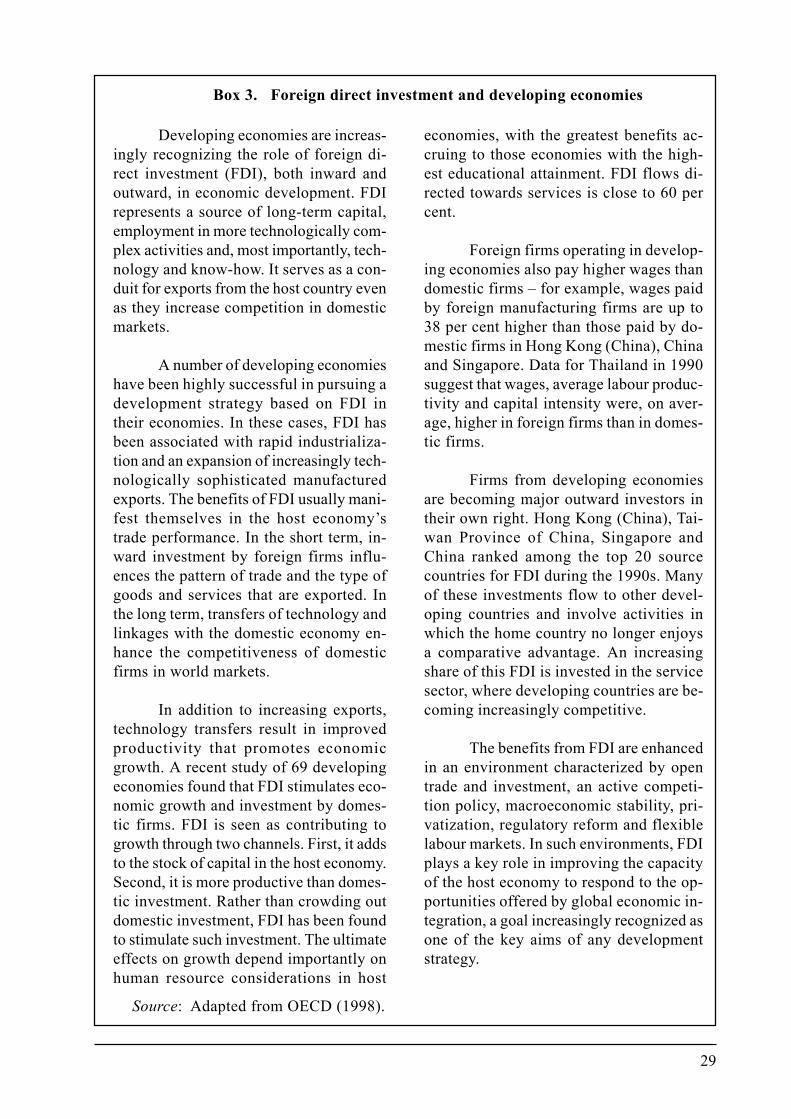
29
Developing economies are increas-ingly recognizing the role of foreign di-rect investment (FDI), both inward andoutward, in economic development. FDIrepresents a source of long-term capital,employment in more technologically com-plex activities and, most importantly, tech-nology and know-how. It serves as a con-duit for exports from the host country evenas they increase competition in domesticmarkets.
A number of developing economieshave been highly successful in pursuing adevelopment strategy based on FDI intheir economies. In these cases, FDI hasbeen associated with rapid industrializa-tion and an expansion of increasingly tech-nologically sophisticated manufacturedexports. The benefits of FDI usually mani-fest themselves in the host economy�strade performance. In the short term, in-ward investment by foreign firms influ-ences the pattern of trade and the type ofgoods and services that are exported. Inthe long term, transfers of technology andlinkages with the domestic economy en-hance the competitiveness of domesticfirms in world markets.
In addition to increasing exports,technology transfers result in improvedproductivity that promotes economicgrowth. A recent study of 69 developingeconomies found that FDI stimulates eco-nomic growth and investment by domes-tic firms. FDI is seen as contributing togrowth through two channels. First, it addsto the stock of capital in the host economy.Second, it is more productive than domes-tic investment. Rather than crowding outdomestic investment, FDI has been foundto stimulate such investment. The ultimateeffects on growth depend importantly onhuman resource considerations in host
economies, with the greatest benefits ac-cruing to those economies with the high-est educational attainment. FDI flows di-rected towards services is close to 60 percent.
Foreign firms operating in develop-ing economies also pay higher wages thandomestic firms � for example, wages paidby foreign manufacturing firms are up to38 per cent higher than those paid by do-mestic firms in Hong Kong (China), Chinaand Singapore. Data for Thailand in 1990suggest that wages, average labour produc-tivity and capital intensity were, on aver-age, higher in foreign firms than in domes-tic firms.
Firms from developing economiesare becoming major outward investors intheir own right. Hong Kong (China), Tai-wan Province of China, Singapore andChina ranked among the top 20 sourcecountries for FDI during the 1990s. Manyof these investments flow to other devel-oping countries and involve activities inwhich the home country no longer enjoysa comparative advantage. An increasingshare of this FDI is invested in the servicesector, where developing countries are be-coming increasingly competitive.
The benefits from FDI are enhancedin an environment characterized by opentrade and investment, an active competi-tion policy, macroeconomic stability, pri-vatization, regulatory reform and flexiblelabour markets. In such environments, FDIplays a key role in improving the capacityof the host economy to respond to the op-portunities offered by global economic in-tegration, a goal increasingly recognized asone of the key aims of any developmentstrategy.
Box 3. Foreign direct investment and developing economies
Source: Adapted from OECD (1998).
30
2001b).
A. The importance of the financialservices sector
The financial services sector is typi-cally the largest service sector of an economyand is vital in mobilizing savings for invest-ment and facilitating business transactions.All economic transactions require, to vary-ing degrees, efficient and reliable access tofinancial services. The development of mod-ern economies relies on diversified interme-diation and risk management services pro-vided by the financial system. A healthy andstable financial system, underpinned bysound macroeconomic management and pru-dential regulation, is an essential ingredientfor sustained growth (Kono et al., 1997).Levine (1997) finds a strong positive linkbetween an open and efficient financial sys-tem, and long-run economic growth.
Liberalization of a financial sector islikely to contribute more to economic growththan any other service sector. Like trade inother services, competition in financial serv-ices reduces prices, improves quality andwidens consumer choice. Liberalizing tradein financial services reduces prices throughthe transfer of technology and knowledge.New and innovative financial instrumentsimprove management and risk assessmenttechniques. Financial services also directlyfacilitate trade by providing trade finance,transport insurance and foreign exchangeservices.
Competition forces financial servicesuppliers to increase their efficiency andadopt new technologies for the delivery oftheir services at the lowest costs. Financialreform in many economies between 1972 and1992 resulted in improvements in most indi-cators of bank operational efficiency (OECD,1995, 1997; Kono et al., 1997). Improvedtechnology and greater competition result incost and efficiency savings being passed on
to bank customers. New delivery channels,such as Internet banking, reduce the cost ofproviding financial services. For example,the cost of an average payment transactionover the Internet is as low as US$0.01, com-pared with US$0.27 for an automatic tellermachine, US$0.54 using telephone bankingand US$1.07 through a bank branch (Konoet al., 1997).
Consumers and businesses also ben-efit from liberalization by having a greaterchoice of financial services. Financial inno-vation produces new services in areas whereexisting services inadequately meet customerdemands. Effective competition forces finan-cial service suppliers to provide services inline with customer demands. The range offinancial services increases as customerssearch for financial services which bettermeet their needs. Financial services liberali-zation within the European Union increasedthe number (and choice) of cross-border bankservices by 58 per cent between 1993 and1995 (OECD, 1998).
A strong interdependence exists be-tween the trade regime, macroeconomic man-agement and financial regulation. An openfinancial services sector is likely to improvea host economy�s macroeconomic policiesand encourage the Government to rely onmore effective prudential regulation. Liber-alization of financial services usually entailsthe removal by monetary authorities of lessefficient prescriptive controls on interestrates and credit lending, and greater use ofmarket-based instruments for influencingeconomic activity. Market-based policy in-struments, including open-market transac-tions in securities, place pressure on Gov-ernments to maintain economic stabilitythrough appropriate monetary, fiscal and ex-change rate policies. The implementation ofmonetary policy through these instruments,rather than through the use of prescriptiveinterest rate controls, is considered less dis-tortional and is likely to better develop fi-nancial markets.
31
The existence of foreign banks alsoadds to the stability of the financial system.Foreign banks provide a stable source offunding and are able to draw on capital ofthe parent company for liquidity during timesof difficulties (OECD, 1998). Foreign banksalso improve the regulatory framework intheir host economy. Claessens and Glaessner(1998) argue that foreign banks exert pres-sure on domestic regulators to improve regu-lation and supervision, including intensify-ing linkages with foreign regulators.Goldstein and Turner (1996) report that rela-tively high shares of foreign ownership con-tributed to maintaining stable banking sys-tems in Chile, Hong Kong and Malaysia.
B. Unilateral and multilateral liberaliza-tion
Multilateral liberalization is a neces-sary complement to unilateral liberalization.Unilateral liberalization, whereby Govern-ments liberalize trade regardless of the ef-
forts of other economies, plays an importantrole in reforming service sectors. Reformoften takes place as Governments realize thebenefits of promoting competition and estab-lishing an efficient supply of services. Thesebenefits accrue to the liberalizing economyand are largely independent of whether trad-ing partners choose to liberalize or not.
Multilateral liberalization under theGeneral Agreement on Trade in Services(GATS) complements the efforts of Govern-ments to liberalize unilaterally (Sorsa, 1997).GATS commitments and ongoing negotia-tions can advance services liberalization ina non-discriminatory manner within interna-tionally enforceable rules. The multilateralsystem can help to lock in unilateral reformsto limit possible backsliding by Governmentsin the future. However, the effectiveness ofthe GATS in meeting these objectives, at leastin the short run, will depend in large part onthe extent to which WTO Members havebound their existing policies, or preferablycommitted themselves to new liberalization.
32
VI. CONCLUSION
The economic modelling results putthe importance of liberalizing or removingrestrictions on services into perspective. Theglobal gains from liberalizing services aresimilar to those from liberalizing agricultureand manufacturing combined. The projectedreal income gains for developing economiesare expected to be US$ 130 billion. The larg-est gains will accrue to those economies withthe greatest restrictions.
Gaining market access to foreign serv-ices markets is important for developingeconomies, but relatively greater real-incomegains will be achieved by liberalizing serv-ices independently of others. Liberalizationintroduces service suppliers to the pressuresand opportunities of international competi-tion, which forces them to allocate resourcesefficiently to their most productive uses foreconomic development.
These benefits of liberalizing inde-pendently are not confined to the service sec-tor. Some service sectors � telecommuni-cations, financial and transport � not onlyprovide final consumer services, but also areessential inputs for the production of othergoods and services. This interlinkage be-tween the service sector and other sectorsproduces substantial benefits beyond theservice sector that directly feed into improv-ing an economy�s trade and economic per-formance.
The effects of restrictions on trade inservices are complex and recent economicmodelling provides an indication of the real-income gains, but more research is needed.There are a large and varied number of re-strictions on trade in services, and it is oftendifficult to capture all the effects of restric-tions on the prices and costs of services.General equilibrium models also need to bedeveloped further to incorporate more de-tailed services trade data and accuratelysimulate price and cost effects.
Liberalization is beneficial for aneconomy, but this raises issues about the paceand sequencing of reform. Many economistsbelieve that faster is better, but it is a factthat rapid liberalization may have short-termstructural adjustment and hence politicalcosts. This suggests that it is important tohave a comprehensive package of measuresin place, including some kind of social safetynet to facilitate change. The �right� environ-ment also needs to be developed to foster lib-eralization. In the service sector, an adequateregulatory framework is needed, which islacking in many developing countries, in or-der to provide certainty for foreign servicesuppliers and to encourage investment in in-frastructure.
33
Benjamin, N. and X. Diao (1998), �Liberalizing Services Trade in APEC: A General Equilib-rium Analysis with Imperfect Competition�, The Economic Implications of Liberalis-ing APEC Tariff and Non-Tariff Barriers to Trade, U.S. International Trade Commis-sion, Washington DC.
�� (2000), �Liberalizing Services Trade in APEC: A General Equilibrium Analysis withImperfect Competition�, Pacific Economic Review, vol. 5, no. 1, pp. 49-75.
Brown, D., A. Deardorff and R. Stern (1996), �Modelling Multilateral Liberalization in Serv-ices�, Asia-Pacific Economic Review, vol. 2, pp. 21-34.
Chadha, R. (2001), �GATS and the Developing Countries: A Case Study of India�, in Stern,Robert M. (ed.), Services in the International Economy: Measurement and Modelling,Sectoral and Country Studies, and Issues in the WTO Services Negotiations, Universityof Michigan Press.
Chadha, R., D. Brown, A. Deardorff and A. Stern (2000), Computational Analysis of the Im-pact on India of the Uruguay Round and the Forthcoming WTO Trade Negotiations,Discussion Paper No. 459, School of Public Policy, University of Michigan.
Claessens, S. and Glaessner, T. (1998), Internationalization of Financial Services in Asia,World Bank, Washington DC.
Dee, P. and K. Hanslow (2000), Multilateral Liberalisation of Services Trade, ProductivityCommission Staff Research Paper, Ausinfo, Canberra http://www.pc.gov.au/research/staffres/multilatlib/index.html (accessed 15 October 2001).
Dee, P., A. Hardin and L. Holmes (2000), �Issues in the Application of CGE Models to Serv-ices Trade Liberalization�, in Findlay, C. and Warren, T. (eds.), Impediments to Tradein Services: Measurement and Policy Implications, Routledge, London and New York.
Department of Foreign Affairs and Trade (DFAT) (1999), Global Trade Reform: MaintainingMomentum, DFAT, Canberra.
Dollar, D. and A. Kraay (2001), Trade, Growth and Poverty, World Bank Draft Working PaperNo. 2615, Washington DC.
Drabek, Z. and S. Laird (2001), Can Trade Policy Help Mobilize Financial Resources forEconomic Development?, Research Paper No. 01/16, Centre for Research in EconomicDevelopment and International Trade, University of Nottingham, Nottingham, UK.
REFERENCES
34
Goldstein, M. and P. Turner (1996), Banking Crises in Emerging Economies: Origins andPolicy Options, BIS Economic Paper No. 46, Bank for International Settlements, Basle.
Greene, W. (1990), Econometric Analysis, Macmillan, New York.
Hanslow, K., T. Phamduc and G. Verikios (1999), �The Structure of the FTAP Model�, Re-search Memorandum Cat. No. MC58, Productivity Commission, Canberra http://www.pc.gov.au/pcpubs/memoranda/ftap/index.html (accessed 15 October 2001).
Hardin, A. and L. Holmes (1997), Services Trade and Foreign Direct Investment, IndustryCommission Staff Research Paper, Australian Government Publishing Service, Can-berra.
Hertel, T. (1997), Global Trade Analysis: Modelling and Applications, Cambridge UniversityPress, Cambridge, UK.
Hertel, T., J. Francois and W. Martin (1999), �Agriculture and Non-agricultural Liberalisationin the Millennium Round�, paper presented at the Global Conference on Agricultureand the New Trade Agenda from a Development Perspective � Interests and Options inthe WTO 2000 Negotiations, sponsored by the World Bank and WTO, Geneva, 1-2October.
International Telecommunication Union (ITU) (1999), Telecommunication Reform 1998, vols.I-V, ITU, Geneva.
Kalirajan, K. (2000), Restrictions on Trade in Distribution Services, Productivity CommissionStaff Research Paper, Ausinfo, Canberra http://www.pc.gov.au/research/staffres/rotids/index.html (accessed 15 October 2001).
Kalirajan, K., G. McGuire, D. Nguyen-Hong and M. Schuele (2000), �The Price Impact ofRestrictions on Banking Services�, in Findlay, C. and Warren, T. (eds.), Impediments toTrade in Services: Measurement and Policy Implications, Routledge, London and NewYork.
Kono, M., P. Low, M. Luanga, A. Mattoo, M. Oshikawa and L. Schuknecht (1997), OpeningMarkets in Financial Services and the Role of the GATS, WTO, Geneva.
Levine, R. (1997), �Financial Development and Economic Growth: Views and Agenda�, Jour-nal of Economic Literature, vol. XXXV, pp. 688-726.
Mattoo, A., R. Rathindran and A. Subramanian (2001), Measuring Services Trade Liberaliza-tion and Its Impact on Economic Growth: An Illustration, World Bank Research Paper,Washington DC.
McGuire, G. (2000), �Measuring and Modelling Restrictions on Trade in Services�, note forthe OECD Trade Committee Working Party meeting held at the OECD, Paris, 18-19September.
McGuire, G. and M. Schuele (2000), �Restrictiveness of International Trade in Banking Serv-
35
ices�, in Findlay, C. and Warren, T. (eds.), Impediments to Trade in Services: Measure-ment and Policy Implications, Routledge, London and New York.
McGuire, G., M. Schuele and T. Smith (2000), �Restrictiveness of International Trade in Mari-time Services�, in Findlay, C. and Warren, T. (eds.), Impediments to Trade in Services:Measurement and Policy Implications, Routledge, London and New York.
McKibbin, W. (1997), �Regional and Multilateral Trade Liberalization: The Effects on Trade,Investment and Welfare�, paper prepared for the CEPR/ESCR/GEI Conference on Eu-rope, East Asia, APEC and the Asia Europe Meeting Process, 16 May.
Nguyen-Hong, D. (2000), Restrictions on Trade in Professional Services, Productivity Com-mission Staff Research Paper, Ausinfo, Canberra, http://www.pc.gov.au/research/staffres/rotips/index.html (accessed 15 October 2001).
Organisation for Economic Co-operation and Development (OECD) (1995), An Assessment ofFinancial Reform in OECD Countries, OECD/GD/(95)60, OECD, Paris.
�� (1997), Regulatory Reform in the Financial Services Industry: Where have we been?Where are we going?, DAFFE/CMF(97)12/REV1, OECD, Paris.
�� (1998), Open Markets Matter � The Benefits of Trade and Investment Liberalisation,OECD, Paris.
�� (1999), Developing Countries And Multilateral Trade Liberalisation: A Background NoteOn Some Key Issues, TD/TC(99)18, OECD, Paris.
�� (2000a), Quantification of Costs to National Welfare from Barriers to Services Trade: ALiterature Review, Working Party Paper of the Trade Committee, TD/TC/WP(2000)24,OECD, Paris.
�� (2000b), Quantification of the Costs to National Welfare from Barriers to Services Trade:Scoping Paper, Working Party Paper of the Trade Committee, TD/TC/WP(2000)32,OECD, Paris.
Pacific Economic Cooperation Council (PECC) (1995), Survey of Impediments to Trade andInvestment in the APEC Region, PECC, Singapore.
Productivity Commission (2000), Trade and Assistance Review 1999-00, Annual Report Se-ries 1999-00, AusInfo, Canberra, http://www.pc.gov.au/research/annrpt/tar9900/index.html (accessed 15 October 2001).
�� (2001a), Measures of Restrictions on Trade in Services Database, http://www.pc.gov.au/research/memoranda/servicesrestriction/index.html (accessed 15 October 2001).
�� (2001b), �Productivity Commission Submission to DFAT on Australia�s Approach toForthcoming Trade Negotiations�, mimeo, Canberra.
Productivity Commission and the Australian National University (2000), �Achieving Better
36
Regulation of Services�, Conference Proceedings, AusInfo, Canberra.
Robinson, S., Z. Wang and W. Martin (1999), �Capturing the Implications of Services TradeLiberalisation�, Invited Paper at the Second Annual Conference on Global EconomicAnalysis, Ebberuk, Denmark, 20-22 June.
Sachs, J. and A. Warner (1995), �Economic Reform and the Process of Global Integration�,Brookings Papers on Economic Activity, vol. 1, pp. 1-118.
Sorsa, P. (1997), The GATS Agreement on Financial Services � A Modest Start to MultilateralLiberalization, Working Paper of the International Monetary Fund, IMF, Geneva.
Srinivasan, T. and J. Bhagwati (2001), �Outward-orientation and Development: Are the Revi-sionists Right?�, in Lal, D. and Snape, R. (eds.), Trade, Development and PoliticalEconomy, Palgrave, UK, pp. 3-26.
Stewart, T. (1993), The GATT Uruguay Round: A Negotiating History (1986-1992), vol. 2,Kluwer, Amsterdam.
United Nations Conference on Trade and Development (UNCTAD) (1998), Scope for Expand-ing Exports of Developing Countries in Specific Services Sectors through all GATSModes of Supply, Taking into Account Their Interrelationship, the Role of InformationTechnology and of New Business Practices, TD/B/COM.1/21, United Nations, New Yorkand Geneva.
�� (2001), Services Sector Reform and Development Strategies: Issues and Research Pri-orities, Policy Issues in International Trade and Commodities Study Series No. 8, UnitedNations, New York and Geneva.
Verikios, G. and X.-G. Zhang (2001), Global Gains from Liberalising Trade in Telecommuni-cations and Financial Services, Productivity Commission Staff Research Paper, AusInfo,Canberra.
Warren, T. (2000a), �The Identification of Impediments to Trade and Investment in Telecom-munications Services�, in Findlay, C. and Warren, T. (eds.), Impediments to Trade inServices: Measurement and Policy Implications, Routledge, London and New York.
Warren, T. (2000b), �The impact on Output of Impediments to Trade and Investment in Tel-ecommunications Services�, in Findlay, C. and Warren, T. (eds.), Impediments to Tradein Services: Measurement and Policy Implications, Routledge, London and New York.
World Bank (2001), World Development Indicators Database on CD-ROM, World Bank, Wash-ington DC.
World Trade Organization (WTO) (1994), General Agreement on Trade in Services and Re-lated Instruments, WTO, Geneva.
�� (1998), Computer and Related Services � Background Note by the Secretariat, S/C/W/45, WTO, Geneva.
37
�� (2001a), Annual Report � International Trade Statistics 2001, WTO, Geneva.
�� (2001b), Market Access: Unfinished Business � Post-Uruguay Round Inventory and Is-sues, WTO, Geneva.
38
UNCTAD Study Series on
POLICY ISSUES IN INTERNATIONAL TRADEAND COMMODITIES
39
UNCTAD Study Series on
POLICY ISSUES IN INTERNATIONAL TRADEAND COMMODITIES
No. 1 Erich Supper, Is there effectively a level playing field for developing countryexports?, 2001, 138 p. Sales No. E.00.II.D.22.
No. 2 Arvind Panagariya, E-commerce, WTO and developing countries, 2000, 24 p.Sales No. E.00.II.D.23.
No. 3 Joseph Francois, Assessing the results of general equilibrium studies of multi-lateral trade negotiations, 2000, 26 p. Sales No. E.00.II.D.24.
No. 4 John Whalley, What can the developing countries infer from the UruguayRound models for future negotiations?, 2000, 29 p. Sales No. E.00.II.D.25.
No. 5 Susan Teltscher, Tariffs, taxes and electronic commerce: Revenue implicationsfor developing countries, 2000, 57 p. Sales No. E.00.II.D.36.
No. 6 Bijit Bora, Peter J. Lloyd, Mari Pangestu, Industrial policy and the WTO, 2000,47 p. Sales No. E.00.II.D.26.
No. 7 Emilio J. Medina-Smith, Is the export-led growth hypothesis valid for develop-ing countries? A case study of Costa Rica, 2001, 49 p. Sales No. E.01.II.D.8.
No. 8 Christopher Findlay, Service sector reform and development strategies: Issuesand research priorities, 2001, 24 p. Sales No. E.01.II.D.7.
No. 9 Inge Nora Neufeld, Anti-dumping and countervailing procedures � Use orabuse? Implications for developing countries, 2001, 33 p. Sales No. E.01.II.D.6.
No. 10 Robert Scollay, Regional trade agreements and developing countries: The caseof the Pacific Islands� proposed free trade agreement, 2001, 45 p. Sales No.E.01.II.D.16.
No. 11 Robert Scollay and John Gilbert, An integrated approach to agricultural tradeand development issues: Exploring the welfare and distribution issues, 2001,43 p. Sales No. E.01.II.D.15.
No. 12 Marc Bacchetta and Bijit Bora, Post-Uruguay round market access barriers forindustrial products, 2001, 50 p. Sales No. E.01.II.D.23.
No. 13 Bijit Bora and Inge Nora Neufeld, Tariffs and the East Asian financial crisis,2001, 30 p. Sales No. E.01.II.D.27.
40
No. 14 Bijit Bora, Lucian Cernat, Alessandro Turrini, Duty and Quota-Free Access forLDCs: Further Evidence from CGE Modelling, 2002, 130 p. Sales No.E.01.II.D.22.
No. 15 Bijit Bora, John Gilbert, Robert Scollay, Assessing regional trading arrange-ments in the Asia-Pacific, 2001, 29 p. Sales No. E.01.II.D.21.
No. 16 Lucian Cernat, Assessing regional trade arrangements: Are South-South RTAsmore trade diverting?, 2001, 24 p. Sales No. E.01.II.D.32.
No. 17 Bijit Bora, Trade related investment measures and the WTO: 1995-2001, 2002.
No. 18 Bijit Bora, Aki Kuwahara, Sam Laird, Quantification of non-tariff measures,2002, 42 p. Sales No. E.02.II.D.8.
No. 19 Greg McGuire, Trade in services � Market access opportunities and the ben-efits of liberalization for developing economies, 2002.
No. 20 Alessandro Turrini, International trade and labour market performance:major findings and open questions, 2002.
No. 21 Lucian Cernat, Assessing south-south integration: same issues, many metrics,forthcoming.
United Nations publications may be obtained from bookstores and distributors throughout the world.Please consult your bookstore or write to:
United Nations Publications
All orders from North America, Latin America, the Caribbean and Asia and the Pacific shouldbe sent to:
United Nations PublicationsRoom DC2-853, 2 UN PlazaNew York, NY 10017, USATelephone: (212) 963-8302, Toll Free 1-800-253-9646 (North America only)Fax: (212) 963-3489E-mail: [email protected]
Customers in Europe, Africa and the Middle East should send their orders to:Section des Ventes et CommercialisationBureau E-4, CH-1211Geneva 10, SwitzerlandTelephone: 41 (22) 917-2613/2614Fax: 41 (22) 917-0027E-mail: [email protected]
QUESTIONNAIRE
UNCTAD Study Series onPOLICY ISSUES IN INTERNATIONAL TRADE AND COMMODITIES
(Study series no. 19: Trade in services � Market access opportunitiesand the benefits of liberalization for developing economies)
Readership Survey
Since 1999, the Trade Analysis Branch of the Division on International Trade in Goods andServices, and Commodities of UNCTAD has been carrying out policy-oriented analytical workaimed at improving the understanding of current and emerging issues in international trade ofconcern to developing countries. In order to improve the quality of the work of the Branch, itwould be useful to receive the views of readers on this and other similar publications. It wouldtherefore be greatly appreciated if you could complete the following questionnaire and return to:
Jenifer Tacardon-MercadoTAB/DITC, Rm. E-8054
United Nations Conference on Trade and DevelopmentPalais des Nations
CH-1211 Geneva 10, Switzerland
1. Name and address of respondent (optional):
2. Which of the following describes your area of work?
Government Public enterprisePrivate enterprise institution Academic or researchInternational organization MediaNot-for-profit organization Other (specify) _________________
3. In which country do you work? _________________________________________
4. Did you find this publication Very useful Of some use Little useto your work?
5. What is your assessment of the contents of this publication? Excellent Good Adequate Poor
6. Other comments: