Embed Size (px)
Citation preview

Policy Research Working Paper 8533
Trade in Developing East Asia
How It Has Changed and Why It Matters
Cristina ConstantinescuAaditya MattooMichele Ruta
East Asia and the Pacific RegionDevelopment Research GroupMacroeconomics, Trade and Investment Global Practice July 2018
WPS8533P
ublic
Dis
clos
ure
Aut
horiz
edP
ublic
Dis
clos
ure
Aut
horiz
edP
ublic
Dis
clos
ure
Aut
horiz
edP
ublic
Dis
clos
ure
Aut
horiz
ed
Produced by the Research Support Team
Abstract
The Policy Research Working Paper Series disseminates the findings of work in progress to encourage the exchange of ideas about development issues. An objective of the series is to get the findings out quickly, even if the presentations are less than fully polished. The papers carry the names of the authors and should be cited accordingly. The findings, interpretations, and conclusions expressed in this paper are entirely those of the authors. They do not necessarily represent the views of the International Bank for Reconstruction and Development/World Bank and its affiliated organizations, or those of the Executive Directors of the World Bank or the governments they represent.
Policy Research Working Paper 8533
East Asia, for long the epitome of successful engagement in trade, faces serious challenges: technological change that may threaten the very model of labor intensive industrial-ization and a backlash against globalization that may reduce access to important markets. A detailed analysis of the evo-lution of East Asia’s trade and trade policy in goods and services leads to the conclusion that how East Asia copes with these global challenges will depend on how it addresses three more proximate national and regional challenges. The first is the emergence of one East Asian country, China, as a global trade giant—accounting for nearly one-seventh of global exports and one-tenth of global imports—which
is fundamentally altering the trading patterns and oppor-tunities of its neighbors. The second is the asymmetric implementation of national reform—remarkable open-ness to goods trade and investment coexists with relative restrictiveness of services policies—which is affecting the evolution of comparative advantage and productivity in each country. The third is the divergence between the rela-tively shallow and fragmented agreements that regulate the region’s trade and investment and the growing importance of regional and global value chains as crucial drivers of productivity growth.
This paper is a product of the East Asia and the Pacific Region, Development Research Group, and the Macroeconomics, Trade and Investment Global Practice. It is part of a larger effort by the World Bank to provide open access to its research and make a contribution to development policy discussions around the world. Policy Research Working Papers are also posted on the Web at http://www.worldbank.org/research. The authors may be contacted at [email protected], [email protected], and [email protected]

Trade in Developing East Asia:
How It Has Changed and Why It Matters*
Cristina Constantinescu, Aaditya Mattoo, Michele Ruta**
Keywords: trade policy, goods trade, services trade, China, trade agreements, global value chains
JEL codes: F13, F14, F15, F63 * This study was prepared as a background paper for the East Asia Regional Flagship report, “A Resurgent East Asia: Navigating a Changing World,” and has benefited from valuable guidance and comments from Andrew Mason and Sudhir Shetty. We are also grateful for financial support from the World Bank’s Multi‐Donor Trust Fund for Trade and Development and Strategic Research Program. The findings in this paper do not necessarily represent the views of the World Bank’s Board of Executive Directors or the governments they represent. Any errors or omissions are the authors’ responsibility. ** World Bank, 1818 H Street, Washington, D.C. 20433.

2
1. INTRODUCTION
East Asia has for long been a paragon of successful engagement in trade. Dramatic growth in exports, stimulated by openness to foreign investment, has rapidly expanded incomes and shrunk poverty. Sustaining this success, however, faces challenges. Some of these are global, notably technological change that may threaten the very model of labor intensive industrialization, and a backlash against globalization that may reduce access to some of the most important markets. How East Asia copes with these global challenges will depend on how it addresses three more proximate national and regional challenges, which are the focus of this paper. The first is the emergence of one East Asian country, China, as a global trade giant ‐ accounting for nearly one‐seventh of global exports and one‐tenth of global imports ‐ which is fundamentally altering the trading patterns and opportunities of its neighbors. The second is the asymmetric implementation of national reform – remarkable openness to goods trade and investment that coexists with relative restrictiveness of services policies – which is affecting the evolution of comparative advantage and productivity in each country. The third is the divergence between the relatively shallow and fragmented agreements that regulate the region’s trade and investment and the growing importance of regional and global value chains as crucial drivers of productivity growth.
Developing East Asia’s trade growth has been impressive in the aggregate but uneven across countries and sectors and over time. The region today accounts for about 15 percent of world trade, up from 6 percent in 1995. China, of course, stands out, with a 70 percent share today of the group’s international trade. However, countries’ trade performance diverged in the 2000s. First China’s and then Vietnam and Cambodia’s impressive growth in manufacturing exports, contrasted with the slower growth of earlier dynamos, Malaysia, Thailand and Indonesia, and there are now signs that China’s manufacturing growth itself may be reaching a plateau. Mining products have dominated the trade growth of Mongolia and Myanmar (and to a lesser extent, Indonesia). Services trade growth has been impressive only in the Philippines, and services account on average for less than 20 percent of the region’s total exports.
Even though East Asia remains vulnerable to global developments, the stake in trade within the region is growing. East Asia outperformed the growth of the rest of the world, but the region has not been spared by the global trade slowdown that started in 2012. At the same time, regional trade among developing East Asian economies has progressively increased. Intra‐developing East Asia trade was about 5 percent in the early 1990s and is close to 20 percent today. This trend reflects the shift towards China as the center of gravity of trade for these economies. For countries in the region, the share of exports to China ranges between 10 and 30 percent, and for Mongolia it is as high as 80 percent.
The countries in the region have taken divergent paths in response to China’s emergence, depending on their stage of development and pattern of comparative advantage. Most of the relatively industrialized countries – Malaysia, Thailand, the Philippines and even Indonesia ‐ have been hurt by direct competition at home and abroad from China in manufactured goods. But countries have also benefited: from increased Chinese demand, especially for services (e.g.

3
Philippines, Thailand and the Lao People’s Democratic Republic) and commodities (Indonesia, Myanmar, Lao PDR, and Mongolia); from integration into China‐linked value chains (Malaysia, Vietnam); and from relocation of Chinese production (Vietnam and Cambodia). Going forward, further integration with China will increase competitive pressures in final goods markets, but also provide better access to imported inputs and a growing demand for commodities and services. Moreover, as Chinese manufacturing competitiveness declines due to higher labor costs, developing East Asian countries can be expected to gain market shares in third markets and see an increase in the relocation of production from China.
The paths taken by individual countries have also been determined by the pattern of national reform. In the most dynamic – China itself, as well as Vietnam and Cambodia – WTO accession induced a move away from state‐owned monopolies to more competitive private provision of telecommunications, financial, transport and a range of other services. Even though their services regimes are still not fully open, the radical reform has delivered dramatic improvements in services productivity and access, international connectivity and manufacturing productivity. In the less dynamic – Indonesia, Thailand, Myanmar, and even Malaysia and the Philippines – initial regimes were less closed but the approach to reform has been more lethargic. The irony is that countries that built their manufacturing success on the back of openness to FDI have resisted similar opening in services, sacrificing productivity not just in services but also in manufacturing. A key conclusion of this paper is that further services reform is vital for continued growth, because it will affect productivity in services and in other sectors, including by influencing the evolution of comparative advantage and participation in global value chains.
In fact, the increased fragmentation of production across the region has been an important factor in trade and productivity growth. Developing East Asian countries have the highest share in the world of foreign value added in gross exports ‐ a measure of backward specialization in global value chains. Traditionally, most of the intermediate inputs used in production would come from advanced economies. But today the increasing backward participation in global value chains by countries like Vietnam is in part the result of China’s growing exports of sophisticated intermediate inputs. The rise of both global and regional value chains has been an important driver of productivity growth for developing East Asian countries. The reason is that GVCs lead to technology spillovers, learning externalities, better inputs and a more efficient international division of labor. On average, a 10 percent increase in the backward GVC participation of manufacturing sectors has increased labor productivity by 1.4 percent.
Differently from other areas in the world such as Europe and North America, much of the rise of trade, investment and global value chains in East Asia took place despite the presence of relatively shallow trade agreements. These agreements lowered tariffs but led to relatively weak commitments in areas such as services, investment and intellectual property rights. All countries are now members of the World Trade Organization (WTO). The most recent accessions include Cambodia (2004), Vietnam (2007) and Lao PDR (2013). ASEAN ‐ the Association of East Asia Nations ‐ which includes all East Asian developing countries except for Mongolia and China ‐ has progressively widened its scope and signed new agreements with third countries such as Australia, New Zealand, India and the Republic of Korea in the 2000s. But these agreements are

4
still relatively shallow and efforts are underway to negotiate deeper trade rules on investment, services, competition, intellectual property rights protection, and government procurement, as in the context of the Comprehensive and Progressive Trans‐Pacific Partnership (CPTPP). A second key conclusion of this paper is that sustaining future growth in trade, investment and GVC participation, and hence productivity growth, will require deeper integration through a more coherent set of trade rules within the region and with the rest of the world.
The rest of the paper is organized as follows. Section 2 establishes stylized facts on the trade landscape of East Asian developing countries. Section 3 focuses on four issues: the rise of China and its economic rebalancing; asymmetric trade opening and restrictions on services trade; the rise of global value chains; and the importance of deep trade agreements. Section 4 concludes.
2. THE EVOLUTION OF DEVELOPING EAST ASIA’S TRADE
East Asia’s developing countries account today for about 15 percent of the world trade ‐ up from 6 percent in 1995 ‐ and for 8 percent of the global FDI stock ‐ up from 5 percent in 1995. There are currently 10 developing countries in the East Asia region, namely China, Mongolia, and eight of the Association of Southeast Asian Nations (ASEAN) members: Cambodia, Indonesia, Lao PDR, Malaysia, Myanmar, the Philippines, Thailand and Vietnam. These countries collectively traded 6.3 trillion USD in 2015 and absorbed almost 2 trillion USD of the global FDI stock, due in great part to the contribution of China which accounts for 70 percent of the international trade in goods and services of the developing East Asian group and for 62 percent of its FDI stock. The group’s dynamism over time is noteworthy, especially when it comes to exports of goods and services, which have tripled as a share of world trade since 1995.1
Developing East Asia’s trade shows considerable heterogeneity at the country level. The trading patterns and specialization focus of the countries in the region show divergent paths, depending on their stage of development, pattern of comparative advantage, and approach to reform. The big changes have been the emergence of China and the rise in global and regional value chains. In this section, we document these developments.
1 Developing East Asia includes some of the most active participants in trade and investment in the world. As indicated in tables A.1 through A.4, more than half of the developing East Asian countries are today among or close to the first 50 largest traders and FDI recipients in the world. Some of these countries (China, Indonesia, Malaysia, Philippines, Thailand) ranked highly in previous decades as well, while others have caught up, sometimes at impressive rates. For example, Vietnam has become the 25th largest merchandise importer by 2015, climbing up from the 82th and the 61th positions in 1980 and 1990, respectively. Among the developing East Asian countries, China is particularly noteworthy for its scale and dynamism in trade and investment. Accounting for almost 14 percent of world goods exports and 10 percent of world goods imports in 2015, China has stood out as the world’s largest exporter since 2009 (up from the 12th place in 1990), and the world’s second largest importer after the United States since 2009 (up from the 15th place in 1990). China has also ranked second and fifth in services imports, respectively, since 2013. In addition, it has been a preferred destination for FDI for many years. As of 2015, it hosted 5 percent of the global FDI. Particularly remarkable is the recent surge in China’s direct investment abroad. In 2015, China totaled 4 percent of the global outward direct investment, up from negligible shares in 2005 and before. In fact, China’s outward direct investment flows surpassed the FDI inflows for the first time in 2015.

5
a. Uneven trade growth
The trade performance of developing East Asian countries has been more dynamic than that of the rest of the world. The trends in the overall trade flows of developing East Asian countries reveal several specific features (Figure 1).
First, the group’s trade growth has generally outperformed global trade growth for the past 3 decades (see Figure A.1 for years prior to 2005).2
Second, the trade slowdown affecting global trade volumes since 2012 has not spared developing East Asia.3 The group’s trade volumes have slowed from a yearly average growth rate of 13 percent during 1987‐2007 to 3.8 percent since 2012. The decline is smaller, yet still apparent when China is excluded from the aggregate, with the growth rate falling from 9.8 percent during 1987‐2007 to 4 percent after 2012.
Third, developing East Asia’s exports of goods and trade in services have grown at comparable rates in the past decade. This is in contrast with the global trends, which point to a resilience of services trade growth relative to goods trade growth during the Great Recession and the recent trade slowdown. The gap between the growth in developing East Asia’s goods imports and services imports is mostly due to the recent growth in China’s travel imports.
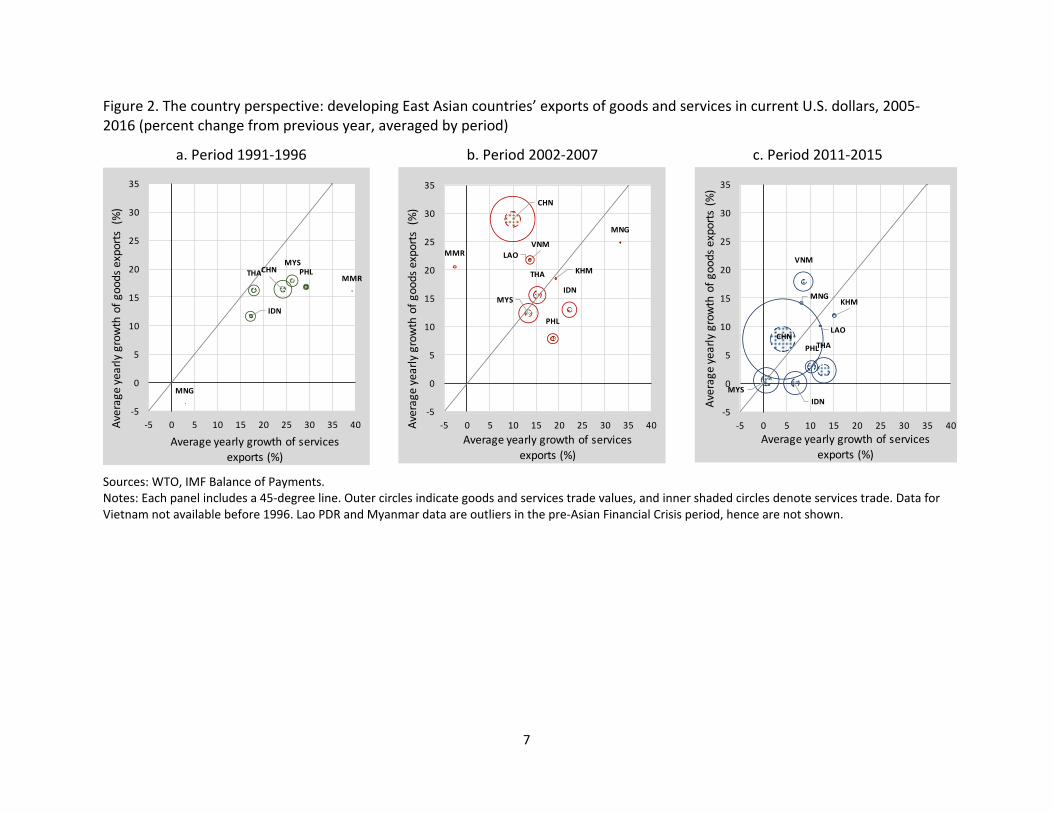
Three periods showing divergent paths can be identified in the growth experience of developing East Asian countries. An examination of the growth of goods and services export values by country and over time shows that developing East Asian countries followed different and often diverging routes for their exports, in part influenced by China’s emergence.
During the period that preceded the Asian Financial Crisis, goods exports were growing at comparable rates for most countries in the group (Figure 2a). Services exports were relatively more dynamic than goods exports, yet of significantly smaller magnitude (except in the cases of Thailand and the Philippines) and were mostly accounted for by travel exports (except for the Philippines, where other business services already had a significant contribution to services exports).
The 2000s brought a major split in the ranks (Figure 2b). China’s goods exports accelerated markedly, driven by rapid growth in manufacturing, and a switch in focus from apparel to electronic equipment. Vietnam followed in China’s footsteps, replicating its neighbor’s earlier emphasis on apparel. Cambodia, too, grew its exports based on apparel products. Thailand, Malaysia and Indonesia stayed broadly at the same levels of
2 Two notable exceptions are the period of the Asian Financial crisis and year 2015. In 2015, a combination of factors including sluggish external demand, the commodity price decline, and the macroeconomic rebalancing in China caused trade growth in East Asia to fall below the world aggregate (Constantinescu et al., 2016). 3 “The recent trade slowdown” refers to the post‐2012 sluggishness in the growth of global trade volume relative to the past rates and to real GDP growth. After bouncing back from the historic low of the Great Recession in 2010, world trade grew by 7.0 percent in 2011, slowed to 2.8 percent in 2012 and remained around 3 percent until 2016. This 3 percent is less than half the average yearly trade growth of 7 percent during period 1987‐2007. Moreover, it is in line with the GDP growth of the recent years, whereas before the crisis, and especially in the 1990s, trade was growing 2 and even 3 times faster than real GDP (Constantinescu et al., 2015).

6
growth, while the Philippines experienced a deceleration in the growth of its goods exports. Indonesia, Myanmar and Mongolia focused on commodity exports, reaping benefits from the rise of China’s imports. For most countries, goods exports growth increased relative to services exports growth. One notable exception is the Philippines, which continued its focus on other business services exports.
After the Great Recession, growth rates in export values throughout the region have been burdened by two situations (Figure 2c): the global trade slowdown and the decline in the commodity prices (particularly accelerated for fuels in 2014 and 2015). As a result, all points on the scatterplot appear closer to the origin. Yet many of the previous patterns remained and some accentuated: manufacturing exports grew faster in Vietnam and Cambodia, diverging significantly from the growth patterns of the old guard (Malaysia, Thailand, Indonesia). Export values of Indonesia, Myanmar and Mongolia were hit more severely by the commodity price shock. The Philippines continued to rely on services via other business services, while the services performance of Thailand, Cambodia, Myanmar and Lao PDR was tied to tourism.
Figure 1. The aggregate perspective: developing East Asian countries’ goods and services trade performance, 2005‐2016 (Index of trade in current US dollars: 2005=100)
a. EXPORTS b. IMPORTS
Source: World Trade Organization (WTO) and authors’ calculations. Notes: World trade is represented by the average of exports and imports. Labels indicate services shares in percent.
10.9
11.4
11.5
19.3
19.7
22.8
80
130
180
230
280
330
380
2005
2006
2007
2008
2009
2010
2011
2012
2013
2014
2015
2016
dev. EA goods exportsdev. EA services exportsworld goods tradeworld services trade
Index
13.5
13.4
20.3
19.3
19.7
22.8
80
13
18
23
28
33
38
2005
2006
2007
2008
2009
2010
2011
2012
2013
2014
2015
2016
dev. EA goods importsdev. EA services importsworld goods tradeworld services trade
Index
7
Figure 2. The country perspective: developing East Asian countries’ exports of goods and services in current U.S. dollars, 2005‐2016 (percent change from previous year, averaged by period)
a. Period 1991‐1996 b. Period 2002‐2007 c. Period 2011‐2015
Sources: WTO, IMF Balance of Payments. Notes: Each panel includes a 45‐degree line. Outer circles indicate goods and services trade values, and inner shaded circles denote services trade. Data for Vietnam not available before 1996. Lao PDR and Myanmar data are outliers in the pre‐Asian Financial Crisis period, hence are not shown.
CHN
IDN
KHM
LAO
MNG
MYS
PHLTHA
VNM
‐5
0
5
10
15
20
25
30
35
‐5 0 5 10 15 20 25 30 35 40
Average yearly growth of goo
ds exports (%)
Average yearly growth of services exports (%)
CHN
IDN
KHM
LAOMMR
MNG
MYS
PHL
THA
VNM
‐5
0
5
10
15
20
25
30
35
‐5 0 5 10 15 20 25 30 35 40Average
yea
rly growth of goo
ds exports (%)
Average yearly growth of services
exports (%)
CHN
IDN
MMR
MNG
MYSPHLTHA
‐5
0
5
10
15
20
25
30
35
‐5 0 5 10 15 20 25 30 35 40Average yearly growth of goo
ds expo
rts (%)
Average yearly growth of services exports (%)

8
b. Changing specialization
i. Goods trade
The specialization patterns within goods trade differ across countries (Figure 3). China, Malaysia, the Philippines, Thailand and Vietnam experienced increasing specialization in manufacturing – relative to the rest of the world ‐ over the previous decades. Mongolia and Myanmar continued to focus mostly on mining exports. For Indonesia, the share of manufacturing in total merchandise exports has increased from less than 10 percent in 1980 to more than 40 percent in 2015, yet mining products still dominate the country’s export basket. As indicated in Table A.5, manufacturing as a share of goods trade grew significantly during the 1980s and 1990s and then stayed broadly at the same level in countries like China, Indonesia, Malaysia, Philippines, and Thailand. In contrast, Vietnam experienced an increase of about 30 percentage points, between 2005 and 2015.
Figure 3. Share of manufacturing in goods exports (percent)
Sources: WTO Note: ISO3 country codes are indicated in labels. See Table 1 for country names.
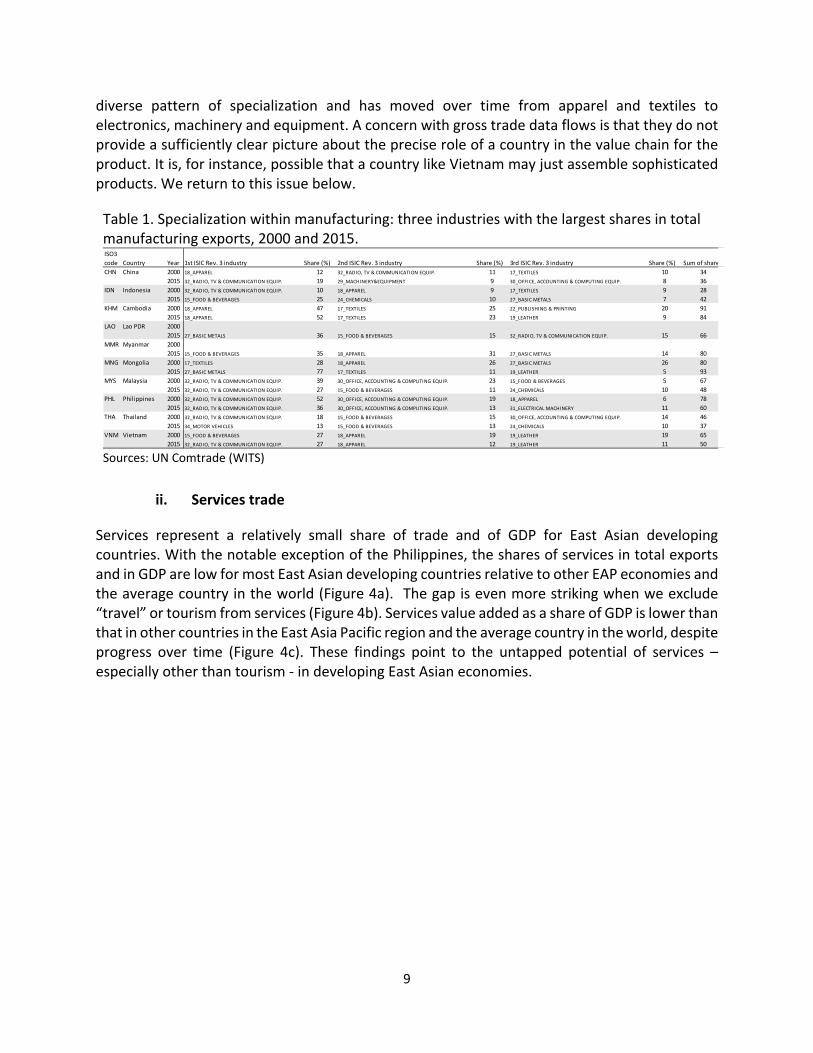
Within manufacturing, there is evidence of significant heterogeneity in exporting patterns across countries and over time (Table 1). Some countries have been and still are focused on light manufacturing (Cambodia) while others have started upgrading to more sophisticated manufacturing (Vietnam). Countries that began industrialization earlier are currently trading heavily in electronics and transport industries (Malaysia, Thailand, Philippines). China has a
IDN
MYS
PHL
THA
CHN
MMR
MNG
VNM
KHM
0
10
20
30
40
50
60
70
80
90
100
0 10 20 30 40 50 60 70 80 90 100
2015 or latest year with data
1980 or earliest year with data
9
diverse pattern of specialization and has moved over time from apparel and textiles to electronics, machinery and equipment. A concern with gross trade data flows is that they do not provide a sufficiently clear picture about the precise role of a country in the value chain for the product. It is, for instance, possible that a country like Vietnam may just assemble sophisticated products. We return to this issue below.
Table 1. Specialization within manufacturing: three industries with the largest shares in total manufacturing exports, 2000 and 2015.
Sources: UN Comtrade (WITS)
ii. Services trade
Services represent a relatively small share of trade and of GDP for East Asian developing countries. With the notable exception of the Philippines, the shares of services in total exports and in GDP are low for most East Asian developing countries relative to other EAP economies and the average country in the world (Figure 4a). The gap is even more striking when we exclude “travel” or tourism from services (Figure 4b). Services value added as a share of GDP is lower than that in other countries in the East Asia Pacific region and the average country in the world, despite progress over time (Figure 4c). These findings point to the untapped potential of services – especially other than tourism ‐ in developing East Asian economies.
ISO3
code Country Year 1st ISIC Rev. 3 industry Share (%) 2nd ISIC Rev. 3 industry Share (%) 3rd ISIC Rev. 3 industry Share (%) Sum of share
CHN China 2000 18_APPAREL 12 32_RADIO, TV & COMMUNICATION EQUIP. 11 17_TEXTILES 10 34
2015 32_RADIO, TV & COMMUNICATION EQUIP. 19 29_MACHINERY&EQUIPMENT 9 30_OFFICE, ACCOUNTING & COMPUTING EQUIP. 8 36
IDN Indonesia 2000 32_RADIO, TV & COMMUNICATION EQUIP. 10 18_APPAREL 9 17_TEXTILES 9 28
2015 15_FOOD & BEVERAGES 25 24_CHEMICALS 10 27_BASIC METALS 7 42
KHM Cambodia 2000 18_APPAREL 47 17_TEXTILES 25 22_PUBLISHING & PRINTING 20 91
2015 18_APPAREL 52 17_TEXTILES 23 19_LEATHER 9 84
LAO Lao PDR 2000
2015 27_BASIC METALS 36 15_FOOD & BEVERAGES 15 32_RADIO, TV & COMMUNICATION EQUIP. 15 66
MMR Myanmar 2000
2015 15_FOOD & BEVERAGES 35 18_APPAREL 31 27_BASIC METALS 14 80
MNG Mongolia 2000 17_TEXTILES 28 18_APPAREL 26 27_BASIC METALS 26 80
2015 27_BASIC METALS 77 17_TEXTILES 11 19_LEATHER 5 93
MYS Malaysia 2000 32_RADIO, TV & COMMUNICATION EQUIP. 39 30_OFFICE, ACCOUNTING & COMPUTING EQUIP. 23 15_FOOD & BEVERAGES 5 67
2015 32_RADIO, TV & COMMUNICATION EQUIP. 27 15_FOOD & BEVERAGES 11 24_CHEMICALS 10 48
PHL Philippines 2000 32_RADIO, TV & COMMUNICATION EQUIP. 52 30_OFFICE, ACCOUNTING & COMPUTING EQUIP. 19 18_APPAREL 6 78
2015 32_RADIO, TV & COMMUNICATION EQUIP. 36 30_OFFICE, ACCOUNTING & COMPUTING EQUIP. 13 31_ELECTRICAL MACHINERY 11 60
THA Thailand 2000 32_RADIO, TV & COMMUNICATION EQUIP. 18 15_FOOD & BEVERAGES 15 30_OFFICE, ACCOUNTING & COMPUTING EQUIP. 14 46
2015 34_MOTOR VEHICLES 13 15_FOOD & BEVERAGES 13 24_CHEMICALS 10 37
VNM Vietnam 2000 15_FOOD & BEVERAGES 27 18_APPAREL 19 19_LEATHER 19 65
2015 32_RADIO, TV & COMMUNICATION EQUIP. 27 18_APPAREL 12 19_LEATHER 11 50

10
Figure 4. The importances of services in developing East Asian countries’ trade and value added, according to the level of development a. Services exports
b. Non‐travel services exports
c. Services value added
Sources: WTO, World Bank World Development Indicators (WDI). Notes: GNI is in current US dollars calculated using the Atlas method. Vertical lines indicate thresholds for lower middle, upper middle and high income categories*. In panel b, countries with share of services in total exports greater than 40 percent are not shown: AFG, COM, CYP, DJI, GRC, LUX, KIR, CPV, CUB, MLT, IRL, LBN *https://datahelpdesk.worldbank.org/knowledgebase/articles/906519‐world‐bank‐country‐and‐lending‐groups.
CHNIDN
KHMLAO
MMR
MNG
MYSPHL THA
VNM
0
10
20
30
40
50
60
70
80
90
100
4 6 8 10 12
Share of services in total exports (percent)
Log of GNI per capita
2005
CHNIDN
KHM
LAOMMR
MNG MYS
PHL
THA
VNM
0
10
20
30
40
50
60
70
80
90
100
4 6 8 10 12
Share of services in total exports (percent)
Log of GNI per capita
2015
CHN
IDNKHMLAO
MMR
MNG
MYS
PHL
THA
VNM
0
5
10
15
20
25
30
35
40
4 6 8 10 12
Share of services (excl. travel) in total
exports (percent)
Log of GNI per capita
2005
CHNIDN
KHMLAO
MMRMNG MYS
PHL
THAVNM
0
5
10
15
20
25
30
35
40
4 6 8 10 12
Share of services (excl. travel) in total exports
(percent)
Log of GNI per capita
2015
CHNKHM
LAOMMR
MNG MYS
PHL THA
0
10
20
30
40
50
60
70
80
90
100
4 6 8 10 12
Share of services value ad
ded
in GDP
(percent)
Log of GNI per capita
2005
CHN
IDNKHMLAO
MMR
MNG MYS
PHLTHA
VNM
20
30
40
50
60
70
80
90
100
4 6 8 10 12
Share of services value ad
ded
in GDP
(percent)
Log of GNI per capita
2015
11
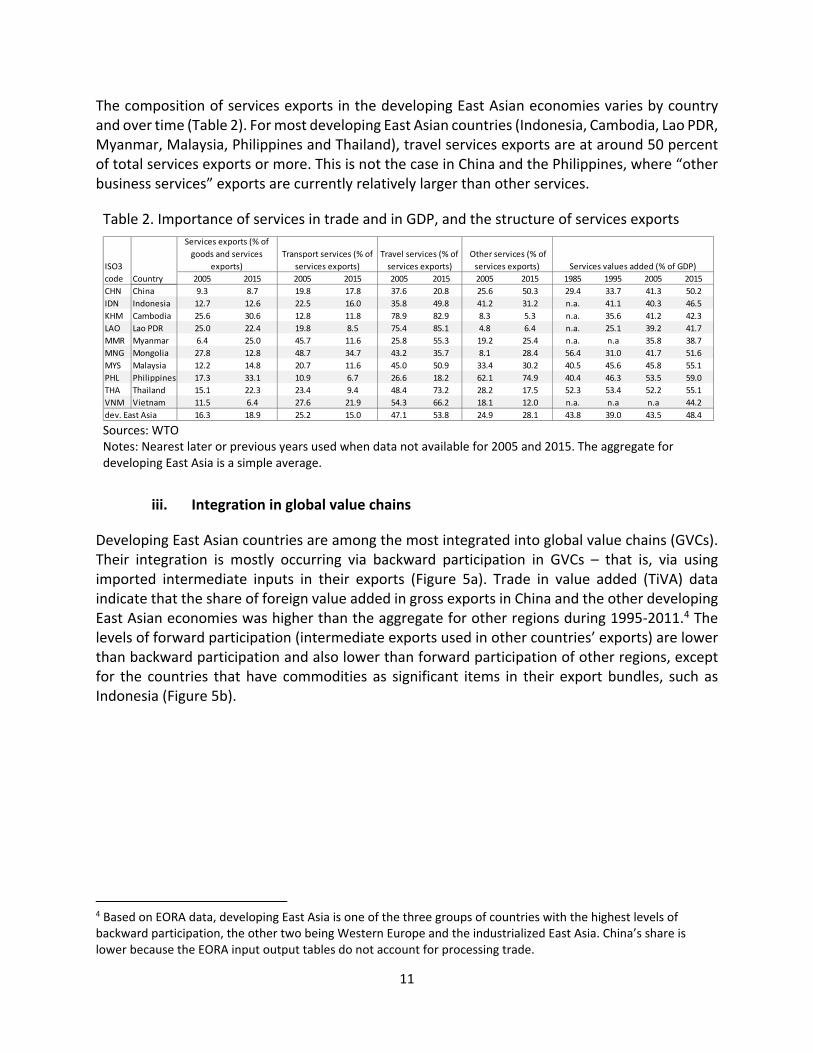
The composition of services exports in the developing East Asian economies varies by country and over time (Table 2). For most developing East Asian countries (Indonesia, Cambodia, Lao PDR, Myanmar, Malaysia, Philippines and Thailand), travel services exports are at around 50 percent of total services exports or more. This is not the case in China and the Philippines, where “other business services” exports are currently relatively larger than other services.
Table 2. Importance of services in trade and in GDP, and the structure of services exports
Sources: WTO Notes: Nearest later or previous years used when data not available for 2005 and 2015. The aggregate for developing East Asia is a simple average.
iii. Integration in global value chains
Developing East Asian countries are among the most integrated into global value chains (GVCs). Their integration is mostly occurring via backward participation in GVCs – that is, via using imported intermediate inputs in their exports (Figure 5a). Trade in value added (TiVA) data indicate that the share of foreign value added in gross exports in China and the other developing East Asian economies was higher than the aggregate for other regions during 1995‐2011.4 The levels of forward participation (intermediate exports used in other countries’ exports) are lower than backward participation and also lower than forward participation of other regions, except for the countries that have commodities as significant items in their export bundles, such as Indonesia (Figure 5b).
4 Based on EORA data, developing East Asia is one of the three groups of countries with the highest levels of backward participation, the other two being Western Europe and the industrialized East Asia. China’s share is lower because the EORA input output tables do not account for processing trade.
2005 2015 2005 2015 2005 2015 2005 2015 1985 1995 2005 2015
CHN China 9.3 8.7 19.8 17.8 37.6 20.8 25.6 50.3 29.4 33.7 41.3 50.2
IDN Indonesia 12.7 12.6 22.5 16.0 35.8 49.8 41.2 31.2 n.a. 41.1 40.3 46.5
KHM Cambodia 25.6 30.6 12.8 11.8 78.9 82.9 8.3 5.3 n.a. 35.6 41.2 42.3
LAO Lao PDR 25.0 22.4 19.8 8.5 75.4 85.1 4.8 6.4 n.a. 25.1 39.2 41.7
MMR Myanmar 6.4 25.0 45.7 11.6 25.8 55.3 19.2 25.4 n.a. n.a 35.8 38.7
MNG Mongolia 27.8 12.8 48.7 34.7 43.2 35.7 8.1 28.4 56.4 31.0 41.7 51.6
MYS Malaysia 12.2 14.8 20.7 11.6 45.0 50.9 33.4 30.2 40.5 45.6 45.8 55.1
PHL Philippines 17.3 33.1 10.9 6.7 26.6 18.2 62.1 74.9 40.4 46.3 53.5 59.0
THA Thailand 15.1 22.3 23.4 9.4 48.4 73.2 28.2 17.5 52.3 53.4 52.2 55.1
VNM Vietnam 11.5 6.4 27.6 21.9 54.3 66.2 18.1 12.0 n.a. n.a n.a 44.2
16.3 18.9 25.2 15.0 47.1 53.8 24.9 28.1 43.8 39.0 43.5 48.4
ISO3
code
dev. East Asia
Country
Travel services (% of
services exports)
Other services (% of
services exports) Services values added (% of GDP)
Services exports (% of
goods and services
exports)
Transport services (% of
services exports)

12
Figure 5. GVC participation of China and the other developing East Asia relative to the other regions of the world (percent of gross exports).
a. Backward participation in GVCs b. Forward participation in GVCs
Source: Authors’ calculations based on OECD Trade in Value Added (TiVA) Notes: Backward participation is measured as the share of foreign value added in the total gross exports of a country. Forward participation is a country’s domestic value added that is reexported by other countries, as a share of the country’s exports. *”Other East Asia” ‐ includes BRN, HKG, KOR, JPN, MAC, SGP, TWN; Other EAS ‐ East Asia and Pacific (all income levels) except East Asia; Other ECS ‐ Europe and Central Asia (all income levels) except Western Europe; LCN ‐ Latin America & the Caribbean (all income levels); MEA ‐ Middle East and North Africa (all income levels); SAS ‐ South Asia; SSF ‐ Sub‐Saharan Africa (all income levels).
There are important differences in GVC participation between developing East Asian countries (Figure 6). Within developing East Asia, the share of foreign value added in gross exports ranges from high for Malaysia to low for Indonesia (as well as Lao PDR and Myanmar, based on the EORA MRIO data). In terms of dynamism, interesting patterns emerge for three countries. Vietnam’s participation in GVCs has increased steadily overtime and especially in recent years, reflecting its deeper engagement into GVCs. In contrast, the Philippines saw a decline in the backward participation – possibly reflecting a retreat from GVCs, rather than an upgrade to more value added‐intensive activities. Finally, for China, the share of foreign value added in gross exports has been declining since the mid‐2000s, reflecting the substitution of imported inputs for domestically‐produced ones. At the same time, China has gradually increased its forward participation in global value chains with increasing exports of intermediate inputs.
5
10
15
20
25
30
35
40
1995
1996
1997
1998
1999
2000
2001
2002
2003
2004
2005
2006
2007
2008
2009
2010
2011
China World
Other East Asia* Developing East Asia (excl. China)
Other ECS LCN (excl. Mex)
MEA North America (incl. Mex.)
Other EAS SAS
SSF Western Europe
5
10
15
20
25
30
35
40
1995
1996
1997
1998
1999
2000
2001
2002
2003
2004
2005
2006
2007
2008
2009
2010
2011
China World
Other East Asia Developing East Asia (excl. China)
Other ECS LCN (excl. Mex)
MEA North America (incl. Mex.)
Other EAS SAS
SSF Western Europe

13
Figure 6. GVC participation of developing East Asian countries (percent of gross exports)
a. Backward participation in GVCs b. Forward participation in GVCs
Source: Authors’ calculations based on OECD TiVA Notes: Backward participation is measured as the share of foreign value added in the total gross exports of a country. Forward participation is a country’s domestic value added that is reexported by other countries, as a share of the country’s exports.
There is also important sectoral variation in GVC participation within East Asia. Figure 7 provides further illustration of the heterogeneous ways in which developing East Asian countries participate in GVCs. Indonesia is notable for its forward participation via commodities, Philippines for its forward participation via services, while Malaysia, Vietnam, Cambodia and Thailand for the backward participation via manufacturing. A comparison between 1995 and 2011 highlights the ascension of Vietnam and the decline of the Philippines as relates to the foreign value‐added content in gross manufacturing exports, and the increase in forward participation of Indonesia’s commodity sectors and of the Philippines’ services sector. The increase in the reexports of the Philippines’ domestic value added from manufacturing is driven by the electric equipment sector.
5
10
15
20
25
30
35
40
45
50
1995
1996
1997
1998
1999
2000
2001
2002
2003
2004
2005
2006
2007
2008
2009
2010
2011
CHN IDN KHM MYS
PHL THA VNM
0
5
10
15
20
25
30
35
1995
1996
1997
1998
1999
2000
2001
2002
2003
2004
2005
2006
2007
2008
2009
2010
2011
CHN IDN KHM MYS
PHL THA VNM

14
Figure 7. GVC participation in developing East Asia, by country and sector (percent of gross exports)
Source: Authors’ calculations based on OECD TiVA Notes: Backward participation is measured as the share of foreign value added (from commodities, manufacturing and services) in the total gross exports of a country. Forward participation is a country’s domestic value added (from commodities, manufacturing and services) that is reexported by other countries, as a share of the country’s exports.
0
5
10
15
20
25
commodities manufacturing services commodities manufacturing services
a. 1995
CHN IDN KHM MYS PHL THA VNM World
backward participation forward participation
0
5
10
15
20
25
commodities manufacturing services commodities manufacturing services
b. 2011
CHN IDN KHM MYS PHL THA VNM World
backward participation forward participation

15
c. Shifting partners
Close to 50 percent of developing East Asian countries’ trade is with countries outside the region (Figure 8). Several composition‐related trends are noteworthy. First, intra‐developing East Asian trade increased from around 5 percent in the early 1990s to 18 percent by 2016. Second, the share of other East Asian countries has gradually declined, notably since the late 2000s.5 Third, while trade with other advanced economies remained roughly stable, trade with other developing countries outside the region increased, particularly in the late 2000s.
Figure 8. Developing East Asia: bilateral trade (billion US dollars)
Source: IMF Direction of Trade Statistics (DOTS). Notes: trade is exports of goods plus imports of goods. *”Other East Asia” ‐ includes BRN, HKG, KOR, JPN, MAC, SGP, TWN; Other EAS ‐ East Asia and Pacific (all income levels) except East Asia; Other ECS ‐ Europe and Central Asia (all income levels) except Western Europe; LCN ‐ Latin America & the Caribbean (all income levels); MEA ‐ Middle East and North Africa (all income levels); SAS ‐ South Asia; SSF ‐ Sub‐Saharan Africa (all income levels).
The center of gravity for developing East Asian countries has shifted toward China. Figure 9 presents the regional trading patterns for the 10 developing East Asian countries in 1995 and 2015. The most striking development is the increase in exposure to China, both as an origin for goods imports and as a destination for goods exports. Other developing East Asian countries have also gained in importance as trading partners. Yet the opposite seems to be true of the other East Asia group. Even though the absolute traded values have generally expanded over time (there are exceptions, for example during crisis years), the goods trade of developing East Asian
5 Other East Asia includes Brunei; Hong Kong SAR, China; Korea; Japan; Macao SAR, China; Singapore; and Taiwan, China.
0
1
2
3
4
5
6
1980
1981
1982
1983
1984
1985
1986
1987
1988
1989
1990
1991
1992
1993
1994
1995
1996
1997
1998
1999
2000
2001
2002
2003
2004
2005
2006
2007
2008
2009
2010
2011
2012
2013
2014
2015
2016
developing East Asia other East Asia*
Other EAS USA
Western Europe other ECS
LCN MEA
Canada and Mexico SAS
SSF

16
countries has been gradually shifting towards China (see trade values and more information on shares in Tables A.6 and A.7). In 2015, Mongolia and Lao PDR were the most exposed developing East Asian countries to intra‐regional trade. Mongolia sent 80 percent of its goods exports to China, while Lao PDR traded almost exclusively with developing East Asian countries, although within this group, it traded relatively less with China. Malaysia, Indonesia and Thailand were the least exposed to China, as they traded relatively more with other East Asia. Vietnam and Cambodia’s trading patterns suggest engagement in GVCs via triangular trade: importing from China and other developing East Asian countries and exporting overseas to the US and Western Europe.6
Figure 9. Bilateral trade in goods of developing East Asian countries, selected partners
a. Bilateral trade with China Exports to China (% of gross exports) Imports from China (% of gross imports)
6 Similar patterns emerge when examining bilateral trade in value added instead of bilateral gross trade.
AFG
AGO
AUS
CHL
COD
COG
GNQ
HKG
IRN
IRQ
KAZ
KOR
MAC
MLI
MRT
OMN
PER
SLB
TKM
URY
YEM
IDNKHM
LAO
MMR
MNG
MYS
PHL THA
VNM
0
10
20
30
40
50
60
70
80
90
0 10 20 30 40
2015
1995
AFG
ARE
AUSBGD
CHL COD
ETH GHA
GMB
HKG
IRQ JPN
KEN
KGZ
KOR
MAC
MRT
NERNGA
NPL
PAK
PER
SLB TGO
USAUZB
IDN
KHM
LAO
MMR
MNG
MYSPHL
THA
VNM
0
5
10
15
20
25
30
35
40
45
50
0 10 20 30 40
2015
1995

17
b. Bilateral trade with other developing East Asian countries (excl. China) Exports to dev. East Asia (% of gross exports) Imports from dev. East Asia (% of gross imports)
c. Bilateral trade with other East Asian countries Exports to other East Asia (% of gross exports) Imports from other East Asia (% of gross imports)
AUS
BEN
BFA
BRN
GNB
JPNKOR
MDV
MLI
OMN
SGP
TGO
ZMB
CHN
IDN
KHM
LAO
MMR
MNG
MYS
PHL
THA
VNM
0
10
20
30
40
50
60
0 10 20 30 40 50 60
2015
1995
AUS
BEN
BRN
DJI
GNB
IRQ
JPNLKA
MDV
NPL
NZLPAK
PNG
SGP
SLB
VUT
CHN
IDN
KHM
LAO
MMR
MNG
MYS
PHL
THA
VNM
0
10
20
30
40
50
60
70
80
0 10 20 30 40 50 602015
1995
ARE
AUS
BRN
CHL
COG
GNQ
IRN
JPN
KOR
KWT
MAC
MLT
MRT
NER
NZL
OMN
PNG QAT
SAU
SDNSGP
SLB
TON
USA
VUTYEMZMB
CHNIDN
KHM
LAO
MMR
MNG
MYS
PHL
THAVNM
0
10
20
30
40
50
60
70
80
0 20 40 60 80 100
2015
1995
AFGARE
AUS
BGD
BRN
CAFDJI
FJIGUY
HKG
KOR
LBR
LKAMAC
MDV
NPL
NZL
OMN
PNG
PRY
SDN
SGP
SLB
SYC
USA
VUT
WSM
CHN
IDN
KHM
LAO
MMR
MNG
MYS
PHL
THA
VNM
0
10
20
30
40
50
60
0 20 40 60 80
2015
1995

18
d. Bilateral trade with the U.S. and Western Europe Exports to the U.S. and Western Europe
(% of gross exports) Imports from the U.S. and Western Europe
(% of gross imports)
Source: IMF DOTS and authors’ calculations. Notes: 45‐degree line shown as dotted line. Labels indicate developing East Asian countries and other selected countries.
Much of the rise of China as a trade partner of developing East Asian countries has to do with its larger role in GVCs. Figure 10 depicts the Chinese foreign value added embodied in the other countries’ gross exports of goods and services, as well as the domestic value added produced in various countries that is re‐exported by China.7 Developing East Asian countries collaborate more closely with China on these two aspects of GVC participation relative to most other countries in the world, but different countries have different roles. Vietnam and Cambodia have a high content of Chinese value added in gross exports (Vietnam in its exports of electrical and optical equipment and Cambodia in its exports of garments), an indication of downstream positioning relative to China in a triangular trade to destinations overseas. Malaysia, Philippines and Thailand, which are not highly dependent on China in the bilateral gross trade charts, have more than 40 percent of their forward participation in the electrical equipment industry accounted for by China’s re‐exports. This suggests that the three countries are heavily integrated in global value chains, upstream of China, as its suppliers of parts and components.
7 Note that country availability is restricted to the coverage in the OECD TiVA Database. For example, Mongolia, a country with high gross trade exposure to China, is not included.
CHN
IDN
KHM
LAOMMR
MNG
MYS
PHLTHA
VNM
0
10
20
30
40
50
60
70
80
90
100
0 20 40 60 80 100
2015
1995
CHN
IDN
K…LAO
MMR
MNG
MYS
PHLTHA
VNM
0
10
20
30
40
50
60
70
80
90
0 20 40 60 80
2015
1995

19
Figure 10a: China’s role in developing East Asia’s participation in GVCs China’s share in the total FVA embodied in a
country’s gross exports (percent) A country’s share in DVA embodied in China’s gross
exports (percent)
Source: OECD TiVA and authors’ calculations. Notes: 45‐degree line shown as dotted line. FVA stands for “foreign value added”; DVA stands for: “domestic value added.” Labels indicate developing East Asian countries and other selected countries. Note: Trade refers to both goods and services.
Figure 10b: China’s role in developing East Asia’s participation in GVCs: focus on the electrical and optical equipment industry China’s share in the total FVA embodied in a country’s gross exports of electrical and optical equip. (percent)
A country’s share in DVA from electrical equip. sector embodied in China’s gross exports (percent)
Source: OECD TiVA and authors’ calculations. Notes: 45‐degree line shown as dotted line. FVA stands for “foreign value added”; DVA stands for: “domestic value added.” Labels indicate developing East Asian countries and other selected countries.
AUS
BRA
BRNCOL
CZE
HKG
IND
JPN
KOR
MEX
PER
RUS
SGP
TWNUSA
IDN
KHM
MYS
PHL
THA
VNM
0
5
10
15
20
25
30
35
0 5 10 15 20
2011
1995
ARG
AUS
BRA
CANCHE
CHL
CRI
DEU
HKG
INDISR
JPN
KOR
NZL
PER
RUS
SAU
SGP
TWN
USA
ZAFIDN
KHM
MYS
PHL
THA
VNM
0
5
10
15
20
25
30
35
40
45
50
0 5 10 15 20 25 30
2011
1995
ARG
AUS
BRA
CAN
CHL
COLCZE
GBR
HKG
HUN
IND
JPN
KOR
MEX
NZL
PER
POLRUS
SGPTUR
TWN
USA
ZAF
IDN
KHM
MYS
PHL
THA
VNM
0
5
10
15
20
25
30
0 2 4 6 8 10 12 14
2011
1995
AUSCANCHE
CHL
CRI
DEU
ESP
FINFRA
GBRHKG
IND
IRL
ISR
JPN
KOR
LUX
MLT
NOR
NZL
ROU
ROW
RUS
SGP
SWE
TWN
USA
IDN
KHM
MYS
PHL
THA
VNM
0
10
20
30
40
50
60
0 5 10 15 20 25 30
2011
1995

20
As a source of final demand, the role of China in the region is still limited. Gross trade statistics show that developing Asian economies vary in their exposure to China, and that the exposure has been growing over time. Yet these indicators do not clarify whether a country is potentially exposed to shocks to Chinese domestic demand or to shocks to demand of other countries that are positioned downstream from China in an international supply chain. Examining the decomposed bilateral exports to China suggests that, among the developing East Asian countries for which we have the required data, the Philippines and Indonesia are relatively more exposed to Chinese demand. This exposure could reflect the fact that these two countries, with exports respectively dominated by services and natural resources, are different from the other East Asian countries which are linked to China through manufacturing value chains that ultimately serve third countries. In general, the exposure of East Asian economies to demand shocks in China is, however, not much higher than that of other economies (Figure 11).
Figure 11. Share of China in gross exports of goods and services, by type of value added, 2011
Source: OECD TiVA, Wang et al. (2013) and authors’ calculations. Note: Countries are sorted by the total domestic value added absorbed in China as a share of multilateral gross exports.
0
5
10
15
20
25
30
35
40
45
HKG
AUS
TWN
JPN
CHL
BRA
PHL*
KOR
ZAF
IDN*
SAU
MYS*
NZL
THA*
VNM*
RUS
ARG
SGP
IND
CRI
USA
DEU
COL
BRN
ISR
CHE
KHM*
CAN
Other
Foreign value added in gross exports to China
Domestic value added not absorbed in China
Domestic value added in intermediates absorbed in China
Domestic value added in final goods and services absorbed in China
% of multilateral gross exports

21
3. THE IMPLICATIONS OF AND THE POLICY RESPONSE TO THE CHANGING TRADE PATTERN
This section addresses four questions associated with the changing trade trends outlined in Section 2. The first pair of questions relates to China’s emergence and the appropriate national policy response. What are the trade effects of the growth of China on other developing East Asian countries? And how has the asymmetric opening of goods and services trade affected the productivity and comparative advantage of developing East Asian economies? The second pair relates to the emergence of GVCs and the appropriate response in terms of international cooperation. How does the increasing fragmentation of production across borders affect developing East Asian countries’ productivity? And how far are the international agreements negotiated by developing East Asia fostering the growth of GVCs and deeper international integration? We will investigate these issues in turn.
a. The heterogeneous impact of China
The inclusion of China in the global trade system has had a significant impact on developing East Asian countries. This section provides an assessment of the effect on trade flows. As discussed in Section 2, the rise of China as a major player in world trade has changed the nature of intra‐regional and extra‐regional trade for developing East Asian countries. China’s share of world exports increased between 1995 and 2015 from about 2 percent to 11 percent. In light of this change, a number of studies (most notably, Autor et al., 2013) have investigated the impact of the China (supply) shock on other countries. At the same time, China grew as an importer, notably of agricultural and mining products where its share of world imports increased from 2 percent in 1995 to 10 percent in 2015. This China (demand) shock also affected its trade partners, altering their trade patterns. China’s supply and demand shocks have contrasting effects on East Asian developing countries that ultimately depend on their production and trade structures and the similarity of their export destinations with China. An empirical investigation is required to quantify these various channels.
Econometric analysis points to a heterogeneous impact of China‐related trade shocks on exports of developing East Asian countries. Bastos (2018) examines empirically the effect of supply and demand shocks associated with China’s trade dynamics on multilateral exports of the Belt and Road Initiative (BRI) countries – a group that includes, but is not limited to developing East Asian countries ‐ and finds a significant overall effect and heterogeneous impacts by country and period, for both types of trade shocks.8,9 Table 1 presents the estimated coefficients obtained in
8 Intuitively, China‐related supply or competition shocks are associated with China’s rising global exports, and may pose a competition challenge especially for countries with an initial export structure that is similar to China’s. In contrast, China‐related demand shocks are associated with China’s rising imports, and may represent an opportunity for countries with initial export profiles matching China’s import structure. 9 The methodological approach in Bastos (2018) is built on insights by Autor et al. (2013). The estimation equation relates multilateral exports by country, sector and period to the China‐related supply and demand shocks, where the supply shock is computed as the product of the change in log of multilateral exports of China in a sector and period and the export similarity index between China and the exporting country and the same sector in 1995, while the demand shock is computed by the product of the change in log of multilateral imports of China in a sector and period and the similarity index between China’s imports and the country’s exports in the same sector in

22
Bastos (2018) for the average BRI country and for each developing East Asian country separately. The results suggest that China‐related supply shocks may have intensified in the last decade compared to the previous. Indeed, while competition pressures from China appear to have been innocuous for the multilateral exports of the developing East Asian countries during the period 1995‐2015, they have had a negative and significant impact for the exports of Indonesia, Malaysia, the Philippines, Thailand and Vietnam during period 2005‐2015. Demand shocks associated with the rise in China’s imports are found to have significantly boosted multilateral exports of Cambodia, Indonesia and Thailand, during 1995‐2015, and of Indonesia and Mongolia, during 2005‐2015.
The positive effects associated with the rise in Chinese imports may have offset China’s competition pressure on developing East Asian countries in external markets, but not consistently throughout the last two decades. The finding in Bastos (2018), that China‐driven supply shocks may have intensified in the last decade, holds for the entire group of BRI countries, as suggested by the changing magnitude of the estimate for the average BRI country (Table 3, last row). The implication is that up until 2005, China’s competition pressure in external markets, for countries in East Asia specifically, and for BRI countries in general, was offset by the positive effects associated with the increasing Chinese imports. This insight corroborates the findings in World Bank (2007) about the effect of the rise of China on the exports of East Asian countries during period 1985‐2004.10
1995. Regressions control for period effects (given that up to four 5‐year periods from the interval 1995‐2015 are being used) and panel fixed effects (either country‐industry level, for the regressions including all countries, or industry‐level, for the country‐specific regressions). Potential endogeneity concerns are addressed by employing 2SLS estimation, whereby the change in China’s multilateral exports is instrumented using changes in sectoral Chinese exports and imports to the top 10 destinations and sources. 10 Using a different methodology, the chapter on trade in World Bank (2007) finds that export growth to non‐China markets in industrial products was affected negatively by Chinese exports in the same products during period 1984‐2004 and more so during 2000‐2004. In addition, it finds that the negative effect was offset by the positive impact of China‐related demand shocks (with countries more seriously affected by the supply shocks also being the ones gaining from increased exports to China, notably Korea, Singapore, and Taiwan, China). The chapter further indicates that China appears to have been pushing other exporters up the value chain in parts and components, so that everyone ended up benefitting via specialization in specific tasks, and engagement in GVC and triangular trade.

23
Table 3. Impact of China shocks on exports of selected BRI countries.
Source: Bastos (2018). Notes: Robust standard errors clustered by country‐industry, *** p<0.01, ** p<0.05, * p<0.1. Reported coefficients are obtained using the 2SLS estimation method.
The China effect on trade depends on the complementarity of the trade structure of developing East Asian countries with China and the similarity of their export destinations with China. Bastos (2018) also offers an intuitive approach – validated by the previous econometric results ‐ on how to identify countries that are more likely to be impacted by China’s rise. First, countries that share a similarity of exports with China in both the exported products and the destination markets are likely to face competition pressure from China in the markets abroad (Figure 12a). Indeed, for Vietnam, Thailand, Malaysia and the Philippines, which have the highest similarity index among the BRI countries in 2015, the econometric analysis yields negative and significant supply shock coefficients in the regressions covering the period 2005‐2015. Second, countries whose exports are similar to China’s imports and who also have a large share of their exports going to China are likely to benefit from an increase in Chinese imports (Figure 12b). For Instance, Mongolia, a country in this category, is found to have a positive and significant demand shock effect during the period 2005‐2015. Third, countries that share a similarity of production structure (proxied by exports) with China and also have a large share of imports sourced from China are likely to be affected negatively in their domestic markets by Chinese competition (Figure 12c).
Country 1995-2015 2005-2015 1995-2015 2005-2015Cambodia 35.46 43.36 161.33*** 79.6
(31.89) (46.32) (27.40) (189.09)
Indonesia -12.87 -31.78* 39.76*** 36.97***
(9.82) (17.98) (15.02) (13.73)
Lao -63.83 -55.18 -189.1 59.5
(43.05) (44.35) (641.80) (363.26)
Malaysia 7.21 -83.48** 19.03 29.57*
(12.01) (40.64) (16.24) (16.19)
Myanmar -30.59 -35.05 21.16 -12.52
(49.83) (102.48) (15.78) (97.22)
Philippines -13.07 -70.54*** 40.7 61.96
(14.32) (24.35) (30.56) (38.34)
Thailand -1.34 -40.84** 32.35*** 6.79
(10.38) (17.74) (9.34) (23.90)
Vietnam -1.58 -36.92*** 38.18 4.23
(15.27) (11.04) (45.67) (13.05)
Mongolia 94.95 -129.03 126.42 512.76***
(66.45) (190.87) (104.73) (130.44)
Average BRI country -21.75*** -52.82*** 42.52*** 44.95***
(3.88) (8.31) (7.27) (16.94)
Supply shock Demand shock

24
Figure 12. Identifying opportunities and vulnerabilities associated with competition from China
a. Exposure to competition from China in third export markets: export similarity with China in products and markets, 2015
b. Exposure to demand shocks from China, 2015
c. Exposure to import competition from China in the domestic market, 2015
Source: Bastos (2018) Note: 45‐degree line shown as dotted line.
Further integration with China will affect developing East Asian countries differently and the extent of this impact will depend on the ongoing rebalancing of the Chinese economy.11 In recent years, China has been engaged in a number of regional processes, the Belt and Road Initiative (BRI) and the Regional Comprehensive Economic Partnership (RCEP), which are likely to further reduce trade costs within East Asia because of improved transport infrastructure and reduced
11 See Lardy (2012), Pettis (2014) and Constantinescu, Mattoo and Ruta (2016) for an analysis of the implications of China’s rebalancing.
0
0.05
0.1
0.15
0.2
0.25
0.3
VNM
THA
MYS
PHL
IND
SGP
HKG
IDN
CZE
POL
TUR
ISR
HUN
ROU
KHM
SVK
BGR
EST
SVN
LKA
LTU
PAK
BGD
LVA
GRC
HRV
EGY
SRB
ARE
BIH
MMR
UKR
NPL
RUS
MDA
JOR
BHR
ALB
MKD
LBN
BLR
GEO
LAO
SAU
OMN
ARM
QAT
KWT
MNE
KAZ
BRN
KGZ
IRN
SYR
MDV
MNG
AFG
UZB
YEM AZE
PSE
TJK
TLS
TKM BTN
IRQ
AFGALB
ARE
ARM
AZE
BHR
BGD
BLR
BTN
BIH
BRN
BGR
HRV
CZEEGY
ESTGEO
GRC
HKG
HUN
IND
IRN
IRQ
ISR
JOR
KAZ
KWT
KGZ
LVA
LBN
LTUMKD
MDVMDAMNE
NPL
OMN
PAK
PSE
POLQAT
ROU
RUS
SAU
SRB
SGP
SVKSVN
LKA
SYR
TJK
TLS
TURTKMUKR
UZB
YEM
KHM IDN
LAOMYS
MNG
MMR
PHLTHA
VNM
0
0.1
0.2
0.3
0.4
0.5
0.6
0 0.1 0.2 0.3 0.4 0.5
Share of im
ports sourced
from China
Similarity between country's exports and China's exports
AFGALB
ARE
ARM
AZEBHRBGD BLR
BTN BIHBRNBGR
HRV CZEEGYEST
GEO
GRC
HKG
HUNIND
IRN
IRQ
ISRJOR
KAZKWT
KGZ
LVALBN LTUMKD
MDV MDAMNENPL
OMN
PAK
PSE POL
QAT
ROU
RUS
SAU
SRB
SGP
SVKSVN
LKASYR
TJK
TLSTUR
TKM
UKR
UZB
YEM
KHMIDN
LAO
MYS
MNG
MMR
PHL
THA
VNM
0
0.1
0.2
0.3
0.4
0.5
0.6
0.7
0.8
0 0.1 0.2 0.3 0.4
Share of exports to China
similarity between country's exports and China's imports
25
trade policy barriers. Based on this analysis, the impact of further integration with China will have asymmetric effects on developing East Asian countries.
Vietnam, Malaysia, the Philippines, Thailand and Indonesia source a large share of imports from China and have similar export structure and export destinations. For these countries, further integration with China will increase the competitive pressures in final goods markets. But firms involved in value chains with China will benefit from the access to cheaper inputs.
Myanmar and Mongolia source a sizable share of imports from China and have an export structure that differs from China. For these economies, further integration with China will have small effects on domestic competition, while these economies will benefit from further specialization according to their comparative advantage. The risk will be that they will be even more exposed to domestic economic and policy shocks in China.
At the same time, the gradual rebalancing of the Chinese economy, away from investment and industrial production and towards consumption and services, will imply that further integration in East Asia in the next decade may look quite different from the past decade. For instance, as Chinese competitiveness declines due to higher labor costs, countries like Vietnam, Cambodia and Indonesia will gain market shares in third markets. As Chinese demand for services increases, services export opportunities for countries like Malaysia (utilities and finance), the Philippines (business services) and Thailand (tourism and health) will surge. Resource exporters like Myanmar and Mongolia will still supply large shares of their exports to China and other industrializing countries, but probably not at the rising growth rates of past years.
b. Asymmetric market opening in services and goods
One striking aspect of East Asian reform is the contrasting attitude to the liberalization of goods and services trade which has meant foregone benefits. A region that has grown dramatically through manufacturing exports stimulated by foreign direct investment has shown a relative reluctance to be as open to foreign trade and investment in services. This reluctance is a puzzle because growth theories have for long emphasized that trade in intermediate goods and services generally improves the allocation of capital and labor across sectors and countries (Jones 2011).
There is also growing evidence that services reform, of which trade liberalization is one important component, can contribute significantly to inclusive growth. Services shape both overall economic performance and help people to engage productively in the modern economy. An efficient and well‐regulated financial sector leads to the efficient transformation of savings to investment, ensuring that resources are deployed wherever they have the highest returns, and facilitates better risk‐sharing in the economy. At the same time, improved access to finance improves household welfare and income growth, by allowing consumption smoothing and investment in assets that enhance longer‐term productivity. Improved efficiency in telecommunications allows the dissemination and diffusion of knowledge and connects firms and individuals to economic opportunity—witness the spread of the internet and the dynamism that that has lent to economies around the world. Similarly, transport services help goods to move where they are most wanted and people to where they are most productive. Business services

26
such as accounting and legal services are important in reducing transaction costs both for firms and individuals. Education and health services enhance the quality of lives and human capital, allowing people to engage productively in the modern economy.
In this section, we focus first on how services trade has an impact on two key aspects of economic performance: the growth of productivity and the evolution of comparative advantage. Improved access to finance, communications, transport, and other services, either through general reform or reform of trade and FDI policies, enhances firms’ productivity and other aspects of the performance of firms. The development of domestic services sectors and access to foreign services can also shift the pattern of comparative advantage. However, these benefits do not automatically follow from services liberalization, and a successful reform program will also need strengthened regulation and mechanisms to improve access to services, which is briefly discussed in the third part of this section.12
i. Asymmetric trade policy liberalization
Figure 13 depicts the asymmetric trade‐opening in goods and services in East Asia. On the horizontal axis is a measure of tariff protection, while on the vertical axis is a measure of services protection —as measured by the Services Trade Restrictions Index, which takes values from 0 for completely open regimes to 100 for completely closed. Apart from Cambodia and Mongolia, all the countries in the study inhabit the top left quadrant, signifying that their levels of tariff protection are lower than the global median while their levels of services protection are higher than the global median.
Even though many of the larger East Asian countries are now similarly situated, the pace of reform has been strikingly different over the last two decades. Even though their regimes are still not very open, in China, Vietnam and Cambodia, WTO accession induced a move away from state‐owned monopolies to more competitive private provision of telecommunications, financial, transport and a range of other services. In Indonesia, Thailand, Malaysia and the Philippines regimes at the turn of the century were less closed but the approach to reform has been more gradual and not always towards greater openness.
The World Bank Services Trade Restrictions Database reveals interesting policy patterns in East Asia. Although public monopolies are now rare, and few services markets are completely closed, numerous second‐generation restrictions remain on entry, ownership, and operations. Even where there is little explicit discrimination against foreign providers, market access is often unpredictable because the allocation of new licenses remains opaque and highly discretionary in many countries. Regulatory discretion is accentuated by a lack of accountability in a number of countries where regulators are not required to provide reasons for rejecting a license application or where foreign providers do not have the right to appeal regulatory decisions.
12Added urgency is lent to services reform by the deepening interlinkages between manufacturing and services sectors, manifested as the so‐called “servicification” of manufacturing, whereby services are increasingly embodied in manufactured goods. See Hallward‐Driemeier and Nayyar (2018) for a discussion of the trends and the implications of this phenomenon.

27
Figure 13. Protectionism in goods trade versus services trade
Sources: UNCTAD TRAINS (via WITS), World Bank Services Trade Restrictiveness database (Borchert et al. 2012) and authors’ calculations.
Bank sector policies in Thailand, Philippines, Malaysia, and Vietnam restrict greenfield entry and operations. In Thailand, the limit on foreign ownership in a “local bank” was 49 percent, and there was a limit on operations: the number of branches and ATMs allowed per subsidiary was 20. In the Philippines, greenfield entry was not possible since the license limit of 10 had been reached, and for acquisition, the foreign ownership limit was 60 percent. In Malaysia, with the enactment of the Financial Services Act 2013 and the Islamic Financial Services Act 2013 in June 2013, there was a comprehensive modernization and streamlining of Malaysia’s regime on licensing and foreign equity limits in the banking and insurance sector (conventional and Islamic). In both conventional and Islamic finance, application for a license is now based on the prudential and “best interest of Malaysia” criteria. Similarly, the acquisition of a significant foreign equity interest in Malaysian banks and insurance companies could be up to 100 percent, subject to meeting the aforementioned criteria. In the context of the TPP negotiations, Malaysia promised to phase‐in further liberalization in the financial sector. Vietnam allowed wholly foreign‐owned subsidiaries but imposed a limit on the acquisition of banks. To acquire existing banks, the foreign ownership limit was 30 percent for aggregate foreign investment and 20 percent for a single foreign credit institution.
Most developing East Asian countries limited foreign investment in fixed and mobile telecommunications services. The limit on foreign ownership was 49 percent in Indonesia and Malaysia, and 40 percent in the Philippines. But Malaysia is progressively removing foreign
ALBARG
ARM
AUSAUT
BDIBEL
BGD
BGR
BHR
BLR
BOL
BRA
BWA
CAN CHL
CIV CMR
COL
CRI
CZEDEU
DNK
DOM
DZA
ECU
EGY
ESP
FIN
FRA
GBR
GEO
GHA
GRC
GTM
HND
HUN
IND
IRL
IRN
ITA
JOR
JPN
KAZ
KEN
KGZ
KOR
KWT
LBN
LKA
LSO
LTU
MAR
MDG
MEXMLI
MOZMUS
MWI
NAM
NGA
NIC
NLD
NPL
NZL
OMN
PAK
PAN
PER
POL
PRT
PRY
QAT
ROU
RUS RWA
SAU
SEN
SWETTO
TUN
TUR
TZA
UGA
UKRURY
USA
UZB
VEN
YEM
ZAF
ZMB
ZWE
CHN
IDN
KHM
MNG
MYS
PHLTHA
VNM
0
10
20
30
40
50
60
70
80
0 2 4 6 8 10 12 14 16 18 20
Services Trade Restrictions Index (STR
I)
Average applied Most Favored Nation (MFN) tariff (percent)

28
equity limits in the telecom sector; currently the foreign equity limit is 70 percent for network facilities providers and 100 percent for applications service providers. The limit was a more relaxed 70 percent in Vietnam, but foreign majority control required government approval, and in Thailand foreign majority owned or controlled providers could only offer services on a resale basis. In the context of the TPP negotiations, Vietnam has promised to relax or eliminate foreign equity restrictions over the same time frame. A number of countries allowed full foreign ownership in private companies, but restricted foreign ownership in state‐owned telecom operators. Thus, the Philippines did not allow acquisition of a state‐owned entity, whereas Cambodia and Lao PDR allowed only a minority foreign share in state entities. In Vietnam, the state held a dominant share in telecommunications service providers with network infrastructure. However, in the context of the TPP, Vietnam has pre‐committed to further liberalization.
Transportation services were relatively restricted in developing East Asian countries as they were in other parts of the world. Thailand, Vietnam, Philippines, and Malaysia had restrictions on foreign ships carrying government cargo but no limitations on private cargo. On commercial presence (mode 3), for the types of transport covered by the survey (maritime, air, road, and rail), the majority of developing East Asian countries mentioned that the control must be held by local companies. In air transport, all ASEAN member states, including the developing East Asian countries (except Mongolia), signed the ASEAN Multilateral Agreement on Full Liberalization of Air Freight and Air Passenger services. It was difficult to assess how much more openness the regional air services agreements offered beyond the existing Bilateral Air Services Agreements (BASAs).
ii. Services openness and productivity
Research on several developing countries offers examples of the significant impact of openness to services on manufacturing productivity. Reforms in these countries visibly transformed services sectors, with greater openness and improved regulation leading to dramatic growth in domestic and foreign investment. Local manufacturing firms were no longer at the mercy of inefficient public monopolies but could now source services from a wide range of domestic and foreign providers operating in an increasingly competitive environment. As a result, they had access to better, newer, more reliable, and more diverse business services. These improvements enhanced firms’ ability to invest in new business opportunities and better production technology, to exploit economies of scale by concentrating production in fewer locations, to efficiently manage inventories, and to coordinate decisions with suppliers and customers.13
13 Several studies show that access to low‐cost and high‐quality (domestic or foreign) producer services can promote productivity and economic growth (Hoekman and Mattoo 2008). Arnold et al. (2016) collected detailed information on the pace of reform across Indian services sectors, with a focus on entry and operational restrictions. The results suggest that procompetitive reforms in banking, transport, insurance, and telecommunications boosted the productivity of both foreign and locally owned manufacturing firms. Using firm‐level data for the Czech Republic for 1998–2003, Arnold, Javorcik, and Mattoo (2011) find a positive effect on the productivity of domestic firms in downstream manufacturing as a result of services sector reforms leading to greater FDI. Using the annual manufacturing survey of Chilean firms, Fernandes and Paunov (2012) find a positive

29
An example of the power of services reform is offered by Indonesia. Duggan, Rahardja, and Varela (2013) examined the extent to which policy restrictions on foreign direct investment in the Indonesian service sector affected the performance of manufacturers over the period 1997–2009. They used firm level data on manufacturers’ total factor productivity and the OECD’s foreign direct investment Regulatory Restrictiveness Index, combined with data from Indonesia’s input‐output tables regarding the intensity with which manufacturing sectors use services inputs. Controlling for firm‐level fixed effects and other relevant policy indicators, they find, first, that relaxing policies toward foreign direct investment in the service sector was associated with improvements in perceived performance of the service sector. Second, they found that this relaxation in service sector foreign direct investment policies accounted for 8 percent of the observed increase in manufacturers’ total factor productivity over the period. The total factor productivity gains accrued disproportionately to firms that are relatively more productive, and gains are related to the relaxation of restrictions in both the transport and electricity, gas, and water sectors. Total factor productivity gains were associated, in particular, with the relaxation of foreign equity limits, screening, and prior approval requirements, but less so with discriminatory regulations that prevent multinationals from hiring key personnel abroad (Figure 14).
Figure 14. Indonesia: Services FDI reform and productivity in the manufacturing industries
a. Services FDI reform b. Productivity gains from services reform
Source: Duggan, Rahardja and Varela (2013)
iii. Services openness and comparative advantage
Since a large part of goods trade includes trade in embodied services, the development of the domestic services sector and access to imported services inputs can be expected to influence comparative advantage in manufacturing trade. The impact of services development on manufacturing trade is not straightforward. Since services are used as inputs in the production
effect of substantial FDI inflows in producer services sectors on the total factor productivity of Chilean manufacturing firms. Their findings also suggest that services FDI fosters innovation in manufacturing and offers opportunities for laggard firms to catch up with industry leaders. These benefits arise not just from foreign investment but also from cross‐border trade in services. For example, Amiti and Wei (2009) find that services offshoring by high‐income countries tends to raise their manufacturing sectors’ productivity.
0.0 0.2 0.4 0.6 0.8 1.0
Electricity
Construction
Distribution
Transport
Hotels & restaurants
Media
Communications
Financial services
Business services
Real estate investment
All Services
Overall FDI Index
2010 2006 2003 1997
‐0.2 ‐0.15 ‐0.1 ‐0.05 0
Domestic
All
Lower Bound (90% Conf.)
Mid Point Estimate
Upper Bound (90% Conf.)

30
of manufactured goods, their development can increase manufacturing production. But since services and manufacturing compete for resources, the development of services can be at the expense of manufacturing. For example, the development of the services sector has drawn resources away from manufacturing not just in industrial countries like the United States and the United Kingdom, but also in developing countries like India and possibly the Philippines (see, for example, Kochar et al. 2006).
Some early studies examined the link between services as inputs in manufacturing and the pattern of manufacturing exports using single national input‐output tables. For example, Francois and Woerz (2008) find significant and strong positive effects of increased business services openness (greater imports) on some industries. Their reliance on national data means that inputs cannot be broken down according to their origins, and services inputs are mismeasured due to two‐way trade in intermediate products. More recently, Stehrer, Foster, and de Vries (2012), Timmer et al. (2013), and Liu et al. (2017) used the newly constructed international input‐output tables to measure more precisely the embodied services and indirect trade through other sectors.
Liu et al. (2017) focus on two key services sectors: financial services and business services. Domestic services development has a mixed effect on the revealed comparative advantage (RCA) of manufacturing exports. Liu et al. (2017) quantify the indirect role of services in international trade in goods and construct new measures of revealed comparative advantage based on domestic value added in gross exports.14 In their econometric analysis of the impact of services development on RCA in manufacturing sectors, the key explanatory variable is the interaction between a measure of the development of financial (or business) services and the financial (or business) services intensity of each manufacturing sector. Services development reduces the RCA of manufacturing exports in manufacturing sectors with low embodied services (basic and fabricated metals) but increases it in sectors with a high degree of embodied services (food, beverages and tobacco). Liu et al. also consider the role of services imports in overcoming the limitations of domestic services markets. In countries with less developed services, manufacturing exports benefit more from access to foreign services inputs. Such a bypass effect is also discussed in a theoretical model by Ju and Wei (2010), which derives the conditions for financial globalization to serve as a substitute for reforms of domestic financial systems. These results suggest that lower services trade barriers can help developing countries bypass inefficient domestic services provision and promote their manufacturing exports through intersectoral linkages.
The patterns across East Asian developing countries of their direct and indirect domestic value‐added exports of services reveals the current state and potential evolution of their comparative advantage in services. In Figures 15 and 16, developing East Asian countries are placed in the
14 Note that RCA based on gross exports (used as a dependent variable) can cause an endogeneity problem because the embodied services (used as explanatory variables) are part of gross manufacturing exports. Liu et al. (2017) avoid this problem because manufacturing RCA is based on the value added created by the factors employed in manufacturing sectors, excluding the embodied services in gross exports contributed by the factors employed in services sectors.

31
context of other countries for which value‐added trade data are available. The horizontal axis measures direct value‐added exports of services and the vertical axis measures indirect domestic value‐added exports of services (the value‐added exports of services embodied in exports of goods). Lines representing the median shares divide the countries into groups occupying four quadrants.
For financial services, Figure 15 shows that there is heterogeneity across developing East Asian countries:
In the bottom left quadrant is Indonesia. The low competitiveness of financial services is reflected in the low share of direct exports and the low level of embodied exports—which could reflect the low financial services intensity of goods production, the reliance primarily on imported financial services, or both.
In the top left quadrant are China, Vietnam and Thailand, which are not yet sufficiently competitive to export financial services directly, but which do export a significant share indirectly. That goods sectors in these countries rely significantly on domestically produced financial services could be because financial services in these countries have reached an intermediate level of development at which they can compete in the domestic market but not yet internationally. It could also be that restrictions on cross‐border imports in these countries oblige goods producers to use domestically produced services.
In the top right quadrant is Malaysia, whose more developed financial services sector exports both directly and indirectly.
In the bottom right quadrant are Cambodia and less clearly, the Philippines, along with such “mature deindustrializers” as Britain and the United States, where the domestic tangible industries have shrunk in importance and financial services are mostly exported directly. The Philippines is too similar to Vietnam to be treated as qualitatively different, and Cambodia’s presence may merit further exploration.

32
Figure 15. Direct and indirect value added exports of financial services as shares of GDP, 2011
Source: OECD TiVA and authors’ calculations.
For business services, Figure 16 shows two interesting differences with developing East Asia:
Given the greater cross‐border tradability or openness to trade of business services, there is less scope for an intermediate stage (for countries to populate the top left quadrant). When a country is not competitive in producing these services, it neither exports them nor do its goods sectors import them. When a country is competitive, it exports both directly and indirectly.
Most countries in the region inhabit the bottom left hand quadrant, where both direct and indirect exports of business services are low, reflecting the relative weakness of this sector.
In the bottom right quadrant are Philippines, and surprisingly, Malaysia, and along with the “premature deindustrializer,” India, where direct exports of business services are high but indirect exports are low. In the case of the Philippines, the explanation is the relative strength of business services and the relative weakness of goods sectors, but the Malaysian case deserves closer inspection.
ARG
AUS
AUT
BEL
BGR
BRA
BRN
CAN
CHL
COL
CRI
CZE
DEU
DNK
ESP
EST
FIN
FRA
GBRGRC
HRVHUN
IND
ISL
ISR
ITA
JPN
KOR
LTU
LVA
MAR
MEX
NLD
NOR
NZL
PERPOL
PRT
ROU
RUS
SAU
SVK
SVN
SWE
TUN
TUR
USA
ZAF
CHN
IDNKHM
MYS
PHL
THA
VNM
0
0.5
1
1.5
2
2.5
0 0.5 1 1.5 2 2.5
Indirect V
alue Added
Exports/GDP (p
ercent)
Direct Value Added Exports/GDP (percent)

33
Figure 16. Direct and indirect value‐added exports of business services as shares of GDP, 2011
Source: OECD TiVA and authors’ calculations.
iv. Challenges in services reform
The significant benefits of services openness cannot be achieved by a mechanical opening of markets. Flawed reform programs can substantially reduce gains from liberalization (World Bank 2002, chapter 3). While precise recommendations require detailed analysis of each service sector in each country, three broad types of action are likely to be desirable: emphasizing competition, strengthening the regulatory environment, and creating mechanisms to improve access to essential services in the poorest areas. Regional cooperation and international support could help in each of these respects.
The largest gains come from eliminating barriers to entry and enhancing competition. Some East Asian developing countries like Malaysia and Thailand have given priority to a change in ownership from public to private or national to foreign hands, while retaining limitations on new entry. These restrictions can lead to a transfer of rents not just to domestic firms but also to foreign firms at the expense of consumer welfare. It is sometimes suggested that unrestricted entry is not always desirable, and in areas like banking might threaten bank viability and financial
ARG
AUS
AUT
BEL
BGR
BRA
BRN
CAN
CHE
CHL
COL
CRI
CYP
CZE
DEU
DNK
ESP
EST
FIN
FRA
GBR
GRC
HKG
HRV
HUN
IND
IRL
ISL
ISR
ITA
JPN
KOR
LTU
LUX
LVA
MAR
MEX
MLT
NLD
NOR
NZL
PER
POLPRT
ROU
RUS
SAU
SGP
SVK
SVN
SWE
TUN
TUR
USAZAF
CHN
IDN
KHM
MYS
PHL
THA
VNM0
0.5
1
1.5
2
2.5
3
3.5
4
4.5
5
0 0.5 1 1.5 2 2.5 3 3.5 4
Indirect V
alue Added
Exports/GDP (p
ercent)
Direct Value Added Exports/GDP (percent)

34
stability. But such concerns are ideally addressed through effective prudential regulation and there must be a strong presumption in favor of eliminating barriers to entry.
Effective regulation ranging from prudential regulation in financial and professional services to pro‐competitive regulation in telecommunications and other network‐based services is critical to the success of liberalization (Mattoo and Sauve, 2003). While regulatory capacity is a limited in some countries in the region like Lao PDR and Myanmar, regulatory design is a challenge even for the more advanced countries in the region and the world. Rapid changes in services technology and business models are rendering redundant old models of regulation. Conventional communication is being disrupted and displaced by platforms like Facebook and WeChat, conventional financial services by fintech and providers like the Ant Financial Services Group (formerly Alipay), and conventional transport by Uber and Didi Chuxing.
Regulatory institutions that can address conventional concerns and emerging issues can be costly and require sophisticated skills. Regional cooperation may enable a reduction of costs and a pooling of skills and help to develop regional solutions to problems. A key problem is that improvements in domestic standards are often needed to export services, but standards that are too high can hurt domestic access to services or competitiveness in other markets. For example, in the case of professional services, low standards and disparities in domestic training and examinations can become a major impediment to obtaining foreign recognition; but too high standards make these services unaffordable for the poor and small firms. A concrete example of the dilemma: the Philippines initially enacted national privacy legislation in order to ensure continued access to the EU data processing market; but the result was that many Philippines‐based US firms found it difficult/costly to operate in the Philippines and suspended investment plans; whereupon the Philippines government was obliged to reversed course. Striking an appropriate balance in these cases is a challenge and a regional approach may help countries create locally appropriate standards without segmenting markets – and also enhance the region’s influence on the evolution of international standards in these new areas.
Liberalization often requires complementary policies to help improve access to essential services for the poor, but these policies have not always been put in place even in the more advanced countries. In certain poor countries, and certain regions within all countries, improvements in services policy and regulation will not be sufficient to ensure access to essential services and therefore special mechanisms are needed. The effectiveness of international assistance could be maximized by allocating it in a manner similar to that used domestically by countries like Chile and Peru to achieve wider access to services ranging from telecommunications to education (Mattoo, Nielsen and Nordas, 2006). For instance, once a region or group within a country has been identified as needing assistance – because the market is not delivering affordable services – funds could be pooled and allocated through international competitive tenders to the firm which offers to provide the necessary infrastructure at least cost. Providing poorer countries assistance in meeting the costs of the programs could increase the benefits of and sustain liberalization by ensuring that the gains are distributed widely.

35
c. Participation in GVCs and productivity growth
A key feature of developing East Asian countries has been their increasing participation in regional and global value chains. Section 2 has documented the changing nature of East Asian trade with the rise of production fragmentation across borders. The focus of this section is to investigate how GVC participation has affected productivity growth in the region.
Trading in the context of GVCs is associated with multiple border‐crossing by intermediate products and services. Economists rely on this fact to identify GVC‐related trade and to set it apart from conventional trade. Specifically, they look for the following two features in the international trade data: (1) the significant presence of foreign value added in a country’s total or sectoral gross exports, and (2) the significant presence of domestic value added produced by a country or its sectors in the gross exports of all other countries. The first feature reflects backward participation in GVCs, which occurs when countries specialize in downstream, often low‐skilled, stages of the process of production, using imported parts, components and other processed intermediates to produce output that is then exported. The second feature is associated with forward participation in GVCs, typical of countries that offshore labor‐intensive stages of the production process while specializing in upstream high‐skilled stages of production such as design, research and development.15 This method of identification is not always foolproof, especially in the case of forward participation, which can be confounded with conventional trading of oil and other raw materials.16
GVC participation can increase labor productivity through two main channels. Recent theoretical models have shown that productivity gains associated with offshoring and participation in GVCs may accrue from the finer international division of labor, which is isomorphic to factor‐augmenting technical change (Grossman and Rossi‐Hansberg 2008). In addition to specialization, GVC participation can boost productivity growth through greater diversity in input varieties, learning externalities and technology spillovers (Li and Liu 2014; Baldwin and Robert‐Nicoud 2014).17 The latter effects may be especially important for developing countries with backward participation in GVCs, stemming from the engagement with firms in technologically advanced countries.
In this section, we investigate whether the pattern of productivity growth for developing East Asian countries can in part be explained by the changes in GVC participation. We proceed by examining the general trends in labor productivity based on country‐specific data from The Total Economy Database. As for the trends in backward and forward GVC participation of the developing East Asian countries, we refer the reader to the discussion in Section 1. Second, we
15 Calculation of both backward and forward participation in GVCs involves applying Leontief’s approach to synthetically derived international input‐output tables (Hummels, Ishi and Yi 2001; Koopman, Wang, and Wei 2014). 16 Indeed, output exported by oil and commodity producers tends to be found in exports of multiple countries that use raw materials as intermediate inputs embodied in their output. Consequently, the forward participation of oil and commodity producers can be high even when the producers themselves may not be engaged in GVCs. 17 Trade in general can lead to productivity gains through multiple channels that are the object of a large body of research ‐ see IMF (2016), Chapter 2, for a brief survey.

36
check whether labor productivity and backward GVC participation are associated at country‐sector level, in general for the average country in the sample, and in the specific case of the developing East Asia. Third, we subject this association to more rigorous scrutiny, to see whether it is robust to controlling for other obvious drivers of labor productivity.
Labor productivity growth rates in developing East Asia are among the highest in the world but some of the countries have seen declines in the past two decades. In level terms, labor productivity in the developing East Asian countries is yet to catch up with developed countries. The 2015 rankings range from 48/123 for Malaysia to 113/123 for Cambodia, with China being ranked 83/123 and Vietnam 102/123. However, the picture is completely different as relates to labor productivity growth: the 2015 rankings range from 2/123 for Vietnam to 28/123 for Thailand. Labor productivity growth in the countries of focus has been consistently above the averages of the mature economies, and, with few exceptions, also above the world and the emerging market averages. There has been plenty of discussion about the average world productivity being sluggish in recent years, particularly since the Great Recession (World Bank, 2018). Slower productivity growth in the 2010s relative to the 2000s seems to also affect some of the developing East Asian countries, most notably China, Malaysia and Myanmar (Table 4).
Table 4. Labor productivity in the developing East Asian countries
Source: Conference Board, The Total Economy Dataset. Note: Arrows denote change from previous decade. Decade labelled 2010s refers to period 2010‐2016.
Prima facie evidence indicates a positive correlation between backward GVC participation and productivity growth for developing East Asian countries. For the average country in the world, sectors with larger growth in backward GVC participation tend to also have larger growth in labor productivity. In Figure 17, we explore the time variation in the TiVA data (yearly from 1995‐2011) and find that, for the average developing East Asian country‐sector combination, the level of
Country/region 1980s
World n.a. n.a. 1.5 2.5 2.3
Mature Economies n.a. n.a. 2.0 1.3 1.1
Emerging Markets and Developing Economies n.a. n.a. 0.9 4.0 3.4
China 3.2 4.9 8.4 6.4
Indonesia 2.6 2.8 3.5 3.8
Cambodia 1.3 2.6 4.3 4.9
Myanmar 0.8 4.2 9.3 5.3
Malaysia 3.6 3.9 2.6 1.9
Philippines 0.5 0.4 2.1 3.8
Thailand 3.4 4.4 2.7 3.8
Vietnam 1.4 4.8 4.5 4.5
Labor productivity growth
2010s2000s1990s

37
labor productivity and the level of backward GVC participation are positively associated.18 The strength of this association is heterogeneous across country‐sector combinations, but it displays a surprisingly consistent upward path.19
Figure 17. Emerging East Asia: correlation between labor productivity and backward GVC participation in manufacturing sectors, by country (1995‐2011)
18 For this step, we use OECD TiVA to compute the backward GVC participation indicator. OECD TiVA covers 63 countries and 34 goods and services sectors and spans period 1995‐2011. The following developing East Asian countries are included in the TiVA database: China, Indonesia, Malaysia, Philippines, Thailand and Vietnam. For labor productivity by country and sector, we use data on value added from OECD TiVA and on employment from OECD STAN, WIOD (Release 2013) and UNIDO INDSTAT2. 19 Each row in Figures 17 and 18 refers to a country. The first figure in each row presents all the sector‐year combinations of that country next to all the country‐sector‐year combinations in the sample. The y axis indicates the position of a country relative to the rest, as concerns the level of labor productivity. The x axis indicates the same for the degree of GVC participation, but the ranking in this case is less accurate due to the scale effects (being more to the right may indicate that a country simply exports more than the others). The second figure in each row zooms in on the sector‐year combinations of the country in focus and indicates for each sector the strength of the association between the level of labor productivity and the level of backward GVC participation.

38

39

40
Figure 18. Emerging East Asia: correlation between labor productivity and backward GVC participation in manufacturing sectors, by country (1995‐2011)
41

42
Econometric analysis allows us to identify rigorously the effect of backward GVC participation on productivity growth. Labor productivity has a multitude of drivers. To investigate whether GVC participation is among the significant ones in the context of the developing East Asian countries, we draw on the econometric framework in Constantinescu, Mattoo and Ruta (2017). We apply that framework to data on value‐added, output and trade from the OECD ICIO and TiVA and on employment and capital from OECD STAN, WIOD (Release 2013) and UNIDO INDSTAT2.20 We estimate the impact of GVC‐related trade and non‐GVC‐related trade on labor productivity for the average country in the world, and then use interaction terms to investigate whether a differential effect exists for the developing East Asian group. Annex B provides the details of the econometric analysis.
The analysis shows that GVC participation has been a significant driver of productivity growth for developing East Asian economies. Results are presented in table 5. For the average country/sector in the world, they confirm the findings in Constantinescu, Mattoo and Ruta (2017) that total imports and total exports influence productivity (specification 1), that the imported input channel is relatively more important (specification 2), and that imported inputs matter for productivity whether or not they are related to GVCs (specification 3).21 The coefficients of the interacted terms which aim to capture differential impact for developing East Asian countries relative to the average country/sector in the world are generally not significant. Gross final imports have a negative impact on productivity that is significant at the 5 percent level, suggesting that the positive effect of international competition may be outweighed by the resulting contraction in the scale of production. Our GVC results suggest that, on average, a 10 percent increase in the backward GVC participation of manufacturing sectors in developing East Asian countries corresponds to a 1.4 percent increase in labor productivity, other things being equal. In other words, developing East Asia also sees a productivity boost from GVC‐related imported inputs or backward linkages, and the magnitude is not significantly different from the global average.
20 The resulting data set covers 55 countries, 12 sectors and period 1995 through 2011. It includes the following developing East Asian countries: China, Indonesia, Malaysia, Philippines and Vietnam. Estimations are restricted to manufacturing sectors (excluding manufacturing of coke, refined petroleum and nuclear fuel). 21 While all trade variables included in the regressions have endogeneity concerns associated with them, our focus is on identifying the causal effect due to backward GVC participation, for which we were able to find a plausible instrument. Hence, we examine this effect using IV estimation. Backward GVC participation of sector s in country c is instrumented by the average value added from the United States, Japan and Germany embodied in the exports of industry s of three countries in the sample that are closest in income to the country c.

43
Table 5. Labor productivity and trade
Notes: FVA stands for “foreign value added”. Specification 1 relates labor productivity to gross imports and gross exports. Specification 2 relates labor productivity to gross imports and gross exports by type of product (final and intermediates). Specifications 1 and 2 are estimated using the Ordinary Least Squares (OLS) estimation. Specification 3 relates labor productivity to three components of gross imports. It is estimated using Instrumental Variables (IV) estimation, where GVC backward participation is instrumented by the average value added originating from Germany, Japan and the United States that is embodied in the exports of three countries in the sample that have the most similar per capita income to the country in question. Regressions are run at the country, year and sector level and include controls for the log of capital stock per employee as well as the following fixed effects: country‐industry; country‐year and industry‐year. Column (1) displays coefficients of trade indicators (denoting average effect across countries, sectors and years) from regressions that do not account for a differential effect for developing East Asia. Column (2) displays coefficients of trade indicators interacted with developing East Asia dummy variable from regressions that account for a differential effect (average effects from these regressions are similar to average effects reported in column (1). Standard errors indicated in parenthesis; * p<0.10, ** p<0.05, *** p<0.01. Number of observations ranges between 8,368 and 8,700. R‐squared: 0.985. Sample is restricted to manufacturing sectors excluding manufacturing of coke, refined petroleum and nuclear fuel.
d. Shallow and fragmented trade agreements
The trade policy framework in which developing East Asian countries operate has changed over time. By 2013, with the entry of Lao PDR, all developing East Asian countries had become members of the WTO. Indonesia, Malaysia, Myanmar, the Philippines and Thailand have been members since the start in 1995, followed by Mongolia in 1997. China entered the WTO in 2001, Cambodia in 2004 and Vietnam in 2007. In addition, as further documented below, developing East Asian economies are members of several preferential trade agreements (PTAs). The combination of multilateral, regional and (often) unilateral trade policy reforms has dramatically
Average effect
Differential effect for
developing East Asia
(1) (2)
log of gross imports 0.0752*** ‐0.0483
(0.0212) (0.0632)
log of gross exports 0.0838*** ‐0.0541
(0.0172) (0.0606)
log of gross final imports ‐0.0185 ‐0.0917**
(0.0128) (0.0382)
log of gross intermediate imports 0.141*** 0.0847
(0.0238) (0.0768)
log of gross final exports 0.0161 ‐0.131*
(0.0198) (0.0689)
log of gross intermediate exports 0.0429** 0.0395
(0.0214) (0.0654)
log of gross final imports ‐0.0266* ‐0.107**
(0.0161) (0.0496)
0.0879*** 0.0622
(0.0182) (0.0518)
0.140** 0.138
(0.0581) (0.183)
log of FVA embodied in exports (GVC backward part.)
log of FVA embodied in domestically‐absorbed output
Specification
Regressors
log of labor productivity
Dependent
variab
le
31
2

44
reduced applied tariffs in the region. However, even though the number of trade agreements has grown, they remain relatively shallow and fragmented in nature.
Developing East Asian countries are involved in a growing number of preferential trade agreements. The “noodle bowl” of Asian trade agreements has become denser in the last decade. Developing East Asian countries have signed a total of 36 PTAs.22 Since some of these agreements involve several countries, such as the Association of East Asian Nations (ASEAN), each developing East Asian country has on average an agreement with 8 partners. While the proliferation of overlapping trade agreements has certainly contributed to the reduction of tariffs and other non‐tariff restrictions to trade, it also creates multiple, and possibly inconsistent, trade rules. The risk is that divergent trade rules may create costs for businesses and lower the efficiency of global and regional value chains (Baldwin and Kawai, 2013).
The content of East Asian trade agreements has also changed over time. ASEAN provides a good example of this evolving content. The free trade area, liberalizing goods trade among ASEAN economies, was established in 1992. Subsequent protocols covering services and intellectual property rights were added in 1995, an investment agreement and dispute settlement mechanism was included in 1996, and a framework agreement for the mutual recognition of standards was signed in 1998. In some cases, the new set of rules are of a legally binding nature, as for investment (WTO, 2011). For other policy areas, such as intellectual property rights protection, cooperation is only on a best‐endeavor basis, As the ASEAN Framework Agreement on Services reflects. The extent of commitments in the agreement is limited, but the agreement does make references to schedules of commitments (Art. X) and a few more specific concessions.
International agreements have not played a significant role in driving regional services reform. Drawing on surveys of applied policies in the key services sectors of ASEAN countries, Gootiiz and Mattoo (2017) assessed the impact of the ASEAN Framework Agreement on Services (AFAS) and the ambitious ASEAN Economic Community Blueprint, which envisaged integrated services markets by 2015 (Table 8). The analysis finds that over this period, ASEAN did not integrate faster internally than vis‐à‐vis the rest of the world: policies applied to trade with other ASEAN countries were virtually the same as those applied to trade with the rest of the world. Moreover, the recent commitments scheduled under AFAS did not produce significant liberalization and, in a few instances, services trade policy actually became more restrictive. The two exceptions are in areas that are not on the multilateral negotiating agenda: steps have been taken toward creating regional open skies in air transport, and a few mutual recognition agreements have been negotiated in professional services. These findings suggest that regional negotiations have added the most value when they were focused on areas that are not being addressed multilaterally.
22 In addition, developing East Asian countries are also members of 6 partial scope agreements that cover only a limited number of products.

45
Table 8. Restrictiveness of GATS commitments, Doha offers, AFAS commitments, applied policy and
Blueprint goals by country
Country
Restrictiveness of GATS Commitments
Restrictiveness of Doha Offers
Restrictiveness of AFAS commitments
Restrictiveness of applied policy
Restrictiveness of Blueprint goals
BRN 89.3 89.3 65.2 No data 19.1
IDN 78.2 74.0 49.5 48.3 19.1
KHM 24.1 23.4 18.5 10.0 19.1
LAO 76.0 75.3 55.3 44.6 19.1
MMR 100.0 100.0 42.8 26.4 19.1
MYS 76.0 73.1 54.2 42.3 19.1
PHL 78.7 78.7 55.0 48.6 19.1
SGP 60.4 59.8 30.5 10.8 19.1
THA 80.4 70.0 58.5 43.8 19.1
VNM 38.3 38.3 36.4 36.0 19.1
Trade rules in East Asia appear to be patchy and trade agreements remain relatively shallow. Table 9 provides an overview of the policy areas that are covered by developing East Asia countries’ trade agreements. Some of the policy areas that are covered by the WTO agreements are absent from most East Asian PTAs, including public procurement (covered by a plurilateral WTO agreement), subsidies and state trading enterprises. Since all developing East Asian economies are members of the WTO, multilateral rules apply to them. However, PTAs in other regions tend to go beyond multilateral rules in these areas, indicating that regional disciplines may be weaker in ASEAN than in other regions. Coverage of policy areas that are not regulated by the WTO, such as competition policy, intellectual property rights, movements of capital, visa and asylum, is even patchier. These gaps indicate that the trade agreements signed by developing East Asian countries are shallow relative to other regions with comparable shares of intra‐regional trade such as North America and Europe. Initiatives such as the Comprehensive and Progressive Trans‐Pacific Partnership (CPTPP) and the Regional Comprehensive Economic Partnership (RCEP) may help fill these regulatory gaps. But they may also risk creating regulatory fragmentation within the region and between the region and other key trading partners. This indicates the importance of ensuring “open” regionalism in East Asia, i.e. rules should aim at being non‐discriminatory or minimize their discriminatory component.

46
Table 9. Content of developing East Asian countries’ preferential agreements
Source: “Content of Deep Trade Agreements” World Bank database, Hofman et al. (2017).
Notes: ASEAN FTA stands for Association of Southeast Asian Nations free trade area; Table lists policy areas
covered in at least 3 agreements.
Deepening trade agreements in East Asia can promote further GVC integration and support productivity growth. The shallow and fragmented nature of trade agreements in East Asia, and the resulting inadequacy and inconsistency of trade and investment rules within East Asia can be a stumbling block to further GVC integration and, hence, negatively affect productivity growth. Recent research shows that the depth of trade agreements is positively correlated with GVC integration (Ruta 2017). Specifically, Laget et al. (2018) find that signing deep PTAs doubles trade in parts and components and increases re‐exported value added by about 22 percent. Intuitively, better protection of foreign investment and intellectual property rights, a more competitive environment safeguarded by competition policy and the regulation of state owned enterprises, greater freedom of movement of people and capital across borders, and other deep provisions embedded in PTAs contribute to promote GVCs. Such a policy environment will be even more relevant as developing East Asian countries aim to specialize not only through low value‐added tasks like product assembly but aim to participate increasingly in the production of more sophisticated goods and services. Ongoing trade negotiations within East Asia and with the rest
CONTENT ASEAN FTA
China ‐ Costa
Rica
China‐Pe
ru
Malaysia ‐
Australia
New
Zea
land ‐
Malaysia
Chile
‐China
ASEAN‐Korea
Australia
‐
Thailand
Icelan
d ‐ China
China‐New
Zealand
Thailand ‐ New
Zealand
Switzerlan
d ‐
China
ASEAN‐Australia‐
New
Zea
land
Pakistan ‐
Malaysia
Japan
‐ASEAN
Japan
‐
Philippines
Japan
‐Viet Nam
China‐Singapore
Japan
‐Indonesia
FTA Customs
FTA Agriculture
AD
Customs
CVM
GATS
SPS
TBT
TRIPS
TRIMS
State Aid
Export Taxes
STE
Public Procurement
Investment
IPR
Competition Policy
Movement of Capital
Visa and Asylum
Environmental Laws
Regional Cooperation
Information Society
Education and Training
Research and Technology
Labour Market Regulation
SME
Agriculture
Consumer Protection
Cultural Cooperation
Industrial Cooperation
Innovation Policies
Economic Policy Dialogue
Data Protection
Mining
Public Administration
WTO Plus
WTO Extra

47
of the world will, therefore, have important consequences for the future of GVC integration and productivity growth of developing East Asian countries.
Analysis on the CPTPP shows that the agreement would have positive trade and income effects for developing East Asian countries, notably for Vietnam. Maliszewska et al. (2018) estimate the economic and distributional impacts of CPTPP using a global dynamic computable general equilibrium (CGE) model. By 2030, CPTPP members’ income is estimated to be on average 0.87 percent higher than in the baseline. Vietnam is expected to reap the largest gains from CPTPP, ranging between 2.8 to 4.4 percent of income. The gains are determined mainly by three factors: reduction in tariffs, lower trade costs associated to changes in non‐tariff measures, and the importance of CPTPP members as trading partners. Vietnamese sectors that benefit the most are food, beverages, and tobacco; wearing apparel and leather, and textiles. Most services sectors would also expand faster than in the baseline. Increases in output are mostly driven by higher exports. CPTPP is expected to reduce the poverty rate in Vietnam, but higher‐skilled workers are likely to benefit more. CPTPP is estimated to lift from poverty (at PPP$5.50 a day) 0.6 million people in 2030, relative to baseline conditions. Although all income groups are expected to benefit, people at higher ends of the income distribution benefit proportionately more than the poor, because the agreement creates more economic opportunities for skilled workers.
4. CONCLUSION
The world is changing in ways that developing East Asian countries cannot predict or control. Looking back, we have demonstrated how countries in the region have forged a remarkable development path, taking advantage of technologies that favored labor intensive manufacturing and access to foreign markets that was secured by trade agreements. We also showed how their trade and developments prospects have been profoundly affected by the emergence of China.
None of these largely external developments can simply be extrapolated into the future. The window for continued labor‐intensive industrialization is defined by a race between two prices: how fast the real wage in China increases relative to how fast the price of robots falls. That race will determine whether companies like Foxconn shift production from China to Cambodia or automate. The scope and speed of technological change has always been impossible to forecast. Aging and rebalancing in China favor a faster increase in real‐wages, but initiatives like the Belt and Road could awaken the relatively underdeveloped interior of China to prolong its hold on large scale, low wage manufacturing. It is also hard to assess whether the backlash against globalization in its erstwhile strongest proponents, the EU and US ‐ provoked in part by the pain of adjusting to East Asia’s remarkable success – will be dissipated in political rhetoric or translate into a serious retreat from legally bound openness.
Even though the evolution of the world economy is mostly beyond developing East Asia’s control, the countries of the region still have significant power to mold their own economic destiny. National reform in services, especially telecommunications, transport and finance, would equip East Asian citizens and firms with the connectivity and capital needed for productive and inclusive

48
engagement in a technologically dynamic global economy. International cooperation through deeper agreements that are open to all trade partners would create a more secure policy environment to exploit the gains from an ever‐finer international division of labor and from reaping economies of scale and scope in large, integrated markets. These two major recommendations of this paper will have a significant development pay‐off regardless of which state of the world prevails.
REFERENCES
Amiti, M. and S.J. Wei. 2009. "Service Offshoring and Productivity: Evidence from the US." World Economy 32 (2): 203–20.
Arnold, J., B. Javorcik, M. Lipscomb and A. Mattoo. 2016. Services reform and manufacturing performance: Evidence from India, Economic Journal, Volume 126 (590) pp. 1–255.
Arnold, J., B. Javorcik and A. Mattoo. 2011. The Productivity Effects of Services Liberalization: Evidence from the Czech Republic, Journal of International Economics, vol. 85(1), 136‐146.
Baldwin, R. E. and Kawai, M. 2013. “Multilateralizing Asian Regionalism” (August 15, 2013). ADBI Working Paper No. 431.
Baldwin, R. and F. Robert‐Nicoud. 2014. “Trade‐in‐goods and Trade‐in‐tasks: An Integrating Framework,” Journal of International Economics 92 (1): 51‐62.
Bastos, P. 2018. “Exposure of Belt and Road Economies to China Trade Shocks.” World Bank Policy Research Working Paper No. 8503.
Borchert, I., B. Gootiiz and A. Mattoo. 2012. “Guide to the Services Trade Restrictions Database. World Bank Policy Research Working Paper No. 6108.
Constantinescu, C., A. Mattoo and M. Ruta. 2015. “The Global Trade Slowdown: Cyclical or Structural?”, World Bank Policy Research Working Paper No. 7158, forthcoming in the World Bank Economic Review.
Constantinescu, C., A. Mattoo and M. Ruta. 2016. “Global Trade Watch: Trade Developments in 2015.” Washington, DC.: World Bank Group.
Constantinescu, C., A. Mattoo and M. Ruta. 2017. “Does Vertical Specialization Increase Productivity?” World Bank Policy Research Working Paper No. 7978.
Duggan, V., S. Rahardja, G. Varela. 2013. “Services Sector Reform and manufacturing Productivity: Evidence from Indonesia.” World Bank Policy Research Working Paper No. 6349.
Escaith, H., N. Lindenberg, and S. Miroudot. 2010. “International Supply Chains and Trade Elasticity in Times of Global Crisis.” WTO Staff Working Paper ERSD‐2010‐08.

49
Fernandes, A. and C. Paunov. 2012. Foreign direct investment in services and manufacturing productivity: Evidence for Chile, Journal of Development Economics, 2012, vol. 97, issue 2, 305‐321.
Gootiiz, B. and A. Mattoo. 2017. Regionalism in Services: A Study of ASEAN, World Economy 40(3): 574‐597.
Grossman, G. M. and E. Rossi‐Hansberg. 2008. “Trading Tasks: A Simple Theory of Offshoring.” American Economic Review 98 (5): 1978‐1997.
Hallward‐Driemeier, Mary, and Gaurav Nayyar. 2018. Trouble in the Making? The Future of Manufacturing‐Led Development. Washington, DC: World Bank.”
Hoekman, B. and A. Mattoo 2008 Services Trade and Growth, with Bernard Hoekman, Chapter 1 in Opening Markets for Trade in Services, Juan A. Marchetti and Martin Roy (eds.), Cambridge University Press, Cambridge.
IMF. 2016. World Economic Outlook: chapter 2; “Global Trade: What’s behind the slowdown?” Washington, DC, October.
Lardy, N. 2012. Sustaining China's Economic Growth after the Global Financial Crisis. Washington, DC: Peterson Institute for International Economics.
Li, B. and Y. Liu. 2014. “Moving up the Value Chain.” Boston, MA: Boston College.
Maliszewska, M.; Olekseyuk Z.; Osorio‐Rodarte, I. 2018. “Economic and distributional impacts of comprehensive and progressive agreement for trans‐pacific partnership: the case of Vietnam.” (English, Vietnamese). Washington, D.C. : World Bank Group.
Mattoo, A. and P. Sauve. 2003. “Domestic Regulation and Service Trade Liberalization. Trade and Development, Washington, DC: World Bank.
Laget, E., A. Osnago, N. Rocha and M. Ruta. 2018. “Deep Trade Agreements and Global Value Chains.” Policy Research Working Paper; No. 8491. World Bank, Washington, DC.
Pettis, M. 2014. The Great Rebalancing: Trade, Conflict, and the Perilous Road Ahead for the World Economy. Princeton: Princeton University Press.
Ruta, M. 2017. “Preferential Trade Agreements and Global Value Chains: Theory, Evidence, and Open Questions.” Policy Research Working Paper; No. 8190. World Bank, Washington, DC.
Wang, Z., Shang‐Jin Wei, Kunfu Zhu. 2013. “Quantifying International Production Sharing at the Bilateral and Sector Levels.” NBER Working Paper No. 19677.
World Bank. 2002. “Global Economic Prospects and the Developing Countries: Making Trade Work for the World’s Poor”, Washington, DC: World Bank.

50
World Bank. 2007. “An East Asian Renaissance: Ideas for Economic Growth.”
World Bank. 2018. “Global Economic Prospects, January 2018: Broad‐Based Upturn, but for How Long?” Advance edition, Washington, DC: World Bank.
WTO (World Trade Organization). 2011. World Trade Report 2011—The WTO and preferential trade agreements: From co‐existence to coherence. Geneva: WTO.

51
ANNEX A
Table A.1. Goods and services trade
Sources: World Bank WDI and authors’ calculation. Notes: Shares of world goods and services trade (percent) and rankings in italic font.
Table A.2. Goods trade
Sources: WTO and authors’ calculation. Notes: Shares of world goods trade (percent) and rankings in italic font.
Table A.3. Services trade
Sources: WTO and authors’ calculation. Notes: Shares of world goods trade (percent) and rankings in italic font.
bil l. USD % rank bil l. USD % rank bill . USD % rank bill . USD % rank bil l. USD % rank bil l. USD % rank
Developing East Asia 378.2 5.86 1,268.6 9.80 3,386.3 15.88 388.7 6.15 1,095.7 8.58 2,955.3 14.24
China 135.4 2.10 14 788.9 6.10 3 2,431.3 11.40 1 119.9 1.90 15 648.7 5.08 4 2,045.8 9.86 2
Indonesia 53.2 0.82 27 97.4 0.75 32 181.8 0.85 30 55.9 0.88 25 85.5 0.67 30 179.7 0.87 30
Cambodia 1.1 0.02 118 4.0 0.03 109 11.1 0.05 89 1.6 0.03 113 4.6 0.04 105 11.9 0.06 93
Lao PDR 0.4 0.01 142 0.9 0.01 146 4.5 0.02 116 0.7 0.01 144 1.3 0.01 150 6.3 0.03 118
Myanmar n.a. n.a. n.a. 0.0 0.00 187 13.0 0.06 84 n.a. n.a. n.a 0.0 0.00 188 16.6 0.08 83
Mongolia 0.6 0.01 134 1.5 0.01 135 5.4 0.03 110 0.6 0.01 147 1.6 0.01 144 5.2 0.03 121
Malaysia 83.5 1.29 19 162.0 1.25 21 210.1 0.99 27 87.0 1.38 17 130.6 1.02 24 187.4 0.90 28
Philippines 26.9 0.42 37 47.6 0.37 47 82.4 0.39 41 32.7 0.52 35 53.3 0.42 42 101.9 0.49 36
Thailand 70.3 1.09 21 129.5 1.00 26 272.9 1.28 21 81.6 1.29 20 131.5 1.03 23 228.2 1.10 24
Vietnam 6.8 0.11 62 36.7 0.28 51 173.8 0.82 31 8.7 0.14 60 38.6 0.30 48 172.3 0.83 31
1995 2005 2015 1995 2005 2015
exports of goods and services imports of goods and services
bil l . USD % rank bil l . USD % rank bill . USD % rank bil l. USD % rank bil l . USD % rank bil l . USD % rank
Developing East Asia 350.0 6.77 1,183.7 11.26 3,085.7 18.71 361.2 6.83 1,062.3 9.77 2,475.7 14.79
China 148.8 2.88 10 762.0 7.25 3 2,273.5 13.79 1 132.1 2.50 11 660.0 6.07 3 1,679.6 10.03 2
Indonesia 45.4 0.88 25 87.0 0.83 30 150.4 0.91 29 40.6 0.77 24 75.7 0.70 29 142.7 0.85 29
Cambodia 0.9 0.02 113 3.1 0.03 103 8.5 0.05 89 1.2 0.02 115 3.9 0.04 101 12.6 0.08 87
Lao PDR 0.3 0.01 144 0.6 0.01 151 2.8 0.02 119 0.6 0.01 143 0.9 0.01 156 5.2 0.03 122
Myanmar 0.9 0.02 114 3.8 0.04 97 11.4 0.07 79 1.3 0.03 110 1.9 0.02 128 16.9 0.10 79
Mongolia 0.5 0.01 130 1.1 0.01 131 4.7 0.03 109 0.4 0.01 155 1.2 0.01 147 3.8 0.02 132
Malaysia 73.9 1.43 18 141.6 1.35 18 199.2 1.21 23 77.7 1.47 15 114.3 1.05 23 176.0 1.05 25
Philippines 17.5 0.34 40 41.3 0.39 44 58.8 0.36 44 28.3 0.54 34 49.5 0.46 39 70.2 0.42 38
Thailand 56.4 1.09 20 110.9 1.06 24 214.4 1.30 20 70.8 1.34 17 118.2 1.09 21 202.7 1.21 21
Vietnam 5.4 0.11 59 32.4 0.31 48 162.1 0.98 26 8.2 0.15 55 36.8 0.34 43 166.1 0.99 27
2015 1995 2005 20151995 2005
exports of goods imports of goods
bill. USD % rank bil l. USD % rank bil l. USD % rank bil l. USD % rank
Developing East Asia 144.8 5.57 383.3 8.00 166.1 6.57 591.9 12.75
China 78.0 3.00 8 216.5 4.52 5 83.3 3.30 7 433.3 9.33 2
Indonesia 12.6 0.49 36 21.6 0.45 40 22.0 0.87 26 30.8 0.66 31
Cambodia 1.1 0.04 92 3.8 0.08 80 0.6 0.02 114 1.9 0.04 106
Lao PDR 0.2 0.01 139 0.8 0.02 131 0.0 0.00 178 0.6 0.01 148
Myanmar 0.3 0.01 132 3.8 0.08 79 0.5 0.02 126 2.4 0.05 98
Mongolia 0.4 0.02 120 0.7 0.01 134 0.4 0.02 135 1.4 0.03 118
Malaysia 19.6 0.76 27 34.6 0.72 30 21.8 0.86 27 39.8 0.86 29
Philippines 8.6 0.33 46 29.0 0.61 34 6.4 0.25 50 23.4 0.50 35
Thailand 19.8 0.76 26 61.4 1.28 21 26.7 1.05 24 42.2 0.91 28
Vietnam 4.2 0.16 55 11.1 0.23 54 4.4 0.17 59 16.3 0.35 44
2005 20152005 2015
exports of services imports of services
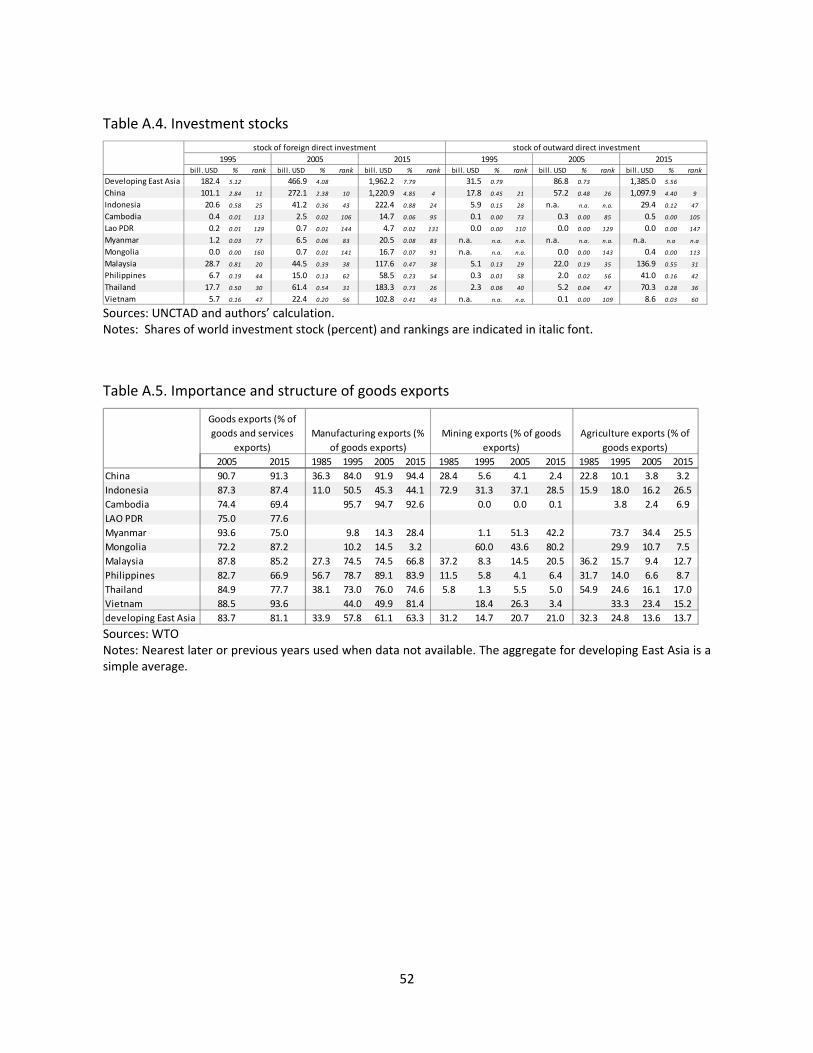
52
Table A.4. Investment stocks
Sources: UNCTAD and authors’ calculation. Notes: Shares of world investment stock (percent) and rankings are indicated in italic font.
Table A.5. Importance and structure of goods exports
Sources: WTO Notes: Nearest later or previous years used when data not available. The aggregate for developing East Asia is a simple average.
bill . USD % rank bil l. USD % rank bil l . USD % rank bill . USD % rank bil l. USD % rank bill . USD % rank
Developing East Asia 182.4 5.12 466.9 4.08 1,962.2 7.79 31.5 0.79 86.8 0.73 1,385.0 5.56
China 101.1 2.84 11 272.1 2.38 10 1,220.9 4.85 4 17.8 0.45 21 57.2 0.48 26 1,097.9 4.40 9
Indonesia 20.6 0.58 25 41.2 0.36 43 222.4 0.88 24 5.9 0.15 28 n.a. n.a. n.a. 29.4 0.12 47
Cambodia 0.4 0.01 113 2.5 0.02 106 14.7 0.06 95 0.1 0.00 73 0.3 0.00 85 0.5 0.00 105
Lao PDR 0.2 0.01 129 0.7 0.01 144 4.7 0.02 131 0.0 0.00 110 0.0 0.00 129 0.0 0.00 147
Myanmar 1.2 0.03 77 6.5 0.06 83 20.5 0.08 83 n.a. n.a. n.a. n.a. n.a. n.a. n.a. n.a n.a
Mongolia 0.0 0.00 160 0.7 0.01 141 16.7 0.07 91 n.a. n.a. n.a. 0.0 0.00 143 0.4 0.00 113
Malaysia 28.7 0.81 20 44.5 0.39 38 117.6 0.47 38 5.1 0.13 29 22.0 0.19 35 136.9 0.55 31
Philippines 6.7 0.19 44 15.0 0.13 62 58.5 0.23 54 0.3 0.01 58 2.0 0.02 56 41.0 0.16 42
Thailand 17.7 0.50 30 61.4 0.54 31 183.3 0.73 26 2.3 0.06 40 5.2 0.04 47 70.3 0.28 36
Vietnam 5.7 0.16 47 22.4 0.20 56 102.8 0.41 43 n.a. n.a. n.a. 0.1 0.00 109 8.6 0.03 60
2015 1995 2005 20151995 2005
stock of foreign direct investment stock of outward direct investment
2005 2015 1985 1995 2005 2015 1985 1995 2005 2015 1985 1995 2005 2015
China 90.7 91.3 36.3 84.0 91.9 94.4 28.4 5.6 4.1 2.4 22.8 10.1 3.8 3.2
Indonesia 87.3 87.4 11.0 50.5 45.3 44.1 72.9 31.3 37.1 28.5 15.9 18.0 16.2 26.5
Cambodia 74.4 69.4 95.7 94.7 92.6 0.0 0.0 0.1 3.8 2.4 6.9
LAO PDR 75.0 77.6
Myanmar 93.6 75.0 9.8 14.3 28.4 1.1 51.3 42.2 73.7 34.4 25.5
Mongolia 72.2 87.2 10.2 14.5 3.2 60.0 43.6 80.2 29.9 10.7 7.5
Malaysia 87.8 85.2 27.3 74.5 74.5 66.8 37.2 8.3 14.5 20.5 36.2 15.7 9.4 12.7
Philippines 82.7 66.9 56.7 78.7 89.1 83.9 11.5 5.8 4.1 6.4 31.7 14.0 6.6 8.7
Thailand 84.9 77.7 38.1 73.0 76.0 74.6 5.8 1.3 5.5 5.0 54.9 24.6 16.1 17.0
Vietnam 88.5 93.6 44.0 49.9 81.4 18.4 26.3 3.4 33.3 23.4 15.2
developing East Asia 83.7 81.1 33.9 57.8 61.1 63.3 31.2 14.7 20.7 21.0 32.3 24.8 13.6 13.7
Goods exports (% of
goods and services
exports)
Manufacturing exports (%
of goods exports)
Mining exports (% of goods
exports)
Agriculture exports (% of
goods exports)

53
Table A.6. Bilateral trade of developing East Asian countries, billion U.S. dollars
Exports
Imports
Sources: IMF DOTS.
1995 2005 2015 1995 2005 2015 1995 2005 2015 1995 2005 2015 1995 2005 2015 1995 2005 2015 1995 2005 2015
China n.a . n.a . n.a . 7,003 39,029 225,913 50,114 194,552 538,334 28,466 84,097 135,897 24,744 163,348 410,783 19,761 147,477 356,166 17,009 131,328 603,088
Indonesia 1,742 6,662 15,045 2,709 7,951 20,912 8,341 18,933 27,497 12,288 18,049 18,014 6,322 9,889 16,267 6,472 10,461 15,871 5,079 13,664 36,710
Cambodia 5 14 406 187 73 705 58 618 415 7 63 572 5 1,597 2,137 52 520 3,319 41 131 989
Lao PDR 9 24 1,225 171 317 1,958 5 12 71 5 8 92 5 4 43 33 174 245 1 16 181
Myanmar 136 136 2,597 170 2,121 4,399 300 1,678 2,789 86 113 479 79 2 146 71 260 580 218 584 1,389
Mongolia 78 513 3,897 ‐ ‐ 8 31 66 105 47 6 20 26 152 19 145 136 513 144 190 105
Malaysis 1,889 9,303 25,987 5,067 14,407 27,742 23,490 39,260 50,557 9,199 13,181 18,999 15,313 27,763 18,880 9,959 16,800 20,622 7,621 20,168 36,962
Philippines 209 4,077 6,393 1,365 4,432 4,877 2,830 9,337 14,570 2,740 7,203 12,381 6,217 7,429 8,811 3,004 7,019 7,137 832 1,683 4,125
Thailand 1,642 9,105 23,366 3,938 16,513 45,593 13,061 18,784 27,911 9,477 14,979 19,770 10,078 16,950 23,720 8,997 15,645 23,938 7,035 17,553 45,492
Vietnam 362 3,228 16,568 424 3,826 14,926 1,621 3,869 21,446 1,461 4,340 14,100 170 5,924 33,475 748 5,631 30,889 271 4,866 28,565
Western Europe OtherChina Other Developing East Asia Other East Asia Japan USA
1995 2005 2015 1995 2005 2015 1995 2005 2015 1995 2005 2015 1995 2005 2015 1995 2005 2015 1995 2005 2015
China n.a . n.a . n.a . 6,599 58,818 164,030 37,198 180,764 353,240 29,007 100,468 142,716 16,123 48,994 144,867 21,562 78,451 219,875 17,931 136,653 429,181
Indonesia 1,495 5,843 29,411 3,680 6,372 20,642 5,093 15,168 31,580 9,217 6,906 13,264 4,756 3,886 7,617 8,372 6,202 12,082 7,297 12,990 27,699
Cambodia 57 424 3,926 645 654 3,045 620 1,029 2,227 84 100 423 30 36 229 110 236 393 26 62 297
Lao PDR 22 112 1,352 315 898 5,020 31 67 468 49 21 111 2 10 26 7 52 147 4 40 106
Myanmar 680 303 3,043 320 404 1,845 890 749 2,979 173 76 883 18 11 259 173 58 445 66 185 1,177
Mongolia 45 303 1,361 2 15 119 36 82 308 45 76 275 14 37 116 56 122 377 215 539 1,239
Malaysis 1,709 13,177 33,155 3,891 14,816 25,474 18,424 28,340 41,517 21,179 16,634 13,785 12,657 14,789 14,194 12,929 14,602 20,402 5,727 11,107 25,874
Philippines 660 2,973 11,915 1,707 5,146 12,700 5,626 11,502 17,727 6,303 8,071 7,023 5,225 9,105 7,940 3,062 4,026 7,260 4,707 6,583 8,761
Thailand 2,096 11,153 40,911 4,801 16,035 30,453 11,094 15,475 23,989 21,625 26,026 31,128 8,507 8,724 13,921 11,941 12,138 22,742 8,590 26,533 35,989
Vietnam 330 5,900 49,441 952 4,844 17,702 3,999 13,616 44,989 916 4,074 14,182 130 863 7,793 819 3,484 10,924 410 3,790 17,872
China Other Developing East Asia Other East Asia Japan USA Western Europe Other

54
Table A.7. Bilateral trade of developing East Asian countries, percent of total goods trade, percent
Exports
Imports
Sources: IMF DOTS.
1995 2005 2015 1995 2005 2015 1995 2005 2015 1995 2005 2015 1995 2005 2015 1995 2005 2015 1995 2005 2015
China n.a. n.a. n.a. 4.7 5.1 9.9 33.6 25.5 23.6 19.1 11 6 16.6 21.4 18 13.3 19.3 15.6 11.4 17.2 26.4
Indonesia 3.8 7.8 10 6 9.3 13.9 18.3 22.1 18.3 27 21.1 12 13.9 11.5 10.8 14.2 12.2 10.6 11.2 16 24.4
Cambodia 1.5 0.5 4.7 52.4 2.4 8.2 16.3 20.5 4.8 1.9 2.1 6.7 1.4 52.9 24.9 14.5 17.2 38.7 11.5 4.3 11.5
Lao PDR 2.8 4.3 32.1 54.9 57 51.3 1.6 2.2 1.9 1.7 1.4 2.4 1.7 0.8 1.1 10.7 31.4 6.4 0.4 2.9 4.7
Myanmar 11.4 2.8 21 14.2 43.3 35.5 25.1 34.3 22.5 7.1 2.3 3.9 6.6 0 1.2 5.9 5.3 4.7 18.2 11.9 11.2
Mongolia 16.4 48.2 83.5 0 0 0.2 6.5 6.2 2.3 9.9 0.5 0.4 5.5 14.3 0.4 30.7 12.8 11 30.5 17.9 2.3
Malaysis 2.6 6.6 13 6.9 10.2 13.9 31.9 27.8 25.3 12.5 9.3 9.5 20.8 19.7 9.4 13.5 11.9 10.3 10.3 14.3 18.5
Phil ippines 1.2 9.9 10.9 7.9 10.8 8.3 16.3 22.6 24.8 15.8 17.5 21.1 35.8 18 15 17.3 17 12.2 4.8 4.1 7
Thailand 2.8 8.3 11.1 6.7 15 21.6 22.3 17.1 13.2 16.2 13.6 9.4 17.2 15.4 11.2 15.3 14.2 11.3 12 15.9 21.6
Vietnam 6.4 9.9 10.4 7.5 11.8 9.3 28.8 11.9 13.4 26 13.3 8.8 3 18.2 20.9 13.3 17.3 19.3 4.8 15 17.9
Western Europe OtherChina Other Developing East Asia Other East Asia Japan USA
1995 2005 2015 1995 2005 2015 1995 2005 2015 1995 2005 2015 1995 2005 2015 1995 2005 2015 1995 2005 2015
China n.a. n.a. n.a. 5 8.9 10.2 28.1 27.4 22.1 21.9 15.2 8.9 12.2 7.4 9 16.3 11.9 13.7 13.6 20.7 26.8
Indonesia 3.7 10.1 20.6 9.1 11 14.5 12.5 26.3 22.1 22.7 12 9.3 11.7 6.7 5.3 20.6 10.7 8.5 18 22.5 19.4
Cambodia 3.6 16.6 35 41 25.7 27.1 39.4 40.4 19.9 5.4 3.9 3.8 1.9 1.4 2 7 9.3 3.5 1.6 2.4 2.6
Lao PDR 3.7 9.3 18.7 53.4 74.8 69.4 5.2 5.6 6.5 8.3 1.7 1.5 0.3 0.9 0.4 1.2 4.4 2 0.7 3.3 1.5
Myanmar 29 16.7 28.1 13.7 22.3 17 38 41.4 27.5 7.4 4.2 8.2 0.8 0.6 2.4 7.4 3.2 4.1 2.8 10.2 10.9
Mongolia 10.7 25.8 35.8 0.5 1.3 3.1 8.7 7 8.1 10.9 6.4 7.2 3.5 3.1 3.1 13.6 10.4 9.9 51.8 45.8 32.6
Malaysis 2.2 11.6 18.8 5 13 14.5 23.7 24.9 23.6 27.3 14.6 7.8 16.3 13 8.1 16.7 12.9 11.6 7.4 9.8 14.7
Phil ippines 2.3 6.3 16.2 6 10.9 17.3 19.9 24.3 24.2 22.3 17 9.6 18.5 19.2 10.8 10.8 8.5 9.9 16.6 13.9 11.9
Thailand 2.7 9.4 20.3 6.2 13.6 15.1 14.4 13.1 11.9 28.1 22 15.4 11 7.4 6.9 15.5 10.3 11.3 11.1 22.5 17.8
Vietnam 3.9 16 28.1 11.4 13.2 10.1 47.8 37 25.6 11 11.1 8.1 1.6 2.3 4.4 9.8 9.5 6.2 4.9 10.3 10.2
China Other Developing East Asia Other East Asia Japan USA Western Europe Other
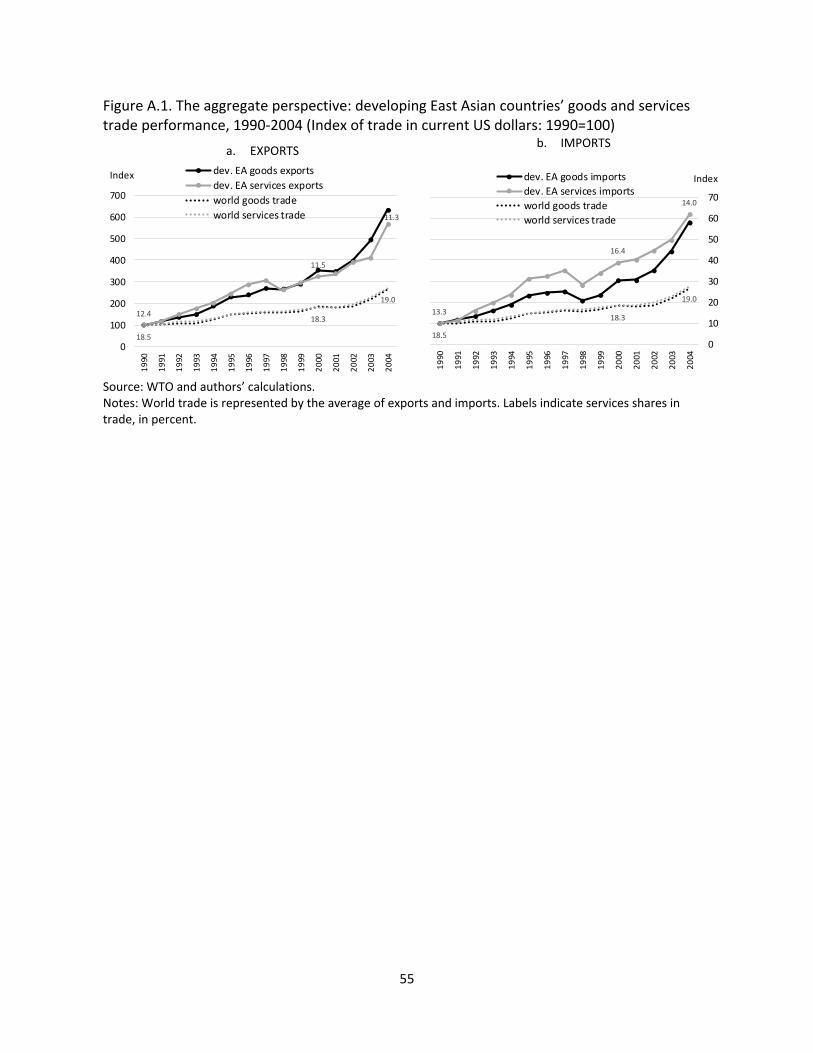
55
Figure A.1. The aggregate perspective: developing East Asian countries’ goods and services trade performance, 1990‐2004 (Index of trade in current US dollars: 1990=100)
a. EXPORTS b. IMPORTS
Source: WTO and authors’ calculations. Notes: World trade is represented by the average of exports and imports. Labels indicate services shares in trade, in percent.
12.4
11.5
11.3
18.5
18.3
19.0
0
100
200
300
400
500
600
700
1990
1991
1992
1993
1994
1995
1996
1997
1998
1999
2000
2001
2002
2003
2004
dev. EA goods exports
dev. EA services exports
world goods trade
world services trade
Index
13.3
16.4
14.0
18.5
18.3
19.0
0
10
20
30
40
50
60
70
1990
1991
1992
1993
1994
1995
1996
1997
1998
1999
2000
2001
2002
2003
2004
dev. EA goods imports
dev. EA services imports
world goods trade
world services trade
Index

56
ANNEX B
The estimation equation used in sub‐section 3c is the one in Constantinescu, Mattoo and Ruta (2017) (Eq. 1) and it is derived from a production function that relates value added VAc,s,t in industry s in country c and year t to capital, Kc,s,t,, labor, Lc,s,t, and a technology shifter Ac,s,t . The reduced form is obtained by dividing both sides of the production function by Lc,s,t , taking logs and adding fixed effects. The technology shifter is driven in part by a range of trade‐related determinants (θ1, θ2,, θn), that capture both traditional trade and trade occurring in a GVC context. These are our variables of interest, of which the most important one is the proxy for backward GVC participation. To assess whether the impact of trade on labor productivity differs for developing East Asian countries compared to the average country in the world, we interact the technology shifter with country and region dummies for East Asia.
ln , , ∗ ln / , , ∑ ∗ ln , , , , , , , , (1)
Labor productivity ‐ computed as nominal value added divided by employment ‐ and the nominal capital stock per employee are denoted by LP and K, respectively.23 The GVC variable of interest is captured by the foreign value added embodied in gross exports (backward GVC participation), computed by applying Leontief’s approach to synthetically derived international input‐output tables (Hummels, Ishi and Yi 2001; Koopman, Wang, and Wei 2014; Leontief 1936). The trade‐related variables are lagged by one period as their effect on labor productivity may not be instantaneous and to alleviate reverse causality. A range of unobserved determinants, such as, for instance, labor market reforms, global technology shocks, and time‐invariant technology differences across countries and industries, are captured by three types of fixed effects (FE): country‐industry, country‐year and industry‐year.
Equation (1) is estimated sequentially, in three steps, as we explore several measures of the trade‐related determinants of the technology shifter Ac,s,t. While this approach provides an overall perspective of the trade‐productivity nexus, it is ultimately intended to minimize the problem of omitted variables in the regressions. We start from trade indicators of broad scope and work our way towards specifications that allow for greater focus on the GVC‐related trade. The first specification includes overall imports and exports of goods and services. In the second one, we split imports and exports into: imports of final goods, imports of intermediates, exports of final goods and exports of intermediates. The third and final specification focuses on imports, and splits them into imports of final goods, imports of intermediates that are absorbed domestically and imports of intermediates that are embodied in the exports. The latter component is the GVC‐related trade measuring the backward participation in GVCs.
23 Note here a departure from the method in Constantinescu, Mattoo and Ruta (2017) that relies on data from WIOD, which includes price deflators. Price deflators by country, sector and year are unavailable in our case, so we use nominal indicators and assume that the price effects are absorbed in part by the sector‐year fixed effects (Rodrik, 2013).