Embed Size (px)
Citation preview

Policy Research Working Paper 6007
Trade Causes Growth in Sub-Saharan AfricaMarkus BrücknerDaniel Lederman
The World BankPoverty Reduction and Economic Management NetworkInternational Trade DepartmentMarch 2012
WPS6007P
ublic
Dis
clos
ure
Aut
horiz
edP
ublic
Dis
clos
ure
Aut
horiz
edP
ublic
Dis
clos
ure
Aut
horiz
edP
ublic
Dis
clos
ure
Aut
horiz
edP
ublic
Dis
clos
ure
Aut
horiz
edP
ublic
Dis
clos
ure
Aut
horiz
edP
ublic
Dis
clos
ure
Aut
horiz
edP
ublic
Dis
clos
ure
Aut
horiz
ed

Produced by the Research Support Team
Abstract
The Policy Research Working Paper Series disseminates the findings of work in progress to encourage the exchange of ideas about development issues. An objective of the series is to get the findings out quickly, even if the presentations are less than fully polished. The papers carry the names of the authors and should be cited accordingly. The findings, interpretations, and conclusions expressed in this paper are entirely those of the authors. They do not necessarily represent the views of the International Bank for Reconstruction and Development/World Bank and its affiliated organizations, or those of the Executive Directors of the World Bank or the governments they represent.
Policy Research Working Paper 6007
In the 1990s the mainstream consensus was that trade causes growth. Subsequent research shed doubt on the consensus view, as evidence suggested that the identification of the effect of trade on growth was problematic in the existing literature. This paper contributes to this debate by focusing on growth in Sub-Saharan Africa. It estimates the effect of openness to international trade on economic growth with panel data. Employing instrumental variables techniques that correct
This paper is a product of the International Trade Department, Poverty Reduction and Economic Management Network. It is part of a larger effort by the World Bank to provide open access to its research and make a contribution to development policy discussions around the world. Policy Research Working Papers are also posted on the Web at http://econ.worldbank.org. The author may be contacted at [email protected].
for endogeneity bias, the empirical evidence suggests that within-country variations in trade openness cause economic growth: a 1 percentage point increase in the ratio of trade over gross domestic product is associated with a short-run increase in growth of approximately 0.5 percent per year; the long-run effect is larger, reaching about 0.8 percent after ten years. These results are robust to controlling for country and time fixed effects as well as political institutions.

Trade Causes Growth in Sub-Saharan Africa
by
Markus Brückner and Daniel Lederman*
Key words: Trade, Growth, Africa
JEL codes: E2, F1
Sector Board : EPOL
* National University of Singapore (Brückner), and World Bank (Lederman). We gratefully acknowledge comments
from Bernard Hoekman.

2
1. Introduction
Frankel and Romer (1999) showed that exogenous cross-country variations in international trade
were positively correlated with GDP per capita across countries. Their identification strategy relied
on the gravity model of trade, whereby bilateral geographic distances between trading partners was
used as an exogenous instrument for each country‟s volume of trade. However, subsequent research
argued that these geographic instruments were closely correlated with countries' historical
experiences during colonial times, which in turn help explain the international differences in
governance and institutions (Acemoglu et al., 2001). Rodrik et al. (2004) thus argued, and showed
empirically, that “institutions rule”: once the institutional channel is controlled for, international
trade appears to have no impact on GDP per capita across countries. Furthermore, Rodriguez and
Rodrik (2001) also had shed doubts on highly cited papers that argued that international trade is
associated with higher growth rates of total factor productivity or GDP per capita. Rodriguez and
Rodrik argued that this influential literature suffered from fatal flaws, including the endogeneity of
international trade and other specification and econometric problems.1
Moreover, doubts are further justified by biases arising from omitted variables in cross-
sectional growth regressions.2 Even the econometric estimates in the seminal papers by Acemoglu
et al. (2001) and Rodrik et al. (2004) may be suspect. What is needed to advance the debate on the
growth effects of openness to international trade is an estimation strategy that controls for time-
invariant country characteristics. We exploit, using panel data, within-country variations in
countries' trade openness and GDP per capita. By exploiting these within-country variations, we are
able to control for country fixed effects, which account for any time-invariant country
characteristics that affect both international trade and economic growth. The panel fixed effects
approach is, therefore, an important step forward to uncovering causal effects of trade openness on
1 For some further readings see, for example, Edwards (1993), Vamvakidis (2002), Alcala and Ciccone (2004), or
Wacziarg and Welch (2008). It is also noteworthy that in the past decade there have been a number of papers that
documented, using firm-level data, the effects of exporting on firms' productivity and employment. For some
examples, see Van Biesebroeck (2005), Verhoogen (2008), Fernandez (2007), or Lileeva and Trefler (2010).
2 See, for example, Levine and Renelt (1992) or Ciccone and Jarocinsky (2011).

3
economic growth.
To uncover causal effects of openness on economic growth, we, of course, also need to
tackle endogeneity biases that arise from reverse causality and within-country omitted variables. To
do so, we deploy two complementary instrumental variables (IV) strategies. The first IV strategy
uses rainfall as an instrument for GDP per capita in Sub-Saharan Africa (SSA) to estimate the
response of trade openness to within-country variations in GDP per capita. This IV strategy builds
on prior literature that has established a robust effect of rainfall on SSA countries' GDP per capita.3
The IV strategy enables us to obtain useful information on the extent to which international trade is
itself a function of SSA countries' GDP per capita. It enables us, furthermore, to compute a residual
trade openness variable that, by construction, is exogenous to within-country variations in GDP per
capita. In our first IV strategy, we use this residual trade openness variable as an instrument to
estimate the within-country growth effect of openness to international trade.
The second IV strategy, that is complementary to the first IV strategy, uses the GDP growth
rates of OECD countries as an instrument for international trade openness of SSA economies.
Higher real GDP growth of OECD countries can increase trade openness of SSA countries through
two main channels: the supply channel (higher OECD GDP growth increases OECD countries
exports of goods and services) and the demand channel (higher OECD GDP growth leads to an
increase in the consumption of goods and services produced by Sub-Saharan African countries).
The fact that Sub-Saharan African countries' GDP is only a tiny fraction of OECD countries' GDP
ensures that variations in OECD countries' GDP growth are plausibly exogenous to within-country
variations of Sub-Saharan African countries' openness to international trade.
The main finding is that greater openness to international trade causes economic growth in
Sub-Saharan Africa. The instrumental variables estimates suggest that, on average, a one percentage
point increase in the ratio of exports plus imports over GDP in SSA countries is associated with a
3 See Miguel et al. (2004), Barrios et al. (2010), and Bruckner and Ciccone (2011).
4
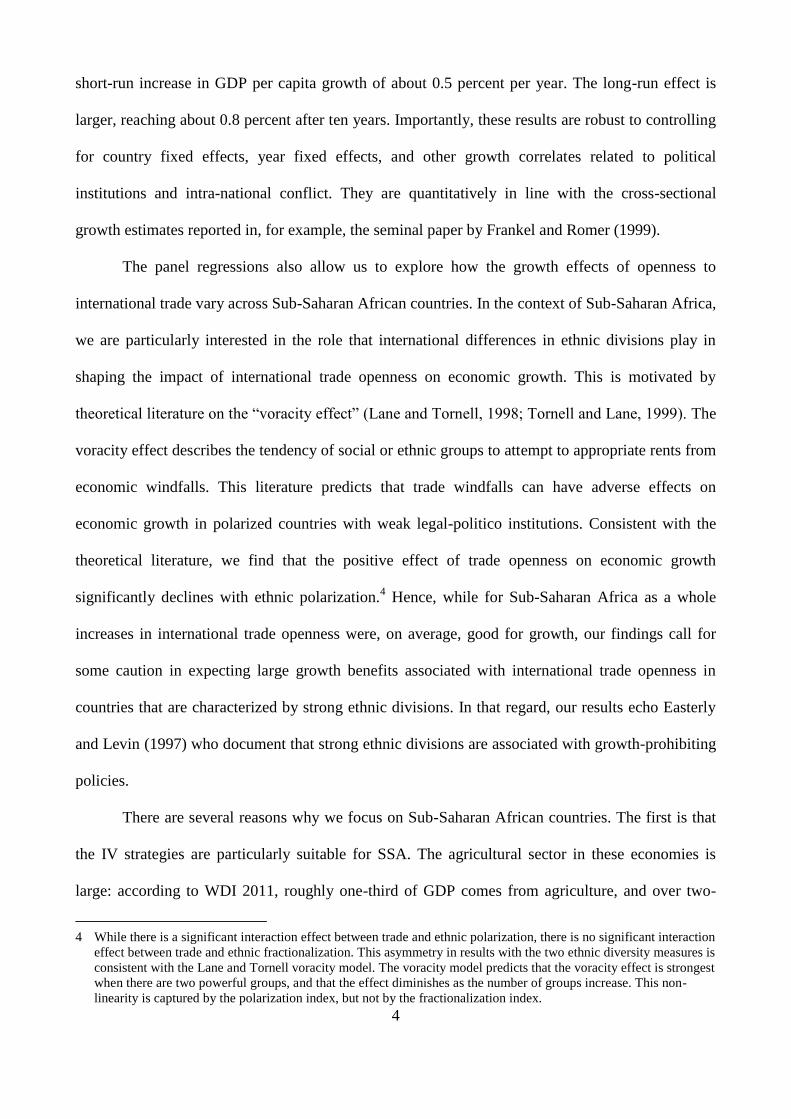
short-run increase in GDP per capita growth of about 0.5 percent per year. The long-run effect is
larger, reaching about 0.8 percent after ten years. Importantly, these results are robust to controlling
for country fixed effects, year fixed effects, and other growth correlates related to political
institutions and intra-national conflict. They are quantitatively in line with the cross-sectional
growth estimates reported in, for example, the seminal paper by Frankel and Romer (1999).
The panel regressions also allow us to explore how the growth effects of openness to
international trade vary across Sub-Saharan African countries. In the context of Sub-Saharan Africa,
we are particularly interested in the role that international differences in ethnic divisions play in
shaping the impact of international trade openness on economic growth. This is motivated by
theoretical literature on the “voracity effect” (Lane and Tornell, 1998; Tornell and Lane, 1999). The
voracity effect describes the tendency of social or ethnic groups to attempt to appropriate rents from
economic windfalls. This literature predicts that trade windfalls can have adverse effects on
economic growth in polarized countries with weak legal-politico institutions. Consistent with the
theoretical literature, we find that the positive effect of trade openness on economic growth
significantly declines with ethnic polarization.4 Hence, while for Sub-Saharan Africa as a whole
increases in international trade openness were, on average, good for growth, our findings call for
some caution in expecting large growth benefits associated with international trade openness in
countries that are characterized by strong ethnic divisions. In that regard, our results echo Easterly
and Levin (1997) who document that strong ethnic divisions are associated with growth-prohibiting
policies.
There are several reasons why we focus on Sub-Saharan African countries. The first is that
the IV strategies are particularly suitable for SSA. The agricultural sector in these economies is
large: according to WDI 2011, roughly one-third of GDP comes from agriculture, and over two-
4 While there is a significant interaction effect between trade and ethnic polarization, there is no significant interaction
effect between trade and ethnic fractionalization. This asymmetry in results with the two ethnic diversity measures is
consistent with the Lane and Tornell voracity model. The voracity model predicts that the voracity effect is strongest
when there are two powerful groups, and that the effect diminishes as the number of groups increase. This non-
linearity is captured by the polarization index, but not by the fractionalization index.

5
thirds of the population is employed in agriculture, which makes rainfall a powerful instrument as a
determinant of SSA growth. Research by Barrios et al. (2010) has shown that the significant effects
of rainfall on GDP are limited to the Sub-Saharan African region; this in turn implies that the
rainfall IV strategy used in this paper is limited to the Sub-Saharan African region. Also, Sub-
Saharan African GDP is only a tiny fraction of OECD GDP. Hence, GDP growth of OECD
countries is plausibly exogenous to variations in Sub-Saharan African countries' openness to
international trade. It is questionable whether OECD GDP growth is exogenous to changes in
international trade openness of other developing regions, such as Asia or Latin America. These
economies are in GDP terms much larger than Sub-Saharan African economies.
In addition, it is important to note the significant policy interest in factors associated with
economic growth in Sub-Saharan Africa. SSA is lagging other regions in terms of poverty
reduction, though with signs of progress since the mid-1990s (Chen and Ravallion, 2010). It is,
therefore, understandable from the perspective of the Millennium Development Goals that there is a
significant policy interest in factors driving economic growth in Sub-Saharan Africa. Openness to
international trade is one of these factors; see, for example, the Africa Competitiveness Report
(2011), IMF (2011), or World Bank (2011, 2012). Although international trade is cited as a key
factor in numerous reports issued by these organizations, the policy recommendations cover not
only the need for further reductions in import tariffs but also a broad policy agenda aiming to
reduce the costs of international trade.5 Some of these recommendations might entail some costs,
either fiscal costs associated with the reduction of tariffs or with needed public investments in
infrastructure. Hence the gains from trade in terms of economic growth seems like an important
consideration, especially because it is unlikely that most policy interventions that would raise the
incidence of international trade in GDP will not be subject to impact evaluations. Our paper seeks to
contribute to this important policy debate -- from an empirical angle -- by using panel data
5 It is also noteworthy that, on average, African economies have the highest import tariffs in the world. See, for
example, Figure 3.3 in the World Bank‟s 2009 World Development Report.

6
regressions and novel IV strategies. The hope is that the results will add to our understanding of
how and to what extent exogenous increases in international trade cause economic growth in Sub-
Saharan Africa.
The rest of the paper is organized as follows. Section 2 discusses the data. Section 3 presents
our estimation and identification strategies. Section 4 discusses the results from the baseline
estimates linking trade openness with economic growth, which are used to compute residuals that
are later used as IVs in the growth models. Rainfall is used as an IV for growth in Sub-Saharan
Africa in this section. Section 5 presents the results on the effects of trade openness on growth,
followed by a discussion of the role of ethnic divisions, as well as the results from our second IV
estimations that rely on the GDP growth of OECD countries as an exogenous determinant of
African trade openness. Section 6 concludes.
2. Data
The key variables for the subsequent econometric analyses are trade and GDP in developing and
developed countries, with latter used as an IV. Rainfall is the other instrumental variable. In
addition, we also include variables related to political institutions and ethnic polarization and
fractionalization as additional controls and to test for heterogeneity in coefficient estimates. The
following paragraphs describe the relevant data, their sources and the variable definitions.
Trade Openness and GDP. We obtain data on trade openness and real GDP per capita from
the Penn World Table, version 7.0 (Heston et al., 2011). Following Ciccone and Alcala, we measure
trade openness as the sum of exports plus imports (in constant US dollar) over PPP GDP.
Rainfall. Our data on year-to-year variations in rainfall are from the National Aeronautics
and Space Administration (NASA) Global Precipitation Climatology Project (GPCP), version 2.1
(Adler et al., 2003). These data are available from 1979 and to 2009. The rainfall data come on a
2.5°x2.5° latitude-longitude grid. We aggregate the data to the country level by assigning grids to
7
the geographic borders of countries. We use satellite-based rainfall data because these data have a
number of important advantages over gauge-station based rainfall data. As pointed out in Bruckner
and Ciccone (2011) satellite-based rainfall data are less likely to suffer from measurement error that
is due to the sparseness of operating gauge stations in Sub-Saharan African countries (especially
after 1990). Also, as Bruckner and Ciccone (2011) point out, the number of operating gauge
stations in a country may be affected by socio-economic conditions, which could lead to non-
classical measurement error in gauge-station based rainfall data.
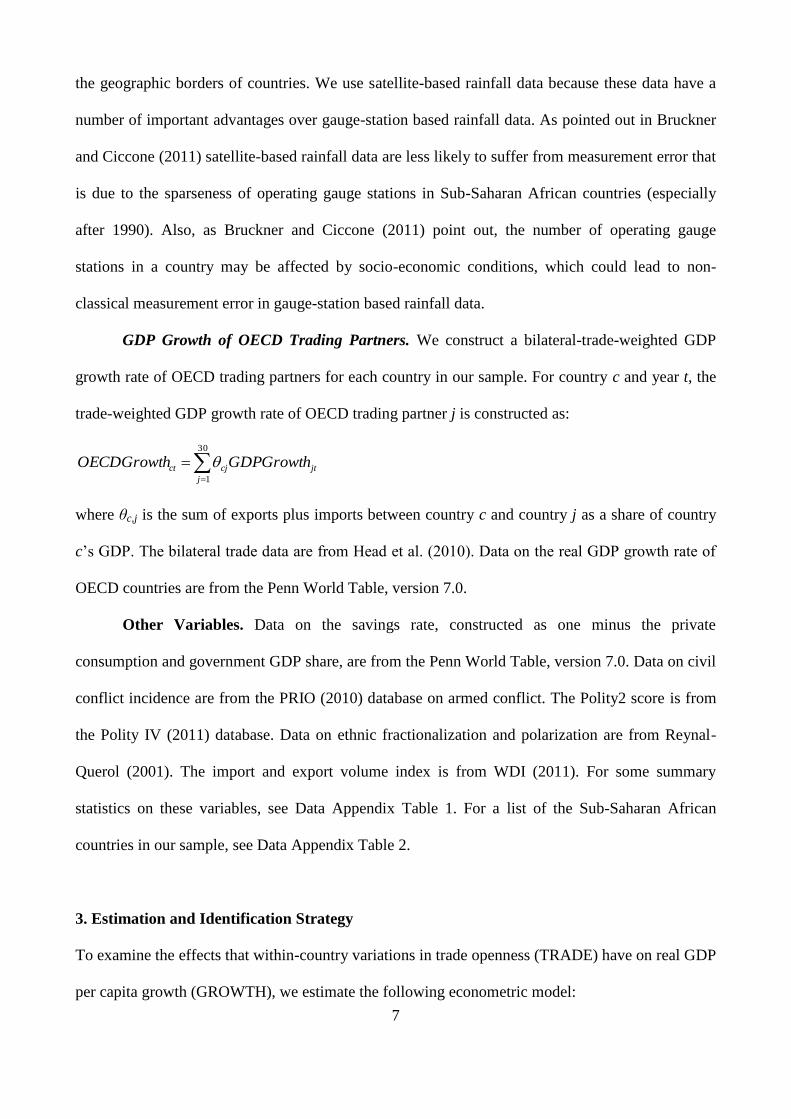
GDP Growth of OECD Trading Partners. We construct a bilateral-trade-weighted GDP
growth rate of OECD trading partners for each country in our sample. For country c and year t, the
trade-weighted GDP growth rate of OECD trading partner j is constructed as:
jt
j
cjct GDPGrowthOECDGrowth
30
1
where θc,j is the sum of exports plus imports between country c and country j as a share of country
c‟s GDP. The bilateral trade data are from Head et al. (2010). Data on the real GDP growth rate of
OECD countries are from the Penn World Table, version 7.0.
Other Variables. Data on the savings rate, constructed as one minus the private
consumption and government GDP share, are from the Penn World Table, version 7.0. Data on civil
conflict incidence are from the PRIO (2010) database on armed conflict. The Polity2 score is from
the Polity IV (2011) database. Data on ethnic fractionalization and polarization are from Reynal-
Querol (2001). The import and export volume index is from WDI (2011). For some summary
statistics on these variables, see Data Appendix Table 1. For a list of the Sub-Saharan African
countries in our sample, see Data Appendix Table 2.
3. Estimation and Identification Strategy
To examine the effects that within-country variations in trade openness (TRADE) have on real GDP
per capita growth (GROWTH), we estimate the following econometric model:
8
(1) GROWTHi,t = αi + βt + κi t + ηTRADEit +θRainfallit + ΓXi,t+ uit
where αi are country fixed effects that account for cross-country differences in geography, history,
ethnicity and other time-invariant determinants of economic growth such as initial income per
capita levels. The year fixed effects, βt, capture common year shocks that affect both GDP per
capita growth and trade openness across all countries, for example, common shocks to economic
growth that are due to changes in the world business cycle or political events such as the end of the
Cold War. κi t is a country-specific linear time trend that captures additional within-country time
series variation. The vector Xi,t includes within-country variations in political institutions and civil
conflict incidence. The error term, uit, is clustered at the country level to allow for arbitrary serial
correlation.
As a baseline, we estimate the average marginal effect η that within-country variations in
trade openness have on economic growth. We then examine lagged effects of trade openness on
economic growth by means of a distributed lag model where we include further lags of trade
openness on the right-hand side of the estimating equation. By doing so, we can examine both
short-run and longer-run growth effects of trade openness.
A necessary condition for consistent estimation of the growth effects of trade openness is
that variations in trade openness are exogenous to economic growth. If economic growth itself has
an effect on trade openness, then least squares estimation of η will not yield a consistent estimate.
We employ two different, but complimentary, strategies to deal with this. The first strategy consists
in directly estimating the response of trade openness to economic growth:
(2) Tradeit = ai + bt + ci t + δGrowthit +γOECDGrowthit +ΛXi,t + eit
If in equation (1) η≠0, then least squares estimation of equation (2) will not provide a consistent
estimate of δ. We employ, therefore, a two-stage least squares estimation approach to equation (2),
instrumenting GDP growth with year-to-year variations in rainfall. This instrument has been used in
previous work by Miguel et al. (2004) and Brückner and Ciccone (2011). These authors use rainfall
9
to examine how GDP shocks affect civil war risk and within-country variations in political
institutions in Sub-Saharan African countries. Barrios et al. (2010) show that rainfall's significant
effect on GDP is limited to the group of Sub-Saharan African countries; in other continental
regions, such as Asia or Latin America, there is no significant average effect. Given the limited
effect of rainfall on income of other countries, our first estimation strategy focuses only on Sub-
Saharan African countries.
The exclusion restriction in the two-stage least squares estimation of equation (2) is that
conditional on GDP per capita growth, year-to-year variations in rainfall only affect trade openness
through their GDP per capita growth effects. We will discuss and examine this exclusion restriction
in detail in the section that follows.6
With a consistent estimate of δ in hand, we can use the residual variation in trade openness
that is not due to economic growth, eit, as an instrumental variable for trade openness in equation
(1). By construction, this residual variation in trade openness is not driven by economic growth.
Using this residual variation as an instrument in equation (1) eliminates biases that arise from a
reverse effect of economic growth on trade openness. This first estimation strategy is commonly
used in the business-cycle literature. See, for example, Blanchard and Perotti (2004) with an
application to cyclically adjusted tax revenues; or Bruckner (2011) with an application to estimating
the effects of foreign aid on economic growth.
Exogeneity of within-country variations in trade openness to economic growth is a
necessary condition for consistent estimation of the growth effects of trade openness. However, it is
not a sufficient condition. If there are time-varying variables that affect: (i) trade openness beyond
economic growth; and (ii) economic growth beyond trade openness -- then the first estimation
6 We do not use variations in international commodity prices as instruments for economic growth (as has been done
for example in Bruckner and Ciccone (2010) in the context of civil wars). The reason for this is that variations in the
international commodity prices are likely to have direct effects on trade openness -- through changes in the relative
price of tradables to non-tradables.

10
strategy suffers from an omitted variables bias.7
In the cross-section of countries, one example of bias arising from omitted variables are
countries' geographic characteristics. Another example are countries' historical characteristics. Note
however that in our estimation framework we control for country fixed effects. Therefore, time-
invariant variables, such as history and geography, do not constitute a source of omitted variables
bias in our regressions.
What about time-varying factors? The year fixed effects capture Sub-Saharan Africa wide
changes in political institutions, global business-cycle effects, as well as global events such as the
end of the Cold War. Thus these Sub-Saharan Africa wide factors are not part of the error term.
Nevertheless, there could be country-specific factors which are time-varying that constitute an
omitted variable in the sense of fulfilling conditions (i) and (ii). Take, for example, country-specific
episodes of policy reform. These country-specific episodes of policy reform could be associated
with reforms in trade policy as well as other reforms such as, for example, reforms of financial
sector regulation or changes in fiscal and monetary policy. However, by itself the presence of such
waves of policy reform does not imply that conditions (i) and (ii) are fulfilled. If these waves of
policy reforms only affect economic growth, then they would not be part of the error term, eit, in
equation (2). It would be a different case, of course, if these trade policies also affect the
distribution of income, for example, and changes in the income distribution affect trade openness
beyond economic growth.
To address concerns of bias arising from time-varying omitted variables, our second strategy
relies on the variable we labeled OECDGROWTHit – the trade-weighted real GDP growth rate of
OECD trading partners (see Section 2 for details on how this instrument is constructed) – which we
use as an instrument for trade openness. The assumption is that changes in economic conditions of
7 Note that both, conditions (i) and (ii) have to be fulfilled for the IV estimation strategy to suffer from omitted
variable bias. This is stricter than in least squares estimation of, say, equation (1). In the least squares estimation of
equation (1), omitted variables bias would imply that only condition (i) is satisfied. For omitted variables bias in the
IV estimation both conditions (i) and (ii) have to be satisfied.

11
non-OECD countries have negligible effects on the GDP growth rate of OECD countries. For the
group of Sub-Saharan African countries this exogeneity assumption is plausible: for all years since
1960, the GDP of the group of Sub-Saharan African countries is less than 3 percent of OECD GDP;
and the GDP of the largest Sub-Saharan African economy (South Africa) is less than 1 percent of
OECD GDP (WDI, 2011).
The exclusion restriction is that OECDGROWTHit should only affect Sub-Saharan African
countries' GDP growth through trade openness. With regard to this exclusion restriction, the year
fixed effects are an important ingredient in our estimating framework since they pick up Sub-
Saharan Africa-wide variation in GDP growth that is due to OECD-wide growth in GDP. The
instrumental variables regressions that use OECDGROWTHit as an instrumental variable therefore
only use variations in OECD countries' GDP growth that is specific to each Sub-Saharan African
country. That is, these are country-specific variations in GDP growth. They arise precisely because
bilateral trade flows between each OECD and Sub-Saharan African country are country specific.
It is important to note that we use time-invariant bilateral trade flows to construct the trade-
weighted OECD GDP growth instrument. Using time-invariant bilateral trade flows ensures that
within-country variations in Sub-Saharan African countries' GDP growth do not affect the
OECDGROWTH instrument. We use the 2000 value of bilateral trade flows to maximize the
number of bilateral trade flow observations. However, for robustness purposes, we will also present
results that use initial, i.e. pre-determined, trade flows to construct the OECDGROWTH instrument.
4. The Response of Trade Openness to Economic Growth
We begin our empirical analysis by estimating the response of trade openness to within-country
variations in real GDP per capita growth. In turn, we discuss the quality of our instrumental
variable, rainfall, when estimating the response of trade openness to within-country GDP per capita
growth.
12
4.1 Baseline Estimates
This exercise quantifies the response of trade openness to economic growth. As discussed in
Section 3, with an estimate of the response of trade openness to economic growth in hand, we can
construct a series of trade openness that is exogenous to economic growth.
Table 1 presents our instrumental variables estimates of the within-country effect that
economic growth has on trade openness. Column (1) reports panel data estimates that control for
country fixed effects only. Column (2) adds year fixed effects, and column (3) adds country-specific
linear time trends. The main finding is that economic growth has a significant negative effect on
trade openness. The estimated coefficient in column (3) implies that on average a one percentage
point higher GDP per capita growth rate was associated with a 1.8 percentage points lower GDP
share of imports plus exports.
In column (4) we show that there continues to be a significant negative effect of economic
growth on trade openness when controlling for lagged trade openness. The coefficient on lagged
trade openness is positive and significant at the 1 percent level. The estimated coefficient, 0.75,
implies an average half-life of shocks to trade openness of about 2.5 years. In this dynamic
specification, the estimated impact response of trade openness to economic growth is -0.88. Hence,
according to this dynamic panel specification, there is an approximately one-to-one relationship
between trade openness and economic growth. On the one hand, this one-to-one relationship is not
surprising: GDP is in the denominator of the trade openness variable; thus, in the absence of a
reaction in exports and imports to GDP growth, one would expect precisely such a negative one-to-
one relationship. On the other hand, the negative response of trade openness to economic growth,
while perhaps not surprising from a purely theoretical point of view, is an important empirical
result: it implies that when estimating the within-country effect that trade openness has on
economic growth, there is a negative reverse causality bias that downward biases the least squares
estimate of the causal effect that trade openness has on economic growth.

13
We demonstrate that this first finding is robust to controlling for the incidence of civil
conflict, political institutions, and the GDP growth of OECD trading partners in column (5). Neither
civil conflict incidence nor countries' Polity2 scores are significantly correlated with trade openness.
However, GDP growth of OECD trading partners has a significant positive effect on Sub-Saharan
African countries' trade openness. In particular, this significant estimate shows that, beyond an
effect that GDP growth of OECD countries has on GDP growth of Sub-Saharan African countries,
there is a direct effect on Sub-Saharan African countries' trade openness.
In column (6) of Table 1 we show that GDP growth continues to have a significant negative
effect on trade openness when excluding the top and bottom 1 percentile of rainfall observations.
Our finding of a negative effect of economic growth on trade openness is thus robust to excluding
extreme drought and flood years. Quantitatively, the estimated coefficient on GDP growth, -1.08, is
significantly different from zero at the 5 percent level. However, it is not significantly different
from -1 (p-value 0.85). This reconfirms our previous finding that there is an approximately one-to-
one relationship between GDP growth and trade openness of Sub-Saharan African countries.
For comparison purposes, we report in Panel B of Table 1 least squares and system-GMM
estimates. These estimates are also negative in sign and statistically significant for most
specifications. However, quantitatively, they are less than half the size of the instrumental variables
estimates that we reported in Panel A of Table 1. One reason for this difference in size is reverse
causality bias: if trade openness has a positive effect on economic growth than the least squares and
system-GMM estimates are upward bias. The instrumental variables estimates that use rainfall as an
instrument for GDP growth do not suffer from this reverse causality bias because year-to-year
variations in rainfall are exogenous to economic conditions of Sub-Saharan African countries.
Another reason for the quantitatively larger (in absolute value) instrumental variables estimates is
measurement error. It is well known that national accounts statistics of Sub-Saharan African
countries are plagued by measurement error. To the extent that this measurement error is classical,
14
it will attenuate the least squares estimates towards zero but not the instrumental variables
estimates.
4.2 Discussion of Instrument Quality
The quality of rainfall as an instrument for GDP growth in terms of first-stage fit is reasonable. The
first-stage estimates on rainfall's effect on GDP growth are positive and significant at the 1 percent
level; the joint first-stage F-statistic on rainfall is around 10 in column (3) and around 9 in the
columns that follow. According to the tabulations in Stock and Yogo (2005), this F-statistic implies
that we can reject the hypothesis that the IV size distortion is larger than 15 percent (the second
most stringent criteria listed in Stock and Yogo) at the 5 percent significance level.
What about the exclusion restriction? The assumption in the instrumental variables
regression is that rainfall only affects trade openness through its effect on GDP growth. To examine
empirically whether there are any significant effects of rainfall on trade openness beyond GDP
growth, we follow Acemoglu et al. (2008) and use the savings rate as an additional instrument for
GDP growth. It seems clear that the savings rate is not as exogenous to politico-economic
conditions as is rainfall. This is the main reason why our instrumental variables analysis relies on
rainfall as an instrument for GDP growth. Also, as is well understood, tests of the exclusion
restriction are not bullet-proof evidence that indeed instruments are valid. This is because these are
joint tests and they require at least one valid instrument.
With these caveats in mind, we report in column (1) of Table 2 instrumental variables
estimates that use rainfall as well as the savings rate as instrumental variables for GDP growth. The
estimated coefficient on GDP growth, -1.42, is significant at the 1 percent level. And the p-value on
the Hansen J-test is 0.57. Hence, the Hansen J test does not reject the null that the instruments are
jointly valid. To show also in a more intuitive way that, indeed, rainfall's effect on trade openness
beyond economic growth is statistically insignificant and quantitatively small we report in column
15
(2) of Table 2 estimates where we include rainfall directly in the second stage. For comparison
purposes, we report in column (3) the reduced-form estimates of rainfall on trade openness. The
estimates on rainfall in column (2) are less than 15 percent the size of the reduced-form estimates in
column (3). Hence, conditional on economic growth we find that rainfall has only very small effects
on trade openness. And statistically, these effects are insignificant: the p-value in column (2) on
rainfall is 0.57. We now turn to reporting our estimates of the within-country effect that trade
openness has on economic growth.
5. The Effects of Trade Openness on Economic Growth
The preceding analysis in Section 4.1 revealed that the commonly used measure of trade openness
(the GDP share of imports plus exports) is strongly endogenous to within-country variations in
GDP per capita growth. In particular, the previous analysis revealed that there is a nearly one-to-one
negative relationship between trade openness and countries' GDP per capita growth. Hence, least
squares estimation of the within-country effect of trade openness on economic growth is downward
biased.
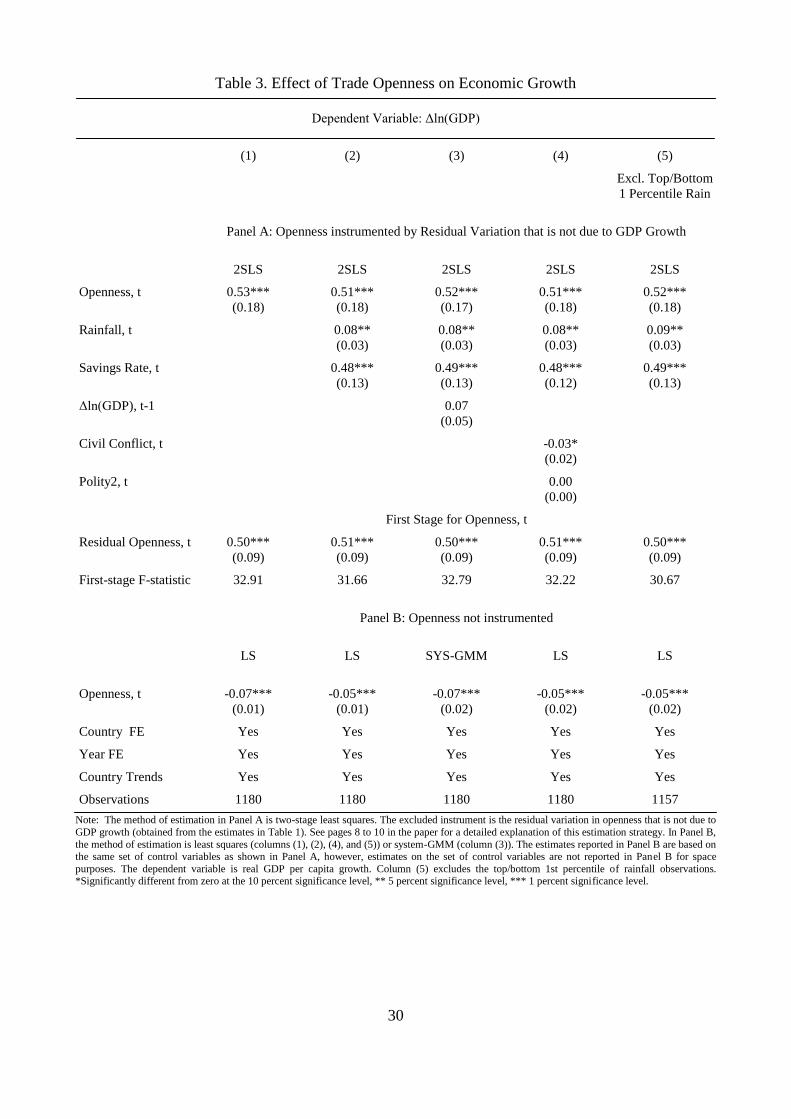
To correct for this negative reverse causality bias, we report in Panel A of Table 3
instrumental variables estimates that use the residual variation in trade openness which is not due to
economic growth (see Section 2 for a detailed discussion of this estimation strategy). The IV
estimates in column (1), that control for country and year fixed effects as well as country-specific
linear time trends, yield a coefficient on trade openness of about 0.5. This estimated coefficient is
significantly different from zero at the 1 percent significance level. The estimate is robust to
controlling for direct effects of rainfall and the savings rate on economic growth (column (2)),
controlling for lagged GDP growth (column (3)), controlling for civil conflict incidence and
political institutions (column (4)), and excluding extreme rainfall observations (column (5)).
Panel B of Table 3 reports estimates that do not instrument trade openness. The estimated
16
coefficient on trade openness is, in this case, negative and significant. However, given that Section
4.1 revealed a strong negative effect of economic growth on trade openness, the negative coefficient
in Panel B suffers from a negative reverse causality bias. The estimates in Panel B do not capture,
therefore, the causal effects that trade openness has on economic growth.
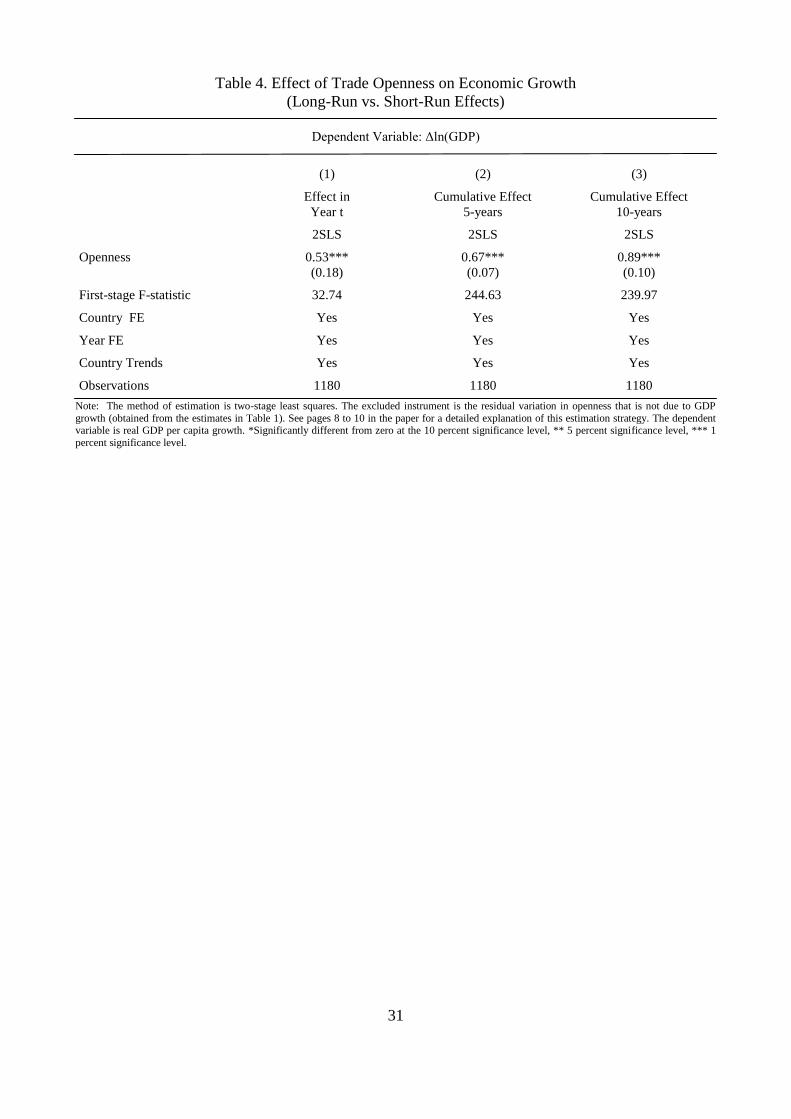
While the estimates in Table 3 reflect the short-run effect that trade openness has on
economic growth, it is also possible to study the long-run growth effects with the annual panel data.
This can be done by including additional lags of trade openness on the right-hand side of the
regression and summing up the coefficients on the contemporaneous and lagged effects of trade
openness. In Table 4, column (2), we report estimates when including up to five lags of trade
openness on the right-hand side of the regression. The sum of the estimated effects, 0.67, is positive
and significant at the 1 percent level. Repeating this exercise for up to ten lags yields a cumulated
effect of 0.89. This cumulated effect is significantly different from zero at the 1 percent significance
level. Hence, the distributed lag exercise shows that also in the longer-run trade openness has a
significant positive effect on economic growth. Quantitatively, the size of the estimated effects is in
line with estimates obtained in cross-country regressions that focus on the long-run relationship
between trade openness and growth as in Frankel and Romer (1999).
5.1 The Role of Ethnic Polarization
Beyond the significant positive average effect of trade openness on economic growth, an important
issue is how the effect of trade openness varies across Sub-Saharan African countries as a function
of ethnic divisions. A number of papers have traced poor policy performance of many Sub-Saharan
African countries over the past half century to strong ethnic divisions that are prevalent in these
countries (see for example, Easterly and Levin, 1997). Other papers have traced the incidence of
civil conflict -- which, over the past three decades, has been particularly high in the group of Sub-
Saharan African countries -- to ethnic polarization (e.g. Montalvo and Reynal-Querol, 2005a,b).

17
However, these papers are concerned with direct effects of ethnic divisions on economic growth
and conflict. These direct effects are captured in our regressions by the country fixed effects.
Voracity models such as those in Tornell and Lane (1999) and Lane and Tornell (1998)
predict, on the other hand, heterogeneity in the marginal effect of trade windfalls on economic
growth. Specifically, these models predict that the voracity effect is strongest in countries where
there are two groups of equal size claiming transfers from the government budget. The voracity
effect diminishes as the number of groups exceeds two; it is not present in a homogenous country.
The voracity effect described in the models of Lane and Tornell calls, therefore, for a measure of
polarization, and not fractionalization. This is because the index of fractionalization is strictly
increasing in the number of ethnic groups. In other words, the fractionalization index is not closely
tailored to the non-linear relationship described in the voracity model between the number of
groups and the voracity effect. The polarization index, on the other hand, is maximized when there
are two groups which are of equal size, it is zero if there is one group only, and decreases as the
number of groups exceeds two. This is exactly the non-linear relationship described in the voracity
model between the number of groups contesting for resources and the extent of the voracity effect.8
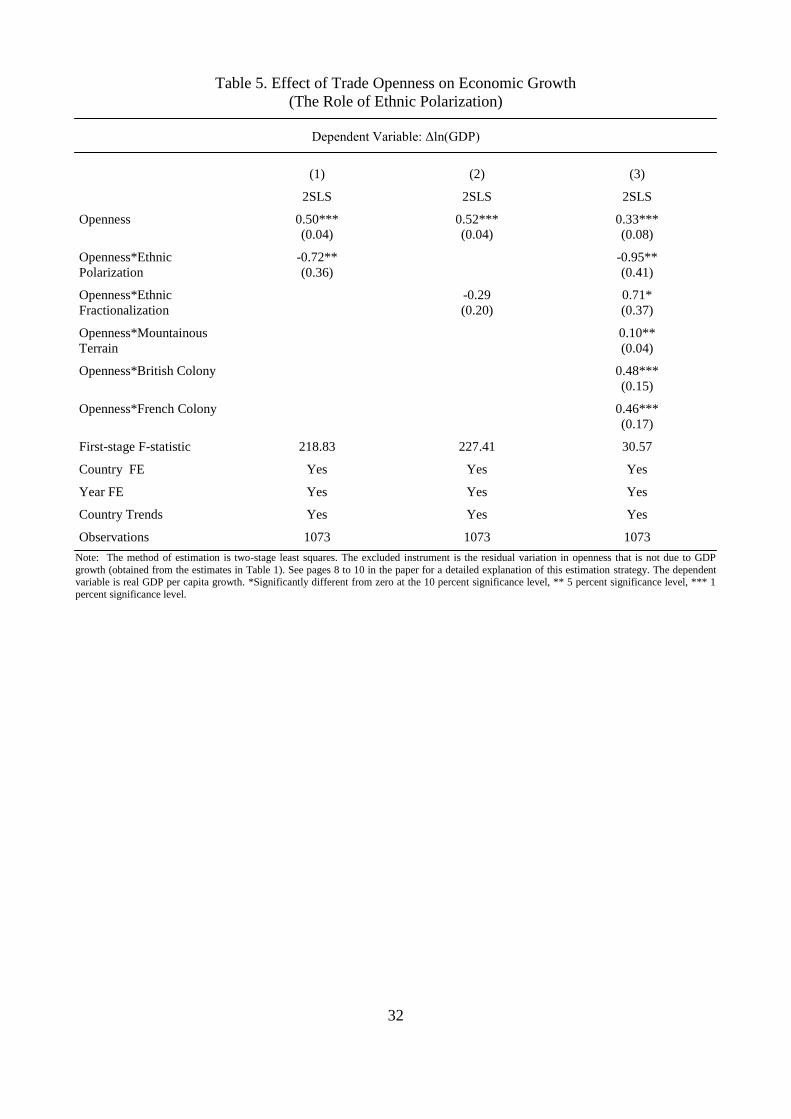
In column (1) of Table 5 we report results from an interaction model where we allow the
marginal effect of trade openness on economic growth to vary with cross-country differences in
ethnic polarization. We note that we do not include directly the ethnic polarization index on the
right-hand side of the regression because the regressions already control for country fixed effects
(the ethnic polarization index is time-invariant). The main finding in column (1) is a significant
negative interaction effect between trade openness and ethnic polarization. The significant negative
interaction effect implies that the growth benefits of trade openness are significantly attenuated by
ethnic polarization. Because we compute the interaction term as Opennessit*(Ethpoli-Av(Ethpoli)),
the estimate on Openness reflects the marginal effect at sample mean values of ethnic polarization.
8 See also Montalvo and Reynal-Querol (2005) for further discussion on differences between the fractionalization and
polarization index.
18
The estimate on Openness is around 0.5. Hence it is very similar to the average marginal effect that
we reported in Table 3. The negative coefficient on the interaction term, -0.72, implies that the
predicted marginal effect varies significantly with ethnic polarization. At the sample minimum of
ethnic polarization (0.02), the predicted marginal effect is 0.88 and has a standard error of 0.18; at
the sample maximum ethnic polarization (0.84) the predicted marginal effect is 0.29 and has a
standard error of 0.11. These numbers imply that: (i) the marginal effect of trade openness on
economic growth is significantly positive across the entire range of polarization; and (ii) the effect
at the sample minimum of polarization is about three times the effect at the sample maximum.
Ethnic polarization, therefore, plays a significant role in shaping the effect that openness to
international trade has on economic growth.
In column (2) of Table 5 we report interaction estimates that use an index of ethnic
fractionalization. The main finding is that the linear effect of trade openness on economic growth is
positive and significant; and the interaction between trade openness and ethnic fractionalization is
negative but insignificant. To interpret this last result, it is important to note that the
fractionalization index is strictly increasing in the number of groups. In contrast, the polarization
index is maximized when there are two groups of equal size. The fractionalization index does not
relate, therefore, as well to the voracity model as the polarization index. In fact, as the number of
groups exceeds two, the fractionalization index increases, while the voracity model predicts in this
case a weaker -- rather than stronger -- voracity effect.
In column (3) of Table 5 we report results when controlling for additional interaction terms
that capture differences in Sub-Saharan African countries' geography and colonial history. The
ethnic fragmentation of countries is a more exogenous variable than, say, measures of institutional
quality. But differences in countries' geography and colonial history might still be driving the
results. To address this concern, we include as additional right-hand-side controls an interaction
between trade openness and the share of countries' mountainous terrain. We also include interaction
19
terms between trade openness and indicator variables that are unity if a country was a British or
French colony. The main message is that the interaction between ethnic polarization and trade
openness continues to be negative and significant when controlling for these additional interaction
terms.
5.2 IV Estimates Using OECD Trade-Weighted GDP Growth
An alternative instrumental variables approach that we discussed in detail in Section 2 consists in
using the trade-weighted GDP growth rate of OECD countries. In Table 6 we report two-stage least
squares estimates that use this variable as an instrument for trade openness. For comparison
purposes to the previous estimates reported in Section 5, column (1) of Table 6 reports two-stage
least squares estimates for the Sub-Saharan African sample where there are available satellite data
on annual rainfall (the 1980-2009 period). With this IV approach the estimated coefficient on trade
openness is 0.56. This coefficient is significantly different from zero at the 1 percent level. And the
first-stage fit is also strong: the F-statistic for the trade-weighted OECD GDP growth instrument is
over 90.
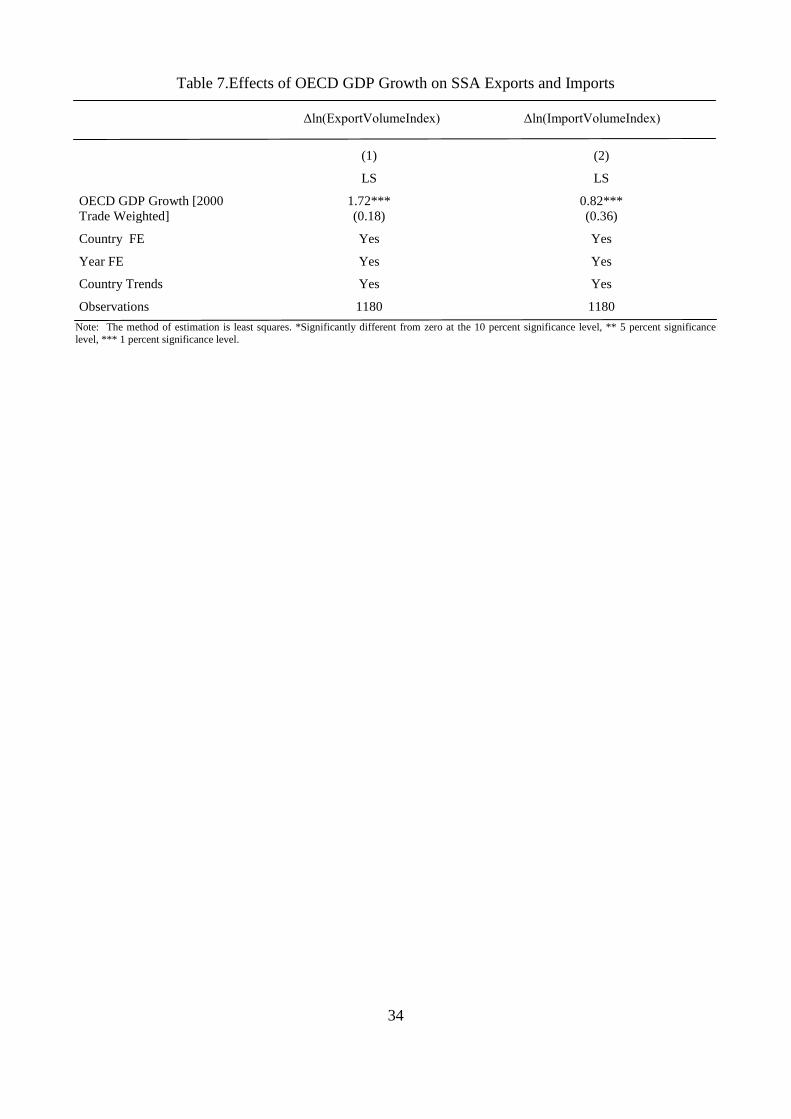
Table 7 shows that the reason for the significant positive first-stage effect of the OECD GDP
growth instrument on Sub-Saharan African countries' trade openness is a significant positive effect
on exports and imports. The significant positive coefficient in column (1) implies that, on average, a
one percentage point increase in OECD GDP growth increased the growth rate of SSA countries'
import volume index by over 1.7 percentage points. Column (2) shows that the effect on the growth
rate of SSA countries' export volume index is around 0.8 percentage points. Thus, the effect on
exports is a bit smaller than on imports. However, for both imports and exports the effect of OECD
GDP growth is positive, and significantly different from zero at the 1 percent level.
In column (2) of Table 6 we demonstrate that this instrumental variables estimation strategy
yields similar results if we use the pre-1980 trade-flow to construct the trade-weighted OECD GDP

20
growth instrument.9 The first-stage fit is in this case a bit weaker but the F-statistic is still around
23. The estimated second-stage coefficient on trade openness is 0.73, thus a bit larger than in
column (1), but also positive and significant at the 1 percent level.
There are a number of further issues that the alternative instrumental variables approach
enables us to explore. First, the trade-weighted OECD GDP growth instrument is also available for
the period before 1980, i.e. from 1950-2009.10
In column (3) we report results for the longest
possible Sub-Saharan African sample. The main finding is that in this sample the coefficient on
trade openness is 0.51. This coefficient is significantly different from zero at the 1 percent level. It
is, however, not significantly different from the coefficient obtained for the post-1980 period.
A second issue that the trade-weighted OECD GDP growth instrument enables us to explore
is whether the effect of trade openness on economic growth is significantly different when using a
world sample. The first instrumental variables approach that used rainfall as an instrument for GDP
growth was limited to the Sub-Saharan African region. The reason is that rainfall's significant effect
on GDP growth is limited to that region. In contrast, the trade-weighted OECD GDP growth
instrument should also work for other regions. Column (4) of Table 6 shows that the coefficient for
the world sample is 0.49. This coefficient is, therefore, not significantly different from the Sub-
Saharan African sample.
One issue, of course, that needs to be kept in mind is that while GDP growth of Sub-Saharan
African countries has an expectedly small effect on OECD countries' GDP growth -- this may not
be the case for other regions. For example, changes in politico-economic conditions in Arab
countries which are major oil producers could have repercussions on GDP growth of OECD
countries. It is unclear how large this effect is. However, a fair evaluation of this issue is that trade-
weighted OECD GDP growth is not as clean an instrument for trade openness in a global sample as
9 We have also tried using bilateral distances instead of bilateral trade flows to compute the trade-weighted OECD
GDP growth instrument. However, this did not lead to a significant first-stage fit.
10 Note that including the pre-1980 period leads to a strongly unbalanced sample as the PWT data for Sub-Saharan
African countries are unevenly available for the pre-1980 period.
21
it is for the group of Sub-Saharan African countries. Also, the first-stage fit for the world sample is
much weaker than in the Sub-Saharan African sample. This continues to be the case when
excluding OECD countries from the world sample, see column (5). In addition, column (6) shows
that when both OECD countries and SSA countries are excluded, the first-stage fit between the
instrument and trade openness is only significant at the 5 percent level, thus raising concerns about
instrument weakness.
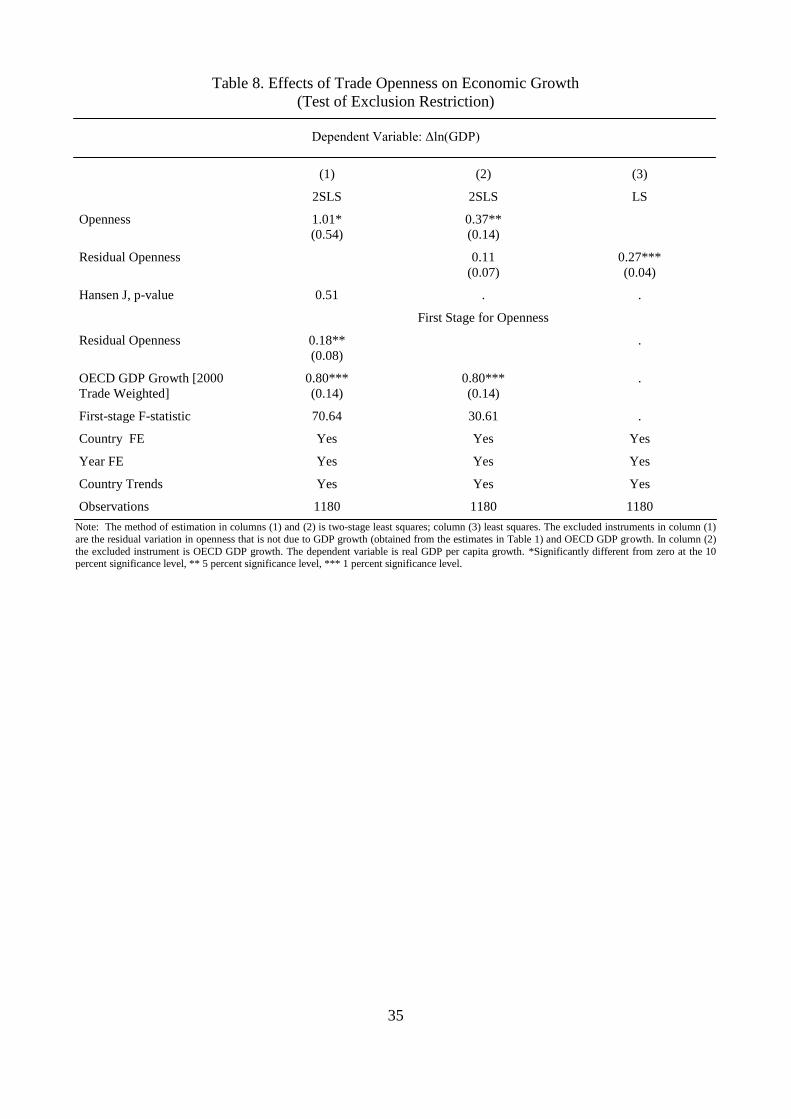
A third issue that we can address with this second instrumental variable in hand is the
empirical examination of the exclusion restriction. In column (1) of Table 8, we report two-stage
least squares estimates that use the residual variation in trade openness (that is not due to economic
growth, see Section 4) and the trade-weighted OECD GDP growth variable as excluded
instruments. The two-stage least squares estimate on trade openness is 1.01 and significant at the
conventional confidence level. The Hansen J-test does not reject the hypothesis that the instruments
are jointly uncorrelated with the second-stage error term. In column (2) of Table 8 we also
document that, conditional on trade openness, the residual variations in trade openness that is not
due to economic growth is not significantly correlated with economic growth. On the other hand,
the reduced-form estimates in column (3) show that residual openness has a significant positive
effect on economic growth. Hence, these tests of the exclusion restriction do not reject the
hypothesis that the residual variation in trade openness which is not due to economic growth is a
valid instrument.
6. Conclusion
Estimates of the effect of international trade on development remain contentious, while the policy
agenda to raise the level of trade in Sub-Saharan Africa has widened to a rather broad set of
policies. The literature, however, has raised concerns about the validity and interpretation of cross-
country evidence. In particular, it remains unclear whether a positive correlation between trade
22
openness (even when instrumented by geography as in Frankel and Romer 1999) and growth
withstands the inclusion of the historical roots of governance in cross-country estimations. This
paper tackled the debate with panel data and new IV strategies applied mainly to the case of Sub-
Saharan Africa.
Our approaches entailed two instrumental-variable identification strategies. One relied on
rainfall data to identify the effect of growth on trade, which in turn allowed us to use the residual as
an IV for trade in the growth model to correct for reverse causality bias. The second strategy relied
on the GDP growth of OECD economies as an IV for trade openness in Sub-Saharan Africa (and
other developing countries).
The results appear to be robust and the IVs seem to be both valid and relevant. On average,
trade openness appears to have a significant positive effect on growth in Sub-Saharan Africa. A one
percentage point increase in the ratio of trade over GDP in Sub-Saharan Africa is associated with a
short-run increase in growth of approximately 0.5 percent per year. The long-run effect is larger,
reaching about 0.8 percent after ten years. Consistent with the theoretical voracity models
developed by Lane and Tornell, the growth effects tend to decline with ethnic polarization,
therefore calling for some caution in expecting large growth gains from openness to international
trade in strongly polarized countries.
In the process, the evidence suggests other findings of interest for the literature. Importantly,
trade openness is endogenous to growth, but this effect is negative. This is expected because GDP is
in the denominator of the trade openness ratio. Thus least squares estimates of the effect of
openness on growth tend to be downward biased. Finally, ethnic fractionalization is immaterial for
the relationship between trade and growth, whereas ethnic polarization is highly significant. These
contrasting findings indeed suggest that the voracity effect is at play, because rent seeking is
expected to be at a maximum when groups are polarized (and not simply when fractionalization is
high). These results are robust to the inclusion of country fixed effects, time effects, country-

23
specific linear time trends, as well as interactions between trade openness and topography and
between trade openness and colonial heritage.

24
References
Acemoglu, D., S. Johnson, J. Robinson (2001), "The Colonial Origins of Comparative
Development: An Empirical Investigation," American Economic Review 91: 1369-1401.
Acemoglu, D., S. Johnson, J. Robinson, and P. Yared (2008). "Income and Democracy." American
Economic Review 98 (3): 808-842.
Africa Competitiveness Report (2011), Africa Competitiveness Report, World Economic Forum,
Geneva.
Alcala, F. and A. Ciccone (2004), „Trade and Productivity‟, Quarterly Journal of Economics 119:
613-46.
Barrios, S., L. Bertinelli and E. Strobl (2010), „Trends in Rainfall and Economic Growth in Africa:
A Neglected Cause of the African Growth Tragedy‟, Review of Economics and Statistics 92(2):
350-66, May.
Bond, S., A. Leblebicioglu and F. Schiantarelli (2010), ‟Capital Accumulation and Growth: A New
Look at the Empirical Evidence‟, Journal of Applied Econometrics 25: 1073-99.
Brückner, M. (2011), „On the Simultaneity Problem in the Aid and Growth Debate‟, Journal of
Applied Econometrics (forthcoming).
Brückner, M. and A. Ciccone (2011), „Rainfall and the Democratic Window of Opportunity‟,
Econometrica 79(3): 923-47, May.
Brückner, M. and A. Ciccone (2010), „International Commodity Price Shocks, Growth, and the
Outbreak of Civil War in Africa‟, Economic Journal 120(544): 519-34, May.
Blundell, R. and S. Bond (1998), „Initial Conditions and Moment Restrictions in Dynamic Panel
Data Models‟, Journal of Econometrics 87(1): 115-43.
Chen, S. and M. Ravallion (2010). "The Developing World is Poorer than we Thought, But No Less
Successful in the Fight Against Poverty. Quarterly Journal of Economics 125: 1577-1625.
Ciccone, A. and M. Jarocinski (2010), "Determinants of Economic Growth: Will Data Tell?",

25
American Economic Journal: Macroeconomics 2: 223-247.
Easterly, W. and R. Levine (1997), 'Africa's Growth Tragedy: Policies and Ethnic Divisions,'
Quarterly Journal of Economics 112(4): 1203-50, November.
Edwards, S. (1993), "Openness, Trade Liberalization, and Growth in Developing Countries."
Journal of Economic Literature. 31: 1358-93.
Fernandes, A. (2007), “Trade Policy, Trade Volumes and Plant-Level Productivity in Colombian
Manufacturing Industries,” Journal of International Economics 71: 52–71.
Frankel, J.A. and D. Romer (1999), „Does Trade Cause Growth?‟ American Economic Review
89(3): 379-99, June.
Heston, A., Summers, R., and B. Aten (2011), Penn World Table Version 7.0. Center for
International Comparisons of Production, Income and Prices, University of Pennsylvania, May
2011.
Head, K., T. Mayer, and J. Ries (2010). "The Erosion of Colonial Trade Linkages After
Independence." Journal of International Economics 81 (1):1-14.
IMF (2011), Sub-Saharan Africa: Sustaining the Expansion, Washington, D.C. 2011, Oct.
Lane, P.R. and A. Tornell (1998). "Are Windfalls a Curse? A Non-Representative Agent Model of
the Current Account." Journal of International Economics 83-112.
Levine, R. and D. Renelt (1992). "A Sensitivity Analysis of Cross-Country Growth Regressions."
Lileeva, A. and D. Trefler (2010), “Improved Access to Foreign Markets Raises Plant-Level
Productivity... for Some Plants,” Quarterly Journal of Economics 125: 1051–99.
Marshall, M. and K. Jaggers (2009), „Polity IV Project: Political Regime Characteristics and
Transitions: 1800-2009‟, Online Database.
Miguel, E., S. Satyanath and E. Sergenti (2004), „Economic Shocks and Civil Conflict: An
Instrumental Variables Approach‟, Journal of Political Economy 112(4): 725-53, August.
Montalvo, J. and M. Reynal-Querol (2005a), "Ethnic Polarization, Potential Conflict, and Civil
26
War," American Economic Review 95: 796-813.
Montalvo, J. and M. Reynal-Querol (2005a), "Ethnic Diversity and Economic Development,"
Journal of Development Economics 76: 293-323.
Polity IV (2010), “Political Regime Characteristics and Transitions, 1800-2010,” Online Database.
PRIO (2010), “Armed Conflict Dataset v4-2009,” Online Database.
Reynal-Querol, M (2002), "Ethnicity, Political Systems and Civil War," Journal of Conflict
Resolution 46: 465-483.
Rodriguez, F. and D. Rodrik (2001), "Trade Policy and Economic Growth: A Skeptic‟s Guide to
Cross-National Evidence," in B.S. Bernanke and K.S. Rogoff (eds.), NBER Macroeconomics
Annual 2000, Cambridge MA: MIT Press.
Rodrik, D., Arvind Subramanian, and Francesco Trebbi (2004), "Institutions Rule: The Primacy of
Institutions Over Geography and Integration in Economic Development," Journal of Economic
Growth 9: 131-165.
Tornell, A. and P. Lane (1999), "The Voracity Effect," American Economic Review 89: 22-46.
Stock, J. and M. Yogo (2005), „Testing for Weak Instruments in Linear IV Regression‟, pp. 80-108
in Identification and Inference for Econometric Models: Essays in Honor of Thomas Rothenberg,
ed. D. Andrews and J. Stock, Cambridge: Cambridge University Press.
Vamvakidis, A. (2002), 'How Robust is the Growth-Openness Connection? Historical Evidence',
Journal of Economic Growth 7(1): 57–80, March.
Van Biesebroeck, J. (2005), “Exporting Raises Productivity in Sub-Saharan African Manufacturing
Firms,” Journal of International Economics 67: 373–91.
Verhoogen, E. (2008), “Trade, Quality Upgrading, and Wage Inequality in the Mexican
Manufacturing Sector,” Quarterly Journal of Economics 123: 489–530
Wacziarg, R. and K.H. Welch (2008), „Trade Liberalization and Growth: New Evidence‟, World
Bank Economic Review 15(3): 393-429, October.

27
WDI (2011), World Development Indicators, Online Database.
World Bank (2011), Africa's Future and the World Bank's Support to It, Washington, D.C.
World Bank (2012), De-Fragmenting Africa: Deepening Regional Trade Integration in Goods and
Services, Washington, D.C.

28
Table 1. Response of Trade Openness to Economic Growth
Dependent Variable: Openness
(1) (2) (3) (4) (5) (6)
Excl.
Top/Bottom 1
Percentile Rain
Panel A: GDP instrumented by Rainfall
2SLS 2SLS 2SLS 2SLS 2SLS 2SLS
Δln(GDP), t -2.55**
(1.00)
-3.65***
(1.30)
-1.89*
(0.95)
-0.88**
(0.38)
-0.87**
(0.39)
-1.08**
(0.42)
Openness, t-1 0.72***
(0.04)
0.72***
(0.05)
0.74***
(0.05)
OECD GDP Growth,
[2000 Trade Weighted], t
0.71**
(0.27)
0.83***
(0.27)
Civil Conflict, t -0.02
(0.02)
Polity2, t -0.00
(0.09)
First Stage for Δln(GDP), t
Rainfall, t 0.050***
(0.013)
0.040***
(0.014)
0.047***
(0.016)
0.051***
(0.016)
0.051***
(0.017)
0.052***
(0.017)
First-stage F-statistic 15.46 7.69 10.77 9.72 9.37 9.46
Panel B: GDP not instrumented
LS LS LS SYS-GMM SYS-GMM SYS-GMM
Δln(GDP), t -0.15
(0.12)
-0.24**
(0.10)
-0.28***
(0.10)
-0.47**
(0.18)
-0.47**
(0.18)
-0.47**
(0.19)
Country FE Yes Yes Yes Yes Yes Yes
Year FE No Yes Yes Yes Yes Yes
Country Trends No No Yes Yes Yes Yes
Observations 1180 1180 1180 1180 1180 1157
Note: The method of estimation in Panel A is two-stage least squares. The excluded instrument is the log of rainfall. In Panel B, columns (1)-(3), the
method of estimation is least squares; Panel B, columns (4)-(6), system-GMM. The estimates reported in Panel B are based on the same set of control
variables as shown in Panel A, however, estimates on the set of control variables are not reported in Panel B for space purposes. The dependent variable, Openness, is defined as exports plus imports over PPP GDP. Column (6) excludes the top/bottom 1st percentile of rainfall observations.
*Significantly different from zero at the 10 percent significance level, ** 5 percent significance level, *** 1 percent significance level.

29
Table 2. Response of Trade Openness to Economic Growth
(Test of Exclusion Restriction)
Dependent Variable: Openness
(1) (2) (3)
2SLS 2SLS LS
Δln(GDP), t -1.42***
(0.41)
-1.39***
(0.40)
ln(Rainfall), t -0.02
(0.04)
-0.14***
(0.04)
Hansen J, p-value 0.57 . .
First Stage Δln(GDP), t
ln(Rainfall), t 0.038**
(0.016)
. .
Savings Rate 0.281**
(0.118)
0.281**
(0.118)
.
First-stage F-statistic 6.72 5.66 .
Country FE Yes Yes Yes
Year FE Yes Yes Yes
Country Trends Yes Yes Yes
Observations 1180 1180 1180
Note: The method of estimation in columns (1) and (2) is two-stage least squares; column (3) least squares. The dependent variable, Openness, is
defined as exports plus imports over PPP GDP. *Significantly different from zero at the 10 percent significance level, ** 5 percent significance level,
*** 1 percent significance level.
30
Table 3. Effect of Trade Openness on Economic Growth
Dependent Variable: Δln(GDP)
(1) (2) (3) (4) (5)
Excl. Top/Bottom
1 Percentile Rain
Panel A: Openness instrumented by Residual Variation that is not due to GDP Growth
2SLS 2SLS 2SLS 2SLS 2SLS
Openness, t 0.53***
(0.18)
0.51***
(0.18)
0.52***
(0.17)
0.51***
(0.18)
0.52***
(0.18)
Rainfall, t 0.08**
(0.03)
0.08**
(0.03)
0.08**
(0.03)
0.09**
(0.03)
Savings Rate, t 0.48***
(0.13)
0.49***
(0.13)
0.48***
(0.12)
0.49***
(0.13)
Δln(GDP), t-1 0.07
(0.05)
Civil Conflict, t -0.03*
(0.02)
Polity2, t 0.00
(0.00)
First Stage for Openness, t
Residual Openness, t 0.50***
(0.09)
0.51***
(0.09)
0.50***
(0.09)
0.51***
(0.09)
0.50***
(0.09)
First-stage F-statistic 32.91 31.66 32.79 32.22 30.67
Panel B: Openness not instrumented
LS LS SYS-GMM LS LS
Openness, t -0.07***
(0.01)
-0.05***
(0.01)
-0.07***
(0.02)
-0.05***
(0.02)
-0.05***
(0.02)
Country FE Yes Yes Yes Yes Yes
Year FE Yes Yes Yes Yes Yes
Country Trends Yes Yes Yes Yes Yes
Observations 1180 1180 1180 1180 1157
Note: The method of estimation in Panel A is two-stage least squares. The excluded instrument is the residual variation in openness that is not due to
GDP growth (obtained from the estimates in Table 1). See pages 8 to 10 in the paper for a detailed explanation of this estimation strategy. In Panel B,
the method of estimation is least squares (columns (1), (2), (4), and (5)) or system-GMM (column (3)). The estimates reported in Panel B are based on the same set of control variables as shown in Panel A, however, estimates on the set of control variables are not reported in Panel B for space
purposes. The dependent variable is real GDP per capita growth. Column (5) excludes the top/bottom 1st percentile of rainfall observations. *Significantly different from zero at the 10 percent significance level, ** 5 percent significance level, *** 1 percent significance level.
31
Table 4. Effect of Trade Openness on Economic Growth
(Long-Run vs. Short-Run Effects)
Dependent Variable: Δln(GDP)
(1) (2) (3)
Effect in
Year t
Cumulative Effect
5-years
Cumulative Effect
10-years
2SLS 2SLS 2SLS
Openness 0.53***
(0.18)
0.67***
(0.07)
0.89***
(0.10)
First-stage F-statistic 32.74 244.63 239.97
Country FE Yes Yes Yes
Year FE Yes Yes Yes
Country Trends Yes Yes Yes
Observations 1180 1180 1180
Note: The method of estimation is two-stage least squares. The excluded instrument is the residual variation in openness that is not due to GDP
growth (obtained from the estimates in Table 1). See pages 8 to 10 in the paper for a detailed explanation of this estimation strategy. The dependent variable is real GDP per capita growth. *Significantly different from zero at the 10 percent significance level, ** 5 percent significance level, *** 1
percent significance level.
32
Table 5. Effect of Trade Openness on Economic Growth
(The Role of Ethnic Polarization)
Dependent Variable: Δln(GDP)
(1) (2) (3)
2SLS 2SLS 2SLS
Openness 0.50***
(0.04)
0.52***
(0.04)
0.33***
(0.08)
Openness*Ethnic
Polarization
-0.72**
(0.36)
-0.95**
(0.41)
Openness*Ethnic
Fractionalization
-0.29
(0.20)
0.71*
(0.37)
Openness*Mountainous
Terrain
0.10**
(0.04)
Openness*British Colony 0.48***
(0.15)
Openness*French Colony 0.46***
(0.17)
First-stage F-statistic 218.83 227.41 30.57
Country FE Yes Yes Yes
Year FE Yes Yes Yes
Country Trends Yes Yes Yes
Observations 1073 1073 1073
Note: The method of estimation is two-stage least squares. The excluded instrument is the residual variation in openness that is not due to GDP
growth (obtained from the estimates in Table 1). See pages 8 to 10 in the paper for a detailed explanation of this estimation strategy. The dependent variable is real GDP per capita growth. *Significantly different from zero at the 10 percent significance level, ** 5 percent significance level, *** 1
percent significance level.

33
Table 6. Effect of Trade Openness on Economic Growth
(Sub-Saharan Africa vs. World Sample)
Dependent Variable: Δln(GDP)
SSA Only World Sample
(1) (2) (3) (4) (5) (6)
Pre-1980
Trade
Weights
Including
50s, 60s, 70s
Excluding
OECD
Excluding
OECD & SSA
2SLS 2SLS 2SLS 2SLS 2SLS 2SLS
Second Stage for Δln(GDP)
Openness 0.46***
(0.11)
0.73*
(0.38)
0.51***
(0.10)
0.49***
(0.16)
0.46***
(0.16)
0.40
(0.29)
First-stage F-statistic 91.13 23.22 27.64 8.11 7.60 4.68
First-Stage for Openness
OECD GDP Growth,
[2000 Trade Weighted]
0.88***
(0.09)
0.84***
(0.16)
1.18***
(0.41)
1.20***
(0.43)
2.26**
(1.04)
OECD GDP Growth [Pre-
1980 Trade Weighted]
0.45***
(0.09)
Country FE Yes Yes Yes Yes Yes Yes
Year FE Yes Yes Yes Yes Yes Yes
Country Trends Yes Yes Yes Yes Yes Yes
Observations 1180 1180 1998 5013 4346 3166
Note: The method of estimation is two-stage least squares. The excluded instrument is OECD GDP growth. See page 7 in the paper for details on
how this variable is constructed. The dependent variable is real GDP per capita growth. Columns (1)-(3) report estimates for the Sub-Saharan African sample; columns (4)-(6) report estimates for the world sample, with column (5) excluding OECD countries and column (6) excluding Sub-Saharan
African countries as well as OECD countries. *Significantly different from zero at the 10 percent significance level, ** 5 percent significance level,
*** 1 percent significance level.
34
Table 7.Effects of OECD GDP Growth on SSA Exports and Imports
Δln(ExportVolumeIndex) Δln(ImportVolumeIndex)
(1) (2)
LS LS
OECD GDP Growth [2000
Trade Weighted]
1.72***
(0.18)
0.82***
(0.36)
Country FE Yes Yes
Year FE Yes Yes
Country Trends Yes Yes
Observations 1180 1180
Note: The method of estimation is least squares. *Significantly different from zero at the 10 percent significance level, ** 5 percent significance
level, *** 1 percent significance level.
35
Table 8. Effects of Trade Openness on Economic Growth
(Test of Exclusion Restriction)
Dependent Variable: Δln(GDP)
(1) (2) (3)
2SLS 2SLS LS
Openness 1.01*
(0.54)
0.37**
(0.14)
Residual Openness 0.11
(0.07)
0.27***
(0.04)
Hansen J, p-value 0.51 . .
First Stage for Openness
Residual Openness 0.18**
(0.08)
.
OECD GDP Growth [2000
Trade Weighted]
0.80***
(0.14)
0.80***
(0.14)
.
First-stage F-statistic 70.64 30.61 .
Country FE Yes Yes Yes
Year FE Yes Yes Yes
Country Trends Yes Yes Yes
Observations 1180 1180 1180
Note: The method of estimation in columns (1) and (2) is two-stage least squares; column (3) least squares. The excluded instruments in column (1)
are the residual variation in openness that is not due to GDP growth (obtained from the estimates in Table 1) and OECD GDP growth. In column (2)
the excluded instrument is OECD GDP growth. The dependent variable is real GDP per capita growth. *Significantly different from zero at the 10 percent significance level, ** 5 percent significance level, *** 1 percent significance level.

36
Data Appendix Table 1. Descriptive Statistics
Variable Source Mean Stdv. Obs
Trade Openness PWT 7.0 0.667 0.387 1180
GDP Growth PWT 7.0 0.008 0.091 1180
OECD Trade-Weighted Growth Heat et al., PWT 7.0 0.005 0.018 1180
Ln(Rainfall) GPCP V2.1 6.713 0.642 1180
Polity2 Polity IV -1.653 5.677 1180
Civil Conflict Incidence PRIO/UPSALLA 0.262 0.440 1180
Export Volume Index Growth WDI 2011 0.040 0.267 1180
Import Volume Index Growth WDI 2011 0.037 0.245 1180
Ethnic Polarization Reynal-Querol 0.545 0.170 1073
Ethnic Fractionalization Reynal-Querol 0.672 0.234 1073
Mountainous Terrain Miguel et al. 1.583 1.414 1180
British Colony Acemoglu et al. 0.393 0.489 1180
French Colony Acemoglu et al. 0.393 0.489 1180
Data Appendix Table 2. List of Sub-Saharan African Countries in Sample
Angola Chad Gambia, The Madagascar Nigeria SwazilandBenin Congo, Dem. Rep. Ghana Malawi Rwanda TanzaniaBotswana Congo, Rep. of Guinea Mali Senegal TogoBurkina Faso Cote d'Ivoire Guinea-Bissau Mauritania Sierra Leone UgandaBurundi Djibouti Kenya Mozambique Somalia ZambiaCameroon Ethiopia Lesotho Namibia South Africa ZimbabweCentr. Afr. Rep. Gabon Liberia Niger Sudan