Embed Size (px)
Citation preview

Trade and structural change in East and Southeast Asia: Implications for growth and industrialization
IntroductionEast and Southeast Asian economies have been among the most dynamic participants in global trade, particularly trade in manufactures, led initially by Japan, then by the newly industrialized economies (NIEs) of Hong Kong, China; Korea; Singapore; and Taipei,China, and more recently by the People’s Republic of China (PRC) and five members of the Association of Southeast Asian Nations (ASEAN‑5—Indonesia, Malaysia, Philippines, Thailand, and Viet Nam). In contrast, India and South and Central Asia have not yet made much of an impact and to date remain small players in global manufacturing trade.1
The latter half of the 20th century for the first time provided a worldwide institutional framework for open trade under the auspices of the General Agreement on Tariffs and Trade (GATT) and its successor the World Trade Organization (WTO). At the same time that global tariffs were being cut in successive rounds of GATT/WTO negotiations, more and more countries experimented with bilateral and regional preferential trade agreements, particularly after the completion of the Uruguay Round in 1995.
The Asian Development Outlook 2006 (ADB 2006) provided a detailed discussion of the global trend toward bilateralism in trade and some forward‑looking estimates of the possible impact of various liberalization scenarios for the Asian region. It found that the region’s trade opportunities could best be obtained through the combination of unilateral reforms and multilateral, nondiscriminatory reduction of trade barriers. Deeper integration in the region could also provide additional scope for growth provided it was done in a manner that avoided emergence of hub‑and‑spoke systems that are based upon bilateral agreements with inconsistent coverage and rules.
This chapter provides a review of trade and structural change in the region and examines the state of regional integration in manufacturing trade using recent historical data with a focus on East and Southeast Asia. The key issues addressed include the role trade plays in facilitating structural change and industrial development, the rising share of intraregional trade and intra‑industry trade, and the controversies relating to the role of the PRC regarding the impacts of Asia’s giant on manufacturing competition for foreign direct investment (FDI) and trade. It also addresses the question of whether East and Southeast Asian trade and growth are uncoupling from global trade and growth.

Trade and structural change in East and Southeast Asia 83
Patterns of trade in East and Southeast Asia and the world, 1995–2004
Japan, followed by the NIEs, first adopted export‑oriented manufacturing as a growth strategy in the 1960s. Trade growth was rapid as the world economy expanded with recovery in Western Europe and strong growth in the United States (US).
Japan itself recorded double‑digit real rates of growth from 1960 up until the first oil shock of 1973. During this period of rapid growth, industrial structure also changed as exports shifted away from labor‑intensive to more sophisticated products. Japan’s movement into higher technology exports opened the way for the NIEs to themselves adopt an export‑oriented manufacturing growth strategy. These economies were able to expand production and exports in labor‑intensive industries such as apparel and footwear in the 1960s and then to develop more capital‑intensive industries following Japan in the 1970s and 1980s.
A third wave of trade‑led industrial growth then began to take hold as Southeast Asian economies adopted export‑oriented policies in the mid‑1970s and early 1980s, with rapid growth in exports of labor‑intensive manufactures. By the mid‑1980s, the ASEAN countries started exporting electrical and nonelectrical machinery and other more sophisticated products. Finally, the PRC and Viet Nam emerged as fast‑growing exporters of labor‑intensive manufactures in the late 1980s and early 1990s. International trade provided an environment conducive to rapid industrial growth and transformation of the predominantly agricultural economies of East and Southeast Asia into modern industrial economies in a remarkably short period of time by historical standards. Openness to trade is still a catalyst for further industrial growth in East and Southeast Asia today as the following sections will demonstrate.
World trade shares of East and Southeast Asia are presented by Harmonized System (HS) chapter categories for 1995 and 2004 (the latest year that data are available) in Appendix Table A1.6.1.2
The major HS chapter categories are given in Table 1.6.1. These categories’ shares in total world trade for 1995 and 2004 are shown in Table 1.6.2.3 The most striking changes in shares in the current dollar value of global trade over the decade are in HS 27 (mineral fuels) with a huge jump from under 7% to over 10% and in HS 28–38 (chemicals and allied products) with an increase to nearly 11% from 9.5%. Other than minerals (HS 25–26), the only categories to show increases are in machinery sectors: HS 85 (electrical machinery), HS 86–89 (transportation machinery), and HS 90–91 (precision instruments). It should be kept in mind that the declining shares of HS 50–60 (textiles) and HS 61–63 (apparel) are likely to be artificial as most of these products remained under global quotas during the period in question, despite integration of about half the tariff lines under the Agreement on Textiles and Clothing (GATT 1994) over the period in question.4 Machinery sectors (HS 84, HS 85, and HS 86–89) were by far the most important in terms of world trade shares with 38% in 1995 and 39% in 2004.
The East and Southeast Asian region shows a remarkable concentration in these machinery sectors over 1995–2004. The share of East and Southeast Asia in world exports rose from 31% to 35% in HS 84;
1.6.1 Harmonized System categories
HS 01–05 Live animals (meat, fish, poultry, livestock)
HS 06–10 Unprocessed fruit and vegetable products
HS 11–24 Processed agricultural products (food, beverages and tobacco)
HS 25–26 Mineral products (including cement)
HS 27 Mineral fuels (including petroleum and coal)
HS 28–38 Chemicals and allied industries (organic and inorganic chemicals)
HS 39–40 Plastic and rubber products (articles of plastic, articles of rubber)
HS 41–43 Leather products (articles of leather, manufactures of fur)
HS 44–46 Wood and cork (articles of wood, cork and straw)
HS 47–49 Pulp and paper (including printed matter of paper)
HS 50–60 Textiles (natural and manmade fiber yarn and fabric, carpets)
HS 61–63 Apparel (including other made-up textile articles)
HS 64–67 Footwear, headgear and umbrellas (including articles of human hair)
HS 68–70 Articles of stone, glass and ceramic products
HS 71 Gems and jewelry (including precious stones and precious metals, and coin)
HS 72–83 Base metals (articles of base metal)HS 84 Nonelectrical machinery (including
plant and capital equipment, office machinery and computers)
HS 85 Electrical machinery (including television receivers, sound recorders and reproducers, and telecommunications equipment)
HS 86–89 Transportation machinery (vehicles and parts)
HS 90–91 Precision instruments (optical, medical, measuring equipment)
HS 92 Musical instruments (parts and accessories)
HS 93 Arms and ammunition (parts and accessories)
HS 94–97 Miscellaneous manufactures (furniture, toys, sports equipment and art)

84 Asian Development Outlook 2007
from 48% to 54% in HS 85 and from 21% to 22% in HS 86–89. East and Southeast Asia also managed to increase the share of exports in three of the other main expanding sectors: HS 25–26 from 10% to 11%; HS 28–38 from 16% to 17%; and HS 90–91 from 33% to 36%. Hence, it can be seen that aside from HS 27 (mineral fuels), East and Southeast Asia have concentrated their exports on the fastest growing segments of global trade over the most recent decade. Export shares of East and Southeast Asia in world trade have also increased in HS 50–63 (from 38% to 39% for textiles and from 42% to 43% in apparel). Figure 1.6.1 shows that East and Southeast Asia have lifted their share of world exports over the decade from 25% to almost 28% when Japan is included and from 17% to 21% when Japan is excluded. The increase in the PRC exports relative to world trade has been particularly impressive over 1995–2004.
Import shares of East and Southeast Asia are shown in Figure 1.6.2 and are roughly constant when Japan is included but rise from about 17% to 18% when Japan is excluded. The PRC share in world imports nearly doubled over 1995–2004, from 3% to 6%. The share of East and Southeast Asia in world imports of electrical machinery (HS 85) increased sharply over 1995–2004 from 34% to 39%. There was also a sharp jump in the share of the region in world imports of precision instruments from 26% to 34%. The world import share of the region in nonelectrical machinery (HS 84) also increased modestly from 23% to 24%. In contrast, the share of the region in world imports of transportation goods fell very sharply from 12% to 8% (9% to 6% excluding Japan) reflecting the relatively slow growth of imports in the region (Table 1.6.3) of around 2% annually. Only the PRC experienced high import growth in transport equipment during 1995–2004 within the region. Still the period has seen the emergence of the region as a supplier of markets outside the region of transportation equipment.
These data on world export and import market shares of East and Southeast Asia indicate that the region has a huge surplus on the trade account in the balance of payments and this surplus has built up following the recovery from the Asian financial crisis of 1997–1998. The ASEAN‑5 countries’ decline in world import share is mirrored by their increase in world export share and move from deficit to surplus in 2004 compared with 1995. The PRC shows a similar pattern of shift from trade deficit to surplus. The NIEs increase the surplus of export shares over import shares in global trade. These surpluses help explain the large increase in foreign exchange reserve holdings of East and Southeast Asia.
The PRC has become a dominant force in global trade in labor‑intensive manufactures (HS 50–60 [textiles], HS 61–63 [apparel], HS 64–67 [footwear, headgear and umbrellas]) but has also become a player in HS 84 (nonelectrical machinery) and HS 85 (electrical machinery) (especially in office and computing equipment) and HS 90–91 (precision instruments). Japan remains a dominant player in HS 86–89 (transportation equipment).
Growth in world trade by HS chapter categories and growth in East and Southeast Asia (1995–2004), measured as compound annual growth rates are shown in Table 1.6.3. Setting aside mineral fuels, growth over the period is fastest in manufacturing sectors: (1) HS 28–38 (chemicals); (2) HS 85 (electrical machinery); (3) HS 90–91 (precision instruments); and (4) HS 86–89 (transport equipment). The PRC has double‑digit growth
1.6.2 Shares in word trade by HS category, 1995 and 2004
HS category 1995 200401–05 2.78 2.0606–10 3.26 2.3911–24 2.96 2.3825–26 1.32 1.4127 6.81 10.3528–38 9.48 10.8139–40 1.03 0.9741–43 0.60 0.4344–46 1.35 1.0547–49 2.54 1.7650–60 3.39 2.1761–63 3.84 3.6264–67 0.82 0.6268–70 0.86 0.7271 0.84 0.8272–83 7.21 6.8684 14.86 14.4685 12.13 13.4586–89 11.11 11.2790–91 3.15 3.3292 0.59 0.5093 0.14 0.0694–97 4.69 4.49
Source: Statistics Canada, World Trade Analyzer.
1.6.1 Share of world exports
0 5 10 15 20 25 30
20041995
ASEAN-5
NIEs
China, People's Rep. of
East and Southeast Asiaexcluding Japan
East and Southeast Asia
%
Note: ASEAN-5 comprises Indonesia, Malaysia, Philippines, Thailand, and Viet Nam.
Source: Statistics Canada, World Trade Analyzer.
Click here for figure data
1.6.2 Share of world imports
0 5 10 15 20 25
20041995
ASEAN-5
NIEs
China, People's Rep. of
East and Southeast Asiaexcluding Japan
East and Southeast Asia
%
Note: ASEAN-5 comprises Indonesia, Malaysia, Philippines, Thailand, and Viet Nam.
Source: Statistics Canada, World Trade Analyzer.
Click here for figure data

Trade and structural change in East and Southeast Asia 85
across the machinery sectors with imports growing alongside exports suggesting trade in parts and components may be expanding rapidly. Growth rates of some machinery exports of the NIEs and ASEAN‑5 are double digits as well suggesting complementary growth with PRC exports in these sectors. Export growth of East and Southeast Asia in these categories thus surpassed growth in world trade (Figure 1.6.3).
It is important to ascertain the relative importance and roles of intermediate and components trade versus final demand growth in this dynamic Asian trade (see below). Growth rates of exports of labor‑intensive manufactures from East and Southeast Asia (excluding Japan) also exceeded world trade growth in these sectors, indicating that East and Southeast Asia continued to gain market share in these segments (Figure 1.6.4). This performance was related to the entry of the PRC into WTO in late 2001 and to Viet Nam’s emergence at the same time. Viet Nam concluded a bilateral trade agreement (BTA) with the United
1.6.3 Growth in trade by HS categoryHS category Growth in
world tradeJapan PRC NIEs ASEAN‑5 East and Southeast
AsiaEast and Southeast
Asia excl. Japan
Imports
01–05 3.22 -2.03 11.46 2.46 4.58 0.38 4.2606–10 3.12 0.57 0.24 -0.39 1.31 0.38 0.2511–24 4.17 0.44 9.26 -1.72 3.85 2.42 3.2625–26 7.48 3.29 22.44 6.06 3.03 9.03 12.2527 11.80 7.01 25.28 9.72 9.77 10.21 12.6428–38 8.28 4.67 13.37 4.16 4.35 6.72 7.1939–40 6.02 2.41 14.94 1.21 4.43 5.23 6.0441–43 2.81 -1.86 8.50 1.14 0.32 3.78 4.1544–46 3.73 -2.87 8.67 -4.33 -1.88 -1.48 0.4347–49 2.45 -2.48 10.43 -2.91 1.42 1.31 2.2850–60 1.55 -3.49 3.18 -2.73 0.69 -0.07 0.2661–63 6.00 2.58 8.96 5.26 6.72 4.17 5.9064–67 3.51 0.37 13.14 3.66 8.20 2.29 4.5068–70 4.62 3.70 11.26 3.58 -1.06 3.85 3.8871 6.34 -7.97 26.61 6.55 0.76 3.46 6.8772–83 6.14 2.19 13.81 4.62 2.27 5.59 6.3684 6.40 6.73 13.79 5.49 1.54 6.87 6.9085 7.95 7.31 21.44 7.60 5.63 9.56 9.8986–89 6.89 2.37 13.18 -0.43 -1.26 2.19 2.1390–91 7.35 6.53 23.39 7.94 4.89 10.29 11.2692 4.65 5.11 19.63 1.30 1.08 4.59 4.4093 -2.90 0.25 5.61 -0.27 -22.31 -3.28 -4.9694–97 6.19 3.17 8.03 3.28 3.24 3.78 4.09All sectors 6.72 3.88 14.83 5.15 3.64 6.45 7.25
Exports01–05 5.20 7.51 -5.75 2.11 1.95 1.8206–10 1.28 7.68 -4.19 2.65 3.07 3.1211–24 1.92 2.81 -3.29 5.94 3.06 3.1225–26 12.93 14.77 0.66 6.25 8.18 7.0527 0.78 12.70 11.64 8.22 9.70 10.1828–38 6.14 12.93 8.92 13.07 8.97 10.3439–40 3.70 20.52 4.11 4.29 5.32 6.0541–43 -2.91 13.66 2.43 0.02 4.23 4.4744–46 0.19 16.41 -5.39 -2.03 1.14 1.1547–49 2.94 14.16 1.70 8.79 5.33 5.9750–60 0.19 9.85 -1.14 2.15 2.10 2.3461–63 2.64 12.16 0.45 3.95 6.30 6.3464–67 -9.63 10.94 -4.92 3.83 3.72 3.7568–70 1.58 14.01 1.03 7.68 5.32 7.6571 4.98 12.01 11.97 -1.46 8.07 8.2872–83 3.56 16.74 5.73 10.13 7.77 9.7684 1.61 34.14 6.16 12.92 8.12 12.2185 2.26 25.75 9.83 8.24 9.37 11.8686–89 5.04 21.79 10.88 9.63 7.47 12.5390–91 4.68 18.76 8.95 10.66 8.25 11.3092 3.17 14.33 10.24 8.94 8.11 10.7893 1.58 -11.81 9.31 -8.12 4.48 5.8994–97 2.32 15.66 0.75 5.27 6.32 6.71All sectors 3.56 17.73 6.53 7.71 7.71 9.38
Note: Table shows compounded annual growth rates between 1995 and 2004.
Source: Statistics Canada, World Trade Analyzer.
86 Asian Development Outlook 2007
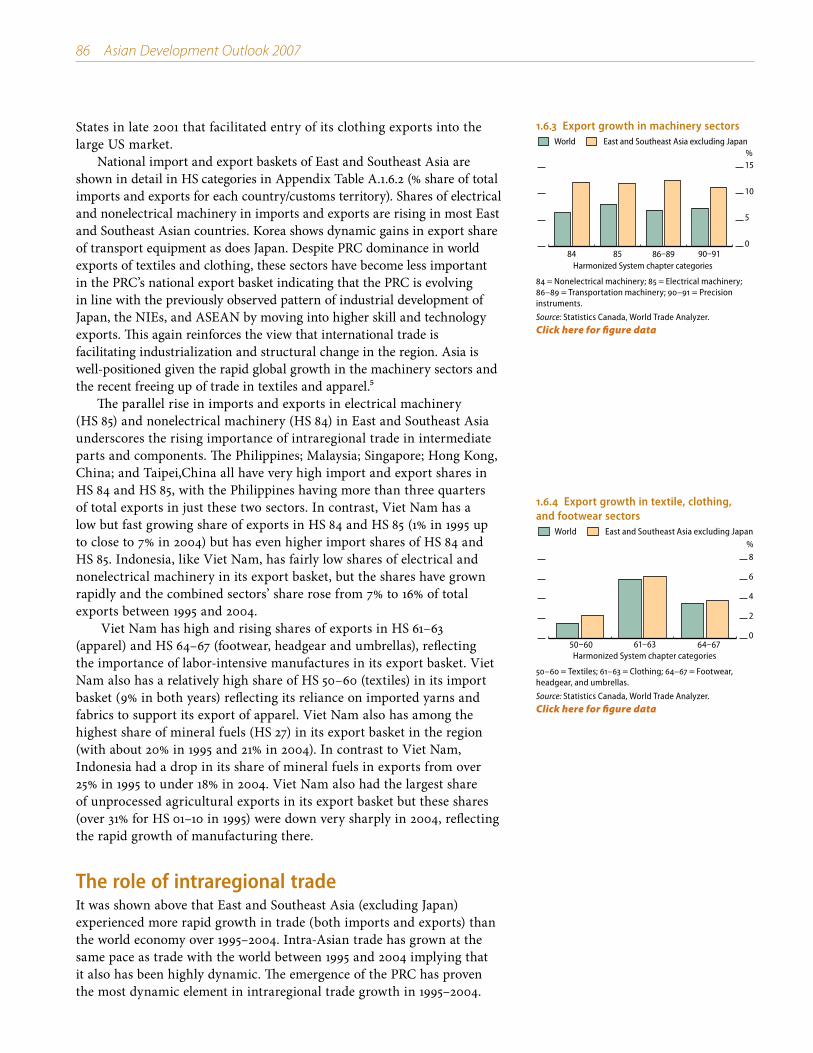
States in late 2001 that facilitated entry of its clothing exports into the large US market.
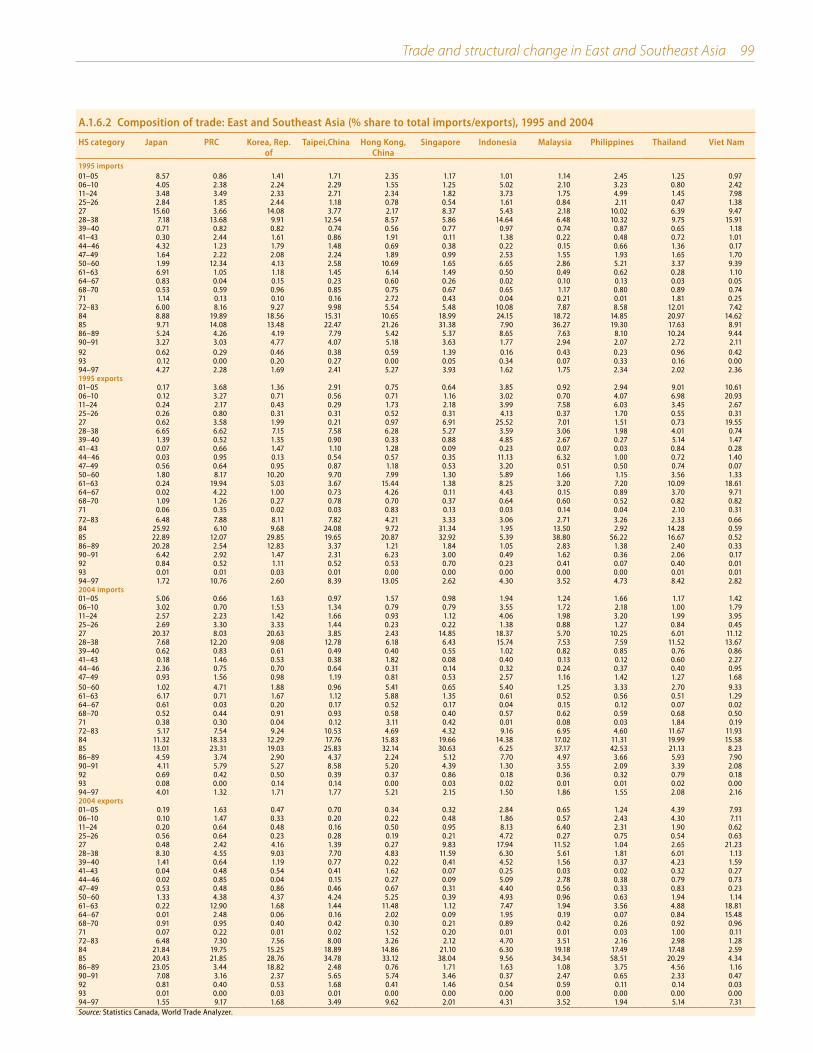
National import and export baskets of East and Southeast Asia are shown in detail in HS categories in Appendix Table A.1.6.2 (% share of total imports and exports for each country/customs territory). Shares of electrical and nonelectrical machinery in imports and exports are rising in most East and Southeast Asian countries. Korea shows dynamic gains in export share of transport equipment as does Japan. Despite PRC dominance in world exports of textiles and clothing, these sectors have become less important in the PRC’s national export basket indicating that the PRC is evolving in line with the previously observed pattern of industrial development of Japan, the NIEs, and ASEAN by moving into higher skill and technology exports. This again reinforces the view that international trade is facilitating industrialization and structural change in the region. Asia is well‑positioned given the rapid global growth in the machinery sectors and the recent freeing up of trade in textiles and apparel.5
The parallel rise in imports and exports in electrical machinery (HS 85) and nonelectrical machinery (HS 84) in East and Southeast Asia underscores the rising importance of intraregional trade in intermediate parts and components. The Philippines; Malaysia; Singapore; Hong Kong, China; and Taipei,China all have very high import and export shares in HS 84 and HS 85, with the Philippines having more than three quarters of total exports in just these two sectors. In contrast, Viet Nam has a low but fast growing share of exports in HS 84 and HS 85 (1% in 1995 up to close to 7% in 2004) but has even higher import shares of HS 84 and HS 85. Indonesia, like Viet Nam, has fairly low shares of electrical and nonelectrical machinery in its export basket, but the shares have grown rapidly and the combined sectors’ share rose from 7% to 16% of total exports between 1995 and 2004.
Viet Nam has high and rising shares of exports in HS 61–63 (apparel) and HS 64–67 (footwear, headgear and umbrellas), reflecting the importance of labor‑intensive manufactures in its export basket. Viet Nam also has a relatively high share of HS 50–60 (textiles) in its import basket (9% in both years) reflecting its reliance on imported yarns and fabrics to support its export of apparel. Viet Nam also has among the highest share of mineral fuels (HS 27) in its export basket in the region (with about 20% in 1995 and 21% in 2004). In contrast to Viet Nam, Indonesia had a drop in its share of mineral fuels in exports from over 25% in 1995 to under 18% in 2004. Viet Nam also had the largest share of unprocessed agricultural exports in its export basket but these shares (over 31% for HS 01–10 in 1995) were down very sharply in 2004, reflecting the rapid growth of manufacturing there.
The role of intraregional trade It was shown above that East and Southeast Asia (excluding Japan) experienced more rapid growth in trade (both imports and exports) than the world economy over 1995–2004. Intra‑Asian trade has grown at the same pace as trade with the world between 1995 and 2004 implying that it also has been highly dynamic. The emergence of the PRC has proven the most dynamic element in intraregional trade growth in 1995–2004.
1.6.4 Export growth in textile, clothing, and footwear sectors
0
2
4
6
8
East and Southeast Asia excluding JapanWorld
64675060
%
Harmonized System chapter categories6163
50–60 = Textiles; 61–63 = Clothing; 64–67 = Footwear, headgear, and umbrellas.
Source: Statistics Canada, World Trade Analyzer.
Click here for figure data
1.6.3 Export growth in machinery sectors
0
5
10
15
East and Southeast Asia excluding JapanWorld
909186898584
%
Harmonized System chapter categories
84 = Nonelectrical machinery; 85 = Electrical machinery; 86–89 = Transportation machinery; 90–91 = Precision instruments.
Source: Statistics Canada, World Trade Analyzer.
Click here for figure data

Trade and structural change in East and Southeast Asia 87
The PRC’s growth has been both as an importer and an exporter. The PRC growth in trade with Japan, the NIEs, and ASEAN‑5 was 14% per year over the period 1995 to 2004 (Table 1.6.4) implying a more than tripling in the value of trade between the PRC and the other countries in the region (Table 1.6.5) from $199 billion in 1995 to $655 billion in 2004. Moreover, the PRC has imported more than it exports within the region, implying that its global trade is dependent on access to world markets outside the region, given its overall trade surplus. This pattern of rapid expansion of intraregional trade based on the PRC as an assembly point for final products destined for the markets of Europe and the Americas (and elsewhere outside the region) indicates that far from decoupling from globalization, the region is becoming more oriented toward the global economy than ever before.
Intraregional trade doubled in value between 1995 and 2004 from $651 billion to $1,296 billion. Intraregional trade shares (over 60%) in both years in East and Southeast Asia including Japan (Table 1.6.6) are as high as in the EU despite the relatively limited institutional basis for regional integration in Asia. Apart from the ASEAN free trade agreement, other regional and bilateral initiatives have only recently been negotiated within the region and are still quite limited in their impact on the direction of trade. Hence, the growth in intra‑Asian trade and its trade growth with the world have been largely driven by market forces rather than by discriminatory trade agreements.
If the growth of intraregional trade has been very rapid, does this provide a case for the view that greater regional integration efforts will enable Asia to break its dependence on final demand in industrial countries? Or is it the case that intraregional trade is being driven by global integration with final demand for exports of East and Southeast Asia largely lying outside the region for the key manufacturing sectors?
1.6.4 Growth of intra‑Asian trade, all sectors, 1995–2004
Exporter\importer Japan PRC NIEs ASEAN‑5 East and Southeast
Asia
East and Southeast Asia
excluding JapanJapan - 16.3 2.8 0.5 4.9 - PRC 12.9 - 13.9 19.0 14.0 14.5 NIEs 2.7 12.8 5.8 3.9 7.6 8.6 ASEAN-5 4.3 21.8 4.8 12.1 7.5 8.9 East and Southeast Asia 6.4 14.2 6.5 5.0 8.0 -East and Southeast Asia
excluding Japan- 13.6 8.4 7.4 - 9.8
Source: Statistics Canada, World Trade Analyzer.
1.6.5 Intra‑Asian trade, all sectors ($ billion), 1995 and 2004Exporter\importer Japan PRC NIEs ASEAN‑5 East and
Southeast Asia
East and Southeast Asia
excluding Japan1995Japan - 23 113 53 189 - PRC 29 - 51 6 85 57 NIEs 51 85 77 59 272 221 ASEAN-5 36 6 49 13 104 68 East and Southeast Asia 116 114 290 131 651 - East and Southeast Asia
excluding Japan - 91 177 78 - 346
Total market 314 167 344 221 1,047 733
2004Japan - 90 144 55 289 - PRC 86 - 164 29 278 193 NIEs 65 252 128 84 528 464 ASEAN-5 53 36 75 36 200 147 East and Southeast Asia 204 377 511 204 1,296 - East and Southeast Asia
excluding Japan - 288 367 148 - 803
Total market 443 579 796 305 2,123 1,680
Source: Statistics Canada, World Trade Analyzer.
1.6.6 Intra‑Asian trade, all sectors (% share of world total), 1995 and 2004Exporter\importer Japan PRC NIEs ASEAN‑5 East and
Southeast Asia
East and Southeast Asia
excluding Japan1995Japan - 13.80 32.76 23.90 18.03 -PRC 9.13 14.74 2.69 8.16 7.74NIEs 16.26 50.91 22.30 26.86 26.01 30.19ASEAN-5 11.55 3.69 14.30 5.75 9.98 9.30East and Southeast Asia 36.94 68.40 84.10 59.21 62.17 -East and Southeast Asia
excluding Japan- 54.60 51.34 35.30 - 47.23
Total market 100.00 100.00 100.00 100.00 100.00 100.00
2004Japan - 15.46 18.15 18.11 13.62PRC 19.33 - 20.61 9.36 13.10 11.46NIEs 14.64 43.45 16.06 27.57 24.89 27.59ASEAN-5 12.02 6.27 9.43 11.69 9.44 8.76East and Southeast Asia 45.99 65.19 64.25 66.74 61.05 -East and Southeast Asia
excluding Japan- 49.73 46.10 48.62 - 47.81
Total market 100.00 100.00 100.00 100.00 100.00 100.00
Source: Statistics Canada, World Trade Analyzer.

88 Asian Development Outlook 2007
One way to address these issues is to simply compare the share of East and Southeast Asia in world imports and world exports to verify that markets outside the immediate region are still essential in providing the demand growth for the region’s overall exports. Recall that world exports and imports are identical in the database. This implies that a region with export shares greater than import shares in its world trade has a global trade surplus.
Furthermore, by definition intraregional trade, like world trade, when summed up must balance (imports and exports within the region or the world are equal when summed across members). Then it follows that extraregional trade of a region with a global trade surplus must be in surplus and that external demand from outside the region is important in final demand for the region’s global exports. For example in HS 61–63 (apparel), the region’s imports from the world were $39.2 billion ($17.4 billion if Japan is excluded) with a world share of 19% in 1995 but exports to the world were $84.6 billion ($83.6 billion excluding Japan) or 42% of the world total. This implies that exports were largely dependent on external demand.
In 2004 the region’s share of imports of HS 61–63 amounted to less than 17% of the world total ($56.5 billion; $29.2 billion excluding Japan) while exports rose to $146.7 billion ($145.3 billion excluding Japan) or 43% of world total—implying that final demand outside the region was the driving force in the expansion of exports. In the case of HS 85 (electrical machinery) the share of East and Southeast Asia in world imports increased from 34% to 39% yet the region’s export share in the world increased by more, from 48% to 54%, so even on the margin it was external final demand outside the region that was most important for growth. Similarly in nonelectrical machinery (HS 84) the import share rose moderately from 23% to 24% over the period but the share in world exports rose sharply from 31% to 35%. For each of these sectors, external final demand had to be relied upon for export expansion between 1995 and 2004.
Intra‑industry trade in manufactures Intra‑industry trade—trade in which a country simultaneously imports and exports similar products (defined as belonging to the same Standard International Trade Classification (SITC) 3‑digit product group) is an indicator of the sophistication of consumer markets and industrial development (OECD 2002). As barriers to trade and investment are reduced, multinational enterprises increasingly engage in production activities across a range of locations seeking to apply their firm’s assets with location‑specific advantages, including abundance of particular types of resources or a favorable geographic position.
More open economies are likely to have a high ratio of intra‑industry trade in manufactures, particularly in sophisticated and technology‑intensive products like chemicals, office machinery, transport equipment, and electronics. Increased variety and choice in production and consumption is associated with intra‑industry trade. In theory intra‑industry trade in similar but differentiated products takes place in markets characterized by monopolistic competition (many producers and consumers, consumer tastes favor variety, and firms have

Trade and structural change in East and Southeast Asia 89
some market power) as opposed to perfect competition where firms produce homogeneous products and are price‑takers and consumers are indifferent between firms supplying the homogeneous product. Intra‑industry trade may also arise where fragmentation of the production process in order to minimize costs across locations is taking place. Intra‑industry trade (IIT) is measured by an index designed by Grubel and Lloyd (1975) varying in value between zero and one:
)(− +−
= 1ii
iii MX
MXITT
If the country only imports or exports products in sector i, the second term on the right side of the equation is equal to one and the whole expression collapses to zero signifying pure inter‑industry trade. Similarly, if the country simultaneously imports and exports the same amounts of products in sector i, the second term is zero and the whole expression is equal to one, signifying pure intra‑industry trade.
Intra‑industry trade in East and Southeast Asian manufacturing is evaluated by factor intensity between 1995 and 2004 (Table 1.6.7) using SITC 3‑digit product categories. There are four types of manufacturing industries: unskilled labor‑intensive; natural resource‑intensive; human capital‑intensive; and technology‑intensive.
Trade‑weighted values of the IIT index have been calculated for each group of manufactured products for Japan, PRC, NIEs, ASEAN‑5, East and Southeast Asia, and East and Southeast Asia excluding Japan. These are weighted by the amount of trade in each of the 3‑digit product groups compared with the sum of trade in the product group as a whole. The summary IIT indexes for natural resource‑intensive, technology‑intensive, and human capital‑intensive manufactures are quite large and rising over the period 1995–2004. The exception is unskilled labor‑intensive manufactures, where the IIT indexes generally fell. This reflects predominantly a decline in intra‑industry trade in textiles. The reasons for this decline are beyond the immediate scope of this report but may reflect declines in PRC imports of intermediate textiles associated with the rapidly increasing capacity in textile production that has occurred since it joined WTO (Anson and Brocklehurst 2006). One may distinguish between horizontal IIT in which countries import and export products at a similar level of processing with vertical IIT where countries import and export goods at differing levels of processing. The latter is thought to take place where production is fragmented so that each manufacturing operation in the value chain takes place in the lowest cost or most advantageous location. The IIT in technology‑intensive and human capital‑intensive products in East and Southeast Asia most likely is of the vertical type associated with the rise in trade in machinery parts and components.
1.6.7 Grubel‑Lloyd intra‑industry trade indexes, 1995 and 2004
Year Labor‑intensive
manufacturing
Natural resource‑intensive
manufacturing
Human‑capital intensive
manufacturing
Technology‑intensive
manufacturing
Japan 1995 0.38 0.78 0.40 0.462004 0.34 0.71 0.37 0.60
China, People’s Rep. of 1995 0.47 0.51 0.75 0.582004 0.32 0.74 0.73 0.64
NIEs 1995 0.60 0.82 0.85 0.802004 0.65 0.80 0.76 0.81
ASEAN-5 1995 0.47 0.63 0.36 0.632004 0.47 0.71 0.67 0.78
East and Southeast Asia 1995 0.68 0.80 0.72 0.842004 0.58 0.85 0.68 0.85
East and Southeast Asia excl. Japan 1995 0.58 0.80 0.77 0.772004 0.48 0.88 0.77 0.81
Source: Statistics Canada, World Trade Analyzer.

90 Asian Development Outlook 2007
The rise of trade in parts and components in machinery sectors
Trade in intermediate products has become very important for East and Southeast Asian trade in electrical machinery, transportation equipment, and nonelectrical machinery. This phenomenon may be observed by looking at more detailed SITC 4‑digit products within these sectors. For example, in electrical machinery the number one 4‑digit product group traded is SITC 7649 (parts of apparatus of division 76—electrical machinery) in the imports and exports of Japan, PRC, NIEs, and ASEAN‑5 taken individually and as a whole. Whereas trade in intermediates accounts for one half of world trade in electrical machinery in 2004, it accounts for 56% of imports and 60% of exports of East and Southeast Asia (including Japan). Growth of trade in SITC 7649 in East and Southeast Asia has exceeded 14% a year between 1995 and 2004 compared with 12% globally.
Growth of exports has been even more dynamic—if one excludes Japan, the growth rate of exports is nearly 18% in East and Southeast Asia. Thus, the share of trade in parts and components in this one 4‑digit category in East and Southeast Asia rose from 50% of imports of electrical machinery and 45% of exports of electrical machinery to 57% and 61% of such imports and exports, respectively. In global trade the shares increased from 38% to 50% over the same time period indicating that East and Southeast Asia trade even more intensively in these intermediate goods than does the rest of the world. These figures actually understate the importance of trade in intermediate goods as certain other 4‑digit SITC groups (i.e., SITC 7757 and SITC 7783 are aggregates of parts and final goods that cannot be broken down further in the data).
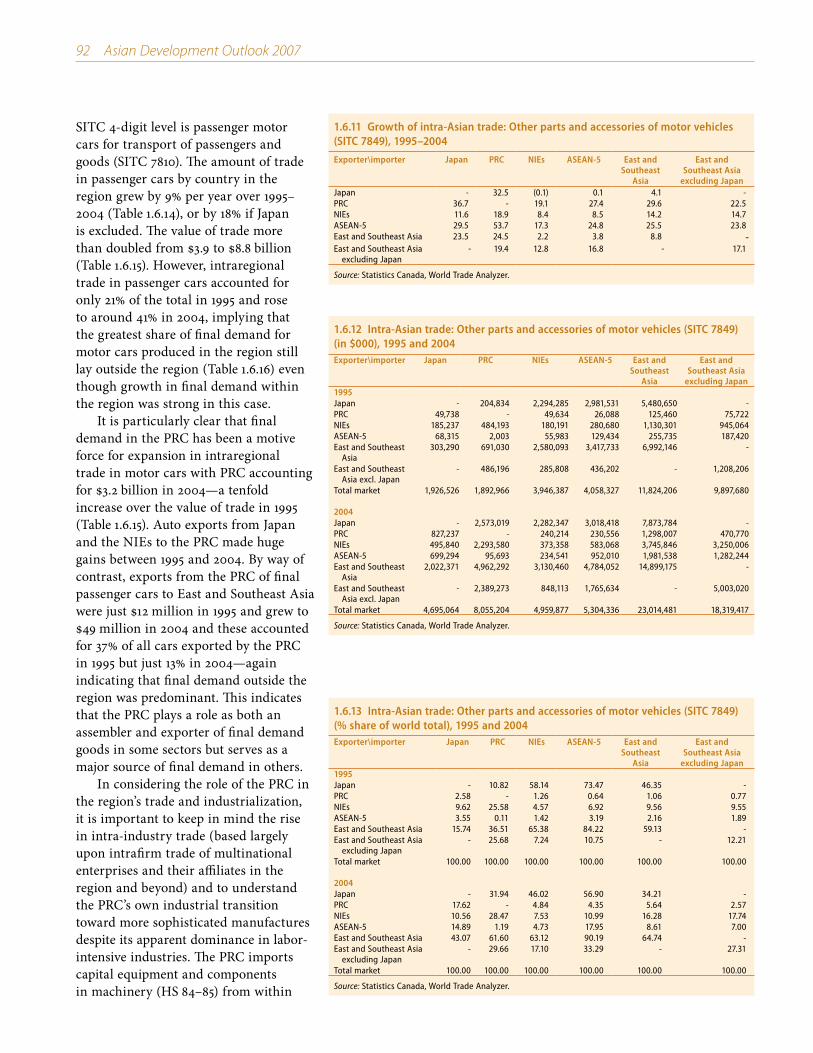
In transportation equipment, SITC 7849 (other parts and accessories of motor vehicles) is the leading 4‑digit product group in the imports of transport equipment in PRC, NIEs, and ASEAN‑5 individually and is the second largest category in Japan. SITC 7849 is the second largest category within transportation equipment exports in Japan and the NIEs and is the largest category in both the PRC and ASEAN‑5. The share of SITC 7849 in total imports of transportation machinery in East and Southeast Asia rose to 43% in 2004 from 28% in 1995 (excluding Japan the increase was from 33% to 46%). In terms of exports, the share of SITC 7849 was constant over the period at 23%, but if Japan is excluded the increase was from 17% in 1995 to 27% in 2004. In global trade the share of SITC 7849 actually fell from 27% to 26%. Growth in exports of SITC 7849 in East and Southeast Asia excluding Japan was 20% per year over 1995–2004 compared with global growth of 7% per year.
It is more difficult to disaggregate trade in intermediate products in the other machinery sectors. However, within nonelectrical machinery, SITC categories 7414, 7492, 7591, 7499, and 7139 consist wholly or partially of parts and components and accounted for 17% of exports of East and Southeast Asia (excluding Japan) in 2004 compared with 15% in 1995. Growth in exports of these 4‑digit product groups from East and Southeast Asia excluding Japan exceeded world growth in each category.
The PRC is a real source of growth of intraregional trade and is known as the assembly point of final goods for export to third markets
Trade and structural change in East and Southeast Asia 91
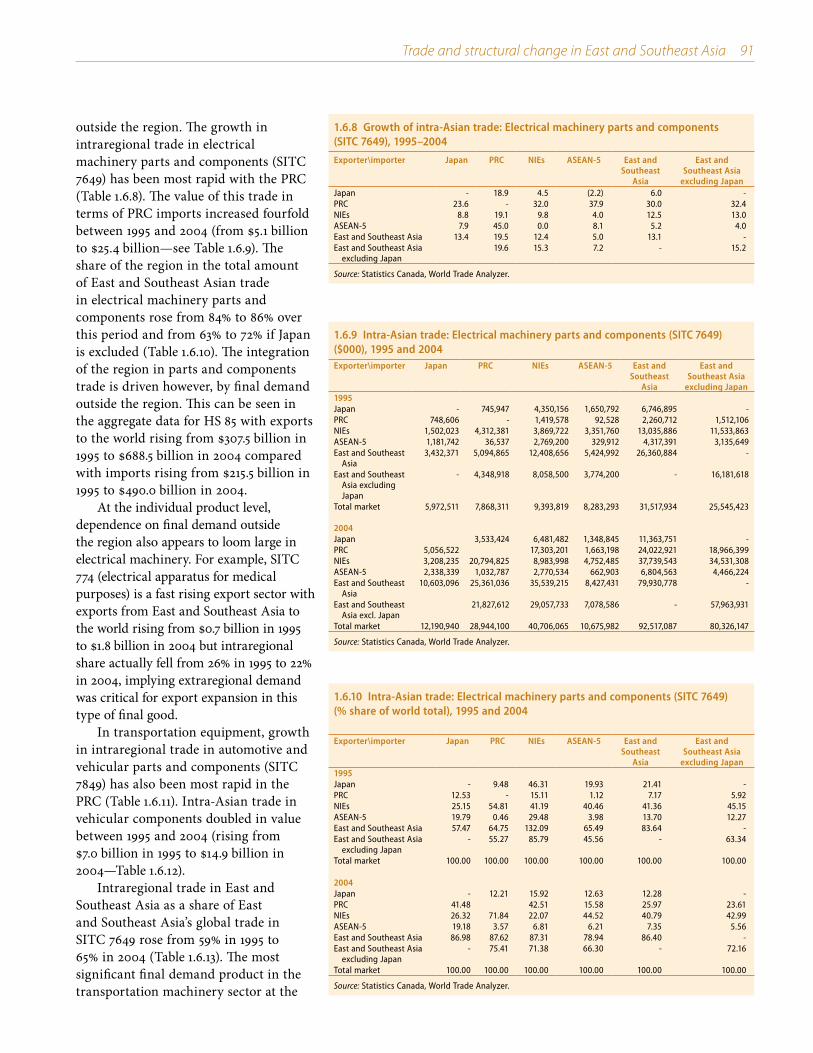
outside the region. The growth in intraregional trade in electrical machinery parts and components (SITC 7649) has been most rapid with the PRC (Table 1.6.8). The value of this trade in terms of PRC imports increased fourfold between 1995 and 2004 (from $5.1 billion to $25.4 billion—see Table 1.6.9). The share of the region in the total amount of East and Southeast Asian trade in electrical machinery parts and components rose from 84% to 86% over this period and from 63% to 72% if Japan is excluded (Table 1.6.10). The integration of the region in parts and components trade is driven however, by final demand outside the region. This can be seen in the aggregate data for HS 85 with exports to the world rising from $307.5 billion in 1995 to $688.5 billion in 2004 compared with imports rising from $215.5 billion in 1995 to $490.0 billion in 2004.
At the individual product level, dependence on final demand outside the region also appears to loom large in electrical machinery. For example, SITC 774 (electrical apparatus for medical purposes) is a fast rising export sector with exports from East and Southeast Asia to the world rising from $0.7 billion in 1995 to $1.8 billion in 2004 but intraregional share actually fell from 26% in 1995 to 22% in 2004, implying extraregional demand was critical for export expansion in this type of final good.
In transportation equipment, growth in intraregional trade in automotive and vehicular parts and components (SITC 7849) has also been most rapid in the PRC (Table 1.6.11). Intra‑Asian trade in vehicular components doubled in value between 1995 and 2004 (rising from $7.0 billion in 1995 to $14.9 billion in 2004—Table 1.6.12).
Intraregional trade in East and Southeast Asia as a share of East and Southeast Asia’s global trade in SITC 7649 rose from 59% in 1995 to 65% in 2004 (Table 1.6.13). The most significant final demand product in the transportation machinery sector at the
1.6.8 Growth of intra‑Asian trade: Electrical machinery parts and components (SITC 7649), 1995–2004
Exporter\importer Japan PRC NIEs ASEAN‑5 East and Southeast
Asia
East and Southeast Asia
excluding JapanJapan - 18.9 4.5 (2.2) 6.0 -PRC 23.6 - 32.0 37.9 30.0 32.4NIEs 8.8 19.1 9.8 4.0 12.5 13.0ASEAN-5 7.9 45.0 0.0 8.1 5.2 4.0East and Southeast Asia 13.4 19.5 12.4 5.0 13.1 -East and Southeast Asia
excluding Japan19.6 15.3 7.2 - 15.2
Source: Statistics Canada, World Trade Analyzer.
1.6.9 Intra‑Asian trade: Electrical machinery parts and components (SITC 7649) ($000), 1995 and 2004Exporter\importer Japan PRC NIEs ASEAN‑5 East and
Southeast Asia
East and Southeast Asia
excluding Japan1995Japan - 745,947 4,350,156 1,650,792 6,746,895 -PRC 748,606 - 1,419,578 92,528 2,260,712 1,512,106NIEs 1,502,023 4,312,381 3,869,722 3,351,760 13,035,886 11,533,863ASEAN-5 1,181,742 36,537 2,769,200 329,912 4,317,391 3,135,649East and Southeast
Asia3,432,371 5,094,865 12,408,656 5,424,992 26,360,884 -
East and Southeast Asia excluding Japan
- 4,348,918 8,058,500 3,774,200 - 16,181,618
Total market 5,972,511 7,868,311 9,393,819 8,283,293 31,517,934 25,545,423
2004Japan 3,533,424 6,481,482 1,348,845 11,363,751 -PRC 5,056,522 17,303,201 1,663,198 24,022,921 18,966,399NIEs 3,208,235 20,794,825 8,983,998 4,752,485 37,739,543 34,531,308ASEAN-5 2,338,339 1,032,787 2,770,534 662,903 6,804,563 4,466,224East and Southeast
Asia10,603,096 25,361,036 35,539,215 8,427,431 79,930,778 -
East and Southeast Asia excl. Japan
21,827,612 29,057,733 7,078,586 - 57,963,931
Total market 12,190,940 28,944,100 40,706,065 10,675,982 92,517,087 80,326,147
Source: Statistics Canada, World Trade Analyzer.
1.6.10 Intra‑Asian trade: Electrical machinery parts and components (SITC 7649) (% share of world total), 1995 and 2004
Exporter\importer Japan PRC NIEs ASEAN‑5 East and Southeast
Asia
East and Southeast Asia
excluding Japan1995Japan - 9.48 46.31 19.93 21.41 -PRC 12.53 - 15.11 1.12 7.17 5.92NIEs 25.15 54.81 41.19 40.46 41.36 45.15ASEAN-5 19.79 0.46 29.48 3.98 13.70 12.27East and Southeast Asia 57.47 64.75 132.09 65.49 83.64 -East and Southeast Asia
excluding Japan- 55.27 85.79 45.56 - 63.34
Total market 100.00 100.00 100.00 100.00 100.00 100.00
2004Japan - 12.21 15.92 12.63 12.28 -PRC 41.48 42.51 15.58 25.97 23.61NIEs 26.32 71.84 22.07 44.52 40.79 42.99ASEAN-5 19.18 3.57 6.81 6.21 7.35 5.56East and Southeast Asia 86.98 87.62 87.31 78.94 86.40 -East and Southeast Asia
excluding Japan- 75.41 71.38 66.30 - 72.16
Total market 100.00 100.00 100.00 100.00 100.00 100.00
Source: Statistics Canada, World Trade Analyzer.
92 Asian Development Outlook 2007
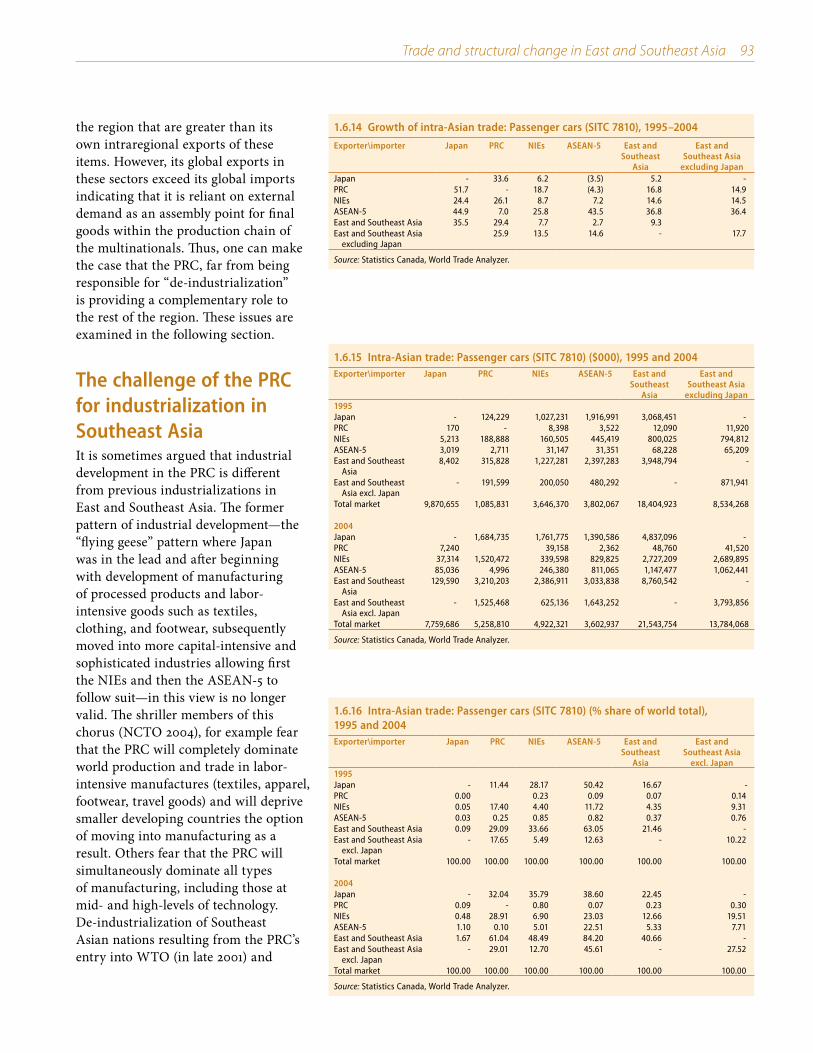
SITC 4‑digit level is passenger motor cars for transport of passengers and goods (SITC 7810). The amount of trade in passenger cars by country in the region grew by 9% per year over 1995–2004 (Table 1.6.14), or by 18% if Japan is excluded. The value of trade more than doubled from $3.9 to $8.8 billion (Table 1.6.15). However, intraregional trade in passenger cars accounted for only 21% of the total in 1995 and rose to around 41% in 2004, implying that the greatest share of final demand for motor cars produced in the region still lay outside the region (Table 1.6.16) even though growth in final demand within the region was strong in this case.
It is particularly clear that final demand in the PRC has been a motive force for expansion in intraregional trade in motor cars with PRC accounting for $3.2 billion in 2004—a tenfold increase over the value of trade in 1995 (Table 1.6.15). Auto exports from Japan and the NIEs to the PRC made huge gains between 1995 and 2004. By way of contrast, exports from the PRC of final passenger cars to East and Southeast Asia were just $12 million in 1995 and grew to $49 million in 2004 and these accounted for 37% of all cars exported by the PRC in 1995 but just 13% in 2004—again indicating that final demand outside the region was predominant. This indicates that the PRC plays a role as both an assembler and exporter of final demand goods in some sectors but serves as a major source of final demand in others.
In considering the role of the PRC in the region’s trade and industrialization, it is important to keep in mind the rise in intra‑industry trade (based largely upon intrafirm trade of multinational enterprises and their affiliates in the region and beyond) and to understand the PRC’s own industrial transition toward more sophisticated manufactures despite its apparent dominance in labor‑intensive industries. The PRC imports capital equipment and components in machinery (HS 84–85) from within
1.6.13 Intra‑Asian trade: Other parts and accessories of motor vehicles (SITC 7849) (% share of world total), 1995 and 2004Exporter\importer Japan PRC NIEs ASEAN‑5 East and
Southeast Asia
East and Southeast Asia
excluding Japan1995Japan - 10.82 58.14 73.47 46.35 -PRC 2.58 - 1.26 0.64 1.06 0.77NIEs 9.62 25.58 4.57 6.92 9.56 9.55ASEAN-5 3.55 0.11 1.42 3.19 2.16 1.89East and Southeast Asia 15.74 36.51 65.38 84.22 59.13 -East and Southeast Asia
excluding Japan- 25.68 7.24 10.75 - 12.21
Total market 100.00 100.00 100.00 100.00 100.00 100.00
2004Japan - 31.94 46.02 56.90 34.21 -PRC 17.62 - 4.84 4.35 5.64 2.57NIEs 10.56 28.47 7.53 10.99 16.28 17.74ASEAN-5 14.89 1.19 4.73 17.95 8.61 7.00East and Southeast Asia 43.07 61.60 63.12 90.19 64.74 -East and Southeast Asia
excluding Japan- 29.66 17.10 33.29 - 27.31
Total market 100.00 100.00 100.00 100.00 100.00 100.00
Source: Statistics Canada, World Trade Analyzer.
1.6.11 Growth of intra‑Asian trade: Other parts and accessories of motor vehicles (SITC 7849), 1995–2004
Exporter\importer Japan PRC NIEs ASEAN‑5 East and Southeast
Asia
East and Southeast Asia
excluding JapanJapan - 32.5 (0.1) 0.1 4.1 - PRC 36.7 - 19.1 27.4 29.6 22.5 NIEs 11.6 18.9 8.4 8.5 14.2 14.7 ASEAN-5 29.5 53.7 17.3 24.8 25.5 23.8 East and Southeast Asia 23.5 24.5 2.2 3.8 8.8 -East and Southeast Asia
excluding Japan- 19.4 12.8 16.8 - 17.1
Source: Statistics Canada, World Trade Analyzer.
1.6.12 Intra‑Asian trade: Other parts and accessories of motor vehicles (SITC 7849) (in $000), 1995 and 2004Exporter\importer Japan PRC NIEs ASEAN‑5 East and
Southeast Asia
East and Southeast Asia
excluding Japan1995Japan - 204,834 2,294,285 2,981,531 5,480,650 -PRC 49,738 - 49,634 26,088 125,460 75,722NIEs 185,237 484,193 180,191 280,680 1,130,301 945,064ASEAN-5 68,315 2,003 55,983 129,434 255,735 187,420East and Southeast
Asia303,290 691,030 2,580,093 3,417,733 6,992,146 -
East and Southeast Asia excl. Japan
- 486,196 285,808 436,202 - 1,208,206
Total market 1,926,526 1,892,966 3,946,387 4,058,327 11,824,206 9,897,680
2004Japan - 2,573,019 2,282,347 3,018,418 7,873,784 -PRC 827,237 - 240,214 230,556 1,298,007 470,770NIEs 495,840 2,293,580 373,358 583,068 3,745,846 3,250,006ASEAN-5 699,294 95,693 234,541 952,010 1,981,538 1,282,244East and Southeast
Asia2,022,371 4,962,292 3,130,460 4,784,052 14,899,175 -
East and Southeast Asia excl. Japan
- 2,389,273 848,113 1,765,634 - 5,003,020
Total market 4,695,064 8,055,204 4,959,877 5,304,336 23,014,481 18,319,417
Source: Statistics Canada, World Trade Analyzer.
Trade and structural change in East and Southeast Asia 93
the region that are greater than its own intraregional exports of these items. However, its global exports in these sectors exceed its global imports indicating that it is reliant on external demand as an assembly point for final goods within the production chain of the multinationals. Thus, one can make the case that the PRC, far from being responsible for “de‑industrialization” is providing a complementary role to the rest of the region. These issues are examined in the following section.
The challenge of the PRC for industrialization in Southeast AsiaIt is sometimes argued that industrial development in the PRC is different from previous industrializations in East and Southeast Asia. The former pattern of industrial development—the “flying geese” pattern where Japan was in the lead and after beginning with development of manufacturing of processed products and labor‑intensive goods such as textiles, clothing, and footwear, subsequently moved into more capital‑intensive and sophisticated industries allowing first the NIEs and then the ASEAN‑5 to follow suit—in this view is no longer valid. The shriller members of this chorus (NCTO 2004), for example fear that the PRC will completely dominate world production and trade in labor‑intensive manufactures (textiles, apparel, footwear, travel goods) and will deprive smaller developing countries the option of moving into manufacturing as a result. Others fear that the PRC will simultaneously dominate all types of manufacturing, including those at mid‑ and high‑levels of technology. De‑industrialization of Southeast Asian nations resulting from the PRC’s entry into WTO (in late 2001) and
1.6.16 Intra‑Asian trade: Passenger cars (SITC 7810) (% share of world total), 1995 and 2004Exporter\importer Japan PRC NIEs ASEAN‑5 East and
Southeast Asia
East and Southeast Asia
excl. Japan1995Japan - 11.44 28.17 50.42 16.67 -PRC 0.00 0.23 0.09 0.07 0.14NIEs 0.05 17.40 4.40 11.72 4.35 9.31ASEAN-5 0.03 0.25 0.85 0.82 0.37 0.76East and Southeast Asia 0.09 29.09 33.66 63.05 21.46 -East and Southeast Asia
excl. Japan- 17.65 5.49 12.63 - 10.22
Total market 100.00 100.00 100.00 100.00 100.00 100.00
2004Japan - 32.04 35.79 38.60 22.45 -PRC 0.09 - 0.80 0.07 0.23 0.30NIEs 0.48 28.91 6.90 23.03 12.66 19.51ASEAN-5 1.10 0.10 5.01 22.51 5.33 7.71East and Southeast Asia 1.67 61.04 48.49 84.20 40.66 -East and Southeast Asia
excl. Japan- 29.01 12.70 45.61 - 27.52
Total market 100.00 100.00 100.00 100.00 100.00 100.00
Source: Statistics Canada, World Trade Analyzer.
1.6.14 Growth of intra‑Asian trade: Passenger cars (SITC 7810), 1995–2004
Exporter\importer Japan PRC NIEs ASEAN‑5 East and Southeast
Asia
East and Southeast Asia
excluding JapanJapan - 33.6 6.2 (3.5) 5.2 - PRC 51.7 - 18.7 (4.3) 16.8 14.9 NIEs 24.4 26.1 8.7 7.2 14.6 14.5 ASEAN-5 44.9 7.0 25.8 43.5 36.8 36.4 East and Southeast Asia 35.5 29.4 7.7 2.7 9.3 East and Southeast Asia
excluding Japan 25.9 13.5 14.6 - 17.7
Source: Statistics Canada, World Trade Analyzer.
1.6.15 Intra‑Asian trade: Passenger cars (SITC 7810) ($000), 1995 and 2004Exporter\importer Japan PRC NIEs ASEAN‑5 East and
Southeast Asia
East and Southeast Asia
excluding Japan1995Japan - 124,229 1,027,231 1,916,991 3,068,451 -PRC 170 - 8,398 3,522 12,090 11,920 NIEs 5,213 188,888 160,505 445,419 800,025 794,812 ASEAN-5 3,019 2,711 31,147 31,351 68,228 65,209 East and Southeast
Asia 8,402 315,828 1,227,281 2,397,283 3,948,794 -
East and Southeast Asia excl. Japan
- 191,599 200,050 480,292 - 871,941
Total market 9,870,655 1,085,831 3,646,370 3,802,067 18,404,923 8,534,268
2004Japan - 1,684,735 1,761,775 1,390,586 4,837,096 -PRC 7,240 39,158 2,362 48,760 41,520 NIEs 37,314 1,520,472 339,598 829,825 2,727,209 2,689,895 ASEAN-5 85,036 4,996 246,380 811,065 1,147,477 1,062,441 East and Southeast
Asia 129,590 3,210,203 2,386,911 3,033,838 8,760,542 -
East and Southeast Asia excl. Japan
- 1,525,468 625,136 1,643,252 - 3,793,856
Total market 7,759,686 5,258,810 4,922,321 3,602,937 21,543,754 13,784,068
Source: Statistics Canada, World Trade Analyzer.
94 Asian Development Outlook 2007
improving access to capital inflows and markets abroad are particular concerns (McKibbin and Woo 2003).
The more optimistic about the emergence of the PRC make almost equally fallacious arguments—to the extent of claiming that Asia can soon jettison its reliance on US consumer spending (and to a lesser extent, spending by Western European and Japanese consumers) because of the phenomenal growth in the PRC. Uncoupling of Asia from the US and EU in this view will be occurring rapidly as Asia shifts its focus in favor of fast‑growing insatiable demand in the 1.3 billion strong PRC consumer market.
A careful analysis based upon the data paints a much more nuanced view of the role that the PRC is likely to take (assuming it avoids the disastrous collapse predicted for it by pundits such as Gordon Chang). The data presented in this section tend to support this more nuanced view—the PRC may take some of the lunch from Southeast Asia this afternoon but is likely to need to invite the same countries to dine with it in the evening. That is, the PRC prowess in labor‑intensive manufacturing may lead it to gain market share in trade and FDI at the expense of countries such as Thailand, Indonesia, Viet Nam, and the Philippines. However, rapid growth in the PRC economy will also depend on increased imports of raw materials and intermediate inputs from Southeast Asia as well as capital equipment and technology from the NIEs. Eichengreen and Tong (2005) argue that the trade and FDI impact of the PRC’s emergence will be negative for producers in low‑income countries in Southeast Asia that specialize in labor‑intensive manufactures and other consumer goods but positive for high‑income countries in East Asia that export high‑technology components and capital goods.
McKibbin and Woo (2003) estimate that if the PRC’s membership in WTO increases its attractiveness as a destination for FDI, this is likely to come at the expense of Southeast Asia and result in losses in GDP of significant amounts for Thailand, Malaysia, Philippines, and Indonesia—unless these countries can rapidly upgrade their human resources in order to move more rapidly into sophisticated manufacturing where productivity growth is likely. Srinivasan (2006) makes the argument that competition for resources between the PRC and India will provide a large dividend for exporters in some of the poorer countries and regions of the world and that any negative effects (such as congestion in demand for shipping) will be short term.
The real danger is that the PRC’s success (followed by emergence of India in complementary activities) might set off a protectionist backlash that will have negative global repercussions. Srinivasan (2006) cites the “blatantly protectionist response” of the EU and US to competition from the PRC in their textile and clothing industries as well as threats by US politicians to impose an across the board discriminatory tariff against products from the PRC unless the authorities there revalue the yuan. In addition, threats of increased use of antidumping measures appear to be legitimate as the EU has moved to impose antidumping duties on footwear from the PRC and the US on staple fiber exports from the PRC. Overall, the PRC’s impact on the region and the world economy is positive and this is likely to continue, provided the PRC can constantly implement economic and political reforms necessary to sustain growth. A successful revival and conclusion to the Doha Round negotiations

Trade and structural change in East and Southeast Asia 95
in WTO would go a long way toward reducing protectionist threats to sustained growth in the region.
Does the rapid rise of manufacturing in the PRC led by booming exports of assembled machinery products and labor‑intensive consumer goods imply that the rest of East and Southeast Asia will be displaced as manufacturing centers and as hosts for FDI? Data on global production shares show that the PRC doubled its share from 3.5% in 1994 to 7.0% in 2003, yet the NIEs and ASEAN‑5 also increased their share in world production from 7.0% to 9.0% over the same decade (The Economist 2007). And as has been documented above, ASEAN‑5 was able to lift its export share in world markets over roughly the same period, hardly lending support to the argument that the PRC poses a threat. In fact, The Economist argues that the PRC is losing favor relative to Southeast Asia as a manufacturing location and FDI host, as multinationals are adopting a “PRC plus one” strategy in which they invest in the PRC and in at least one ASEAN country simultaneously.
A recently released study for the World Bank (Winters and Yusuf 2007) also provides support for the nuanced view of assorted complementary and competitive impacts of the PRC on the exports and manufacturing competitiveness of ASEAN countries. Empirical data also tend to support the view of a complementary role for the PRC vis‑à‑vis ASEAN trade and manufacturing. For example, recent data show that ASEAN increased its market share in the US apparel market, in 2006 from 2005, to 19.3% from 17.3% in value and to 18.9% from 16.7% in volume.6 In particular, low‑income ASEAN members, such as Cambodia, Indonesia, and Lao People’s Democratic Republic, have done well in expanding their market shares in the US clothing market.
This indicates that the PRC is not closing off opportunities for low‑income countries to enter the manufacturing process along the lines of the traditional “flying geese” pattern. Critical to this process is openness to trade and FDI, market‑friendly policies, and institutional reforms at customs and tax departments (and elsewhere) so that export‑oriented growth may take root and then bloom.
Conclusion The main findings of this chapter, based upon the empirical analysis of recent trade data, are broadly encouraging for the future prospects of the economies of East and Southeast Asia. Fundamentally, the processes of regional integration and regional cooperation are binding these economies closer together as trade and cross‑border investments are mutually reinforcing. The key message from earlier sections is that globalization is the driving force behind increasing regional integration in Asia. Final demand emanating from outside the region is still crucial in the expansion of exports of manufactures from East and Southeast Asia. This is shown to be the case in traditional labor‑intensive goods and in more sophisticated products, such as electrical machinery and motor cars. Thus, the economies of East and Southeast Asia are definitely not uncoupling from global markets, indeed they have become ever more closely linked with the large markets of the industrial economies.
East and Southeast Asia have concentrated their export manufactures

96 Asian Development Outlook 2007
in the fastest‑growing industries in world trade and this has allowed them to enhance their manufacturing capabilities in more sophisticated products while expanding their market shares. The rising trade shares of developing Asia in world trade underscores the fact that trade growth is indeed influenced by the composition of what countries export.
The pattern of trade and structural change in developing Asia has consistently followed the “flying geese” pattern and this remains the case for the PRC and emerging economies such as Indonesia and Viet Nam. The process of industrialization is being fostered by the rise in intra‑industry trade. Although such trade has been stagnant or declining in traditional labor‑intensive manufacturing (textiles, clothing, and footwear), it has been on the rise in more dynamic industrial branches, including in technology‑intensive and human capital‑intensive manufacturing sectors, as well as in natural resource‑intensive products.
Most of the economies in the region initially stimulated openness by setting up special economic zones, export processing zones, and industrial bonded zones that encourage FDI and provide export‑oriented firms with imported inputs free of tax and duty. Eventually they went further in cutting tariffs and opening the entire economy to trade and investment.
Within East and Southeast Asia, there has been explosive growth in trade in intermediate products—especially in parts and components of electrical machinery and transportation equipment centered on the PRC as the assembly point for final goods. The fact that intra‑Asian trade has flourished indicates that multinational enterprises in the region tend to have high propensities to engage in vertical production sharing and have much higher export‑sales ratios than in other parts of the world. The PRC has a nuanced impact on the process of industrialization elsewhere in the region. Southeast Asia competes in world markets with the PRC in labor‑intensive manufacturing but the PRC is largely complementary to the rest of East and Southeast Asia in natural resource‑based products and human capital‑ and technology‑intensive manufactures.
Policy implications are as follows:Market access to third country markets, especially in North America and Europe, is vital to further export expansion in East and Southeast Asia and this means a successful and ambitious Doha Round is in the interest of the region.Globalization, technological change and competition requires the East and Southeast Asian economies to employ resources flexibly with ease of entry and exit.Countries may initiate the process of structural change by adopting or simulating open‑economy policies that impart market discipline to firms and investors.Liberalization of trade and investment on a unilateral basis is still the most important route for reaping the gains from trade in the region and bilateral initiatives have not had much impact.Productivity improvements at the firm level have helped to ensure competitiveness and will continue to be essential to further develop global and regional integration through trade.Second generation reforms aimed at developing markets and institutions that are missing, incomplete, or inefficient are necessary to generalize open economy policies in the PRC and Southeast Asian economies.
•
•
•
•
•
•

Trade and structural change in East and Southeast Asia 97
Endnotes
1 Although India is becoming a significant global supplier of services, particularly those asso‑ciated with information technology outsourcing (Winters and Yusuf 2007), services are not covered in this chapter.
2 Data from World Trade Analyzer of Statistics Canada in Standard International Trade Clas‑sification format were mapped into HS chapter categories using a concordance from Jon Haveman: www.haveman.org.
3 World imports are equal to world exports in the World Trade Analyzer database.4 The Agreement on Textiles and Clothing (ATC) ended the system of global quotas on
December 31, 2004. See ADB (2006), pp. 36–57 for an in‑depth analysis of textiles and apparel trade in the region.
5 The United States and European Communities have both placed renewed quota restrictions on certain textile and clothing products from the PRC beginning in late 2005 (ADB 2006). These restrictions will be in place through 2008 and, although they are to be progressively loosened, they will limit the ability of the PRC to increase its shares of these items.
6 Data from the United States Office of Textiles and Apparel: http://www.OTEXA.ita.doc.gov/.
ReferencesAnson, Robin and Guillaume Brocklehurst. 2006. World Markets for Textile
Machinery, 2006: Part 2-Fabric Manufacture. Textiles Intelligence. December.
Asian Development Bank. 2006. “Routes for Asia’s Trade.” Asian Development Outlook 2006. Hong Kong, China.
Eichengreen, Barry and Hui Tong. 2005. “How China is Reorganizing the World Economy.” Paper prepared for the inaugural meeting of the Asian Economic Policy Panel. Tokyo. 22 October 2005.
General Agreement on Tariffs and Trade (GATT). 1994. Agreement on Textiles and Clothing. Geneva.
Grubel, Herbert G. and Peter Lloyd. 1975. Intra-Industry Trade: The Theory and Measurement of International Trade in Differentiated Products. London: Basingstoke.
McKibbin, Warwick J. and Wing Thye Woo. 2003. “The Consequences of China’s WTO Accession on its Neighbors.” Working Papers in Trade and Development No. 2003/17. Canberra: The Australian National University, Division of Economics, Research School of Pacific and Asian Studies. August.
National Council of Textile Organizations (NCTO). 2004. The China Threat to World Textile and Apparel Trade. Washington, DC. July 15.
Organisation for Economic Co‑operation and Development (OECD). 2002. “Intra‑Industry and Intra‑Firm Trade and the Internationalisation of Production.” In Economic Outlook No. 71, Chapter 6, pp. 159–70. Paris.
Srinivasan, T. N. 2006. “China, India and the World Economy.” Stanford Center for International Development Working Paper No. 286. 3 July.
The Economist. 2007. “The Problem with Made in China.” January 13, pp. 68–70.Winters, L. Alan and Shahid Yusuf, editors. 2007. Dancing with Giants: China,
India and the Global Economy. Washington, DC and Singapore: The World Bank and Institute of Policy Studies.

98 Asian Development Outlook 2007
A.1.6.1 Structure of trade in East and Southeast Asia (% share of world total), 1995 and 2004
HS category Japan China, People’s Rep. of
NIEs ASEAN‑5 East and Southeast Asia
1995 imports28–38 4.52 4.57 9.13 4.28 22.5039–40 4.10 2.53 6.63 3.20 16.4741–43 3.01 12.89 19.31 4.41 39.6244–46 19.03 2.87 7.38 1.88 31.1647–49 3.85 2.78 6.79 2.97 16.3950–60 3.50 11.53 15.16 5.17 35.3561–63 10.73 0.87 7.24 0.51 19.3464–67 6.06 0.14 3.95 0.35 10.5168–70 3.65 2.17 8.94 4.56 19.3271 8.11 0.47 11.79 3.34 23.7272–83 4.97 3.59 9.73 5.61 23.9084 3.57 4.24 10.04 5.58 23.4385 4.78 3.68 17.42 7.86 33.7386–89 2.82 1.22 4.80 3.31 12.1590–91 6.20 3.04 13.72 3.40 26.3692 6.25 1.54 11.58 3.77 23.1393 4.96 0.05 7.73 5.12 17.8794–97 5.44 1.54 7.20 1.71 15.89
1995 exports28–38 5.93 1.99 7.13 1.32 16.3739–40 11.47 1.45 8.18 13.39 34.4941–43 0.99 3.12 17.65 2.09 23.8644–46 0.16 1.99 3.13 14.58 19.8747–49 1.86 0.71 3.72 1.75 8.0550–60 4.48 6.87 22.68 3.48 37.5161–63 0.53 14.79 19.48 7.02 41.8264–67 0.18 14.77 22.60 11.54 49.0968–70 10.68 4.18 6.52 2.95 24.3371 0.59 1.18 3.71 3.02 8.5172–83 7.60 3.12 8.23 1.41 20.3684 14.76 1.17 12.24 2.50 30.6785 15.97 2.84 21.41 7.92 48.1486–89 15.45 0.65 4.21 0.72 21.0390–91 17.24 2.64 11.49 1.61 32.9992 11.94 2.48 12.13 2.09 28.6593 0.54 0.14 0.65 0.14 1.4894–97 3.11 6.54 16.03 4.19 29.88
2004 imports28–38 3.33 6.91 6.44 3.07 19.7539–40 3.00 5.23 4.37 2.80 15.3941–43 1.98 20.92 16.67 3.54 43.1144–46 10.53 4.36 3.56 1.14 19.6047–49 2.47 5.45 4.18 2.72 14.8250–60 2.21 13.31 10.29 4.79 30.6161–63 7.99 1.21 6.80 0.54 16.5364–67 4.60 0.32 4.01 0.51 9.4468–70 3.37 3.77 8.17 2.76 18.0771 2.21 2.26 12.00 2.06 18.5372–83 3.53 6.72 8.55 4.02 22.8284 3.67 7.76 9.30 3.67 24.3985 4.53 10.61 16.91 6.46 38.5286–89 1.91 2.03 2.54 1.62 8.1090–91 5.79 10.66 14.42 2.76 33.6292 6.50 5.13 8.64 2.76 23.0293 6.61 0.12 9.84 0.69 17.2594–97 4.19 1.80 5.61 1.33 12.92
2004 exports28–38 4.96 2.90 7.52 1.94 17.3339–40 9.40 4.59 6.94 11.55 32.4741–43 0.59 7.70 17.07 1.63 27.0044–46 0.12 5.62 1.37 8.72 15.8347–49 1.95 1.89 3.49 3.01 10.3350–60 3.97 13.94 17.81 3.68 39.4061–63 0.40 24.59 12.00 5.89 42.8764–67 0.05 27.57 10.52 11.87 50.0168–70 8.19 9.06 4.77 3.82 25.8371 0.53 1.88 5.91 1.52 9.8472–83 6.10 7.34 7.95 1.96 23.3584 9.75 9.42 12.00 4.27 35.4485 9.81 11.20 25.01 8.11 54.1386–89 13.21 2.11 5.86 0.90 22.0890–91 13.75 6.56 13.13 2.11 35.5692 10.50 5.51 19.38 2.99 38.3893 0.81 0.06 1.90 0.09 2.8594–97 2.23 14.10 9.98 3.88 30.19
Source: Statistics Canada, World Trade Analyzer.
Trade and structural change in East and Southeast Asia 99
A.1.6.2 Composition of trade: East and Southeast Asia (% share to total imports/exports), 1995 and 2004
HS category Japan PRC Korea, Rep. of
Taipei,China Hong Kong, China
Singapore Indonesia Malaysia Philippines Thailand Viet Nam
1995 imports01–05 8.57 0.86 1.41 1.71 2.35 1.17 1.01 1.14 2.45 1.25 0.9706–10 4.05 2.38 2.24 2.29 1.55 1.25 5.02 2.10 3.23 0.80 2.4211–24 3.48 3.49 2.33 2.71 2.34 1.82 3.73 1.75 4.99 1.45 7.9825–26 2.84 1.85 2.44 1.18 0.78 0.54 1.61 0.84 2.11 0.47 1.3827 15.60 3.66 14.08 3.77 2.17 8.37 5.43 2.18 10.02 6.39 9.4728–38 7.18 13.68 9.91 12.54 8.57 5.86 14.64 6.48 10.32 9.75 15.9139–40 0.71 0.82 0.82 0.74 0.56 0.77 0.97 0.74 0.87 0.65 1.1841–43 0.30 2.44 1.61 0.86 1.91 0.11 1.38 0.22 0.48 0.72 1.0144–46 4.32 1.23 1.79 1.48 0.69 0.38 0.22 0.15 0.66 1.36 0.1747–49 1.64 2.22 2.08 2.24 1.89 0.99 2.53 1.55 1.93 1.65 1.7050–60 1.99 12.34 4.13 2.58 10.69 1.65 6.65 2.86 5.21 3.37 9.3961–63 6.91 1.05 1.18 1.45 6.14 1.49 0.50 0.49 0.62 0.28 1.1064–67 0.83 0.04 0.15 0.23 0.60 0.26 0.02 0.10 0.13 0.03 0.0568–70 0.53 0.59 0.96 0.85 0.75 0.67 0.65 1.17 0.80 0.89 0.7471 1.14 0.13 0.10 0.16 2.72 0.43 0.04 0.21 0.01 1.81 0.2572–83 6.00 8.16 9.27 9.98 5.54 5.48 10.08 7.87 8.58 12.01 7.4284 8.88 19.89 18.56 15.31 10.65 18.99 24.15 18.72 14.85 20.97 14.6285 9.71 14.08 13.48 22.47 21.26 31.38 7.90 36.27 19.30 17.63 8.9186–89 5.24 4.26 4.19 7.79 5.42 5.37 8.65 7.63 8.10 10.24 9.4490–91 3.27 3.03 4.77 4.07 5.18 3.63 1.77 2.94 2.07 2.72 2.1192 0.62 0.29 0.46 0.38 0.59 1.39 0.16 0.43 0.23 0.96 0.4293 0.12 0.00 0.20 0.27 0.00 0.05 0.34 0.07 0.33 0.16 0.0094–97 4.27 2.28 1.69 2.41 5.27 3.93 1.62 1.75 2.34 2.02 2.361995 exports01–05 0.17 3.68 1.36 2.91 0.75 0.64 3.85 0.92 2.94 9.01 10.6106–10 0.12 3.27 0.71 0.56 0.71 1.16 3.02 0.70 4.07 6.98 20.9311–24 0.24 2.17 0.43 0.29 1.73 2.18 3.99 7.58 6.03 3.45 2.6725–26 0.26 0.80 0.31 0.31 0.52 0.31 4.13 0.37 1.70 0.55 0.3127 0.62 3.58 1.99 0.21 0.97 6.91 25.52 7.01 1.51 0.73 19.5528–38 6.65 6.62 7.15 7.58 6.28 5.27 3.59 3.06 1.98 4.01 0.7439–40 1.39 0.52 1.35 0.90 0.33 0.88 4.85 2.67 0.27 5.14 1.4741–43 0.07 0.66 1.47 1.10 1.28 0.09 0.23 0.07 0.03 0.84 0.2844–46 0.03 0.95 0.13 0.54 0.57 0.35 11.13 6.32 1.00 0.72 1.4047–49 0.56 0.64 0.95 0.87 1.18 0.53 3.20 0.51 0.50 0.74 0.0750–60 1.80 8.17 10.20 9.70 7.99 1.30 5.89 1.66 1.15 3.56 1.3361–63 0.24 19.94 5.03 3.67 15.44 1.38 8.25 3.20 7.20 10.09 18.6164–67 0.02 4.22 1.00 0.73 4.26 0.11 4.43 0.15 0.89 3.70 9.7168–70 1.09 1.26 0.27 0.78 0.70 0.37 0.64 0.60 0.52 0.82 0.8271 0.06 0.35 0.02 0.03 0.83 0.13 0.03 0.14 0.04 2.10 0.3172–83 6.48 7.88 8.11 7.82 4.21 3.33 3.06 2.71 3.26 2.33 0.6684 25.92 6.10 9.68 24.08 9.72 31.34 1.95 13.50 2.92 14.28 0.5985 22.89 12.07 29.85 19.65 20.87 32.92 5.39 38.80 56.22 16.67 0.5286–89 20.28 2.54 12.83 3.37 1.21 1.84 1.05 2.83 1.38 2.40 0.3390–91 6.42 2.92 1.47 2.31 6.23 3.00 0.49 1.62 0.36 2.06 0.1792 0.84 0.52 1.11 0.52 0.53 0.70 0.23 0.41 0.07 0.40 0.0193 0.01 0.01 0.03 0.01 0.00 0.00 0.00 0.00 0.00 0.01 0.0194–97 1.72 10.76 2.60 8.39 13.05 2.62 4.30 3.52 4.73 8.42 2.822004 imports01–05 5.06 0.66 1.63 0.97 1.57 0.98 1.94 1.24 1.66 1.17 1.4206–10 3.02 0.70 1.53 1.34 0.79 0.79 3.55 1.72 2.18 1.00 1.7911–24 2.57 2.23 1.42 1.66 0.93 1.12 4.06 1.98 3.20 1.99 3.9525–26 2.69 3.30 3.33 1.44 0.23 0.22 1.38 0.88 1.27 0.84 0.4527 20.37 8.03 20.63 3.85 2.43 14.85 18.37 5.70 10.25 6.01 11.1228–38 7.68 12.20 9.08 12.78 6.18 6.43 15.74 7.53 7.59 11.52 13.6739–40 0.62 0.83 0.61 0.49 0.40 0.55 1.02 0.82 0.85 0.76 0.8641–43 0.18 1.46 0.53 0.38 1.82 0.08 0.40 0.13 0.12 0.60 2.2744–46 2.36 0.75 0.70 0.64 0.31 0.14 0.32 0.24 0.37 0.40 0.9547–49 0.93 1.56 0.98 1.19 0.81 0.53 2.57 1.16 1.42 1.27 1.6850–60 1.02 4.71 1.88 0.96 5.41 0.65 5.40 1.25 3.33 2.70 9.3361–63 6.17 0.71 1.67 1.12 5.88 1.35 0.61 0.52 0.56 0.51 1.2964–67 0.61 0.03 0.20 0.17 0.52 0.17 0.04 0.15 0.12 0.07 0.0268–70 0.52 0.44 0.91 0.93 0.58 0.40 0.57 0.62 0.59 0.68 0.5071 0.38 0.30 0.04 0.12 3.11 0.42 0.01 0.08 0.03 1.84 0.1972–83 5.17 7.54 9.24 10.53 4.69 4.32 9.16 6.95 4.60 11.67 11.9384 11.32 18.33 12.29 17.76 15.83 19.66 14.38 17.02 11.31 19.99 15.5885 13.01 23.31 19.03 25.83 32.14 30.63 6.25 37.17 42.53 21.13 8.2386–89 4.59 3.74 2.90 4.37 2.24 5.12 7.70 4.97 3.66 5.93 7.9090–91 4.11 5.79 5.27 8.58 5.20 4.39 1.30 3.55 2.09 3.39 2.0892 0.69 0.42 0.50 0.39 0.37 0.86 0.18 0.36 0.32 0.79 0.1893 0.08 0.00 0.14 0.14 0.00 0.03 0.02 0.01 0.01 0.02 0.0094–97 4.01 1.32 1.71 1.77 5.21 2.15 1.50 1.86 1.55 2.08 2.162004 exports01–05 0.19 1.63 0.47 0.70 0.34 0.32 2.84 0.65 1.24 4.39 7.9306–10 0.10 1.47 0.33 0.20 0.22 0.48 1.86 0.57 2.43 4.30 7.1111–24 0.20 0.64 0.48 0.16 0.50 0.95 8.13 6.40 2.31 1.90 0.6225–26 0.56 0.64 0.23 0.28 0.19 0.21 4.72 0.27 0.75 0.54 0.6327 0.48 2.42 4.16 1.39 0.27 9.83 17.94 11.52 1.04 2.65 21.2328–38 8.30 4.55 9.03 7.70 4.83 11.59 6.30 5.61 1.81 6.01 1.1339–40 1.41 0.64 1.19 0.77 0.22 0.41 4.52 1.56 0.37 4.23 1.5941–43 0.04 0.48 0.54 0.41 1.62 0.07 0.25 0.03 0.02 0.32 0.2744–46 0.02 0.85 0.04 0.15 0.27 0.09 5.09 2.78 0.38 0.79 0.7347–49 0.53 0.48 0.86 0.46 0.67 0.31 4.40 0.56 0.33 0.83 0.2350–60 1.33 4.38 4.37 4.24 5.25 0.39 4.93 0.96 0.63 1.94 1.1461–63 0.22 12.90 1.68 1.44 11.48 1.12 7.47 1.94 3.56 4.88 18.8164–67 0.01 2.48 0.06 0.16 2.02 0.09 1.95 0.19 0.07 0.84 15.4868–70 0.91 0.95 0.40 0.42 0.30 0.21 0.89 0.42 0.26 0.92 0.9671 0.07 0.22 0.01 0.02 1.52 0.20 0.01 0.01 0.03 1.00 0.1172–83 6.48 7.30 7.56 8.00 3.26 2.12 4.70 3.51 2.16 2.98 1.2884 21.84 19.75 15.25 18.89 14.86 21.10 6.30 19.18 17.49 17.48 2.5985 20.43 21.85 28.76 34.78 33.12 38.04 9.56 34.34 58.51 20.29 4.3486–89 23.05 3.44 18.82 2.48 0.76 1.71 1.63 1.08 3.75 4.56 1.1690–91 7.08 3.16 2.37 5.65 5.74 3.46 0.37 2.47 0.65 2.33 0.4792 0.81 0.40 0.53 1.68 0.41 1.46 0.54 0.59 0.11 0.14 0.0393 0.01 0.00 0.03 0.01 0.00 0.00 0.00 0.00 0.00 0.00 0.0094–97 1.55 9.17 1.68 3.49 9.62 2.01 4.31 3.52 1.94 5.14 7.31Source: Statistics Canada, World Trade Analyzer.