Embed Size (px)
Citation preview

Note: This document has been reproduced in the form in which it was received, without formal editing.
Distr. LIMITED E/ESCWA/SDPD/2007/WP.2 October 2007 ORIGINAL: ENGLISH
ECONOMIC AND SOCIAL COMMISSION FOR WESTERN ASIA (ESCWA)
TRADE AND ENVIRONMENT DIMENSIONS OF THE FISHERIES SECTOR IN THE ARAB COUNTRIES
THE CASE OF YEMEN AND OMAN
United Nations
New York, 2007

ii
Preface
This study was prepared by the Sustainable Development and Productivity Division of the United Nations Economic and Social Commission for Western Asia (ESCWA). This output is among the activities conducted within the framework of the inter-regional United Nations Development Account project entitled “Capacity-Building in Trade and the Environment.”
The designations and maps included in this study do not necessarily reflect the views of the United Nations regarding the international boundary or the legal status of any country, territory or area discussed in the text.
iii
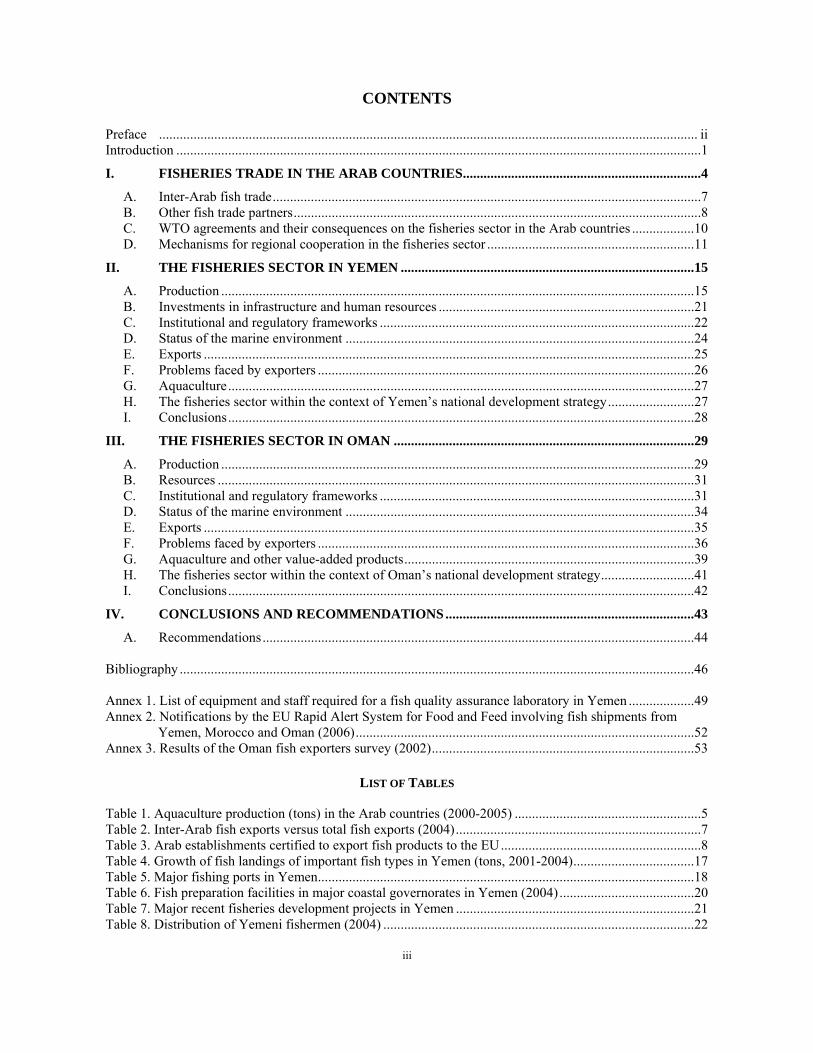
CONTENTS
Preface ............................................................................................................................................................ ii Introduction ........................................................................................................................................................1 I. FISHERIES TRADE IN THE ARAB COUNTRIES.....................................................................4
A. Inter-Arab fish trade............................................................................................................................7 B. Other fish trade partners......................................................................................................................8 C. WTO agreements and their consequences on the fisheries sector in the Arab countries ..................10 D. Mechanisms for regional cooperation in the fisheries sector ............................................................11
II. THE FISHERIES SECTOR IN YEMEN .....................................................................................15 A. Production .........................................................................................................................................15 B. Investments in infrastructure and human resources ..........................................................................21 C. Institutional and regulatory frameworks ...........................................................................................22 D. Status of the marine environment .....................................................................................................24 E. Exports ..............................................................................................................................................25 F. Problems faced by exporters .............................................................................................................26 G. Aquaculture.......................................................................................................................................27 H. The fisheries sector within the context of Yemen’s national development strategy.........................27 I. Conclusions.......................................................................................................................................28
III. THE FISHERIES SECTOR IN OMAN .......................................................................................29 A. Production .........................................................................................................................................29 B. Resources ..........................................................................................................................................31 C. Institutional and regulatory frameworks ...........................................................................................31 D. Status of the marine environment .....................................................................................................34 E. Exports ..............................................................................................................................................35 F. Problems faced by exporters .............................................................................................................36 G. Aquaculture and other value-added products....................................................................................39 H. The fisheries sector within the context of Oman’s national development strategy...........................41 I. Conclusions.......................................................................................................................................42
IV. CONCLUSIONS AND RECOMMENDATIONS........................................................................43 A. Recommendations.............................................................................................................................44
Bibliography .....................................................................................................................................................46 Annex 1. List of equipment and staff required for a fish quality assurance laboratory in Yemen ...................49 Annex 2. Notifications by the EU Rapid Alert System for Food and Feed involving fish shipments from
Yemen, Morocco and Oman (2006)..................................................................................................52 Annex 3. Results of the Oman fish exporters survey (2002)............................................................................53
LIST OF TABLES
Table 1. Aquaculture production (tons) in the Arab countries (2000-2005) ......................................................5 Table 2. Inter-Arab fish exports versus total fish exports (2004).......................................................................7 Table 3. Arab establishments certified to export fish products to the EU..........................................................8 Table 4. Growth of fish landings of important fish types in Yemen (tons, 2001-2004)...................................17 Table 5. Major fishing ports in Yemen.............................................................................................................18 Table 6. Fish preparation facilities in major coastal governorates in Yemen (2004) .......................................20 Table 7. Major recent fisheries development projects in Yemen .....................................................................21 Table 8. Distribution of Yemeni fishermen (2004) ..........................................................................................22
iv
Table 9. Estimated cost to establish a large-scale fish quality assurance laboratory in Yemen .......................24 Table 10. List of mandatory laboratory tests conducted at export points in Yemen ........................................24 Table 11. Growth of Yemeni fish exports by country groupings (1,000 tons).................................................25 Table 12. Growth of Yemeni fish exports by type (1,000 tons) .......................................................................26 Table 13. Key indicators of the Omani fisheries sector (1980-2005)...............................................................29 Table 14. Total fish landings (thousand metric tons) and value (RO million) in Oman ..................................30 Table 15. Current coastal industrial estates in Oman .......................................................................................41
LIST OF FIGURES
Figure 1. Growth of total Arab fish production (1994-2005).............................................................................4 Figure 2. Top Arab fish producers (2005) ..........................................................................................................4 Figure 3. Top Arab fish exporters (2005)...........................................................................................................5 Figure 4. Distribution of Arab fishery export quantities by commodity type (2005).........................................6 Figure 5. Top Arab fish importers (2005) ..........................................................................................................6 Figure 6. Distribution of Arab fishery import quantities by commodity type (2005) ........................................7 Figure 7. Direction and value of Arab fishery exports (2004) ...........................................................................9 Figure 8. Country distribution of fish imports (by value) for Egypt and Saudi Arabia (2005) ..........................9 Figure 9. Growth of fish landings and exports in Yemen (2000-2005)............................................................15 Figure 10. Growth of artisanal fishing production in Yemen as a share of total (2000-2004).........................16 Figure 11. Distribution of landings by governorate in Yemen (2004) .............................................................16 Figure 12. Distribution of landings by species in Yemen (2005).....................................................................16 Figure 13. Fish production and preparation cycle in Yemen............................................................................18 Figure 14. Growth of the share of exports out of total fish landings in Yemen ...............................................25 Figure 15. Share of Yemeni fish exports among various types of exporters (2004) ........................................26 Figure 16. Location of current and projected coastal industrial and free zones in Yemen relative to major
industrial and artisanal fishing ports ...............................................................................................28 Figure 17. Distribution of fish landings by artisanal fishermen in Oman according to fish type (2005) .........31 Figure 18. Total fish exports in metric tons in Oman (1989- 2005).................................................................35 Figure 19. Total fish export in tons and value by product type in Oman (2005) .............................................36 Figure 20. Location of current and projected coastal industrial estates relative to artisanal fish landing sites in
Oman...............................................................................................................................................42
LIST OF BOXES
Box 1. Tuna production in Yemen ...................................................................................................................17 Box 2. The Gwaizi fish canning factory...........................................................................................................19 Box 3. The European Union market.................................................................................................................38
v
ABBREVIATIONS
$ United States Dollars ALECSO Arab League Educational, Cultural and Scientific Organization CAEU Council of Arab Economic Unity CTE Committee on Trade and Environment DAW Department of Animal Wealth DGF Directorate General of Fisheries Wealth DGHC Directorate General of Health Control EU European Union EEZ Exclusive Economic Zone ESCWA Economic and Social Commission for Western Asia FAO Food and Agriculture Organization FQCC Food Quality Control Center GAFTA Greater Arab Free-Trade Area GATT General Agreement on Tariffs and Trade GCC Gulf Cooperation Council GDP gross domestic product GMP Good Manufacturing Practices HACCP Hazard Analysis Critical Control Point IMO International Maritime Organization IOTC Indian Ocean Tuna Commission kg kilogram MAF Ministry of Agriculture and Fisheries MARPOL International Convention for the Prevention of Pollution from Ships MD Ministerial Decision MRMEWR Ministry of Regional Municipalities, Environment and Water Resources MSFC Marine Science and Fisheries Centre NAMA non-agricultural market access QC Quality Control RASFF Rapid Alert System for Food and Feed RECOFI Regional Commission for Fisheries RFB Regional Fishery Body RO Omani Riyal SANCO Health and Consumer Protection DG SPS Sanitary and Phytosanitary measures TBT Technical Barriers to Trade UAE United Arab Emirates UNEP United Nations Environment Programme US United States WTO World Trade Organization
1
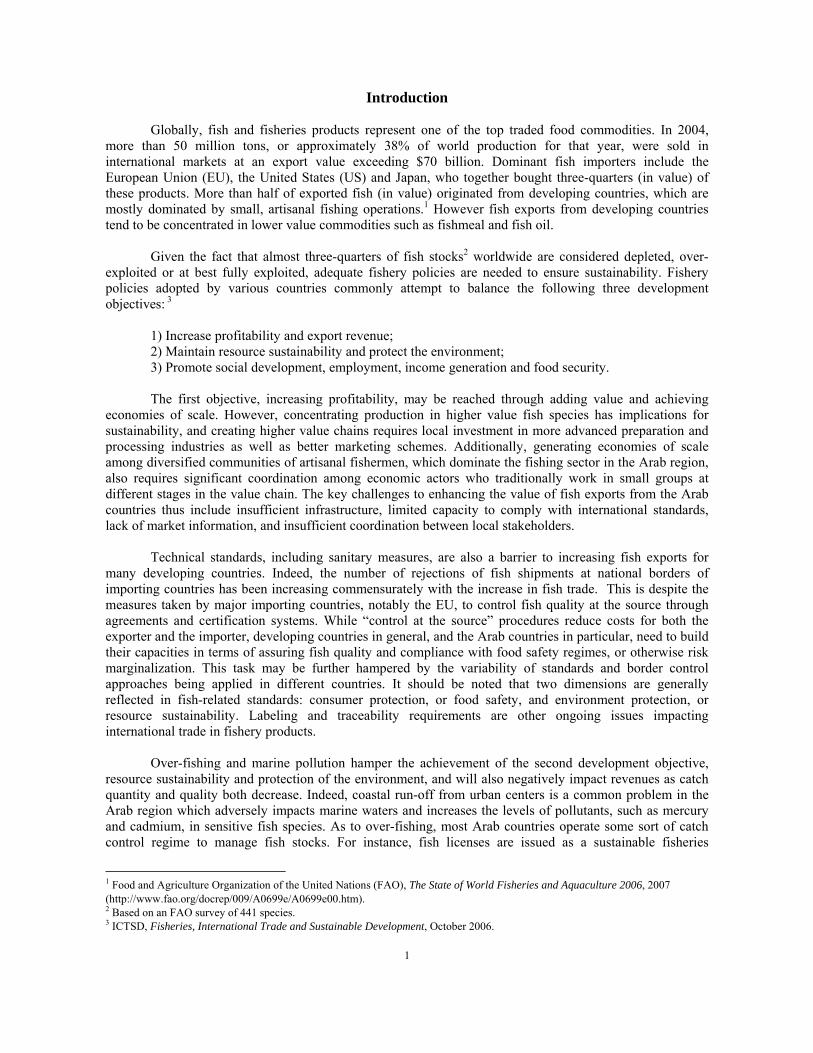
Introduction Globally, fish and fisheries products represent one of the top traded food commodities. In 2004,
more than 50 million tons, or approximately 38% of world production for that year, were sold in international markets at an export value exceeding $70 billion. Dominant fish importers include the European Union (EU), the United States (US) and Japan, who together bought three-quarters (in value) of these products. More than half of exported fish (in value) originated from developing countries, which are mostly dominated by small, artisanal fishing operations.1 However fish exports from developing countries tend to be concentrated in lower value commodities such as fishmeal and fish oil.
Given the fact that almost three-quarters of fish stocks2 worldwide are considered depleted, over-
exploited or at best fully exploited, adequate fishery policies are needed to ensure sustainability. Fishery policies adopted by various countries commonly attempt to balance the following three development objectives: 3
1) Increase profitability and export revenue; 2) Maintain resource sustainability and protect the environment; 3) Promote social development, employment, income generation and food security. The first objective, increasing profitability, may be reached through adding value and achieving
economies of scale. However, concentrating production in higher value fish species has implications for sustainability, and creating higher value chains requires local investment in more advanced preparation and processing industries as well as better marketing schemes. Additionally, generating economies of scale among diversified communities of artisanal fishermen, which dominate the fishing sector in the Arab region, also requires significant coordination among economic actors who traditionally work in small groups at different stages in the value chain. The key challenges to enhancing the value of fish exports from the Arab countries thus include insufficient infrastructure, limited capacity to comply with international standards, lack of market information, and insufficient coordination between local stakeholders.
Technical standards, including sanitary measures, are also a barrier to increasing fish exports for
many developing countries. Indeed, the number of rejections of fish shipments at national borders of importing countries has been increasing commensurately with the increase in fish trade. This is despite the measures taken by major importing countries, notably the EU, to control fish quality at the source through agreements and certification systems. While “control at the source” procedures reduce costs for both the exporter and the importer, developing countries in general, and the Arab countries in particular, need to build their capacities in terms of assuring fish quality and compliance with food safety regimes, or otherwise risk marginalization. This task may be further hampered by the variability of standards and border control approaches being applied in different countries. It should be noted that two dimensions are generally reflected in fish-related standards: consumer protection, or food safety, and environment protection, or resource sustainability. Labeling and traceability requirements are other ongoing issues impacting international trade in fishery products.
Over-fishing and marine pollution hamper the achievement of the second development objective,
resource sustainability and protection of the environment, and will also negatively impact revenues as catch quantity and quality both decrease. Indeed, coastal run-off from urban centers is a common problem in the Arab region which adversely impacts marine waters and increases the levels of pollutants, such as mercury and cadmium, in sensitive fish species. As to over-fishing, most Arab countries operate some sort of catch control regime to manage fish stocks. For instance, fish licenses are issued as a sustainable fisheries
1 Food and Agriculture Organization of the United Nations (FAO), The State of World Fisheries and Aquaculture 2006, 2007 (http://www.fao.org/docrep/009/A0699e/A0699e00.htm). 2 Based on an FAO survey of 441 species. 3 ICTSD, Fisheries, International Trade and Sustainable Development, October 2006.
2
management instrument; however, they also constitute a source of revenue for national governments that sell fishing licenses to foreign trawlers in their territorial waters. Enforcing such regimes is often difficult due to the high costs involved and developing countries – particularly least developed countries – that consider fish licensing an important source of revenue and do not have sufficient resources to monitor their territorial waters. Subsidies granted by developed countries to commercial fishery operators increases the profitability of the industry in those countries, encourages the expansion of fisheries in foreign waters, and also gives them a competitive edge relative to smaller scale fisheries in developing countries that can not afford to subsidize their producers.
In response to increasing demand and relative stagnation in wild fish capture due to stock depletion,
aquaculture has recently been developing significantly in some Arab countries. Aquaculture involves several complex issues related to both environmental impact and food safety. As such, international standards related to aquaculture and organic fish farming have been developed that touch upon both of these dimensions. While significant opportunities exist for increasing aquaculture in the Arab region, investments in turnkey systems should be examined within the local environmental context in a manner that takes into account existing water resource quantity and quality, agricultural production in the area, and access to veterinary support services.
The fisheries sector is also an important source of employment and income generation for poor
coastal communities in many Arab countries, whether directly engaged in the industry or in associated activities at the input (e.g. boat manufacturing, baits, nets, etc.) or the output (gutting, slicing, freezing, canning, transport, etc.) stages of production. In addition, fish are an important source of nutrition. Indeed, figures for apparent fish consumption4 indicate a worldwide fish consumption of 16 kg per person per year, reaching around 30 kg per person per year in industrialized countries.5 In the Arab countries, the average yearly consumption is nearly 10 kg per person, however, the role of fish in national diets varies considerably between countries, with figures as high as 25 kg in Oman and the United Arab Emirates, and as low as 2 kg in Syria, Sudan and Somalia. Anecdotal evidence indicates, however, that as fish exports become an increasingly profitable enterprise, the price of fish in the local market is increasingly. As such, lower and middle income communities in fish-producing developing countries are switching from fish to livestock, which is changing traditional diets and local market dynamics.6
Based on the above, it can be seen that the fisheries sector contributes to poverty alleviation, which
partly explains why governments, including those in the Arab countries, have traditionally assisted small-scale fishermen in times of low productivity. However, many complex and inter-dependent issues are involved in fisheries policies targeting employment, food security, export promotion and sustainability. Some of the questions that policy-makers should consider thus include:7
While increased fish exports could increase employment, what would be the impact on food
security and human health? Would fish export growth increase fish prices in local markets and leave only low grade fish as a
food supply for poor communities? While importing fish at cheap prices may help the local fish processing industry and supply protein
for low-income families, what would be the impact on artisanal fishermen? How should the issuance of fishing licenses be balanced between traditional fisheries and
international trawlers to achieve national development goals?
4 According to FAO, apparent fish consumption is calculated based on estimates of supplies from different sources matched against estimates of different forms of utilization. 5 FAO, Yearbook of Fishery Statistics, Appendix I - Fish and fishery products – apparent consumption (ftp://ftp.fao.org/fi/STAT/summary/appIybc.pdf). 6 Based on discussions with heads of households and women in Yemen in May 2006 and March 2007. 7 Elaborated from FAO, Increasing the Contribution of Small-Scale Fisheries to Poverty Alleviation and Food Security, 2005 (ftp://ftp.fao.org/docrep/fao/008/a0237e/a0237e00.pdf).
3
What instruments can be put into place to monitor fish catches and ensure the sustainability of the sector in a manner that reaps benefits from both local and foreign market demand?
This study proceeds in four chapters. The first chapter provides an overview of fisheries trade in the
Arab countries and sheds some light on related World Trade Organization (WTO) issues and coordination mechanisms in the Arab region. Chapters II and III are devoted to two country case studies, namely of Yemen and Oman, which include an in-depth quantitative description of fish production and export capacities, as well as a review of institutional and regulatory frameworks impacting the performance of the fishing industry in these countries. The fisheries industries in both case studies are also examined within the framework of national development strategies and highlight the importance of integrated planning to achieve sustainable development. The study concludes in Chapter IV with a summary of the issues discussed and a proposed set of actions for consideration.
4
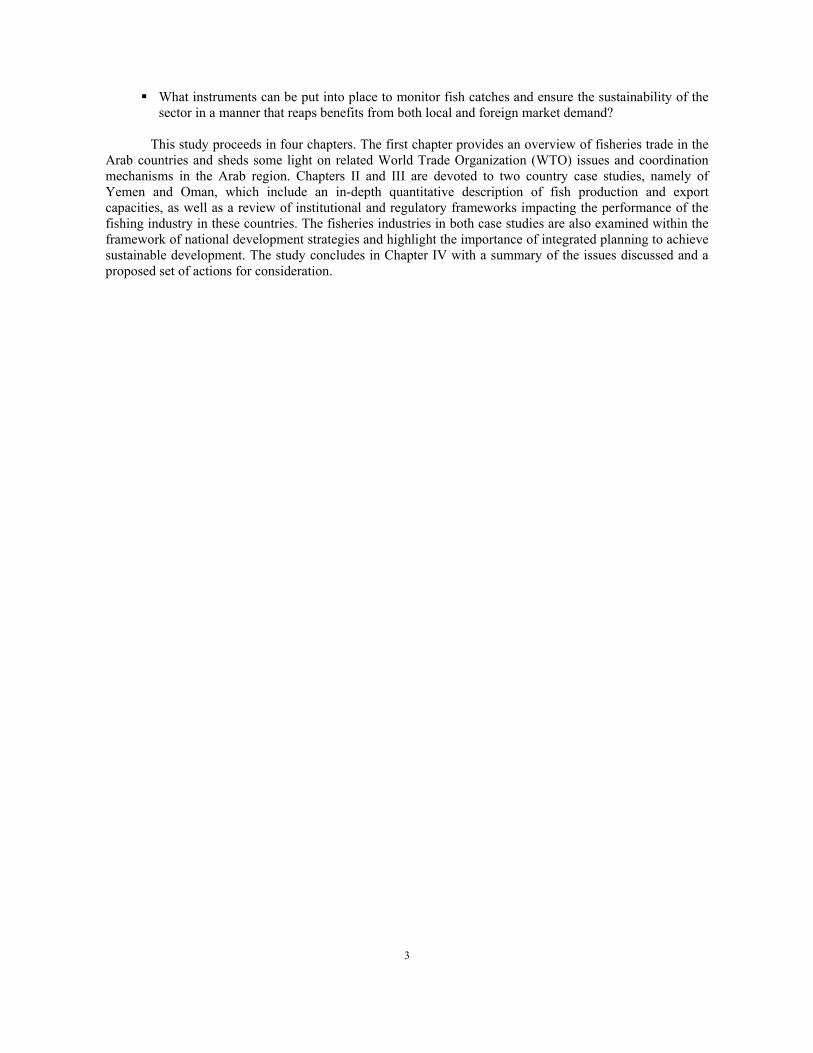
I. FISHERIES TRADE IN THE ARAB COUNTRIES Many Arab countries are endowed with long, rich coastlines and strong fishing traditions. Total Arab
production of fish and marine species grew at an average rate of 5% yearly during the period 1994-2005, from around two million tons in 1994 to more than three million tons a decade later, as shown in figure 1. In comparison, worldwide fish production grew at a slower rate of 3% yearly during the same period. However, Arab countries were apparently unable to increase their share of world fish production, which stagnated at around 2% throughout the last decade.
Figure 1. Growth of total Arab fish production8 (1994-2005)
1
1.5
2
2.5
3
3.5
1994 1995 1996 1997 1998 1999 2000 2001 2002 2003 2004 2005
Mill
ion
tons
Source: FAO, Fisheries and Aquaculture Department, Total Production 1950-2005 dataset, 2007
(extracted using FishStat Plus, available at: http://www.fao.org/fi/statist/FISOFT/FISHPLUS.asp) Two major Arab fish producers stand out from the others, namely Morocco and Egypt, who alone
contributed 1.8 million tons, or 58% of the total Arab fish production in 2005, while Yemen and Mauritania occupied third and fourth positions respectively, as can be seen in figure 2.
Figure 2. Top Arab fish producers (2005)
0
100,000
200,000
300,000
400,000
500,000
600,000
700,000
800,000
900,000
1,000,000
Mor
occo
Egy
pt
Yem
en
Mau
ritan
ia
Om
an
Alg
eria
Tuni
sia
UA
E
Sau
di A
rabi
a
Sud
an
Liby
a
Iraq
Som
alia
Syr
ia
Com
oros
Qat
ar
Bah
rain
Tons
Source: FAO, Fisheries and Aquaculture Department, Total Production 1950-2005 dataset, 2007
(extracted using FishStat Plus, available at: http://www.fao.org/fi/statist/FISOFT/FISHPLUS.asp)
8 According to FishStat dataset notes, total production data “relate to nominal catch of fish, crustaceans and mollusks, the production of other aquatic animals, residues and plants and catches of aquatic mammals, taken for commercial, industrial, recreational and subsistence purposes from inland, brackish and marine waters. The harvest from mariculture, aquaculture and other kinds of fish farming is also included.”
5
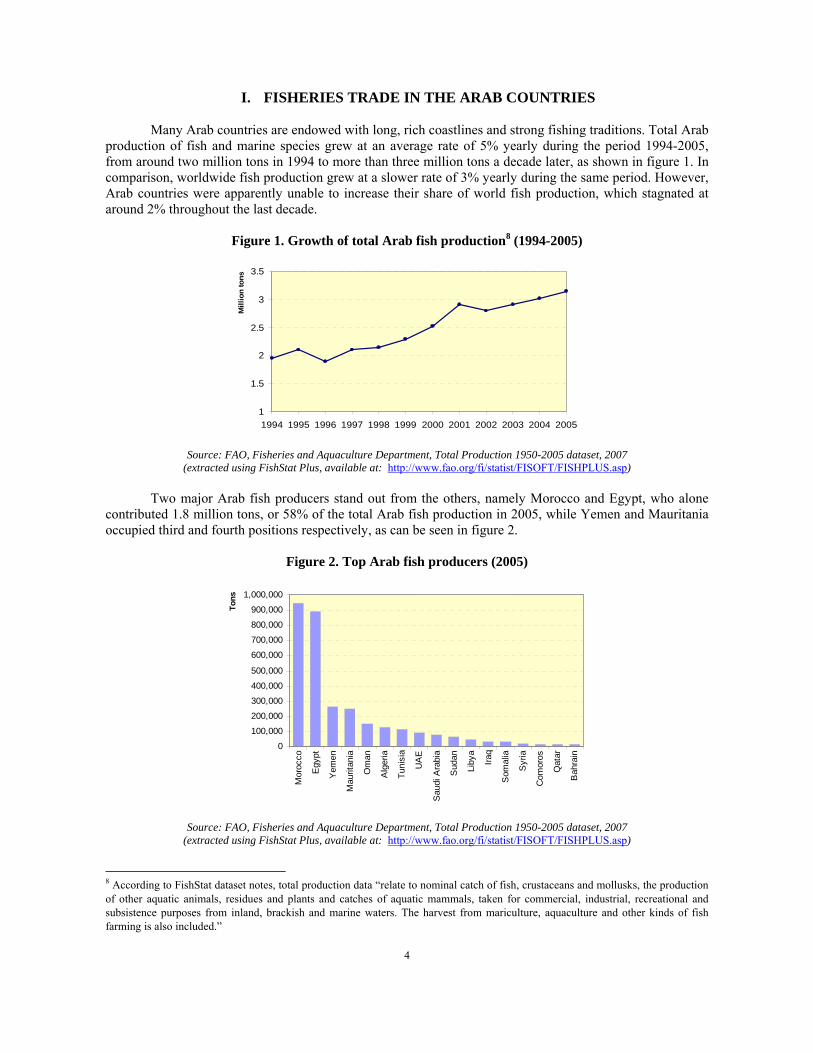
Since 2000, total aquaculture production9 in Arab countries has been increasing at an average annual rate of 12% to reach 585,130 tons in 2005. As noted in table 1, Egypt is by far the largest aquaculture producer, with around 540,000 tons – or 92% of the total Arab production – produced in 2005. Aquaculture thus remains an untapped industry in the ESCWA region. However, care is needed when seeking to develop this alternative to traditional fisheries since some parts of the Arab region have experienced negative environmental impacts associated with aquaculture production. Furthermore, aquaculture is sensitive to local environmental conditions, and thus heavy metals effluents or pesticide run-off from neighboring agricultural lands may contaminate water resources used by fish farms and render aquaculture outputs non-compliant with environmental and health safety standards, particularly those in export markets.
Table 1. Aquaculture production (tons) in the Arab countries (2000-2005)
Country 2000 2001 2002 2003 2004 2005 Egypt 340,093 342,864 376,296 445,181 471,535 539,748 Saudi Arabia 6,004 8,218 6,744 11,824 11,172 14,375 Iraq 1,745 2,000 2,000 2,000 12,196 12,870 Syria 6,797 5,880 5,988 7,217 8,682 8,533 Tunisia 1,553 1,868 1,975 2,130 2,524 2,665 Morocco 1,889 1,403 1,670 1,538 1,718 2,257 Sudan 1,000 1,000 1,600 1,600 1,600 1,600 Lebanon 400 300 790 790 790 803 UAE <0.5 <0.5 <0.5 2,300 570 570 Jordan 569 540 515 650 487 561 Algeria 351 454 476 417 586 368 Kuwait 376 195 195 366 375 327 Libya 100 100 - 58 266 266 Oman <0.5 <0.5 <0.5 352 503 173 Qatar <0.5 1 <0.5 <0.5 <0.5 11 Bahrain 12 <0.5 3 4 8 3
Total 360,889 364,823 398,252 476,427 513,012 585,130
Note: Data is not available for other Arab countries.
Source: FAO, Fisheries and Aquaculture Department, Aquaculture production: quantities 1950-2005 dataset, 2007 (extracted using FishStat Plus, available at: http://www.fao.org/fi/statist/FISOFT/FISHPLUS.asp)
Figure 3. Top Arab fish exporters (2005)
0
50,000
100,000
150,000
200,000
250,000
300,000
350,000
400,000
Mor
occo
Mau
ritan
ia
Yem
en
Om
an
Tuni
sia
UA
E
Sau
di A
rabi
a
Bah
rain
Egy
pt
Qat
ar
Liby
a
Som
alia
Sud
an
Alg
eria
Tons
Source: FAO, Fisheries and Aquaculture Department, Fisheries Commodities Production and Trade 1976-2005 dataset, 2007
(extracted using FishStat Plus, available at: http://www.fao.org/fi/statist/FISOFT/FISHPLUS.asp)
9 Includes freshwater culture, brackish water culture and mariculture.
6
0
50,000
100,000
150,000
200,000
250,000
Egy
pt
Sau
di A
rabi
a
UA
E
Tuni
sia
Mor
occo
Jord
an
Alg
eria
Leba
non
Kuw
ait
Om
an
Syr
ia
Mau
ritan
ia
Liby
a
Iraq
Qat
ar
Yem
en
Bah
rain
Tons
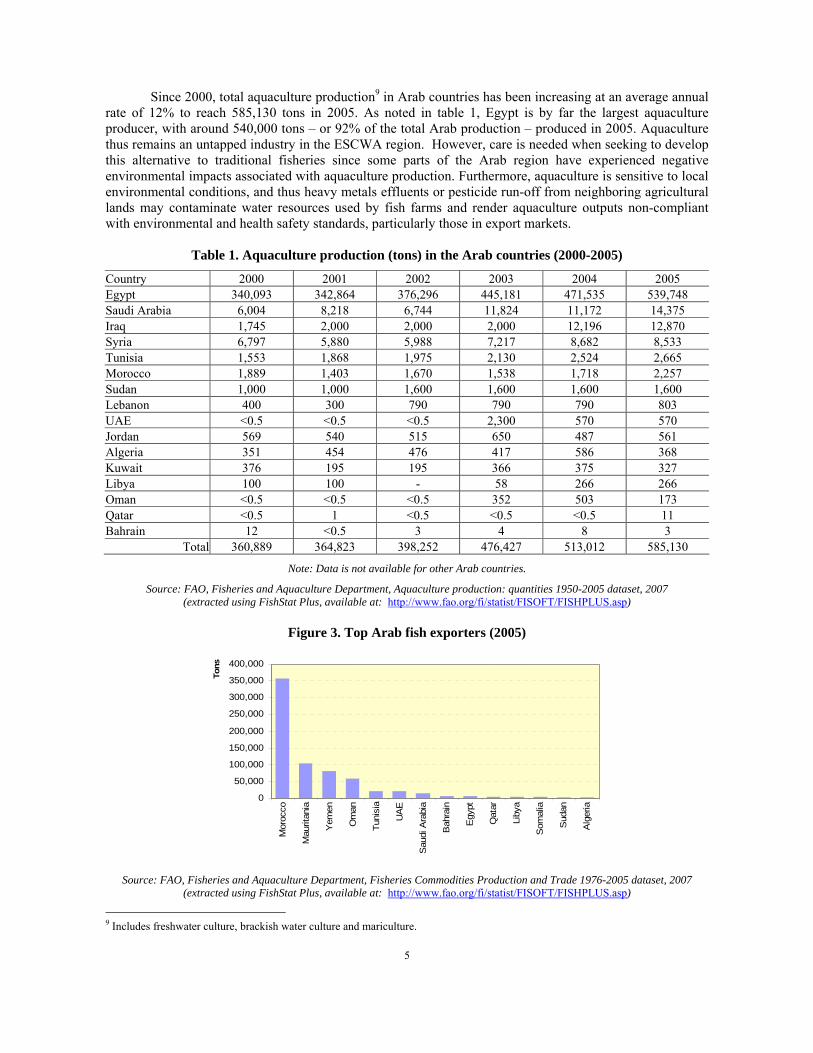
Around 700,000 tons or 23% of fish landings were exported in 2005, with Morocco topping the list of Arab fish exporters by volume, followed by Mauritania, Yemen and Oman, as illustrated in figure 3 above. Interestingly, while Egypt is a significant producer of fish, output does not nearly satisfy national demand, making it the largest importer of fish in the region, as will be further discussed later in this chapter. As for the distribution of exports by commodity type, figure 4 indicates that fresh, chilled or frozen fish constituted around 40% of total exported fishery products, followed by canned fish (21%) and crustaceans and mollusks (21%).
Figure 4. Distribution of Arab fishery export quantities by commodity type (2005)
Oils4%
Fish, dried, salted, or smoked
2%
Other2%
Fishmeal9%
Crustaceans and molluscs
21%
Fish, fresh, chilled or
frozen41%
Fish, canned21%
Source: FAO, Fisheries and Aquaculture Department, Fisheries Commodities Production and Trade 1976-2005 dataset, 2007
(extracted using FishStat Plus, available at: http://www.fao.org/fi/statist/FISOFT/FISHPLUS.asp) According to FAO statistics, fish imports by Arab countries amounted to 685,000 tons in 2005,
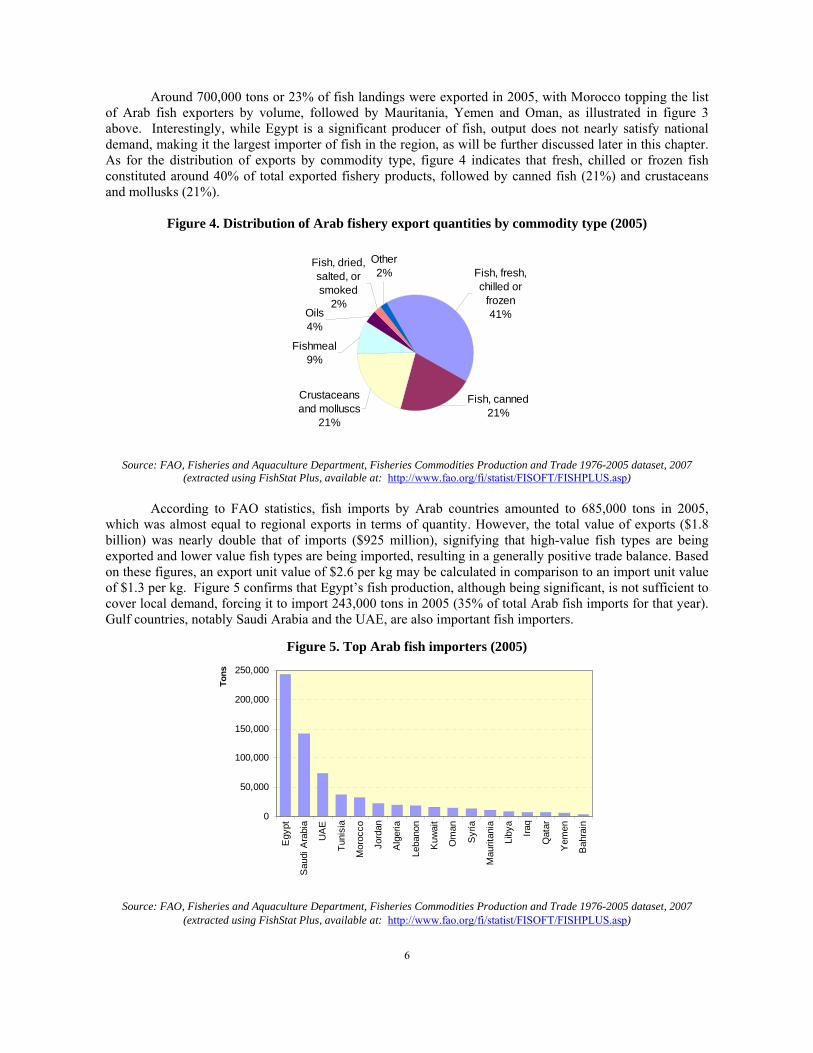
which was almost equal to regional exports in terms of quantity. However, the total value of exports ($1.8 billion) was nearly double that of imports ($925 million), signifying that high-value fish types are being exported and lower value fish types are being imported, resulting in a generally positive trade balance. Based on these figures, an export unit value of $2.6 per kg may be calculated in comparison to an import unit value of $1.3 per kg. Figure 5 confirms that Egypt’s fish production, although being significant, is not sufficient to cover local demand, forcing it to import 243,000 tons in 2005 (35% of total Arab fish imports for that year). Gulf countries, notably Saudi Arabia and the UAE, are also important fish importers.
Figure 5. Top Arab fish importers (2005)
Source: FAO, Fisheries and Aquaculture Department, Fisheries Commodities Production and Trade 1976-2005 dataset, 2007 (extracted using FishStat Plus, available at: http://www.fao.org/fi/statist/FISOFT/FISHPLUS.asp)
7
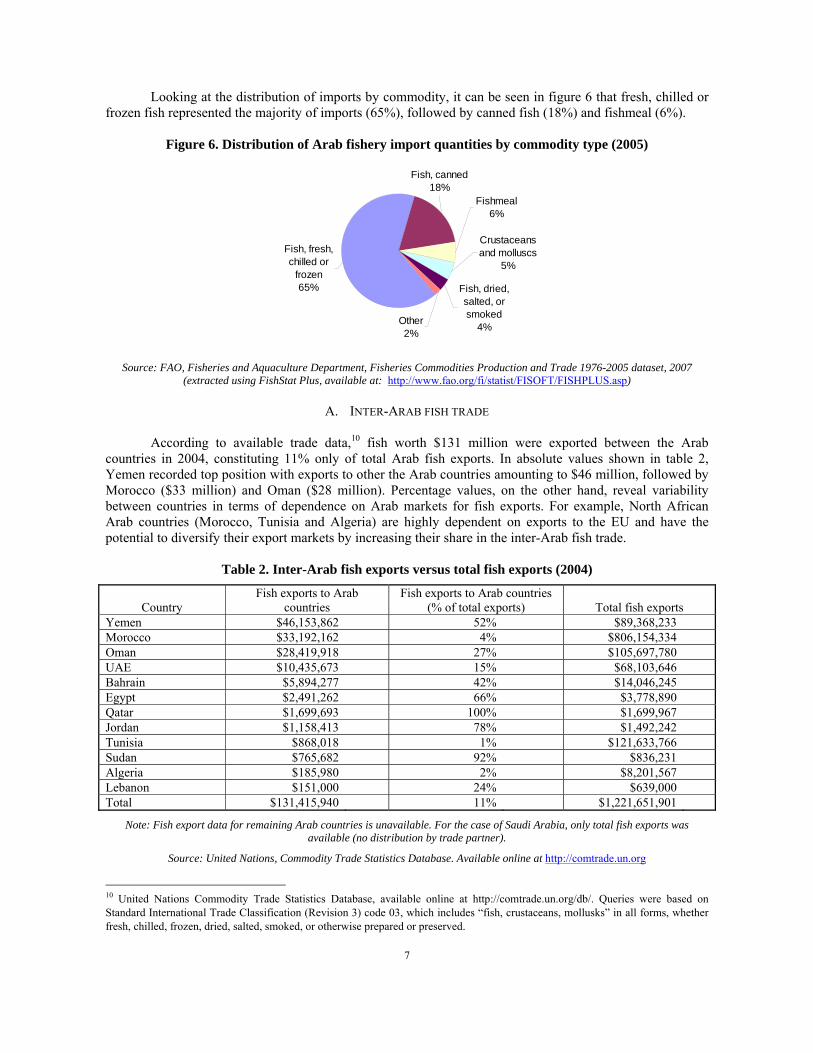
Looking at the distribution of imports by commodity, it can be seen in figure 6 that fresh, chilled or frozen fish represented the majority of imports (65%), followed by canned fish (18%) and fishmeal (6%).
Figure 6. Distribution of Arab fishery import quantities by commodity type (2005)
Fish, fresh, chilled or
frozen65%
Crustaceans and molluscs
5%
Other2%
Fish, dried, salted, or smoked
4%
Fishmeal6%
Fish, canned18%
Source: FAO, Fisheries and Aquaculture Department, Fisheries Commodities Production and Trade 1976-2005 dataset, 2007
(extracted using FishStat Plus, available at: http://www.fao.org/fi/statist/FISOFT/FISHPLUS.asp)
A. INTER-ARAB FISH TRADE According to available trade data,10 fish worth $131 million were exported between the Arab
countries in 2004, constituting 11% only of total Arab fish exports. In absolute values shown in table 2, Yemen recorded top position with exports to other the Arab countries amounting to $46 million, followed by Morocco ($33 million) and Oman ($28 million). Percentage values, on the other hand, reveal variability between countries in terms of dependence on Arab markets for fish exports. For example, North African Arab countries (Morocco, Tunisia and Algeria) are highly dependent on exports to the EU and have the potential to diversify their export markets by increasing their share in the inter-Arab fish trade.
Table 2. Inter-Arab fish exports versus total fish exports (2004)
Country Fish exports to Arab
countries Fish exports to Arab countries
(% of total exports) Total fish exports Yemen $46,153,862 52% $89,368,233 Morocco $33,192,162 4% $806,154,334 Oman $28,419,918 27% $105,697,780 UAE $10,435,673 15% $68,103,646 Bahrain $5,894,277 42% $14,046,245 Egypt $2,491,262 66% $3,778,890 Qatar $1,699,693 100% $1,699,967 Jordan $1,158,413 78% $1,492,242 Tunisia $868,018 1% $121,633,766 Sudan $765,682 92% $836,231 Algeria $185,980 2% $8,201,567 Lebanon $151,000 24% $639,000 Total $131,415,940 11% $1,221,651,901
Note: Fish export data for remaining Arab countries is unavailable. For the case of Saudi Arabia, only total fish exports was available (no distribution by trade partner).
Source: United Nations, Commodity Trade Statistics Database. Available online at http://comtrade.un.org
10 United Nations Commodity Trade Statistics Database, available online at http://comtrade.un.org/db/. Queries were based on Standard International Trade Classification (Revision 3) code 03, which includes “fish, crustaceans, mollusks” in all forms, whether fresh, chilled, frozen, dried, salted, smoked, or otherwise prepared or preserved.
8
Fish trade within the Arab world has significant potential to grow because of expanding markets as a result of population growth, a recent estimate of which exceeded 290 million in 2005,11 in addition to increasing demand driven by higher incomes and expanded tourism (for example in Egypt).12 However, intra-region trade in fish products is still marginal due to many commercial and administrative barriers, including a weak marine and land transportation infrastructure. The Greater Arab Free Trade Area (GAFTA), which was approved by the Economic and Social Council of the League of Arab States in late 1997, seeks the elimination of custom duties and other commercial and administrative barriers currently imposed by some countries on various commodities. The gradual trade liberalization through GAFTA, as well as through bilateral trade agreements between Arab countries, is expected to enhance export-oriented production of fishery products within the Arab region.
B. OTHER FISH TRADE PARTNERS
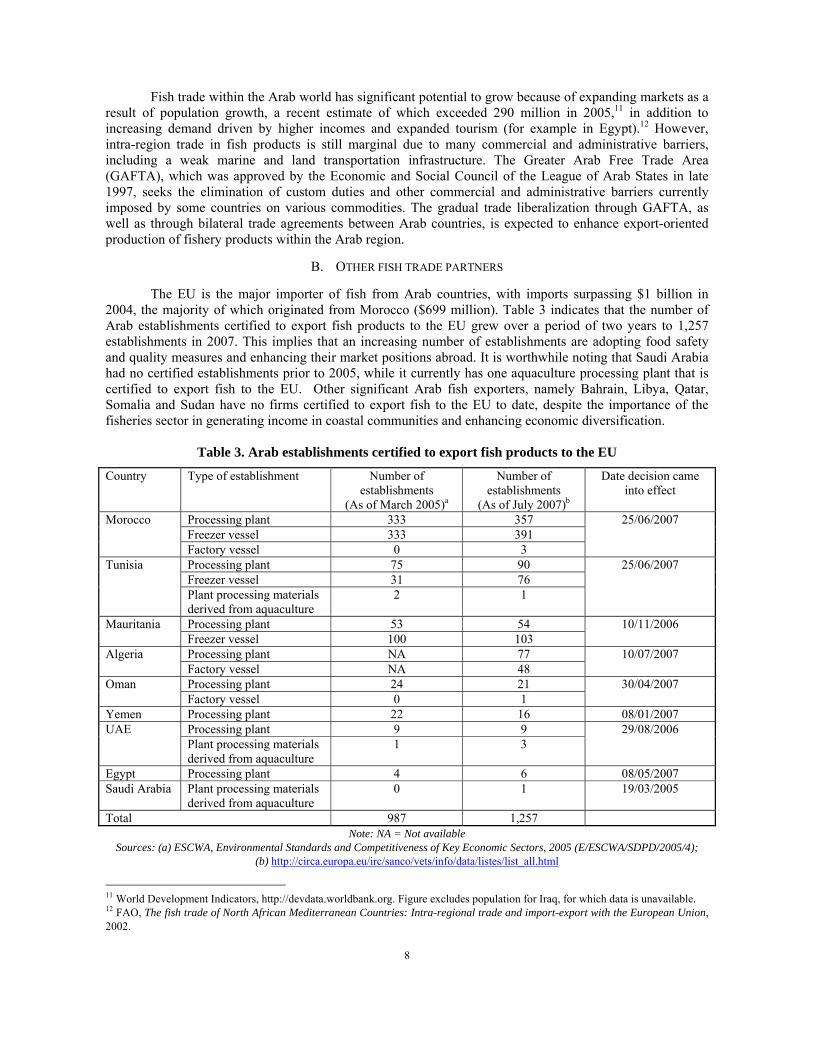
The EU is the major importer of fish from Arab countries, with imports surpassing $1 billion in
2004, the majority of which originated from Morocco ($699 million). Table 3 indicates that the number of Arab establishments certified to export fish products to the EU grew over a period of two years to 1,257 establishments in 2007. This implies that an increasing number of establishments are adopting food safety and quality measures and enhancing their market positions abroad. It is worthwhile noting that Saudi Arabia had no certified establishments prior to 2005, while it currently has one aquaculture processing plant that is certified to export fish to the EU. Other significant Arab fish exporters, namely Bahrain, Libya, Qatar, Somalia and Sudan have no firms certified to export fish to the EU to date, despite the importance of the fisheries sector in generating income in coastal communities and enhancing economic diversification.
Table 3. Arab establishments certified to export fish products to the EU
Country Type of establishment Number of establishments
(As of March 2005)a
Number of establishments
(As of July 2007)b
Date decision came into effect
Processing plant 333 357 Freezer vessel 333 391
Morocco
Factory vessel 0 3
25/06/2007
Processing plant 75 90 Freezer vessel 31 76
Tunisia
Plant processing materials derived from aquaculture
2 1
25/06/2007
Processing plant 53 54 Mauritania Freezer vessel 100 103
10/11/2006
Processing plant NA 77 Algeria Factory vessel NA 48
10/07/2007
Processing plant 24 21 Oman Factory vessel 0 1
30/04/2007
Yemen Processing plant 22 16 08/01/2007 Processing plant 9 9 UAE Plant processing materials derived from aquaculture
1 3 29/08/2006
Egypt Processing plant 4 6 08/05/2007 Saudi Arabia Plant processing materials
derived from aquaculture 0 1 19/03/2005
Total 987 1,257 Note: NA = Not available
Sources: (a) ESCWA, Environmental Standards and Competitiveness of Key Economic Sectors, 2005 (E/ESCWA/SDPD/2005/4); (b) http://circa.europa.eu/irc/sanco/vets/info/data/listes/list_all.html
11 World Development Indicators, http://devdata.worldbank.org. Figure excludes population for Iraq, for which data is unavailable. 12 FAO, The fish trade of North African Mediterranean Countries: Intra-regional trade and import-export with the European Union, 2002.
9
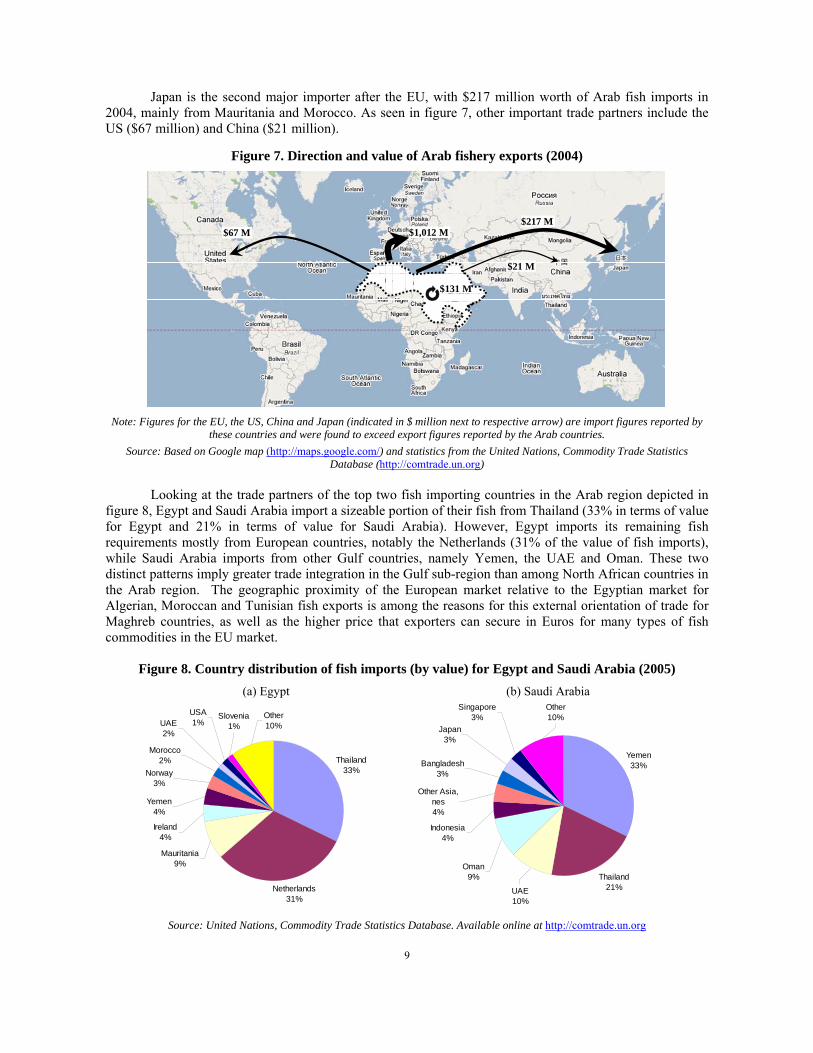
Japan is the second major importer after the EU, with $217 million worth of Arab fish imports in 2004, mainly from Mauritania and Morocco. As seen in figure 7, other important trade partners include the US ($67 million) and China ($21 million).
Figure 7. Direction and value of Arab fishery exports (2004)
$67 M $217 M
$21 M
$1,012 M
$131 M
Note: Figures for the EU, the US, China and Japan (indicated in $ million next to respective arrow) are import figures reported by
these countries and were found to exceed export figures reported by the Arab countries. Source: Based on Google map (http://maps.google.com/) and statistics from the United Nations, Commodity Trade Statistics
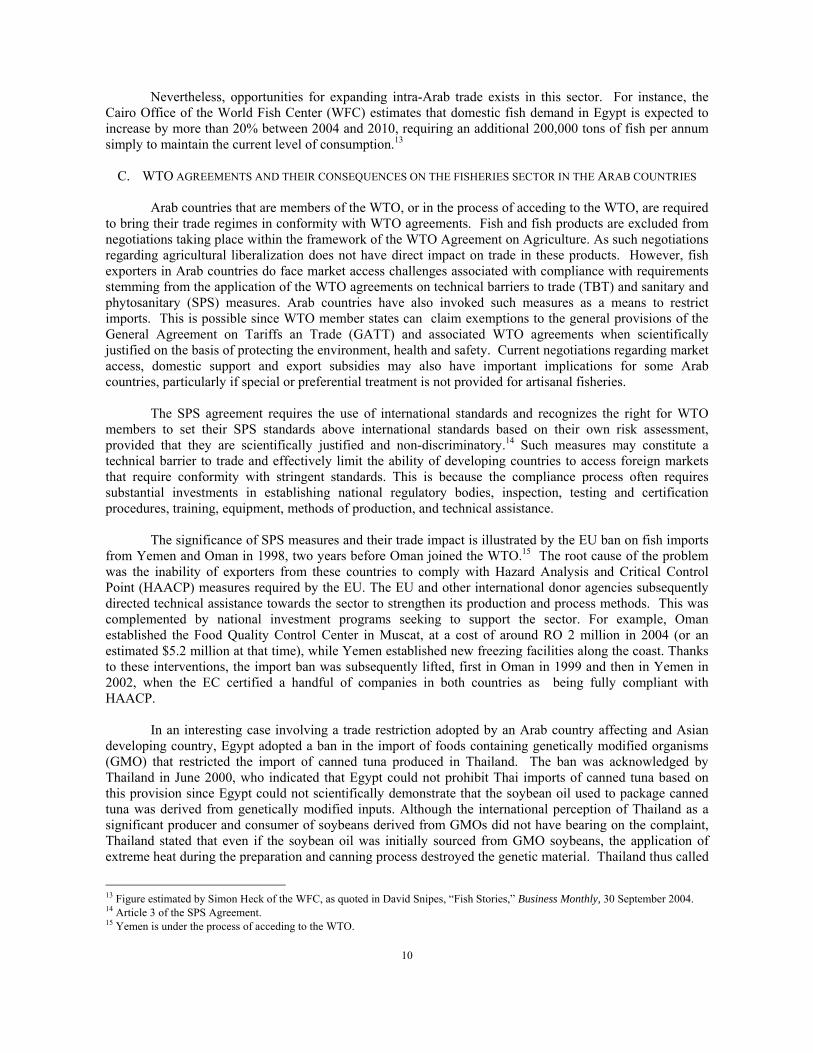
Database (http://comtrade.un.org) Looking at the trade partners of the top two fish importing countries in the Arab region depicted in
figure 8, Egypt and Saudi Arabia import a sizeable portion of their fish from Thailand (33% in terms of value for Egypt and 21% in terms of value for Saudi Arabia). However, Egypt imports its remaining fish requirements mostly from European countries, notably the Netherlands (31% of the value of fish imports), while Saudi Arabia imports from other Gulf countries, namely Yemen, the UAE and Oman. These two distinct patterns imply greater trade integration in the Gulf sub-region than among North African countries in the Arab region. The geographic proximity of the European market relative to the Egyptian market for Algerian, Moroccan and Tunisian fish exports is among the reasons for this external orientation of trade for Maghreb countries, as well as the higher price that exporters can secure in Euros for many types of fish commodities in the EU market.
Figure 8. Country distribution of fish imports (by value) for Egypt and Saudi Arabia (2005)
(a) Egypt (b) Saudi Arabia
Thailand33%
Netherlands31%
USA1%
Morocco2%
UAE2%
Slovenia1%
Other10%
Norway3%
Yemen4%
Ireland4%
Mauritania9%
Yemen33%
Thailand21%UAE
10%
Oman9%
Indonesia4%
Other Asia, nes4%
Other10%
Japan3%
Bangladesh3%
Singapore3%
Source: United Nations, Commodity Trade Statistics Database. Available online at http://comtrade.un.org
10
Nevertheless, opportunities for expanding intra-Arab trade exists in this sector. For instance, the Cairo Office of the World Fish Center (WFC) estimates that domestic fish demand in Egypt is expected to increase by more than 20% between 2004 and 2010, requiring an additional 200,000 tons of fish per annum simply to maintain the current level of consumption.13
C. WTO AGREEMENTS AND THEIR CONSEQUENCES ON THE FISHERIES SECTOR IN THE ARAB COUNTRIES
Arab countries that are members of the WTO, or in the process of acceding to the WTO, are required
to bring their trade regimes in conformity with WTO agreements. Fish and fish products are excluded from negotiations taking place within the framework of the WTO Agreement on Agriculture. As such negotiations regarding agricultural liberalization does not have direct impact on trade in these products. However, fish exporters in Arab countries do face market access challenges associated with compliance with requirements stemming from the application of the WTO agreements on technical barriers to trade (TBT) and sanitary and phytosanitary (SPS) measures. Arab countries have also invoked such measures as a means to restrict imports. This is possible since WTO member states can claim exemptions to the general provisions of the General Agreement on Tariffs an Trade (GATT) and associated WTO agreements when scientifically justified on the basis of protecting the environment, health and safety. Current negotiations regarding market access, domestic support and export subsidies may also have important implications for some Arab countries, particularly if special or preferential treatment is not provided for artisanal fisheries.
The SPS agreement requires the use of international standards and recognizes the right for WTO
members to set their SPS standards above international standards based on their own risk assessment, provided that they are scientifically justified and non-discriminatory.14 Such measures may constitute a technical barrier to trade and effectively limit the ability of developing countries to access foreign markets that require conformity with stringent standards. This is because the compliance process often requires substantial investments in establishing national regulatory bodies, inspection, testing and certification procedures, training, equipment, methods of production, and technical assistance.
The significance of SPS measures and their trade impact is illustrated by the EU ban on fish imports from Yemen and Oman in 1998, two years before Oman joined the WTO.15 The root cause of the problem was the inability of exporters from these countries to comply with Hazard Analysis and Critical Control Point (HAACP) measures required by the EU. The EU and other international donor agencies subsequently directed technical assistance towards the sector to strengthen its production and process methods. This was complemented by national investment programs seeking to support the sector. For example, Oman established the Food Quality Control Center in Muscat, at a cost of around RO 2 million in 2004 (or an estimated $5.2 million at that time), while Yemen established new freezing facilities along the coast. Thanks to these interventions, the import ban was subsequently lifted, first in Oman in 1999 and then in Yemen in 2002, when the EC certified a handful of companies in both countries as being fully compliant with HAACP.
In an interesting case involving a trade restriction adopted by an Arab country affecting and Asian
developing country, Egypt adopted a ban in the import of foods containing genetically modified organisms (GMO) that restricted the import of canned tuna produced in Thailand. The ban was acknowledged by Thailand in June 2000, who indicated that Egypt could not prohibit Thai imports of canned tuna based on this provision since Egypt could not scientifically demonstrate that the soybean oil used to package canned tuna was derived from genetically modified inputs. Although the international perception of Thailand as a significant producer and consumer of soybeans derived from GMOs did not have bearing on the complaint, Thailand stated that even if the soybean oil was initially sourced from GMO soybeans, the application of extreme heat during the preparation and canning process destroyed the genetic material. Thailand thus called
13 Figure estimated by Simon Heck of the WFC, as quoted in David Snipes, “Fish Stories,” Business Monthly, 30 September 2004. 14 Article 3 of the SPS Agreement. 15 Yemen is under the process of acceding to the WTO.
11
the measure discriminatory and asked for consultations with Egypt to discuss the matter.16 The case was subsequently settled informally between the two parties and canned tuna imports from Thailand were again given access to the Egyptian market. In 2006, Thailand’s exports of preserved and processed fish to Egypt was valued at over $66 million, over 96% of which consisted of canned tuna and similar species (i.e., skipjack and bonito).17
The other major issue affecting the fisheries sector that has been raised before the WTO is the
phasing out of fish subsidies. These negotiations called for by the Doha Ministerial Declaration are “…to clarify and improve WTO disciplines on fisheries subsidies, taking into account the importance of this sector to developing countries.”18 Negotiations aim to eliminate trade distorting subsidies, especially those provided to large industrial fishing fleets.
Although negotiations are advancing under the Agreement on Subsidies and Countervailing
Measures (SCM) in the Negotiating Group on Rules, final agreements will likely be delayed until the results of other agricultural and non-agricultural market access (NAMA) negotiations are known. Debate also continues regarding the definition of artisanal fishing, since small-scale fishing industries support traditional livelihoods in coastal villages in developing and developed countries alike.19 20 The WTO Committee on Trade and Environment also conducts sectoral analysis on the fisheries sector as part of its regular program of work, which is undertaken with a view towards promoting sustainable development in the sector.
To date, there has been consensus in these negotiations that government support of the artisanal
fisheries sector will not be subject to new subsidy disciplines. Many developing countries seek special and differential treatment provisions that establish non-actionable green box subsidies that permit them to continue subsidy support to their artisanal and ‘sustainable’ small-scale industrial fisheries sector operating within their exclusive economic zone. Therefore, the impact on the fish industries in most Arab countries is expected to be limited in view of the fact that many of the support measures offered by Arab governments either fall in the permissible green box class of subsidies or are below the de minimis level, i.e., the level deemed not to distort competition.21 This is often because the main exporters of fishery products in the region do not have the public resources available to financially support domestic producers to the same extent as exporters based in industrialized countries.
D. MECHANISMS FOR REGIONAL COOPERATION IN THE FISHERIES SECTOR
Many global instruments have been developed related to fisheries governance. Some of the most
known of these instruments are the United Nations Convention on the Law of the Sea in 1982, which formalized a country’s rights to marine resources in its exclusive economic zones (EEZ), and the Code of Conduct for Responsible Fishing in 1995. Several other multilateral environmental agreements exist for protecting marine resources. For example, the International Convention for the Prevention of Pollution from Ships, initially adopted in 1973 though the International Maritime Organization (IMO) and later modified in 16 WTO Committee on Sanitary and Phytosanitary Measures, issue raised by Thailand in June 2000 (G/SPS/R/19, paras. 103-104,) and revisited in September 2000 and March 2001. 17 United Nations Commodity Trade Statistics Database, available online at http://comtrade.un.org/db/. Export data for Thailand to Egypt (2006), HS 1604 and HS 160414. 18 Doha Ministerial Declaration, para. 28, available at: http://www.wto.org/english/thewto_e/minist_e/min01_e/mindecl_e.htm. 19 For a discussion of challenges associated with defining the term “artisanal fisheries,” see: UNEP/ETB, Artisanal Fishing: Promoting Poverty Reduction and Community Development Through New WTO Rules on Fisheries Subsidies: An Issue and Options Paper, Geneva, November 2006. 20 Interestingly, the problem of definition is a similar difficulty stymieing WTO negotiations on the liberalization of trade in environmental goods. See other paper in this series of publications on trade and environment, ESCWA, “The Liberalization of Trade in Environmental Goods and Services in the ESCWA and Arab Regions,” E/ESCWA/SDPD/2007/WP.1, October 2007. 21 In July 2007, the European Commission raised the ceiling of the de minimis level from €3,000 to €30,000 per three-year period per beneficiary (or about $4,110 to $41,100 at that time), under the condition that the total aid for each member state shall not exceed 2.5% of the annual national fisheries output, and that funds will not be used for increasing fleet capacity. Source: http://ec.europa.eu/fisheries/press_corner/press_releases/com07_55_en.htm
12
1978 (MARPOL 73/78), is the main global instrument targeting the minimization of maritime pollution by oil, chemicals and other harmful substances.
At the regional level, more than forty regional fishery bodies (RFBs) aim to promote better fisheries
management practices. Some of these RFBs have advisory roles only, while others are empowered to establish specific management measures.22 The following sections describe some of these regional agreements and institutions that support the fisheries sector in the Arab region that are linked to different global and regional organizations.
1. FAO supported bodies
(a) Center for Marketing Information and Advisory Services for Fishery Products in the Arab Region
The Center for Marketing Information and Advisory Services for Fishery Products in the Arab
Region (InfoSamak) was created in 1986 as an independent, inter-governmental organization with support from the Food and Agriculture Organization (FAO).23 InfoSamak is an integral part of the FAO’s FISH INFONetwork, which includes six other regional organizations in addition to FAO’s GlobeFish (a unit of the Fisheries Department at the FAO). Headquartered in Casablanca, InfoSamak provides market information, implements projects, publishes studies and conducts training workshops and business meetings. Issues of concern include product specifications and quality standards, niche market development, and trends in trade of fisheries products. InfoSamak serves private industry and governments of all Arab countries.24
(b) The Regional Commission for Fisheries
The Regional Commission for Fisheries (RECOFI) was established in 1999 by the FAO Council at
its 117th Session (9-11 November 1999) under Article XIV of the FAO Constitution, through an agreement between the Governments of Bahrain, Iran, Iraq, Kuwait, Oman, Qatar, Saudi Arabia, and the UAE; Yemen remains an observer country. Based in Cairo, RECOFI is an advisory body which provides member countries with scientific and management advice aimed at promoting “the development, conservation, rational management and best utilization of living marine resources, as well as the sustainable development of aquaculture.”25 Two working groups have been established within RECOFI, one on Aquaculture and another on Fishery Statistics.
(c) General Fisheries Commission for the Mediterranean
Seven Arab countries (Algeria, Egypt, Lebanon, Libya, Morocco, Syria, Tunisia)26 are members of
the General Fisheries Commission for the Mediterranean (GFCM), which was established in 1949 within the framework of the FAO. GFCM is a management body which formulates and recommends measures aimed at the conservation and rational management of living marine resources in the Mediterranean basin.27 Subsidiary bodies of GFCM include the: (a) Committee on Aquaculture (established in 1995); (b) Scientific Advisory Committee (established in 1997); and (c) Ad-hoc technical panels. (d) Indian Ocean Tuna Commission
22 APFIC, Regional fishery bodies and arrangements in Asia and the Pacific, 2004 (http://library.enaca.org/NACA-Publications/RFBs_handbook_best.pdf). 23 http://www.infosamak.org/ 24 http://www.fishinfonet.com/ 25 Agreement for the Establishment of the Regional Commission for Fisheries, http://www.fao.org/fi/body/rfb/RECOFI/recofi_agreement_text.pdf 26 Other members are: Albania, Bulgaria, Croatia, Cyprus, EC, France, Greece, Israel, Italy, Malta, Monaco, Romania, Slovenia, Serbia and Montenegro, Spain, Turkey, and, interestingly, Japan. 27 Agreement for the Establishment of the General Fisheries Commission for the Mediterranean, http://www.fao.org/Legal/treaties/003t-e.htm
13
The Indian Ocean Tuna Commission (IOTC) was established in 1993 under the auspices of the FAO. Based in the Seychelles, IOTC aims to manage tuna and tuna-like species in the Indian Ocean and adjacent seas. Three Arab countries are members of IOTC: Comoros, Oman and Sudan.28
2. Regional bodies associated with the League of Arab States
(a) The Arab Federation of Fish Producers
The Arab Federation of Fish Producers was established in 1976 through a decision of the Council of
Arab Economic Unity (CAEU) of the League of Arab States (Decision no. 743/27 of 7/6/1976).29 Headquartered in Baghdad (Iraq), the Federation has three regional offices located in Egypt, Mauritania and Tunisia. Federation members are companies, enterprises and organizations from both the public and private sectors that have Arab ownership (at least 51% of capital) and operate in the fishing industry. Current members of the federation are nationals of thirteen fish producing Arab countries, namely Algeria, Djibouti, Egypt, Iraq, Jordan, Libya, Mauritania, Morocco, Somalia, Sudan, Syria, Tunisia, and the occupied Palestinian territories. The main objectives of the federation include promoting inter-Arab fish trade and investments, conducting studies and meetings, and encouraging knowledge and technology transfer between members.
(b) The Arab Council of Fisheries Wealth
A decision to establish the Arab Council of Fisheries Wealth under the League of Arab States was
approved in early 2007. The establishment of the Council was originally proposed by Yemen and subsequently endorsed by Arab ministers responsible for fisheries issues at a meeting organized by the Arab Federation of Fish Producers in November 2006 in Sana’a, Yemen. The Council is expected to play a three-fold role: promote consultation among Arab countries concerning international laws and agreements related to fisheries; develop policies and strategies for promoting the fisheries sector; and encourage cooperation among Arab countries in fisheries-related training, surveys and research.30
(c) Regional Organization for the Conservation of the Environment of the Red Sea and Gulf of Aden
The Regional Organization for the Conservation of the Environment of the Red Sea and Gulf of
Aden, known as PERSGA, is an inter-governmental body that was formally established in 1995 under the umbrella of the League of Arab States and with support from the Arab League Educational, Cultural and Scientific Organization (ALECSO). Based in Jeddah, PERSGA member countries include Djibouti, Egypt, Jordan, Saudi Arabia, Somalia, Sudan and Yemen.31 The organization examines sources of marine pollution from coastal zones and marine transport, as well as their impacts on marine resources.
3. Other regional bodies
(a) Regional Organization for the Protection of Marine Environment
The Regional Organization for the Protection of Marine Environment (ROPME) was established in
1979 with initial assistance from UNEP, and is based in Kuwait. Its member states include the following: Bahrain, Iran, Iraq, Kuwait, Oman, Qatar, Saudi Arabia and the UAE. Its aim is to coordinate efforts of its member states towards protection of the water quality in the sea area surrounded by the eight member states
28 http://www.iotc.org/ 29 http://www.caeu.net/default.asp?pageid=5&CurrentLanguage=EngLang&FedID=1 30 Almotamar.net, 26 November 2006, “وزراء الثروة السمكية يُقرَون إنشاء مجلس عربي بصنعاء” (http://www.almotamar.net/news/37228.htm) 31 http://www.persga.org/about/history/history.asp
14
and abating the pollution caused by development activities.32 It is responsible for supporting the implementation of the Kuwait Action Plan, as well as the Kuwait Regional Convention and its Protocols.
4. Conclusion
A wealth of institutions exist in the Arab region to advise and coordinate policies on the fisheries
sector and associated issues related to the sustainable management of marine resources. National ministries and agencies are also responsible for examining the sector within the scope of national development plans and objectives. Regional bodies tend to be associated based on their geographic proximity to specific bodies of water or on a political basis. This results in overlapping memberships and a duplication of some roles which, in several instances is complicated by poor coordination between regional institutions. This results in disjointed approaches and ad hoc positions on how to define and approach the liberalization of trade in fish and fishery products in regional and international forums.
32 http://www.ropme.com/pages/objectives.htm
15
II. THE FISHERIES SECTOR IN YEMEN The fisheries sector represents the most important non-oil production sector in Yemen. Through its
five distinct fishing regions (Red Sea, Gulf of Aden, Arabian Sea, Bab el-Mandeb Strait and Socotra Archipelago), its coastline of 2,230 km and fishing area of more than 40,000 km2, Yemen’s total fish landings exceeded 260,000 tons in 2005. Almost 30% of this quantity was exported mainly to Arab, Asian and European countries, while the remaining 70% were consumed locally.
During the last fifteen years, the fisheries sector experienced important growth in fish landings
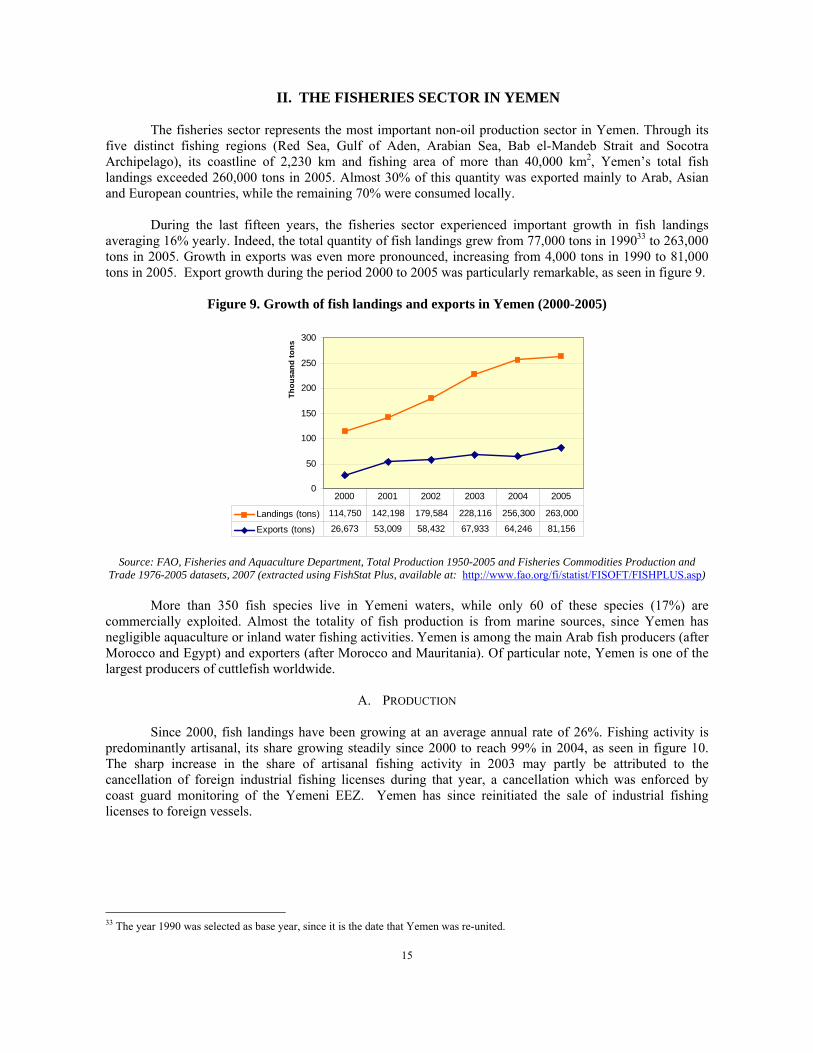
averaging 16% yearly. Indeed, the total quantity of fish landings grew from 77,000 tons in 199033 to 263,000 tons in 2005. Growth in exports was even more pronounced, increasing from 4,000 tons in 1990 to 81,000 tons in 2005. Export growth during the period 2000 to 2005 was particularly remarkable, as seen in figure 9.
Figure 9. Growth of fish landings and exports in Yemen (2000-2005)
0
50
100
150
200
250
300
Thou
sand
tons
Landings (tons) 114,750 142,198 179,584 228,116 256,300 263,000
Exports (tons) 26,673 53,009 58,432 67,933 64,246 81,156
2000 2001 2002 2003 2004 2005
Source: FAO, Fisheries and Aquaculture Department, Total Production 1950-2005 and Fisheries Commodities Production and
Trade 1976-2005 datasets, 2007 (extracted using FishStat Plus, available at: http://www.fao.org/fi/statist/FISOFT/FISHPLUS.asp) More than 350 fish species live in Yemeni waters, while only 60 of these species (17%) are
commercially exploited. Almost the totality of fish production is from marine sources, since Yemen has negligible aquaculture or inland water fishing activities. Yemen is among the main Arab fish producers (after Morocco and Egypt) and exporters (after Morocco and Mauritania). Of particular note, Yemen is one of the largest producers of cuttlefish worldwide.
A. PRODUCTION
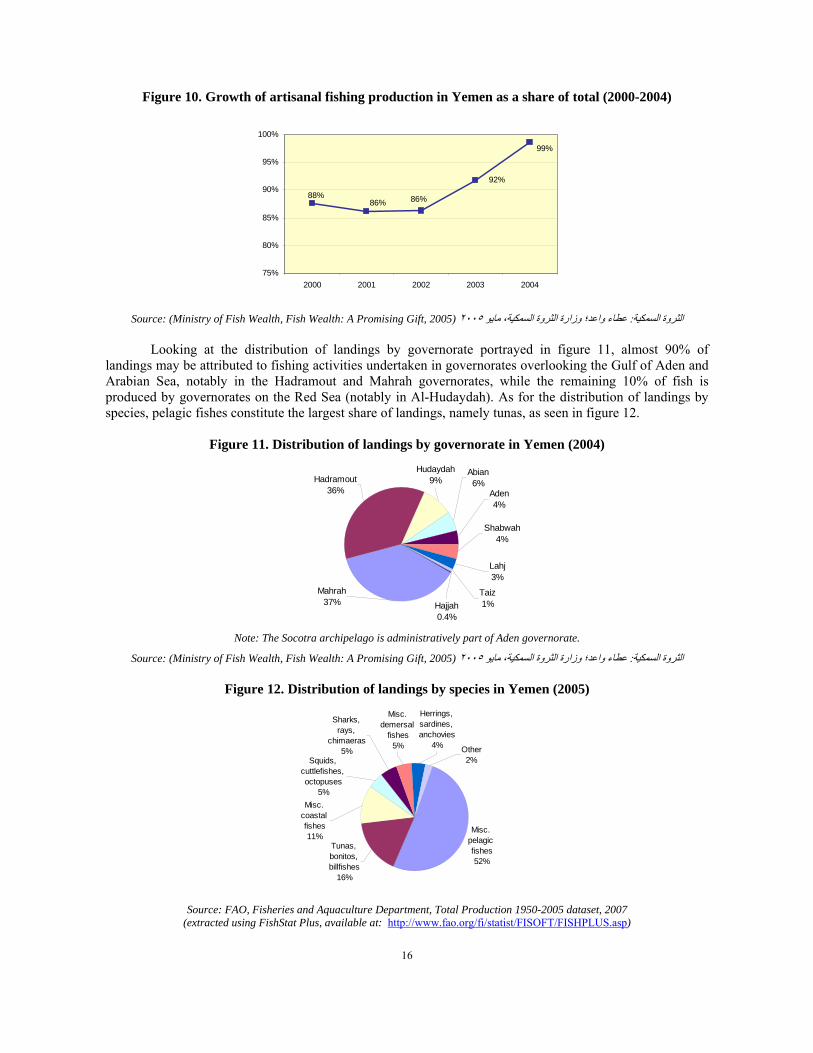
Since 2000, fish landings have been growing at an average annual rate of 26%. Fishing activity is
predominantly artisanal, its share growing steadily since 2000 to reach 99% in 2004, as seen in figure 10. The sharp increase in the share of artisanal fishing activity in 2003 may partly be attributed to the cancellation of foreign industrial fishing licenses during that year, a cancellation which was enforced by coast guard monitoring of the Yemeni EEZ. Yemen has since reinitiated the sale of industrial fishing licenses to foreign vessels.
33 The year 1990 was selected as base year, since it is the date that Yemen was re-united.
16
Figure 10. Growth of artisanal fishing production in Yemen as a share of total (2000-2004)
88%86% 86%
92%
99%
75%
80%
85%
90%
95%
100%
2000 2001 2002 2003 2004
Source: (Ministry of Fish Wealth, Fish Wealth: A Promising Gift, 2005) ٢٠٠٥عطاء واعد؛ وزارة الثروة السمكية، مايو : الثروة السمكية
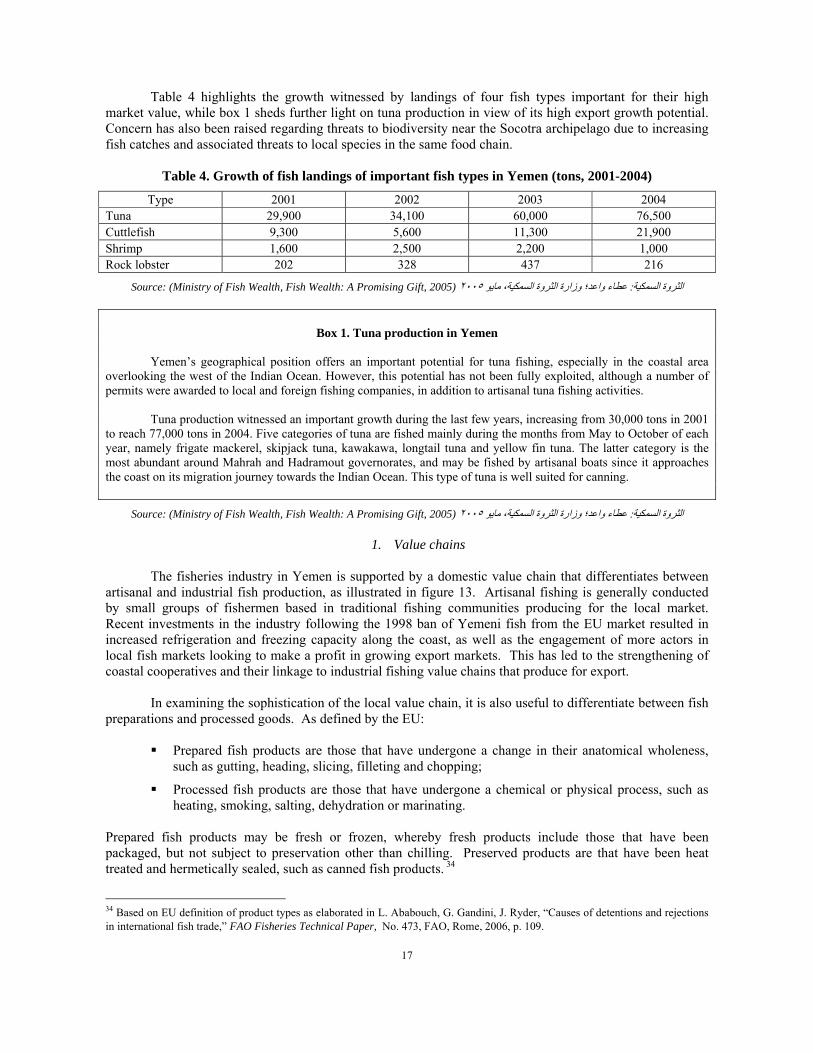
Looking at the distribution of landings by governorate portrayed in figure 11, almost 90% of
landings may be attributed to fishing activities undertaken in governorates overlooking the Gulf of Aden and Arabian Sea, notably in the Hadramout and Mahrah governorates, while the remaining 10% of fish is produced by governorates on the Red Sea (notably in Al-Hudaydah). As for the distribution of landings by species, pelagic fishes constitute the largest share of landings, namely tunas, as seen in figure 12.
Figure 11. Distribution of landings by governorate in Yemen (2004)
Mahrah37%
Hadramout36%
Hajjah0.4%
Taiz1%
Lahj3%
Shabwah4%
Aden4%
Abian6%
Hudaydah9%
Note: The Socotra archipelago is administratively part of Aden governorate.
Source: (Ministry of Fish Wealth, Fish Wealth: A Promising Gift, 2005) ٢٠٠٥عطاء واعد؛ وزارة الثروة السمكية، مايو : الثروة السمكية
Figure 12. Distribution of landings by species in Yemen (2005)
Tunas, bonitos, billfishes
16%
Misc. demersal
fishes5%
Herrings, sardines, anchovies
4% Other2%Squids,
cuttlefishes, octopuses
5%
Sharks, rays,
chimaeras5%
Misc. coastal fishes11%
Misc. pelagic fishes52%
Source: FAO, Fisheries and Aquaculture Department, Total Production 1950-2005 dataset, 2007
(extracted using FishStat Plus, available at: http://www.fao.org/fi/statist/FISOFT/FISHPLUS.asp)
17
Table 4 highlights the growth witnessed by landings of four fish types important for their high market value, while box 1 sheds further light on tuna production in view of its high export growth potential. Concern has also been raised regarding threats to biodiversity near the Socotra archipelago due to increasing fish catches and associated threats to local species in the same food chain.
Table 4. Growth of fish landings of important fish types in Yemen (tons, 2001-2004)
Type 2001 2002 2003 2004 Tuna 29,900 34,100 60,000 76,500 Cuttlefish 9,300 5,600 11,300 21,900 Shrimp 1,600 2,500 2,200 1,000 Rock lobster 202 328 437 216
Source: (Ministry of Fish Wealth, Fish Wealth: A Promising Gift, 2005) ٢٠٠٥عطاء واعد؛ وزارة الثروة السمكية، مايو : الثروة السمكية
Box 1. Tuna production in Yemen
Yemen’s geographical position offers an important potential for tuna fishing, especially in the coastal area
overlooking the west of the Indian Ocean. However, this potential has not been fully exploited, although a number of permits were awarded to local and foreign fishing companies, in addition to artisanal tuna fishing activities.
Tuna production witnessed an important growth during the last few years, increasing from 30,000 tons in 2001
to reach 77,000 tons in 2004. Five categories of tuna are fished mainly during the months from May to October of each year, namely frigate mackerel, skipjack tuna, kawakawa, longtail tuna and yellow fin tuna. The latter category is the most abundant around Mahrah and Hadramout governorates, and may be fished by artisanal boats since it approaches the coast on its migration journey towards the Indian Ocean. This type of tuna is well suited for canning.
Source: (Ministry of Fish Wealth, Fish Wealth: A Promising Gift, 2005) ٢٠٠٥عطاء واعد؛ وزارة الثروة السمكية، مايو : الثروة السمكية
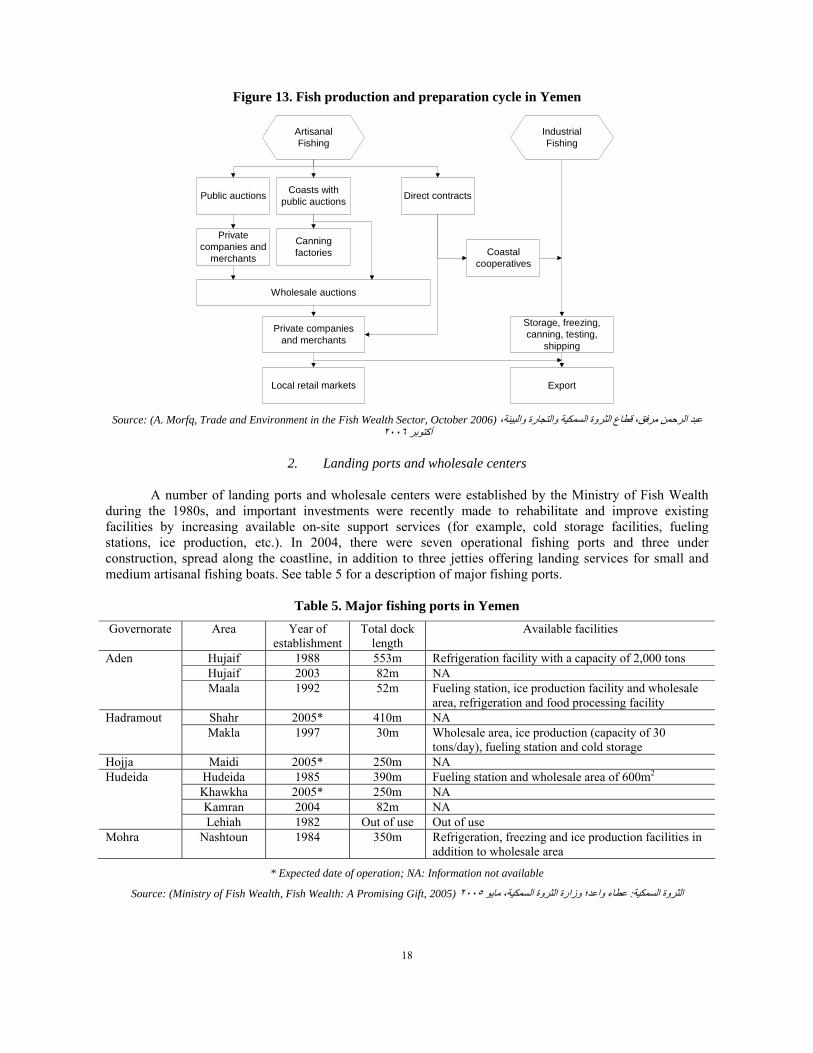
1. Value chains The fisheries industry in Yemen is supported by a domestic value chain that differentiates between
artisanal and industrial fish production, as illustrated in figure 13. Artisanal fishing is generally conducted by small groups of fishermen based in traditional fishing communities producing for the local market. Recent investments in the industry following the 1998 ban of Yemeni fish from the EU market resulted in increased refrigeration and freezing capacity along the coast, as well as the engagement of more actors in local fish markets looking to make a profit in growing export markets. This has led to the strengthening of coastal cooperatives and their linkage to industrial fishing value chains that produce for export.
In examining the sophistication of the local value chain, it is also useful to differentiate between fish
preparations and processed goods. As defined by the EU: Prepared fish products are those that have undergone a change in their anatomical wholeness,
such as gutting, heading, slicing, filleting and chopping;
Processed fish products are those that have undergone a chemical or physical process, such as heating, smoking, salting, dehydration or marinating.
Prepared fish products may be fresh or frozen, whereby fresh products include those that have been packaged, but not subject to preservation other than chilling. Preserved products are that have been heat treated and hermetically sealed, such as canned fish products. 34
34 Based on EU definition of product types as elaborated in L. Ababouch, G. Gandini, J. Ryder, “Causes of detentions and rejections in international fish trade,” FAO Fisheries Technical Paper, No. 473, FAO, Rome, 2006, p. 109.
18
Figure 13. Fish production and preparation cycle in Yemen
ArtisanalFishing
IndustrialFishing
Public auctions Coasts withpublic auctions Direct contracts
Privatecompanies and
merchants
Canningfactories
Wholesale auctions
Private companiesand merchants
Local retail markets Export
Coastalcooperatives
Storage, freezing,canning, testing,
shipping
Source: (A. Morfq, Trade and Environment in the Fish Wealth Sector, October 2006) ،عبد الرحمن مرفق، قطاع الثروة السمكية والتجارة والبيئة
٢٠٠٦أآتوبر
2. Landing ports and wholesale centers A number of landing ports and wholesale centers were established by the Ministry of Fish Wealth
during the 1980s, and important investments were recently made to rehabilitate and improve existing facilities by increasing available on-site support services (for example, cold storage facilities, fueling stations, ice production, etc.). In 2004, there were seven operational fishing ports and three under construction, spread along the coastline, in addition to three jetties offering landing services for small and medium artisanal fishing boats. See table 5 for a description of major fishing ports.
Table 5. Major fishing ports in Yemen
Governorate Area Year of establishment
Total dock length
Available facilities
Hujaif 1988 553m Refrigeration facility with a capacity of 2,000 tons Hujaif 2003 82m NA
Aden
Maala 1992 52m Fueling station, ice production facility and wholesale area, refrigeration and food processing facility
Shahr 2005* 410m NA Hadramout Makla 1997 30m Wholesale area, ice production (capacity of 30
tons/day), fueling station and cold storage Hojja Maidi 2005* 250m NA
Hudeida 1985 390m Fueling station and wholesale area of 600m2 Khawkha 2005* 250m NA Kamran 2004 82m NA
Hudeida
Lehiah 1982 Out of use Out of use Mohra Nashtoun 1984 350m Refrigeration, freezing and ice production facilities in
addition to wholesale area
* Expected date of operation; NA: Information not available
Source: (Ministry of Fish Wealth, Fish Wealth: A Promising Gift, 2005) ٢٠٠٥عطاء واعد؛ وزارة الثروة السمكية، مايو : الثروة السمكية
19
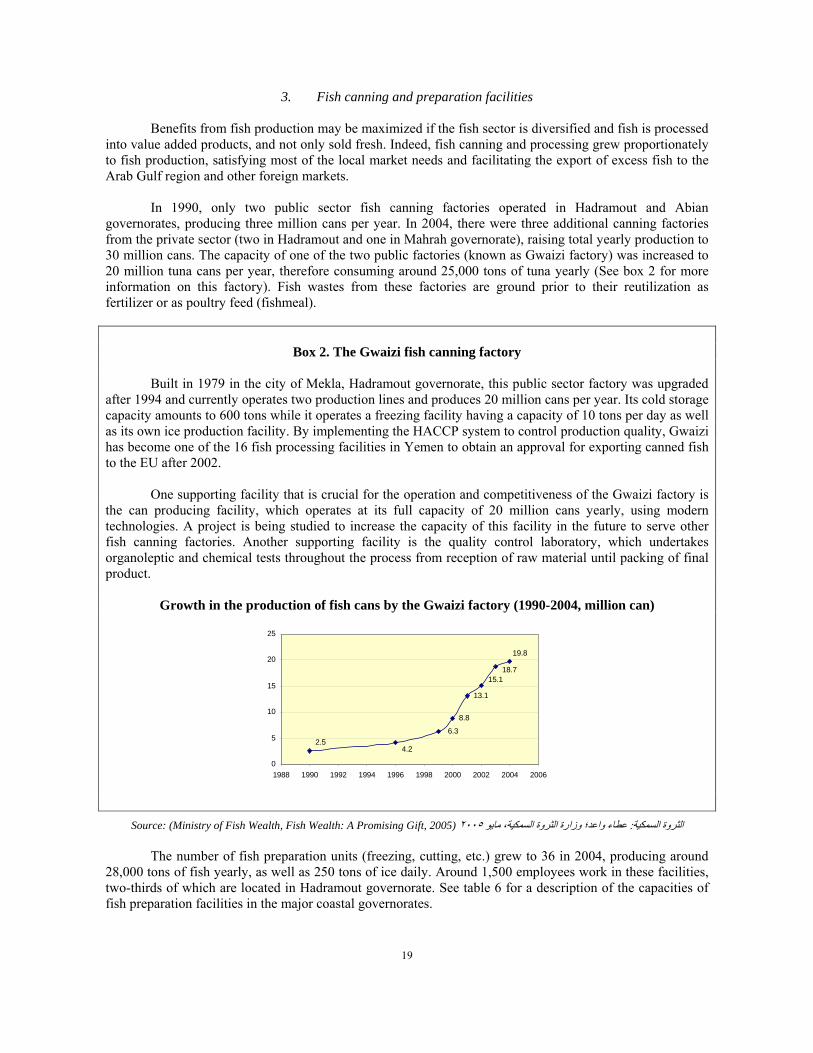
3. Fish canning and preparation facilities Benefits from fish production may be maximized if the fish sector is diversified and fish is processed
into value added products, and not only sold fresh. Indeed, fish canning and processing grew proportionately to fish production, satisfying most of the local market needs and facilitating the export of excess fish to the Arab Gulf region and other foreign markets.
In 1990, only two public sector fish canning factories operated in Hadramout and Abian
governorates, producing three million cans per year. In 2004, there were three additional canning factories from the private sector (two in Hadramout and one in Mahrah governorate), raising total yearly production to 30 million cans. The capacity of one of the two public factories (known as Gwaizi factory) was increased to 20 million tuna cans per year, therefore consuming around 25,000 tons of tuna yearly (See box 2 for more information on this factory). Fish wastes from these factories are ground prior to their reutilization as fertilizer or as poultry feed (fishmeal).
Box 2. The Gwaizi fish canning factory Built in 1979 in the city of Mekla, Hadramout governorate, this public sector factory was upgraded
after 1994 and currently operates two production lines and produces 20 million cans per year. Its cold storage capacity amounts to 600 tons while it operates a freezing facility having a capacity of 10 tons per day as well as its own ice production facility. By implementing the HACCP system to control production quality, Gwaizi has become one of the 16 fish processing facilities in Yemen to obtain an approval for exporting canned fish to the EU after 2002.
One supporting facility that is crucial for the operation and competitiveness of the Gwaizi factory is
the can producing facility, which operates at its full capacity of 20 million cans yearly, using modern technologies. A project is being studied to increase the capacity of this facility in the future to serve other fish canning factories. Another supporting facility is the quality control laboratory, which undertakes organoleptic and chemical tests throughout the process from reception of raw material until packing of final product.
Growth in the production of fish cans by the Gwaizi factory (1990-2004, million can)
8.8
13.1
2.54.2
6.3
15.118.7
19.8
0
5
10
15
20
25
1988 1990 1992 1994 1996 1998 2000 2002 2004 2006
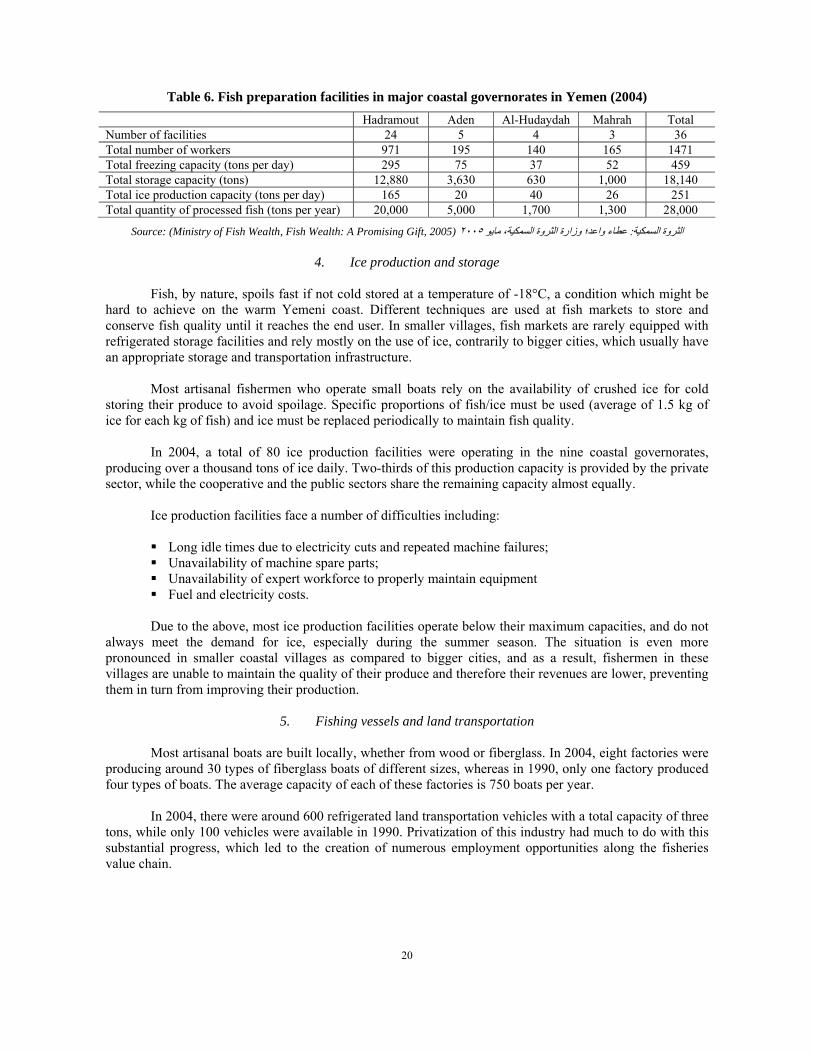
Source: (Ministry of Fish Wealth, Fish Wealth: A Promising Gift, 2005) ٢٠٠٥عطاء واعد؛ وزارة الثروة السمكية، مايو : الثروة السمكية The number of fish preparation units (freezing, cutting, etc.) grew to 36 in 2004, producing around
28,000 tons of fish yearly, as well as 250 tons of ice daily. Around 1,500 employees work in these facilities, two-thirds of which are located in Hadramout governorate. See table 6 for a description of the capacities of fish preparation facilities in the major coastal governorates.
20
Table 6. Fish preparation facilities in major coastal governorates in Yemen (2004) Hadramout Aden Al-Hudaydah Mahrah Total
Number of facilities 24 5 4 3 36 Total number of workers 971 195 140 165 1471 Total freezing capacity (tons per day) 295 75 37 52 459 Total storage capacity (tons) 12,880 3,630 630 1,000 18,140 Total ice production capacity (tons per day) 165 20 40 26 251 Total quantity of processed fish (tons per year) 20,000 5,000 1,700 1,300 28,000
Source: (Ministry of Fish Wealth, Fish Wealth: A Promising Gift, 2005) ٢٠٠٥عطاء واعد؛ وزارة الثروة السمكية، مايو : الثروة السمكية
4. Ice production and storage Fish, by nature, spoils fast if not cold stored at a temperature of -18°C, a condition which might be
hard to achieve on the warm Yemeni coast. Different techniques are used at fish markets to store and conserve fish quality until it reaches the end user. In smaller villages, fish markets are rarely equipped with refrigerated storage facilities and rely mostly on the use of ice, contrarily to bigger cities, which usually have an appropriate storage and transportation infrastructure.
Most artisanal fishermen who operate small boats rely on the availability of crushed ice for cold
storing their produce to avoid spoilage. Specific proportions of fish/ice must be used (average of 1.5 kg of ice for each kg of fish) and ice must be replaced periodically to maintain fish quality.
In 2004, a total of 80 ice production facilities were operating in the nine coastal governorates,
producing over a thousand tons of ice daily. Two-thirds of this production capacity is provided by the private sector, while the cooperative and the public sectors share the remaining capacity almost equally.
Ice production facilities face a number of difficulties including: Long idle times due to electricity cuts and repeated machine failures; Unavailability of machine spare parts; Unavailability of expert workforce to properly maintain equipment Fuel and electricity costs.
Due to the above, most ice production facilities operate below their maximum capacities, and do not
always meet the demand for ice, especially during the summer season. The situation is even more pronounced in smaller coastal villages as compared to bigger cities, and as a result, fishermen in these villages are unable to maintain the quality of their produce and therefore their revenues are lower, preventing them in turn from improving their production.
5. Fishing vessels and land transportation
Most artisanal boats are built locally, whether from wood or fiberglass. In 2004, eight factories were
producing around 30 types of fiberglass boats of different sizes, whereas in 1990, only one factory produced four types of boats. The average capacity of each of these factories is 750 boats per year.
In 2004, there were around 600 refrigerated land transportation vehicles with a total capacity of three
tons, while only 100 vehicles were available in 1990. Privatization of this industry had much to do with this substantial progress, which led to the creation of numerous employment opportunities along the fisheries value chain.
21
B. INVESTMENTS IN INFRASTRUCTURE AND HUMAN RESOURCES In addition to human resources, the availability of an adequate infrastructure is an important factor
impacting the competitiveness of the fisheries sector through decrease in production cost and improvement in product quality. Substantial investments in infrastructure were made by the Yemeni government during the period 1990-2004, which paralleled growth in production and public sector efforts exerted for setting quality control standards and norms. Additional investments were made by the private and cooperative sectors.
1. Investments
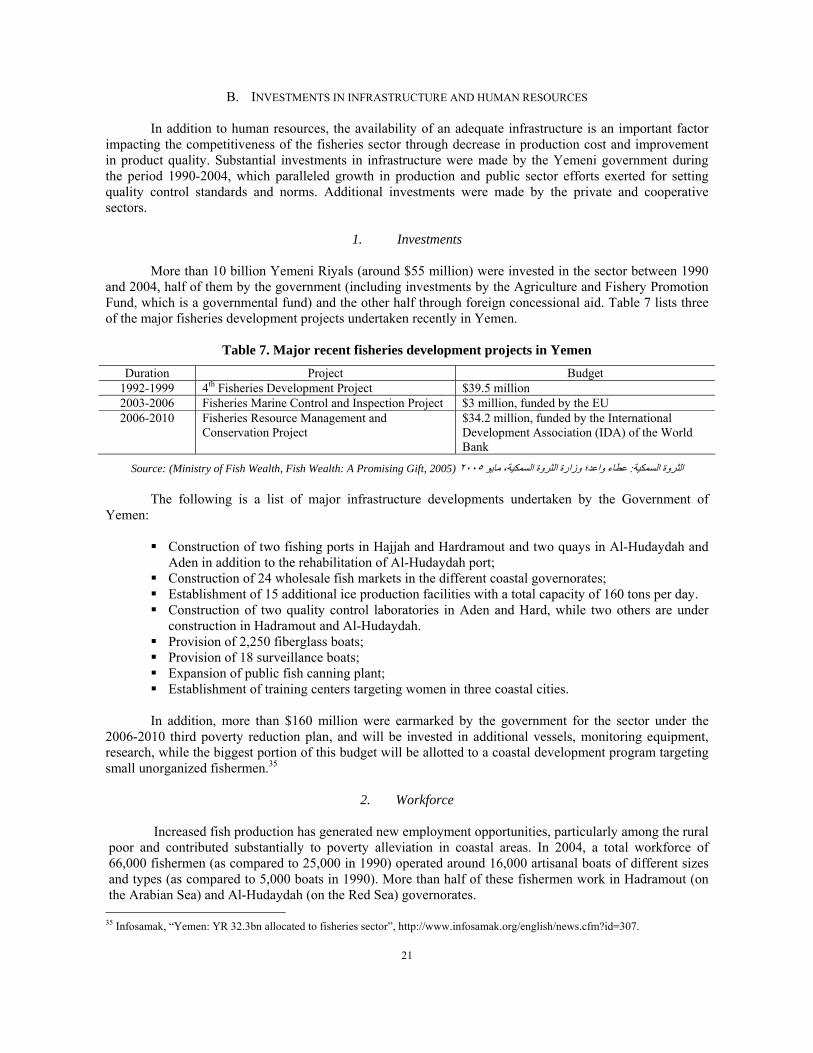
More than 10 billion Yemeni Riyals (around $55 million) were invested in the sector between 1990
and 2004, half of them by the government (including investments by the Agriculture and Fishery Promotion Fund, which is a governmental fund) and the other half through foreign concessional aid. Table 7 lists three of the major fisheries development projects undertaken recently in Yemen.
Table 7. Major recent fisheries development projects in Yemen
Duration Project Budget 1992-1999 4th Fisheries Development Project $39.5 million 2003-2006 Fisheries Marine Control and Inspection Project $3 million, funded by the EU 2006-2010 Fisheries Resource Management and
Conservation Project $34.2 million, funded by the International Development Association (IDA) of the World Bank
Source: (Ministry of Fish Wealth, Fish Wealth: A Promising Gift, 2005) ٢٠٠٥عطاء واعد؛ وزارة الثروة السمكية، مايو : الثروة السمكية The following is a list of major infrastructure developments undertaken by the Government of
Yemen: Construction of two fishing ports in Hajjah and Hardramout and two quays in Al-Hudaydah and
Aden in addition to the rehabilitation of Al-Hudaydah port; Construction of 24 wholesale fish markets in the different coastal governorates; Establishment of 15 additional ice production facilities with a total capacity of 160 tons per day. Construction of two quality control laboratories in Aden and Hard, while two others are under
construction in Hadramout and Al-Hudaydah. Provision of 2,250 fiberglass boats; Provision of 18 surveillance boats; Expansion of public fish canning plant; Establishment of training centers targeting women in three coastal cities.
In addition, more than $160 million were earmarked by the government for the sector under the
2006-2010 third poverty reduction plan, and will be invested in additional vessels, monitoring equipment, research, while the biggest portion of this budget will be allotted to a coastal development program targeting small unorganized fishermen.35
2. Workforce
Increased fish production has generated new employment opportunities, particularly among the rural
poor and contributed substantially to poverty alleviation in coastal areas. In 2004, a total workforce of 66,000 fishermen (as compared to 25,000 in 1990) operated around 16,000 artisanal boats of different sizes and types (as compared to 5,000 boats in 1990). More than half of these fishermen work in Hadramout (on the Arabian Sea) and Al-Hudaydah (on the Red Sea) governorates. 35 Infosamak, “Yemen: YR 32.3bn allocated to fisheries sector”, http://www.infosamak.org/english/news.cfm?id=307.
22
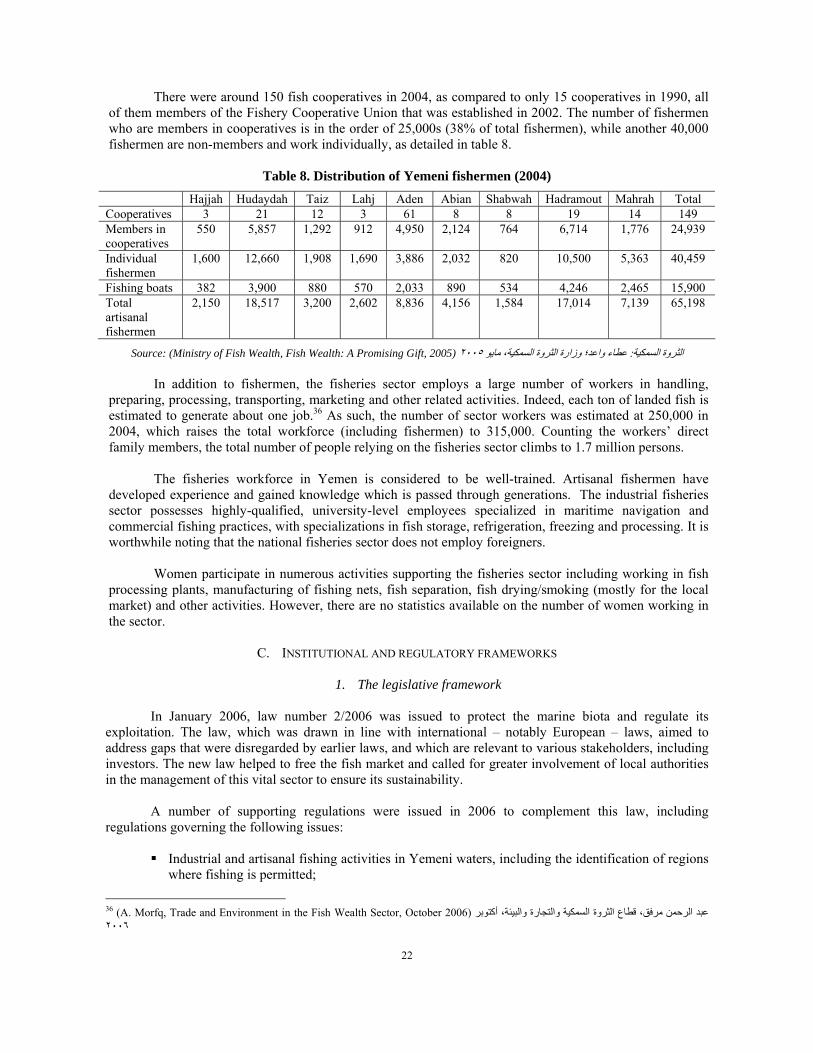
There were around 150 fish cooperatives in 2004, as compared to only 15 cooperatives in 1990, all of them members of the Fishery Cooperative Union that was established in 2002. The number of fishermen who are members in cooperatives is in the order of 25,000s (38% of total fishermen), while another 40,000 fishermen are non-members and work individually, as detailed in table 8.
Table 8. Distribution of Yemeni fishermen (2004)
Hajjah Hudaydah Taiz Lahj Aden Abian Shabwah Hadramout Mahrah Total Cooperatives 3 21 12 3 61 8 8 19 14 149 Members in cooperatives
550 5,857 1,292 912 4,950 2,124 764 6,714 1,776 24,939
Individual fishermen
1,600 12,660 1,908 1,690 3,886 2,032 820 10,500 5,363 40,459
Fishing boats 382 3,900 880 570 2,033 890 534 4,246 2,465 15,900 Total artisanal fishermen
2,150 18,517 3,200 2,602 8,836 4,156 1,584 17,014 7,139 65,198
Source: (Ministry of Fish Wealth, Fish Wealth: A Promising Gift, 2005) ٢٠٠٥عطاء واعد؛ وزارة الثروة السمكية، مايو : الثروة السمكية In addition to fishermen, the fisheries sector employs a large number of workers in handling,
preparing, processing, transporting, marketing and other related activities. Indeed, each ton of landed fish is estimated to generate about one job.36 As such, the number of sector workers was estimated at 250,000 in 2004, which raises the total workforce (including fishermen) to 315,000. Counting the workers’ direct family members, the total number of people relying on the fisheries sector climbs to 1.7 million persons.
The fisheries workforce in Yemen is considered to be well-trained. Artisanal fishermen have
developed experience and gained knowledge which is passed through generations. The industrial fisheries sector possesses highly-qualified, university-level employees specialized in maritime navigation and commercial fishing practices, with specializations in fish storage, refrigeration, freezing and processing. It is worthwhile noting that the national fisheries sector does not employ foreigners.
Women participate in numerous activities supporting the fisheries sector including working in fish
processing plants, manufacturing of fishing nets, fish separation, fish drying/smoking (mostly for the local market) and other activities. However, there are no statistics available on the number of women working in the sector.
C. INSTITUTIONAL AND REGULATORY FRAMEWORKS
1. The legislative framework
In January 2006, law number 2/2006 was issued to protect the marine biota and regulate its
exploitation. The law, which was drawn in line with international – notably European – laws, aimed to address gaps that were disregarded by earlier laws, and which are relevant to various stakeholders, including investors. The new law helped to free the fish market and called for greater involvement of local authorities in the management of this vital sector to ensure its sustainability.
A number of supporting regulations were issued in 2006 to complement this law, including
regulations governing the following issues: Industrial and artisanal fishing activities in Yemeni waters, including the identification of regions
where fishing is permitted;
36 (A. Morfq, Trade and Environment in the Fish Wealth Sector, October 2006) والتجارة والبيئة، أآتوبر عبد الرحمن مرفق، قطاع الثروة السمكية ٢٠٠٦
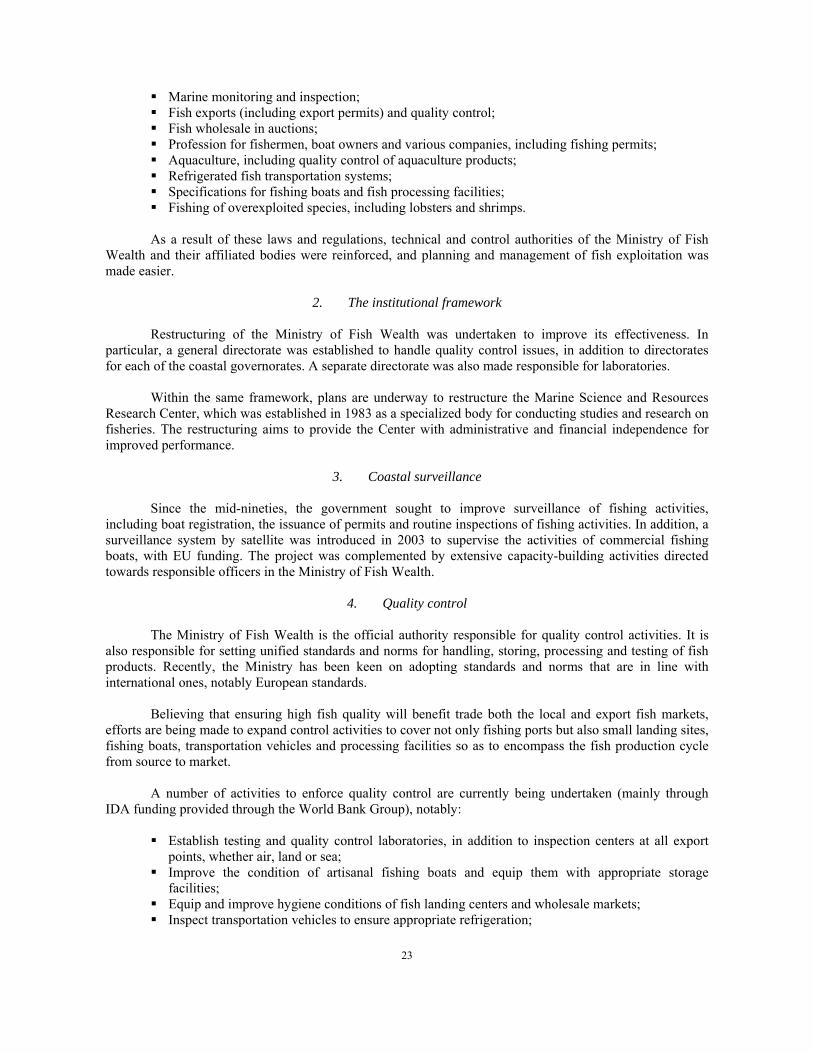
23
Marine monitoring and inspection; Fish exports (including export permits) and quality control; Fish wholesale in auctions; Profession for fishermen, boat owners and various companies, including fishing permits; Aquaculture, including quality control of aquaculture products; Refrigerated fish transportation systems; Specifications for fishing boats and fish processing facilities; Fishing of overexploited species, including lobsters and shrimps.
As a result of these laws and regulations, technical and control authorities of the Ministry of Fish
Wealth and their affiliated bodies were reinforced, and planning and management of fish exploitation was made easier.
2. The institutional framework
Restructuring of the Ministry of Fish Wealth was undertaken to improve its effectiveness. In
particular, a general directorate was established to handle quality control issues, in addition to directorates for each of the coastal governorates. A separate directorate was also made responsible for laboratories.
Within the same framework, plans are underway to restructure the Marine Science and Resources
Research Center, which was established in 1983 as a specialized body for conducting studies and research on fisheries. The restructuring aims to provide the Center with administrative and financial independence for improved performance.
3. Coastal surveillance
Since the mid-nineties, the government sought to improve surveillance of fishing activities,
including boat registration, the issuance of permits and routine inspections of fishing activities. In addition, a surveillance system by satellite was introduced in 2003 to supervise the activities of commercial fishing boats, with EU funding. The project was complemented by extensive capacity-building activities directed towards responsible officers in the Ministry of Fish Wealth.
4. Quality control
The Ministry of Fish Wealth is the official authority responsible for quality control activities. It is
also responsible for setting unified standards and norms for handling, storing, processing and testing of fish products. Recently, the Ministry has been keen on adopting standards and norms that are in line with international ones, notably European standards.
Believing that ensuring high fish quality will benefit trade both the local and export fish markets,
efforts are being made to expand control activities to cover not only fishing ports but also small landing sites, fishing boats, transportation vehicles and processing facilities so as to encompass the fish production cycle from source to market.
A number of activities to enforce quality control are currently being undertaken (mainly through
IDA funding provided through the World Bank Group), notably: Establish testing and quality control laboratories, in addition to inspection centers at all export
points, whether air, land or sea; Improve the condition of artisanal fishing boats and equip them with appropriate storage
facilities; Equip and improve hygiene conditions of fish landing centers and wholesale markets; Inspect transportation vehicles to ensure appropriate refrigeration;
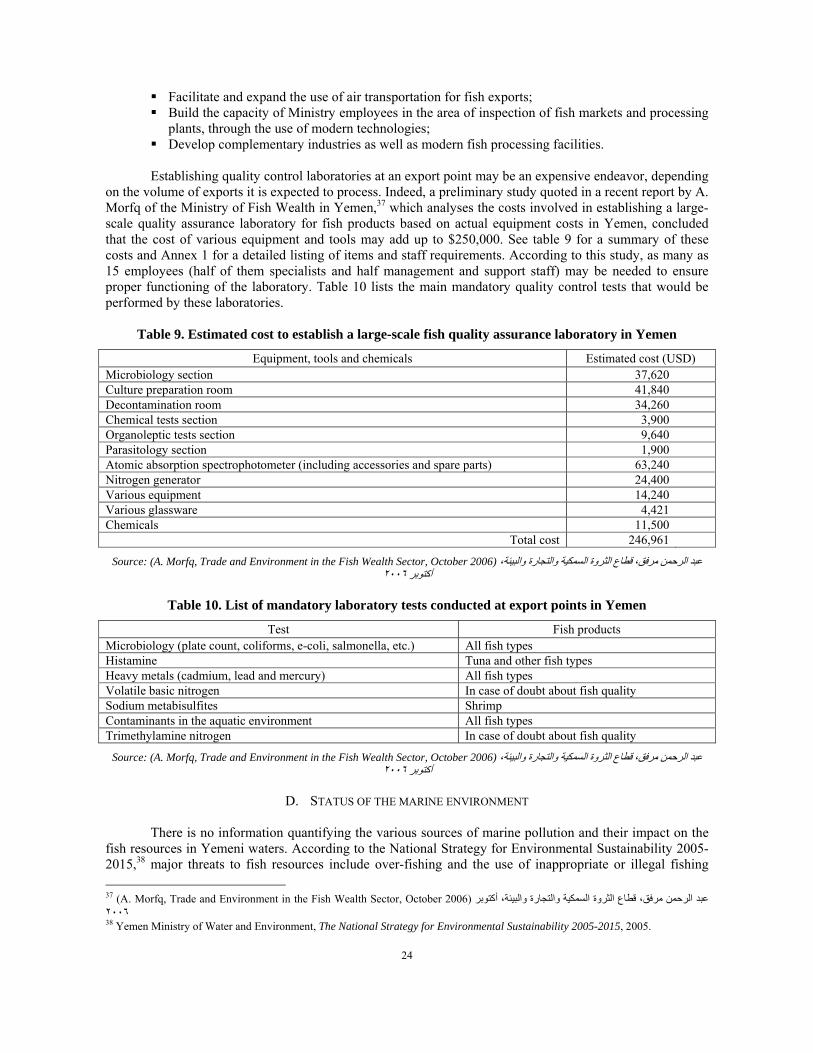
24
Facilitate and expand the use of air transportation for fish exports; Build the capacity of Ministry employees in the area of inspection of fish markets and processing
plants, through the use of modern technologies; Develop complementary industries as well as modern fish processing facilities.
Establishing quality control laboratories at an export point may be an expensive endeavor, depending
on the volume of exports it is expected to process. Indeed, a preliminary study quoted in a recent report by A. Morfq of the Ministry of Fish Wealth in Yemen,37 which analyses the costs involved in establishing a large-scale quality assurance laboratory for fish products based on actual equipment costs in Yemen, concluded that the cost of various equipment and tools may add up to $250,000. See table 9 for a summary of these costs and Annex 1 for a detailed listing of items and staff requirements. According to this study, as many as 15 employees (half of them specialists and half management and support staff) may be needed to ensure proper functioning of the laboratory. Table 10 lists the main mandatory quality control tests that would be performed by these laboratories.
Table 9. Estimated cost to establish a large-scale fish quality assurance laboratory in Yemen
Equipment, tools and chemicals Estimated cost (USD) Microbiology section 37,620 Culture preparation room 41,840 Decontamination room 34,260 Chemical tests section 3,900 Organoleptic tests section 9,640 Parasitology section 1,900 Atomic absorption spectrophotometer (including accessories and spare parts) 63,240 Nitrogen generator 24,400 Various equipment 14,240 Various glassware 4,421 Chemicals 11,500
Total cost 246,961
Source: (A. Morfq, Trade and Environment in the Fish Wealth Sector, October 2006) ن مرفق، قطاع الثروة السمكية والتجارة والبيئة، عبد الرحم٢٠٠٦أآتوبر
Table 10. List of mandatory laboratory tests conducted at export points in Yemen
Test Fish products Microbiology (plate count, coliforms, e-coli, salmonella, etc.) All fish types Histamine Tuna and other fish types Heavy metals (cadmium, lead and mercury) All fish types Volatile basic nitrogen In case of doubt about fish quality Sodium metabisulfites Shrimp Contaminants in the aquatic environment All fish types Trimethylamine nitrogen In case of doubt about fish quality
Source: (A. Morfq, Trade and Environment in the Fish Wealth Sector, October 2006) ،عبد الرحمن مرفق، قطاع الثروة السمكية والتجارة والبيئة٢٠٠٦أآتوبر
D. STATUS OF THE MARINE ENVIRONMENT
There is no information quantifying the various sources of marine pollution and their impact on the
fish resources in Yemeni waters. According to the National Strategy for Environmental Sustainability 2005-2015,38 major threats to fish resources include over-fishing and the use of inappropriate or illegal fishing 37 (A. Morfq, Trade and Environment in the Fish Wealth Sector, October 2006) عبد الرحمن مرفق، قطاع الثروة السمكية والتجارة والبيئة، أآتوبر٢٠٠٦ 38 Yemen Ministry of Water and Environment, The National Strategy for Environmental Sustainability 2005-2015, 2005.
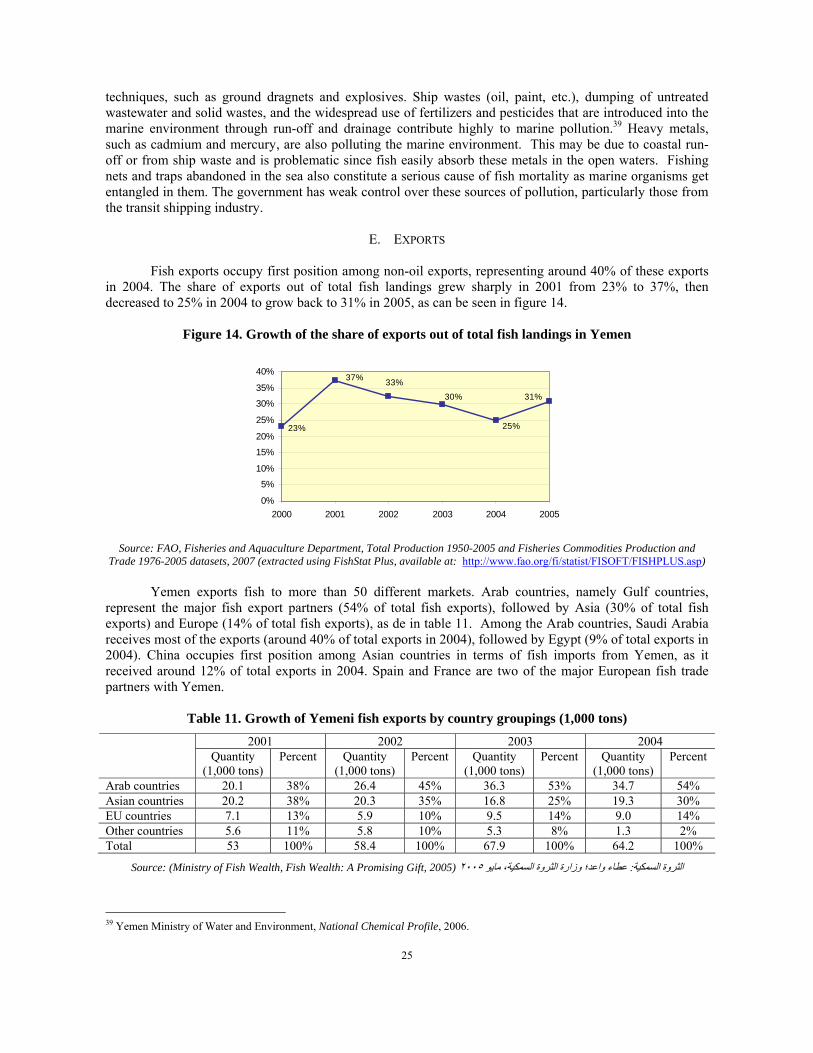
25
techniques, such as ground dragnets and explosives. Ship wastes (oil, paint, etc.), dumping of untreated wastewater and solid wastes, and the widespread use of fertilizers and pesticides that are introduced into the marine environment through run-off and drainage contribute highly to marine pollution.39 Heavy metals, such as cadmium and mercury, are also polluting the marine environment. This may be due to coastal run-off or from ship waste and is problematic since fish easily absorb these metals in the open waters. Fishing nets and traps abandoned in the sea also constitute a serious cause of fish mortality as marine organisms get entangled in them. The government has weak control over these sources of pollution, particularly those from the transit shipping industry.
E. EXPORTS
Fish exports occupy first position among non-oil exports, representing around 40% of these exports
in 2004. The share of exports out of total fish landings grew sharply in 2001 from 23% to 37%, then decreased to 25% in 2004 to grow back to 31% in 2005, as can be seen in figure 14.
Figure 14. Growth of the share of exports out of total fish landings in Yemen
31%
25%
30%
33%37%
23%
0%
5%
10%
15%
20%
25%
30%
35%
40%
2000 2001 2002 2003 2004 2005
Source: FAO, Fisheries and Aquaculture Department, Total Production 1950-2005 and Fisheries Commodities Production and
Trade 1976-2005 datasets, 2007 (extracted using FishStat Plus, available at: http://www.fao.org/fi/statist/FISOFT/FISHPLUS.asp) Yemen exports fish to more than 50 different markets. Arab countries, namely Gulf countries,
represent the major fish export partners (54% of total fish exports), followed by Asia (30% of total fish exports) and Europe (14% of total fish exports), as de in table 11. Among the Arab countries, Saudi Arabia receives most of the exports (around 40% of total exports in 2004), followed by Egypt (9% of total exports in 2004). China occupies first position among Asian countries in terms of fish imports from Yemen, as it received around 12% of total exports in 2004. Spain and France are two of the major European fish trade partners with Yemen.
Table 11. Growth of Yemeni fish exports by country groupings (1,000 tons)
2001 2002 2003 2004 Quantity
(1,000 tons) Percent Quantity
(1,000 tons) Percent Quantity
(1,000 tons) Percent Quantity
(1,000 tons) Percent
Arab countries 20.1 38% 26.4 45% 36.3 53% 34.7 54% Asian countries 20.2 38% 20.3 35% 16.8 25% 19.3 30% EU countries 7.1 13% 5.9 10% 9.5 14% 9.0 14% Other countries 5.6 11% 5.8 10% 5.3 8% 1.3 2% Total 53 100% 58.4 100% 67.9 100% 64.2 100%
Source: (Ministry of Fish Wealth, Fish Wealth: A Promising Gift, 2005) ٢٠٠٥عطاء واعد؛ وزارة الثروة السمكية، مايو : لسمكيةالثروة ا
39 Yemen Ministry of Water and Environment, National Chemical Profile, 2006.
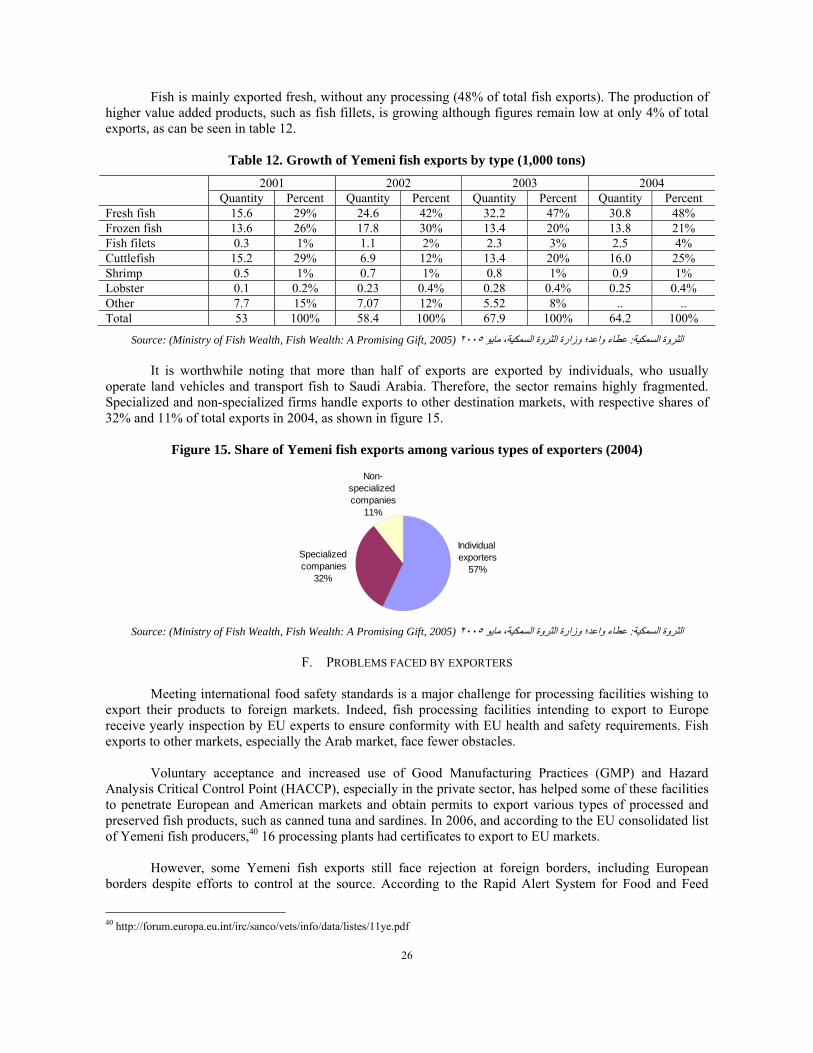
26
Fish is mainly exported fresh, without any processing (48% of total fish exports). The production of higher value added products, such as fish fillets, is growing although figures remain low at only 4% of total exports, as can be seen in table 12.
Table 12. Growth of Yemeni fish exports by type (1,000 tons)
2001 2002 2003 2004 Quantity Percent Quantity Percent Quantity Percent Quantity Percent
Fresh fish 15.6 29% 24.6 42% 32.2 47% 30.8 48% Frozen fish 13.6 26% 17.8 30% 13.4 20% 13.8 21% Fish filets 0.3 1% 1.1 2% 2.3 3% 2.5 4% Cuttlefish 15.2 29% 6.9 12% 13.4 20% 16.0 25% Shrimp 0.5 1% 0.7 1% 0.8 1% 0.9 1% Lobster 0.1 0.2% 0.23 0.4% 0.28 0.4% 0.25 0.4% Other 7.7 15% 7.07 12% 5.52 8% .. .. Total 53 100% 58.4 100% 67.9 100% 64.2 100%
Source: (Ministry of Fish Wealth, Fish Wealth: A Promising Gift, 2005) ٢٠٠٥عطاء واعد؛ وزارة الثروة السمكية، مايو : الثروة السمكية
It is worthwhile noting that more than half of exports are exported by individuals, who usually operate land vehicles and transport fish to Saudi Arabia. Therefore, the sector remains highly fragmented. Specialized and non-specialized firms handle exports to other destination markets, with respective shares of 32% and 11% of total exports in 2004, as shown in figure 15.
Figure 15. Share of Yemeni fish exports among various types of exporters (2004)
Specialized companies
32%
Non-specialized companies
11%
Individual exporters
57%
Source: (Ministry of Fish Wealth, Fish Wealth: A Promising Gift, 2005) ٢٠٠٥عطاء واعد؛ وزارة الثروة السمكية، مايو : الثروة السمكية
F. PROBLEMS FACED BY EXPORTERS
Meeting international food safety standards is a major challenge for processing facilities wishing to
export their products to foreign markets. Indeed, fish processing facilities intending to export to Europe receive yearly inspection by EU experts to ensure conformity with EU health and safety requirements. Fish exports to other markets, especially the Arab market, face fewer obstacles.
Voluntary acceptance and increased use of Good Manufacturing Practices (GMP) and Hazard
Analysis Critical Control Point (HACCP), especially in the private sector, has helped some of these facilities to penetrate European and American markets and obtain permits to export various types of processed and preserved fish products, such as canned tuna and sardines. In 2006, and according to the EU consolidated list of Yemeni fish producers,40 16 processing plants had certificates to export to EU markets.
However, some Yemeni fish exports still face rejection at foreign borders, including European
borders despite efforts to control at the source. According to the Rapid Alert System for Food and Feed
40 http://forum.europa.eu.int/irc/sanco/vets/info/data/listes/11ye.pdf
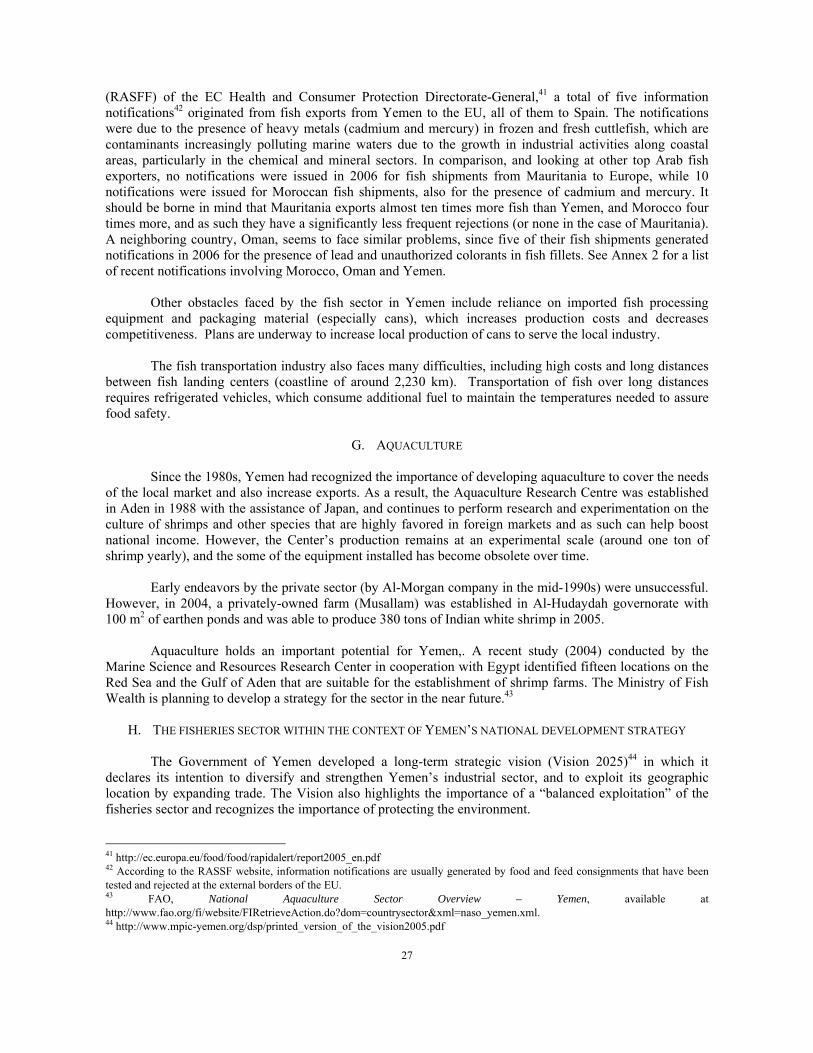
27
(RASFF) of the EC Health and Consumer Protection Directorate-General,41 a total of five information notifications42 originated from fish exports from Yemen to the EU, all of them to Spain. The notifications were due to the presence of heavy metals (cadmium and mercury) in frozen and fresh cuttlefish, which are contaminants increasingly polluting marine waters due to the growth in industrial activities along coastal areas, particularly in the chemical and mineral sectors. In comparison, and looking at other top Arab fish exporters, no notifications were issued in 2006 for fish shipments from Mauritania to Europe, while 10 notifications were issued for Moroccan fish shipments, also for the presence of cadmium and mercury. It should be borne in mind that Mauritania exports almost ten times more fish than Yemen, and Morocco four times more, and as such they have a significantly less frequent rejections (or none in the case of Mauritania). A neighboring country, Oman, seems to face similar problems, since five of their fish shipments generated notifications in 2006 for the presence of lead and unauthorized colorants in fish fillets. See Annex 2 for a list of recent notifications involving Morocco, Oman and Yemen.
Other obstacles faced by the fish sector in Yemen include reliance on imported fish processing
equipment and packaging material (especially cans), which increases production costs and decreases competitiveness. Plans are underway to increase local production of cans to serve the local industry.
The fish transportation industry also faces many difficulties, including high costs and long distances
between fish landing centers (coastline of around 2,230 km). Transportation of fish over long distances requires refrigerated vehicles, which consume additional fuel to maintain the temperatures needed to assure food safety.
G. AQUACULTURE
Since the 1980s, Yemen had recognized the importance of developing aquaculture to cover the needs
of the local market and also increase exports. As a result, the Aquaculture Research Centre was established in Aden in 1988 with the assistance of Japan, and continues to perform research and experimentation on the culture of shrimps and other species that are highly favored in foreign markets and as such can help boost national income. However, the Center’s production remains at an experimental scale (around one ton of shrimp yearly), and the some of the equipment installed has become obsolete over time.
Early endeavors by the private sector (by Al-Morgan company in the mid-1990s) were unsuccessful.
However, in 2004, a privately-owned farm (Musallam) was established in Al-Hudaydah governorate with 100 m2 of earthen ponds and was able to produce 380 tons of Indian white shrimp in 2005.
Aquaculture holds an important potential for Yemen,. A recent study (2004) conducted by the
Marine Science and Resources Research Center in cooperation with Egypt identified fifteen locations on the Red Sea and the Gulf of Aden that are suitable for the establishment of shrimp farms. The Ministry of Fish Wealth is planning to develop a strategy for the sector in the near future.43
H. THE FISHERIES SECTOR WITHIN THE CONTEXT OF YEMEN’S NATIONAL DEVELOPMENT STRATEGY
The Government of Yemen developed a long-term strategic vision (Vision 2025)44 in which it
declares its intention to diversify and strengthen Yemen’s industrial sector, and to exploit its geographic location by expanding trade. The Vision also highlights the importance of a “balanced exploitation” of the fisheries sector and recognizes the importance of protecting the environment.
41 http://ec.europa.eu/food/food/rapidalert/report2005_en.pdf 42 According to the RASSF website, information notifications are usually generated by food and feed consignments that have been tested and rejected at the external borders of the EU. 43 FAO, National Aquaculture Sector Overview – Yemen, available at http://www.fao.org/fi/website/FIRetrieveAction.do?dom=countrysector&xml=naso_yemen.xml. 44 http://www.mpic-yemen.org/dsp/printed_version_of_the_vision2005.pdf
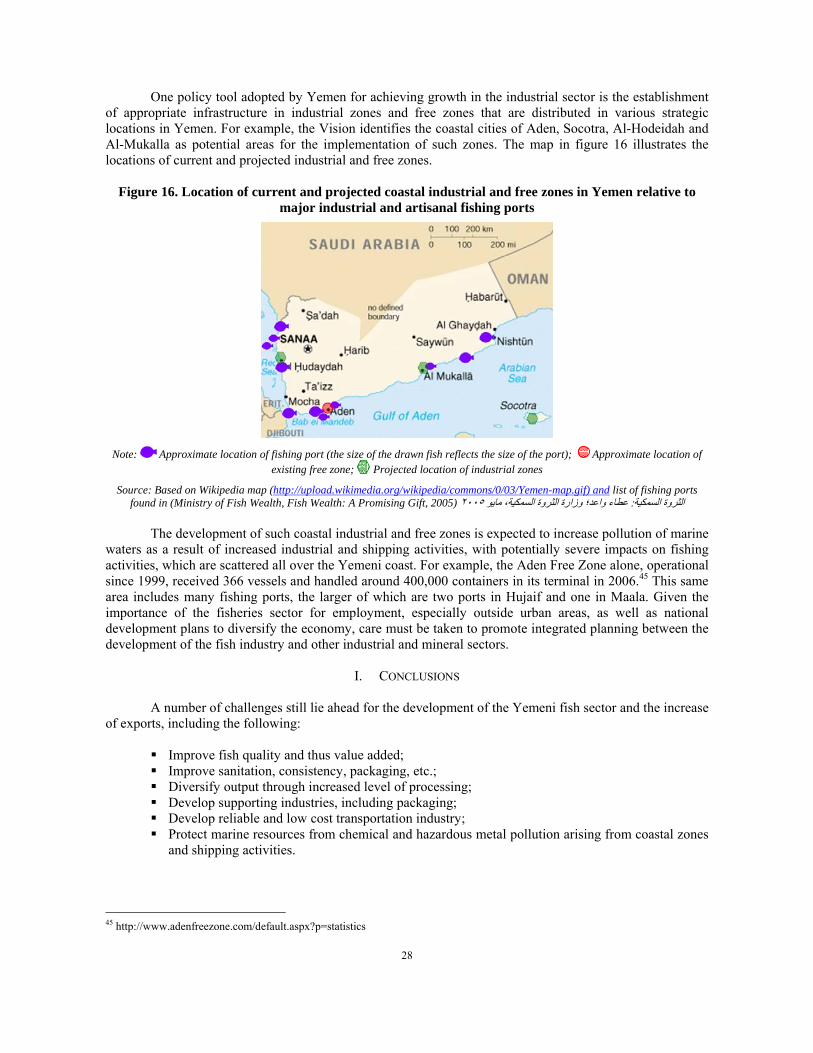
28
One policy tool adopted by Yemen for achieving growth in the industrial sector is the establishment of appropriate infrastructure in industrial zones and free zones that are distributed in various strategic locations in Yemen. For example, the Vision identifies the coastal cities of Aden, Socotra, Al-Hodeidah and Al-Mukalla as potential areas for the implementation of such zones. The map in figure 16 illustrates the locations of current and projected industrial and free zones.
Figure 16. Location of current and projected coastal industrial and free zones in Yemen relative to
major industrial and artisanal fishing ports
Note: Approximate location of fishing port (the size of the drawn fish reflects the size of the port); Approximate location of
existing free zone; Projected location of industrial zones
Source: Based on Wikipedia map (http://upload.wikimedia.org/wikipedia/commons/0/03/Yemen-map.gif) and list of fishing ports found in (Ministry of Fish Wealth, Fish Wealth: A Promising Gift, 2005) ٢٠٠٥عطاء واعد؛ وزارة الثروة السمكية، مايو : الثروة السمكية
The development of such coastal industrial and free zones is expected to increase pollution of marine
waters as a result of increased industrial and shipping activities, with potentially severe impacts on fishing activities, which are scattered all over the Yemeni coast. For example, the Aden Free Zone alone, operational since 1999, received 366 vessels and handled around 400,000 containers in its terminal in 2006.45 This same area includes many fishing ports, the larger of which are two ports in Hujaif and one in Maala. Given the importance of the fisheries sector for employment, especially outside urban areas, as well as national development plans to diversify the economy, care must be taken to promote integrated planning between the development of the fish industry and other industrial and mineral sectors.
I. CONCLUSIONS
A number of challenges still lie ahead for the development of the Yemeni fish sector and the increase
of exports, including the following: Improve fish quality and thus value added; Improve sanitation, consistency, packaging, etc.; Diversify output through increased level of processing; Develop supporting industries, including packaging; Develop reliable and low cost transportation industry; Protect marine resources from chemical and hazardous metal pollution arising from coastal zones
and shipping activities.
45 http://www.adenfreezone.com/default.aspx?p=statistics
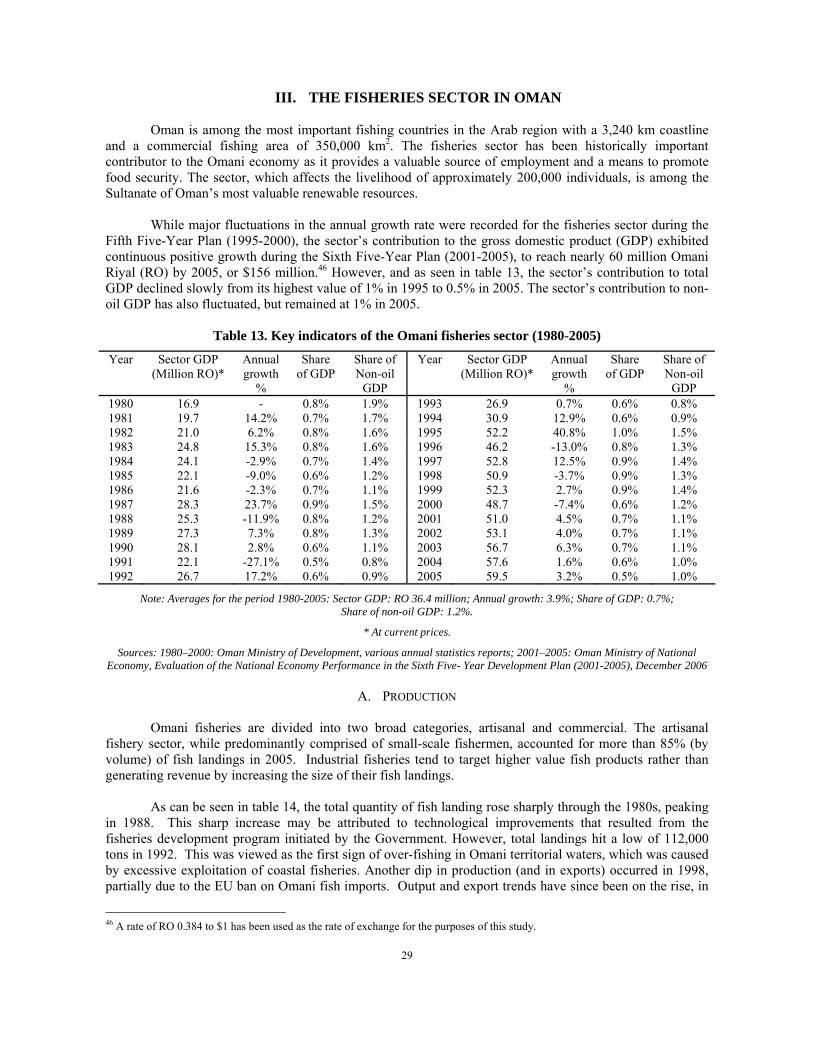
29
III. THE FISHERIES SECTOR IN OMAN
Oman is among the most important fishing countries in the Arab region with a 3,240 km coastline and a commercial fishing area of 350,000 km2. The fisheries sector has been historically important contributor to the Omani economy as it provides a valuable source of employment and a means to promote food security. The sector, which affects the livelihood of approximately 200,000 individuals, is among the Sultanate of Oman’s most valuable renewable resources.
While major fluctuations in the annual growth rate were recorded for the fisheries sector during the
Fifth Five-Year Plan (1995-2000), the sector’s contribution to the gross domestic product (GDP) exhibited continuous positive growth during the Sixth Five-Year Plan (2001-2005), to reach nearly 60 million Omani Riyal (RO) by 2005, or $156 million.46 However, and as seen in table 13, the sector’s contribution to total GDP declined slowly from its highest value of 1% in 1995 to 0.5% in 2005. The sector’s contribution to non-oil GDP has also fluctuated, but remained at 1% in 2005.
Table 13. Key indicators of the Omani fisheries sector (1980-2005)
Year Sector GDP (Million RO)*
Annual growth
%
Share of GDP
Share of Non-oil
GDP
Year Sector GDP (Million RO)*
Annual growth
%
Share of GDP
Share of Non-oil
GDP 1980 16.9 - 0.8% 1.9% 1993 26.9 0.7% 0.6% 0.8% 1981 19.7 14.2% 0.7% 1.7% 1994 30.9 12.9% 0.6% 0.9% 1982 21.0 6.2% 0.8% 1.6% 1995 52.2 40.8% 1.0% 1.5% 1983 24.8 15.3% 0.8% 1.6% 1996 46.2 -13.0% 0.8% 1.3% 1984 24.1 -2.9% 0.7% 1.4% 1997 52.8 12.5% 0.9% 1.4% 1985 22.1 -9.0% 0.6% 1.2% 1998 50.9 -3.7% 0.9% 1.3% 1986 21.6 -2.3% 0.7% 1.1% 1999 52.3 2.7% 0.9% 1.4% 1987 28.3 23.7% 0.9% 1.5% 2000 48.7 -7.4% 0.6% 1.2% 1988 25.3 -11.9% 0.8% 1.2% 2001 51.0 4.5% 0.7% 1.1% 1989 27.3 7.3% 0.8% 1.3% 2002 53.1 4.0% 0.7% 1.1% 1990 28.1 2.8% 0.6% 1.1% 2003 56.7 6.3% 0.7% 1.1% 1991 22.1 -27.1% 0.5% 0.8% 2004 57.6 1.6% 0.6% 1.0% 1992 26.7 17.2% 0.6% 0.9% 2005 59.5 3.2% 0.5% 1.0%
Note: Averages for the period 1980-2005: Sector GDP: RO 36.4 million; Annual growth: 3.9%; Share of GDP: 0.7%; Share of non-oil GDP: 1.2%.
* At current prices.
Sources: 1980–2000: Oman Ministry of Development, various annual statistics reports; 2001–2005: Oman Ministry of National Economy, Evaluation of the National Economy Performance in the Sixth Five- Year Development Plan (2001-2005), December 2006
A. PRODUCTION
Omani fisheries are divided into two broad categories, artisanal and commercial. The artisanal
fishery sector, while predominantly comprised of small-scale fishermen, accounted for more than 85% (by volume) of fish landings in 2005. Industrial fisheries tend to target higher value fish products rather than generating revenue by increasing the size of their fish landings.
As can be seen in table 14, the total quantity of fish landing rose sharply through the 1980s, peaking
in 1988. This sharp increase may be attributed to technological improvements that resulted from the fisheries development program initiated by the Government. However, total landings hit a low of 112,000 tons in 1992. This was viewed as the first sign of over-fishing in Omani territorial waters, which was caused by excessive exploitation of coastal fisheries. Another dip in production (and in exports) occurred in 1998, partially due to the EU ban on Omani fish imports. Output and export trends have since been on the rise, in
46 A rate of RO 0.384 to $1 has been used as the rate of exchange for the purposes of this study.
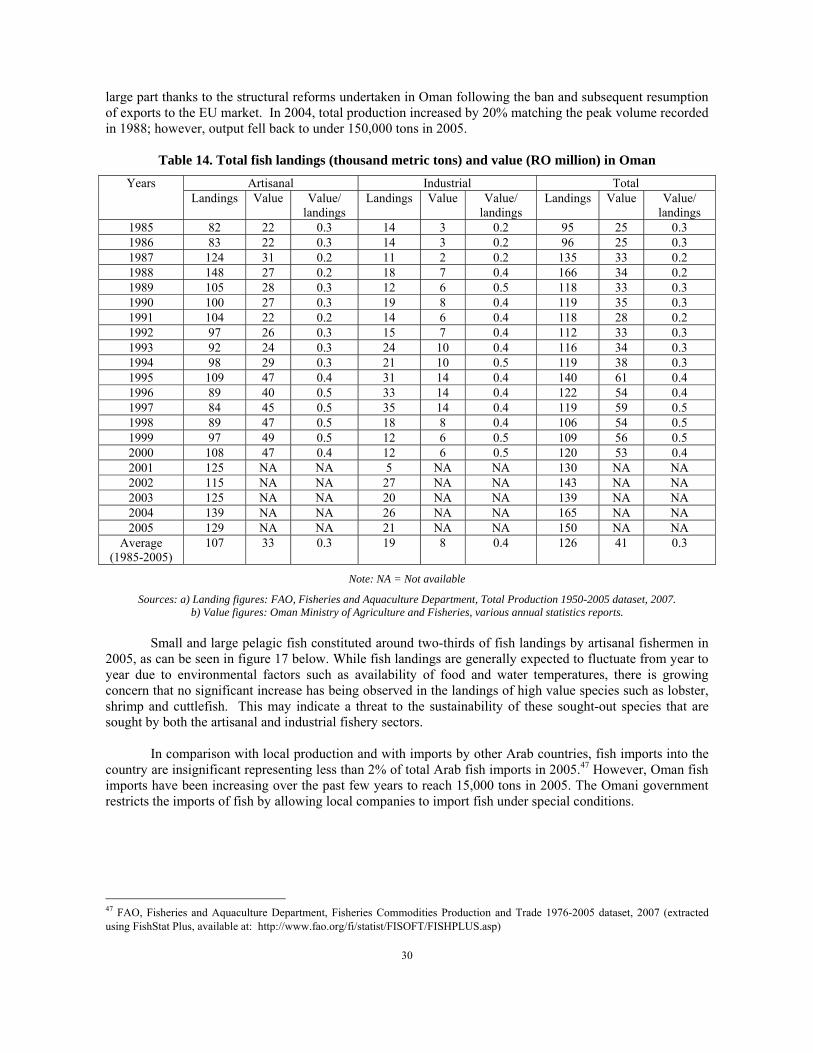
30
large part thanks to the structural reforms undertaken in Oman following the ban and subsequent resumption of exports to the EU market. In 2004, total production increased by 20% matching the peak volume recorded in 1988; however, output fell back to under 150,000 tons in 2005.
Table 14. Total fish landings (thousand metric tons) and value (RO million) in Oman
Artisanal Industrial Total Years Landings Value Value/
landings Landings Value Value/
landings Landings Value Value/
landings 1985 82 22 0.3 14 3 0.2 95 25 0.3 1986 83 22 0.3 14 3 0.2 96 25 0.3 1987 124 31 0.2 11 2 0.2 135 33 0.2 1988 148 27 0.2 18 7 0.4 166 34 0.2 1989 105 28 0.3 12 6 0.5 118 33 0.3 1990 100 27 0.3 19 8 0.4 119 35 0.3 1991 104 22 0.2 14 6 0.4 118 28 0.2 1992 97 26 0.3 15 7 0.4 112 33 0.3 1993 92 24 0.3 24 10 0.4 116 34 0.3 1994 98 29 0.3 21 10 0.5 119 38 0.3 1995 109 47 0.4 31 14 0.4 140 61 0.4 1996 89 40 0.5 33 14 0.4 122 54 0.4 1997 84 45 0.5 35 14 0.4 119 59 0.5 1998 89 47 0.5 18 8 0.4 106 54 0.5 1999 97 49 0.5 12 6 0.5 109 56 0.5 2000 108 47 0.4 12 6 0.5 120 53 0.4 2001 125 NA NA 5 NA NA 130 NA NA 2002 115 NA NA 27 NA NA 143 NA NA 2003 125 NA NA 20 NA NA 139 NA NA 2004 139 NA NA 26 NA NA 165 NA NA 2005 129 NA NA 21 NA NA 150 NA NA
Average (1985-2005)
107 33 0.3 19 8 0.4 126 41 0.3
Note: NA = Not available
Sources: a) Landing figures: FAO, Fisheries and Aquaculture Department, Total Production 1950-2005 dataset, 2007. b) Value figures: Oman Ministry of Agriculture and Fisheries, various annual statistics reports.
Small and large pelagic fish constituted around two-thirds of fish landings by artisanal fishermen in
2005, as can be seen in figure 17 below. While fish landings are generally expected to fluctuate from year to year due to environmental factors such as availability of food and water temperatures, there is growing concern that no significant increase has being observed in the landings of high value species such as lobster, shrimp and cuttlefish. This may indicate a threat to the sustainability of these sought-out species that are sought by both the artisanal and industrial fishery sectors.
In comparison with local production and with imports by other Arab countries, fish imports into the
country are insignificant representing less than 2% of total Arab fish imports in 2005.47 However, Oman fish imports have been increasing over the past few years to reach 15,000 tons in 2005. The Omani government restricts the imports of fish by allowing local companies to import fish under special conditions.
47 FAO, Fisheries and Aquaculture Department, Fisheries Commodities Production and Trade 1976-2005 dataset, 2007 (extracted using FishStat Plus, available at: http://www.fao.org/fi/statist/FISOFT/FISHPLUS.asp)
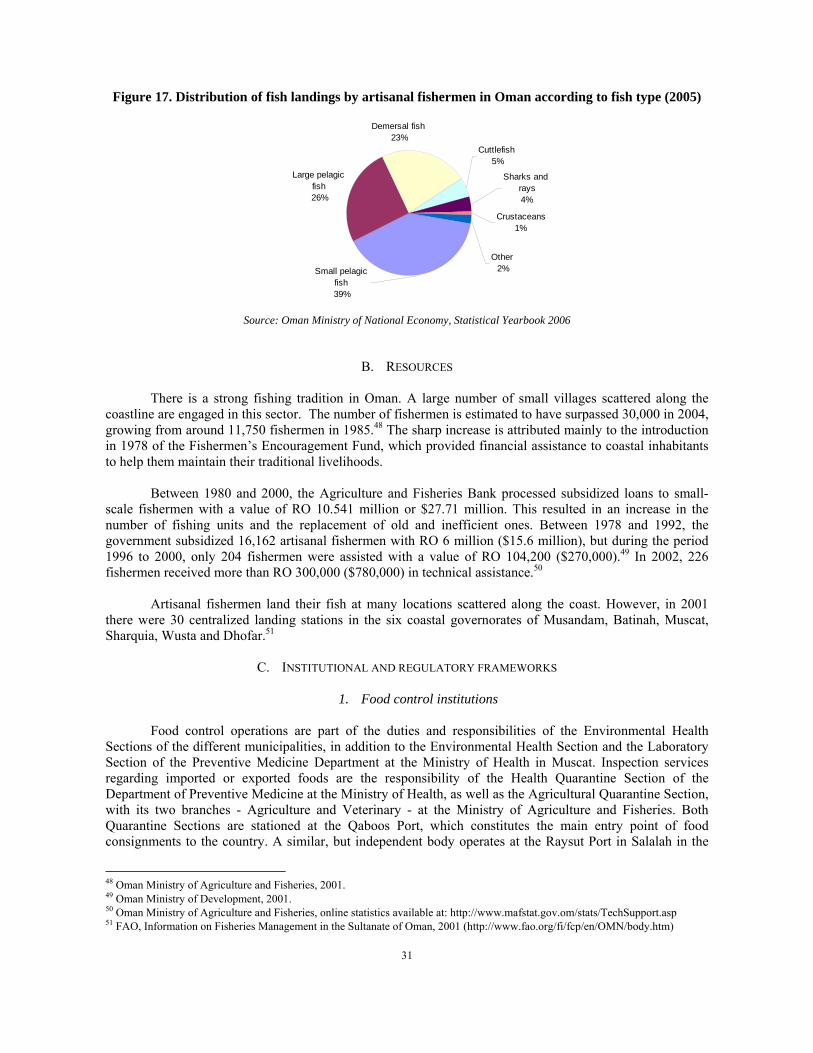
31
Figure 17. Distribution of fish landings by artisanal fishermen in Oman according to fish type (2005)
Large pelagic fish 26%
Small pelagic fish 39%
Demersal fish 23%
Crustaceans1%
Sharks and rays4%
Other 2%
Cuttlefish 5%
Source: Oman Ministry of National Economy, Statistical Yearbook 2006
B. RESOURCES There is a strong fishing tradition in Oman. A large number of small villages scattered along the
coastline are engaged in this sector. The number of fishermen is estimated to have surpassed 30,000 in 2004, growing from around 11,750 fishermen in 1985.48 The sharp increase is attributed mainly to the introduction in 1978 of the Fishermen’s Encouragement Fund, which provided financial assistance to coastal inhabitants to help them maintain their traditional livelihoods.
Between 1980 and 2000, the Agriculture and Fisheries Bank processed subsidized loans to small-
scale fishermen with a value of RO 10.541 million or $27.71 million. This resulted in an increase in the number of fishing units and the replacement of old and inefficient ones. Between 1978 and 1992, the government subsidized 16,162 artisanal fishermen with RO 6 million ($15.6 million), but during the period 1996 to 2000, only 204 fishermen were assisted with a value of RO 104,200 ($270,000).49 In 2002, 226 fishermen received more than RO 300,000 ($780,000) in technical assistance.50
Artisanal fishermen land their fish at many locations scattered along the coast. However, in 2001
there were 30 centralized landing stations in the six coastal governorates of Musandam, Batinah, Muscat, Sharquia, Wusta and Dhofar.51
C. INSTITUTIONAL AND REGULATORY FRAMEWORKS
1. Food control institutions
Food control operations are part of the duties and responsibilities of the Environmental Health
Sections of the different municipalities, in addition to the Environmental Health Section and the Laboratory Section of the Preventive Medicine Department at the Ministry of Health in Muscat. Inspection services regarding imported or exported foods are the responsibility of the Health Quarantine Section of the Department of Preventive Medicine at the Ministry of Health, as well as the Agricultural Quarantine Section, with its two branches - Agriculture and Veterinary - at the Ministry of Agriculture and Fisheries. Both Quarantine Sections are stationed at the Qaboos Port, which constitutes the main entry point of food consignments to the country. A similar, but independent body operates at the Raysut Port in Salalah in the
48 Oman Ministry of Agriculture and Fisheries, 2001. 49 Oman Ministry of Development, 2001. 50 Oman Ministry of Agriculture and Fisheries, online statistics available at: http://www.mafstat.gov.om/stats/TechSupport.asp 51 FAO, Information on Fisheries Management in the Sultanate of Oman, 2001 (http://www.fao.org/fi/fcp/en/OMN/body.htm)
32
Southern Region. There are two other control points: one at Khatmet Melaha in the north (opposite to Kalba, on the border with the UAE) and the other at Al-Wagaga (on the border with Dubai).
The High Consultative Committee for Food Affairs serves as the coordinating and planning body of
policies and regulatory requirements involving the food industry, including food control. The Committee is comprised of ten government agencies. However, the number of institutions involved in monitoring and managing the food industry is among the challenges facing seafood inspection agencies. For instance, the Directorate General of Health Control (DGHC) in the Ministry of Health and the Ministry of Regional Municipalities, Environment and Water Resources (MRMEWR) are both responsible for food hygiene in food establishments (e.g., retail shops, market places, fish markets, and food (including seafood) processing plants) located in all regions except for the Capital Area, Sohar, and Dhofar region. The Capital Area and Sohar are under the responsibility of the Muscat Municipality, while Dhofar region is under the responsibility of the Dhofar Municipality. DGHC is responsible for issuing an annual certificate for food handlers who work in these establishments.
2. Health and environmental standards
The Ministry of Commerce and Industry has, in cooperation with other agencies, developed 80
Omani standards for food products, but none of these standards concern fishery products.52 The Ministry carries out product analysis only at the request of foreign governments. The Department of Animal Wealth (DAW) at the Ministry of Agriculture and Fisheries (MAF) inspects products and issues certificates for each shipment of fish, as required, but there are no standards for products or establishments. The Directorate General of Fisheries Wealth (DGF) requires licensing of individuals or organizations that transport fish, and also requires use of approved fish boxes with ice, but this requirement is only applied to exports and is not widely enforced.
The General Directorate for Standards and Metrology was created in October 1976 and includes four
Departments: Standards, Laboratories, Quality Control and Metrology of Precious Metals.53 A separate section in the Department of Standards is responsible for issuing food standards. The Food Chemical Laboratory and the Microbiology Laboratory (of the Department of Laboratories) and the Inspection Section (of the Department of Quality Control) are responsible for testing food and water samples, whether imported or locally produced, to determine their conformity with Omani regulations. The laboratories also extend analytical services to governmental and non-governmental agencies and individuals upon request and on a fee basis.
Before 1998, the DAW was responsible for controlling exports and imports of agricultural goods,
meat and fishery products, as well as issuing permits for product shipments. The DAW did not have a laboratory at the time able to inspect fish products. Their only available laboratory was a veterinary laboratory, which was used to test for animal diseases. Accordingly, whenever the DAW needed to conduct a seafood analysis, it referred the request to the Ministry of Commerce and Industry. In 1999, a section was established at the Marine Science and Fisheries Centre (MSFC) for this purpose.
Overall, the Omani fisheries industry is broadly committed to compliance with environmental,
quality and health standards, including international standards such as HACCP, and existing Omani requirements. However, persisting impediments to the expansion of local exporters into new markets include lack of information on regulatory requirements in destination markets, voluntary standards and certification schemes, and consumer preferences.
52 The Ministry has also adopted Gulf Standard 21/1984 on “Hygiene Regulations for Food Plants and their Personnel,” but this standard does not apply to fish processing establishments. 53 http://www.mocioman.gov.om/arabic/standards/StandardsHome.html
33
3. Monitoring and inspection In 1998, Oman introduced mandatory quality management regulations (Ministerial Decision or MD
136/98) on exported seafood products to meet the increasingly stricter international standards on food safety.54 According to this decision, “inspection of establishments, buildings, ice boxes and fish handling, processing, and transport operations, as well as records and test results inspection shall be made according to HACCP.”55 Furthermore, Quality Control Regulations, as stipulated in MD 136/98, are complemented by the following decisions: Ministry of Commerce Decision No. 129/98 approving Omani Standards Specifications; Ministry of Commerce Decision No. 9/84 and 114/86 approving the Unified Gulf Standard Specifications; Ministry of Commerce Decision No. 61/84 approving the conditions concerning food processing plants and their personnel; and Ministry of Commerce Decision No. 58/84 approving the Labeling of Packaged Foods.
To implement MD 136/98 and to overcome challenges facing the sector, the government established
the Food Quality Control Center (FQCC) in 2002, which acts under the mandate of the Ministry of Agriculture and Fisheries. The mission of the FQCC is: (a) to ensure that consumers are provided with high quality seafood products meeting the highest standards of food safety and hygiene; (b) to encourage the development of seafood products; and (c) to increase consumer awareness of the significance of seafood in nutrition.56 The FQCC implements a system for inspection and analysis that ensures the quality of imported and exported seafood products, hence assisting seafood processing companies to comply with foreign regulations, such as those mandated by the EU. The FQCC is the officially designated assessment body that is responsible for certifying fish preparation and processing companies that adopt the Omani quality control system.
The Food Safety and System Implementation Section of the FQCC is responsible for reviewing and
approving plant layouts and documentation on seafood safety systems operated by processing plants, including compliance with HACCP. The section also reviews and disseminates new national and international legislations, and provides recommendations and advice through training workshops targeting employees of the seafood industry. This service is provided free of charge to all seafood plants willing to upgrade their systems so as to meet the requirements stipulated in MD 136/98. Once corrective actions are complete, the Inspection Section evaluates the HACCP-based quality assurance system, and if compliant, the plant is certified to export and issued a Quality Control (QC) number.
MD 136/98 maintains strict monitoring on fish exports especially to EU markets. For demersal
species, pelagic species and cephalopods exported fresh, a sample must analyzed for every six individual consignments or every five tons in a shipment, which ever is the least. For frozen products, samples are taken for analysis from every container. For baby sharks and crustacea, samples are taken for every second consignment, while every consignment of large shark are analyzed microbiologically and chemically.
The analytical tests required vary according to species and processing method. For example, only
microbiological analysis is carried out for demersal species, but exports of pelagic species require microbiological, histamine and chemical analysis. In addition, antibiotic residue analysis is required for aquaculture products. However, this test is not readily available in Oman and therefore samples are sent to foreign accredited laboratories for analysis, an operation which is costly (around RO 200 or $520 per sample). For canned products, samples are obtained from a plant on two randomly selected days each month and are subject to microbiological and chemical testing. The FQCC may sanction violators by withdrawing their QC number, which restricts their ability to export.
54 Oman Ministry of Agriculture and Fisheries, 2001. 55 HACCP as described in the HACCP Annex to the Codex Proposed Draft Guidelines for the Utilization and Importation of Quality Assurance Systems to Meet Requirements in Relation to Food (CX/FICS 02/6. 2001). 56 Food Quality Control Center, 2002.
34
D. STATUS OF THE MARINE ENVIRONMENT Oman has given high priority to environmental protection. A number of Royal Decrees have been
issued, among which Royal Decree No. 114/2001 entitled “the law on conservation of the environment and prevention of pollution.” This Royal Decree was reinforced by a number of Ministerial Decisions issued by the MRMEWR. In Oman, it is mandatory for development projects to obtain an environmental permit from the MRMEWR prior to initiating a project. These permits are issued based on an environmental impact assessment carried out by an authorized agency in which all mitigation measures needed are clearly indicated.57
Moreover, and in line with its national policy to protect the environment, Oman adhered to relevant
international and regional conventions, and is a member of ROPME and the IOTC (See Chapter II, Section C for elaboration) and was among the first in the region to sign the International Maritime Organization convention and protocols linked to MARPOL 73/78 and the UN Convention on the Law of the Sea.
Over-fishing constitutes a major environmental issue that impacts the sustainability of the sector and
can have significant economic and social implications as well. As in most developing nations, certain stocks of Oman’s coastal fisheries have been over-exploited and, as a result of the depletion, the livelihoods and the prosperity of coastal communities have been affected. The underlying factors are a combination of excess capacity and government transfers, which encourage excessive investment and activity in the fisheries sector, together with inadequate management of the resource.58
To overcome these management challenges, Oman now applies export restrictions for certain
endangered species of fish (e.g., shrimp, lobster and abalone) during breeding seasons. These restrictions are consistent with WTO rules because the same restrictions apply to domestic sale of these species. The FAO Code of Conduct for Responsible Fisheries was adopted in October 1995 to secure international consensus in support of an open and responsible regime for trading fish products with a view towards ensuring long-term sustainable development. Accordingly, Oman ratified a number of international treaties and conventions relevant to the management and exploitation of commercial fisheries, the most recent being that of the Indian Ocean Tuna Commission (signed in April 2000). In general, these agreements have helped Oman to fulfill and implement the objectives and principles contained within the FAO’s Code of Conduct.59 A major portion of the Code relates to promoting conservation and best management practices for fisheries resources such that present and future generations are able to benefit from this renewable resource.60 To fulfill its obligations under the Code of Conduct, the government developed and adopted appropriate policies and reviewed legal and institutional frameworks to support the sustainability of its national stocks.
Omani fisheries legislations have also begun to impose strict monitoring of industrial fishing vessels
through a monitoring system installed on each boat. Observers are also placed on these vessels to ensure compliance. In addition, large sums of money have been directed toward improving fisheries research through the national Fisheries Research Fund, which was established by a Royal Decree to support fisheries research in the Sultanate. The fund provides financial support to several research projects that provide baseline information and monitor fish stocks in order to inform fisheries management decisions. In 2004, the Agricultural and Fish Development Fund was established (Royal Decree No. 48) to undertake research and implement pilot projects aimed at developing agricultural and fish resources.
57 Al-Jufaili, S., Oman Marine Environment, 2001. 58 Al-Oufi, H., McLean, E. and Palfreman, A., “Observations upon the Batinah Artisanal Fishery, the Sultanate of Oman”, Marine Policy, vol. 24, pp. 423-429, 2000. 59 Oman adopted the FAO Code of Conduct for Responsible Fisheries in March 1999. 60 Mclean, E. and Al-Oufi, H., “Fisheries Stock Assessment and Fisheries Management Plan Development for the Sultanate of Oman”, report submitted to the Economic Coordination Council, 2001.
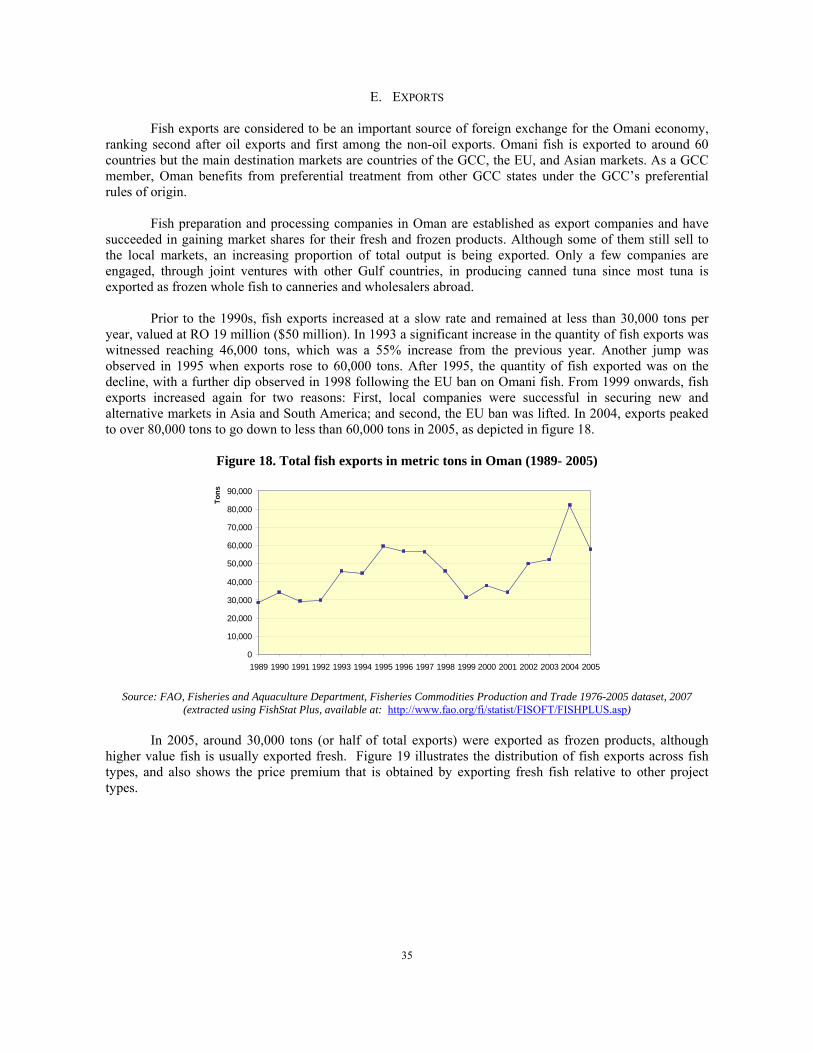
35
E. EXPORTS Fish exports are considered to be an important source of foreign exchange for the Omani economy,
ranking second after oil exports and first among the non-oil exports. Omani fish is exported to around 60 countries but the main destination markets are countries of the GCC, the EU, and Asian markets. As a GCC member, Oman benefits from preferential treatment from other GCC states under the GCC’s preferential rules of origin.
Fish preparation and processing companies in Oman are established as export companies and have
succeeded in gaining market shares for their fresh and frozen products. Although some of them still sell to the local markets, an increasing proportion of total output is being exported. Only a few companies are engaged, through joint ventures with other Gulf countries, in producing canned tuna since most tuna is exported as frozen whole fish to canneries and wholesalers abroad.
Prior to the 1990s, fish exports increased at a slow rate and remained at less than 30,000 tons per
year, valued at RO 19 million ($50 million). In 1993 a significant increase in the quantity of fish exports was witnessed reaching 46,000 tons, which was a 55% increase from the previous year. Another jump was observed in 1995 when exports rose to 60,000 tons. After 1995, the quantity of fish exported was on the decline, with a further dip observed in 1998 following the EU ban on Omani fish. From 1999 onwards, fish exports increased again for two reasons: First, local companies were successful in securing new and alternative markets in Asia and South America; and second, the EU ban was lifted. In 2004, exports peaked to over 80,000 tons to go down to less than 60,000 tons in 2005, as depicted in figure 18.
Figure 18. Total fish exports in metric tons in Oman (1989- 2005)
0
10,000
20,000
30,000
40,000
50,000
60,000
70,000
80,000
90,000
1989 1990 1991 1992 1993 1994 1995 1996 1997 1998 1999 2000 2001 2002 2003 2004 2005
Tons
Source: FAO, Fisheries and Aquaculture Department, Fisheries Commodities Production and Trade 1976-2005 dataset, 2007
(extracted using FishStat Plus, available at: http://www.fao.org/fi/statist/FISOFT/FISHPLUS.asp) In 2005, around 30,000 tons (or half of total exports) were exported as frozen products, although
higher value fish is usually exported fresh. Figure 19 illustrates the distribution of fish exports across fish types, and also shows the price premium that is obtained by exporting fresh fish relative to other project types.
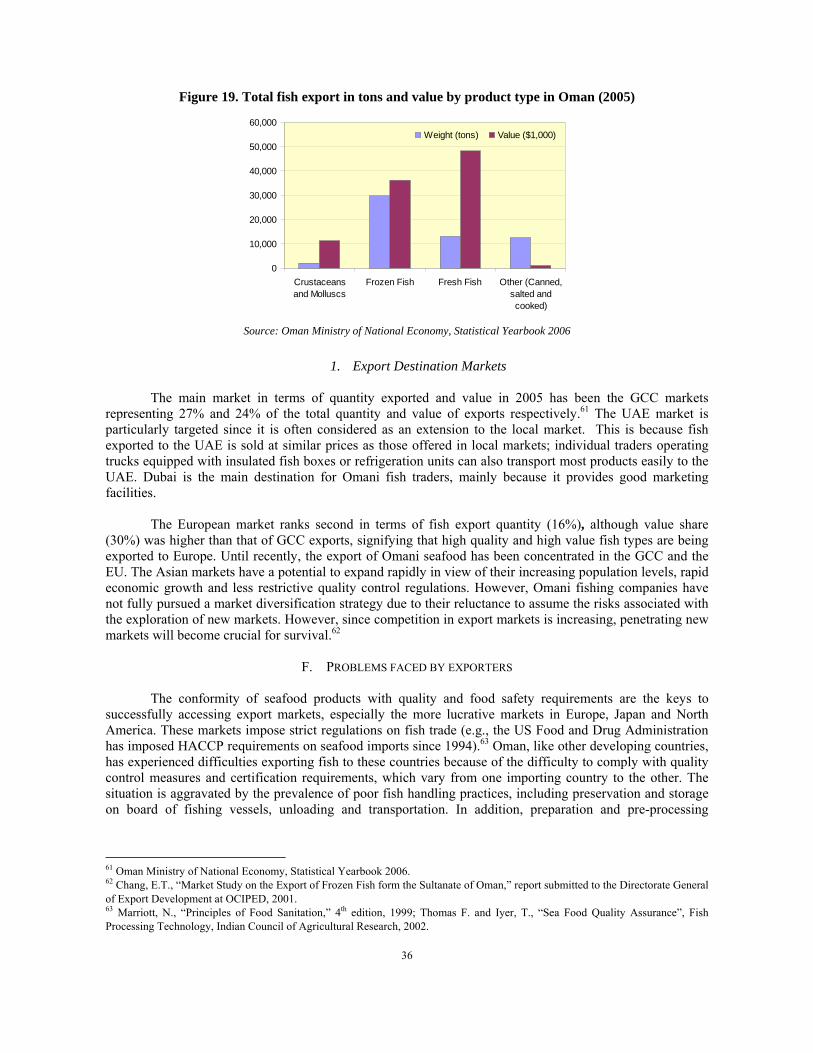
36
Figure 19. Total fish export in tons and value by product type in Oman (2005)
0
10,000
20,000
30,000
40,000
50,000
60,000
Crustaceansand Molluscs
Frozen Fish Fresh Fish Other (Canned,salted andcooked)
Weight (tons) Value ($1,000)
Source: Oman Ministry of National Economy, Statistical Yearbook 2006
1. Export Destination Markets
The main market in terms of quantity exported and value in 2005 has been the GCC markets
representing 27% and 24% of the total quantity and value of exports respectively.61 The UAE market is particularly targeted since it is often considered as an extension to the local market. This is because fish exported to the UAE is sold at similar prices as those offered in local markets; individual traders operating trucks equipped with insulated fish boxes or refrigeration units can also transport most products easily to the UAE. Dubai is the main destination for Omani fish traders, mainly because it provides good marketing facilities.
The European market ranks second in terms of fish export quantity (16%), although value share
(30%) was higher than that of GCC exports, signifying that high quality and high value fish types are being exported to Europe. Until recently, the export of Omani seafood has been concentrated in the GCC and the EU. The Asian markets have a potential to expand rapidly in view of their increasing population levels, rapid economic growth and less restrictive quality control regulations. However, Omani fishing companies have not fully pursued a market diversification strategy due to their reluctance to assume the risks associated with the exploration of new markets. However, since competition in export markets is increasing, penetrating new markets will become crucial for survival.62
F. PROBLEMS FACED BY EXPORTERS
The conformity of seafood products with quality and food safety requirements are the keys to
successfully accessing export markets, especially the more lucrative markets in Europe, Japan and North America. These markets impose strict regulations on fish trade (e.g., the US Food and Drug Administration has imposed HACCP requirements on seafood imports since 1994).63 Oman, like other developing countries, has experienced difficulties exporting fish to these countries because of the difficulty to comply with quality control measures and certification requirements, which vary from one importing country to the other. The situation is aggravated by the prevalence of poor fish handling practices, including preservation and storage on board of fishing vessels, unloading and transportation. In addition, preparation and pre-processing
61 Oman Ministry of National Economy, Statistical Yearbook 2006. 62 Chang, E.T., “Market Study on the Export of Frozen Fish form the Sultanate of Oman,” report submitted to the Directorate General of Export Development at OCIPED, 2001. 63 Marriott, N., “Principles of Food Sanitation,” 4th edition, 1999; Thomas F. and Iyer, T., “Sea Food Quality Assurance”, Fish Processing Technology, Indian Council of Agricultural Research, 2002.
37
operations, mostly conducted outside the plants under poor sanitary conditions, are sources of contamination and decomposition.64
A decrease in the landings of some commercial fish species is another major difficulty for local
exporters. Many processors claim that there has been an insufficient supply of fish to their processing plants and consequently, fish prices have increased sharply, especially for high value species. Higher prices for raw materials, coupled with high custom duties on Omani fish in foreign markets, impact the competitiveness of Omani fish exporters. In addition, it appears that due to the strict legislations imposed by the government on fish processors, and the consequent high requirements that processors impose on fishermen in terms of the quality of supplied fish, Omani fishermen prefer to sell a substantial quantity of their catch to the neighboring Dubai market rather than looking for more lucrative markets abroad, which further aggravates the situation for Omani exports. To address this problem, efforts need to be directed at exploiting new fishing grounds, especially deep-sea fish resources, in a sustainable manner. However, significant investments would first bee needed to modernize the national fishing fleet and to conduct research on species diversity and population levels in more distant territorial waters.
Competition in international markets, particularly from neighboring countries, is also on the rise as
many export countries are currently upgrading the capacity of their fish industry to comply with international standards. However, Oman has been able to face this challenge to some degree thanks to the quality assurance system that it adopted in 1999, which is recognized by the EU. As such, the EU ban had a positive effect in motivating increased investment and technical assistance in the sector and improving the competitiveness of Omani fish exporters.
In addition, the EU ban underlined the importance of continuous marketing development. After the
ban was lifted, many companies were certified to export to the EU but faced difficulty regaining their previous market shares because EU clients had contracted new suppliers during the ban and forged new commercial partnerships. Another source of competition stems from the custom duties scheme maintained by the EU. The scheme favors some countries, particularly those with preferential trade agreements with the EU that include provisions related to trade in fisheries – as is the case between the EU and some least developed countries which have duty-free access to the EU market.
64 Connell, J., “Control of Fish Quality”, 4th Edition, Fishing News Books, 1995.
38
Box 3. The European Union market
The EU consumption of fishery products is high, and internal market production in not sufficient to meet
growing demand. Supply is limited due to the implementation of the European Fisheries Common Policy, which restricts catches in order to preserve European fish stocks. Consequently, the EU depends heavily on imports and this trend is expected to continue.
The EU sets some of the highest specifications in terms of product quality assurance. The legislative
requirements have been established in a series of harmonized regulations since early 1990s. Directive 91/492/EEC imposes strict recommendations on building, construction, equipment, purification tanks and storage of products, while Directive 91/493/EEC requires quality assurance to be based on HACCP principles. Control should also take place prior to export rather than at the EU port of entry. In accordance with EU directives, exporting countries must also submit details regarding their national regulations concerning the export of seafood products, as well as comprehensive reports on the capacity of its control authority and associated infrastructure. The European Commission’s Health and Consumer Protection DG (SANCO) also sends delegations to visit exporting country on a regular basis to verify its compliance with EU standards. A permit is issued after an assessment of existing capacity through which an official control body65 in the exporting country is designated as the authorized body to monitor and enforce compliance with the requisite EU procedures and standards.
A health certificate also has to accompany all imports of fishery products into the EU, except for countries for
which an individual decision has been adopted. In addition, the EU imposes strict rules governing packaging and labeling. For example, plastic bags inside cartons must be of food grade quality so that any contact with food is not harmful to human health. In the case of canned products, maximum cadmium and mercury content thresholds are applicable.
Among other environmental requirements imposed by the EU is waste recycling. In 2000, the Commission set
a target to process 50% to 60% of packaging waste. These environmental requirements are transferred to exporters, which mean that packaging materials used for prepared and processed fish products should be recyclable to the extent possible. In addition, some countries within the EU imposed their own environmental requirements regarding packaging materials. For example, Austria, Belgium France and Germany have adopted the green dot scheme, which might impose additional financial burdens for Omani fish exporters or result in a technical barrier to trade of scheme-compliant materials are not readily available.
Omani exporters targeting the EU market must also remain informed of regulatory developments being
pursued by the EC, and also be aware of frequent changes to EU environmental policies and regulations so as to take appropriate measures and remain compliant with EU requirements. Otherwise, Omani exporters will be confronted with additional costs and face detentions of their products, thus reducing their competitiveness and profitability.
1. Adoption of HACCP The general principles articulated in HACCP shift the emphasis of control from the testing of end-
products to preventive control of all critical operations along the production process. This makes HACCP an ideal tool where resources are scarce, as is the case in many developing countries such as Oman. However, HACCP implementation and maintenance is not easy. It requires management commitment, an understanding of the system and its principles, as well as technical and financial resources to design and, implement and monitor HACCP plans. To achieve these goals, industry and government must be convinced of the rationale and importance of applying HACCP.
Following the 1998 EU ban, a compliance process was launched that involved costly and time-
consuming macro- and micro-level diagnostics and actions. At the macro-level, the responsibility of the government was to: 1) increase awareness and issue the necessary legislation to implement and enforce the
65 In Oman, FQCC is the official controlling body recognized by the EU.
39
required quality control measures;66 2) provide sufficient infrastructure, such as icing and other facilities, in several fishing areas; 3) ensure the existence of adequate laboratories to facilitate testing; and 4) provide the needed training and technical assistance for companies to improve their quality assurance systems.
At the company level, the responsibility of the private processing companies was to develop a
company-specific quality assurance system to meet international standards. This often required the modification of their layout to permit the smooth flow of the product from reception to delivery without contamination. For small fishermen, compliance required the use of fishing methods that preserve the catch from vessel to shore to points of sale.
In July 1999, only one year after the ban, nine plants were certified as being HACCP-compliant, and
soon after (October of the same year), the EU lifted the ban. The number of certified plants increased gradually reaching 25 factories by September 2002 representing around 50% of the total processing plants in the Sultanate. Many companies subsequently pursued the process of upgrading their plants, and as a result, 21 companies obtained certifications for exporting fish to the EU in 2007 (refer to table 3 earlier in this study).
An estimate of the effects of quality control adoption would also consider the benefits that would be
generated in terms of competitiveness and penetration in international markets. A 1999 study67 used an econometric analysis to investigate export performance of fish processing companies in Oman, and found a positive relation between the variables reflecting the quality of fish products (use of HACCP) and an export penetration index defined as the proportion of export sold to the USA and Europe over total production. The relationship is strongest for companies requiring minor modification to adapt to international standards. The same study investigated the impacts of the 1998 EU ban on Oman fish exports and the internationalization of Oman fish companies. The study investigated how firms responded to the ban and the effects it had on the long term export strategy of the fish companies. During the ban, most firms reacted by identifying new substitute markets. Shortly after the ban was lifted, most companies acquired the needed competencies and engaged in a more rigorous, long term strategy in order to improve their production process. The ban thus acted as a driving force which helped to modernize and upgrade the fisheries industry to become HACCP-compliant.
G. AQUACULTURE AND OTHER VALUE-ADDED PRODUCTS
Most of Oman’s current exports are targeted toward medium and down-scale markets, mainly
because of quality constraints. However, global demand for prepared and processed fish products is expected to increase in the future in line with increasing population levels and greater public interest in personal health. The contribution of the domestic fisheries sector is thus expected to increase significantly and create new jobs if industry remains in line with international standards and developments.
The private sector is already contributing to the development and expansion of the fisheries sector.
Private firms have been actively involved in improving operating conditions and practices during catching, distribution, marketing and exportation of fish. Export of higher value added products, such as fish fillets, fish fingers, cakes, burgers, and sausages, together with tuna and sardine canning operations, is increasing. However, aspects related to freshness, quality control, microbiology, and product packaging need to be enhanced to assist processing companies to better access foreign markets. A survey of firms, summarized in Annex 3, signals that the private sector is aware if the needs and concerns affecting the industry.
66 Under the new legislation, only licensed companies approved by the FQCC are allowed to export fish to Europe. 67 Zaibet, L., “Competitiveness of Omani Fresh and frozen Fish Exports: Economic Analysis of Quality Control”, report prepared for the Fisheries Research Fund, 1999.
40
1. Aquaculture New opportunities are emerging in Oman with the development of aquaculture. While still in its
early stages of development and although its contribution to the national economy is negligible,68 the potential for significant growth and expansion exist. Total aquaculture production was approximately $1.5 million in 2003, but increased to $2.5 million in 2004. High prices in neighboring UAE, coupled with the fact that the Omani consumer had not developed a preference for aquaculture products, explain why almost all of the production is exported ($2.29 million in 2004) to the UAE and to Japan (in the case of tuna).
The first aquaculture farm was set up in the region of Sur in 1986, and although technical limitations
forced the facility to cease operations a couple years later, the initiative caught the attention of the government planners. In 1992, the Ministry of Agriculture and Fisheries established the Aquaculture Laboratory with the objective of undertaking applied and scientific research in the field, as well as identify potential sites and species for development.
Positive research outcomes led to the establishment of the Aquaculture Committee in 1996 with the
mandate of managing the sector and the relationship with the private sector. In 2000, and two years after the establishment of the Fish Quality Control Center, the institutional framework governing the aquaculture industry was further developed with the establishment of the Department of Aquaculture Development. The Department was entrusted with organizing the work of the Aquaculture Committee, seeking investment opportunities, and receiving requests from companies wishing to enter the market. In 2004, a ministerial decision was issued setting the by-laws on aquaculture and quality control of cultured organisms.
Amongst the species commercially farmed are two exotic ones, the gilthead sea bream and the
European sea bass. Additional species are also produced such as the yellow-fin sea bream, the Nile tilapa (originally imported from Egypt and Thailand) and the orange-spotted grouper (imported from Kuwait). The main culture systems practiced include cage farming (most common), integrated farming systems (fresh water small farms), and tuna farming. Oman is the first country in the Middle East to have launched a tuna farming project, which in 2004 produced 14 tons of yellow-fin tuna.
The increasing global demand for fish has encouraged investors to venture into aquaculture. Exports
of fish can increase significantly through the utilization of the aquatic environment and the application of aquaculture. However, more applied research is still required in order to promote the development of the industry.
2. Other value added products
Another value added industry that can be supported by the marine environment is the use of marine
biotechnology tools to produce a range of high-value products. Oman hosts a variety of coastal habitats that are home to a great diversity of animal and plant life. Compared to terrestrial habitats, the oceans and their life remain largely unexplored. Using biotechnology tools, oceans can be tapped to provide a range of new products. While marine biotechnology remains a young field, it promises considerable rewards. Current research seeks new diagnostic and therapeutic agents for diseases including HIV, cancer, Alzheimer’s disease and many others, in addition to the development of new enzyme catalysts and microorganisms that are able to detoxify and renew pollution-degraded environments.69 Marine cultures could also become a source of raw material to support the biotechnology industry.
The global industry has incorporated research findings from marine biotechnologies into food
production, pharmaceuticals, and biomaterials. In doing so it has used the marine environments as a source
68 FAO, National Aquaculture Sector Overview - Oman, available at http://www.fao.org/figis/servlet/static?dom=countrysector&xml=naso_oman.xml. 69 E. Mclean, “A National Center for Marine Biotechnology: A Proposal”, Sultan Qaboos University, 2001.
41
of traditional minerals and as a novel arena in which to create new products and sources of energy. Because of the high level of scientific and technical integration required, marine biotechnology represents one of the new frontiers left for scientific exploration and commercialization in the 21st century. Research and developments in the field could result in considerable prospects for increasing productivity and income generation from marine-based renewable resources in Oman. However, care must be taken to minimize human-induced exploitation of such resources and to ensure their sustainability.
H. THE FISHERIES SECTOR WITHIN THE CONTEXT OF OMAN’S NATIONAL DEVELOPMENT STRATEGY
Oman developed its second long-term development strategy in 1995, which is known as “Vision
2020”. The strategy calls for greater economic diversification and shifting from reliance on oil to sectors that can foster increased involvement of the private sector.70 Among the initiatives identified for achieving this vision is the development of industrial estates and free zones, as well as seaports to support export growth. While these activities are expected to help boost various industries including fish processing and trade, they could also have negative impacts on the marine environment in areas close to existing and planned industrial zones, unless integrated planning and sufficient investment in environmental management services are pursued from the onset.
Four coastal industrial estates are currently operational in Sohar, Rusayl (close to Muscat), Sur and
Raysut,. These zones serve various industries, including oil, chemical, food, and construction materials, as detailed in table 15. More coastal industrial estates are planned, including one Khasab in the Musandam area, which is known for its fishing industry. As depicted in figure 20, numerous fish landing sites and fishing activities (artisanal and industrial) are located in areas neighboring these existing and planned industrial estates.71 This are notably found near the coastal cities overlooking the Gulf of Oman as well as around Salalah.
Table 15. Current coastal industrial estates in Oman
Name Year of establishment
Closest port Industries operating in the estate
Rusayl 1983 Sultan Qaboos
Chemicals, batteries, electrical and building materials, fiber optic cables, food, textiles and garments, stationery, paints
Sohar 1992 Sohar Port
Marble, paper recycling, food, detergents, leather, furniture, toothpaste, resins, glass, steel bars, engine oil
Raysut 1992 Salalah Port
Stationery, food (including ice and fish processing), PVC pipes, steel fabrication, medical supplies, solar heaters, fertilizers
Sur 1999 Possesses its own port Fertilizers, natural gas and its associated industries
Source: Public Establishment for Industrial Estates, http://www.peie.om/ While most industrial zones under development along the coastline have conducted feasibility
studies that identify the environmental infrastructure that will be needed to support sectors targeted for establishment in these zones (e.g., wastewater treatment plants, access to sewage networks, storm water facilities), adequate implementation of their recommendations is needed. This is of particular concern in industrial estates that will cater to heavy industries, including those associated with the petrochemicals industry, due to the impacts they may have on the local marine environment. Similar consideration should also be given to the location of proposed desalinization plants, which may also impact the neighboring marine environment in terms of its salinity and temperature, which are also likely to adversely impact fish stocks. Careful consideration of these relationships will be needed, particularly as domestic and industrial water demand associated with these industrial zones increases.
70 http://www.moneoman.gov.om/dev_strategy2.asp 71 For example in Sur, Sohar, Salalah and Muscat.
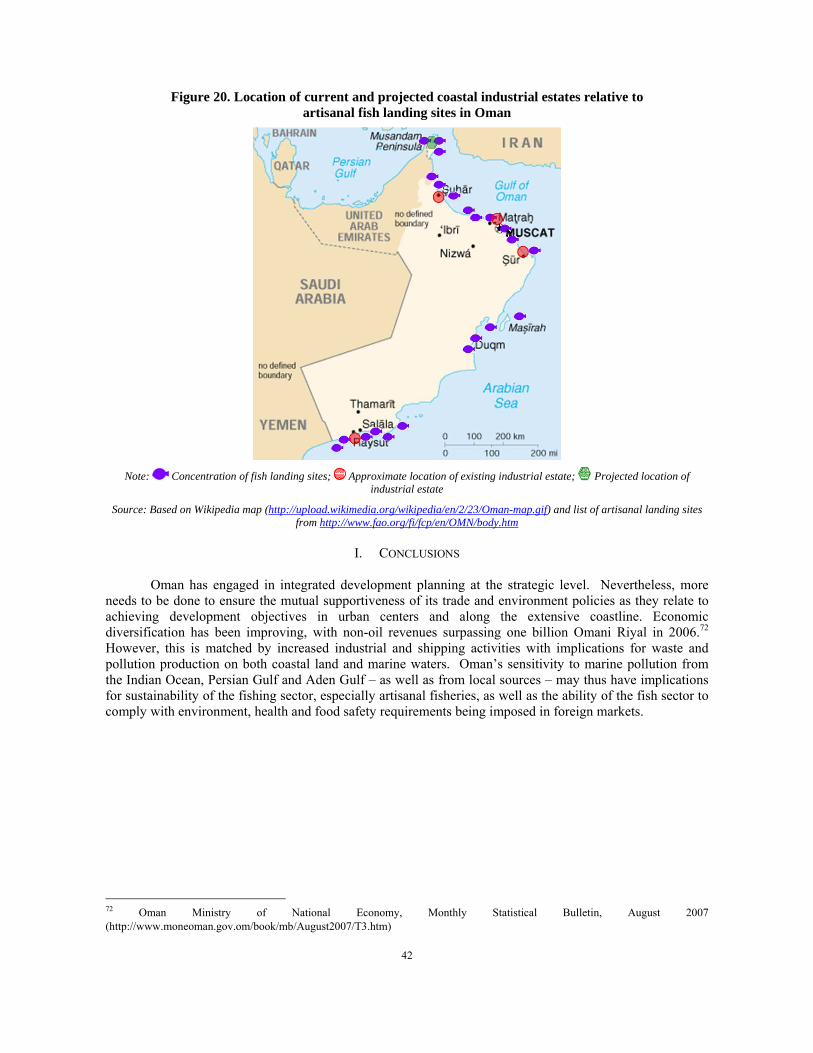
42
Figure 20. Location of current and projected coastal industrial estates relative to artisanal fish landing sites in Oman
Note: Concentration of fish landing sites; Approximate location of existing industrial estate; Projected location of
industrial estate
Source: Based on Wikipedia map (http://upload.wikimedia.org/wikipedia/en/2/23/Oman-map.gif) and list of artisanal landing sites from http://www.fao.org/fi/fcp/en/OMN/body.htm
I. CONCLUSIONS
Oman has engaged in integrated development planning at the strategic level. Nevertheless, more
needs to be done to ensure the mutual supportiveness of its trade and environment policies as they relate to achieving development objectives in urban centers and along the extensive coastline. Economic diversification has been improving, with non-oil revenues surpassing one billion Omani Riyal in 2006.72 However, this is matched by increased industrial and shipping activities with implications for waste and pollution production on both coastal land and marine waters. Oman’s sensitivity to marine pollution from the Indian Ocean, Persian Gulf and Aden Gulf – as well as from local sources – may thus have implications for sustainability of the fishing sector, especially artisanal fisheries, as well as the ability of the fish sector to comply with environment, health and food safety requirements being imposed in foreign markets.
72 Oman Ministry of National Economy, Monthly Statistical Bulletin, August 2007 (http://www.moneoman.gov.om/book/mb/August2007/T3.htm)
43
IV. CONCLUSIONS AND RECOMMENDATIONS
Most Arab countries are blessed with a variety of coastal habitats that are home to a diversity of animal and plant life. Fish exports are a significant source of foreign currency for many Arab economies, particularly those seeking to diversify their national economies. The fisheries sector is also an important way of generating income and employment opportunities in coastal communities that have traditional engaged in artisanal and industrial fishing.
The main destination markets for Arab fish exports are countries of the GCC, the EU, and certain
Asian markets, such as China and Japan. Countries in the Gulf tend to export largely to GCC countries, while North African fish producers are oriented more towards Europe. Interestingly, despite growing production and export of fish products in the region, several countries in the ESCWA region still import fish from Asia (Thailand) and Europe (the Netherlands).
Arab fish exporters face numerous challenges imposed by the rapid globalization and the emergence of new environmental and food safety regulations. With international competition becoming more intense, inaction will result in the loss of market share and profitability for Arab exporters. The inability to access more regulated foreign markets will also prompt producers to catch greater volumes of lower-value fish that can be caught and sold to less developed markets, but at lower prices. This will in term exacerbate the depletion of fishery resources as profitability will be related to volume rather than quality. In the absence of increased capacity and investment in the sector, the situation will prevent producers in the region from securing price premiums associated with catch, preparation and processing of higher value products.
One success story emerging from the Arab region is found in the response of the government and the
private sector to the EU ban on its fish exports from Oman in 1998 due to food safety concerns. The incident represented a turning point for the industry and triggering Omani fish producers to upgrade their processing plants and establish HACCP-compliant systems in conformity with international standards. Targeted investments in modern production and process technologies, enhanced technical capacity and improved infrastructure at fish landing sites served to improve the competitiveness of the fisheries industry, which was able to regain access to the EU market less than one year after the ban was imposed.
Environmental and health consideration must be integrated throughout the production value chain –
from sea to final sale – so as to ensure that products and processes comply with measures required in foreign markets. The scale and scope of investment needed to improve fish quality and demonstrate compliance with foreign standards can be significant. For instance, the estimated cost to establish a fish quality assurance laboratory in Yemen could reach $250,000. Such facilities are needed in order to conduct mandatory testing of fish products at the source, rather than at the point of entry, as required by EU regulations. Ice-making factories and refrigeration - which are energy-intensive activities - are also needed at strategic points along the coastline in order to preserve fish for longer durations, particularly during the long and hot summers that characterize the region.
Traces of heavy metals (mercury, cadmium, lead), use of colorants and the decomposition of fish are
among the chief causes of detentions of fish export from Arab countries to markets outside the region. While the source of some of these problems may be inadequate compliance with sanitary measures, increased trade and shipping of goods through water bodies surrounding the Arab region is increasing the concentration and range of marine pollutants, which are being absorbed by regional fish stocks. Effluent emitted from heavy industries based in industrial zones along the Arab coast could present another problem if mitigation measures are not incorporated into national development plans from the onset. The environmental effects of trade, transport and globalization thus have important implications for the regional and global fish trade.
Over-fishing is another trade-related challenge affecting the potential of the industry to expand in the
Arab region. While some progress has been made in applying export restrictions for certain endangered and high-value species during breading seasons, some developing countries must still strike the balance between
44
national interests involving the protection of fish stocks compared to the potential income that can be generated from selling fishing licenses to large foreign vessels. Sufficient funds must also be allocated to research institutes that can support the monitoring of fish stocks so as to inform decision-making on sustainable fisheries management. New opportunities presented by aquaculture might also be a way to stem the depletion of fishery resources, while still expanding exports.
Governmental and non-governmental institutions in the Arab region have a pivotal role to play in
increasing market access for fish exports and enhancing their competitiveness in foreign markets. A host of regional organizations are currently mandated to work on fisheries in the Arab region. Through improved coordination between these institutions and improved understanding of the trade and environmental dimensions of the fisheries industry, coherent sustainable development strategies can be formulated at the national and regional levels.
A. RECOMMENDATIONS
The following recommendations are proposed for consideration as a means to facilitate discussion of
measures to improve the competitiveness and sustainability of the fisheries sector in the Arab region, with a view to trade and environment concerns.
1. Regulatory actions
Develop (or update existing) fishing laws, associated regulations and supporting monitoring and
enforcement mechanisms; Regulate, and possibly reduce, duration of fishing seasons for over-exploited fish species, such as squids,
shrimps and lobster; Develop aquaculture standards; Require fish processing factories to comply with international standards related to food safety, even for
products not destined for export; Supervise the artisanal fishing sector to ensure appropriate food safety and quality measures are being
applied. For example, (a) ensure that proper refrigeration is being used throughout the production cycle, from storage inside fishing boats, through unloading and transportation and at fish markets; and (b) require all small boats to unload their fish at landing sites where appropriate infrastructure is available.
2. Infrastructure development
Encourage private sector investment in energy-efficient ice production and refrigeration facilities
throughout the coastline; Establish additional refrigeration and freezing units to allow stocking of excess fish during high seasons
for sale during periods of low productivity; Supply ice production and refrigeration units with power generators and ensure spare parts are available
to reduce down time; Facilitate investment and purchase of refrigerated trucks for enhanced inter-regional transport and trade; Develop hygienic central fish landing and distribution sites and equip them with quality assurance
laboratories.
3. Capacity building activities
Train fishermen in the hygienic cleaning, preparation, storage and stocking of fish to extend shelf life, and improve artisanal processing methods, such as those used for smoking and drying fish;
Modernize the artisanal boat industry so as to equip all boats with cold storage areas; Support research and development in aquaculture; Build the capacity of government employees responsible for monitoring and reporting on renewable
resources and quality control.

45
4. Policy coherence and integrated sustainable development planning
Integrate fisheries development policies, including aquaculture, into national development strategies, by drawing upon linkages between industrial development, agricultural intensification, income generation, environmental protection and trade.
Improve environmental management policies associated with the trade, transport and disposal of chemicals and hazardous substances that pose a threat to marine environments;
Balance government gains from the issuance of industrial fish licenses in EEZ against measures seeking to preventing over-fishing.
46
Bibliography
Agreement for the Establishment of the General Fisheries Commission for the Mediterranean, http://www.fao.org/Legal/treaties/003t-e.htm
Agreement for the Establishment of the Regional Commission for Fisheries, http://www.fao.org/fi/body/rfb/RECOFI/recofi_agreement_text.pdf
Al-Jufaili, S. Oman Marine Environment. 2001
Almotamar.net, 26 November 2006, “وزراء الثروة السمكية يُقرَون إنشاء مجلس عربي بصنعاء” (http://www.almotamar.net/news/37228.htm)
Al-Oufi, H., McLean, E. and Palfreman, A. Observations upon the Batinah Artisanal Fishery, the Sultanate of Oman. Marine Policy, Vol. 24, pp. 423-429. 2000
APFIC, Regional fishery bodies and arrangements in Asia and the Pacific, 2004 (http://library.enaca.org/NACA-Publications/RFBs_handbook_best.pdf)
Article 3 of the SPS Agreement. Text available at http://www.wto.org/English/tratop_e/sps_e/spsagr_e.htm
Chang, E.T. Market Study on the Export of Frozen Fish form the Sultanate of Oman. A report submitted to the Directorate General of Export Development, OCIPED. Sultanate of Oman. 2001
Connell, J. Control of Fish Quality. 4th Edition, Fishing News Books. 1995
Doha Ministerial Declaration available at: http://www.wto.org/english/thewto_e/minist_e/min01_e/mindecl_e.htm
ESCWA, Environmental Standards and Competitiveness of Key Economic Sectors, 2005 (E/ESCWA/SDPD/2005/4)
FAO, 2007. The State of World Fisheries and Aquaculture 2006. Available at http://www.fao.org/docrep/009/A0699e/A0699e00.htm
FAO, Fisheries and Aquaculture Department, Aquaculture production: quantities 1950-2005 dataset, 2007 (extracted using FishStat Plus, available at: http://www.fao.org/fi/statist/FISOFT/FISHPLUS.asp)
FAO, Fisheries and Aquaculture Department, Fisheries Commodities Production and Trade 1976-2005 dataset, 2007 (extracted using FishStat Plus, available at: http://www.fao.org/fi/statist/FISOFT/FISHPLUS.asp)
FAO, Fisheries and Aquaculture Department, Total Production 1950-2005 dataset, 2007 (extracted using FishStat Plus, available at: http://www.fao.org/fi/statist/FISOFT/FISHPLUS.asp)
FAO, Increasing the Contribution of Small-Scale Fisheries to Poverty Alleviation and Food Security, 2005 (ftp://ftp.fao.org/docrep/fao/008/a0237e/a0237e00.pdf)
FAO, Information on Fisheries Management in the Sultanate of Oman, 2001 (http://www.fao.org/fi/fcp/en/OMN/body.htm)
FAO, National Aquaculture Sector Overview – Yemen, available at http://www.fao.org/fi/website/FIRetrieveAction.do?dom=countrysector&xml=naso_yemen.xml
FAO, The fish trade of North African Mediterranean Countries: Intra-regional trade and import-export with the European Union, 2002 (ftp://ftp.fao.org/docrep/fao/005/y4326e/y4326e00.pdf)
Food Quality Control Center, 2002
http://circa.europa.eu/irc/sanco/vets/info/data/listes/list_all.html
http://ec.europa.eu/food/food/rapidalert/archive_2006_en.htm
http://ec.europa.eu/food/food/rapidalert/report2005_en.pdf
47
http://forum.europa.eu.int/irc/sanco/vets/info/data/listes/11ye.pdf
http://maps.google.com/
http://www.adenfreezone.com/default.aspx?p=statistics
http://www.caeu.net/default.asp?pageid=5&CurrentLanguage=EngLang&FedID=1
http://www.fishinfonet.com/
http://www.infosamak.org/
http://www.iotc.org/
http://www.mocioman.gov.om/arabic/standards/StandardsHome.html
http://www.moneoman.gov.om/dev_strategy2.asp
http://www.mpic-yemen.org/dsp/printed_version_of_the_vision2005.pdf
http://www.peie.om/
http://www.persga.org/about/history/history.asp
http://www.ropme.com/pages/objectives.htm
ICTSD, Fisheries, International Trade and Sustainable Development, October 2006.
Infosamak, “Yemen: YR 32.3bn allocated to fisheries sector”, http://www.infosamak.org/english/news.cfm?id=307
Marriott, N. Principles of Food Sanitation. 4th edition. Aspen, Maryland. 1999
Mclean, E. A National Center for Marine Biotechnology: A Proposal, Sultan Qaboos University, 2001
Mclean, E. and Al-Oufi, H. Fisheries Stock Assessment and Fisheries Management Plan Development for the Sultanate of Oman. A report submitted to the Economic Coordination Council, Sultanate of Oman. 2001
National Aquaculture Sector Overview, http://www.fao.org/figis/servlet/static?dom=countrysector&xml=naso_oman.xml
Oman Ministry of Agriculture and Fisheries online statistics available at: http://www.mafstat.gov.om/stats/TechSupport.asp
Oman Ministry of Agriculture and Fisheries, 2001
Oman Ministry of Agriculture and Fisheries, various annual statistics reports.
Oman Ministry of Development, 2001
Oman Ministry of Development, various annual statistics reports;
Oman Ministry of National Economy, Evaluation of the National Economy Performance in the Sixth Five- Year Development Plan (2001-2005), December 2006
Oman Ministry of National Economy, Statistical Yearbook 2004
Oman Ministry of National Economy, Statistical Yearbook 2006
Oman Ministry of National Economy, Monthly Statistical Bulletin, August 2007 (http://www.moneoman.gov.om/book/mb/August2007/T3.htm)
Omani Center for Investment Promotion and Export Development. Trade Secrets: the export answer book for small and medium-sized exporters in the Sultanate of Oman. 2001
Thomas F. and Iyer, T. Sea Food Quality Assurance. Fish Processing Technology. Indian Council of Agricultural Research. New Delhi, India. 2002
48
United Nations Commodity Trade Statistics Database, available online at http://comtrade.un.org/db/.
World Development Indicators, http://devdata.worldbank.org
Yemen Ministry of Water and Environment, 2005. The National Strategy for Environmental Sustainability 2005-2015
Yemen Ministry of Water and Environment, 2006, National Chemical Profile
Zaibet, L., “Competitiveness of Omani Fresh and frozen Fish Exports: Economic Analysis of Quality Control”, report prepared for the Fisheries Research Fund, 1999.
(A. Morfq, “Trade and Environment in the Fish Wealth Sector”, October 2006) عبد الرحمن مرفق، قطاع الثروة٢٠٠٦السمكية والتجارة والبيئة، أآتوبر
(Ministry of Fish Wealth, Fish Wealth: A Promising Gift, 2005) عطاء واعد؛ وزارة الثروة السمكية، مايو : الثروة السمكية٢٠٠٥
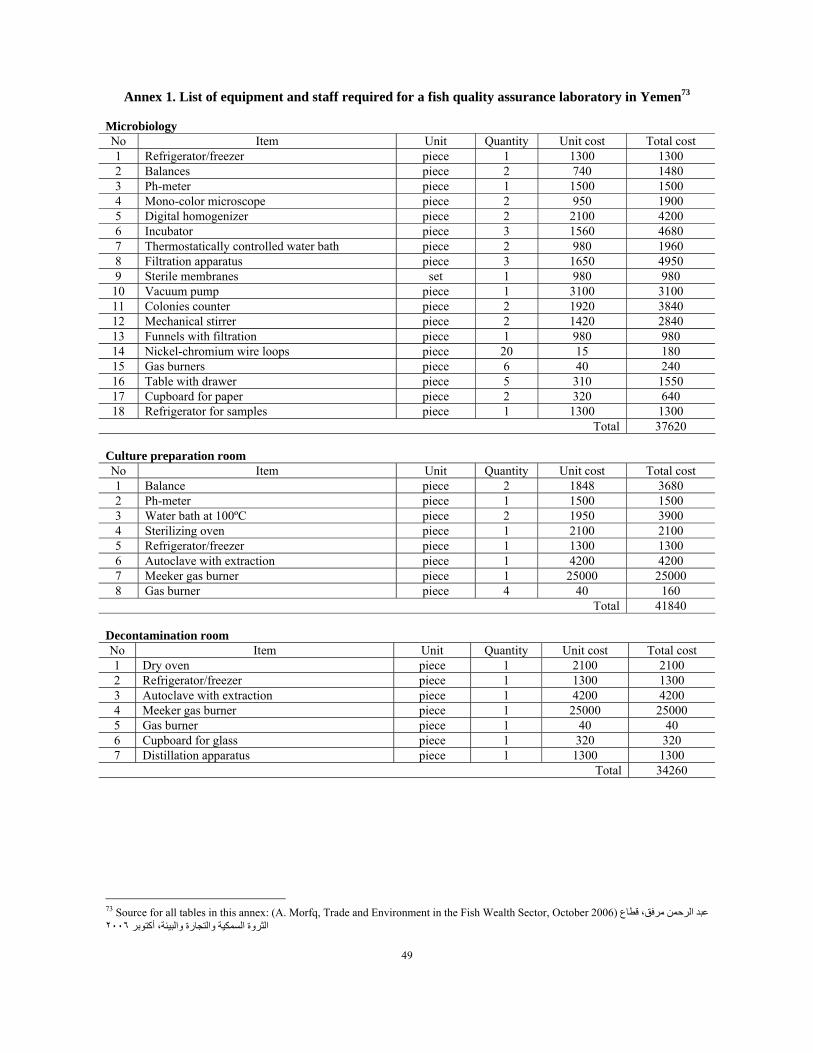
49
Annex 1. List of equipment and staff required for a fish quality assurance laboratory in Yemen73
Microbiology Total cost Unit cost Quantity Unit Item No
1300 1300 1 piece Refrigerator/freezer 1 1480 740 2 piece Balances 2 1500 1500 1 piece Ph-meter 3 1900 950 2 piece Mono-color microscope 4 4200 2100 2 piece Digital homogenizer 5 4680 1560 3 piece Incubator 6 1960 980 2 piece Thermostatically controlled water bath 7 4950 1650 3 piece Filtration apparatus 8 980 980 1 set Sterile membranes 9
3100 3100 1 piece Vacuum pump 10 3840 1920 2 piece Colonies counter 11 2840 1420 2 piece Mechanical stirrer 12 980 980 1 piece Funnels with filtration 13 180 15 20 piece Nickel-chromium wire loops 14 240 40 6 piece Gas burners 15
1550 310 5 piece Table with drawer 16 640 320 2 piece Cupboard for paper 17
1300 1300 1 piece Refrigerator for samples 18 37620 Total
Culture preparation room
Total cost Unit cost Quantity Unit Item No 3680 1848 2 piece Balance 1 1500 1500 1 piece Ph-meter 2 3900 1950 2 piece Water bath at 100ºC 3 2100 2100 1 piece Sterilizing oven 4 1300 1300 1 piece Refrigerator/freezer 5 4200 4200 1 piece Autoclave with extraction 6 25000 25000 1 piece Meeker gas burner 7
160 40 4 piece Gas burner 8 41840 Total
Decontamination room
Total cost Unit cost Quantity Unit Item No 2100 2100 1 piece Dry oven 1 1300 1300 1 piece Refrigerator/freezer 2 4200 4200 1 piece Autoclave with extraction 3
25000 25000 1 piece Meeker gas burner 4 40 40 1 piece Gas burner 5 320 320 1 piece Cupboard for glass 6 1300 1300 1 piece Distillation apparatus 7
34260 Total
73 Source for all tables in this annex: (A. Morfq, Trade and Environment in the Fish Wealth Sector, October 2006) عبد الرحمن مرفق، قطاع
٢٠٠٦الثروة السمكية والتجارة والبيئة، أآتوبر
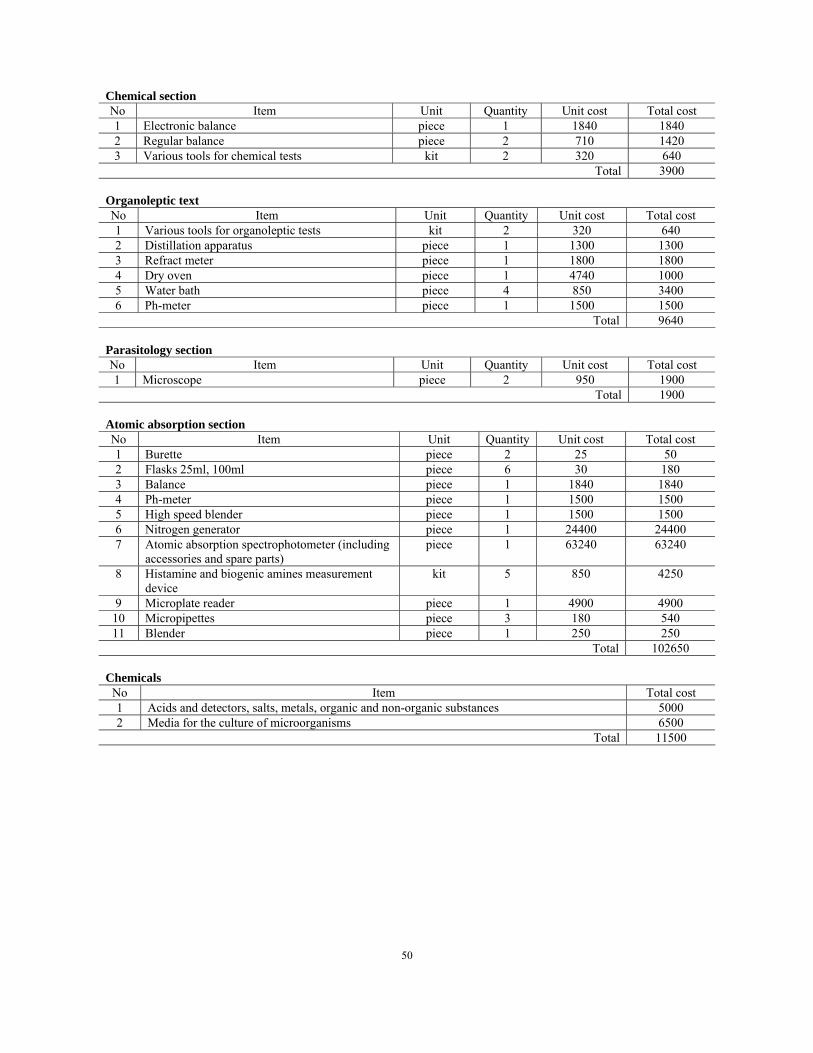
50
Chemical section Total cost Unit cost Quantity Unit Item No
1840 1840 1 piece Electronic balance 1 1420 710 2 piece Regular balance 2 640 320 2 kit Various tools for chemical tests 3 3900 Total
Organoleptic text
Total cost Unit cost Quantity Unit Item No 640 320 2 kit Various tools for organoleptic tests 1
1300 1300 1 piece Distillation apparatus 2 1800 1800 1 piece Refract meter 3 1000 4740 1 piece Dry oven 4 3400 850 4 piece Water bath 5 1500 1500 1 piece Ph-meter 6 9640 Total
Parasitology section
Total cost Unit cost Quantity Unit Item No 1900 950 2 piece Microscope 1 1900 Total
Atomic absorption section
Total cost Unit cost Quantity Unit Item No 50 25 2 piece Burette 1 180 30 6 piece Flasks 25ml, 100ml 2 1840 1840 1 piece Balance 3 1500 1500 1 piece Ph-meter 4 1500 1500 1 piece High speed blender 5
24400 24400 1 piece Nitrogen generator 6 63240 63240 1 piece Atomic absorption spectrophotometer (including
accessories and spare parts) 7
4250 850 5 kit Histamine and biogenic amines measurement device
8
4900 4900 1 piece Microplate reader 9 540 180 3 piece Micropipettes 10 250 250 1 piece Blender 11
102650 Total
Chemicals Total cost Item No
5000 Acids and detectors, salts, metals, organic and non-organic substances 1 6500 Media for the culture of microorganisms 2 11500 Total
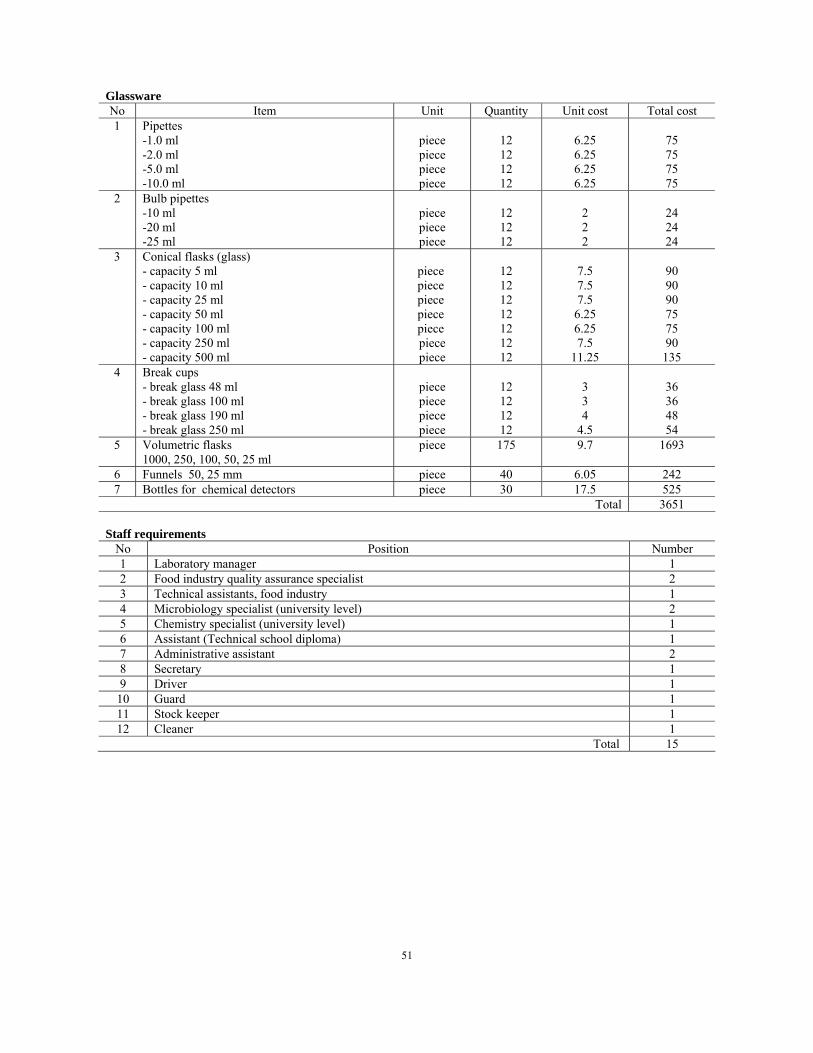
51
Glassware Total cost Unit cost Quantity Unit Item No
75 75 75 75
6.25 6.25 6.25 6.25
12 12 12 12
piece piece piece piece
Pipettes -1.0 ml -2.0 ml -5.0 ml -10.0 ml
1
24 24 24
2 2 2
12 12 12
piece piece piece
Bulb pipettes -10 ml -20 ml -25 ml
2
90 90 90 75 75 90 135
7.5 7.5 7.5 6.25 6.25 7.5
11.25
12 12 12 12 12 12 12
piece piece piece piece piece piece piece
Conical flasks (glass) - capacity 5 ml - capacity 10 ml - capacity 25 ml - capacity 50 ml - capacity 100 ml - capacity 250 ml - capacity 500 ml
3
36 36 48 54
3 3 4
4.5
12 12 12 12
piece piece piece piece
Break cups - break glass 48 ml - break glass 100 ml - break glass 190 ml - break glass 250 ml
4
1693 9.7 175 piece Volumetric flasks 1000, 250, 100, 50, 25 ml
5
242 6.05 40 piece Funnels 50, 25 mm 6 525 17.5 30 piece Bottles for chemical detectors 7 3651 Total
Staff requirements
No Position Number 1 Laboratory manager 1 2 Food industry quality assurance specialist 2 3 Technical assistants, food industry 1 4 Microbiology specialist (university level) 2 5 Chemistry specialist (university level) 1 6 Assistant (Technical school diploma) 1 7 Administrative assistant 2 8 Secretary 1 9 Driver 1
10 Guard 1 11 Stock keeper 1 12 Cleaner 1
Total 15
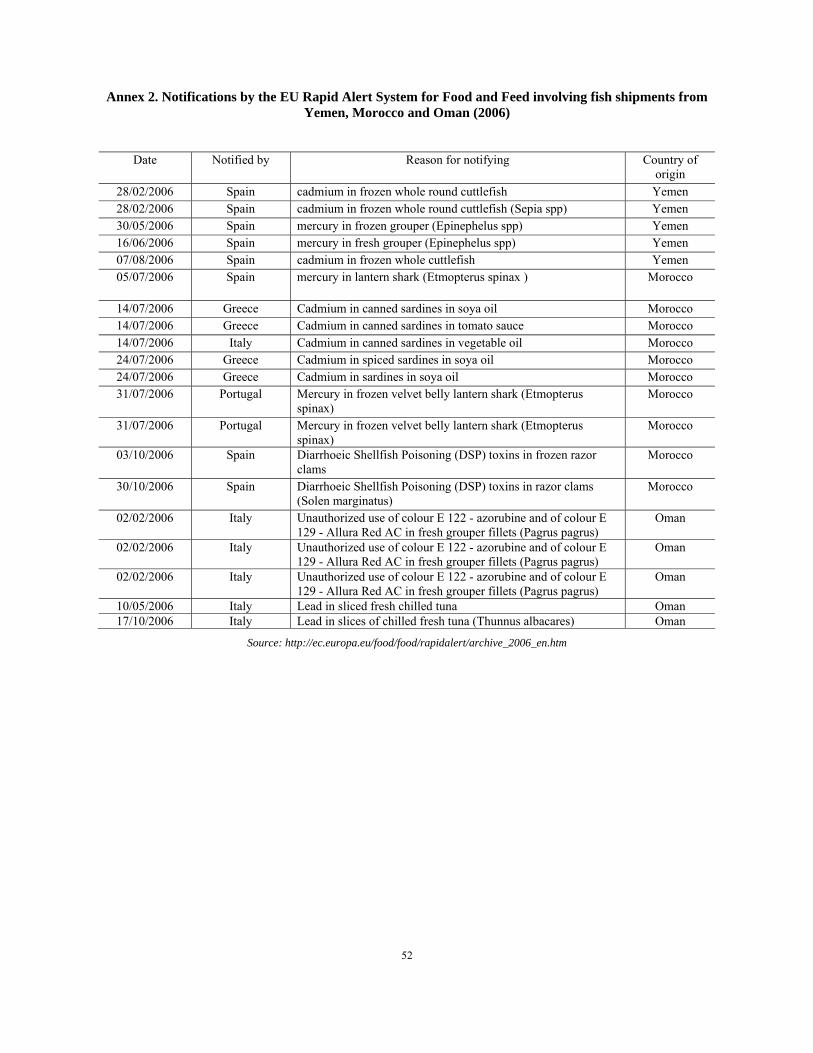
52
Annex 2. Notifications by the EU Rapid Alert System for Food and Feed involving fish shipments from Yemen, Morocco and Oman (2006)
Date Notified by Reason for notifying Country of origin
28/02/2006 Spain cadmium in frozen whole round cuttlefish Yemen 28/02/2006 Spain cadmium in frozen whole round cuttlefish (Sepia spp) Yemen 30/05/2006 Spain mercury in frozen grouper (Epinephelus spp) Yemen 16/06/2006 Spain mercury in fresh grouper (Epinephelus spp) Yemen 07/08/2006 Spain cadmium in frozen whole cuttlefish Yemen 05/07/2006 Spain mercury in lantern shark (Etmopterus spinax ) Morocco
14/07/2006 Greece Cadmium in canned sardines in soya oil Morocco 14/07/2006 Greece Cadmium in canned sardines in tomato sauce Morocco 14/07/2006 Italy Cadmium in canned sardines in vegetable oil Morocco 24/07/2006 Greece Cadmium in spiced sardines in soya oil Morocco 24/07/2006 Greece Cadmium in sardines in soya oil Morocco 31/07/2006 Portugal Mercury in frozen velvet belly lantern shark (Etmopterus
spinax) Morocco
31/07/2006 Portugal Mercury in frozen velvet belly lantern shark (Etmopterus spinax)
Morocco
03/10/2006 Spain Diarrhoeic Shellfish Poisoning (DSP) toxins in frozen razor clams
Morocco
30/10/2006 Spain Diarrhoeic Shellfish Poisoning (DSP) toxins in razor clams (Solen marginatus)
Morocco
02/02/2006 Italy Unauthorized use of colour E 122 - azorubine and of colour E 129 - Allura Red AC in fresh grouper fillets (Pagrus pagrus)
Oman
02/02/2006 Italy Unauthorized use of colour E 122 - azorubine and of colour E 129 - Allura Red AC in fresh grouper fillets (Pagrus pagrus)
Oman
02/02/2006 Italy Unauthorized use of colour E 122 - azorubine and of colour E 129 - Allura Red AC in fresh grouper fillets (Pagrus pagrus)
Oman
10/05/2006 Italy Lead in sliced fresh chilled tuna Oman 17/10/2006 Italy Lead in slices of chilled fresh tuna (Thunnus albacares) Oman
Source: http://ec.europa.eu/food/food/rapidalert/archive_2006_en.htm
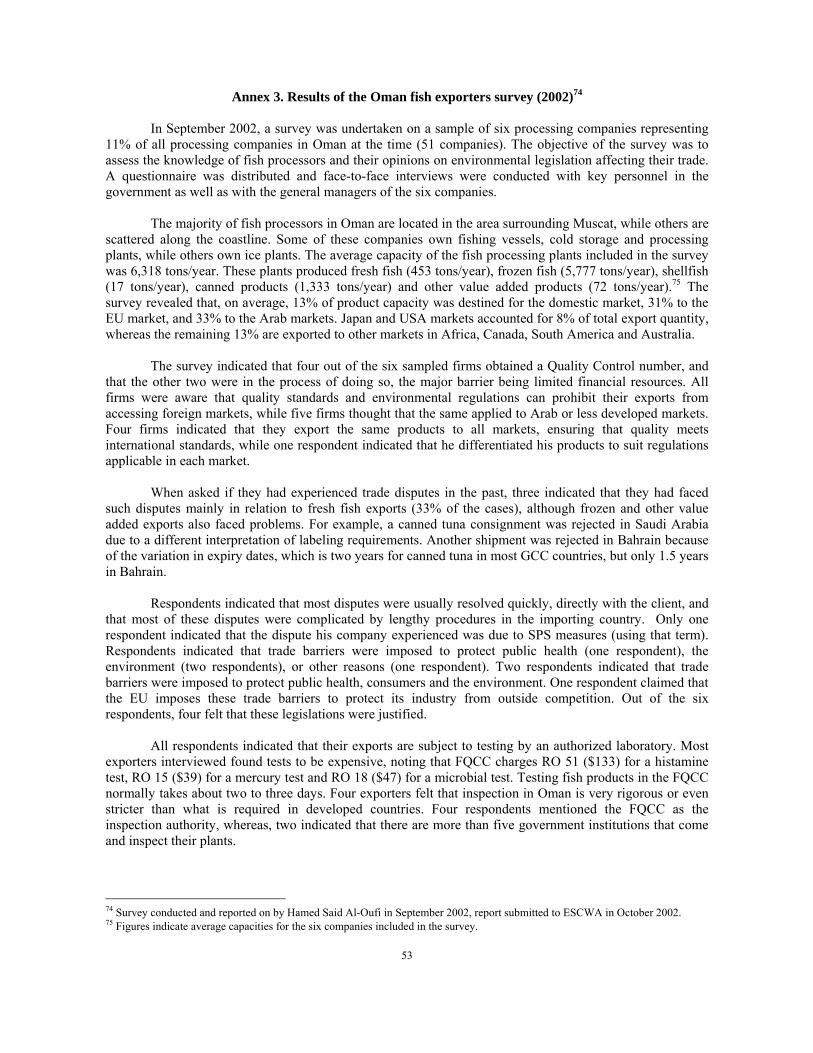
53
Annex 3. Results of the Oman fish exporters survey (2002)74 In September 2002, a survey was undertaken on a sample of six processing companies representing
11% of all processing companies in Oman at the time (51 companies). The objective of the survey was to assess the knowledge of fish processors and their opinions on environmental legislation affecting their trade. A questionnaire was distributed and face-to-face interviews were conducted with key personnel in the government as well as with the general managers of the six companies.
The majority of fish processors in Oman are located in the area surrounding Muscat, while others are
scattered along the coastline. Some of these companies own fishing vessels, cold storage and processing plants, while others own ice plants. The average capacity of the fish processing plants included in the survey was 6,318 tons/year. These plants produced fresh fish (453 tons/year), frozen fish (5,777 tons/year), shellfish (17 tons/year), canned products (1,333 tons/year) and other value added products (72 tons/year).75 The survey revealed that, on average, 13% of product capacity was destined for the domestic market, 31% to the EU market, and 33% to the Arab markets. Japan and USA markets accounted for 8% of total export quantity, whereas the remaining 13% are exported to other markets in Africa, Canada, South America and Australia.
The survey indicated that four out of the six sampled firms obtained a Quality Control number, and
that the other two were in the process of doing so, the major barrier being limited financial resources. All firms were aware that quality standards and environmental regulations can prohibit their exports from accessing foreign markets, while five firms thought that the same applied to Arab or less developed markets. Four firms indicated that they export the same products to all markets, ensuring that quality meets international standards, while one respondent indicated that he differentiated his products to suit regulations applicable in each market.
When asked if they had experienced trade disputes in the past, three indicated that they had faced
such disputes mainly in relation to fresh fish exports (33% of the cases), although frozen and other value added exports also faced problems. For example, a canned tuna consignment was rejected in Saudi Arabia due to a different interpretation of labeling requirements. Another shipment was rejected in Bahrain because of the variation in expiry dates, which is two years for canned tuna in most GCC countries, but only 1.5 years in Bahrain.
Respondents indicated that most disputes were usually resolved quickly, directly with the client, and
that most of these disputes were complicated by lengthy procedures in the importing country. Only one respondent indicated that the dispute his company experienced was due to SPS measures (using that term). Respondents indicated that trade barriers were imposed to protect public health (one respondent), the environment (two respondents), or other reasons (one respondent). Two respondents indicated that trade barriers were imposed to protect public health, consumers and the environment. One respondent claimed that the EU imposes these trade barriers to protect its industry from outside competition. Out of the six respondents, four felt that these legislations were justified.
All respondents indicated that their exports are subject to testing by an authorized laboratory. Most
exporters interviewed found tests to be expensive, noting that FQCC charges RO 51 ($133) for a histamine test, RO 15 ($39) for a mercury test and RO 18 ($47) for a microbial test. Testing fish products in the FQCC normally takes about two to three days. Four exporters felt that inspection in Oman is very rigorous or even stricter than what is required in developed countries. Four respondents mentioned the FQCC as the inspection authority, whereas, two indicated that there are more than five government institutions that come and inspect their plants.
74 Survey conducted and reported on by Hamed Said Al-Oufi in September 2002, report submitted to ESCWA in October 2002. 75 Figures indicate average capacities for the six companies included in the survey.
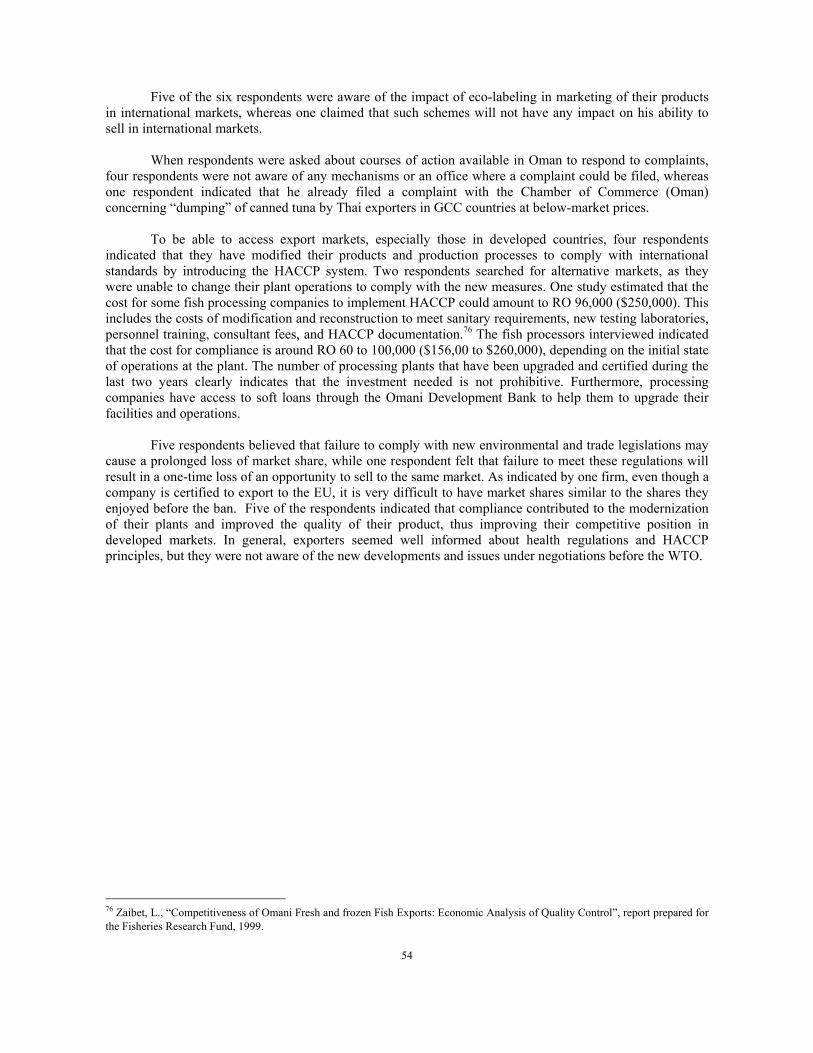
54
Five of the six respondents were aware of the impact of eco-labeling in marketing of their products in international markets, whereas one claimed that such schemes will not have any impact on his ability to sell in international markets.
When respondents were asked about courses of action available in Oman to respond to complaints,
four respondents were not aware of any mechanisms or an office where a complaint could be filed, whereas one respondent indicated that he already filed a complaint with the Chamber of Commerce (Oman) concerning “dumping” of canned tuna by Thai exporters in GCC countries at below-market prices.
To be able to access export markets, especially those in developed countries, four respondents
indicated that they have modified their products and production processes to comply with international standards by introducing the HACCP system. Two respondents searched for alternative markets, as they were unable to change their plant operations to comply with the new measures. One study estimated that the cost for some fish processing companies to implement HACCP could amount to RO 96,000 ($250,000). This includes the costs of modification and reconstruction to meet sanitary requirements, new testing laboratories, personnel training, consultant fees, and HACCP documentation.76 The fish processors interviewed indicated that the cost for compliance is around RO 60 to 100,000 ($156,00 to $260,000), depending on the initial state of operations at the plant. The number of processing plants that have been upgraded and certified during the last two years clearly indicates that the investment needed is not prohibitive. Furthermore, processing companies have access to soft loans through the Omani Development Bank to help them to upgrade their facilities and operations.
Five respondents believed that failure to comply with new environmental and trade legislations may
cause a prolonged loss of market share, while one respondent felt that failure to meet these regulations will result in a one-time loss of an opportunity to sell to the same market. As indicated by one firm, even though a company is certified to export to the EU, it is very difficult to have market shares similar to the shares they enjoyed before the ban. Five of the respondents indicated that compliance contributed to the modernization of their plants and improved the quality of their product, thus improving their competitive position in developed markets. In general, exporters seemed well informed about health regulations and HACCP principles, but they were not aware of the new developments and issues under negotiations before the WTO.
76 Zaibet, L., “Competitiveness of Omani Fresh and frozen Fish Exports: Economic Analysis of Quality Control”, report prepared for the Fisheries Research Fund, 1999.