Embed Size (px)
Citation preview
DEVELOPING COUNTRIES ININTERNATIONAL TRADE2007TRADE AND DEVELOPMENT INDEX
Developing C
ountries in International Trade 2007 - Trade and D
evelopment Index
EMBARGO
The contents of this report must
not be quoted or summarized
in the print, broadcast, or
electronic media, before
6 November 2007 17:00 hours GMT
Printed at United Nations, Geneva–GE.07-51939–October 2007–UNCTAD/DITC/TAB/2007/2–ISSN 1817-1214
Developing Countries in International Trade 2007Trade and Development Index
The Trade and Development Index (TDI) is a new policy assessment and policymaking tool produced by UNCTAD for member States, particularly for developing countries. TDI provides an analytical framework for enhancing the enabling environment for economic and social development, and promoting a mutually beneficial interplay between trade and development in the context of globalization.
As requested by member States, DCIT-TDI 2007 substantially refines and improves the conceptual framework by the additional composing indicators on the interplay between trade and development, as well as expanded country coverage. Currently, 123 UNCTAD member States are covered by TDI and its framework.
The TDI thus presents both a quantitative indication and an analytical framework to identify how well trade and development are integrated in an individual country, based not only on its trade and development performance, but also on key factors affecting this joint performance. These include human capital, physical infrastructure, domestic and international financial resources, institutional quality, macroeconomic stability, environmental sustainability, openness to trade and access to foreign markets.
TDI national scores are a composite quantitative indication describing the degree of integration between trade and development performance.
Comments on the Trade and Development Index
“The Trade and Development Index (TDI) is an outcome of the Secretariat’s analysis to identify the complex interdependence of current economic conditions in both developing and developed nations... The Index offers a comprehensive review of the global trade and development performance of different countries, and identifies the strengths and weaknesses of their institutional and policy environment... This framework will contribute to understanding why certain countries have made progress towards achieving the United Nations Millennium Development Goals (MDGs), while others have not. The analytical framework will also allow the UNCTAD secretariat to enhance the overall coherence of its work, ranging from technical assistance to promoting Aid for Trade.”
Supachai Panitchpakdi, Secretary-General of UNCTAD
“The Trade and Development Index (TDI) has been taken forward in 2007 beyond its inaugural presentation in 2005, and UNCTAD has laid a solid framework in establishing new standards for examining progress in world economic and social development... It also takes up the very important concept of sustainability... The TDI framework indicates that in this era of globalization, one must look at financial interrelationships among nations. Trade flows alone cannot provide an understanding of international economic issues... Methodology, scope, and provision of practical information are all present in improved form in the 2007 edition of this publication.”
Lawrence R. Klein, Nobel Laureate in Economic Sciences

UNITED NATIONS CONFERENCE ON TRADE AND DEVELOPMENT
DEVELOPING COUNTRIES IN INTERNATIONAL TRADE
TRADE AND DEVELOPMENT INDEX
2007
UNITED NATIONSNew York and Geneva, 2007

ii
DE
VE
LO
PIN
G C
OU
NT
RIE
S I
N I
NT
ER
NA
TIO
NA
L T
RA
DE
20
07
Tr
ad
e a
nd
dev
elo
pm
en
t i
nd
ex
NOTE
The views expressed in this report are those of the authors and do not necessarily reflect the
views of the United Nations Secretariat. The designations employed and the presentation
of the material in this publication do not imply the expression of any opinion whatsoever
on the part of the United Nations Secretariat concerning the legal status of any country,
territory, city or area, or of its authorities, or concerning the delimitation of its frontiers or
boundaries.
Symbols of United Nationsdocuments are composed of capital le ers with fi gures. Mention
of such a symbol indicates a reference to a United Nations document.
Material in this publicationmay be freely quoted or reprinted, but full acknowledgement is
requested. A copy of the publication containing the quotation or reprint should be sent to
the UNCTAD secretariat at: Palais des Nations, CH-1211 Geneva 10, Switzerland.
© Copyright United Nations 2007
All rights reserved
UNCTAD/DITC/TAB/2007/2
UNITED NATIONS PUBLICATION
ISSN 1817-1214

iii
DE
VE
LO
PIN
G C
OU
NT
RIE
S IN
INT
ER
NA
TIO
NA
L T
RA
DE
20
07
Tr
ad
e a
nd
dev
elo
pm
en
t in
dex
PREFACEby Dr. Supachai Panitchpakdi, Secretary-General, UNCTAD
Supachai Panitchpakdi
The link between trade and development, and the kind of policies required to strengthen the
contribution of one to the other, have been the subject of much academic discussion. For UNCTAD,
as the United Nations focal point for the integrated treatment of trade and development, this issue
has been at the centre of its work for more than 40 years.
In this Trade and Development Index (TDI), UNCTAD presents some of its research on the
link between trade and development in a new, integrated fashion. The TDI is an outcome of the
secretariat’s analysis to identify the complex interdependence of current economic conditions in both
developing and developed nations.
The index o ers a comprehensive review of the global trade and development performance
of di erent countries, and identifies the strengths and weaknesses of their institutional and policy
environment. It showcases not only the tremendous progress that many developing countries have
achieved in recent years, but also raises several pertinent issues which will require further a ention
in formulating trade and development policies.
The TDI also aims to provide policymakers and researchers with a new tool for policy
analysis and formulation, by presenting an analytical framework to understand how to enhance the
enabling environment for trade and development. We believe that this framework will contribute
to understanding why certain countries have made progress towards achieving the United Nations
Millennium Development Goals (MDGs), while others have not. The analytical framework will also
allow the UNCTAD Secretariat to enhance the overall coherence of its work, ranging from technical
assistance to promoting Aid for Trade.
Inorder to guide and support our future workon the TDI and related issues, I have constituted
an Advisory Board, which will be chaired by Nobel Laureate Professor Lawrence R. Klein. The Board
consists of international scholars drawn from academia, international organizations, think tanks and
the private sector. I am confident that the pragmatic framework of the TDI and the work of the
Advisory Board will help UNCTAD further strengthen its capacity to assist countries in formulating
sound trade and development policies.


v
DE
VE
LO
PIN
G C
OU
NT
RIE
S IN
INT
ER
NA
TIO
NA
L T
RA
DE
20
07
Tr
ad
e a
nd
dev
elo
pm
en
t in
dex
FOREWORDby Professor Lawrence R. Klein, Nobel Laureate in Economic Sciences
The Trade and Development Index (TDI) has been taken forward in 2007 beyond its inaugural
presentation in 2005, and UNCTAD has laid a solid framework in establishing new standards for
examining progress in world economic and social development. The second release of TDI measures
has expanded country coverage and broadened the scope of quantitative analysis.
The main index, showing development dynamics across countries, has been enlarged and
covers new time periods. It also takes up the very important concept of sustainability. In the analysis
of key international totals, such as total national income or total production among countries, new
a ention is paid to income distribution within countries. This is of extreme importance among – as
well as within – countries, as it sheds light on the existence of poverty in all too many countries. This
is a necessary first step for programmes to reduce poverty.
The principal tool of statistical analysis used remains the method of principal components to
deal with latent variables, which are defined in amodern dictionary as something that is “present but
not visible or apparent”. The use of the method of principal components in quantitative economic
analysis was introduced by Richard Stone in 1947, but he fruitfully explored national results in
terms of specifi c economic magnitudes across time periods for the United States. This approach can
readily be used for the countries being studied in the TDI. This extends the statistical analysis to the
sustainability, of specifi c growth rates, a feature that all countries want to know, concerning their
economic progress in development.
The TDI framework indicates that in this era of globalization, one must look at financial
interrelationships among nations. Tradeflows alone cannot provide an understanding of international
economic issues. Trade in goods must be extended to goods and services. The la er concept needs
further extension to current account balances for the increasing degree of globalized connections
among countries to be appreciated. This can be seen in the recent problems of a bank in the United
Kingdom being caused by a financial disturbance in the United States mortgage market. For be er
understanding of financial linkages and their e ect on international economic stability, onemust look
beyond merchandise trade flows among nations.
Methodology, scope, and provision of practical information are all present in improved form
in the 2007 edition of this publication. It can be expected that many more such estimates of specifi c
concepts or magnitudes will be in future publications.
Lawrence R. Klein


vii
DE
VE
LO
PIN
G C
OU
NT
RIE
S IN
INT
ER
NA
TIO
NA
L T
RA
DE
20
07
Tr
ad
e a
nd
dev
elo
pm
en
tin
dex
ADVISORY BOARD
Board Convener and Coordinator
Supachai PanitchpakdiSecretary-General of UNCTAD
Chairperson
Lawrence R. KleinBenjamin Franklin Professor of Economics, Emeritus, University of Pennsylvania,
Philadelphia and Nobel Laureate in Economic Sciences, United States of America.
Members
Meghnad Desai, Professor of Economics, Emeritus, London School of Economics and Political
Science, London, United Kingdom
Jung Taik Hyun, President, Korean Development Institute (KDI), Seoul, Republic of Korea
Lawrence J Lau, President and Ralph and Claire Landau Professor of Economics, the Chinese
University of Hong Kong, and Kwoh-Ting Li Professor in Economic Development, Emeritus,
Stanford University, United States of America .
Warwick J. McKibbin, Professor and Executive Director of the Centre for Applied Macroeconomic
Analysis, Australian National University, Canberra, Australia.
Vladimir Mau, Rector of the Academy of the National Economy under the Government of the
Russian Federation, Member of the Scientifi c Commi ee, Moscow, Russian Federation
Anirudh Lal Nagar, Honorary Fellow, National Institute of Public Finance and Policy, and Visiting
Professor of Econometrics, Jawaharlal Nehru University, New Delhi, India
Jim O'Neill, Managing Director and Head of Global Economic Research, Goldman Sachs, London,
United Kingdom
Peter Pauly, Professor of Economics and Vice-Dean, University of Toronto, and Director, the United
Nations Project LINK, Toronto, Canada
Eustaquio Reis, Economist, Institute of Applied Economic Research, Rio de Janeiro, Brazil
Dominique Salvatore, Distinguished Professor of Economics, Department of Economics, Fordham
University, New York, United States of America
Charlo e du Toit, Professor of Economics, University of Pretoria, and Special advisor to the Minister
of Social Development of the South African Government, South Africa.
Craig VanGrasstek, Executive Director of the Program on Trade and Negotiations at the John F.
Kennedy School of Government, Harvard University, Cambridge, United States of America
Board’s Secretariat
Lakshmi Puri, Acting Deputy Secretary-General of UNCTAD, and Director, Divisionon International
Trade in Goods and Services, and Commodities.

viii
DE
VE
LO
PIN
G C
OU
NT
RIE
S I
N I
NT
ER
NA
TIO
NA
L T
RA
DE
20
07
Tr
ad
e a
nd
dev
elo
pm
en
t i
nd
ex
ACKNOWLEDGEMENTS
Developing Countries in International Trade 2007: Trade and Development Index wasprepared
by sta of the Trade Analysis Branch (TAB) under the general direction of Lakshmi Puri, Acting
Deputy Secretary-General of UNCTAD and Director of the Division on International Trade in Goods
and Services, and Commodities. Khalil Rahman led the team until his reassignment to the Executive
O ce of the Secretary-General of the United Nations in New York in April 2007. A erwards, Victor
Ognivtsev assumed these functions. Sudip Ranjan Basu and Marco Fugazza were the lead authors.
Substantive and technical support wasprovided by Aki Kuwahara, Miho Shirotori, Mark Bloch, Denise
Penello Rial, Wojciech Stawowy, Samuel Munyaneza, Richard Chalverat, Fabien Dumesnil and Minako
Morita. Some helpful comments were also received from other sta members of UNCTAD.
The team thankfully acknowledges the valuable guidance and suggestions by Professor
Lawrence R. Klein. Special thanks go to Andrew Cornford, whomade valuable comments on the dra .
Remarks received from Professor A.L. Nagar are also acknowledged. The team expresses appreciation
to Pranab Bardhan, John Cuddy, Meghnad Desai, M. Muqtada, Jim O’Neill and Craig VanGrasstek.
The report benefited from comments and observations by participants of the high-level event
“Climbing the trade and development ladder: Trade and Development Index” at the tenth session of
the UNCTAD Commission on Trade in Goods and Services, and Commodities, as well as representa-
tives of UNCTAD member States.
Consultations were also carried out with sta members of other international organizations,
including the United Nations Department of Economic and Social A airs, the United Nations
Economic and Social Commission for Asia and the Pacifi c, the International Labour Organization,
the International Monetary Fund, the World Bank and the World Trade Organization; and academic
institutions, including the University of Pennsylvania, the London School of Economics and Graduate
Institute of International Studies and the University of Geneva. Comments were also received from a
number of other entities such as Global Economic Research of Goldman Sachs, as well as some non-
governmental organizations and research institutions.
Desktop publishing was done by Jenifer Tacardon-Mercado. Diego Oyarzun-Reyes designed
the cover, the last one before his retirement. Paul Stephenson and Michael Gibson edited the report.
Brigi e Ruby and Jean-Marc Humblot were responsible for processing the report, while Marisa
Henderson, Susan Graham and Josie Maximo provided overall logistical, administrative and Web-
related support.

ix
DE
VE
LO
PIN
G C
OU
NT
RIE
S IN
INT
ER
NA
TIO
NA
L T
RA
DE
20
07
Tr
ad
e a
nd
dev
elo
pm
en
t in
dex
CONTENTS
PREFACE ....................................................................................................... iiiFOREWORD .........................................................................................................vADVISORY BOARD ...................................................................................................... viiACKNOWLEDGEMENTS .....................................................................................................viiiABBREVIATIONS ........................................................................................................xi
PART I.TRADE AND DEVELOPMENT INDEX 2006
1. Introduction .........................................................................................................1
2. TDI and benchmarks: concepts, methodology
and computation .......................................................................................................4
2.1 The conceptual approach to TDI 2006 ....................................................4
2.2 Selection of indicators ...............................................................................5
2.2.1 Components of the structural and
institutional context dimension .................................................5
2.2.2 Components of the trade policies and processes
dimension ......................................................................................8
2.2.3 Components of trade and development
performance .................................................................................9
3. TDI 2006 results.......................................................................................................10
3.1 TDI 2006 scores and global rankings ....................................................10
3.2 TDI scores and rankings: regional pa erns .........................................10
3.3 Major emerging economies: TDI scores and rankings .......................14
3.4 Benchmarking: TDI, InputMI and OutcomeMI scores .......................17
3.5 Climbing the TDI ladder: a comparison of results in
2005 and 2006 ............................................................................................20
3.6 TDI components and variability ............................................................27
REFERENCES ...................................................................................................................................29
APPENDICES 1. List of countries in the TDI 2006 sample .............................................................33
2. Computational approach .......................................................................................37
3. Components and indicators: definition and sources .........................................41
4. Trade and Development Index: global rankings ................................................47
5. TDI, dimensions and input and outcome measures ..........................................51
PART II.COUNTRY PROFILES .................................................................................................................57

x
DE
VE
LO
PIN
G C
OU
NT
RIE
S I
N I
NT
ER
NA
TIO
NA
L T
RA
DE
20
07
Tr
ad
e a
nd
dev
elo
pm
en
t i
nd
ex
List of Figures
1. Conceptual framework of TDI .............................................................................................4
2. Regional pa ern in TDI 2006, InputMI 2006 and OutcomeMI 2006 scores .................12
3. Regional pa ern in TDI 2006 components .......................................................................13
4. TDI scores in E7 and other regions ....................................................................................14
5. TDI scores in emerging economies ....................................................................................15
6. Emerging economies pa ern in TDI 2006 components ..................................................16
7. Benchmarking TDI .............................................................................................................18
8. Benchmarking TDI components across country groups ................................................19
9. TDI scores in 2005 and 2006 ................................................................................................20
10. InputMI score in 2005 and 2006 .........................................................................................21
11. OutcomeMI score in 2005 and 2006 ...................................................................................21
12. Climbing the TDI ladder: pa ern in developed countries .............................................22
13. Climbing the TDI ladder: pa ern in developing countries ............................................23
14. Climbing the TDI ladder: pa ern in LDCs .......................................................................23
15. Climbing the TDI ladder: pa ern in energy exporting developing
and transition economies .......................................................................................24
16. Climbing the TDI ladder: pa ern in commodity-dependent countries .......................25
17. Climbing the TDI ladder: pa ern in E7 countries ...........................................................26
18. Climbing the TDI ladder: pa ern in countries with economies in transition .............26
19. OutcomeMI scores and input component variability in 2006 ........................................27
A1. Weights for InputMI and OutcomeMI ..............................................................................39
List of Tables
1. Trade and Development Index 2006: global rankings ....................................................11

xi
DE
VE
LO
PIN
G C
OU
NT
RIE
S IN
INT
ER
NA
TIO
NA
L T
RA
DE
20
07
Tr
ad
e a
nd
dev
elo
pm
en
t in
dex
ABBREVIATIONS
DCIT Developing Countries in International Trade
E7 seven emerging economies
EU European Union
EU15 EU Member States before 2004
EU10 EU Member States that acceded in 2004
EVI economic vulnerability index
GDP gross domestic product
GNI gross national income
GNTB Group of Eminent Persons on Non-tari Barriers
ICT information and communication technology
InputMI Input Measure Index
LDC least developed country
MID middle-income developing country
NTBs non-tari barriers
OutcomeMI Outcome Measure Index
PCA principal component analysis
PPP purchasing power parity
SIC structural and institutional context
TDI Trade and Development Index
TDP trade and development performance
TPP trade policies and processes
TRAINS Trade Analyses and Information System
UNDP United Nations Development Programme


TRADE AND DEVELOPMENT INDEX 2006
Part
I


Trade and Development Index
DE
VE
LO
PIN
G C
OU
NT
RIE
S IN
INT
ER
NA
TIO
NA
L T
RA
DE
20
07
Tr
ad
e a
nd
dev
elo
pm
en
t in
dex
1
TD
I
1
1. INTRODUCTION
The Trade and Development Index (TDI) was introduced in Developing Coun-tries in International Trade 2005: Trade and Development Index (DCIT-TDI 2005). It
is a useful policy assessment and policymaking tool for developing countries
as it provides a framework for enhancing the enabling environment for economic and
social development, and promoting a mutually benefi cial interplay between trade and
development in the context of globalization. Analysis through the TDI framework brings
country-specifi c constraints to the forefront by simultaneously identifying structural,
institutional, financial, trade and development policies that allow developing countries
tomaximize benefits andminimize costs from trade liberalization and globalization. The
analysis helps address the challenges and opportunities of trade-driven globalization.
(See UNCTAD XII theme and sub-themes.)1
The TDI provides both a quantitative indication and an analytical framework to
identify how well trade and development are integrated in an individual country, based
not only on its trade and development performance, but also on key factors a ecting this
joint performance. The TDI also o ers an innovative tool for comparative studies among
countries and regions of their trade and development performance. Therefore, TDI na-
tional scores are a composite quantitative indication describing the degree of integration
between trade and development performance. Since the introduction of the TDI as a work
in progress in DCIT-TDI 2005, there has been considerable feedback frommember States,
other international organizations and the academic community.2 In the light of the com-
ments received, a empts have been made to refine the conceptual framework and the
TDI through the addition of further factors, as well as expanded country coverage.
TDI 2005 was designed to measure the key forces underlying the complex process
of trade and development. Although the role of structures, institutions and policies as
preconditions to improving trade performance and achieving a higher level of develop-
ment was highlighted, no a priori judgment as to their relative importance was made
in computing the TDI. The TDI is intended to serve as an innovative diagnostic tool to
capture the overall interactions and interdependence among various factors in the trade
and development process. As a result of new research by the UNCTAD secretariat and in
response to comments on TDI 2005, it is used to distinguish between input-basedmeasures
(such as human capital, physical infrastructure, macroeconomic stability, openness to
trade and access to foreignmarket) on the one hand, and outcome-basedmeasures (such
as trade performance and economic and social well-being) on the other in TDI 2006.
The aimof thismore refined approach is to understandmore clearly how the input
measures (conditioning factors) interact with outcomemeasures (performance indicators).
It is important to stress that there is no straightforward way to identify this interaction.
Analysis of the TDI is intended to identify pa erns at the levels of countries and country
groupings. It is hoped that this will indicate missing links between conditioning factors
and performance indicators. Two indices, the Input Measure Index (InputMI) and the
Outcome Measure Index (OutcomeMI), arefirstmeasured separately and then aggregated
to construct the overall TDI.
1 UNCTAD XII will be held in Ghana in 2008. The theme of the conference, which was adopted at the forty-
first executive session of the Trade and Development Board in April 2007, is “Addressing the opportunities
and challenges of globalization for development”. The four sub-themes are: “(a) Enhancing coherence at
all levels for sustainable economic development and poverty reduction in global policymaking, including
the contribution of regional approaches; (b) Key trade and development issues and the new realities in
the geography of the world economy; (c) Enhancing the enabling environment at all levels to strengthen
productive capacity, trade and investment:mobilizing resources and harnessing knowledge for development;
(d) Strengthening UNCTAD: enhancing its development role, impact and institutional e ectiveness.”
2 See UNCTAD (2006a) chairperson’s summary of the high-level event to discuss “Climbing the trade and
development ladder: Trade and Development Index”. See also, for example, Benefits to trade require broad
reform, UNCTAD’s new Trade and Development Index. Oxford Analytica, 14 November 2005.

2
DE
VE
LO
PIN
G C
OU
NT
RIE
S I
N I
NT
ER
NA
TIO
NA
L T
RA
DE
20
07
Tr
ad
e a
nd
dev
elo
pm
en
t i
nd
ex
TD
I
2
As in the 2005 publication, the TDI incorporates three dimensions: (a) structural
and institutional context (SIC); (b) trade policies and processes (TPP); and (c) trade and
development performance (TDP). The last is a renamed and expanded replacement of
level of development (LD) dimension of DCIT-TDI 2005 that explicitly includes trade
performance indicators. In DCIT-TDI 2007, the first two dimensions (SIC and TPP) fall
within the InputMI, and third (TDP) falls within the OutcomeMI.
The TDI 2006 also includes three additional components, namely domestic finance
resources, international finance resources and macroeconomic stability. For the TDP
dimension, we have introduced a new component, trade performance, which includes
the share of merchandise exports as percentage of the world total, a share of service
exports as a percentage of the world total, a merchandise export concentration index,
and a trade-to-gross domestic product (GDP) ratio. In TDI 2005, the merchandise export
concentration index was part of the e ective market access component of trade policies
and processes dimension. Furthermore, we have modified the economic development
component by including the Sen Welfare Index (1976),3 which incorporates the income/
consumption distribution aspect in the estimation of GDP. Moreover, in TDI 2006, we
put together economic development, social development and gender development in a
new component called economic and social well-being.
The following new indicators are also included in TDI 2006: (a) gross domestic
savings (domestic finance component); (b) total external debt service and short-term
debt (international financial resources component); (c) regulatory quality and control
of corruption (institutional quality component, which replaces the bureaucratic quality
index and corruption index of TDI 2005 in DCIT-TDI 2005); (d) the inflation and current
account balance (macroeconomic stability component); and (e) female-to-male income
share and female labour force participation in total labour force (which replaces the
gender development index of TDI 2005). The gross enrolment ratio has been dropped
from social development, which now includes only the adult literacy ratio as an educa-
tion indicator.
TDI 2006 covers 123 countries, an increase from 110 in DCIT-TDI 2005. Eighty-two of
these countries are developing countries, including 26 least developed countries (LDCs).4
Also included are 10 countries from South-Eastern Europe and the Commonwealth of
Independent States. Scores are also computed for a number of country groups, namely:
(a) developing countries; (b) developed countries, including “European Union (EU15)”
countries (Member States of the EU before 2004) and six Organization for Economic
Cooperation and Development (OECD) member countries; and (c) nine of the 10 new
EU member States that acceded in 2004 (EU10).5 (See appendix 1 for the complete list of
countries and country groups.)
The statistical method used to compute TDI 2006 remains unchanged. The major
di erence in the actual estimation is that the InputMI and OutcomeMI are separately
calculated, and TDI 2006 is arrived at as an average of the two (see appendix 2 for details).
TDI 2005 scores and rankings in DCIT-TDI 2005 are not comparable with TDI 2005 and
TDI rankings in the current publication due to changes in composing indicators, compu-
tational approach and country coverage.
3 Sen (1976) proposed a measure of welfare-based national income that incorporates e ciency and equity
as well as a conventional measure of national income. The measure is defined as W= (1-G), where is the
mean income of the society, and G is the Gini coe cient of the income distribution.
4 According to United Nations classifi cation.
5 The nine countries that are in the sample include the Czech Republic, Estonia, Hungary, Lithuania, Latvia,
Malta, Poland, Slovakia and Slovenia. Cyprus was not includeddue to lack ofdata. In January 2007, Bulgaria
and Romania became members of the EU but are included in the grouping of South-Eastern Europe and
the Commonwealth of Independent States rather than the EU10 country grouping.

Trade and Development Index
DE
VE
LO
PIN
G C
OU
NT
RIE
S IN
INT
ER
NA
TIO
NA
L T
RA
DE
20
07
Tr
ad
e a
nd
dev
elo
pm
en
t in
dex
3
TD
I
3
Yet the objective remains the same: by systematically capturing the linkages between
itsdeterminants, the TDI indicates how e ectively trade is integrated into the development
process acrossdi erent countries and regions. Thus, the TDI framework aims to contribute
to national and international policies designed to keep trade focused on its development
multiplier function. As noted in DCIT-TDI 2005, the TDI analytical framework also focuses
on issues at the crossroads of trade and development, in particular the ultimate goal of
people’s well-being. Conventional mainstream technical analyses of trade performance
o en overlook the crucial relation between trade and development.
The realization of the United Nations Millennium Development Goals, including
Goal 8 – Develop a global partnership for development – has added to the urgency of
examining trade and development linkages. It is therefore necessary to shed light on how
best such strategies can be designed to enhance not only trade but also its contribution to
development. Furthermore, trade policies have far-reaching implications for the range of
choices that people have through their access to goods, services and opportunities. Thus,
the quality of policies need to be judged against their contribution to human develop-
ment. Finally, in recent years, a number of developing countries have made signifi cant
gains in both trade and development, while many others, especially LDCs, have been
less successful. It is therefore necessary to keep the spotlight on the constraints faced by
countries that have performed poorly, while emphasizing the ways in which trade has
served development in more successful countries. The TDI as a policymaking tool is de-
signed to provide an understanding of the relative importance and interaction of various
factors of trade and development in a coherent conceptual framework.

4
DE
VE
LO
PIN
G C
OU
NT
RIE
S I
N I
NT
ER
NA
TIO
NA
L T
RA
DE
20
07
Tr
ad
e a
nd
dev
elo
pm
en
t i
nd
ex
TD
I
4
2. TDI AND BENCHMARKS: CONCEPTS, METHODOLOGY AND COMPUTATION
2.1 The conceptual approach to TDI 2006
As noted earlier, TDI 2006 is intended to measure, to the extent possible, the posi-
tive interaction between inputs and outcomes: countries with be er availability of inputs
have a be er chance ofmeeting the preconditions for reapingmaximum benefits through
benefi cial trade integration with the rest of the world. TDI 2006 is based on two broad
sets of measures: InputMI and OutputMI. Two broad sets of determinants are included
in InputMI: they are referred to as dimensions and include structural and institutional
context, and trade policies and processes. Under the trade and development performance
dimension, OutputMI groups a set of performance-related indicators. The relationships
among these dimensions, which themselves are composed of a number of components,
are complex, mutually interacting and multi-directional, so that each of the components
is both a cause of change in others and an outcome of their infl uences. Each of these
components is in turn composed of a set of indicators.
Figure 1 presents the conceptual framework of the TDI. The three basic dimen-
sions of DCIT-TDI 2007 are composed of 13 components, which in turn are composed
of 34 indicators (see appendix 3 for a full list of indicators). In constructing the TDI, the
indicators are aggregated to form the respective components. The methodology used in
Nagar-Basu (2002) was selected to compute a composite index based on principal com-
ponent analysis. By using this methodology, the structural and institutional context and
trade policies and processes are aggregated by taking the weighted sumof 11 components
to form the InputMI that reflects both dimensions. Similarly, the OutputMI is computed
by taking the weighted sum of two components under trade and development perform-
ance dimension.
Figure 1. Conceptual framework of TDI
Human capital
Physical Infrastructure
Financial Intermediation
Domestic Finance
International Finance
Institutional Quality
Economic Structure
Macroeconomic Stability
Environmental Sustainability
Openness to Trade
Market Access, Foreign
Trade Performance
Economic and SocialWell-Being
Structural andInstitutional
Context
Trade Policies and
Processes
Trade andDevelopmentPerformance
DIMENSIONS COMPONENTS
InputMeasure
Index
OutcomeMeasure
Index
MEASURES
Trade andDevelopment
Index
TDI
Weighted Average
Weighted Average
Simple Average

Trade and Development Index
DE
VE
LO
PIN
G C
OU
NT
RIE
S IN
INT
ER
NA
TIO
NA
L T
RA
DE
20
07
Tr
ad
e a
nd
dev
elo
pm
en
t in
dex
5
TD
I
5
The TDI is then obtained by taking the simple average of two aggregated indices,
InputMI and OutcomeMI. The choice of indicators and methodology assumes special
signifi cance in this regard.
The TDI framework can also be used as a benchmarking tool for the countries under
study. By benchmarking, wemean that a country or group of countriesmay be compared
to another country group or set of groups that have shownmuch improved performance
in trade and development. Thus, in addition to the TDI for developing countries, indices
have also been prepared for two other groups of countries: developed countries (includ-
ing OECD and EU15 countries) and EU10 countries.
Current levels of trade and development integration of most developing countries
are far below those of developed countries and reflected in the measured gaps between
these two groups. Similarly, EU10 countries have achieved a considerably higher level of
trade and development during the past decade. Thus, in this analysis, developing coun-
tries’ performance has been benchmarked against the TDI scores of developed countries,
and EU10 countries have been benchmarked against those of developing countries. The
OECD countries’ TDI scores serve as the long-term trade anddevelopment benchmarks for
developing countries. The EU10 countries are at an intermediate stage between developed
and developing countries and are in the process of integrating into a highly developed
grouping. Their TDI thus serves as themedium-term benchmark for developing countries.
The characteristics of transition economies are crucial in comparing their performance
on TDI with the benchmarked countries.
2.2 Selection of indicators
In choosing the indicators for TDI’s three dimensions, special a ention was paid to
data coverage in terms of both the number of countries and time periods. Cross-country
signifi cance and widespread acceptability were also taken into account. Lack of avail-
ability of data has restricted coverage of countries in our analysis.
A literature survey and a preliminary quantitative analysis were conducted to select
possible candidates for inclusion in the TDI framework. Since it waspossible that a number
of indicators eligible for inclusion in the components were highly correlated, a bivariate
analysis was carried out to reduce redundancy. Indicators were constructed on three-year
averages between 2000 and 2002 for TDI 2005, and between 2003 and 2005 for TDI 2006.
This helps to capture possible lags in the interaction among the various dimensions and
their components as well as possible cyclical variations. These multi-year averages may
be only partially successful for this purpose. Some of the components of the structural
and institutional context dimension may take longer for their e ects to be properly felt.
The discussion that follows on dimensions and indicators also indicates any changes in
TDI 2006 (see appendix 3 for a summary list of indicators, definition and sources).
2.2.1 Components of the structural and institutional context dimension
Human capital: As in TDI 2005, the following two indicators were chosen to reflect
the importance of a proactive government role in providing public goods: public health
expenditure and public education expenditure.6 It has long been argued that higher levels
of health and education expenditure are necessary conditions for the improvement of
human capital, computed as combined expenditure on health and education to GDP.7
6 See Bloom et al (2001), and Krueger and Lindahl (2001).
7 As data coverage for expenditure of these set of indicators tends to be relatively poor, included information
may not perfectly correspond for all countries’ situations.

6
DE
VE
LO
PIN
G C
OU
NT
RIE
S I
N I
NT
ER
NA
TIO
NA
L T
RA
DE
20
07
Tr
ad
e a
nd
dev
elo
pm
en
t i
nd
ex
TD
I
6
Physical infrastructure: As in TDI 2005, three indicators are chosen to represent
transportation and information and communication technology (ICT): (a) total percentage
of roads that are paved; (b) airfreight in millions of tons per kilometre; and (c) telephone
mainlines per 1,000 population.8 Both the quantity and quality of physical infrastructure
are of vital importance for the productive capacity of an economy and for facilitating
trade and enhancing its development impact. E cient transportation facilities encourage
growth prospects and contribute to a country’s export performance by providing faster
and cheaper access to national and international markets.9 It is well known that many
developing countries cannot achieve their full potential for trade expansion because of
inadequate physical infrastructure.10 ICT can foster innovation and contribute to the
improvement of factor productivity. E cient ICT infrastructure also helps to reduce
transaction costs and can bring important gains in employment in developing countries,
especially if made available to small and medium-sized enterprises.11
Financial intermediation: The ratio ofdomestic credit to the private sector to GDP
was selected to capture the capacity of financial institutions. Not only is credit required in
order tofinance working capital and investment infixed capital required for both trade and
development; it can also smooth consumption. Credit shortages can have negative e ects
both on economic activities and social and human development.12 Empirical work shows
that countries with be er-developed financial intermediaries experience faster declines
in measures of both poverty and income inequality.13 This indicator, however, does not
capture financial activities in the informal sector, which may be an important source of
finance. Informal financial activities could also be the consequence of credit shortages,
which would be reflected in low values of the indicator selected. Moreover, this indicator
should ideally be subject to a ceiling.14 However, choice of an appropriate ceiling was not
practicable for the large sample of countries included in TDI 2006.
Domestic fi nance resources: Gross domestic savings as a percentage of GDP was
chosen as a new indicator for TDI 2006. The availability of resources to finance invest-
ment a ects both trade performance and development. Higher savings accompany the
channelling of domestic financial resources into investment opportunities.
International fi nance resources: External debt service as a percentage of Gross
National Income (GNI) and short-term debt as a percentage of total external debt were
selected as new indicators under this heading. Policymakers have long cautioned that
the burden of external debt is an obstacle to productive investment and trade expansion.
Moreover, high external debt provides a negative signal to international capital markets.
8 Indicators such as the expenditure on transport infrastructure or docks, containers, harbours and other
parts of the shipping infrastructure could be more appropriate but were not used because of inadequate
data availability and country coverage. ICT expenditure was not used for the same reason. An indicator
reflecting the percentage of Internet users would be highly correlated with telephonemainlines. Furthermore,
the physical infrastructure component could not incorporate availability of mobile phone coverage and
railway routes due to lack of comparable data.
9 See Limão and Venables (2001), Nagar and Basu (2004a), Fan and Zhang (2004).
10 World Bank (1994), World Development Report and Krugman (1998).
11 See UNCTAD (2004a) for more information on ICT measurement.
12 The role of domestic financial resources for development was given a key role in achieving economic
growth and poverty reduction at the Monterrey Consensus of the International Conference on Financing
for Development (United Nations, 2002).
13 See Levine (1997) and Beck, Demirgu and Levine (2004) for empirical evidence.
14 Growth of lending above a certain ceiling – which may be higher than that of GDP at current prices but not
thatmuch higher – is generally considered to be a harbinger of serious problems such as asset bubbles in the
financial sectors of emerging-market economies. However, a good alternative is not easily at hand. Ideally,
the indicator or indicators here should reflect the availability not only of credit to firms and individuals but
also of other basic financial services such as good facilities for the storage of their assets and for payments
and transfers. One possibility would be the ratio of the value added of the financial sector to GDP, but this
solution faces the di culty that the data for such value added are sometimes poor or non-existent.

Trade and Development Index
DE
VE
LO
PIN
G C
OU
NT
RIE
S IN
INT
ER
NA
TIO
NA
L T
RA
DE
20
07
Tr
ad
e a
nd
dev
elo
pm
en
t in
dex
7
TD
I
7
A high share of short-term in total external debt is treated as a negative signal by lenders
and investors.
Institutional quality: World Bank indicators of regulatory quality and control
of corruption are chosen to represent institutional quality as new indicators in TDI
2006 as against the International Country Risk Guide indicators of institutional quality
used in DCIT-TDI 2005.15 According to the World Bank Governance Ma ers database,
the regulatory quality indicator represents “the ability of the Government to formulate
and implement sound policies and regulations that permit and promote private sec-
tor development”. The control of corruption indicator represents “the extent to which
public power is exercised for private gain, including both pe y and grand forms of cor-
ruption, as well as ‘capture’ of the State by elites and private interests”.16 Policymakers
and international institutions, including the United Nations (UNCTAD 2006b; United
Nations 2006), have recently given increasing emphasis to the importance of the good
governance agenda worldwide. Good governance depends on good institutions, which
in turn are key to be er trade and development outcomes. A burgeoning literature has
shown that trade in general – in particular trade liberalization episodes – is positively
related to economic growth and to social and economic development only within a good
institutional environment.17
Economic structure: As in TDI 2005, the indicator chosen is value added in agri-
culture as a percentage of GDP. The economic structure of a country reflects its level of
economic development. This relationship is clearly established in the Rostow-Kuznets
theory of stages of growth, although it does not appear in neoclassical growth and endog-
enous growth models. All developed countries appear to be characterized by low shares
of agriculture in GDP relative to that of manufactures and services, while most develop-
ing countries have increasing shares in export of diversified commodities, mostly from
primary commodities to manufacturing products. However, the agriculture sector still
contributes themost in GDP. The relationship between trade and development is likely to
be conditional upon the structure of the economy. In turn, trade and trade liberalization
can also be expected to a ect the economic structure.
Macroeconomic stability: The new indicators chosen for this component in TDI
2006 are the rate of inflation of consumer prices and the share of the current account bal-
ance in GDP. These are generally related to a favourable macroeconomic environment
and the avoidance of disruptive shi s in fi scal and monetary policies that are generally
considered conducive to long-term productive investment.
Environmental sustainability: As in TDI 2005, the following three indicators have
been selected: (a) access to an improved water source as indicated by the percentage of
the population with reasonable access to water; (b) access to improved sanitation facilities
as indicated by the percentage of the population with adequate access to excreta disposal
facilities; and (c) the GDP (in purchasing power parity terms) per unit of energy use.18
There is now growing consensus that trade expansion and growth and develop-
ment prospects should be undertaken within the framework of an environmental strategy.
The access to water and sanitation, along with availability of energy services, are key
15 DCIT-TDI 2005 included two International Country Risk Guide indicators to represent institutional quality:
bureaucratic quality and corruption. These indicators are not as broad as the World Bank indicators on
governance database. The World Bank indicators have actually included both these International Country
Risk Guide indicators, along with a number of other variables from di erent sources, in computation of
governance ma ers database, which has six di erent dimensions of governance.
16 See Kaufmann et al. (2007), and World Bank (various years).
17 See also Sachs (2003), Rodrik et al. (2004) and Basu (2007a).
18 The “Energy Poverty Issues” were taken up for discussion by the G8 summit held in St Petersburg, Russian
Federation on 16 July 2006. For more information see: h p:/eng.g8russia/docs/11.htm. The lack of access
of energy services may hinder achieving Millennium Development Goals in many of the developing
countries.
8
DE
VE
LO
PIN
G C
OU
NT
RIE
S I
N I
NT
ER
NA
TIO
NA
L T
RA
DE
20
07
Tr
ad
e a
nd
dev
elo
pm
en
t i
nd
ex
TD
I
8
components of environmental sustainability. Recent empirical studies have shown that
energy and environmental degradation can pose a risk to development.19 The degrada-
tion of the environmentmay lead to the deterioration of health conditions and thus a ect
social and human development. Lack of access to a ordable and reliable energy a ects
social well-being on the one hand and economic, and trade competitiveness on the other.
Universal access to public services such as drinking water and energy is thus critical for
human development.20
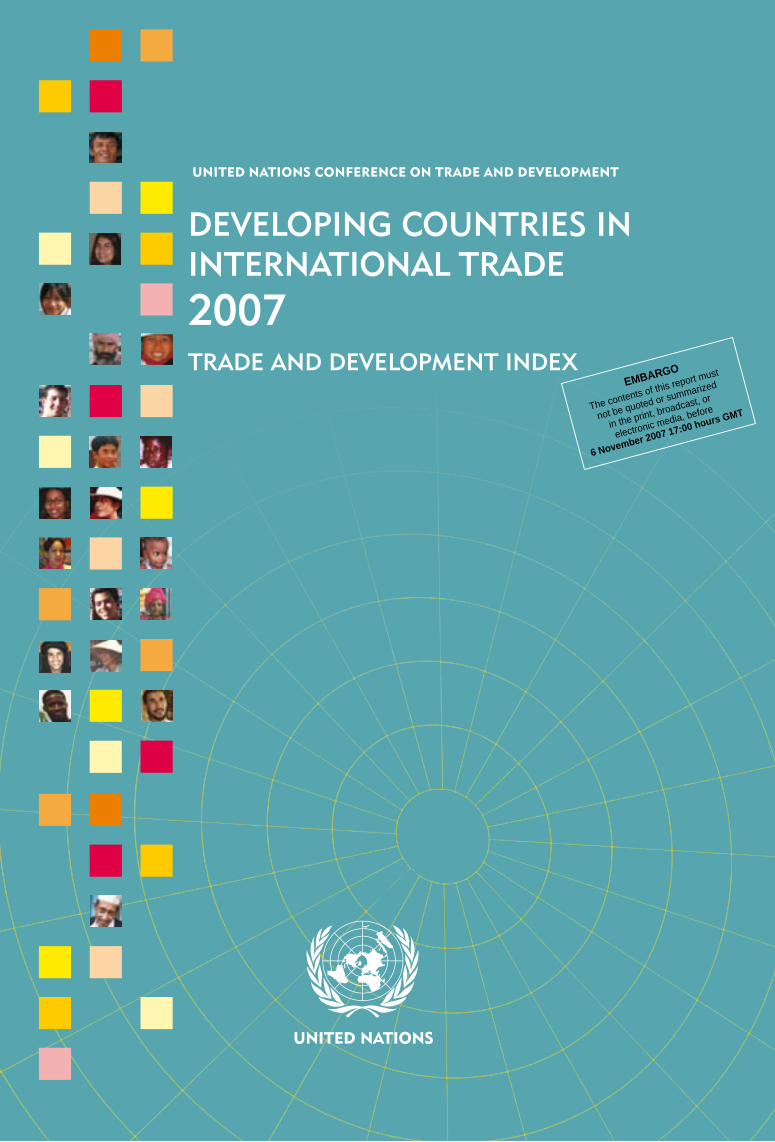
2.2.2 Components of the trade policies and processes dimension
Openness to trade: As in TDI 2005, tari barriers and non-tari barriers (NTBs)
are taken into account, and the three same indicators selected to reflect tari barriers in
DCIT-TDI 2005 are used once again, namely: (a) the applied trade-weighted average tari ;
(b) the share of tari lines with national peaks; and (c) the share of lines with interna-
tional peaks. Applied trade-weighted average tari s account for the preferences granted
to trade partners. The shares of tari lines with national and international peaks can be
seen as indicators of industrial policy, in the sense that they show, although imperfectly,
the extent to which Governments intervene in international trade policymaking to protect
specifi c activity sectors.
The indicator for NTBs, also unchanged from DCIT-TDI 2005, is the share of lines
with specifi c tari s drawn fromamore comprehensive tari database. This is an imperfect
indicator of non-tari barriers, but is the only available and quantitative data that can be
tracked on specifi c NTBs. A specifi c tari rate, as opposed to an ad valorem rate, has a
built-in e ect of restricting less costly imports by applying, de facto, higher ad valorem
rates to them.21
NTBs are increasingly becoming a critical and perhaps more important deter-
minant of market entry and access as they are becoming more frequent and stringent
than traditional tari s. At present, NTBs are di cult to identify, collect, classify and
provide quantitative measure across countries. UNCTAD – in collaboration with vari-
ous international organizations such as the Food and Agriculture Organization of the
United Nations (FAO), International Monetary Fund (IMF), International Trade Centre
(ITC), Organization for Economic Cooperation and Development (OECD), the United
Nations Industrial Development Organization (UNIDO), the World Bank (WB) and the
World Trade Organization (WTO) – has launched a new project on non-tari measures
or barriers.22 This project would be able to bring NTBs-related activities to the forefront
19 See United Nations Environment Programme, Annual Report, various years.
20 See United Nations Development Programme (UNDP) (2003). Water (e.g. emissions of organic water
pollutants) and air (e.g. emissions of the sulfur dioxide or nitrogen dioxide) pollution indicators might be
more appropriate to reflect the degradation of environment and its possible impact on health conditions
but could not be used owing to lack of data.
21 In September 2005, UNCTAD hosted an expert meeting on non-tari barriers, where issues concerning
collection, classifi cation and quantifi cation of NTBs were discussed. As a result, it was agreed that UNCTAD
would reinforce its e orts to improve the quality and data coverage of its NTBs database and establish
a methodology for its quantifi cation (Report of the Expert Meeting on Methodologies, Classifi cations,
Quantifi cation and Development Impacts of Non-Tari Barriers.
h p://www.unctad.org/en/docs/c1em27d3_en.pdf.
22 Dr. Supachai Panitchpakdi, Secretary-General of UNCTAD, has set up a Group of Eminent Persons on NTBs
(GNTBs), which aims to contribute to the understanding of new barriers to international trade and thereby
enhance the participation of developing countries in international trade. The members of the group are:
Ms. Anne O. Kruger, First Deputy Managing Director, IMF; Mr. Rufus H. Yerxa, Deputy Director-General,
WTO; Mr. L. Alan Winters, Director, Development Research Group, World Bank; Prof. Alan Deardorf,
Professor of Economics, University of Michigan; Mr. Amit Mitra, Secretary-General of India’s Federation
of Chambers of Commerce and Industry; Dr. Marcelo de Paiva Abreu, Senior Expert in Integration and
Trade, Inter-American Development Bank; H.E. Mr. Alan Kyerematen, Minister of Trade and Industry,
Ghana. (Positions cited indicate those at the time that the GNTBs were set up.) A multi-agency support
team (MAST) was established to provide technical advice to the group. This is composed of international

Trade and Development Index
DE
VE
LO
PIN
G C
OU
NT
RIE
S IN
INT
ER
NA
TIO
NA
L T
RA
DE
20
07
Tr
ad
e a
nd
dev
elo
pm
en
t in
dex
9
TD
I
9
of international trade policy discussions, to capture more fully the “openness quotient”
of both exporting countries and their receiving members. 23
With regard to tari s, a specifi c as opposed to an ad valorem tari rate has the
built-in e ect of restricting less costly imports by applying de facto higher ad valorem
rates to them.24 These tari rates are intended to reflect di erent dimensions and impera-
tives of trade and industrial policies. Protection may also be motivated by the desire to
promote productive capacity and the need to promote other positive externalities. In this
context, the UNCTAD Least Developed Countries Report 2006 argues that the “development
ofdomestic productive capacities and concomitant expansion of productive employment
opportunities is the key to sustained economic growth and poverty reduction in the…
LDCs”. However, the appropriate weight for such considerations generallydepends on the
characteristics and capacity to absorb for countries at di erent levels of development.
Access to foreign markets: As in TDI 2005, this consists of the same indicators
for the receiving country as those specified under openness to trade above. For obvious
reasons, access to foreign markets is an important determinant of export performance.25
However, low tari barriers in destination markets may not be a fully adequate guide
to the openness of the markets of receiving countries. The indicators are an a empt to
provide as full a measure as possible of access to foreign markets, especially in relation
to NTBs.
2.2.3 Components of trade and development performance
To reflect the trade and development performance under OutcomeMI as explained
above, the present analysis includes two components, namely trade performance and
economic and social well-being.
Trade performance: This component is composed of four indicators: (a) the share
of the country’s merchandise exports in the total world merchandise exports; (b) the
share of the country’s service exports in the total world service exports; (c) the market
concentration index for the country’s merchandise exports; and (d) the country’s ratio of
total trade (exports plus imports) to GDP.
Economic and social well-being: This component includes five indicators: (a) the
Sen Welfare Index, which takes account of income distribution as well GDP per capita
(in United States dollars); (b) the adult literacy rate; (c) life expectancy at birth; (d) the
female-to-male income ratio; and (5) the female labour force participation to represent
gender development.26
experts from the above-mentioned institutions. This team met three times: once in Washington, D.C. in
October 2006; in Rome in April 2007; and in Vienna in September 2007.
23 See Fugazza and Robert-Nicoud (2006) and Fugazza and Vanze i (2007) for a further discussion on trade
liberalization and the potential for trade growth.
24 See Bora et al. (2002), Kee et al. (2005), and Fugazza and Maur (2006).
25 See Redding and Venables (2003) for a theoretical discussion and Fugazza (2004) for empirical evidence.
26 See Anand and Sen (1993, 1995) and UNDP’s Human Development Report (various issues) for a detailed
description of indicators of gender equality and inequality.

10
DE
VE
LO
PIN
G C
OU
NT
RIE
S I
N I
NT
ER
NA
TIO
NA
L T
RA
DE
20
07
Tr
ad
e a
nd
dev
elo
pm
en
t i
nd
ex
TD
I
10
3. TDI 2006 RESULTS
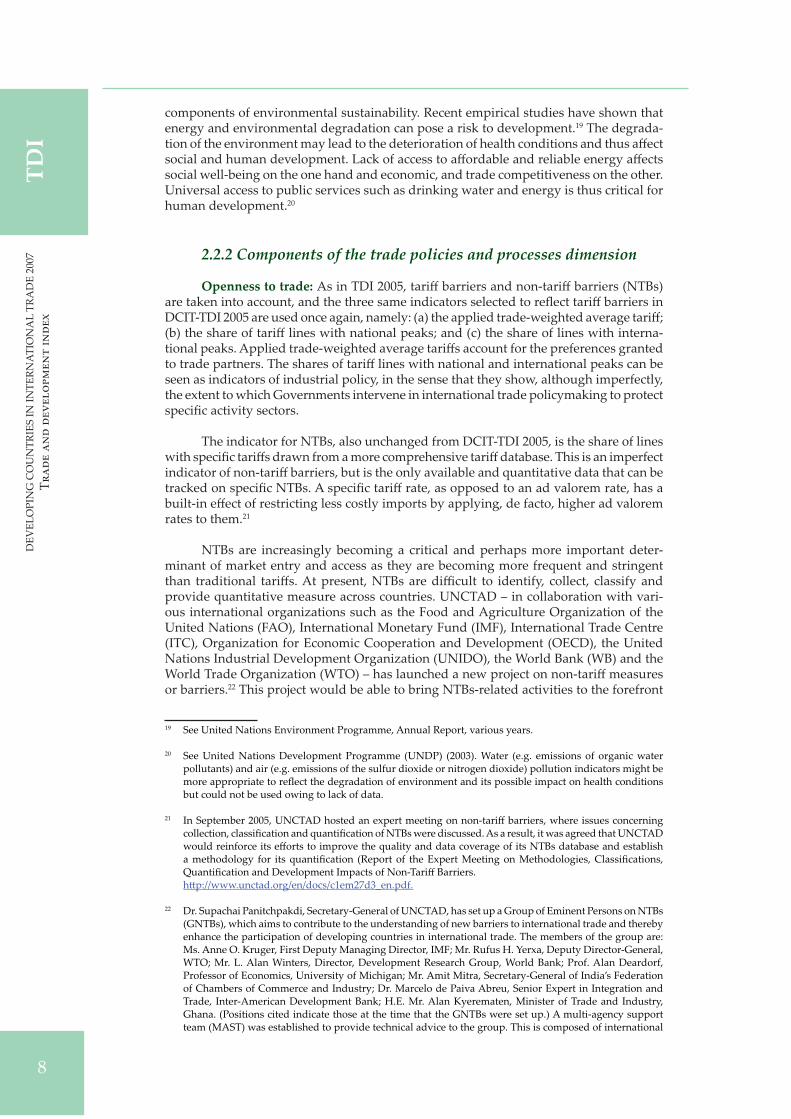
3.1 TDI 2006 scores and global rankings
TDI 2006 provides scores and rankings for 123 countries. Table 1 shows individual
country scores and rankings for TDI 2006, InputMI 2006 and OutcomeMI 2006. Appendix
4 compares scores for refined TDI 2005 (i.e. the new version of the index incorporating
the new indicators and the expanded sample of countries) with TDI 2006.
The United States holds the top position in TDI 2006, followed by Germany, Den-
mark and the United Kingdom. Developed economies hold the top positions, with the
exception of Singapore, which holds fi h place. The following pairs of countries have
equal TDI scores and ranks: Japan and Sweden, France and Norway, and Canada and
Switzerland. Southern European countries are at the bo om of the top 30. Five develop-
ing countries are in the top 30 performers. Besides Singapore, these include the Republic
of Korea (No. 21), China (No. 25), Malaysia (No. 27) and Thailand (No. 29).
At the other extreme, all the bo om 20 countries are either LDCs (14 countries) or
sub-Saharan African countries or both, except for the Syrian Arab Republic (No. 105) and
Yemen (No. 117) in the Middle East and North African region. More specifi cally, nine of
the bo om 10 are sub-Saharan African countries, seven of which are LDCs. Indeed, only
two African countries – South Africa (No. 47) and Mauritius (No. 50) – are among the top
50. This indicates the severity of problems confronting LDCs and sub-Saharan African
countries in integrating trade and development.
China and India have become important players in the world economy following
two decades of impressive growth in their respective economies and trade levels. China
now holds 25th place in the TDI ranking.27 India, on the other hand, started its economic
reforms in the early 1990s and has a long way to go to catch up with China in TDI. Its
relatively lower rank of 86 reflects both the problems which it must still confront and its
still unrealized potential. An in-depth analysis of TDI components reveals the associated
problems and potential that countries face.
3.2 TDI scores and rankings: regional pa erns
TDI 2006, InputMI2006 and OutcomeMI2006 are grouped according to eight re-
gional groupings to account for the inter-country di erences as follows: East Asia and
the Pacifi c (13 countries), Europe and Central Asia (19 countries), Latin America and the
Caribbean (20 countries), Middle East and North Africa (18 countries), North America
(two countries), South Asia (4 countries), sub-Saharan Africa (33 countries) and Western
Europe (14 countries).28
Figure 2 shows the TDI2006, InputMI2006 and OutcomeMI2006 scores and rankings
for the eight country groups. Amongdeveloping country groupings, East Asia and Pacifi c
countries are leading, followed by Middle East and North Africa countries, and Latin
America and Caribbean countries. The scores of sub-Saharan African and South Asian
countries are comparable and lag substantially behind other regions. Western Europe and
North America, not surprisingly, lead the pack by a substantial margin.
27 China’s improved rank of 27 in the refined version of TDI 2005 compared with the rank of 51 recorded in
DCIT-TDI 2005 reflects the changes in the system of indicators since the earlier version.
28 The country and regional classifi cations used in this publication are based on the World Bank’s country
classifi cation system (World Bank, 2005).
Trade and Development Index
DE
VE
LO
PIN
G C
OU
NT
RIE
S IN
INT
ER
NA
TIO
NA
L T
RA
DE
20
07
Tr
ad
e a
nd
dev
elo
pm
en
t in
dex
11
TD
I
11
TD
IT
DI
Inp
utM
IO
utc
om
eMI
TD
IT
DI
Inp
utM
IO
utc
om
eMI
TD
IT
DI
Inp
utM
IO
utc
om
eMI
ran
ksc
ore
ran
kra
nk
ran
ksc
ore
ran
kra
nk
ran
ksc
ore
ran
kra
nk
2006
Co
un
try
2006
2006
2006
2006
Co
un
try
2006
2006
2006
2006
Co
un
try
2006
2006
2006
1U
nite
d S
tate
s 74
31
142
Latv
ia
517
5933
83A
lger
ia
436
4998
2G
erm
any
696
42
43B
ahra
in
511
2489
83U
nite
d R
ep. o
f Tan
zani
a 43
692
783
Den
mar
k 69
12
644
Cos
ta R
ica
503
4253
85B
otsw
ana
434
3911
54
Uni
ted
Kin
gdom
68
25
444
Viet
Nam
50
370
3886
Indi
a 43
360
945
Sin
gapo
re
675
311
46A
lban
ia
495
5547
86Le
bano
n 43
311
062
6Ja
pan
668
105
47M
exic
o 49
351
5089
Leso
tho
432
8985
6S
wed
en
668
123
47S
outh
Afri
ca
493
3584
89P
apua
New
Gui
nea
432
104
728
Fran
ce
664
106
49B
oliv
ia
491
4660
89Ve
nezu
ela,
Bol
ivar
ian
Rep
. 43
296
808
Nor
way
66
47
850
Aze
rbai
jan
490
5749
91S
eneg
al
429
6993
10C
anad
a 65
014
1050
Mau
ritiu
s 49
040
6892
Rw
anda
42
598
8310
Sw
itzer
land
65
09
1252
Col
ombi
a 48
861
4893
Gua
tem
ala
423
8690
12B
elgi
um
642
219
54A
rgen
tina
486
7843
93Ira
n, Is
lam
ic R
epub
lic o
f42
363
9912
Icel
and
642
815
54B
razi
l 48
672
4595
Mor
occo
42
065
101
14Fi
nlan
d 63
616
1354
Rom
ania
48
693
3796
Gha
na
412
115
7515
Irela
nd
630
622
56A
rmen
ia
485
8042
97E
gypt
407
6111
216
Aus
tralia
62
816
1557
Bel
arus
48
410
134
97M
alaw
i 40
711
088
17A
ustri
a 62
719
1458
Rus
sian
Fed
erat
ion
483
8641
99M
ozam
biqu
e 40
410
692
18N
ew Z
eala
nd
623
1318
58U
rugu
ay
483
8144
100
Togo
40
197
9619
Spa
in
619
1519
60Jo
rdan
47
842
8010
1M
ali
398
6711
720
Isra
el
610
1823
60S
ri La
nka
478
4870
102
Ban
glad
esh
397
9810
121
Italy
59
926
1762
Geo
rgia
47
573
5110
3P
akis
tan
395
8610
921
Rep
ublic
of K
orea
599
2027
63P
eru
474
5466
103
Zim
babw
e 39
512
382
23P
ortu
gal
593
2229
63P
hilip
pine
s 47
471
5410
5S
yria
n A
rab
Rep
ublic
39
211
395
24S
love
nia
583
2920
65M
oldo
va
473
103
4010
5C
had
392
8311
325
Chi
na
577
3020
66In
done
sia
468
7356
107
Côt
e d’
Ivoi
re
387
7611
926
Cze
ch R
epub
lic
560
3428
67G
uyan
a 46
577
5710
7M
aurit
ania
38
711
010
127
Mal
aysi
a 55
625
4668
Hon
dura
s 46
458
7410
9B
urki
na F
aso
386
9111
628
Gre
ece
555
3334
68E
l Sal
vado
r 46
467
6311
0B
enin
38
494
114
29M
alta
55
123
5570
Ecu
ador
46
182
5711
1B
urun
di
382
119
9129
Thai
land
55
136
3671
Sau
di A
rabi
a 45
931
111
112
Cen
tral A
frica
n R
epub
lic
381
108
108
31H
unga
ry
539
4425
72Tu
nisi
a 45
552
8611
2Za
mbi
a 38
111
410
332
Pol
and
537
4131
73O
man
45
338
107
114
Eth
iopi
a 37
910
611
033
Est
onia
53
647
2473
Turk
ey
453
7573
115
Cam
eroo
n 37
311
797
34S
lova
kia
527
5029
75C
ambo
dia
452
9061
116
Gui
nea
372
116
105
35Li
thua
nia
526
5325
76Ja
mai
ca
449
8471
117
Yem
en, R
ep.
370
6712
337
Chi
le
522
3259
76M
adag
asca
r 44
988
6811
8A
ngol
a 36
412
110
437
Pan
ama
522
3751
78U
gand
a 44
678
8011
8C
ongo
, Dem
ocra
tic R
ep.
364
120
105
37U
krai
ne
522
4539
79D
omin
ican
Rep
ublic
44
395
6612
0N
iger
36
211
211
839
Uni
ted
Ara
b E
mira
tes
521
2876
79N
icar
agua
44
364
8712
1N
iger
ia
350
105
121
39K
uwai
t 52
127
7781
Ken
ya
441
100
6312
2G
uine
a-B
issa
u 33
912
112
041
Bul
garia
52
055
3282
Par
agua
y 44
010
166
123
Sud
an
326
118
122
Tab
le 1
. T
rad
e an
d D
evel
op
men
t In
dex
200
6: g
lob
al r
ank
ing
s
No
te:
TDI s
core
s ha
ve b
een
roun
ded
to th
e ne
ares
t who
le n
umbe
r but
the
rank
ing
corr
espo
nds
to v
alue
s in
clud
ing
deci
mal
s.
The
high
er s
core
indi
cate
s im
prov
emen
t in
TDI,
Inpu
tMI a
nd O
utco
meM
I.

12
DE
VE
LO
PIN
G C
OU
NT
RIE
S I
N I
NT
ER
NA
TIO
NA
L T
RA
DE
20
07
Tr
ad
e a
nd
dev
elo
pm
en
t i
nd
ex
TD
I
12
An overall analysis of the TDI components reveals that the relatively high score
of East Asia and Pacifi c countries reflects high average scores for components of both
InputMI (especially in human capital, physical infrastructure, financial intermediation,
domestic finance, institutional quality and macroeconomic stability) and of OutcomeMI
(especially trade performance). Sub-Saharan African and South Asian countries lag be-
hind other developing countries on almost all components, a rare exception being trade
performance for South Asia (fi gure 3).
Latin American countries have a relatively lower indicator for physical infrastruc-
ture, but have other InputMI and OutcomeMI components that do not diverge especially
sharply from those for all developing countries. For Middle Eastern and North African
countries, the scores for the human capital and economic structure components are rela-
tively high, while the scores for macroeconomic stability, openness to trade and foreign
market access are similar to the scores those for all developing countries.
Another look at the regional pa erns among the five regional groupings reveal
some interesting features: (a) Middle Eastern and North African countries have performed
be er than other regions in human capital, followed by Latin America and the Caribbean,
East Asia and the Pacifi c, sub-Saharan Africa and South Asia; (b) East Asia and the Pacifi c
outperforms other regions in several components, including physical infrastructure,
domestic finance component, international finance, economic structure, macroeconomic
stability, openness to trade, market access, trade performance and economic and social
well-being; (c) the Middle East and North Africa scores highest in financial intermedia-
tion; (d) South Asia leads in institutional quality, followed by sub-Saharan Africa; and (e)
Latin America and the Caribbean scores second infinancial intermediation, environmental
sustainability, openness to trade, and economic and social well-being. However, final
Figure 2. Regional pa ern in TDI 2006,InputMI 2006 and OutcomeMI 2006 scores
Note: See appendix 1 for regional groupings.
400426
472 477510
554
651697
521560 573
633584
663
769802
279 291
370321
435 445
531
591
0
100
200
300
400
500
600
700
800
900
1000
Sub-SaharanAfrica
South Asia Latin Americaand the
Caribbean
Middle Eastand
North Africa
Europe andCentral Asia
(excl. WesternEurope)
East Asiaand Pacific
WesternEurope
NorthAmerica
..... ..... ..... ..... ..... ..... ..... .....
Inde
x sc
ore
(0-1
000
scal
e)
TDI 2006 InputMI 2006 OutcomeMI 2006
TDI 2006 Developed Countries (average)InputMI 2006 Developed Countries (average).....OutcomeMI 2006 Developed Countries (average)

Trade and Development Index
DE
VE
LO
PIN
G C
OU
NT
RIE
S IN
INT
ER
NA
TIO
NA
L T
RA
DE
20
07
Tr
ad
e a
nd
dev
elo
pm
en
t in
dex
13
TD
I
13
Figure 3. Regional pa ern in TDI 2006 components
21 16 15
54
19
120
5476
5775 79 84
263
0
50
100
150
200
250
300
350
400
HC PI FI DF IF IQ ES MS ES OT MA TP EW
23 3314
65
35
125
62
88
5877 81
115
331
0
50
100
150
200
250
300
350
400
HC PI FI DF IF IQ ES MS ES OT MA TP EW
259 14
56
14
115
48
7658
76 81 84
286
0
50
100
150
200
250
300
350
400
HC PI FI DF IF IQ ES MS ES OT MA TP EW
28 21 16
62
27
129
5678
6175 80 75
246
0
50
100
150
200
250
300
350
400
HC PI FI DF IF IQ ES MS ES OT MA TP EW
18 13
46
14
135
50
87
5265 69
86
205
12
0
50
100
150
200
250
300
350
400
HC PI FI DF IF IQ ES MS ES OT MA TP EW
204 12
45
8
130
40
74
4570 73
60
218
0
50
100
150
200
250
300
350
400
HC PI FI DF IF IQ ES MS ES OT MA TP EW
Developing Countries East Asia and Pacific Region
Latin America and Caribbean Region Middle East and North Africa Region
South Asia Region Sub-Saharan Africa Region
Ind
ex s
core
Ind
ex s
core
Ind
ex s
core
Ind
ex s
core
Ind
ex s
core
Ind
ex s
core
Note: See appendix 1 for regional groupings.
InputMI: HC = Human capital MS = Macroeconomic stability PI = Physical infrastructure ES = Environmental sustainability FI = Financial intermediation OT = Openness to trade DF = Domestic fi nance MA = Access to foreign market IF = International fi nance OutcomeMI: IQ = Institutional quality TP = Trade performance ET = Economic structure EW = Economic and social well-being

14
DE
VE
LO
PIN
G C
OU
NT
RIE
S I
N I
NT
ER
NA
TIO
NA
L T
RA
DE
20
07
Tr
ad
e a
nd
dev
elo
pm
en
t i
nd
ex
TD
I
14
results vary depending on the weights of components that make up the TDI (see fi gure
A1). Among InputMI components, international finance gets the most weight, followed
by financial intermediation, and then institutional quality, macroeconomic sustainability,
physical infrastructure,domestic finance, openness to trade, foreignmarket access, human
capital, economic structure and environmental sustainability. In OutcomeMI components,
economic and social well-being gets about 1.6 times higher weight (see appendix 5 for
disaggregated scores on dimensions, components and input and outcome measures).
3.3 Major emerging economies: TDI scores and rankings
An UNCTAD (2007a) study shows that developing countries’ participation in world
trade has dramatically increased in the last two decades. Several developing countries
and countries with economies in transition have become major players in international
economic relations, and have achieved sustainable economic growth over the past several
years. Seven major emerging economies (E7) have been selected for special study here:
Brazil, China, India, Republic of Korea, Mexico, the Russian Federation and South Africa.29
In 2004, the E7 countries constituted about 45 per cent of the world’s population, contrib-
uted about 26.50 per cent of world’s exports of goods and services, and their combined
GDP growth has been higher than the world average during the past decade.
Figure 4. TDI scores in E7 and other regions
29 A further discussion on this can be found in the Report of the Secretary-General of UNCTAD to UNCTAD XII
(UNCTAD, 2007a), available at: h p://www.unctad.org/en/docs//td413_en.pdf. See also UNCTAD (2007b)
and Basu (2007b).
509
395
467495
542
640621
517
580559
631
762
397
273
342
434 452
518
0
100
200
300
400
500
600
700
800
900
1000
EmergingEconomies 7
Least DevelopedCountries
DevelopingCountries
South-EasternEurope and
Commonwealth ofIndependent States
EuropeanUnion 10
DevelopedCountries
Inde
x sc
ores
(0-1
000
scal
e)
.....
Gap with Developed Countries
TDI 2006InputMI 2006OutcomeMI 2006
Note: See appendix 1 for regional groupings.

Trade and Development Index
DE
VE
LO
PIN
G C
OU
NT
RIE
S IN
INT
ER
NA
TIO
NA
L T
RA
DE
20
07
Tr
ad
e a
nd
dev
elo
pm
en
t in
dex
15
TD
I
15
In comparing E7 countries to developed countries, the EU10, South-Eastern Eu-
rope and the Commonwealth of Independent States, developing countries as a whole
and LDCs, some interesting facts are revealed about the convergence of these countries.
Figure 4 presents the TDI 2006, InputMI2006 and OutcomeMI2006 scores for six country
groups. On average, E7 countries have be er TDI 2006 scores than other developing
countries. Moreover, their score has already surpassed that of South-Eastern Europe and
the Commonwealth of Independent States, and the gap between their score and that of
EU10 countries is not large. A similar pa ern can be obtained from the InputMI scores,
though not for the OutputMI scores. This suggests that, even when E7 countries have
done well on input measures, further sustained improvement of socio-economic policies
is still required.
Figure 5. TDI scores in emerging economies
Within the E7 group, there are signifi cant variations (fi gure 5). An overall analysis
of the TDI, InputMI and OutcomeMI places the Republic of Korea at the top of the list,
followed by China, Mexico, South Africa, Brazil, the Russian Federation and India. The
Republic of Korea leads due to high average scores for InputMI. China lags behind the
Republic of Korea in TDI and InputMI, but has the highest score for OutcomeMI. India’s
scores still lag behind those of the rest of the E7 countries for TDI and OutcomeMI, though
for InputMI its score is above those of Brazil and the Russian Federation. The gaps between
InputMI and OutputMI are especially large for Mexico and South Africa.
A comparative analysis can also be carried out for the components of TDI 2006 for
the E7 countries (fi gure 6). For human capital, South Africa scores highest, followed by
Brazil, Mexico, the Republic of Korea, the Russian Federation, India and China.
For physical infrastructure, the Republic of Korea, China and India score relatively
high, while South Africa lags behind. For financial intermediation, South Africa leads,
while Mexico scores lowest. China obtained the highest score and South Africa the lowest
score on the domestic finance measure. Interestingly, for international finance, the score
486
577
433
599
493 483 493
564
676
576
738
593541
659
408
477
290
460
393425
326
0
100
200
300
400
500
600
700
800
900
1000
Brazil China India Republic ofKorea
Mexico RussianFederation
South Africa
TDI 2006InputMI 2006OutcomeMI 2006
TDI 2006 Developed Countries (average)InputMI 2006 Developed Countries (average).....OutcomeMI 2006 Developed Countries (average)
..... ..... ..... ..... ..... ..... .....
Inde
x sc
ore
(0-1
000
scal
e)
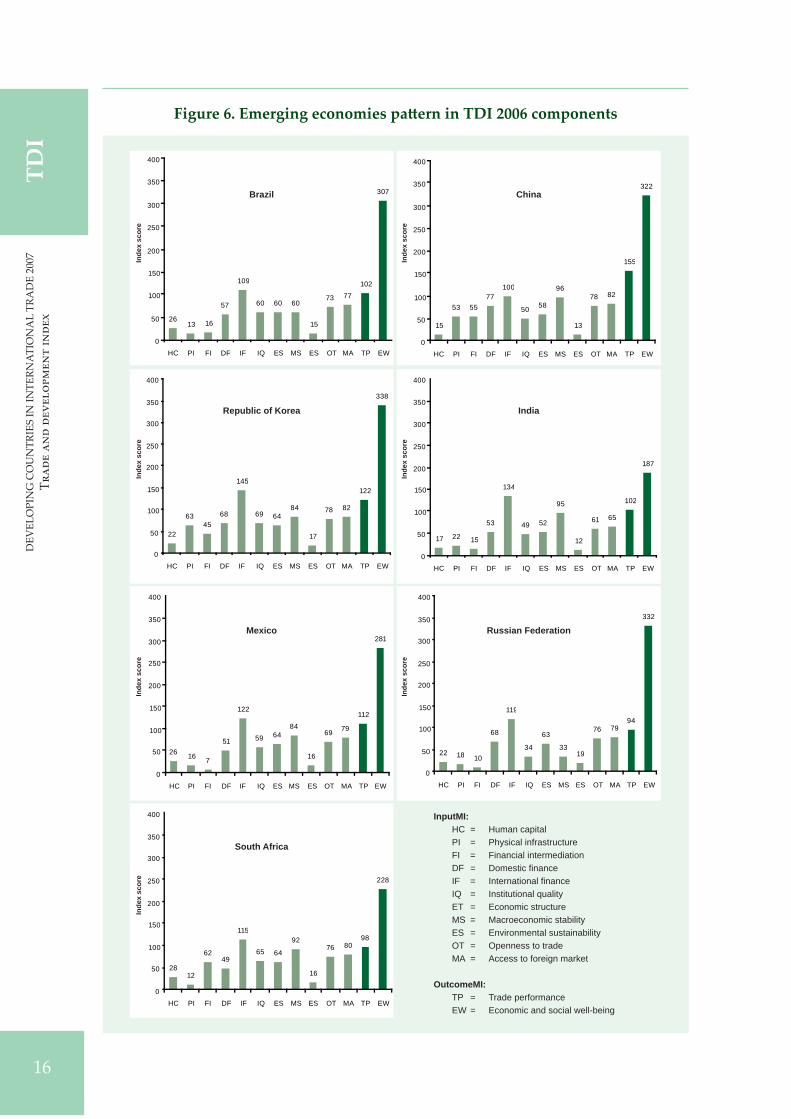
16
DE
VE
LO
PIN
G C
OU
NT
RIE
S I
N I
NT
ER
NA
TIO
NA
L T
RA
DE
20
07
Tr
ad
e a
nd
dev
elo
pm
en
t i
nd
ex
TD
I
16
17 22 15
53
134
49 52
95
12
61 65
102
187
0
50
100
150
200
250
300
350
400
HC PI FI DF IF IQ ES MS ES OT MA TP EW
2613 16
57
109
60 60 60
15
73 77102
307
0
50
100
150
200
250
300
350
400
HC PI FI DF IF IQ ES MS ES OT MA TP EW
15
53 5577
100
50 58
96
13
78 82
155
322
0
50
100
150
200
250
300
350
400
HC PI FI DF IF IQ ES MS ES OT MA TP EW
22
6345
68
145
69 6484
17
78 82
122
338
0
50
100
150
200
250
300
350
400
HC PI FI DF IF IQ ES MS ES OT MA TP EW
26 16 7
51
122
59 6484
16
69 79
112
281
0
50
100
150
200
250
300
350
400
HC PI FI DF IF IQ ES MS ES OT MA TP EW
22 18 10
68
119
34
63
3319
76 7994
332
0
50
100
150
200
250
300
350
400
HC PI FI DF IF IQ ES MS ES OT MA TP EW
2812
6249
115
65 64
92
16
76 8098
228
0
50
100
150
200
250
300
350
400
HC PI FI DF IF IQ ES MS ES OT MA TP EW
Brazil China
Republic of Korea India
Mexico Russian Federation
South Africa
Ind
ex s
core
Ind
ex s
core
Ind
ex s
core
Ind
ex s
core
Ind
ex s
core
Ind
ex s
core
Ind
ex s
core
Figure 6. Emerging economies pa ern in TDI 2006 components
InputMI:
HC = Human capital PI = Physical infrastructure FI = Financial intermediation DF = Domestic fi nance IF = International fi nance IQ = Institutional quality ET = Economic structure MS = Macroeconomic stability ES = Environmental sustainability OT = Openness to trade MA = Access to foreign market
OutcomeMI:
TP = Trade performance EW = Economic and social well-being

Trade and Development Index
DE
VE
LO
PIN
G C
OU
NT
RIE
S IN
INT
ER
NA
TIO
NA
L T
RA
DE
20
07
Tr
ad
e a
nd
dev
elo
pm
en
t in
dex
17
TD
I
17
of India, which has tightly controlled inward capital movements, is be ered only by that
of the Republic of Korea. For institutional quality, the Republic of Korea scores highly,
while the scores of China, India and the Russian Federation lag; a similar pa ern can be
seen for economic structure, reflecting the continuing importance for the la er countries’
agricultural sectors. China and India outperformed other E7 countries formacroeconomic
stability, but for environmental sustainability, their scores are the lowest. The scores for
openness to trade point to the extent to which the Republic of Korea and China have
opened up their economies, while that for India and its score for market access are con-
sistent with the still-cautious openness of its economy. Among the OutcomeMI, China
has the highest score for trade performance components, and the Russian Federation the
lowest. The Republic of Korea has the top score for economic and social well-being, and
India the lowest.
Although there are some variations among di erent components in E7 countries,
the above results indicate that they have an overall balance inmost of the areas of InputMI
and OutcomeMI components, which have provided strong impetus for their growing im-
portance in the world economy. Similar types of analysis of di erent regions and groups
of countries show that, in general, countries with balanced performance among di erent
components tend to obtain be er results in InputMI and OutcomeMI.
3.4 Benchmarking: TDI, InputMI and OutcomeMI scores
One of the objectives of the TDI exercise is to identify gaps among country groups
that point to policy options to overcome bo lenecks to trade and development. To enable
benchmarking, countries are aggregated into three groups: (a) developing countries (ac-
cording to the United Nations definition); (b) South-Eastern Europe and Commonwealth
of Independent States; and (c) developed countries (EU10, EU15 plus other OECD coun-
tries). Within the first group, two sub-groups are identified middle-income developing
countries (MIDs) and LDCs.
The global overview of the TDI 2006 in fi gure 7 shows that there is still a consider-
able gap between developing countries (with average TDI 2006 of 467) and developed
countries (with average TDI 2006 of 640). A similar pa ern can be observed for InputMI
2006 and OutcomeMI 2006 scores. Furthermore, EU10 and South-Eastern Europe and Com-
monwealth of Independent States countries have be er scores than developing countries
for TDI 2006. In the case of South-Eastern Europe and Commonwealth of Independent
States countries, the di erence reflects the scores for OutcomeMI 2006, since InputMI
2006 is higher for developing countries.
However, there is still a large gap between the OutcomeMI 2006 of EU10 and de-
veloped countries, on the one hand, and that of developing countries, on the other. The
scores of MID countries for TDI, InputMI and OutcomeMI are close to those ofdeveloping
countries as a whole. Finally, TDI 2006, InputMI 2006 and OutcomeMI 2006 of LDCs are
all substantially below those for the other country groupings in fi gure 7.

18
DE
VE
LO
PIN
G C
OU
NT
RIE
S I
N I
NT
ER
NA
TIO
NA
L T
RA
DE
20
07
Tr
ad
e a
nd
dev
elo
pm
en
t i
nd
ex
TD
I
18
The average scores for these groups and sub-groups are displayed in fi gure 8.
Disaggregated scores for InputMI and OutcomeMI components (fi gure 8) show that
developing countries have achieved scores not far from those of developed countries
in a number of areas, such as domestic finance, economic structure, macroeconomic
stability, environmental sustainability and openness to trade. However, there is still a
substantial gap between the two groups in most other areas, especially human capital,
physical infrastructure, financial intermediation, institutional quality, trade performance
and economic and social well-being.
Figure 8 also indicates that the scores of developing countries surpass or are close
to those of EU10 countries for domestic finance, international finance, environmental
sustainability, financial intermediation, economic structure, macroeconomic stability,
openness to trade andmarket access. Nevertheless, there are still signifi cant gaps between
the two groups for human capital, physical infrastructure, institutional quality, trade
performance and economic and social well-being.
The disaggregated analysis also shows that the di erent groups of countries are
relatively closer to one another in respect of openness to trade, ranging from the LDCs’
score of 70 to that ofdeveloped and EU10 countries of 79. In other words,most economies
are now relatively comparable with respect to openness. Yet the di erences in other com-
ponents indicate the limits to what openness alone can achieve in the absence of other key
determinants of trade development evolution. This is especially evident in the large gaps
between the scores of the di erent groups of developing countries and those of South-
Eastern Europe and the Commonwealth of Independent States, EU10 and developed
countries for trade performance and economic and social well-being.
The scores for access to foreign markets of developed countries and EU10 (86)
are above those of the developing country group (79). This could be due in part to tar-
i escalation, existence of tari peaks and specifi c tari s in developed countries’ tari
schedules applied to developing countries. However, the lowest scores for developing
countries are due to some extent to the persistence of relatively high tari barriers applied
Figure 7. Benchmarking TDI
395
462 467495
542
640
517
584 586556
631
762
273
339 347
433 452
518
0
100
200
300
400
500
600
700
800
900
1000
Least DevelopedCountries
Middle IncomeDevelopingCountries
DevelopingCountries
South-EasternEurope and
Commonwealth ofIndependent
States
European Union 10
DevelopedCountries
TDI 2006InputMI 2006OutcomeMI 2006
TDI 2006 Developed Countries (average)InputMI 2006 Developed Countries (average).....OutcomeMI 2006 Developed Countries (average)
..... ..... ..... ..... ..... .....
Inde
x sc
ore
(0-1
000
scal
e)
Note: See appendix 1 for regional groupings.

Trade and Development Index
DE
VE
LO
PIN
G C
OU
NT
RIE
S IN
INT
ER
NA
TIO
NA
L T
RA
DE
20
07
Tr
ad
e a
nd
dev
elo
pm
en
t in
dex
19
TD
I
19
202 5
36
134
44 44
78
11
70 7357
216
0
50
100
150
200
250
300
350
400
HC PI FI DF IF IQ ES MS ES OT MA TP EW
24 15 20
53
115
56 5977
15
73 78 82
257
0
50
100
150
200
250
300
350
400
HC PI FI DF IF IQ ES MS ES OT MA TP EW
21 16 19
54
120
54 5776
15
75 79 84
263
0
50
100
150
200
250
300
350
400
HC PI FI DF IF IQ ES MS ES OT MA TP EW
26 298
45
110
4257 63
17
76 82101
332
0
50
100
150
200
250
300
350
400
HC PI FI DF IF IQ ES MS ES OT MA TP EW
36 3220
52
9572 64
81
15
79 86108
344
0
50
100
150
200
250
300
350
400
HC PI FI DF IF IQ ES MS ES OT MA TP EW
42 45 51 54
145
92
6589
14
79 86
123
395
0
50
100
150
200
250
300
350
400
HC PI FI DF IF IQ ES MS ES OT MA TP EW
Least Developed Countries
Developing Countries
European Union 10 Developed Countries
South-Eastern Europe andCommonwealth of Independent States
Middle Income Developing Countries
Ind
ex s
core
Ind
ex s
core
Ind
ex s
core
Ind
ex s
core
Ind
ex s
core
Ind
ex s
core
Figure 8. Benchmarking TDI components across country groups
InputMI: HC = Human capital MS = Macroeconomic stability PI = Physical infrastructure ES = Environmental sustainability FI = Financial intermediation OT = Openness to trade DF = Domestic fi nance MA = Access to foreign market IF = International fi nance OutcomeMI: IQ = Institutional quality TP = Trade performance ET = Economic structure EW = Economic and social well-being
Note: See appendix 1 for regional groupings.

20
DE
VE
LO
PIN
G C
OU
NT
RIE
S I
N I
NT
ER
NA
TIO
NA
L T
RA
DE
20
07
Tr
ad
e a
nd
dev
elo
pm
en
t i
nd
ex
TD
I
20
to products of export interest to other developing countries, which are in the process of
being reduced in South-South regional trade agreements and Global System of Trade
Preferences negotiations.30
Developed countries’ scores for OutcomeMI 2007 indicate important gaps between
developed countries and the rest of world. The score of developed countries for economic
and social well-being (395) exceeds that of EU10 countries by 51 points and that of de-
veloping countries by 132 points. The gap persists for the trade performance component,
where the scores for EU10 and developed countries, 108 and 123, are both well above that
of developing countries (84).
The discussion of benchmarking concept also brings into question the issue of tari
and non-tari barriers for those developing countries in exporting commodities. The
developed countries discriminate against developing countries’ products through tari
escalation and other forms to protect the interests of their domestic industry.
3.5 Climbing the TDI ladder: a comparison of results in 200531 and 2006
The path through time of TDI, InputMI and OutcomeMI can show the extent of
improvements and help to identify their causes. Here too, the scoresofdeveloped countries
serve as useful benchmarks. As noted before, TDI 2005 and TDI 2006 were constructed
on three-year averages between 2000-2002 and 2003-2005 respectively.
Figure 9 shows that TDI scores have improved in all the regions, with the exception
of a marginal decline for North America. TDI scores have risen the most (12 points each)
in sub-Saharan Africa and the Middle East and North Africa. Nevertheless, this improve-
ment still leaves a huge gap between sub-Saharan Africa and North America.
Figure 9. TDI scores in 2005 and 2006
30 See Cernat et al. (2003) and Cordoba et al. (2004) for quantitative evidence.
31 TDI 2005 scores and rankings in DCIT-TDI 2005 are not comparable with TDI 2005 and TDI rankings in
the current publication due to changes in composing indicators, computational approach and country
coverage.
388418
461 465505
548
645701
400426
472 477510
554
651697
0
100
200
300
400
500
600
700
800
900
1000
Sub-SaharanAfrica
South Latin Americaand Caribbean
Middle Eastand North
Africa
Europe andCentral Asia
(excl. WesternEurope)
East Asiaand Pacific
WesternEurope
NorthAsia America
TDI 2005TDI 2006 TDI 2006 Developed Countries (average)
Inde
x sc
ore
(0-1
000
scal
e)
Note: See appendix 1 for regional groupings.

Trade and Development Index
DE
VE
LO
PIN
G C
OU
NT
RIE
S IN
INT
ER
NA
TIO
NA
L T
RA
DE
20
07
Tr
ad
e a
nd
dev
elo
pm
en
t in
dex
21
TD
I
21
The improvement in TDI scores has been accompanied by improvements in InputMI
for all regions and improvements in OutcomeMI for all regions, with the exception of a
slight decline for North America (fi gures 10 and 11).
Figure 10. InputMI score in 2005 and 2006
Figure 11. OutcomeMI score in 2005 and 2006
509549 567
627576
658
766796
521560 573
633584
663
769802
0
100
200
300
400
500
600
700
800
900
1000
Sub-SaharanAfrica
South Latin Americaand Caribbean
Middle Eastand North
Africa
Europe andCentral Asia
(excl. WesternEurope)
East Asiaand Pacific
WesternEurope
NorthAmericaAsia
InputMI 2006InputMI 2005 InputMI 2006 Developed Countries (average).....
..... ..... ..... ..... ..... ..... ..... .....
Inde
x sc
ore
(0-1
000
scal
e)
Note: See appendix 1 for regional groupings.
267 286
355302
432 437
524
606
279 291
370321
435 445
531
591
0
100
200
300
400
500
600
700
800
900
1000
Sub-SaharanAfrica
South Latin Americaand Caribbean
Middle Eastand North
Africa
Europe andCentral Asia
(excl. WesternEurope)
East Asiaand Pacific
WesternEurope
NorthAsia America
OutcomeMI 2006OutcomeMI 2005 OutcomeMI 2006 Developed Countries (average)
Inde
x sc
ore
(0-1
000
scal
e)
Note: See appendix 1 for regional groupings.

22
DE
VE
LO
PIN
G C
OU
NT
RIE
S I
N I
NT
ER
NA
TIO
NA
L T
RA
DE
20
07
Tr
ad
e a
nd
dev
elo
pm
en
t i
nd
ex
TD
I
22
The reductions in the range between the lowest scores (sub-Saharan Africa) and the
highest (North America) suggest that there has been at least some climbing up the ladder
of trade and development during the early years of the new millennium. A country-level
analysis of TDI scores over the two years fleshes out this picture further.
Amongdeveloped countries (OECD and EU15), Switzerland has shown the largest
fall in TDI score from TDI 2005 scores, followed by the United States, Japan and Norway
(Figure 12). This decline in TDI can be a ributed to lower scores for OutcomeMI in these
countries, except in Norway. Japan has experienced a decline both in input and outcome
measures, while Switzerland and the United States have shown a rise in InputMI.
Figure 12. Climbing the TDI ladder: pa ern in developed countries
All the EU15 countries have registered an overall improvement over the years, with
Ireland leading the pack, followed by Sweden, Greece, Spain and Germany. More inter-
estingly, all five of these EU15 countries scored higher both in InputMI and OutcomeMI
score, except Germany, whose InputMI score slightly declined.
The five developing countries with the largest falls in TDI between 2005 and 2006
are Botswana, Jamaica, Uruguay, Cameroon and the Syrian Arab Republic (fi gure 13). In
all five of these countries, InputMI has declined signifi cantly, with the largest decline in
the Syrian Arab Republic. In Uruguay, Cameroon and the Syrian Arab Republic, these
declines were partly o set by increases in OutcomeMI.
The four developing countries with the largest improvements in TDI scores are
Ecuador, the Islamic Republic of Iran, Oman and Honduras. Their climbing up the TDI
ladder can again be a ributed to improvements in both InputMI and OutcomeMI. Of
course, as noted, the Islamic Republic of Iran and Oman are key players in international
trade of energy exports, and could contribute to the performance of these countries.
2005-2006 TDI 2005-2006 OutcomeMI 2005-2006 InputMI
-40 -30 -20 -10 0 10 20 30
Switzerland
United States
Japan
Norway
Germany
Spain
Greece
Sweden
Ireland
Note: 2005–2006: change in indices scores from 2005.

Trade and Development Index
DE
VE
LO
PIN
G C
OU
NT
RIE
S IN
INT
ER
NA
TIO
NA
L T
RA
DE
20
07
Tr
ad
e a
nd
dev
elo
pm
en
t in
dex
23
TD
I
23
Although the 26 LDCs in the report occupy most of the places at the bo om of the
TDI rankings, there were some success stories (fi gure 14).
Figure 14. Climbing the TDI ladder: pa ern in LDCs
Figure 13. Climbing the TDI ladder: pa ern in developing countries
-60 -40 -20 0 20 40 60
Botswana
Jamaica
Uruguay
Cameroon
Syrian Arab Rep.
Honduras
Oman
Iran, Islamic Rep. of
Ecuador
2005-2006 TDI 2005-2006 OutcomeMI 2005-2006 InputMI
Note: 2005–2006: change in indices scores from 2005.
-40 -30 -20 -10 0 10 20 30 40 50 60
Mauritania
Bangladesh
Zambia
Central African Republic
Senegal
Madagascar
Mali
Malawi
Lesotho
Chad
2005-2006 TDI 2005-2006 OutcomeMI 2005-2006 InputMI
Note: 2005–2006: change in indices scores from 2005.

24
DE
VE
LO
PIN
G C
OU
NT
RIE
S I
N I
NT
ER
NA
TIO
NA
L T
RA
DE
20
07
Tr
ad
e a
nd
dev
elo
pm
en
t i
nd
ex
TD
I
24
Only three LDCs – Mauritania, Bangladesh, and Zambia – have experienced a fall in
TDI scores, due mainly to lower InputMI scores in 2006. The remaining LDCs in the 2006
sample registered higher scores. The top climbers among LDCs are (in ascending order):
Chad, Lesotho, Malawi, Mali, Madagascar, Senegal and the Central African Republic. All
seven countries have shown improvement in both InputMI and OutputMI,pointing to the
benefits of a balanced approach in policies towards trade and development. In classifying
criteria for LDCs, UNCTAD includes the economic vulnerability index (EVI), based on
indicators of: (a) the instability of agricultural production; (b) the instability of exports
of goods and services; (c) the economic importance of non-traditional activities (share
of manufacturing and modern services in GDP); (d) merchandise export concentration;
and (e) the handicap of economic smallness (as measured through the population in
logarithmic form). It can therefore be readily seen that some of the concepts of EVI are
already included in the TDI framework. Therefore, a comprehensive LDCs story should
be analysed not just through EVI and other criteria; the climbing up in TDI framework
may be used for the LDCs’ graduation debate.32
Another group of developing and transition economies whose TDI is of special
interest are exporters of energy.33 Among these countries, all except Malaysia have TDI
scores higher for 2006 than for 2005 (fi gure 15).
Figure 15. Climbing the TDI ladder: pa ern inenergy exporting developing and transition economies
32 For further information see h p://r0.unctad.org/ldcs/LDCs/index.html.
33 The 11 countries are included only if their value of energy exports (The Standard International Trade
Classifi cation Revision 3), Chapter 3 for Mineral fuel/lubricants which includes coal, petroleum, gas, and
electric current) is $10 billion or more on an average for the period 2003–2005. There are 24 countries in
the list, including (in descending order of value of energy exports) Saudi Arabia, the Russian Federation,
Canada, Norway, the Islamic Republic of Iran, the Bolivarian Republic of Venezuela, the United Kingdom,
the Netherlands, Mexico, the United Arab Emirates, Singapore, the United States, Australia, Algeria, Belgium,
Indonesia, Qatar, Germany, Malaysia, China, Kazakhstan, France, Oman and the Republic of Korea.
-20 -10 0 10 20 30 40 50
Malaysia (9)
Russian Federation (2)
Venezuela,Bolivarian Rep. of (4)
Korea, Rep. of (11)
Indonesia (8)
United Arab Emirates (6)
Mexico (5)
Saudi Arabia (1)
Algeria (7)
Oman (10)
Iran, Islamic Rep. of (3)
2005-2006 TDI 2005-2006 OutcomeMI 2005-2006 InputMI
Note: 2005–2006: change in indices scores from 2005. The numbers in parentheses following the country indicate the rank-ing in terms of value of energy products.

Trade and Development Index
DE
VE
LO
PIN
G C
OU
NT
RIE
S IN
INT
ER
NA
TIO
NA
L T
RA
DE
20
07
Tr
ad
e a
nd
dev
elo
pm
en
t in
dex
25
TD
I
25
Seven countries with improved TDI scores had larger increases in OutcomeMI
than in InputMI; the exceptions were Mexico, the Republic of Korea and the Russian
Federation.
Figure 16. Climbing the TDI ladder:pa ern in commodity-dependent countries
The Bolivarian Republic of Venezuela registered a decline in InputMI and the Rus-
sian Federation a small drop in OutcomeMI. The decline in the TDI for Malaysia, which
nonetheless enjoys the highest rank among developing countries, is due to falls in both
InputMI and OutcomeMI. It should be noted that three E7 countries are included among
the energy exporters.
The TDI is also computed for commodity-dependent economies of the world.34
Here again, among the top 10 commodity-dependent countries, with the exception of
Jamaica, TDI scores are higher for 2006 than for 2005 (fi gure 16).
All seven emerging economies (E7) have shown a rise in TDI scores between 2005
and 2006 (fi gure 17). Improvements are also evident in both their InputMI and Out-
comeMI, except for Russian Federation and South Africa. Among E7 countries, China
has achieved the highest increase in its TDI, followed by India, but the increases are also
substantial for the other members of this group, except for the Russian Federation and
the Republic of Korea.
There are 10 countries in South-Eastern Europe and the Commonwealth of Inde-
pendent States groupings, including the Russian Federation, but not discussed below as
was included in E7 countries. These countries are also classified as the countries with
economies in transition. Seven countries in this group have achieved positive improve-
ments in TDI scores as compared to 2005. Romania has the highest increase, followed by
Azerba an and Albania, among others (see Figure 18). However, Armenia and Georgia
34 Commodity dependence is defined as the share of top 3 exports of countries during the period of 1998-2000.
For further information, see UNCTAD 2004b.
-30 -20 -10 0 10 20 30 40 50
Jamaica
Paraguay
Ethiopia
Uganda
Guinea-Bissau
Burundi
Rwanda
Iceland
Central African Republic
Malawi
2005-2006 TDI 2005-2006 OutcomeMI 2005-2006 InputMI
Note: 2005–2006: change in indices scores from 2005.

26
DE
VE
LO
PIN
G C
OU
NT
RIE
S I
N I
NT
ER
NA
TIO
NA
L T
RA
DE
20
07
Tr
ad
e a
nd
dev
elo
pm
en
t i
nd
ex
TD
I
26
have registered a decline in TDI score compared to TDI 2005. Romania and Ukraine have
shown the highest improvements in InputMI scores, while Azerba an and Romania climb
up in OutcomeMI score. Belarus showed a decline in InputMI, while OutcomeMI scores
improved since 2005.
Figure 17. Climbing the TDI ladder: pa ern in E7 countries
-5 0 5 10 15 20 25 30 35 40
Russian Federation
Korea, Rep. of
Mexico
South Africa
Brazil
India
China
2005-2006 TDI 2005-2006 OutcomeMI 2005-2006 InputMI
Note: 2005–2006: change in indices scores from 2005.
-10 -5 0 5 10 15 20 25 30 35
Georgia
Armenia
Belarus
Bulgaria
Moldova
Ukraine
Albania
Azerbaijan
Romania
2005-2006 TDI 2005-2006 OutcomeMI 2005-2006 InputMI
Note: 2005–2006: change in indices scores from 2005. The Russian Federation is not included, as it has already been discussed in E7 country groupings.
Figure 18. Climbing the TDI ladder: pa ern incountries with economies in transition

Trade and Development Index
DE
VE
LO
PIN
G C
OU
NT
RIE
S IN
INT
ER
NA
TIO
NA
L T
RA
DE
20
07
Tr
ad
e a
nd
dev
elo
pm
en
t in
dex
27
TD
I
27
Therefore, the above analysis of TDI in twoperiods helps us to identify the improve-
ments of national scores, as well as InputMI and OutcomeMI. In this way, TDI provides
an in-depth look at the national level strength and weakness of structural, institutional
and policy aspects of countries, and their impact on trade and development.
3.6 TDI components and variability
A key result of the TDI 2006 analysis is that the countries with the best OutcomeMI
also tend to score uniformly highly at the level of individual components in InputMI.
Countries with the best scores in OutcomeMIdisplay a low variability of scores among the
11 components of InputMI. In other words, the observed tendency is that the variability
in the components of InputMI decreases with higher OutcomeMI scores. The highest
variability is found among countries with the bo om ten OutcomeMI. This relationship
is shown in fi gure 19. Therefore, the be er-performing countries indicate consistency of
input and outcome performances across all indicators.
Figure 19. OutcomeMI scores and input component variability in 2006
A policy implication of this relationship is that disproportionate emphasis on a
limited number of objectives such as trade liberalization is likely to yield only marginal
results. At a national level, countries need to follow an e ective and coherent framework
that allowsdesigning successful strategies for trade anddevelopment. Moreover, a country
could emphasize simultaneously the di erent individual input components of TDI with
the aim of reducing variation among them. In other words, for trade and development
success, countries need to address multiple development goals within a coherent overall
national trade and development strategy.
0.0
0.2
0.4
0.6
0.8
1.0
1.2
0
100
200
300
400
500
600
700
800
900
1000Variability in input components 2006 OutcomeMI
Co
eff
icie
nt
of
Vari
ati
on
Ou
tco
meM
I S
co
re
Note: See appendix 5.


Trade and Development Index
DE
VE
LO
PIN
G C
OU
NT
RIE
S IN
INT
ER
NA
TIO
NA
L T
RA
DE
20
07
Tr
ad
e a
nd
dev
elo
pm
en
t in
dex
29
TD
I
29
REFERENCES
Acemoglu D and Johnson S (2003). Unbundling institutions. NBER Working Paper No.
9934. Washington, DC.
Acemoglu D, Johnson S and Robinson JA (2004). Institutions as the fundamental cause
of long-run growth. CEPR Discussion Paper No. 4458.
Anand S and Sen A (1993). Human development index methodology andmeasurement.
Human Development Report O ce Occasional Paper No. 12. New York, UNDP.
Anand S and Sen A (1995). Gender inequality in human development theories and
measurement. Human Development Report O ce Occasional Paper No. 19. New
York, UNDP.
Basu SR (2003). Measuring economic well-being and governance: some methodological
tools, in Simos TE (ed), Proceedings of the International Conference of Computational Methods in Sciences and Engineering 2003 (ICCMSE 2003). World Scientifi c, New
Jersey.
Basu SR (2007a). A new way to link development to institutions, policies and geography.
Policy Issues in International Trade and Commodities. UNCTAD, New York and Geneva,
forthcoming.
Basu SR (2007b). The E7 in international trade: dynamism and cooperation. Paper
presented at the Project LINK International Meeting, May 14-17, 2007, Chinese
Academy of Social Sciences, Be ing, China.
Beck TA, Demirgu K and Levine R (2004). Finance inequality and poverty cross-country
evidence. NBER Working Paper No. 10979. Washington, DC.
Bloom D and Canning D, and Sevilla J (2001). The e ect of health on economic growth
theory and evidence. NBER Working Paper No 8587. Washington, DC.
Bora B, Kuwahara H and Laird S (2002). Quantifi cation of non-tari measures. PolicyIssues in International Trade and Commodities, Study Series No. 18. UNCTAD/ITCD/
TAB/19. New York and Geneva.
Cernat L, Laird S and Turrini A (2003). Back to basics: market access issues in the Doha
agenda. UNCTAD/DITC/TAB/Misc.9. New York and Geneva
Fernandez de Cordoba S, Laird S and Vanze i D (2004). Trick or treat? Development
opportunities and challenges in the WTO negotiations on industrial tari s. Credit
Research Paper, University of No hingham.
Fan S. and X. Zhang (2004). Infrastructure and regional economic development in rural
China,’ China Economic Review, 15: 203-214.
Fugazza M (2004). Export performance and its determinants supply and demand
constraints. Policy Issues in International Trade and Commodities, Study Series No.26.
UNCTAD/ITCD/TAB/27. New York and Geneva.
Fugazza M and Robert-Nicoud F (2006). Can South-South trade liberalization stimulate
North-South trade? Journal of Economic Integration 21 (2): 234-253.

30
DE
VE
LO
PIN
G C
OU
NT
RIE
S I
N I
NT
ER
NA
TIO
NA
L T
RA
DE
20
07
Tr
ad
e a
nd
dev
elo
pm
en
t i
nd
ex
TD
I
30
Fugazza M and Maur J-C (2006). Non-tari barriers in a non-tari world (unpublished
manuscript).
Fugazza M and Vanze i D (2007). A South-South survival strategy: the potential for trade
among developing countries. The World Economy (forthcoming).
IEA (2004). World Energy Outlook. International Energy Agency, Paris.
Kaufmann D, Kraay A and Mastruzzi M (2007). Governance Ma ers VI: Governance
Indicators for 1996-2006. World Bank Policy Research Working Paper No. 4280,
World Bank, Washington, DC.
Kee HL, Nicita A and Olarreaga M (2005). Estimating trade restrictiveness indices. The
World Bank research paper presented at the NTBs Expert Meeting, UNCTAD,
Geneva.
Krueger AB and Lindahl M (2001). Education for Growth: why and for whom? NBER
Working Paper No 7591. Washington, DC.
Krugman P (1998). The role of geography in development. Proceedings of World Bank
Annual Conference on Development Economics, World Bank, Washington, D.C.
Levine R (1997). Financial development and economic growth. Journal of Economic Literature, 35: 688-726.
Limão N and Venables T (2001). Infrastructure Geographical Disadvantage Transport
Costs and Trade. World Bank Economic Review, 53: 451-479.
Mauro P (1995). Corruption and Growth. Quarterly Journal of Economics, 109: 681-712.
Nagar AL and Basu SR (2002). Weighting socio-economic indicators of human
development: a latent variable approach, in Ullah A et al. (eds.) Handbook of Applied Econometrics and Statistical Inference. Marcel Dekker, New York.
Nagar AL and Basu SR (2004a). Infrastructure development index: an analysis for 17
major Indian States 1990–91 to 1996–97. Journal of Combinatorics, Information and System Sciences, 27(1-4): 185-203.
Nagar AL and Basu SR (2004b). Statistical properties of a composite index as estimate of
a single latent variable. Journal of Quantitative Economics, Special Issue; 2(2): 19–27.
North DC (1990). Institutions: Institutional Change and Economic Performance. Cambridge,
Cambridge University Press.
North DC (1994). Institutions ma er. Economics Working Paper Archive, Washington
University in St. Louis.
Redding S and Venables A (2003). Geography and export performance external market
access and internal supply capacity. NBER Working Paper No. 9637. Washington,
DC.
Rodrik D, Subramanian A and Trebbi F (2004). Institutions Rule the primacy of institutions
over geography and integration in economic development. Journal of Economic Growth, 9(2): 131–165.
Sachs JD (2003). Institutions don’t rule direct e ects of geography on per capita income.
NBER Working Paper No. 9490. Washington, DC.

Trade and Development Index
DE
VE
LO
PIN
G C
OU
NT
RIE
S IN
INT
ER
NA
TIO
NA
L T
RA
DE
20
07
Tr
ad
e a
nd
dev
elo
pm
en
t in
dex
31
TD
I
31
Sen A (1976). Real national income. Review of Economic Studies, 43: 19–39.
United Nations (2006). World Economic and Social Prospects, DESA, New York.
UNCTAD (2002). Trade and Development Report 2002. UNCTAD, Geneva.
UNCTAD (2003). World Investment Report. UNCTAD, Geneva.
UNCTAD (2004a). E-commerce and Development Report. UNCTAD, Geneva.
UNCTAD (2004b). Commodity Atlas. UNCTAD, Geneva.
UNCTAD (2005). Expert meeting on methodologies classifi cations quantifi cation and
development impacts of non-tari barriers. Geneva 5–7 September TD/B/COM1/
EM27/2.
UNCTAD (2006a). Tenth session of the Commission on Trade in Goods and Services, and
Commodities. 6 February.
UNCTAD (2006b). Trade and Development Report 2006. UNCTAD, Geneva.
UNCTAD (2006c). Least Development Countries Report 2006. UNCTAD, Geneva.
UNCTAD (2007a). Report of the Secretary-General of UNCTAD to UNCTAD XII,
Globalization for development: Opportunities and challenges, TD/413, 4 July.
UNCTAD (2007b). Expert Meeting on Participation of Developing Countries in New and
Dynamic Sectors of World Trade: the South-South Dimension. 16–17 October TD/B/
COM.1/EM.34/2, and TD/B/COM.1/EM.34/2/Add.1.
UNDP (various years). Human Development Report. New York, Oxford University Press.
UNEP (various years). Annual Report. Geneva.
World Bank (various years). World Development Report. Oxford University Press.


33
DE
VE
LO
PIN
G C
OU
NT
RIE
S IN
INT
ER
NA
TIO
NA
L T
RA
DE
20
07
Tr
ad
e a
nd
dev
elo
pm
en
t in
dex
AP
PE
ND
IX1
TDI rank 2006
Country Country code
Region Group
1 United States USA North America Developed Countries
2 Germany DEU Western Europe European Union Countries (EU15)
3 Denmark DNK Western Europe European Union Countries (EU15)
4 United Kingdom GBR Western Europe European Union Countries (EU15)
5 Singapore SGP East Asia and Pacifi c Developing Countries
6 Japan JPN East Asia and Pacifi c Developed Countries
6 Sweden SWE Western Europe European Union Countries (EU15)
8 France FRA Western Europe European Union Countries (EU15)
8 Norway NOR Western Europe European Union Countries (EU15)
10 Canada CAN North America Developed Countries
10 Switzerland CHE Western Europe Developed Countries
12 Belgium BEL Western Europe European Union Countries (EU15)
12 Iceland ISL Western Europe European Union Countries (EU15)
14 Finland FIN Western Europe European Union Countries (EU15)
15 Ireland IRL Western Europe European Union Countries (EU15)
16 Australia AUS East Asia and Pacifi c Developed Countries
17 Austria AUT Western Europe European Union Countries (EU15)
18 New Zealand NZL East Asia and Pacifi c Developed Countries
19 Spain ESP Western Europe European Union Countries (EU15)
20 Israel ISR Middle East and North Africa Developed Countries
21 Italy ITA Western Europe European Union Countries (EU15)
21 Republic of Korea KOR East Asia and Pacifi c Seven Emerging Economies (E7)
23 Portugal PRT Western Europe European Union Countries (EU15)
24 Slovenia SVN Europe and Central Asia European Union Countries (EU10)
25 China CHN East Asia and Pacifi c Seven Emerging Economies (E7)
26 Czech Republic CZE Europe and Central Asia European Union Countries (EU10)
27 Malaysia MYS East Asia and Pacifi c Developing Countries
28 Greece GRC Western Europe European Union Countries (EU15)
29 Thailand THA East Asia and Pacifi c Developing Countries
29 Malta MLT Middle East and North Africa European Union Countries (EU10)
31 Hungary HUN Europe and Central Asia European Union Countries (EU10)
Appendix 1. List of countries in the TDI 2006 sample
.../...

34
DE
VE
LO
PIN
G C
OU
NT
RIE
S I
N I
NT
ER
NA
TIO
NA
L T
RA
DE
20
07
Tr
ad
e a
nd
dev
elo
pm
en
t i
nd
ex
AP
PE
ND
IX1
TDI rank 2006
Country Country code
Region Group
32 Poland POL Europe and Central Asia European Union Countries (EU10)
33 Estonia EST Europe and Central Asia European Union Countries (EU10)
34 Slovakia SVK Europe and Central Asia European Union Countries (EU10)
35 Lithuania LTU Europe and Central Asia European Union Countries (EU10)
37 Chile CHL Latin America and Caribbean Developing Countries
37 Panama PAN Latin America and Caribbean Developing Countries
37 Ukraine UKR Europe and Central Asia South-Eastern Europe and Commonwealth of Independent States
39 Kuwait KWT Middle East and North Africa Developing Countries
39 United Arab Emirates ARE Middle East and North Africa Developing Countries
41 Bulgaria BGR Europe and Central Asia South-Eastern Europe and Commonwealth of Independent States*
42 Latvia LVA Europe and Central Asia European Union Countries (EU10)
43 Bahrain BHR Middle East and North Africa Developing Countries
44 Costa Rica CRI Latin America and Caribbean Developing Countries
44 Viet Nam VNM East Asia and Pacifi c Developing Countries
46 Albania ALB Europe and Central Asia South-Eastern Europe and Commonwealth of Independent States
47 Mexico MEX Latin America and Caribbean Seven Emerging Economies (E7)
47 South Africa ZAF Sub-Saharan Africa Seven Emerging Economies (E7)
49 Bolivia BOL Latin America and Caribbean Developing Countries
50 Mauritius MUS Sub-Saharan Africa Developing Countries
50 Azerbaijan AZE Europe and Central Asia South-Eastern Europe and Commonwealth of Independent States
52 Colombia COL Latin America and Caribbean Developing Countries
54 Argentina ARG Latin America and Caribbean Developing Countries
54 Brazil BRA Latin America and Caribbean Seven Emerging Economies (E7)
54 Romania ROM Europe and Central Asia South-Eastern Europe and Commonwealth of Independent States*
56 Armenia ARM Europe and Central Asia South-Eastern Europe and Commonwealth of Independent States
57 Belarus BLR Europe and Central Asia South-Eastern Europe and Commonwealth of Independent States
58 Uruguay URY Latin America and Caribbean Developing Countries
58 Russian Federation RUS Europe and Central Asia Seven Emerging Economies (E7)
60 Jordan JOR Middle East and North Africa Developing Countries
.../...
Appendix 1. List of countries in the TDI 2006 sample (continued)

35
DE
VE
LO
PIN
G C
OU
NT
RIE
S IN
INT
ER
NA
TIO
NA
L T
RA
DE
20
07
Tr
ad
e a
nd
dev
elo
pm
en
t in
dex
AP
PE
ND
IX1
TDI rank 2006
Country Country code
Region Group
60 Sri Lanka LKA South Asia Developing Countries
62 Georgia GEO Europe and Central Asia South-Eastern Europe and Commonwealth of Independent States
63 Peru PER Latin America and Caribbean Developing Countries
63 Philippines PHL East Asia and Pacifi c Developing Countries
65 Moldova MDA Europe and Central Asia South-Eastern Europe and Commonwealth of Independent States
66 Indonesia IDN East Asia and Pacifi c Developing Countries
67 Guyana GUY Latin America and Caribbean Developing Countries
68 El Salvador SLV Latin America and Caribbean Developing Countries
68 Honduras HND Latin America and Caribbean Developing Countries
70 Ecuador ECU Latin America and Caribbean Developing Countries
71 Saudi Arabia SAU Middle East and North Africa Developing Countries
72 Tunisia TUN Middle East and North Africa Developing Countries
73 Oman OMN Middle East and North Africa Developing Countries
73 Turkey TUR Europe and Central Asia Developing Countries
75 Cambodia KHM East Asia and Pacifi c Least Developed Countries
76 Jamaica JAM Latin America and Caribbean Developing Countries
76 Madagascar MDG Sub-Saharan Africa Least Developed Countries
78 Uganda UGA Sub-Saharan Africa Least Developed Countries
79 Dominican Republic DOM Latin America and Caribbean Developing Countries
79 Nicaragua NIC Latin America and Caribbean Developing Countries
81 Kenya KEN Sub-Saharan Africa Developing Countries
82 Paraguay PRY Latin America and Caribbean Developing Countries
83 Algeria DZA Middle East and North Africa Developing Countries
83 United Republic of Tanzania TZA Sub-Saharan Africa Least Developed Countries
85 Botswana BWA Sub-Saharan Africa Developing Countries
86 Lebanon LBN Middle East and North Africa Developing Countries
86 India IND South Asia Seven Emerging Economies (E7)
89 Lesotho LSO Sub-Saharan Africa Developing Countries
89 Bolivarian Republic ofVenezuela
VEN Latin America and Caribbean Developing Countries
89 Papua New Guinea PNG East Asia and Pacifi c Least Developed Countries
91 Senegal SEN Sub-Saharan Africa Least Developed Countries
92 Rwanda RWA Sub-Saharan Africa Least Developed Countries
93 Guatemala GTM Latin America and Caribbean Developing Countries
93 Islamic Republic of Iran IRN Middle East and North Africa Developing Countries
95 Morocco MAR Middle East and North Africa Developing Countries
96 Chad GHA Sub-Saharan Africa Developing Countries
97 Egypt EGY Middle East and North Africa Developing Countries
97 Malawi MWI Sub-Saharan Africa Least Developed Countries
99 Mozambique MOZ Sub-Saharan Africa Least Developed Countries
100 Togo TGO Sub-Saharan Africa Least Developed Countries
101 Mali MLI Sub-Saharan Africa Least Developed Countries
Appendix 1. List of countries in the TDI 2006 sample (continued)
.../...

36
DE
VE
LO
PIN
G C
OU
NT
RIE
S I
N I
NT
ER
NA
TIO
NA
L T
RA
DE
20
07
Tr
ad
e a
nd
dev
elo
pm
en
t i
nd
ex
AP
PE
ND
IX1
TDI rank 2006
Country Country code
Region Group
102 Bangladesh BGD South Asia Least Developed Countries
103 Pakistan PAK South Asia Developing Countries
103 Zimbabwe ZWE Sub-Saharan Africa Developing Countries
105 Syrian Arab Republic SYR Middle East and North Africa Developing Countries
105 Chad TCD Sub-Saharan Africa Least Developed Countries
107 Côte d’Ivoire CIV Sub-Saharan Africa Developing Countries
107 Mauritania MRT Sub-Saharan Africa Least Developed Countries
109 Burkina Faso BFA Sub-Saharan Africa Least Developed Countries
110 Benin BEN Sub-Saharan Africa Least Developed Countries
111 Burundi BDI Sub-Saharan Africa Least Developed Countries
112 Central African Republic CAF Sub-Saharan Africa Least Developed Countries
112 Zambia ZMB Sub-Saharan Africa Least Developed Countries
114 Ethiopia ETH Sub-Saharan Africa Least Developed Countries
115 Cameroon CMR Sub-Saharan Africa Developing Countries
116 Guinea GIN Sub-Saharan Africa Least Developed Countries
117 Yemen YEM Middle East and North Africa Least Developed Countries
118 Angola AGO Sub-Saharan Africa Developing Countries
118 Democratic Republic of the Congo
ZAR Sub-Saharan Africa Least Developed Countries
120 Niger NER Sub-Saharan Africa Least Developed Countries
121 Nigeria NGA Sub-Saharan Africa Developing Countries
122 Guinea-Bissau GNB Sub-Saharan Africa Least Developed Countries
123 Sudan SDN Sub-Saharan Africa Least Developed Countries
Appendix 1. List of countries in the TDI 2006 sample (concluded)
Note: Regions are based on World Bank classifi cation, and groups (Developing Countries, South-Eastern Europe and Commonwealth of Independent States, Least Developed Countries) follow United Nations classifi cation.
- European Union Member States before 2004 are referred to as EU15.- European Union Member States that acceded in 2004 are referred to as EU10.- Seven Emerging Economies are referred to as E7.
* EU member since January 2007.
37
DE
VE
LO
PIN
G C
OU
NT
RIE
S IN
INT
ER
NA
TIO
NA
L T
RA
DE
20
07
Tr
ad
e a
nd
dev
elo
pm
en
t in
dex
AP
PE
ND
IX2
Appendix 2. Computational approach
A. Rationale
As discussed in DCIT-TDI 2005, a computational approach that could account for interactions
among the constituent components of TDI was adopted. For this purpose, the methodology used in
Nagar-Basu (2002) was selected to compute a composite index based on principal component analysis.35
The TDI is the sum of two indices, which are in turn weighted sums of components, whose respective
weights are estimated by the multivariate statistical technique of principal components analysis (PCA).
Components are estimated through a PCA of normalized versions of the variables or indicators assumed
to determine them.
The rationale for use of the PCA technique is that interactions and interdependence between the
set of indicators selected as determinants of TDI can be taken into account. These indicators are chosen
based on thorough theoretical and empirical scrutiny designed to capture the di erent processes under-
lying the TDI. Use of PCA also permits identifi cation of the drivers of TDI.36
Themethod of principal components was originated by Karl Pearson and Harold Hotelling to rep-
resent the correlation structure of a set of variables, and was pioneered by Richard Stone as a technique
formeasuring relationships among interdependent economic variables. The first step of themethod is to
assume that the index which is the object of the exercise, in this case TDI, is a conceptual/latent variable
linearly dependent on a set of observable indicators or regressors, Xj,plus a disturbance term capturing
error, e. Thus:
Index = + 1X
1+ ......... +
KX
K+ e (1)
where X1,X
2,...... X
Kis a set of indicators that are assumed to determine index.
The problem with estimating the coe cients of these equations through conventional regression
analysis is that thejmaynotbe properly defined or may be unstable as estimates of the infl uence of the
Xjon Index owing to interdependence in the form of signifi cant mutual correlations. The principal com-
ponents, Pj , are estimated as a new set of variables through linear transformations of the X
j ,derived in
such a way as to get around this problem. The Pj so generated are orthogonal and thus uncorrelated. The
linear transformation is also chosen in such a way that, subject to a constraint on the coe cients deter-
mining the relationship to the Xj, P
1accounts for themaximum variance in the X
j. P
2is derived similarly,
i.e. in such a way as to account for the maximum remaining variance of the Xjsubject to the condition
that it is also orthogonal to and thus uncorrelated with P1, And so on for the remaining P
j.
B. Normalization, reference values and estimation
An important element in the adopted methodology is the use of absolute reference values in the
normalization procedure for components. This procedure uses maximum and minimum values of each
indicator as reference values. Changes across periods in such indicators would otherwise make com-
parison of TDI scores somewhat hazardous. As one objective of TDI is to monitor the evolution the TDI
and components of each country in the sample, the reference values were fixed. Some were fixed using
reasonable values. For instance, in the case where shares are considered reasonable values, theminimum
value is taken to be zero and the maximum 100 per cent. In some cases, shares go beyond 100 per cent,
as, for example, in the case of the share of trade in GDP for small open economies. In that case and in
any other case where extreme values could not be given any reasonable value, reference values were
set proportionally to values observed in the first period. A proportionality coe cient equal to 1.5 was
35 See also Basu (2003) for further discussion.
36 An alternative computational approachmight have been factor analysis. However, this is less flexible for analysing the roles of
the di erent variables determining relations between trade and development. This is because of its dependence on the positing
of dependent and independent variables and the importance a ributed to interlinkages in the choice of determinants rather
than to prior conceptual considerations and empirical analysis.
38
DE
VE
LO
PIN
G C
OU
NT
RIE
S I
N I
NT
ER
NA
TIO
NA
L T
RA
DE
20
07
Tr
ad
e a
nd
dev
elo
pm
en
t i
nd
ex
AP
PE
ND
IX2
adopted. Sensitivity analysis shows that TDI results obtained withdi erent proportionality coe cients are
strongly correlated, so that the choice of a specifi c coe cient has a negligible infl uence on estimates.
The Pjthemselves are normalized by subtracting the minimum value of the particular value from
its actual value and dividing it by the range, which is the di erence between themaximumandminimum
value of the selected indicators. So, for component i for a country j:
C =(actual value –minimum valueik)/(maximum value
ik-minimum value
ik) (2)
where j and k are indices referring to countries j and k.
When necessary, the raw data have been transformed in such a way that normalized values equal
to unity correspond to the best situation in the sample.
The variances of the Pjare equal to the variances of the X
k for which they are estimated to account,
with the result that the Pjpartition the total variance of the X
k. These variances can be shown to be equal
to the eigenvalues of the correlation matrix of the original regressors. If these eigenvalues are denoted
k, the weights in the expression for TDI are the shares of the variances of the P
jin the total variance of
X1, X
2...X
K. . Thus:
Indexi = (
1P
1 + 2P
2......+
KP
k)/(
1+
2 + ......
K ), where i refers to country i (3).
From the point of view of analysis of the drivers of TDI, the technique of PCA has the advantage
that the process generating the principal components can be reversed. Thus, the linear transformation
in the form of the matrix consisting of the coe cients of the Pjwith respect to the X
k can be inverted to
generate the values of the original indicators or regressors corresponding to the values of the principal
components. It thus becomes possible to conduct an analysis of the infl uence of these indicators or re-
gressors on the TDI.
C. Comparability of samples and estimates
The weights are a ributed to the two indices of TDI components, InputMI and OutcomeMI, based
on the statistical procedure used to estimate them. Since the weights are obtained from cross-section data,
they may vary from year to year for the same sample of countries or from sample to sample for the same
period. Increased country coverage is by definition an improvement. Marginal increases are unlikely
to create any major problem for comparability. However, substantial increases would necessitate a re-
computation of weights and of the whole index series. Country coverage has increased dramatically since
the first version of TDI 2005 in DCIT-TDI 2005, from 110 countries to 123 countries. It is unlikely, consider-
ing current data availability, that the sample size could be further increased in the immediate future by
a similar proportion, though the fi gure of 150 countries may be a ainable over a longer period.
The most important source of incomparability is the systemic statistical properties of TDI compo-
nents that a ect the weighting. To avoid such incomparability, weights obtained in the first period – i.e.
for InputMI 2005 and OutputMI 2005 – are assumed to be the reference weights and are applied to all
successive periods. Adoption of such a restrictive assumption is motivated by the possibility of compar-
ing TDI scores across years. Thus, TDI 2006 is computed using weights computed for TDI 2005. We also
computed TDI 2006 using 2006 weights. We observe that the two results for TDI 2006 are strongly cor-
related, the coe cient of correlation being 0.987, which implies stability in statistical properties of the
set of components. Nevertheless, in order to check the statistical coherence of weights, similar sensitivity
analysis will be repeated for every future exercise.
The average weight is 9 per cent. The largest weight is obtained for the internationalfinance compo-
nent and is slightlymore than 15 per cent. The smallest weight, obtained for environmental sustainability,
is slightly more than 2 per cent. Weights reflect the systemic statistical properties of TDI components,
higher weights being observed for components that are the most related to other components.37
37 See Nagar and Basu (2004b) for discussion of the statistical properties of a composite index as estimate of a single latent vari-
able.

39
DE
VE
LO
PIN
G C
OU
NT
RIE
S IN
INT
ER
NA
TIO
NA
L T
RA
DE
20
07
Tr
ad
e a
nd
dev
elo
pm
en
t in
dex
AP
PE
ND
IX2
Fixing reference values in the normalization of components (described earlier) and the components’
weights allows full comparability of TDI scores for the same sample of countries acrossperiods. As weights
are normalized to obtain unity when summing them up, the maximum absolute InputMI, OutputMI
and TDI score is 1,000, and the minimum score is zero. Maximum values could also be interpreted as
weights. Indeed, as the unweighted component maximum value is 1,000, the weighted maximum value
is simply equal to the weights a ributed to each component times its unweighted maximum value. The
weights of each of the InputMI and OutputMI components are the following:
Figure A1. Weights for InputMI and OutcomeMI
The major advantage of comparability is that it makes it possible to disentangle the relative from
the absolute increases or decreases in scores for a specifi c country or group of countries. Changes in TDI
scores across periods indicate the absolute evolution in performance, and changes in TDI rank across
periods indicate relative evolution. The same type of analysis can be applied to InputMI and OutputMI
scores. It is then straightforward to identify the components that are driving changes in the index for
each country or group of countries. A higher value of the TDI reflects an improvement in the relation-
ship between structural, institutional and trade policies with trade and development performance; lower
value indicates a deterioration of the relationship and thus in ranking. Moreover, an increase (decrease)
in TDI score through time indicates an improvement (decline) in trade and development performances
compared with the base year of 2005.
0
2
4
6
8
10
12
14
16
Human Physicalinfrastructure
Financialintermediation
Domestic Internationalfinance
Institutional Economic Macroeconomicstability
Environmentalsustainability
Openness Market access,foreignfinance quality structure to tradecapital
0
10
20
30
40
50
60
70
Trade Economic andperformance social well-being
Wei
ghts
Wei
ghts

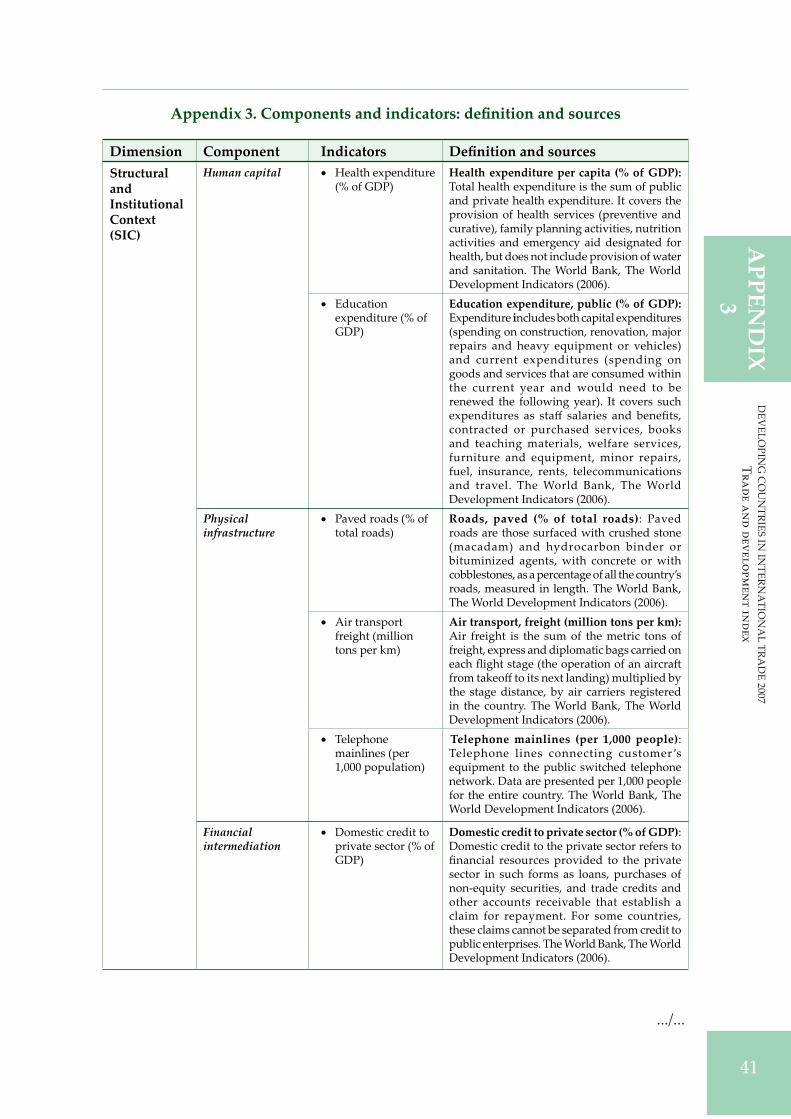
41
DE
VE
LO
PIN
G C
OU
NT
RIE
S IN
INT
ER
NA
TIO
NA
L T
RA
DE
20
07
Tr
ad
e a
nd
dev
elo
pm
en
t in
dex
AP
PE
ND
IX3
Appendix 3. Components and indicators: defi nition and sources
Dimension Component Indicators Defi nition and sources
StructuralandInstitutionalContext(SIC)
Human capital Health expenditure
(% of GDP)
Health expenditure per capita (% of GDP):Total health expenditure is the sum of public
and private health expenditure. It covers the
provision of health services (preventive and
curative), family planning activities, nutrition
activities and emergency aid designated for
health, but does not include provision of water
and sanitation. The World Bank, The World
Development Indicators (2006).
Education
expenditure (% of
GDP)
Education expenditure, public (% of GDP): Expenditure includes both capital expenditures
(spending on construction, renovation, major
repairs and heavy equipment or vehicles)
and current expenditures (spending on
goods and services that are consumed within
the current year and would need to be
renewed the following year). It covers such
expenditures as sta salaries and benefits,
contracted or purchased services, books
and teaching materials, welfare services,
furniture and equipment, minor repairs,
fuel, insurance, rents, telecommunications
and travel. The World Bank, The World
Development Indicators (2006).
Physicalinfrastructure
Paved roads (% of
total roads)
Roads, paved (% of total roads): Paved
roads are those surfaced with crushed stone
(macadam) and hydrocarbon binder or
bituminized agents, with concrete or with
cobblestones,asapercentageofall the country’s
roads, measured in length. The World Bank,
The World Development Indicators (2006).
Air transport
freight (million
tons per km)
Air transport, freight (million tons per km):Air freight is the sum of the metric tons of
freight, express anddiplomatic bags carried on
each flight stage (the operation of an aircra
from takeo to its next landing) multiplied by
the stage distance, by air carriers registered
in the country. The World Bank, The World
Development Indicators (2006).
Telephone
mainlines (per
1,000 population)
Telephone mainlines (per 1,000 people):Telephone lines connecting customer ’s
equipment to the public switched telephone
network. Data are presented per 1,000 people
for the entire country. The World Bank, The
World Development Indicators (2006).
Financialintermediation
Domestic credit to
private sector (% of
GDP)
Domestic credit to private sector (% of GDP):Domestic credit to the private sector refers to
financial resources provided to the private
sector in such forms as loans, purchases of
non-equity securities, and trade credits and
other accounts receivable that establish a
claim for repayment. For some countries,
these claims cannot be separated from credit to
public enterprises. The World Bank, The World
Development Indicators (2006).
.../...

42
DE
VE
LO
PIN
G C
OU
NT
RIE
S I
N I
NT
ER
NA
TIO
NA
L T
RA
DE
20
07
Tr
ad
e a
nd
dev
elo
pm
en
t i
nd
ex
AP
PE
ND
IX3
Dimension Component Indicators Defi nition and sources
Domestic fi nance Gross domestic
savings (% of GDP)
Gross domestic savings (% of GDP): Gross
domestic savings are calculated as GDP
less final consumption expenditure (total
consumption). The World Bank, The World
Development Indicators (2006).
Internationalfi nance
Total external debt
service (% of GNI)
Total external debt service (% of GNI):
Total debt service is the sum of principal
repayments and interest actually paid in
foreign currency, goods or services on long-
term debt, interest paid on short-term debt,
and repayments (repurchases and charges)
to the IMF. The World Bank, The World
Development Indicators (2006).
Short-term debt
(% of total external
debt)
Short-term debt (% of total external debt):Short-term debt includes all debt having
an original maturity of one year or less
and interest in arrears on long-term debt.
The World Bank, The World Development
Indicators (2006).
Institutionalquality
Regulatory quality Regulatory quality (-2.5 to 2.5 scale, with higher score for be er outcomes): Regulatory
quality reflects government policies a ecting
business environment, including measures
of the presence of market-unfriendly policies
such as price controls or financial repression,
as well as perceptions of the burdens imposed
by excessive regulation in areas such as foreign
trade and business development. The World
Bank, The Governance Ma ers Index 2006.
Control of
corruption
Control of corruption (-2.5 to 2.5 scale, with higher score for be er outcomes): Control
of corruption is an aggregate measure of the
extent of corruption, conventionallydefined as
the exercise of public power for private gain.
This indicator, like the preceding rule of law
indicator, is based onperceptions of corruption
recorded in polls and surveys. The World
Bank, The Governance Ma ers Index 2006.
Economicstructure
Agricultural value
added (% of GDP)
Agricultural value added (% of GDP):Agriculture corresponds to International
Standard Industrial Classifi cationdivisions 1to
5 and includes forestry, hunting and fi shing,
as well as cultivation of crops and livestock
production. Value added is the net output
of a sector a er adding up all outputs and
subtracting intermediate inputs. It is calculated
withoutmakingdeductions for depreciation of
fabricated assets or depletion anddegradation
ofnatural resources. The origin of value added
is determined by the International Standard
Industrial Classifi cation, revision 3. The World
Bank, The World Development Indicators
(2006).
Appendix 3. Components and indicators: defi nition and sources (continued)
.../...

43
DE
VE
LO
PIN
G C
OU
NT
RIE
S IN
INT
ER
NA
TIO
NA
L T
RA
DE
20
07
Tr
ad
e a
nd
dev
elo
pm
en
t in
dex
AP
PE
ND
IX3
Dimension Component Indicators Defi nition and sources
Macroeconomicstability
Consumer price
index (annual %)
Consumer price index (annual %): Inflation as
measured by the consumer price index reflects
the annual percentage change in the cost to the
average consumer of acquiring a fixed basket
of goods and services that may be fixed or
changed at specified intervals, such as yearly.
The Laspeyres formula is generally used.
The World Bank, The World Development
Indicators (2006).
Current account
balance (% of GDP)
Current account balance (% of GDP): This is
the sum of net exports of goods and services,
net income (due to compensationof employees
and investment), and net current transfers.
The World Bank, The World Development
Indicators (2006).
Environmentalsustainability
Access to
improved water (%
of total population
with reasonable
access to water)
Water source (% of population with access):Access toan improved water sourcerefers to the
percentage of the population with reasonable
access to an adequate amount of water from
an improved source, such as a household
connection, public standpipe, borehole,
protected well or spring, and rainwater
collection. Unimproved sources include
vendors, tanker trucks, and unprotected wells
and springs. Reasonable access is defined as
the availability of at least 20 litres per person
per day from a source within one kilometre
of the dwelling. The World Bank, The World
Development Indicators (2006).
Access to
improved
sanitation (% of
total population
with adequate
access to excreta
disposal facilities)
Sanitation facilities (% of population with access): This refers to the percentage of the
population with at least adequate excreta
disposal facilities (private or shared, but not
public) that can e ectively prevent human,
animal and insect contact with excreta.
Improved facilities range from simple but
protected pit latrines to fl ush toilets with a
sewerage connection. To be e ective, facilities
must be correctly constructed and properly
maintained. The World Bank, The World
Development Indicators (2006).
GDP in PPP- terms
per unit of energy
use
Energy use: GDP per unit of energy use
is the PPP GDP per kilogram of the oil
equivalent of energy use. PPP GDP is gross
domestic product converted to 1995 constant
international dollars using purchasing power
parity rates. An international dollar has the
same purchasing power over GDP as a dollar
has in the United States. The World Bank, The
World Development Indicators (2006).
Trade policies and processes(TPP)
Openness to trade Applied trade-
weighted average
tari (%)
Weighted mean tari : Average of e ectively
applied rates weighted by the total imports
from trading partner countries. UNCTAD,
Trade Analyses and Information System
(TRAINS) database.
Appendix 3. Components and indicators: defi nition and sources (continued)
.../...

44
DE
VE
LO
PIN
G C
OU
NT
RIE
S I
N I
NT
ER
NA
TIO
NA
L T
RA
DE
20
07
Tr
ad
e a
nd
dev
elo
pm
en
t i
nd
ex
AP
PE
ND
IX3
Dimension Component Indicators Defi nition and sources
Share of lines with
national peaks (%)
Share of lines with international peaks: Share
of lines in the tari schedule with tari rates
that exceed 15 per cent. UNCTAD, TRAINS
database.
Share of lines
with international
peaks(%)
Share of lines with national peaks: Share
of lines in the tari schedule with tari rates
that exceed three times the average tariff.
UNCTAD, TRAINS database.
Share of lines with
specifi c tari s (%)
Share of lines with specifi c rates: Share of
lines in the tari schedule that are set on a per
unit basis or that combine ad valorem and per
unit rates. UNCTAD, TRAINS database.
Access to foreign market
Trade-weighted
average tari
applied on
exports in partner
countries(%)
Weighted mean tari : Average of e ectively
applied rates by trading partners weighted by
the total imports of trading partner countries.
UNCTAD, TRAINS database.
Share of lines
with national
peaks applied on
exports in partner
countries(%)
Share of lines with international peaks:
Share of lines in the tari schedule of trading
partners with tari rates that exceed 15 per
cent. UNCTAD, TRAINS database.
Share of lines
with international
peaks applied on
exports in partner
countries(%)
Share of lines with national peaks: Share of
lines in the tari schedule of trading partners
with tari rates that exceed three times the
average tari . UNCTAD, TRAINS database.
Share of lines
with specifi c
tari s applied on
exports in partner
countries (%)
Share of lines with specifi c rates: Share of
lines in the tari schedule of trading partners
that are set on a per unit basis or that combine
ad valorem and per unit rates. UNCTAD,
TRAINS database.
Trade and developmentperformance(TDP)
Trade Performance Merchandise
exports (% of
world merchandise
exports)
Merchandise exports (% of world): Total
merchandise exports as a share of total world
merchandise exports. UNCTAD Handbook
of Statistics.
Services exports (%
of world services
exports)
Service exports (% of world): Total service
exports as a share of total world service
exports. UNCTAD Handbook of Statistics.
Market
concentration
index for
merchandise
exports
Merchandise export concentration index (0 to 1 scale): For the degree of market
concentration, index value of 1 implies
maximum concentration. UNCTAD Handbook
of Statistics.
Total trade (exports
and imports) (% of
GDP)
Trade (% of GDP): Trade is the sumof exports
and importsof goods and servicesmeasured as
a share of gross domestic product. The World
Bank, The World Development Indicators
(2006).
Appendix 3. Components and indicators: defi nition and sources (continued)
.../...

45
DE
VE
LO
PIN
G C
OU
NT
RIE
S IN
INT
ER
NA
TIO
NA
L T
RA
DE
20
07
Tr
ad
e a
nd
dev
elo
pm
en
t in
dex
AP
PE
ND
IX3
Dimension Component Indicators Defi nition and sources
Economic and social well-being
Sen Welfare Index
(GDP per capita
(1-Gini index))
Sen Welfare Index: This index is defined as
GDP per capita multiplied by (1-Gini index).
The GDP per capita figure is based on a constant $2,000. The Gini index takes a value
of 0 to represent perfect equality, and a value
of 100 to represent perfect inequality. The
index is measured either based on income or
expenditure depending on di erent countries’
methods of data collection. The World Bank,
The World Development Indicators (2006)
for GDP per capita data, and UNDP, Human
Development Report for Gini index.
Adult literacy rate
(%)
Adult literacy rate (%): The percentage
of people aged 15 and above who can,
with understanding, both read and write
a short, simple statement related to their
everyday life. The World Bank, The World
Development Indicators (2006) and UNDP,
Human Development Report.
Life expectancy
(years)
Life expectancy at birth (years): The number
of years a newborn infant would live if
prevailing pa erns of age-specifi c mortality
rates at the time of birth were to stay the
same throughout the child’s life. The World
Development Indicators (2006) and UNDP,
Human Development Report.
Female-to-male
income ratio (%)
Female to male income share (%): This
indicator is computed by taking the ratio
of female-to-male estimated earned income
(PPP). UNDP, Human Development Report.
Female labour
force (% of total
labour force)
Female Labor force (% of total labor force):Female labour force as a percentage of the total
shows the extent to which women are active
in the labour force. Labour force comprises
all people who meet the International Labour
Organization’s definition of the economically
active population. The World Bank, The World
Development Indicators (2006).
Appendix 3. Components and indicators: defi nition and sources (concluded)

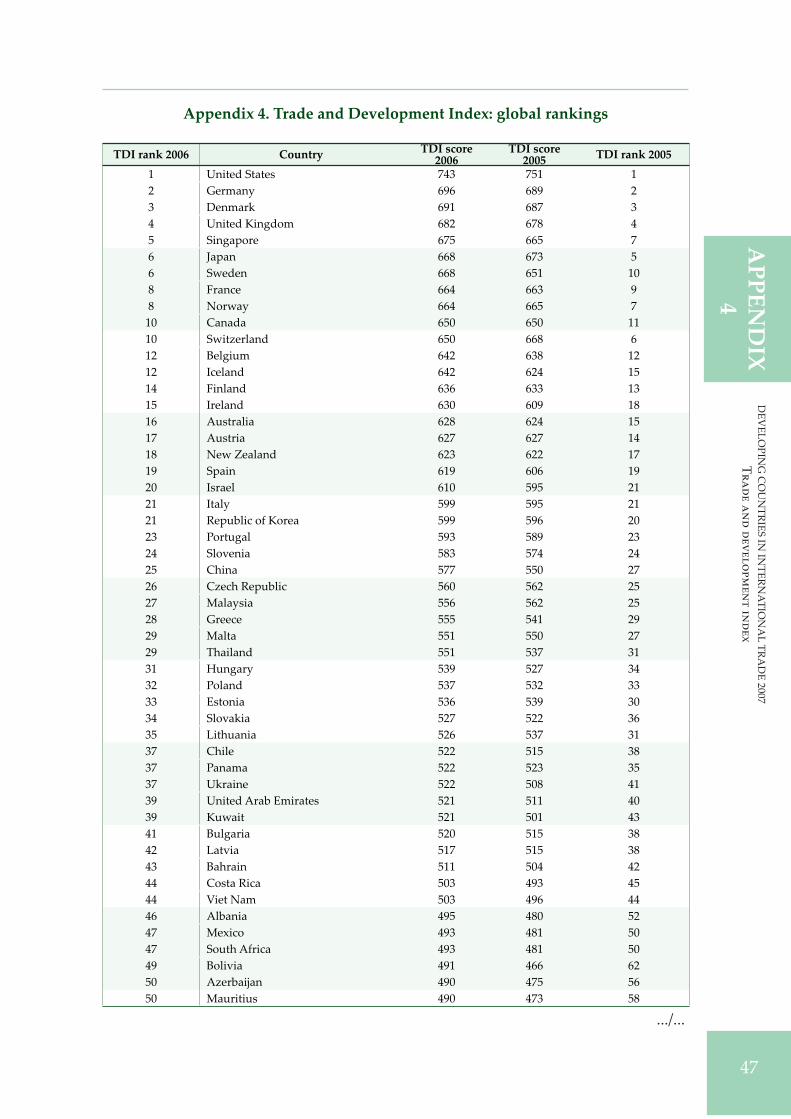
47
DE
VE
LO
PIN
G C
OU
NT
RIE
S IN
INT
ER
NA
TIO
NA
L T
RA
DE
20
07
Tr
ad
e a
nd
dev
elo
pm
en
t in
dex
AP
PE
ND
IX4
Appendix 4. Trade and Development Index: global rankings
TDI rank 2006 Country TDI score 2006
TDI score 2005 TDI rank 2005
1 United States 743 751 1
2 Germany 696 689 2
3 Denmark 691 687 3
4 United Kingdom 682 678 4
5 Singapore 675 665 7
6 Japan 668 673 5
6 Sweden 668 651 10
8 France 664 663 9
8 Norway 664 665 7
10 Canada 650 650 11
10 Switzerland 650 668 6
12 Belgium 642 638 12
12 Iceland 642 624 15
14 Finland 636 633 13
15 Ireland 630 609 18
16 Australia 628 624 15
17 Austria 627 627 14
18 New Zealand 623 622 17
19 Spain 619 606 19
20 Israel 610 595 21
21 Italy 599 595 21
21 Republic of Korea 599 596 20
23 Portugal 593 589 23
24 Slovenia 583 574 24
25 China 577 550 27
26 Czech Republic 560 562 25
27 Malaysia 556 562 25
28 Greece 555 541 29
29 Malta 551 550 27
29 Thailand 551 537 31
31 Hungary 539 527 34
32 Poland 537 532 33
33 Estonia 536 539 30
34 Slovakia 527 522 36
35 Lithuania 526 537 31
37 Chile 522 515 38
37 Panama 522 523 35
37 Ukraine 522 508 41
39 United Arab Emirates 521 511 40
39 Kuwait 521 501 43
41 Bulgaria 520 515 38
42 Latvia 517 515 38
43 Bahrain 511 504 42
44 Costa Rica 503 493 45
44 Viet Nam 503 496 44
46 Albania 495 480 52
47 Mexico 493 481 50
47 South Africa 493 481 50
49 Bolivia 491 466 62
50 Azerba an 490 475 56
50 Mauritius 490 473 58
.../...

48
DE
VE
LO
PIN
G C
OU
NT
RIE
S I
N I
NT
ER
NA
TIO
NA
L T
RA
DE
20
07
Tr
ad
e a
nd
dev
elo
pm
en
t i
nd
ex
AP
PE
ND
IX4
TDI rank 2006 Country TDI score 2006
TDI score 2005 TDI rank 2005
52 Colombia 488 478 53
54 Argentina 486 471 59
54 Brazil 486 469 60
54 Romania 486 464 65
56 Armenia 485 487 47
57 Belarus 484 483 48
58 Russian Federation 483 481 50
58 Uruguay 483 493 45
60 Jordan 478 469 60
60 Sri Lanka 478 477 55
62 Georgia 475 478 53
63 Peru 474 455 69
63 Philippines 474 475 56
65 Moldova 473 466 62
66 Indonesia 468 463 66
67 Guyana 465 457 67
68 Honduras 464 438 75
68 El Salvador 464 456 68
70 Ecuador 461 424 85
71 Saudi Arabia 459 442 73
72 Tunisia 455 436 78
73 Oman 453 426 84
73 Turkey 453 445 72
75 Cambodia 452 438 75
76 Jamaica 449 465 64
76 Madagascar 449 428 83
78 Uganda 446 435 79
79 Dominican Republic 443 433 81
79 Nicaragua 443 434 80
81 Kenya 441 449 71
82 Paraguay 440 438 75
83 Algeria 436 411 90
83 United Republic of Tanzania 436 421 86
85 Botswana 434 451 70
86 India 433 413 88
86 Lebanon 433 437 77
89 Lesotho 432 403 95
89 Papua New Guinea 432 418 87
89 Bolivarian Republic of Venezuela 432 430 82
91 Senegal 429 409 92
92 Rwanda 425 409 92
93 Guatemala 423 409 92
93 Islamic Republic of Iran 423 386 102
95 Morocco 420 406 94
96 Ghana 412 412 89
97 Egypt 407 399 98
97 Malawi 407 380 107
99 Mozambique 404 392 100
100 Togo 401 387 101
101 Mali 398 376 110
102 Bangladesh 397 400 96
Appendix 4. Trade and Development Index: global rankings (continued)
.../...

49
DE
VE
LO
PIN
G C
OU
NT
RIE
S IN
INT
ER
NA
TIO
NA
L T
RA
DE
20
07
Tr
ad
e a
nd
dev
elo
pm
en
t in
dex
AP
PE
ND
IX4
TDI rank 2006 Country TDI score 2006
TDI score 2005 TDI rank 2005
103 Pakistan 395 381 106
103 Zimbabwe 395 380 107
105 Syrian Arab Republic 392 400 96
105 Chad 392 354 118
107 Côte d’Ivoire 387 371 112
107 Mauritania 387 394 99
109 Burkina Faso 386 386 102
110 Benin 384 377 109
111 Burundi 382 367 113
112 Central African Republic 381 362 115
112 Zambia 381 383 104
114 Ethiopia 379 373 111
115 Cameroon 373 382 105
116 Guinea 372 365 114
117 Yemen 370 362 115
118 Angola 364 356 117
118 Democratic Republic of the Congo 364 324 122
120 Niger 362 349 119
121 Nigeria 350 334 120
122 Guinea-Bissau 339 327 121
123 Sudan 326 319 123
Note: TDI 2005 scores and rankings in DCIT-TDI 2005 are not comparable with TDI 2005 and TDI 2005
rank in DCIT-TDI 2007 of this appendix due to changes in composing indicators, computational approach
and country coverage.
Appendix 4. Trade and Development Index: global rankings (concluded)


51
DE
VE
LO
PIN
G C
OU
NT
RIE
S IN
INT
ER
NA
TIO
NA
L T
RA
DE
20
07
Tr
ad
e a
nd
dev
elo
pm
en
t in
dex
AP
PE
ND
IX5
Ap
pen
dix
5. T
DI,
dim
ensi
on
s, c
om
po
nen
ts a
nd
in
pu
t an
d o
utc
om
e m
easu
res
TD
IT
DI
Str
uct
ura
l an
d i
nst
itu
tio
nal
co
nte
xtra
nk
sco
reH
um
anP
hy
sica
lF
inan
cial
Do
mes
tic
Inte
rnat
ion
alIn
stit
uti
on
alE
con
om
icM
acro
eco
no
mic
En
vir
on
men
tal
2006
Co
un
try
2006
cap
ital
infr
astr
uct
ure
inte
rmed
iati
on
fi n
ance
fi n
ance
qu
alit
yst
ruct
ure
stab
ilit
ysu
stai
nab
ilit
y1
Un
ited
State
s7
43
42
74
10
84
41
45
94
66
85
18
2German
y6
96
46
74
51
54
14
59
46
68
81
6
3Denmark
69
15
35
17
05
91
45
10
16
51
00
15
4Un
ited
Kin
gdom
68
24
06
56
84
41
45
10
06
69
59
5S
ingapore
67
51
76
54
98
61
45
10
86
68
61
4
6Japan
66
83
46
44
55
91
45
81
66
94
17
6S
weden
66
85
23
44
75
61
45
10
26
58
21
8
8Norwa
y6
64
53
46
22
67
14
59
46
61
01
15
8Fran
ce
66
44
66
44
05
21
45
84
65
98
11
10
Canada
65
04
23
83
75
71
45
99
65
91
19
10
Sw
itzerland
65
04
24
07
16
11
45
10
06
68
51
6
12
Iceland
64
25
33
17
04
71
45
10
06
09
01
9
12
Belg
ium
64
24
24
03
35
61
45
87
66
90
13
14
Finland
63
64
03
43
05
81
45
10
76
48
81
9
15
Ireland
63
03
44
65
77
71
45
94
65
95
6
16
Au
stralia
62
83
83
44
55
41
45
97
64
89
18
17
Au
str
ia6
27
36
46
47
59
14
59
76
56
81
7
18
New
Zealand
62
34
43
65
35
51
45
10
16
09
11
3
19
Spain
61
93
44
65
35
81
45
90
64
94
9
20
Israel
61
04
74
84
14
21
45
80
65
93
17
21
Rep
ubli
co
f Korea
59
92
26
34
56
81
45
69
64
84
17
21
Italy
59
93
82
93
95
21
45
77
65
83
7
23
Portu
gal
59
34
22
16
74
71
45
87
64
83
9
24
Sloven
ia5
83
43
43
20
59
14
57
66
56
21
2
25
Ch
ina
57
71
55
35
57
71
00
50
58
96
13
26
Czech
Rep
ubli
c5
60
38
41
15
59
91
71
65
10
11
4
27
Mala
ysia
55
63
03
66
08
01
04
65
60
97
17
28
Greece
55
53
02
33
44
81
45
77
62
68
9
29
Tha
iland
55
12
03
84
56
61
02
59
60
10
11
7
29
Malta
55
14
24
34
94
51
45
71
64
87
15
31
Hun
gary
53
93
82
52
05
37
97
76
47
61
7
32
Poland
53
73
33
11
34
89
86
96
48
41
3
33
Eston
ia5
36
32
18
17
57
79
81
64
77
15
34
Slovak
ia
52
73
23
31
45
77
26
66
47
51
9
35
Lit
huan
ia5
26
36
16
10
47
80
69
62
90
14
37
Ch
ile
52
22
31
62
86
21
02
90
64
99
17
37
Panama
52
23
16
41
54
11
86
16
11
00
14
37
Ukra
ine
52
22
93
71
15
91
21
35
58
75
20
39
Un
ited
Ara
b Em
irate
s5
21
14
48
23
74
14
57
66
56
22
0
39
Ku
wa
it5
21
35
11
34
68
14
56
96
68
41
8
.../
...

52
DE
VE
LO
PIN
G C
OU
NT
RIE
S I
N I
NT
ER
NA
TIO
NA
L T
RA
DE
20
07
Tr
ad
e a
nd
dev
elo
pm
en
t i
nd
ex
AP
PE
ND
IX5
TD
IT
DI
Str
uct
ura
l an
d i
nst
itu
tio
nal
co
nte
xtra
nk
sco
reH
um
anP
hy
sica
lF
inan
cial
Do
mes
tic
Inte
rnat
ion
alIn
stit
uti
on
alE
con
om
icM
acro
eco
no
mic
En
vir
on
men
tal
2006
Co
un
try
2006
cap
ital
infr
astr
uct
ure
inte
rmed
iati
on
fi n
ance
fi n
ance
qu
alit
yst
ruct
ure
stab
ilit
ysu
stai
nab
ilit
y4
1B
ulgaria
52
02
63
91
44
31
06
59
59
71
19
42
Latv
ia5
17
29
39
18
47
63
65
64
79
12
43
Ba
hrain
51
12
13
32
77
61
45
75
66
84
18
44
Co
sta
Rica
50
33
61
61
45
01
07
77
61
70
15
44
Viet
Nam
50
31
94
24
62
13
34
15
28
21
2
46
Alban
ia4
95
19
14
42
91
40
46
50
10
21
6
47
Mex
ico
49
32
61
67
51
12
25
96
48
41
6
47
So
uth
Afr
ica
49
32
81
26
24
91
15
65
64
92
16
49
Boliv
ia4
91
35
42
04
51
30
51
56
87
13
50
Azerbaan
49
01
31
83
64
13
33
65
87
71
5
50
Ma
urit
ius
49
02
23
92
65
77
87
06
29
22
1
52
Colom
bia
48
83
91
31
04
81
10
51
59
79
14
54
Argentina
48
63
01
25
59
10
64
85
97
79
54
Bra
zil
48
62
61
31
65
71
09
60
60
60
15
54
Roman
ia4
86
24
21
44
71
17
51
57
47
12
56
Armen
ia4
85
14
93
34
13
74
75
17
81
6
57
Belaru
s4
84
35
40
65
57
12
75
95
11
9
58
Uru
gua
y4
83
18
14
17
46
10
77
45
94
41
5
58
Ru
ssian
Federation
48
32
21
81
06
81
19
34
63
33
19
60
Jordan
47
83
13
43
22
11
17
62
65
93
18
60
Sri
Lan
ka
47
81
22
61
44
71
33
58
54
86
14
62
Georg
ia4
75
11
16
44
11
33
38
54
84
16
63
Peru
47
41
77
95
21
28
59
60
89
11
63
Ph
ilipp
ines
47
41
55
16
47
10
65
35
88
31
4
65
Moldova
47
32
93
29
17
98
39
52
61
17
66
Indonesia
46
88
20
10
59
10
93
85
68
11
4
67
Gu
yana
46
53
26
21
42
12
04
94
67
81
6
68
Hond
ura
s4
64
30
51
84
21
25
48
58
73
15
68
El
Salvador
46
42
26
18
26
11
35
96
08
61
3
70
Ecuador
46
11
19
95
71
08
40
62
81
15
71
Sa
ud
i Ara
bia
45
91
81
72
58
21
45
60
64
89
17
72
Tun
isia
45
53
12
42
95
31
17
65
58
80
14
73
Oman
45
32
36
16
68
10
27
56
51
08
17
73
Turkey
45
33
12
18
51
10
05
55
85
41
6
75
Cam
bod
ia4
52
14
54
46
13
94
44
49
11
0
76
Jamaica
44
92
69
84
31
03
57
63
70
18
76
Madaga
scar
44
91
60
43
91
41
50
47
80
8
78
Uganda
44
62
47
33
61
40
47
45
80
10
79
Dom
inican
Rep
ubli
c4
43
14
10
15
53
11
95
45
93
61
3
79
Nicara
gua
44
32
35
11
27
12
84
85
49
21
4
81
Ken
ya
44
12
74
11
43
12
74
04
86
01
3
Ap
pen
dix
5. T
DI,
dim
ensi
on
s, c
om
po
nen
ts a
nd
in
pu
t an
d o
utc
om
e m
easu
res
(co
nti
nu
ed)
.../
...

53
DE
VE
LO
PIN
G C
OU
NT
RIE
S IN
INT
ER
NA
TIO
NA
L T
RA
DE
20
07
Tr
ad
e a
nd
dev
elo
pm
en
t in
dex
AP
PE
ND
IX5
Ap
pen
dix
5. T
DI,
dim
ensi
on
s, c
om
po
nen
ts a
nd
in
pu
t an
d o
utc
om
e m
easu
res
(co
nti
nu
ed)
TD
IT
DI
Str
uct
ura
l an
d i
nst
itu
tio
nal
co
nte
xtra
nk
sco
reH
um
anP
hy
sica
lF
inan
cial
Do
mes
tic
Inte
rnat
ion
alIn
stit
uti
on
alE
con
om
icM
acro
eco
no
mic
En
vir
on
men
tal
2006
Co
un
try
2006
cap
ital
infr
astr
uct
ure
inte
rmed
iati
on
fi n
ance
fi n
ance
qu
alit
yst
ruct
ure
stab
ilit
ysu
stai
nab
ilit
y8
2Para
gua
y4
40
23
27
43
11
43
64
88
11
5
83
Algeria
43
62
44
58
41
28
41
60
93
16
83
Un
ited
Rep
ubli
co
f Tan
zan
ia4
36
18
34
38
13
24
33
79
81
5
85
Bots
wana
43
41
91
38
75
14
07
66
57
31
4
86
Ind
ia4
33
17
22
15
53
13
44
95
29
51
2
86
Lebanon
43
31
91
03
52
88
05
06
24
21
9
89
Pap
ua
New
Gu
inea
43
22
21
55
11
12
41
47
73
9
89
Bolivarian
Rep
ubli
co
f Venez
uela
43
21
56
47
01
13
41
64
48
16
89
Lesotho
43
24
57
31
01
36
54
55
78
12
91
Senegal
42
92
09
93
81
35
51
55
92
13
92
Rwanda
42
51
40
52
81
42
47
39
86
12
93
Guatemala
42
31
68
93
41
13
51
52
76
14
93
Islam
ic Rep
ubli
co
f Iran
42
32
62
71
67
81
19
36
59
59
17
95
Moro
cco
42
02
51
82
55
11
22
60
56
83
11
96
Ghana
41
21
16
63
91
26
51
42
44
14
97
Eg
ypt
40
71
67
26
46
12
85
05
68
01
6
97
Mala
wi
40
73
00
41
31
38
47
40
73
12
99
Mo
zam
biq
ue
40
42
10
14
11
36
47
52
55
10
10
0To
go
40
11
61
73
31
35
43
39
10
01
1
10
1Mali
39
82
00
94
31
41
52
42
10
81
0
10
2Ban
gladesh
39
71
14
13
50
14
04
05
28
81
0
10
3Pa
kistan
39
58
20
12
49
13
33
85
17
81
5
10
3Z
imba
bwe
39
52
57
14
34
12
72
55
51
81
6
10
5S
yrian
Ara
b Rep
ubli
c3
92
18
10
55
71
18
41
51
39
16
10
5C
had
39
21
90
26
61
41
41
36
98
4
10
7C
ôted
’Ivo
ire
38
71
71
65
21
31
44
51
97
13
10
7Ma
uritan
ia3
87
23
11
25
13
15
25
47
31
0
10
9B
urk
ina
Fa
so
38
61
90
63
21
43
52
46
90
7
11
0Ben
in3
84
17
06
37
14
25
14
38
51
2
11
1B
urund
i3
82
18
31
12
61
20
31
33
69
15
11
2Central
Afr
ican
Rep
ubli
c3
81
13
13
44
13
63
52
91
03
14
11
2Zam
bia
38
11
97
35
01
17
45
52
37
13
11
4Eth
iop
ia3
79
31
41
12
91
43
45
37
61
8
11
5Cameroon
37
31
62
44
81
31
40
37
49
12
11
6G
uinea
37
29
32
37
13
14
55
05
21
1
11
7Yemen
37
03
82
34
01
38
42
57
71
12
11
8Demo
crati
c Rep
.o
f Con
go
36
41
73
13
31
38
15
26
77
11
11
8An
gola
36
41
73
25
61
07
23
61
18
11
12
0N
iger
36
21
60
33
41
43
40
40
81
6
12
1N
igeria
35
09
07
72
12
73
35
25
61
3
12
2G
uinea
-Bis
sa
u3
39
19
11
27
11
53
92
58
91
0
12
3S
udan
32
61
42
34
61
11
33
39
71
12
.../
...

54
DE
VE
LO
PIN
G C
OU
NT
RIE
S I
N I
NT
ER
NA
TIO
NA
L T
RA
DE
20
07
Tr
ad
e a
nd
dev
elo
pm
en
t i
nd
ex
AP
PE
ND
IX5
Tra
de
po
lici
esT
rad
e an
d d
evel
op
men
tT
DI
and
pro
cess
esp
erfo
rman
cera
nk
Op
enn
ess
Mar
ket
acc
ess,
Tra
de
Eco
no
mic
an
dR
ank
of
Ran
k o
f20
06C
ou
ntr
yto
tra
de
fore
ign
per
form
ance
soci
al w
ell-
bei
ng
Inp
utM
IIn
pu
tMI
Ou
tco
meM
IO
utc
om
eMI
1Un
ited
State
s8
08
52
24
41
98
43
16
43
1
2German
y7
98
61
95
39
77
99
45
92
2
3Denmark
79
86
11
74
40
82
52
55
66
4Un
ited
Kin
gdom
79
86
15
94
07
79
75
56
64
5S
ingapore
87
90
18
03
56
81
43
53
61
1
6Japan
81
85
14
64
19
77
11
05
64
5
6S
weden
79
86
11
74
52
76
71
25
68
3
8Norwa
y8
28
87
94
69
78
07
54
88
8Fran
ce
79
86
15
14
05
77
11
05
56
6
10
Canada
80
86
13
14
08
76
01
45
39
10
10
Sw
itzerland
69
82
11
24
11
77
79
52
31
2
12
Iceland
80
83
74
43
07
79
85
04
15
12
Belg
ium
79
86
15
23
94
73
72
15
46
9
14
Finland
79
86
96
42
57
51
16
52
11
3
15
Ireland
79
86
12
23
54
78
46
47
62
2
16
Au
stralia
81
84
98
40
67
51
16
50
41
5
17
Au
str
ia7
98
61
26
38
17
46
19
50
71
4
18
New
Zealand
80
84
94
39
07
63
13
48
31
8
19
Spain
79
86
12
53
54
75
91
54
78
19
20
Israel
82
89
85
38
57
49
18
47
12
3
21
Rep
ubli
co
f Korea
78
82
12
23
38
73
82
04
60
27
21
Italy
79
86
14
23
54
70
02
64
97
17
23
Portu
gal
79
86
10
53
51
73
02
24
56
29
24
Sloven
ia7
58
81
10
36
76
89
29
47
72
0
25
Ch
ina
78
82
15
53
22
67
63
04
77
20
26
Czech
Rep
ubli
c8
18
51
21
33
76
61
34
45
82
8
27
Mala
ysia
75
80
13
32
71
70
72
54
04
46
28
Greece
79
86
10
33
44
66
23
34
47
34
29
Tha
iland
72
77
12
43
21
65
73
64
45
36
29
Malta
79
83
82
29
87
22
23
38
05
5
31
Hun
gary
79
86
11
43
48
61
54
44
62
25
32
Poland
79
85
11
13
43
61
94
14
54
31
33
Eston
ia7
98
51
18
35
26
03
47
46
92
4
34
Slovak
ia
79
86
11
53
41
59
75
04
56
29
35
Lit
huan
ia7
98
61
03
35
95
90
53
46
22
5
37
Ch
ile
83
88
82
29
16
71
32
37
35
9
37
Panama
81
85
83
30
76
53
37
39
05
1
37
Ukra
ine
80
86
10
93
24
61
04
54
34
39
39
Un
ited
Ara
b Em
irate
s8
38
71
12
23
16
98
28
34
37
6
39
Ku
wa
it8
38
75
52
87
69
92
73
42
77
Ap
pen
dix
5. T
DI,
dim
ensi
on
s, c
om
po
nen
ts a
nd
in
pu
t an
d o
utc
om
e m
easu
res
(co
nti
nu
ed)
.../
...

55
DE
VE
LO
PIN
G C
OU
NT
RIE
S IN
INT
ER
NA
TIO
NA
L T
RA
DE
20
07
Tr
ad
e a
nd
dev
elo
pm
en
t in
dex
AP
PE
ND
IX5
Ap
pen
dix
5. T
DI,
dim
ensi
on
s, c
om
po
nen
ts a
nd
in
pu
t an
d o
utc
om
e m
easu
res
(co
nti
nu
ed)
Tra
de
po
lici
esT
rad
e an
d d
evel
op
men
tT
DI
and
pro
cess
esp
erfo
rman
cera
nk
Op
enn
ess
Mar
ket
acc
ess,
Tra
de
Eco
no
mic
an
dR
ank
of
Ran
k o
f20
06C
ou
ntr
yto
tra
de
fore
ign
per
form
ance
soci
al w
ell-
bei
ng
Inp
utM
IIn
pu
tMI
Ou
tco
meM
IO
utc
om
eMI
41
Bulgaria
73
77
11
23
41
58
65
54
53
32
42
Latv
ia7
98
69
93
54
58
15
94
52
33
43
Ba
hra
in8
38
75
82
48
71
52
43
06
89
44
Co
sta
Rica
83
87
90
29
96
17
42
38
95
3
44
Viet
Nam
67
72
10
43
35
56
67
04
39
38
46
Alban
ia8
28
58
43
20
58
65
54
03
47
47
Mex
ico
69
79
11
22
81
59
35
13
93
50
47
So
uth
Afr
ica
76
80
98
22
86
59
35
32
68
4
49
Boliv
ia8
18
78
02
92
60
94
63
72
60
50
Azerbaan
82
85
54
34
15
85
57
39
44
9
50
Ma
urit
ius
76
78
91
26
76
23
40
35
76
8
52
Colom
bia
74
79
84
31
85
74
61
40
24
8
54
Argentina
71
77
91
32
75
53
78
41
84
3
54
Bra
zil
73
77
10
23
07
56
47
24
08
45
54
Roman
ia6
68
31
03
33
85
31
93
44
13
7
56
Armen
ia7
98
37
73
42
55
18
04
19
42
57
Belaru
s7
78
11
06
34
05
21
10
14
47
34
58
Uru
gua
y7
48
18
53
32
54
88
14
17
44
58
Ru
ssian
Federation
76
79
94
33
25
41
86
42
54
1
60
Jordan
70
75
10
62
32
61
74
23
38
80
60
Sri
Lan
ka
77
80
89
26
76
00
48
35
67
0
62
Georg
ia7
98
29
02
99
55
97
33
90
51
63
Peru
77
82
78
28
05
89
54
35
86
6
63
Ph
ilipp
ines
82
87
78
30
55
65
71
38
35
4
65
Moldova
79
84
96
33
15
18
10
34
27
40
66
Indonesia
80
84
10
42
74
55
97
33
77
56
67
Gu
yana
71
73
10
52
70
55
57
73
74
57
68
Hond
ura
s8
28
69
12
55
58
25
83
46
74
68
El
Salvador
79
85
98
26
15
69
67
35
96
3
70
Ecuador
75
79
66
30
85
47
82
37
45
7
71
Sa
ud
i Ara
bia
79
80
49
19
36
75
31
24
21
11
72
Tun
isia
57
65
98
21
95
92
52
31
88
6
73
Oman
83
88
51
20
46
51
38
25
51
07
73
Turkey
78
87
10
72
40
55
87
53
48
73
75
Cam
bod
ia6
97
36
62
99
53
89
03
65
61
76
Jamaica
72
74
54
30
15
42
84
35
57
1
76
Madaga
scar
75
78
76
28
15
40
88
35
76
8
78
Uganda
78
83
76
26
25
53
78
33
88
0
79
Dom
inican
Rep
ubli
c7
57
89
62
62
52
79
53
58
66
79
Nicara
gua
82
87
88
22
55
72
64
31
38
7
81
Ken
ya
72
76
81
27
85
22
10
03
59
63
.../
...

56
DE
VE
LO
PIN
G C
OU
NT
RIE
S I
N I
NT
ER
NA
TIO
NA
L T
RA
DE
20
07
Tr
ad
e a
nd
dev
elo
pm
en
t i
nd
ex
AP
PE
ND
IX5
Tra
de
po
lici
esT
rad
e an
d d
evel
op
men
tT
DI
and
pro
cess
esp
erfo
rman
cera
nk
Op
enn
ess
Mar
ket
acc
ess,
Tra
de
Eco
no
mic
an
dR
ank
of
Ran
k o
f20
06C
ou
ntr
yto
tra
de
fore
ign
per
form
ance
soci
al w
ell-
bei
ng
Inp
utM
IIn
pu
tMI
Ou
tco
meM
IO
utc
om
eMI
82
Para
gua
y7
38
06
92
88
52
11
01
35
86
6
83
Algeria
70
74
51
22
35
98
49
27
49
8
83
Un
ited
Rep
ubli
co
f Tan
zan
ia7
27
67
02
69
53
39
23
39
78
85
Bots
wana
72
76
29
20
86
30
39
23
71
15
86
Ind
ia6
16
51
02
18
75
76
60
29
09
4
86
Lebanon
79
81
11
52
48
50
31
10
36
36
2
89
Pap
ua
New
Gu
inea
75
77
86
26
55
13
10
43
51
72
89
Bolivarian
Rep
ubli
co
f Venez
uela
72
77
31
30
85
26
96
33
88
0
89
Lesotho
68
72
93
23
15
39
89
32
48
5
91
Senegal
72
72
87
20
45
67
69
29
19
3
92
Rwanda
71
78
63
26
45
23
98
32
78
3
93
Guatemala
82
86
90
21
45
41
86
30
49
0
93
Islam
ic Rep
ubli
co
f Iran
64
70
30
24
25
73
63
27
39
9
95
Moro
cco
56
62
95
17
55
70
65
27
01
01
96
Ghana
70
72
77
26
74
80
11
53
44
75
97
Eg
ypt
72
76
77
16
35
74
61
24
01
12
97
Mala
wi
71
74
60
25
15
03
11
03
11
88
99
Mo
zam
biq
ue
72
75
56
24
15
10
10
62
97
92
10
0To
go
70
70
82
19
55
25
97
27
79
6
10
1Mali
71
73
36
19
15
69
67
22
71
17
10
2Ban
gladesh
56
60
72
19
85
23
98
27
01
01
10
3Pa
kistan
67
70
80
16
95
41
86
24
81
09
10
3Z
imba
bwe
65
67
94
24
34
53
12
33
37
82
10
5S
yrian
Ara
b Rep
ubli
c6
77
44
92
38
49
51
13
28
89
5
10
5C
had
67
71
49
19
05
45
83
23
91
13
10
7C
ôted
’Ivo
ire
71
73
74
14
35
56
76
21
71
19
10
7Ma
uritan
ia7
17
26
42
07
50
31
10
27
01
01
10
9B
urk
ina
Fa
so
70
71
43
19
25
37
91
23
51
16
11
0Ben
in6
96
95
81
80
53
09
42
38
11
4
11
1B
urund
i6
47
33
72
63
46
41
19
30
09
1
11
2Central
Afr
ican
Rep
ubli
c6
46
64
92
05
50
81
08
25
41
08
11
2Zam
bia
73
77
55
21
34
93
11
42
69
10
3
11
4Eth
iop
ia6
97
26
61
81
51
01
06
24
71
10
11
5Cameroon
64
67
61
21
44
71
11
72
75
97
11
6G
uinea
69
68
50
21
54
78
11
62
65
10
5
11
7Yemen
80
85
26
14
45
69
67
17
01
23
11
8Dem
. Rep
.o
f Con
go
70
72
50
21
54
62
12
02
65
10
5
11
8An
gola
80
83
31
23
54
61
12
12
67
10
4
12
0N
iger
69
70
49
17
35
02
11
22
22
11
8
12
1N
igeria
69
73
23
16
55
11
10
51
88
12
1
12
2G
uinea
-Bis
sa
u6
86
83
71
79
46
11
21
21
61
20
12
3S
udan
65
70
27
15
84
66
11
81
85
12
2
Ap
pen
dix
5. T
DI,
dim
ensi
on
s, c
om
po
nen
ts a
nd
in
pu
t an
d o
utc
om
e m
easu
res
(co
ncl
ud
ed)
COUNTRY PROFILES
Part
II

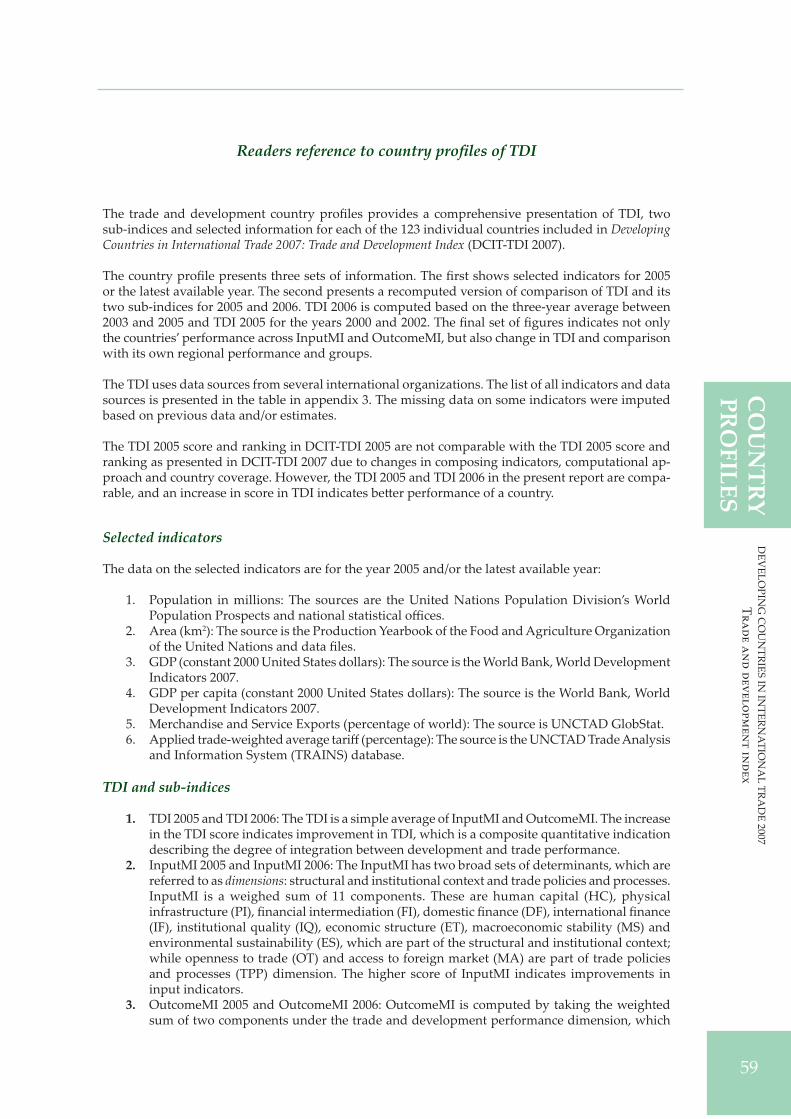
59
DE
VE
LO
PIN
G C
OU
NT
RIE
S IN
INT
ER
NA
TIO
NA
L T
RA
DE
20
07
Tr
ad
e a
nd
dev
elo
pm
en
t in
dex
CO
UN
TR
YP
RO
FIL
ES
Readers reference to country profi les of TDI
The trade and development country profiles provides a comprehensive presentation of TDI, two
sub-indices and selected information for each of the 123 individual countries included in DevelopingCountries in International Trade 2007: Trade and Development Index (DCIT-TDI 2007).
The country profile presents three sets of information. The first shows selected indicators for 2005
or the latest available year. The second presents a recomputed version of comparison of TDI and its
two sub-indices for 2005 and 2006. TDI 2006 is computed based on the three-year average between
2003 and 2005 and TDI 2005 for the years 2000 and 2002. The final set of fi gures indicates not only
the countries’ performance across InputMI and OutcomeMI, but also change in TDI and comparison
with its own regional performance and groups.
The TDI uses data sources from several international organizations. The list of all indicators and data
sources is presented in the table in appendix 3. The missing data on some indicators were imputed
based on previous data and/or estimates.
The TDI 2005 score and ranking in DCIT-TDI 2005 are not comparable with the TDI 2005 score and
ranking as presented in DCIT-TDI 2007 due to changes in composing indicators, computational ap-
proach and country coverage. However, the TDI 2005 and TDI 2006 in the present report are compa-
rable, and an increase in score in TDI indicates be er performance of a country.
Selected indicators
The data on the selected indicators are for the year 2005 and/or the latest available year:
Population in millions: The sources are the United Nations Population Division’s World1.
Population Prospects and national statistical o ces.
Area (km2. 2): The source is the Production Yearbook of the Food and Agriculture Organization
of the United Nations and data files.
GDP (constant 2000 United Statesdollars): The source is the World Bank, World Development3.
Indicators 2007.
GDP per capita (constant 2000 United States dollars): The source is the World Bank, World4.
Development Indicators 2007.
Merchandise and Service Exports (percentage of world): The source is UNCTAD GlobStat.5.
Applied trade-weighted average tari (percentage): The source is the UNCTAD Trade Analysis6.
and Information System (TRAINS) database.
TDI and sub-indices
TDI 2005 and TDI 2006: The TDI is a simple average of InputMI and OutcomeMI. The increase1.in the TDI score indicates improvement in TDI, which is a composite quantitative indication
describing the degree of integration between development and trade performance.
InputMI 2005 and InputMI 2006: The InputMI has two broad sets of determinants, which are2.referred to as dimensions: structural and institutional context and trade policies and processes.
InputMI is a weighed sum of 11 components. These are human capital (HC), physical
infrastructure (PI), financial intermediation (FI), domestic finance (DF), international finance
(IF), institutional quality (IQ), economic structure (ET), macroeconomic stability (MS) and
environmental sustainability (ES), which are part of the structural and institutional context;
while openness to trade (OT) and access to foreign market (MA) are part of trade policies
and processes (TPP) dimension. The higher score of InputMI indicates improvements in
input indicators.
OutcomeMI 2005 and OutcomeMI 2006: OutcomeMI is computed by taking the weighted3.sum of two components under the trade and development performance dimension, which

60
DE
VE
LO
PIN
G C
OU
NT
RIE
S I
N I
NT
ER
NA
TIO
NA
L T
RA
DE
20
07
Tr
ad
e a
nd
dev
elo
pm
en
t i
nd
ex
CO
UN
TR
YP
RO
FIL
ES
are trade performance (TP) and economic and social well-being (EW). The higher score of
OutcomeMI indicates improvements in outcome indicators.
TDI ladder and benchmarking
InputMI 2006: This presents the performance of the nine components, which are based on1.
several indicators, in 2006, derived based on coverage over 2003, 2004 and 2005. It provides
a clear indication of a country-level performance and clue for important policymaking
OutcomeMI 2006: This presents the performance of two components, which are based on2.
several indicators, in 2006. It shows the outcome in trade and development at the country
level.
Climbing the TDI ladder: The TDI, InputMI and OutcomeMI in 2005 and 2006 provide a3.
comprehensive view of a country-level improvement or decline. The higher value in 2006
compared to 2005 indicates overall improvement in the indices.
Benchmarking TDI: This helps a country to compare the TDI performance to its own region4.
and other groups of countries. The regions and country groups are the following: East Asia and
Pacifi c (EAP), Europe and Central Asia (ECA), Latin America and Caribbean (LAC), Middle
East and North Africa (MENA), North America (NA), South Asia (SA), South Eastern Europe
and Commonwealth of Independent States (SEECIS), Sub-Saharan Africa (SSA), Western
Europe (WE), Least Developed Countries (LDC), Developing Countries (DVG), European
Union (EU) Countries, 10 new EU members (EU10), Developed Countries (DEV) and the
Seven Emerging Economies (E7).
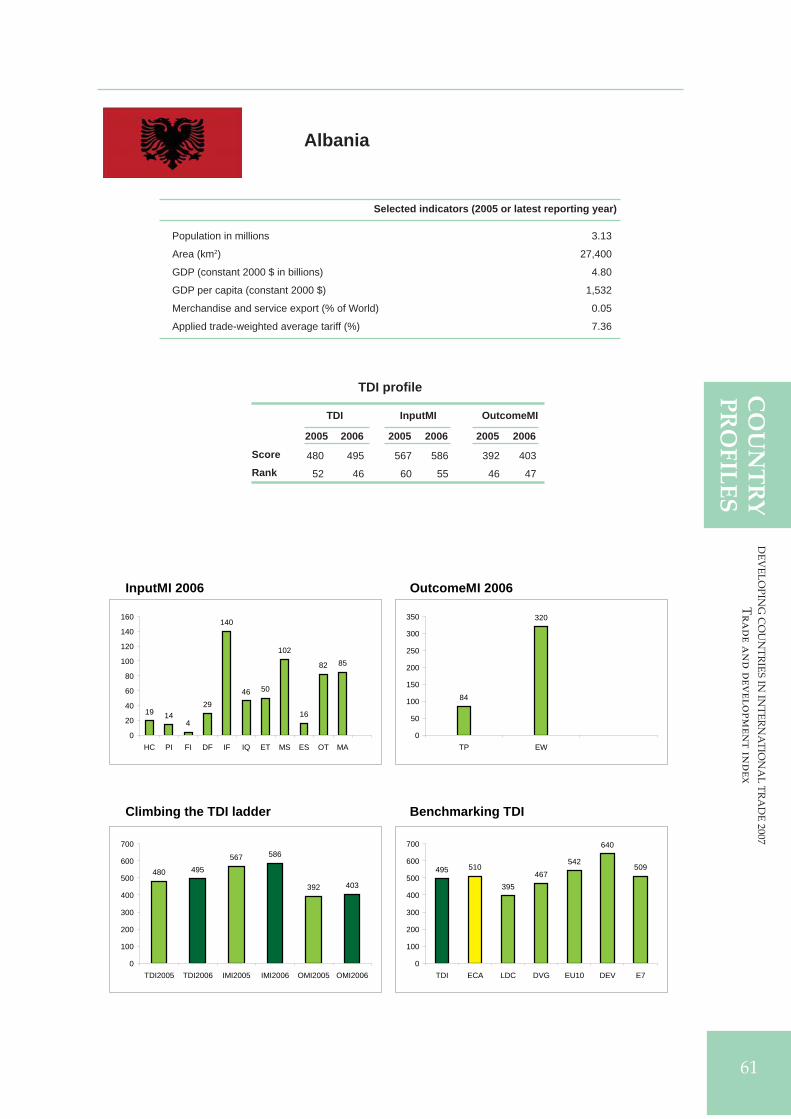
61
DE
VE
LO
PIN
G C
OU
NT
RIE
S IN
INT
ER
NA
TIO
NA
L T
RA
DE
20
07
Tr
ad
e a
nd
dev
elo
pm
en
t in
dex
CO
UN
TR
YP
RO
FIL
ES
61
TDI profi le
TDI InputMI OutcomeMI
2005 2006 2005 2006 2005 2006
Score
Rank
Selected indicators (2005 or latest reporting year)
Albania
Population in millions 3.13
Area (km2) 27,400
GDP (constant 2000 $ in billions) 4.80
GDP per capita (constant 2000 $) 1,532
Merchandise and service export (% of World) 0.05
Applied trade-weighted average tariff (%) 7.36
480 495 567 586 392 403
52 46 60 55 46 47
InputMI 2006 OutcomeMI 2006
Climbing the TDI ladder Benchmarking TDI
19 144
29
140
46 50
102
16
82 85
0
20
40
60
80
100
120
140
160
HC PI FI DF IF IQ ET MS ES OT MA
84
320
0
50
100
150
200
250
300
350
TP EW
480 495567 586
392 403
0
100
200
300
400
500
600
700
TDI2005 TDI2006 IMI2005 IMI2006 OMI2005 OMI2006
495 510
395467
542
640
509
0
100
200
300
400
500
600
700
TDI ECA LDC DVG EU10 DEV E7

62
DE
VE
LO
PIN
G C
OU
NT
RIE
S I
N I
NT
ER
NA
TIO
NA
L T
RA
DE
20
07
Tr
ad
e a
nd
dev
elo
pm
en
t i
nd
ex
CO
UN
TR
YP
RO
FIL
ES
CO
UN
TR
YP
RO
FIL
ES
62
Selected indicators (2005 or latest reporting year)
TDI profi le
TDI InputMI OutcomeMI
2005 2006 2005 2006 2005 2006
Score
Rank
Algeria
Population in millions 32.85
Area (km2) 2,381,740
GDP (constant 2000 $ in billions) 69.70
GDP per capita (constant 2000 $) 2,121
Merchandise and service export (% of World) 0.46
Applied trade-weighted average tariff (%) 11.99
411 436 577 598 245 274
90 83 54 49 105 98
InputMI 2006 OutcomeMI 2006
Climbing the TDI ladder Benchmarking TDI
24
4 5
84
128
41
60
93
16
70 74
0
20
40
60
80
100
120
140
HC PI FI DF IF IQ ET MS ES OT MA
51
223
0
50
100
150
200
250
TP EW
411 436
577 598
245 274
0
100
200
300
400
500
600
700
TDI2005 TDI2006 IMI2005 IMI2006 OMI2005 OMI2006
436477
395467
542
640
509
0
100
200
300
400
500
600
700
TDI MENA LDC DVG EU10 DEV E7

63
DE
VE
LO
PIN
G C
OU
NT
RIE
S IN
INT
ER
NA
TIO
NA
L T
RA
DE
20
07
Tr
ad
e a
nd
dev
elo
pm
en
t in
dex
CO
UN
TR
YP
RO
FIL
ES
63
TDI profi le
TDI InputMI OutcomeMI
2005 2006 2005 2006 2005 2006
Score
Rank
Selected indicators (2005 or latest reporting year)
Angola
Population in millions 15.94
Area (km2) 1,246,700
GDP (constant 2000 $ in billions) 14.90
GDP per capita (constant 2000 $) 937
Merchandise and service export (% of World) 0.18
Applied trade-weighted average tariff (%) 6.46
356 364 439 461 272 267
117 118 121 121 94 104
InputMI 2006 OutcomeMI 2006
Climbing the TDI ladder Benchmarking TDI
17
3 2
56
107
23
61
1811
80 83
0
20
40
60
80
100
120
HC PI FI DF IF IQ ET MS ES OT MA
31
235
0
50
100
150
200
250
TP EW
356 364
439461
272 267
050
100150200250300350400450500
TDI2005 TDI2006 IMI2005 IMI2006 OMI2005 OMI2006
364400 395
467542
640
509
0
100
200
300
400
500
600
700
TDI SSA LDC DVG EU10 DEV E7
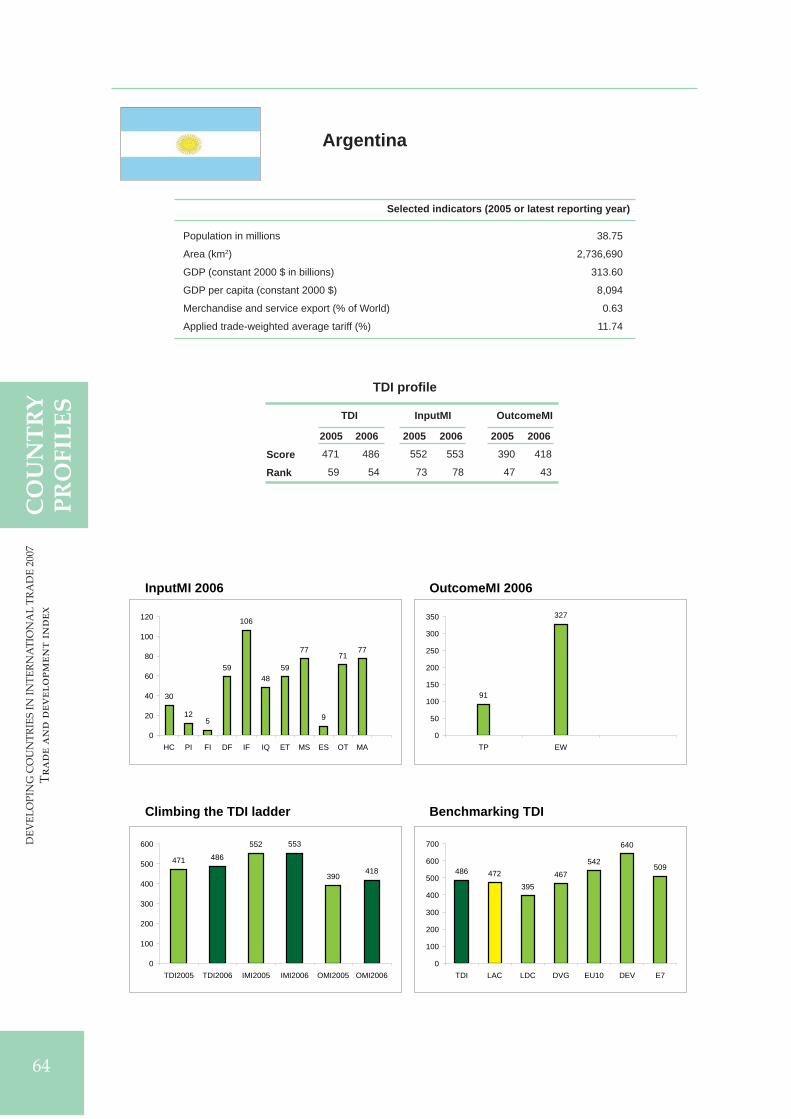
64
DE
VE
LO
PIN
G C
OU
NT
RIE
S I
N I
NT
ER
NA
TIO
NA
L T
RA
DE
20
07
Tr
ad
e a
nd
dev
elo
pm
en
t i
nd
ex
CO
UN
TR
YP
RO
FIL
ES
CO
UN
TR
YP
RO
FIL
ES
64
Selected indicators (2005 or latest reporting year)
TDI profi le
TDI InputMI OutcomeMI
2005 2006 2005 2006 2005 2006
Score
Rank
Argentina
Population in millions 38.75
Area (km2) 2,736,690
GDP (constant 2000 $ in billions) 313.60
GDP per capita (constant 2000 $) 8,094
Merchandise and service export (% of World) 0.63
Applied trade-weighted average tariff (%) 11.74
471 486 552 553 390 418
59 54 73 78 47 43
InputMI 2006 OutcomeMI 2006
Climbing the TDI ladder Benchmarking TDI
30
125
59
106
4859
77
9
7177
0
20
40
60
80
100
120
HC PI FI DF IF IQ ET MS ES OT MA
91
327
0
50
100
150
200
250
300
350
TP EW
471 486
552 553
390418
0
100
200
300
400
500
600
TDI2005 TDI2006 IMI2005 IMI2006 OMI2005 OMI2006
486 472
395467
542
640
509
0
100
200
300
400
500
600
700
TDI LAC LDC DVG EU10 DEV E7

65
DE
VE
LO
PIN
G C
OU
NT
RIE
S IN
INT
ER
NA
TIO
NA
L T
RA
DE
20
07
Tr
ad
e a
nd
dev
elo
pm
en
t in
dex
CO
UN
TR
YP
RO
FIL
ES
65
TDI profi le
TDI InputMI OutcomeMI
2005 2006 2005 2006 2005 2006
Score
Rank
Selected indicators (2005 or latest reporting year)
Armenia
Population in millions 3.02
Area (km2) 28,200
GDP (constant 2000 $ in billions) 3.40
GDP per capita (constant 2000 $) 1,129
Merchandise and service export (% of World) 0.02
Applied trade-weighted average tariff (%) 2.42
487 485 551 551 422 419
47 56 74 80 42 42
InputMI 2006 OutcomeMI 2006
Climbing the TDI ladder Benchmarking TDI
14 9 3
34
137
47 51
78
16
79 83
0
20
40
60
80
100
120
140
160
HC PI FI DF IF IQ ET MS ES OT MA
77
342
0
50
100
150
200
250
300
350
400
TP EW
487 485
551 551
422 419
0
100
200
300
400
500
600
TDI2005 TDI2006 IMI2005 IMI2006 OMI2005 OMI2006
485 510
395467
542
640
509
0
100
200
300
400
500
600
700
TDI ECA LDC DVG EU10 DEV E7
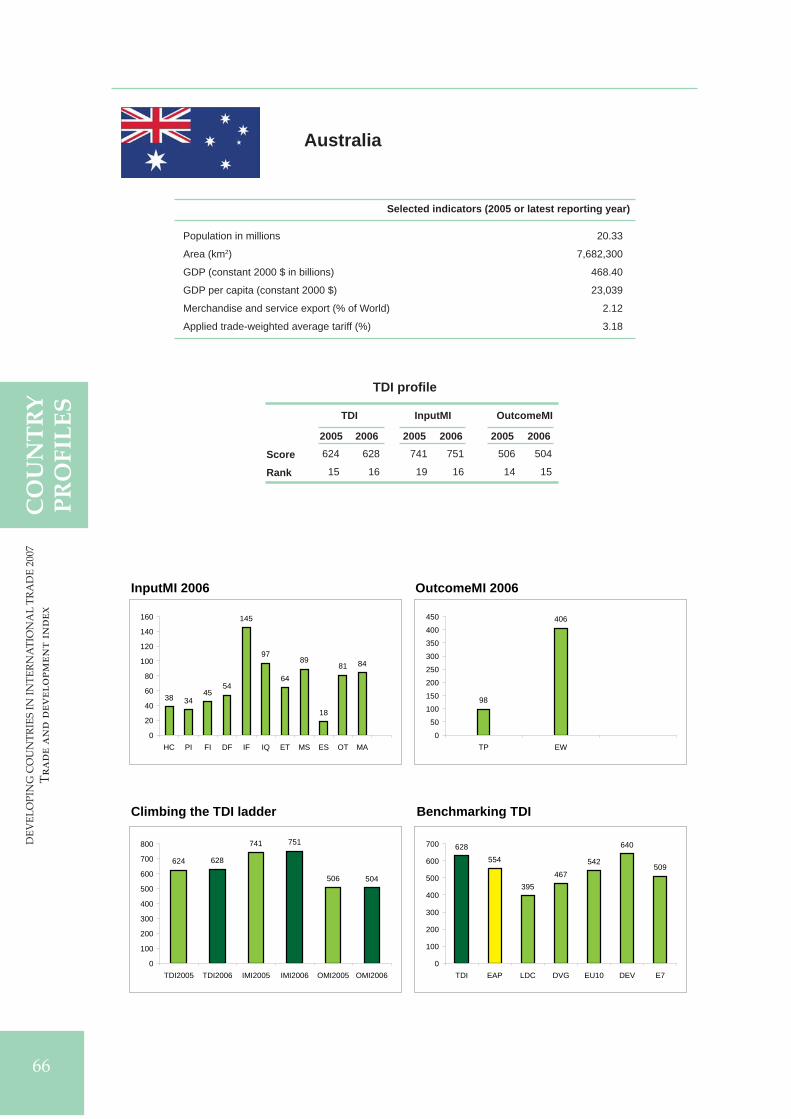
66
DE
VE
LO
PIN
G C
OU
NT
RIE
S I
N I
NT
ER
NA
TIO
NA
L T
RA
DE
20
07
Tr
ad
e a
nd
dev
elo
pm
en
t i
nd
ex
CO
UN
TR
YP
RO
FIL
ES
CO
UN
TR
YP
RO
FIL
ES
66
Selected indicators (2005 or latest reporting year)
TDI profi le
TDI InputMI OutcomeMI
2005 2006 2005 2006 2005 2006
Score
Rank
Australia
Population in millions 20.33
Area (km2) 7,682,300
GDP (constant 2000 $ in billions) 468.40
GDP per capita (constant 2000 $) 23,039
Merchandise and service export (% of World) 2.12
Applied trade-weighted average tariff (%) 3.18
624 628 741 751 506 504
15 16 19 16 14 15
InputMI 2006 OutcomeMI 2006
Climbing the TDI ladder Benchmarking TDI
38 3445
54
145
97
64
89
18
81 84
0
20
40
60
80
100
120
140
160
HC PI FI DF IF IQ ET MS ES OT MA
98
406
0
50
100
150
200
250
300
350
400
450
TP EW
624 628
741 751
506 504
0
100
200
300
400
500
600
700
800
TDI2005 TDI2006 IMI2005 IMI2006 OMI2005 OMI2006
628554
395467
542
640
509
0
100
200
300
400
500
600
700
TDI EAP LDC DVG EU10 DEV E7

67
DE
VE
LO
PIN
G C
OU
NT
RIE
S IN
INT
ER
NA
TIO
NA
L T
RA
DE
20
07
Tr
ad
e a
nd
dev
elo
pm
en
t in
dex
CO
UN
TR
YP
RO
FIL
ES
67
TDI profi le
TDI InputMI OutcomeMI
2005 2006 2005 2006 2005 2006
Score
Rank
Selected indicators (2005 or latest reporting year)
Austria
Population in millions 8.23
Area (km2) 82,450
GDP (constant 2000 $ in billions) 208.70
GDP per capita (constant 2000 $) 25,346
Merchandise and service export (% of World) 3.45
Applied trade-weighted average tariff (%) 2.72
627 627 765 746 489 507
14 17 10 19 17 14
InputMI 2006 OutcomeMI 2006
Climbing the TDI ladder Benchmarking TDI
3646 47
59
145
97
65 68
17
79 86
0
20
40
60
80
100
120
140
160
HC PI FI DF IF IQ ET MS ES OT MA
126
381
0
50
100
150
200
250
300
350
400
450
TP EW
627 627
765 746
489 507
0
100
200
300
400
500
600
700
800
900
TDI2005 TDI2006 IMI2005 IMI2006 OMI2005 OMI2006
627 651
395467
542
640
509
0
100
200
300
400
500
600
700
TDI WE LDC DVG EU10 DEV E7

68
DE
VE
LO
PIN
G C
OU
NT
RIE
S I
N I
NT
ER
NA
TIO
NA
L T
RA
DE
20
07
Tr
ad
e a
nd
dev
elo
pm
en
t i
nd
ex
CO
UN
TR
YP
RO
FIL
ES
CO
UN
TR
YP
RO
FIL
ES
68
Selected indicators (2005 or latest reporting year)
TDI profi le
TDI InputMI OutcomeMI
2005 2006 2005 2006 2005 2006
Score
Rank
Azerbaijan
Population in millions 8.39
Area (km2) 82,660
GDP (constant 2000 $ in billions) 9.90
GDP per capita (constant 2000 $) 1,182
Merchandise and service export (% of World) 0.06
Applied trade-weighted average tariff (%) 5.82
475 490 578 585 371 394
56 50 53 57 55 49
InputMI 2006 OutcomeMI 2006
Climbing the TDI ladder Benchmarking TDI
13 183
64
133
36
58
77
15
82 85
0
20
40
60
80
100
120
140
HC PI FI DF IF IQ ET MS ES OT MA
54
341
0
50
100
150
200
250
300
350
400
TP EW
475 490
578 585
371 394
0
100
200
300
400
500
600
700
TDI2005 TDI2006 IMI2005 IMI2006 OMI2005 OMI2006
490 510
395467
542
640
509
0
100
200
300
400
500
600
700
TDI ECA LDC DVG EU10 DEV E7

69
DE
VE
LO
PIN
G C
OU
NT
RIE
S IN
INT
ER
NA
TIO
NA
L T
RA
DE
20
07
Tr
ad
e a
nd
dev
elo
pm
en
t in
dex
CO
UN
TR
YP
RO
FIL
ES
69
TDI profi le
TDI InputMI OutcomeMI
2005 2006 2005 2006 2005 2006
Score
Rank
Selected indicators (2005 or latest reporting year)
Bahrain
Population in millions 0.73
Area (km2) 710
GDP (constant 2000 $ in billions) 10.60
GDP per capita (constant 2000 $) 14,588
Merchandise and service export (% of World) 0.16
Applied trade-weighted average tariff (%) 5.55
504 511 706 715 302 306
42 43 25 24 86 89
InputMI 2006 OutcomeMI 2006
Climbing the TDI ladder Benchmarking TDI
2133 27
76
145
7566
84
18
83 87
0
20
40
60
80
100
120
140
160
HC PI FI DF IF IQ ET MS ES OT MA
58
248
0
50
100
150
200
250
300
TP EW
504 511
706 715
302 306
0
100
200
300
400
500
600
700
800
TDI2005 TDI2006 IMI2005 IMI2006 OMI2005 OMI2006
511477
395467
542
640
509
0
100
200
300
400
500
600
700
TDI MENA LDC DVG EU10 DEV E7

70
DE
VE
LO
PIN
G C
OU
NT
RIE
S I
N I
NT
ER
NA
TIO
NA
L T
RA
DE
20
07
Tr
ad
e a
nd
dev
elo
pm
en
t i
nd
ex
CO
UN
TR
YP
RO
FIL
ES
CO
UN
TR
YP
RO
FIL
ES
70
Selected indicators (2005 or latest reporting year)
TDI profi le
TDI InputMI OutcomeMI
2005 2006 2005 2006 2005 2006
Score
Rank
Bangladesh
Population in millions 141.82
Area (km2) 130,170
GDP (constant 2000 $ in billions) 61.40
GDP per capita (constant 2000 $) 433
Merchandise and service export (% of World) 0.14
Applied trade-weighted average tariff (%) 63.72
400 397 528 523 271 270
96 102 94 98 96 101
InputMI 2006 OutcomeMI 2006
Climbing the TDI ladder Benchmarking TDI
114
13
50
140
4052
88
10
56 60
0
20
40
60
80
100
120
140
160
HC PI FI DF IF IQ ET MS ES OT MA
72
198
0
50
100
150
200
250
TP EW
400 397
528 523
271 270
0
100
200
300
400
500
600
TDI2005 TDI2006 IMI2005 IMI2006 OMI2005 OMI2006
397 426395
467542
640
509
0
100
200
300
400
500
600
700
TDI SA LDC DVG EU10 DEV E7

71
DE
VE
LO
PIN
G C
OU
NT
RIE
S IN
INT
ER
NA
TIO
NA
L T
RA
DE
20
07
Tr
ad
e a
nd
dev
elo
pm
en
t in
dex
CO
UN
TR
YP
RO
FIL
ES
71
TDI profi le
TDI InputMI OutcomeMI
2005 2006 2005 2006 2005 2006
Score
Rank
Selected indicators (2005 or latest reporting year)
Belarus
Population in millions 9.78
Area (km2) 207,480
GDP (constant 2000 $ in billions) 18.30
GDP per capita (constant 2000 $) 1,868
Merchandise and service export (% of World) 0.23
Applied trade-weighted average tariff (%) 8.86
483 484 517 521 448 447
48 57 97 101 31 34
InputMI 2006 OutcomeMI 2006
Climbing the TDI ladder Benchmarking TDI
3540
6
55
71
27
5951
19
7781
0
10
20
30
40
50
60
70
80
90
HC PI FI DF IF IQ ET MS ES OT MA
106
340
0
50
100
150
200
250
300
350
400
TP EW
483 484
517 521
448 447
400
420
440
460
480
500
520
540
TDI2005 TDI2006 IMI2005 IMI2006 OMI2005 OMI2006
484 510
395467
542
640
509
0
100
200
300
400
500
600
700
TDI ECA LDC DVG EU10 DEV E7

72
DE
VE
LO
PIN
G C
OU
NT
RIE
S I
N I
NT
ER
NA
TIO
NA
L T
RA
DE
20
07
Tr
ad
e a
nd
dev
elo
pm
en
t i
nd
ex
CO
UN
TR
YP
RO
FIL
ES
CO
UN
TR
YP
RO
FIL
ES
72
Selected indicators (2005 or latest reporting year)
TDI profi le
TDI InputMI OutcomeMI
2005 2006 2005 2006 2005 2006
Score
Rank
Belgium
Population in millions 10.48
Area (km2) 30,230
GDP (constant 2000 $ in billions) 249.40
GDP per capita (constant 2000 $) 23,796
Merchandise and service export (% of World) 5.70
Applied trade-weighted average tariff (%) 2.72
638 642 744 737 531 546
12 12 18 21 11 9
InputMI 2006 OutcomeMI 2006
Climbing the TDI ladder Benchmarking TDI
42 40 33
56
145
87
66
90
13
79 86
0
20
40
60
80
100
120
140
160
HC PI FI DF IF IQ ET MS ES OT MA
152
394
0
50
100
150
200
250
300
350
400
450
TP EW
638 642
744 737
531 546
0
100
200
300
400
500
600
700
800
TDI2005 TDI2006 IMI2005 IMI2006 OMI2005 OMI2006
642 651
395467
542
640
509
0
100
200
300
400
500
600
700
TDI WE LDC DVG EU10 DEV E7

73
DE
VE
LO
PIN
G C
OU
NT
RIE
S IN
INT
ER
NA
TIO
NA
L T
RA
DE
20
07
Tr
ad
e a
nd
dev
elo
pm
en
t in
dex
CO
UN
TR
YP
RO
FIL
ES
73
TDI profi le
TDI InputMI OutcomeMI
2005 2006 2005 2006 2005 2006
Score
Rank
Selected indicators (2005 or latest reporting year)
Benin
Population in millions 8.44
Area (km2) 110,620
GDP (constant 2000 $ in billions) 2.80
GDP per capita (constant 2000 $) 326
Merchandise and service export (% of World) 0.02
Applied trade-weighted average tariff (%) 12.28
377 384 513 530 241 238
109 110 99 94 107 114
InputMI 2006 OutcomeMI 2006
Climbing the TDI ladder Benchmarking TDI
170 6
37
142
5143
85
12
69 69
0
20
40
60
80
100
120
140
160
HC PI FI DF IF IQ ET MS ES OT MA
58
180
020406080
100120140160180200
TP EW
377 384
513 530
241 238
0
100
200
300
400
500
600
TDI2005 TDI2006 IMI2005 IMI2006 OMI2005 OMI2006
384 400 395467
542
640
509
0
100
200
300
400
500
600
700
TDI SSA LDC DVG EU10 DEV E7

74
DE
VE
LO
PIN
G C
OU
NT
RIE
S I
N I
NT
ER
NA
TIO
NA
L T
RA
DE
20
07
Tr
ad
e a
nd
dev
elo
pm
en
t i
nd
ex
CO
UN
TR
YP
RO
FIL
ES
CO
UN
TR
YP
RO
FIL
ES
74
Selected indicators (2005 or latest reporting year)
TDI profi le
TDI InputMI OutcomeMI
2005 2006 2005 2006 2005 2006
Score
Rank
Bolivia
Population in millions 9.18
Area (km2) 1,084,380
GDP (constant 2000 $ in billions) 9.70
GDP per capita (constant 2000 $) 1,061
Merchandise and service export (% of World) 0.04
Applied trade-weighted average tariff (%) 8.67
466 491 586 609 345 372
62 49 49 46 69 60
InputMI 2006 OutcomeMI 2006
Climbing the TDI ladder Benchmarking TDI
35
4
20
45
130
51 56
87
13
81 87
0
20
40
60
80
100
120
140
HC PI FI DF IF IQ ET MS ES OT MA
80
292
0
50
100
150
200
250
300
350
TP EW
466 491
586 609
345 372
0
100
200
300
400
500
600
700
TDI2005 TDI2006 IMI2005 IMI2006 OMI2005 OMI2006
491 472
395467
542
640
509
0
100
200
300
400
500
600
700
TDI LAC LDC DVG EU10 DEV E7
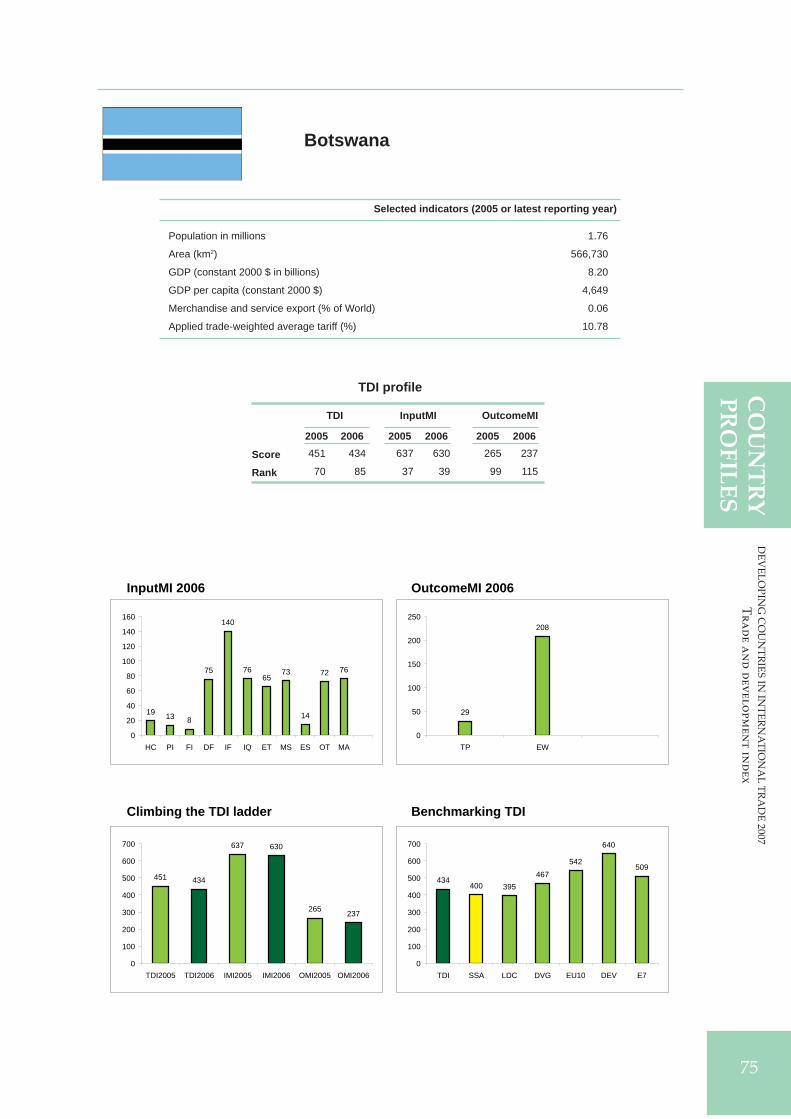
75
DE
VE
LO
PIN
G C
OU
NT
RIE
S IN
INT
ER
NA
TIO
NA
L T
RA
DE
20
07
Tr
ad
e a
nd
dev
elo
pm
en
t in
dex
CO
UN
TR
YP
RO
FIL
ES
75
TDI profi le
TDI InputMI OutcomeMI
2005 2006 2005 2006 2005 2006
Score
Rank
Selected indicators (2005 or latest reporting year)
Botswana
Population in millions 1.76
Area (km2) 566,730
GDP (constant 2000 $ in billions) 8.20
GDP per capita (constant 2000 $) 4,649
Merchandise and service export (% of World) 0.06
Applied trade-weighted average tariff (%) 10.78
451 434 637 630 265 237
70 85 37 39 99 115
InputMI 2006 OutcomeMI 2006
Climbing the TDI ladder Benchmarking TDI
19 13 8
75
140
7665
73
14
72 76
0
20
40
60
80
100
120
140
160
HC PI FI DF IF IQ ET MS ES OT MA
29
208
0
50
100
150
200
250
TP EW
451 434
637 630
265 237
0
100
200
300
400
500
600
700
TDI2005 TDI2006 IMI2005 IMI2006 OMI2005 OMI2006
434400 395
467542
640
509
0
100
200
300
400
500
600
700
TDI SSA LDC DVG EU10 DEV E7
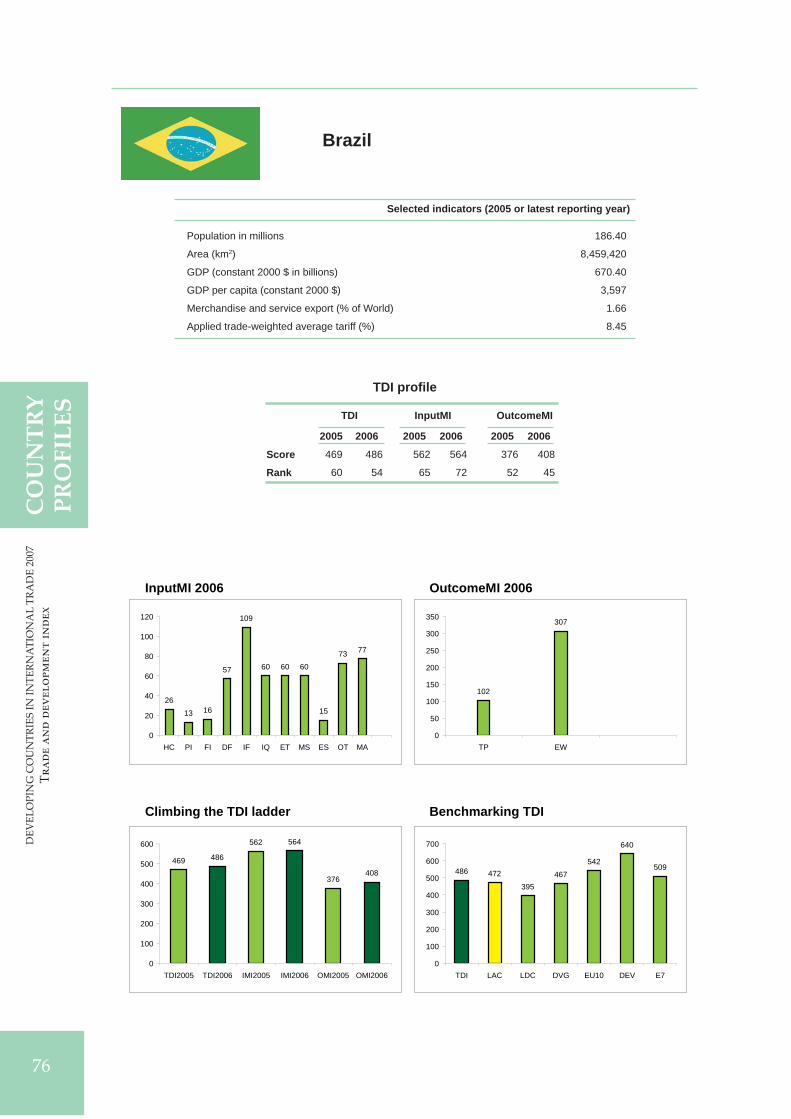
76
DE
VE
LO
PIN
G C
OU
NT
RIE
S I
N I
NT
ER
NA
TIO
NA
L T
RA
DE
20
07
Tr
ad
e a
nd
dev
elo
pm
en
t i
nd
ex
CO
UN
TR
YP
RO
FIL
ES
CO
UN
TR
YP
RO
FIL
ES
76
Selected indicators (2005 or latest reporting year)
TDI profi le
TDI InputMI OutcomeMI
2005 2006 2005 2006 2005 2006
Score
Rank
Brazil
Population in millions 186.40
Area (km2) 8,459,420
GDP (constant 2000 $ in billions) 670.40
GDP per capita (constant 2000 $) 3,597
Merchandise and service export (% of World) 1.66
Applied trade-weighted average tariff (%) 8.45
469 486 562 564 376 408
60 54 65 72 52 45
InputMI 2006 OutcomeMI 2006
Climbing the TDI ladder Benchmarking TDI
2613 16
57
109
60 60 60
15
73 77
0
20
40
60
80
100
120
HC PI FI DF IF IQ ET MS ES OT MA
102
307
0
50
100
150
200
250
300
350
TP EW
469 486
562 564
376408
0
100
200
300
400
500
600
TDI2005 TDI2006 IMI2005 IMI2006 OMI2005 OMI2006
486 472
395467
542
640
509
0
100
200
300
400
500
600
700
TDI LAC LDC DVG EU10 DEV E7

77
DE
VE
LO
PIN
G C
OU
NT
RIE
S IN
INT
ER
NA
TIO
NA
L T
RA
DE
20
07
Tr
ad
e a
nd
dev
elo
pm
en
t in
dex
CO
UN
TR
YP
RO
FIL
ES
77
TDI profi le
TDI InputMI OutcomeMI
2005 2006 2005 2006 2005 2006
Score
Rank
Selected indicators (2005 or latest reporting year)
Bulgaria
Population in millions 7.74
Area (km2) 108,640
GDP (constant 2000 $ in billions) 16.00
GDP per capita (constant 2000 $) 2,071
Merchandise and service export (% of World) 0.34
Applied trade-weighted average tariff (%) 8.89
515 520 579 586 451 453
38 41 52 55 29 32
InputMI 2006 OutcomeMI 2006
Climbing the TDI ladder Benchmarking TDI
2639
14
43
106
59 5971
19
73 77
0
20
40
60
80
100
120
HC PI FI DF IF IQ ET MS ES OT MA
112
341
0
50
100
150
200
250
300
350
400
TP EW
515 520579 586
451 453
0
100
200
300
400
500
600
700
TDI2005 TDI2006 IMI2005 IMI2006 OMI2005 OMI2006
520 510
395467
542
640
509
0
100
200
300
400
500
600
700
TDI ECA LDC DVG EU10 DEV E7

78
DE
VE
LO
PIN
G C
OU
NT
RIE
S I
N I
NT
ER
NA
TIO
NA
L T
RA
DE
20
07
Tr
ad
e a
nd
dev
elo
pm
en
t i
nd
ex
CO
UN
TR
YP
RO
FIL
ES
CO
UN
TR
YP
RO
FIL
ES
78
Selected indicators (2005 or latest reporting year)
TDI profi le
TDI InputMI OutcomeMI
2005 2006 2005 2006 2005 2006
Score
Rank
Burkina Faso
Population in millions 13.23
Area (km2) 273,600
GDP (constant 2000 $ in billions) 3.30
GDP per capita (constant 2000 $) 252
Merchandise and service export (% of World) 0.00
Applied trade-weighted average tariff (%) 11.73
386 386 529 537 242 235
102 109 93 91 106 116
InputMI 2006 OutcomeMI 2006
Climbing the TDI ladder Benchmarking TDI
19
0 6
32
143
52 46
90
7
70 71
0
20
40
60
80
100
120
140
160
HC PI FI DF IF IQ ET MS ES OT MA
43
192
0
50
100
150
200
250
TP EW
386 386
529 537
242 235
0
100
200
300
400
500
600
TDI2005 TDI2006 IMI2005 IMI2006 OMI2005 OMI2006
386 400 395467
542
640
509
0
100
200
300
400
500
600
700
TDI SSA LDC DVG EU10 DEV E7
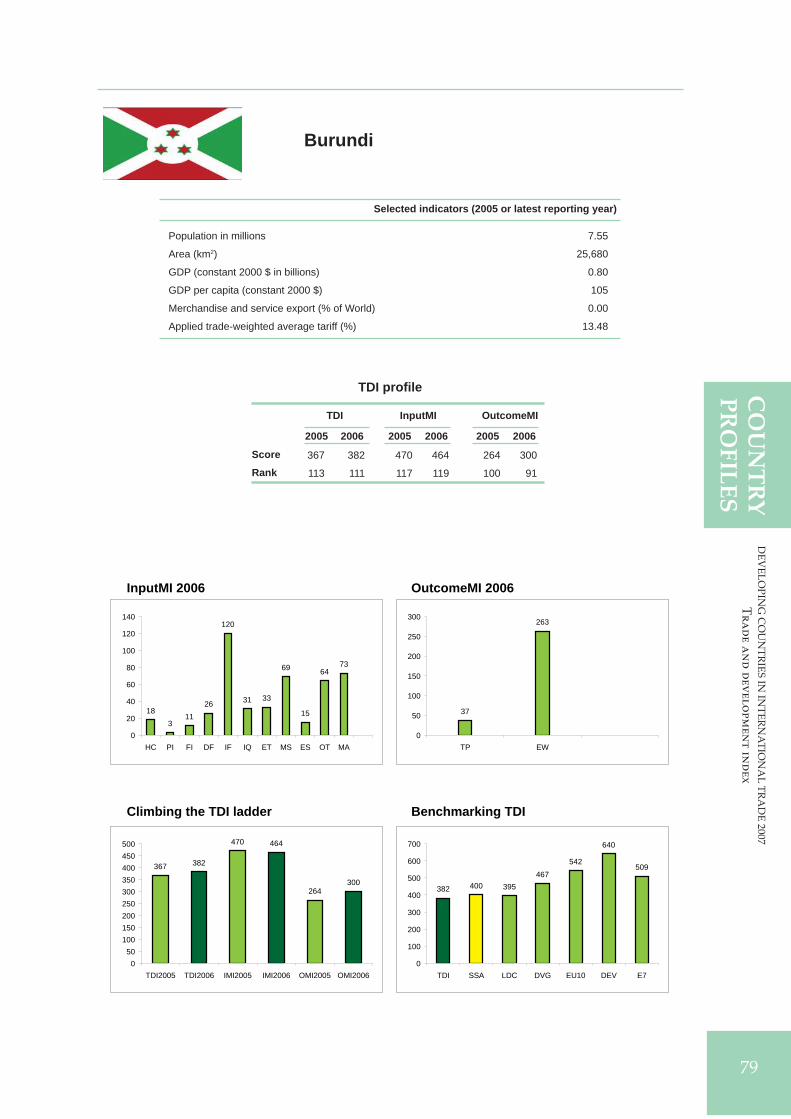
79
DE
VE
LO
PIN
G C
OU
NT
RIE
S IN
INT
ER
NA
TIO
NA
L T
RA
DE
20
07
Tr
ad
e a
nd
dev
elo
pm
en
t in
dex
CO
UN
TR
YP
RO
FIL
ES
79
TDI profi le
TDI InputMI OutcomeMI
2005 2006 2005 2006 2005 2006
Score
Rank
Selected indicators (2005 or latest reporting year)
Burundi
Population in millions 7.55
Area (km2) 25,680
GDP (constant 2000 $ in billions) 0.80
GDP per capita (constant 2000 $) 105
Merchandise and service export (% of World) 0.00
Applied trade-weighted average tariff (%) 13.48
367 382 470 464 264 300
113 111 117 119 100 91
InputMI 2006 OutcomeMI 2006
Climbing the TDI ladder Benchmarking TDI
183
1126
120
31 33
69
15
6473
0
20
40
60
80
100
120
140
HC PI FI DF IF IQ ET MS ES OT MA
37
263
0
50
100
150
200
250
300
TP EW
367 382
470 464
264300
050
100150200250300350400450500
TDI2005 TDI2006 IMI2005 IMI2006 OMI2005 OMI2006
382 400 395467
542
640
509
0
100
200
300
400
500
600
700
TDI SSA LDC DVG EU10 DEV E7

80
DE
VE
LO
PIN
G C
OU
NT
RIE
S I
N I
NT
ER
NA
TIO
NA
L T
RA
DE
20
07
Tr
ad
e a
nd
dev
elo
pm
en
t i
nd
ex
CO
UN
TR
YP
RO
FIL
ES
CO
UN
TR
YP
RO
FIL
ES
80
Selected indicators (2005 or latest reporting year)
TDI profi le
TDI InputMI OutcomeMI
2005 2006 2005 2006 2005 2006
Score
Rank
Cambodia
Population in millions 14.07
Area (km2) 176,520
GDP (constant 2000 $ in billions) 5.70
GDP per capita (constant 2000 $) 402
Merchandise and service export (% of World) 0.06
Applied trade-weighted average tariff (%) 16.47
438 452 524 538 351 365
75 75 96 90 64 61
InputMI 2006 OutcomeMI 2006
Climbing the TDI ladder Benchmarking TDI
145 4
46
139
44 44
91
10
69 73
0
20
40
60
80
100
120
140
160
HC PI FI DF IF IQ ET MS ES OT MA
66
299
0
50
100
150
200
250
300
350
TP EW
438 452
524 538
351 365
0
100
200
300
400
500
600
TDI2005 TDI2006 IMI2005 IMI2006 OMI2005 OMI2006
452
554
395467
542
640
509
0
100
200
300
400
500
600
700
TDI EAP LDC DVG EU10 DEV E7

81
DE
VE
LO
PIN
G C
OU
NT
RIE
S IN
INT
ER
NA
TIO
NA
L T
RA
DE
20
07
Tr
ad
e a
nd
dev
elo
pm
en
t in
dex
CO
UN
TR
YP
RO
FIL
ES
81
TDI profi le
TDI InputMI OutcomeMI
2005 2006 2005 2006 2005 2006
Score
Rank
Selected indicators (2005 or latest reporting year)
Cameroon
Population in millions 16.32
Area (km2) 465,400
GDP (constant 2000 $ in billions) 12.10
GDP per capita (constant 2000 $) 739
Merchandise and service export (% of World) 0.06
Applied trade-weighted average tariff (%) 14.45
382 373 506 471 258 275
105 115 104 117 102 97
InputMI 2006 OutcomeMI 2006
Climbing the TDI ladder Benchmarking TDI
162 4
48
131
40 3749
12
64 67
0
20
40
60
80
100
120
140
HC PI FI DF IF IQ ET MS ES OT MA
61
214
0
50
100
150
200
250
TP EW
382 373
506471
258 275
0
100
200
300
400
500
600
TDI2005 TDI2006 IMI2005 IMI2006 OMI2005 OMI2006
373 400 395467
542
640
509
0
100
200
300
400
500
600
700
TDI SSA LDC DVG EU10 DEV E7

82
DE
VE
LO
PIN
G C
OU
NT
RIE
S I
N I
NT
ER
NA
TIO
NA
L T
RA
DE
20
07
Tr
ad
e a
nd
dev
elo
pm
en
t i
nd
ex
CO
UN
TR
YP
RO
FIL
ES
CO
UN
TR
YP
RO
FIL
ES
82
Selected indicators (2005 or latest reporting year)
TDI profi le
TDI InputMI OutcomeMI
2005 2006 2005 2006 2005 2006
Score
Rank
Canada
Population in millions 32.30
Area (km2) 9,093,510
GDP (constant 2000 $ in billions) 809.50
GDP per capita (constant 2000 $) 25,064
Merchandise and service export (% of World) 5.71
Applied trade-weighted average tariff (%) 2.77
650 650 757 760 543 539
11 10 13 14 9 10
InputMI 2006 OutcomeMI 2006
Climbing the TDI ladder Benchmarking TDI
42 38 37
57
145
99
65
91
19
80 86
0
20
40
60
80
100
120
140
160
HC PI FI DF IF IQ ET MS ES OT MA
131
408
0
50
100
150
200
250
300
350
400
450
TP EW
650 650
757 760
543 539
0
100
200
300
400
500
600
700
800
TDI2005 TDI2006 IMI2005 IMI2006 OMI2005 OMI2006
650697
395467
542
640
509
0
100
200
300
400
500
600
700
800
TDI NA LDC DVG EU10 DEV E7
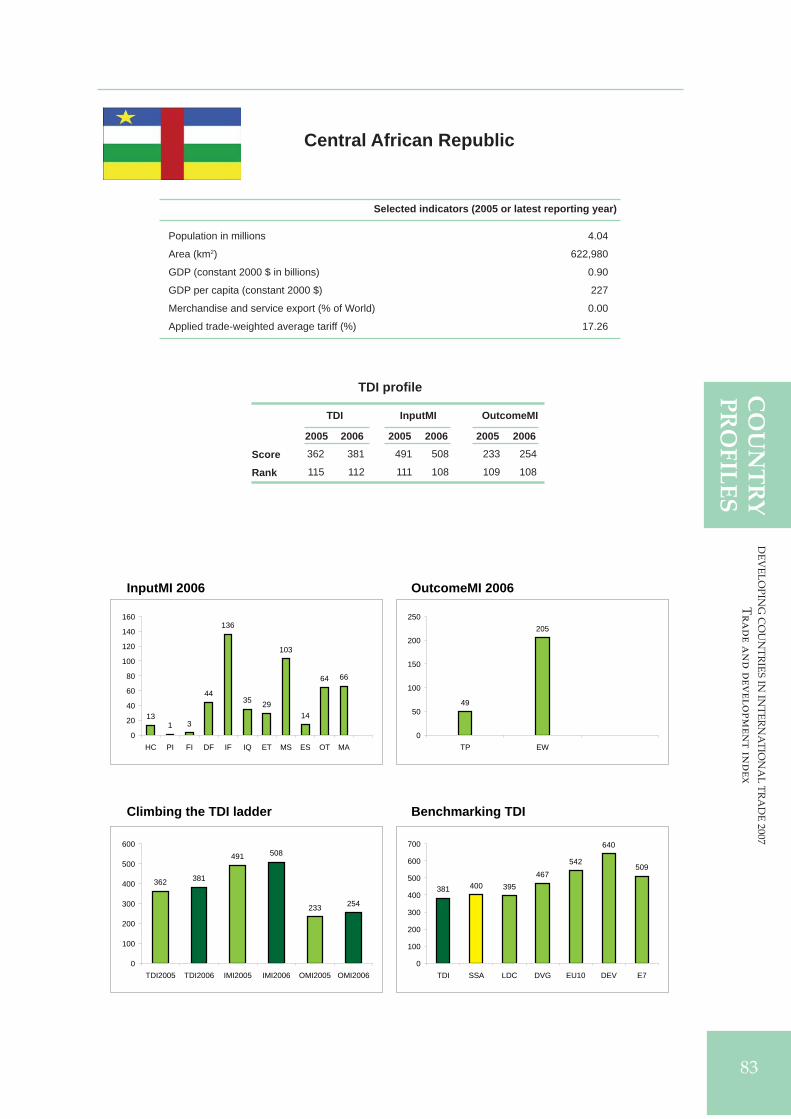
83
DE
VE
LO
PIN
G C
OU
NT
RIE
S IN
INT
ER
NA
TIO
NA
L T
RA
DE
20
07
Tr
ad
e a
nd
dev
elo
pm
en
t in
dex
CO
UN
TR
YP
RO
FIL
ES
83
TDI profi le
TDI InputMI OutcomeMI
2005 2006 2005 2006 2005 2006
Score
Rank
Selected indicators (2005 or latest reporting year)
Central African Republic
Population in millions 4.04
Area (km2) 622,980
GDP (constant 2000 $ in billions) 0.90
GDP per capita (constant 2000 $) 227
Merchandise and service export (% of World) 0.00
Applied trade-weighted average tariff (%) 17.26
362 381 491 508 233 254
115 112 111 108 109 108
InputMI 2006 OutcomeMI 2006
Climbing the TDI ladder Benchmarking TDI
131 3
44
136
35 29
103
14
64 66
0
20
40
60
80
100
120
140
160
HC PI FI DF IF IQ ET MS ES OT MA
49
205
0
50
100
150
200
250
TP EW
362 381
491 508
233 254
0
100
200
300
400
500
600
TDI2005 TDI2006 IMI2005 IMI2006 OMI2005 OMI2006
381 400 395467
542
640
509
0
100
200
300
400
500
600
700
TDI SSA LDC DVG EU10 DEV E7

84
DE
VE
LO
PIN
G C
OU
NT
RIE
S I
N I
NT
ER
NA
TIO
NA
L T
RA
DE
20
07
Tr
ad
e a
nd
dev
elo
pm
en
t i
nd
ex
CO
UN
TR
YP
RO
FIL
ES
CO
UN
TR
YP
RO
FIL
ES
84
Selected indicators (2005 or latest reporting year)
TDI profi le
TDI InputMI OutcomeMI
2005 2006 2005 2006 2005 2006
Score
Rank
Chad
Population in millions 9.75
Area (km2) 1,259,200
GDP (constant 2000 $ in billions) 2.60
GDP per capita (constant 2000 $) 267
Merchandise and service export (% of World) 0.02
Applied trade-weighted average tariff (%) 13.27
354 392 490 545 218 239
118 105 112 83 116 113
InputMI 2006 OutcomeMI 2006
Climbing the TDI ladder Benchmarking TDI
19
0 2
66
141
41 36
98
4
67 71
0
20
40
60
80
100
120
140
160
HC PI FI DF IF IQ ET MS ES OT MA
49
190
020406080
100120140160180200
TP EW
354392
490545
218 239
0
100
200
300
400
500
600
TDI2005 TDI2006 IMI2005 IMI2006 OMI2005 OMI2006
392 400 395467
542
640
509
0
100
200
300
400
500
600
700
TDI SSA LDC DVG EU10 DEV E7

85
DE
VE
LO
PIN
G C
OU
NT
RIE
S IN
INT
ER
NA
TIO
NA
L T
RA
DE
20
07
Tr
ad
e a
nd
dev
elo
pm
en
t in
dex
CO
UN
TR
YP
RO
FIL
ES
85
TDI profi le
TDI InputMI OutcomeMI
2005 2006 2005 2006 2005 2006
Score
Rank
Selected indicators (2005 or latest reporting year)
Chile
Population in millions 16.30
Area (km2) 748,800
GDP (constant 2000 $ in billions) 93.20
GDP per capita (constant 2000 $) 5,721
Merchandise and service export (% of World) 0.61
Applied trade-weighted average tariff (%) 5.99
515 522 660 671 369 373
38 37 31 32 57 59
InputMI 2006 OutcomeMI 2006
Climbing the TDI ladder Benchmarking TDI
2316
28
62
10290
64
99
17
83 88
0
20
40
60
80
100
120
HC PI FI DF IF IQ ET MS ES OT MA
82
291
0
50
100
150
200
250
300
350
TP EW
515 522
660 671
369 373
0
100
200
300
400
500
600
700
800
TDI2005 TDI2006 IMI2005 IMI2006 OMI2005 OMI2006
522472
395467
542
640
509
0
100
200
300
400
500
600
700
TDI LAC LDC DVG EU10 DEV E7

86
DE
VE
LO
PIN
G C
OU
NT
RIE
S I
N I
NT
ER
NA
TIO
NA
L T
RA
DE
20
07
Tr
ad
e a
nd
dev
elo
pm
en
t i
nd
ex
86
CO
UN
TR
YP
RO
FIL
ES
Selected indicators (2005 or latest reporting year)
TDI profi le
TDI InputMI OutcomeMI
2005 2006 2005 2006 2005 2006
Score
Rank
China
Population in millions 1,304.50
Area (km2) 9,326,410
GDP (constant 2000 $ in billions) 1,889.90
GDP per capita (constant 2000 $) 1,449
Merchandise and service export (% of World) 9.34
Applied trade-weighted average tariff (%) 4.90
550 577 658 676 442 477
27 25 32 30 33 20
InputMI 2006 OutcomeMI 2006
Climbing the TDI ladder Benchmarking TDI
15
53 55
77
100
5058
96
13
78 82
0
20
40
60
80
100
120
HC PI FI DF IF IQ ET MS ES OT MA
155
322
0
50
100
150
200
250
300
350
TP EW
550 577658 676
442477
0
100
200
300
400
500
600
700
800
TDI2005 TDI2006 IMI2005 IMI2006 OMI2005 OMI2006
577 554
395467
542
640
509
0
100
200
300
400
500
600
700
TDI EAP LDC DVG EU10 DEV E7
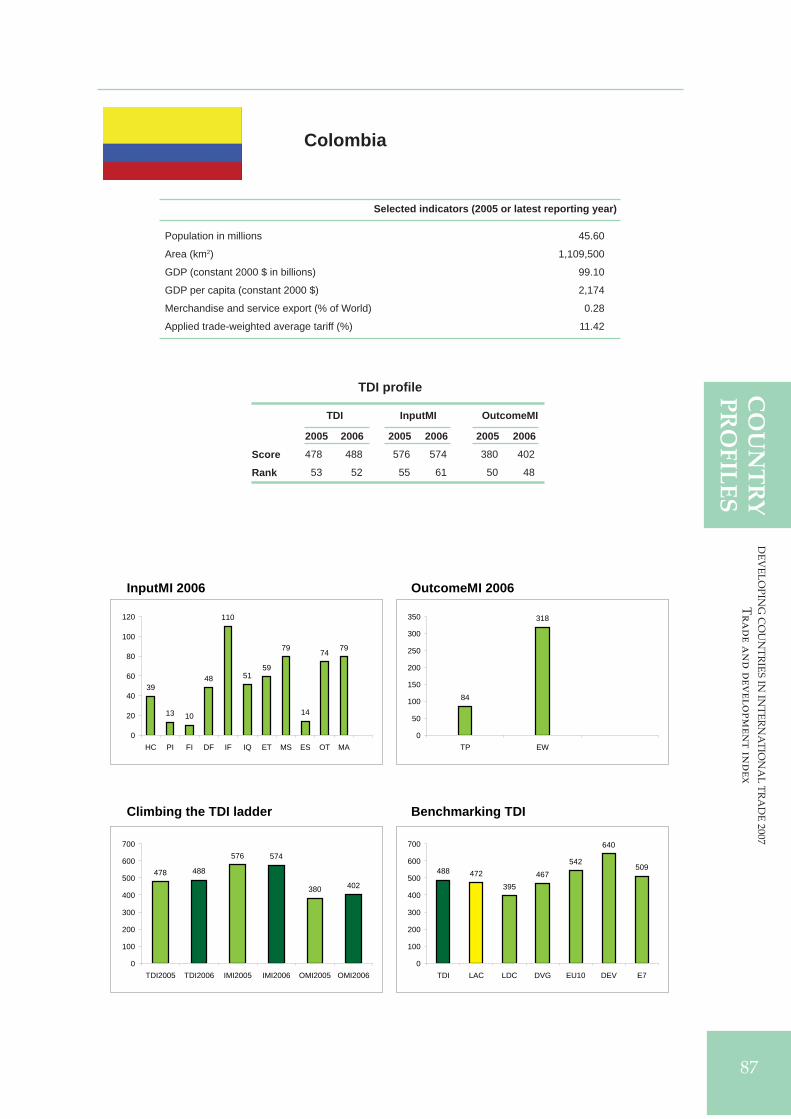
DE
VE
LO
PIN
G C
OU
NT
RIE
S IN
INT
ER
NA
TIO
NA
L T
RA
DE
20
07
Tr
ad
e a
nd
dev
elo
pm
en
t in
dex
87
CO
UN
TR
YP
RO
FIL
ES
TDI profi le
TDI InputMI OutcomeMI
2005 2006 2005 2006 2005 2006
Score
Rank
Selected indicators (2005 or latest reporting year)
Colombia
Population in millions 45.60
Area (km2) 1,109,500
GDP (constant 2000 $ in billions) 99.10
GDP per capita (constant 2000 $) 2,174
Merchandise and service export (% of World) 0.28
Applied trade-weighted average tariff (%) 11.42
478 488 576 574 380 402
53 52 55 61 50 48
InputMI 2006 OutcomeMI 2006
Climbing the TDI ladder Benchmarking TDI
39
13 10
48
110
5159
79
14
74 79
0
20
40
60
80
100
120
HC PI FI DF IF IQ ET MS ES OT MA
84
318
0
50
100
150
200
250
300
350
TP EW
478 488
576 574
380 402
0
100
200
300
400
500
600
700
TDI2005 TDI2006 IMI2005 IMI2006 OMI2005 OMI2006
488 472
395467
542
640
509
0
100
200
300
400
500
600
700
TDI LAC LDC DVG EU10 DEV E7

88
DE
VE
LO
PIN
G C
OU
NT
RIE
S I
N I
NT
ER
NA
TIO
NA
L T
RA
DE
20
07
Tr
ad
e a
nd
dev
elo
pm
en
t i
nd
ex
88
CO
UN
TR
YP
RO
FIL
ES
Selected indicators (2005 or latest reporting year)
TDI profi le
TDI InputMI OutcomeMI
2005 2006 2005 2006 2005 2006
Score
Rank
Costa Rica
Population in millions 4.33
Area (km2) 51,060
GDP (constant 2000 $ in billions) 19.50
GDP per capita (constant 2000 $) 4,499
Merchandise and service export (% of World) 0.17
Applied trade-weighted average tariff (%) 4.14
493 503 613 617 372 389
45 44 42 42 54 53
InputMI 2006 OutcomeMI 2006
Climbing the TDI ladder Benchmarking TDI
36
16 14
50
107
77
6170
15
83 87
0
20
40
60
80
100
120
HC PI FI DF IF IQ ET MS ES OT MA
90
299
0
50
100
150
200
250
300
350
TP EW
493 503
613 617
372 389
0
100
200
300
400
500
600
700
TDI2005 TDI2006 IMI2005 IMI2006 OMI2005 OMI2006
503472
395467
542
640
509
0
100
200
300
400
500
600
700
TDI LAC LDC DVG EU10 DEV E7

DE
VE
LO
PIN
G C
OU
NT
RIE
S IN
INT
ER
NA
TIO
NA
L T
RA
DE
20
07
Tr
ad
e a
nd
dev
elo
pm
en
t in
dex
89
CO
UN
TR
YP
RO
FIL
ES
TDI profi le
TDI InputMI OutcomeMI
2005 2006 2005 2006 2005 2006
Score
Rank
Selected indicators (2005 or latest reporting year)
Côte d’Ivoire
Population in millions 18.15
Area (km2) 318,000
GDP (constant 2000 $ in billions) 10.50
GDP per capita (constant 2000 $) 577
Merchandise and service export (% of World) 0.11
Applied trade-weighted average tariff (%) 7.38
371 387 532 556 209 217
112 107 87 76 118 119
InputMI 2006 OutcomeMI 2006
Climbing the TDI ladder Benchmarking TDI
17
1 6
52
131
4451
97
13
71 73
0
20
40
60
80
100
120
140
HC PI FI DF IF IQ ET MS ES OT MA
74
143
0
20
40
60
80
100
120
140
160
TP EW
371 387
532 556
209 217
0
100
200
300
400
500
600
TDI2005 TDI2006 IMI2005 IMI2006 OMI2005 OMI2006
387 400 395467
542
640
509
0
100
200
300
400
500
600
700
TDI SSA LDC DVG EU10 DEV E7

90
DE
VE
LO
PIN
G C
OU
NT
RIE
S I
N I
NT
ER
NA
TIO
NA
L T
RA
DE
20
07
Tr
ad
e a
nd
dev
elo
pm
en
t i
nd
ex
90
CO
UN
TR
YP
RO
FIL
ES
Selected indicators (2005 or latest reporting year)
TDI profi le
TDI InputMI OutcomeMI
2005 2006 2005 2006 2005 2006
Score
Rank
Czech Republic
Population in millions 10.23
Area (km2) 77,260
GDP (constant 2000 $ in billions) 67.80
GDP per capita (constant 2000 $) 6,628
Merchandise and service export (% of World) 1.15
Applied trade-weighted average tariff (%) 2.72
562 560 653 661 470 458
25 26 35 34 20 28
InputMI 2006 OutcomeMI 2006
Climbing the TDI ladder Benchmarking TDI
38 41
15
59
91
7165
101
14
81 85
0
20
40
60
80
100
120
HC PI FI DF IF IQ ET MS ES OT MA
121
337
0
50
100
150
200
250
300
350
400
TP EW
562 560
653 661
470 458
0
100
200
300
400
500
600
700
TDI2005 TDI2006 IMI2005 IMI2006 OMI2005 OMI2006
560510
395467
542
640
509
0
100
200
300
400
500
600
700
TDI ECA LDC DVG EU10 DEV E7

DE
VE
LO
PIN
G C
OU
NT
RIE
S IN
INT
ER
NA
TIO
NA
L T
RA
DE
20
07
Tr
ad
e a
nd
dev
elo
pm
en
t in
dex
91
CO
UN
TR
YP
RO
FIL
ES
TDI profi le
TDI InputMI OutcomeMI
2005 2006 2005 2006 2005 2006
Score
Rank
Selected indicators (2005 or latest reporting year)
Democratic Republic of the Congo
Population in millions 57.55
Area (km2) 2,267,050
GDP (constant 2000 $ in billions) 5.20
GDP per capita (constant 2000 $) 91
Merchandise and service export (% of World) 0.03
Applied trade-weighted average tariff (%) 12.73
324 364 417 462 231 265
122 118 123 120 110 105
InputMI 2006 OutcomeMI 2006
Climbing the TDI ladder Benchmarking TDI
173 1
33
138
1526
77
11
70 72
0
20
40
60
80
100
120
140
160
HC PI FI DF IF IQ ET MS ES OT MA
50
215
0
50
100
150
200
250
TP EW
324364
417462
231265
050
100150200250300350400450500
TDI2005 TDI2006 IMI2005 IMI2006 OMI2005 OMI2006
364400 395
467542
640
509
0
100
200
300
400
500
600
700
TDI SSA LDC DVG EU10 DEV E7

92
DE
VE
LO
PIN
G C
OU
NT
RIE
S I
N I
NT
ER
NA
TIO
NA
L T
RA
DE
20
07
Tr
ad
e a
nd
dev
elo
pm
en
t i
nd
ex
92
CO
UN
TR
YP
RO
FIL
ES
Selected indicators (2005 or latest reporting year)
TDI profi le
TDI InputMI OutcomeMI
2005 2006 2005 2006 2005 2006
Score
Rank
Population in millions 5.42
Area (km2) 42,430
GDP (constant 2000 $ in billions) 171.20
GDP per capita (constant 2000 $) 31,612
Merchandise and service export (% of World) 2.55
Applied trade-weighted average tariff (%) 2.72
687 691 820 825 554 556
3 3 2 2 6 6
Denmark
InputMI 2006 OutcomeMI 2006
Climbing the TDI ladder Benchmarking TDI
53 51
7059
145
101
65
100
15
79 86
0
20
40
60
80
100
120
140
160
HC PI FI DF IF IQ ET MS ES OT MA
117
440
050
100150200250300350400450500
TP EW
687 691
820 825
554 556
0
100
200
300
400
500
600
700
800
900
TDI2005 TDI2006 IMI2005 IMI2006 OMI2005 OMI2006
691651
395467
542
640
509
0
100
200
300
400
500
600
700
800
TDI WE LDC DVG EU10 DEV E7

DE
VE
LO
PIN
G C
OU
NT
RIE
S IN
INT
ER
NA
TIO
NA
L T
RA
DE
20
07
Tr
ad
e a
nd
dev
elo
pm
en
t in
dex
93
CO
UN
TR
YP
RO
FIL
ES
TDI profi le
TDI InputMI OutcomeMI
2005 2006 2005 2006 2005 2006
Score
Rank
Selected indicators (2005 or latest reporting year)
Dominican Republic
Population in millions 8.89
Area (km2) 48,380
GDP (constant 2000 $ in billions) 23.40
GDP per capita (constant 2000 $) 2,630
Merchandise and service export (% of World) 0.18
Applied trade-weighted average tariff (%) 8.89
433 443 531 527 334 358
81 79 89 95 72 66
InputMI 2006 OutcomeMI 2006
Climbing the TDI ladder Benchmarking TDI
14 10 15
53
119
54 59
36
13
75 78
0
20
40
60
80
100
120
140
HC PI FI DF IF IQ ET MS ES OT MA
96
262
0
50
100
150
200
250
300
TP EW
433 443
531 527
334 358
0
100
200
300
400
500
600
TDI2005 TDI2006 IMI2005 IMI2006 OMI2005 OMI2006
443 472
395467
542
640
509
0
100
200
300
400
500
600
700
TDI LAC LDC DVG EU10 DEV E7

94
DE
VE
LO
PIN
G C
OU
NT
RIE
S I
N I
NT
ER
NA
TIO
NA
L T
RA
DE
20
07
Tr
ad
e a
nd
dev
elo
pm
en
t i
nd
ex
94
CO
UN
TR
YP
RO
FIL
ES
Selected indicators (2005 or latest reporting year)
TDI profi le
TDI InputMI OutcomeMI
2005 2006 2005 2006 2005 2006
Score
Rank
Ecuador
Population in millions 13.23
Area (km2) 276,840
GDP (constant 2000 $ in billions) 20.50
GDP per capita (constant 2000 $) 1,549
Merchandise and service export (% of World) 0.13
Applied trade-weighted average tariff (%) 9.53
424 461 511 547 337 374
85 70 100 82 70 57
InputMI 2006 OutcomeMI 2006
Climbing the TDI ladder Benchmarking TDI
11 9 9
57
108
40
62
81
15
75 79
0
20
40
60
80
100
120
HC PI FI DF IF IQ ET MS ES OT MA
66
308
0
50
100
150
200
250
300
350
TP EW
424461
511547
337374
0
100
200
300
400
500
600
TDI2005 TDI2006 IMI2005 IMI2006 OMI2005 OMI2006
461 472
395467
542
640
509
0
100
200
300
400
500
600
700
TDI LAC LDC DVG EU10 DEV E7

DE
VE
LO
PIN
G C
OU
NT
RIE
S IN
INT
ER
NA
TIO
NA
L T
RA
DE
20
07
Tr
ad
e a
nd
dev
elo
pm
en
t in
dex
95
CO
UN
TR
YP
RO
FIL
ES
TDI profi le
TDI InputMI OutcomeMI
2005 2006 2005 2006 2005 2006
Score
Rank
Selected indicators (2005 or latest reporting year)
Egypt
Population in millions 74.03
Area (km2) 995,450
GDP (constant 2000 $ in billions) 120.20
GDP per capita (constant 2000 $) 1,624
Merchandise and service export (% of World) 0.70
Applied trade-weighted average tariff (%) 13.70
399 407 564 574 234 240
98 97 62 61 108 112
InputMI 2006 OutcomeMI 2006
Climbing the TDI ladder Benchmarking TDI
167
26
46
128
50 56
80
16
72 76
0
20
40
60
80
100
120
140
HC PI FI DF IF IQ ET MS ES OT MA
77
163
0
20
40
60
80
100
120
140
160
180
TP EW
399 407
564 574
234 240
0
100
200
300
400
500
600
700
TDI2005 TDI2006 IMI2005 IMI2006 OMI2005 OMI2006
407477
395467
542
640
509
0
100
200
300
400
500
600
700
TDI MENA LDC DVG EU10 DEV E7

96
DE
VE
LO
PIN
G C
OU
NT
RIE
S I
N I
NT
ER
NA
TIO
NA
L T
RA
DE
20
07
Tr
ad
e a
nd
dev
elo
pm
en
t i
nd
ex
96
CO
UN
TR
YP
RO
FIL
ES
Selected indicators (2005 or latest reporting year)
TDI profi le
TDI InputMI OutcomeMI
2005 2006 2005 2006 2005 2006
Score
Rank
El Salvador
Population in millions 6.88
Area (km2) 20,720
GDP (constant 2000 $ in billions) 14.60
GDP per capita (constant 2000 $) 2,127
Merchandise and service export (% of World) 0.07
Applied trade-weighted average tariff (%) 6.69
456 464 560 569 351 359
68 68 67 67 64 63
InputMI 2006 OutcomeMI 2006
Climbing the TDI ladder Benchmarking TDI
22
618
26
113
59 60
86
13
7985
0
20
40
60
80
100
120
HC PI FI DF IF IQ ET MS ES OT MA
98
261
0
50
100
150
200
250
300
TP EW
456 464
560 569
351 359
0
100
200
300
400
500
600
TDI2005 TDI2006 IMI2005 IMI2006 OMI2005 OMI2006
464 472
395467
542
640
509
0
100
200
300
400
500
600
700
TDI LAC LDC DVG EU10 DEV E7

DE
VE
LO
PIN
G C
OU
NT
RIE
S IN
INT
ER
NA
TIO
NA
L T
RA
DE
20
07
Tr
ad
e a
nd
dev
elo
pm
en
t in
dex
97
CO
UN
TR
YP
RO
FIL
ES
TDI profi le
TDI InputMI OutcomeMI
2005 2006 2005 2006 2005 2006
Score
Rank
Selected indicators (2005 or latest reporting year)
Estonia
Population in millions 1.35
Area (km2) 42,390
GDP (constant 2000 $ in billions) 7.90
GDP per capita (constant 2000 $) 5,862
Merchandise and service export (% of World) 0.19
Applied trade-weighted average tariff (%) 0.89
539 536 612 603 465 469
30 33 43 47 21 24
InputMI 2006 OutcomeMI 2006
Climbing the TDI ladder Benchmarking TDI
32
18 17
57
79 81
64
77
15
7985
0
10
20
30
40
50
60
70
80
90
HC PI FI DF IF IQ ET MS ES OT MA
118
352
0
50
100
150
200
250
300
350
400
TP EW
539 536
612 603
465 469
0
100
200
300
400
500
600
700
TDI2005 TDI2006 IMI2005 IMI2006 OMI2005 OMI2006
536 510
395467
542
640
509
0
100
200
300
400
500
600
700
TDI ECA LDC DVG EU10 DEV E7

98
DE
VE
LO
PIN
G C
OU
NT
RIE
S I
N I
NT
ER
NA
TIO
NA
L T
RA
DE
20
07
Tr
ad
e a
nd
dev
elo
pm
en
t i
nd
ex
98
CO
UN
TR
YP
RO
FIL
ES
Selected indicators (2005 or latest reporting year)
TDI profi le
TDI InputMI OutcomeMI
2005 2006 2005 2006 2005 2006
Score
Rank
Ethiopia
Population in millions 71.26
Area (km2) 1,000,000
GDP (constant 2000 $ in billions) 10.00
GDP per capita (constant 2000 $) 141
Merchandise and service export (% of World) 0.05
Applied trade-weighted average tariff (%) 10.67
373 379 516 510 230 247
111 114 98 106 112 110
InputMI 2006 OutcomeMI 2006
Climbing the TDI ladder Benchmarking TDI
31
411
29
143
4537
61
8
69 72
0
20
40
60
80
100
120
140
160
HC PI FI DF IF IQ ET MS ES OT MA
66
181
020406080
100120140160180200
TP EW
373 379
516 510
230 247
0
100
200
300
400
500
600
TDI2005 TDI2006 IMI2005 IMI2006 OMI2005 OMI2006
379 400 395467
542
640
509
0
100
200
300
400
500
600
700
TDI SSA LDC DVG EU10 DEV E7

DE
VE
LO
PIN
G C
OU
NT
RIE
S IN
INT
ER
NA
TIO
NA
L T
RA
DE
20
07
Tr
ad
e a
nd
dev
elo
pm
en
t in
dex
99
CO
UN
TR
YP
RO
FIL
ES
TDI profi le
TDI InputMI OutcomeMI
2005 2006 2005 2006 2005 2006
Score
Rank
Selected indicators (2005 or latest reporting year)
Finland
Population in millions 5.25
Area (km2) 304,590
GDP (constant 2000 $ in billions) 134.90
GDP per capita (constant 2000 $) 25,713
Merchandise and service export (% of World) 1.11
Applied trade-weighted average tariff (%) 2.72
633 636 751 751 515 521
13 14 16 16 13 13
InputMI 2006 OutcomeMI 2006
Climbing the TDI ladder Benchmarking TDI
40 34 30
58
145
107
64
88
19
79 86
0
20
40
60
80
100
120
140
160
HC PI FI DF IF IQ ET MS ES OT MA
96
425
0
50
100
150
200
250
300
350
400
450
TP EW
633 636
751 751
515 521
0
100
200
300
400
500
600
700
800
TDI2005 TDI2006 IMI2005 IMI2006 OMI2005 OMI2006
636 651
395467
542
640
509
0
100
200
300
400
500
600
700
TDI WE LDC DVG EU10 DEV E7

100
DE
VE
LO
PIN
G C
OU
NT
RIE
S I
N I
NT
ER
NA
TIO
NA
L T
RA
DE
20
07
Tr
ad
e a
nd
dev
elo
pm
en
t i
nd
ex
100
CO
UN
TR
YP
RO
FIL
ES
Selected indicators (2005 or latest reporting year)
TDI profi le
TDI InputMI OutcomeMI
2005 2006 2005 2006 2005 2006
Score
Rank
France
Population in millions 60.87
Area (km2) 550,100
GDP (constant 2000 $ in billions) 1,430.10
GDP per capita (constant 2000 $) 23,494
Merchandise and service export (% of World) 9.74
Applied trade-weighted average tariff (%) 2.72
663 664 773 771 552 556
9 8 9 10 7 6
InputMI 2006 OutcomeMI 2006
Climbing the TDI ladder Benchmarking TDI
46
64
4052
145
84
65
98
11
79 86
0
20
40
60
80
100
120
140
160
HC PI FI DF IF IQ ET MS ES OT MA
151
405
0
50
100
150
200
250
300
350
400
450
TP EW
663 664
773 771
552 556
0
100
200
300
400
500
600
700
800
900
TDI2005 TDI2006 IMI2005 IMI2006 OMI2005 OMI2006
664 651
395467
542
640
509
0
100
200
300
400
500
600
700
TDI WE LDC DVG EU10 DEV E7

DE
VE
LO
PIN
G C
OU
NT
RIE
S IN
INT
ER
NA
TIO
NA
L T
RA
DE
20
07
Tr
ad
e a
nd
dev
elo
pm
en
t in
dex
101
CO
UN
TR
YP
RO
FIL
ES
TDI profi le
TDI InputMI OutcomeMI
2005 2006 2005 2006 2005 2006
Score
Rank
Selected indicators (2005 or latest reporting year)
Georgia
Population in millions 4.47
Area (km2) 69,490
GDP (constant 2000 $ in billions) 4.30
GDP per capita (constant 2000 $) 971
Merchandise and service export (% of World) 0.03
Applied trade-weighted average tariff (%) 9.78
478 475 559 559 397 390
53 62 69 73 45 51
InputMI 2006 OutcomeMI 2006
Climbing the TDI ladder Benchmarking TDI
11 164
41
133
38
54
84
16
79 82
0
20
40
60
80
100
120
140
HC PI FI DF IF IQ ET MS ES OT MA
90
299
0
50
100
150
200
250
300
350
TP EW
478 475
559 559
397 390
0
100
200
300
400
500
600
TDI2005 TDI2006 IMI2005 IMI2006 OMI2005 OMI2006
475510
395467
542
640
509
0
100
200
300
400
500
600
700
TDI ECA LDC DVG EU10 DEV E7

102
DE
VE
LO
PIN
G C
OU
NT
RIE
S I
N I
NT
ER
NA
TIO
NA
L T
RA
DE
20
07
Tr
ad
e a
nd
dev
elo
pm
en
t i
nd
ex
102
CO
UN
TR
YP
RO
FIL
ES
Selected indicators (2005 or latest reporting year)
TDI profi le
TDI InputMI OutcomeMI
2005 2006 2005 2006 2005 2006
Score
Rank
Population in millions 82.47
Area (km2) 348,770
GDP (constant 2000 $ in billions) 1,971.50
GDP per capita (constant 2000 $) 23,906
Merchandise and service export (% of World) 16.26
Applied trade-weighted average tariff (%) 2.72
Germany
689 696 800 799 577 592
2 2 4 4 2 2
InputMI 2006 OutcomeMI 2006
Climbing the TDI ladder Benchmarking TDI
46
74
51 54
145
94
66
88
16
79 86
0
20
40
60
80
100
120
140
160
HC PI FI DF IF IQ ET MS ES OT MA
195
397
0
50
100
150
200
250
300
350
400
450
TP EW
689 696
800 799
577 592
0
100
200
300
400
500
600
700
800
900
TDI2005 TDI2006 IMI2005 IMI2006 OMI2005 OMI2006
696651
395467
542
640
509
0
100
200
300
400
500
600
700
800
TDI WE LDC DVG EU10 DEV E7
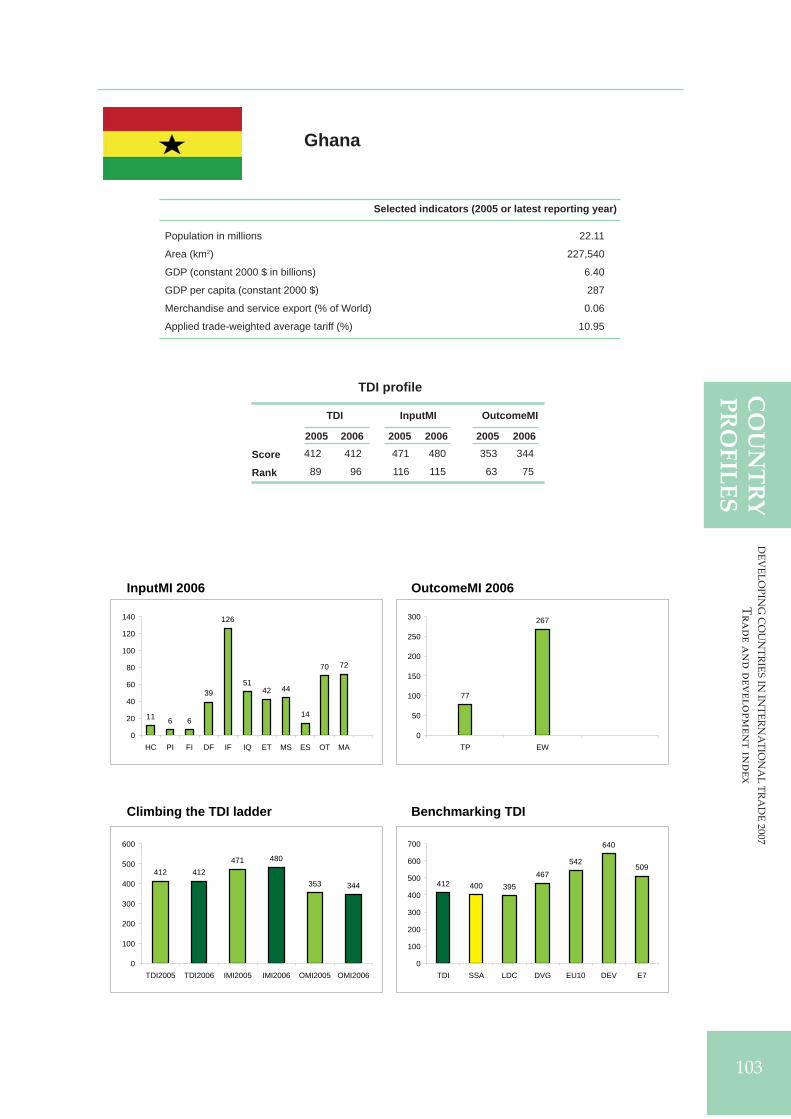
DE
VE
LO
PIN
G C
OU
NT
RIE
S IN
INT
ER
NA
TIO
NA
L T
RA
DE
20
07
Tr
ad
e a
nd
dev
elo
pm
en
t in
dex
103
CO
UN
TR
YP
RO
FIL
ES
TDI profi le
TDI InputMI OutcomeMI
2005 2006 2005 2006 2005 2006
Score
Rank
Selected indicators (2005 or latest reporting year)
Ghana
Population in millions 22.11
Area (km2) 227,540
GDP (constant 2000 $ in billions) 6.40
GDP per capita (constant 2000 $) 287
Merchandise and service export (% of World) 0.06
Applied trade-weighted average tariff (%) 10.95
412 412 471 480 353 344
89 96 116 115 63 75
InputMI 2006 OutcomeMI 2006
Climbing the TDI ladder Benchmarking TDI
11 6 6
39
126
5142 44
14
70 72
0
20
40
60
80
100
120
140
HC PI FI DF IF IQ ET MS ES OT MA
77
267
0
50
100
150
200
250
300
TP EW
412 412471 480
353 344
0
100
200
300
400
500
600
TDI2005 TDI2006 IMI2005 IMI2006 OMI2005 OMI2006
412 400 395467
542
640
509
0
100
200
300
400
500
600
700
TDI SSA LDC DVG EU10 DEV E7
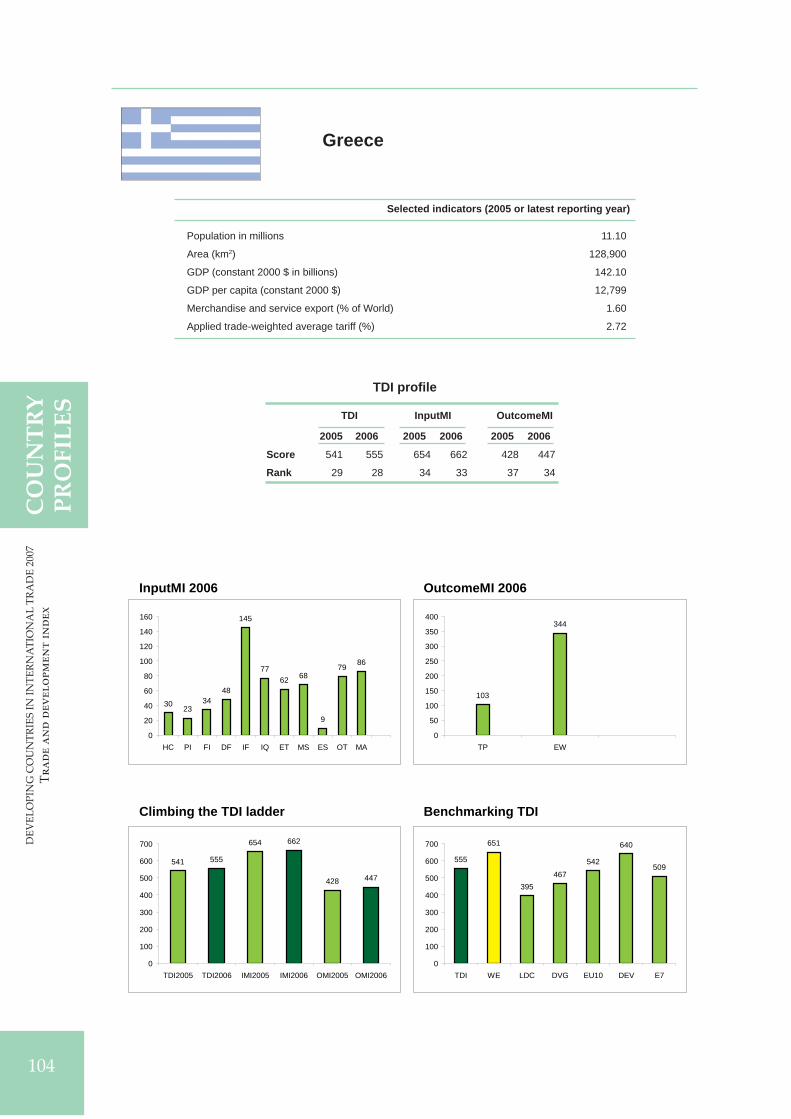
104
DE
VE
LO
PIN
G C
OU
NT
RIE
S I
N I
NT
ER
NA
TIO
NA
L T
RA
DE
20
07
Tr
ad
e a
nd
dev
elo
pm
en
t i
nd
ex
104
CO
UN
TR
YP
RO
FIL
ES
Selected indicators (2005 or latest reporting year)
TDI profi le
TDI InputMI OutcomeMI
2005 2006 2005 2006 2005 2006
Score
Rank
Greece
Population in millions 11.10
Area (km2) 128,900
GDP (constant 2000 $ in billions) 142.10
GDP per capita (constant 2000 $) 12,799
Merchandise and service export (% of World) 1.60
Applied trade-weighted average tariff (%) 2.72
541 555 654 662 428 447
29 28 34 33 37 34
InputMI 2006 OutcomeMI 2006
Climbing the TDI ladder Benchmarking TDI
30 2334
48
145
7762 68
9
79 86
0
20
40
60
80
100
120
140
160
HC PI FI DF IF IQ ET MS ES OT MA
103
344
0
50
100
150
200
250
300
350
400
TP EW
541 555
654 662
428 447
0
100
200
300
400
500
600
700
TDI2005 TDI2006 IMI2005 IMI2006 OMI2005 OMI2006
555
651
395467
542
640
509
0
100
200
300
400
500
600
700
TDI WE LDC DVG EU10 DEV E7

DE
VE
LO
PIN
G C
OU
NT
RIE
S IN
INT
ER
NA
TIO
NA
L T
RA
DE
20
07
Tr
ad
e a
nd
dev
elo
pm
en
t in
dex
105
CO
UN
TR
YP
RO
FIL
ES
TDI profi le
TDI InputMI OutcomeMI
2005 2006 2005 2006 2005 2006
Score
Rank
Selected indicators (2005 or latest reporting year)
Guatemala
Population in millions 12.60
Area (km2) 108,430
GDP (constant 2000 $ in billions) 21.90
GDP per capita (constant 2000 $) 1,734
Merchandise and service export (% of World) 0.08
Applied trade-weighted average tariff (%) 5.82
409 423 530 541 288 304
92 93 91 86 88 90
InputMI 2006 OutcomeMI 2006
Climbing the TDI ladder Benchmarking TDI
168 9
34
113
51 52
76
14
82 86
0
20
40
60
80
100
120
HC PI FI DF IF IQ ET MS ES OT MA
90
214
0
50
100
150
200
250
TP EW
409 423
530 541
288 304
0
100
200
300
400
500
600
TDI2005 TDI2006 IMI2005 IMI2006 OMI2005 OMI2006
423472
395467
542
640
509
0
100
200
300
400
500
600
700
TDI LAC LDC DVG EU10 DEV E7

106
DE
VE
LO
PIN
G C
OU
NT
RIE
S I
N I
NT
ER
NA
TIO
NA
L T
RA
DE
20
07
Tr
ad
e a
nd
dev
elo
pm
en
t i
nd
ex
106
CO
UN
TR
YP
RO
FIL
ES
Selected indicators (2005 or latest reporting year)
TDI profi le
TDI InputMI OutcomeMI
2005 2006 2005 2006 2005 2006
Score
Rank
Guinea
Population in millions 9.40
Area (km2) 245,720
GDP (constant 2000 $ in billions) 3.60
GDP per capita (constant 2000 $) 385
Merchandise and service export (% of World) 0.01
Applied trade-weighted average tariff (%) 12.66
365 372 467 478 263 265
114 116 118 116 101 105
InputMI 2006 OutcomeMI 2006
Climbing the TDI ladder Benchmarking TDI
9 3 2
37
131
45 50 52
11
69 68
0
20
40
60
80
100
120
140
HC PI FI DF IF IQ ET MS ES OT MA
50
215
0
50
100
150
200
250
TP EW
365 372
467 478
263 265
0
100
200
300
400
500
600
TDI2005 TDI2006 IMI2005 IMI2006 OMI2005 OMI2006
372 400 395467
542
640
509
0
100
200
300
400
500
600
700
TDI SSA LDC DVG EU10 DEV E7

DE
VE
LO
PIN
G C
OU
NT
RIE
S IN
INT
ER
NA
TIO
NA
L T
RA
DE
20
07
Tr
ad
e a
nd
dev
elo
pm
en
t in
dex
107
CO
UN
TR
YP
RO
FIL
ES
TDI profi le
TDI InputMI OutcomeMI
2005 2006 2005 2006 2005 2006
Score
Rank
Selected indicators (2005 or latest reporting year)
Guinea-Bissau
Population in millions 1.59
Area (km2) 28,120
GDP (constant 2000 $ in billions) 0.20
GDP per capita (constant 2000 $) 135
Merchandise and service export (% of World) 0.00
Applied trade-weighted average tariff (%) 11.65
327 339 434 461 219 216
121 122 122 121 114 120
InputMI 2006 OutcomeMI 2006
Climbing the TDI ladder Benchmarking TDI
19
1 1
27
115
3925
89
10
68 68
0
20
40
60
80
100
120
140
HC PI FI DF IF IQ ET MS ES OT MA
37
179
020406080
100120140160180200
TP EW
327 339
434461
219 216
050
100150200250300350400450500
TDI2005 TDI2006 IMI2005 IMI2006 OMI2005 OMI2006
339400 395
467542
640
509
0
100
200
300
400
500
600
700
TDI SSA LDC DVG EU10 DEV E7

108
DE
VE
LO
PIN
G C
OU
NT
RIE
S I
N I
NT
ER
NA
TIO
NA
L T
RA
DE
20
07
Tr
ad
e a
nd
dev
elo
pm
en
t i
nd
ex
108
CO
UN
TR
YP
RO
FIL
ES
Selected indicators (2005 or latest reporting year)
TDI profi le
TDI InputMI OutcomeMI
2005 2006 2005 2006 2005 2006
Score
Rank
Guyana
Population in millions 0.75
Area (km2) 196,850
GDP (constant 2000 $ in billions) 0.70
GDP per capita (constant 2000 $) 980
Merchandise and service export (% of World) 0.02
Applied trade-weighted average tariff (%) 11.50
457 465 545 555 369 374
67 67 77 77 57 57
InputMI 2006 OutcomeMI 2006
Climbing the TDI ladder Benchmarking TDI
32
621
42
120
49 46
78
16
71 73
0
20
40
60
80
100
120
140
HC PI FI DF IF IQ ET MS ES OT MA
105
270
0
50
100
150
200
250
300
TP EW
457 465
545 555
369 374
0
100
200
300
400
500
600
TDI2005 TDI2006 IMI2005 IMI2006 OMI2005 OMI2006
465 472
395467
542
640
509
0
100
200
300
400
500
600
700
TDI LAC LDC DVG EU10 DEV E7
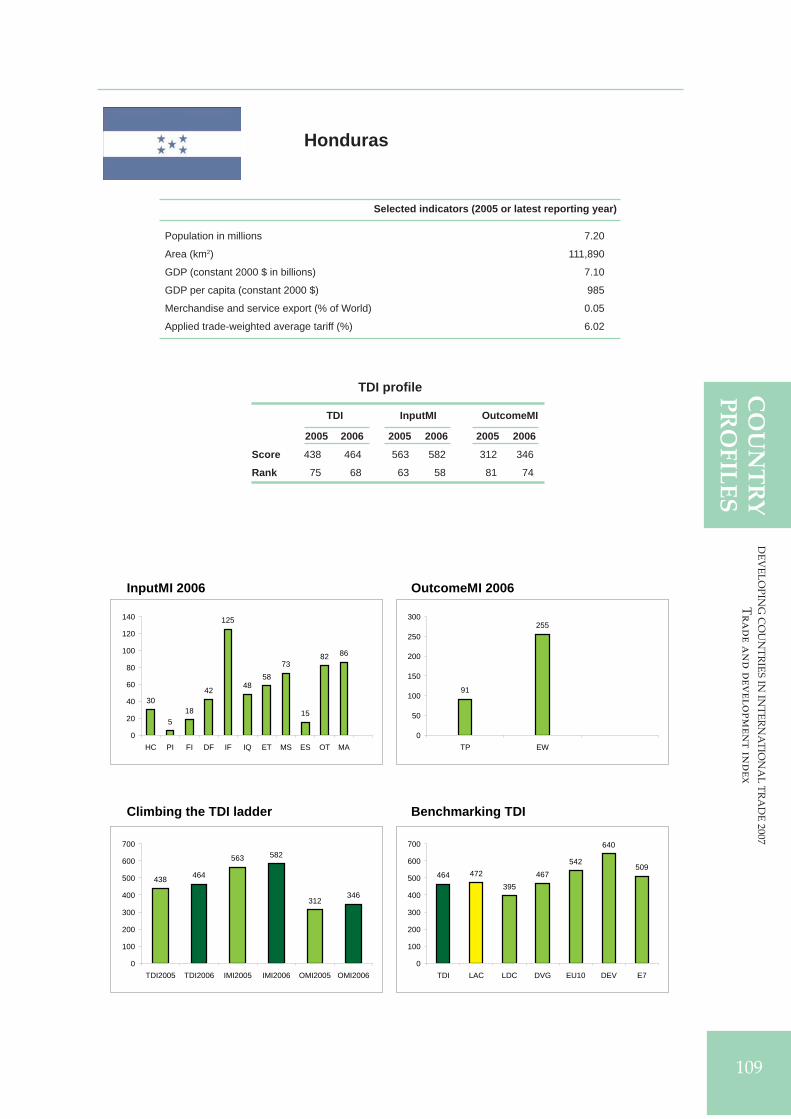
DE
VE
LO
PIN
G C
OU
NT
RIE
S IN
INT
ER
NA
TIO
NA
L T
RA
DE
20
07
Tr
ad
e a
nd
dev
elo
pm
en
t in
dex
109
CO
UN
TR
YP
RO
FIL
ES
TDI profi le
TDI InputMI OutcomeMI
2005 2006 2005 2006 2005 2006
Score
Rank
Selected indicators (2005 or latest reporting year)
Honduras
Population in millions 7.20
Area (km2) 111,890
GDP (constant 2000 $ in billions) 7.10
GDP per capita (constant 2000 $) 985
Merchandise and service export (% of World) 0.05
Applied trade-weighted average tariff (%) 6.02
438 464 563 582 312 346
75 68 63 58 81 74
InputMI 2006 OutcomeMI 2006
Climbing the TDI ladder Benchmarking TDI
30
518
42
125
4858
73
15
82 86
0
20
40
60
80
100
120
140
HC PI FI DF IF IQ ET MS ES OT MA
91
255
0
50
100
150
200
250
300
TP EW
438 464
563 582
312346
0
100
200
300
400
500
600
700
TDI2005 TDI2006 IMI2005 IMI2006 OMI2005 OMI2006
464 472
395467
542
640
509
0
100
200
300
400
500
600
700
TDI LAC LDC DVG EU10 DEV E7

110
DE
VE
LO
PIN
G C
OU
NT
RIE
S I
N I
NT
ER
NA
TIO
NA
L T
RA
DE
20
07
Tr
ad
e a
nd
dev
elo
pm
en
t i
nd
ex
110
CO
UN
TR
YP
RO
FIL
ES
Selected indicators (2005 or latest reporting year)
TDI profi le
TDI InputMI OutcomeMI
2005 2006 2005 2006 2005 2006
Score
Rank
Hungary
Population in millions 10.09
Area (km2) 89,610
GDP (constant 2000 $ in billions) 57.70
GDP per capita (constant 2000 $) 5,720
Merchandise and service export (% of World) 1.06
Applied trade-weighted average tariff (%) 2.72
527 539 593 615 460 462
34 31 46 44 24 25
InputMI 2006 OutcomeMI 2006
Climbing the TDI ladder Benchmarking TDI
38
2520
53
79 77
64
76
17
7986
0102030405060708090
100
HC PI FI DF IF IQ ET MS ES OT MA
114
348
0
50
100
150
200
250
300
350
400
TP EW
527 539593 615
460 462
0
100
200
300
400
500
600
700
TDI2005 TDI2006 IMI2005 IMI2006 OMI2005 OMI2006
539 510
395467
542
640
509
0
100
200
300
400
500
600
700
TDI ECA LDC DVG EU10 DEV E7

DE
VE
LO
PIN
G C
OU
NT
RIE
S IN
INT
ER
NA
TIO
NA
L T
RA
DE
20
07
Tr
ad
e a
nd
dev
elo
pm
en
t in
dex
111
CO
UN
TR
YP
RO
FIL
ES
TDI profi le
TDI InputMI OutcomeMI
2005 2006 2005 2006 2005 2006
Score
Rank
Selected indicators (2005 or latest reporting year)
Iceland
Population in millions 0.30
Area (km2) 100,250
GDP (constant 2000 $ in billions) 10.40
GDP per capita (constant 2000 $) 35,136
Merchandise and service export (% of World) 0.10
Applied trade-weighted average tariff (%) 2.26
624 642 753 779 495 504
15 12 15 8 15 15
InputMI 2006 OutcomeMI 2006
Climbing the TDI ladder Benchmarking TDI
53
31
70
47
145
100
60
90
19
80 83
0
20
40
60
80
100
120
140
160
HC PI FI DF IF IQ ET MS ES OT MA
74
430
050
100150200250300350400450500
TP EW
624 642
753 779
495 504
0
100
200
300
400
500
600
700
800
900
TDI2005 TDI2006 IMI2005 IMI2006 OMI2005 OMI2006
642 651
395467
542
640
509
0
100
200
300
400
500
600
700
TDI WE LDC DVG EU10 DEV E7

DE
VE
LO
PIN
G C
OU
NT
RIE
S I
N I
NT
ER
NA
TIO
NA
L T
RA
DE
20
07
Tr
ad
e a
nd
dev
elo
pm
en
t i
nd
ex
112
CO
UN
TR
YP
RO
FIL
ES
Selected indicators (2005 or latest reporting year)
TDI profi le
TDI InputMI OutcomeMI
2005 2006 2005 2006 2005 2006
Score
Rank
India
Population in millions 1,094.58
Area (km2) 2,973,190
GDP (constant 2000 $ in billions) 644.10
GDP per capita (constant 2000 $) 588
Merchandise and service export (% of World) 2.34
Applied trade-weighted average tariff (%) 14.76
413 433 549 576 277 290
88 86 75 60 91 94
InputMI 2006 OutcomeMI 2006
Climbing the TDI ladder Benchmarking TDI
17 22 15
53
134
49 52
95
12
61 65
0
20
40
60
80
100
120
140
160
HC PI FI DF IF IQ ET MS ES OT MA
102
187
020406080
100120140160180200
TP EW
413 433
549 576
277 290
0
100
200
300
400
500
600
700
TDI2005 TDI2006 IMI2005 IMI2006 OMI2005 OMI2006
433 426395
467542
640
509
0
100
200
300
400
500
600
700
TDI SA LDC DVG EU10 DEV E7

DE
VE
LO
PIN
G C
OU
NT
RIE
S IN
INT
ER
NA
TIO
NA
L T
RA
DE
20
07
Tr
ad
e a
nd
dev
elo
pm
en
t in
dex
113
CO
UN
TR
YP
RO
FIL
ES
TDI profi le
TDI InputMI OutcomeMI
2005 2006 2005 2006 2005 2006
Score
Rank
Selected indicators (2005 or latest reporting year)
Indonesia
Population in millions 220.56
Area (km2) 1,811,570
GDP (constant 2000 $ in billions) 207.70
GDP per capita (constant 2000 $) 942
Merchandise and service export (% of World) 1.45
Applied trade-weighted average tariff (%) 6.07
463 468 556 559 370 377
66 66 71 73 56 56
InputMI 2006 OutcomeMI 2006
Climbing the TDI ladder Benchmarking TDI
820
10
59
109
38
56
81
14
80 84
0
20
40
60
80
100
120
HC PI FI DF IF IQ ET MS ES OT MA
104
274
0
50
100
150
200
250
300
TP EW
463 468
556 559
370 377
0
100
200
300
400
500
600
TDI2005 TDI2006 IMI2005 IMI2006 OMI2005 OMI2006
468
554
395467
542
640
509
0
100
200
300
400
500
600
700
TDI EAP LDC DVG EU10 DEV E7

DE
VE
LO
PIN
G C
OU
NT
RIE
S I
N I
NT
ER
NA
TIO
NA
L T
RA
DE
20
07
Tr
ad
e a
nd
dev
elo
pm
en
t i
nd
ex
114
CO
UN
TR
YP
RO
FIL
ES
Selected indicators (2005 or latest reporting year)
TDI profi le
TDI InputMI OutcomeMI
2005 2006 2005 2006 2005 2006
Score
Rank
Iran (Islamic Republic of)
Population in millions 68.25
Area (km2) 1,636,200
GDP (constant 2000 $ in billions) 132.60
GDP per capita (constant 2000 $) 1,943
Merchandise and service export (% of World) 0.77
Applied trade-weighted average tariff (%) 13.84
386 423 542 573 230 273
102 93 81 63 112 99
InputMI 2006 OutcomeMI 2006
Climbing the TDI ladder Benchmarking TDI
26 2716
78
119
36
59 59
17
64 70
0
20
40
60
80
100
120
140
HC PI FI DF IF IQ ET MS ES OT MA
30
242
0
50
100
150
200
250
300
TP EW
386423
542573
230273
0
100
200
300
400
500
600
700
TDI2005 TDI2006 IMI2005 IMI2006 OMI2005 OMI2006
423477
395467
542
640
509
0
100
200
300
400
500
600
700
TDI MENA LDC DVG EU10 DEV E7

DE
VE
LO
PIN
G C
OU
NT
RIE
S IN
INT
ER
NA
TIO
NA
L T
RA
DE
20
07
Tr
ad
e a
nd
dev
elo
pm
en
t in
dex
115
CO
UN
TR
YP
RO
FIL
ES
TDI profi le
TDI InputMI OutcomeMI
2005 2006 2005 2006 2005 2006
Score
Rank
Selected indicators (2005 or latest reporting year)
Ireland
Population in millions 4.16
Area (km2) 68,890
GDP (constant 2000 $ in billions) 124.70
GDP per capita (constant 2000 $) 29,991
Merchandise and service export (% of World) 3.43
Applied trade-weighted average tariff (%) 2.72
609 630 765 784 452 476
18 15 10 6 27 22
InputMI 2006 OutcomeMI 2006
Climbing the TDI ladder Benchmarking TDI
3446
57
77
145
94
65
95
6
79 86
0
20
40
60
80
100
120
140
160
HC PI FI DF IF IQ ET MS ES OT MA
122
354
0
50
100
150
200
250
300
350
400
TP EW
609 630
765 784
452 476
0
100
200
300
400
500
600
700
800
900
TDI2005 TDI2006 IMI2005 IMI2006 OMI2005 OMI2006
630 651
395467
542
640
509
0
100
200
300
400
500
600
700
TDI WE LDC DVG EU10 DEV E7

DE
VE
LO
PIN
G C
OU
NT
RIE
S I
N I
NT
ER
NA
TIO
NA
L T
RA
DE
20
07
Tr
ad
e a
nd
dev
elo
pm
en
t i
nd
ex
116
CO
UN
TR
YP
RO
FIL
ES
Selected indicators (2005 or latest reporting year)
TDI profi le
TDI InputMI OutcomeMI
2005 2006 2005 2006 2005 2006
Score
Rank
Israel
Population in millions 6.92
Area (km2) 21,640
GDP (constant 2000 $ in billions) 127.20
GDP per capita (constant 2000 $) 18,367
Merchandise and service export (% of World) 1.09
Applied trade-weighted average tariff (%) 2.61
595 610 739 749 451 471
21 20 20 18 29 23
InputMI 2006 OutcomeMI 2006
Climbing the TDI ladder Benchmarking TDI
47 48 41 42
145
8065
93
17
8289
0
20
40
60
80
100
120
140
160
HC PI FI DF IF IQ ET MS ES OT MA
85
385
0
50
100
150
200
250
300
350
400
450
TP EW
595 610
739 749
451 471
0
100
200
300
400
500
600
700
800
TDI2005 TDI2006 IMI2005 IMI2006 OMI2005 OMI2006
610
477
395467
542
640
509
0
100
200
300
400
500
600
700
TDI MENA LDC DVG EU10 DEV E7

DE
VE
LO
PIN
G C
OU
NT
RIE
S IN
INT
ER
NA
TIO
NA
L T
RA
DE
20
07
Tr
ad
e a
nd
dev
elo
pm
en
t in
dex
117
CO
UN
TR
YP
RO
FIL
ES
TDI profi le
TDI InputMI OutcomeMI
2005 2006 2005 2006 2005 2006
Score
Rank
Selected indicators (2005 or latest reporting year)
Italy
Population in millions 58.61
Area (km2) 294,110
GDP (constant 2000 $ in billions) 1,132.80
GDP per capita (constant 2000 $) 19,329
Merchandise and service export (% of World) 7.59
Applied trade-weighted average tariff (%) 2.72
595 599 698 700 492 497
21 21 26 26 16 17
InputMI 2006 OutcomeMI 2006
Climbing the TDI ladder Benchmarking TDI
3829
3952
145
7765
83
7
79 86
0
20
40
60
80
100
120
140
160
HC PI FI DF IF IQ ET MS ES OT MA
142
354
0
50
100
150
200
250
300
350
400
TP EW
595 599
698 700
492 497
0
100
200
300
400
500
600
700
800
TDI2005 TDI2006 IMI2005 IMI2006 OMI2005 OMI2006
599651
395467
542
640
509
0
100
200
300
400
500
600
700
TDI WE LDC DVG EU10 DEV E7

DE
VE
LO
PIN
G C
OU
NT
RIE
S I
N I
NT
ER
NA
TIO
NA
L T
RA
DE
20
07
Tr
ad
e a
nd
dev
elo
pm
en
t i
nd
ex
118
CO
UN
TR
YP
RO
FIL
ES
Selected indicators (2005 or latest reporting year)
TDI profi le
TDI InputMI OutcomeMI
2005 2006 2005 2006 2005 2006
Score
Rank
Jamaica
Population in millions 2.65
Area (km2) 10,830
GDP (constant 2000 $ in billions) 8.70
GDP per capita (constant 2000 $) 3,291
Merchandise and service export (% of World) 0.13
Applied trade-weighted average tariff (%) 10.08
465 449 556 542 374 355
64 76 71 84 53 71
InputMI 2006 OutcomeMI 2006
Climbing the TDI ladder Benchmarking TDI
26
9 8
43
103
5763
70
18
72 74
0
20
40
60
80
100
120
HC PI FI DF IF IQ ET MS ES OT MA
54
301
0
50
100
150
200
250
300
350
TP EW
465 449
556 542
374 355
0
100
200
300
400
500
600
TDI2005 TDI2006 IMI2005 IMI2006 OMI2005 OMI2006
449 472
395467
542
640
509
0
100
200
300
400
500
600
700
TDI LAC LDC DVG EU10 DEV E7

DE
VE
LO
PIN
G C
OU
NT
RIE
S IN
INT
ER
NA
TIO
NA
L T
RA
DE
20
07
Tr
ad
e a
nd
dev
elo
pm
en
t in
dex
119
CO
UN
TR
YP
RO
FIL
ES
TDI profi le
TDI InputMI OutcomeMI
2005 2006 2005 2006 2005 2006
Score
Rank
Selected indicators (2005 or latest reporting year)
Japan
Population in millions 127.77
Area (km2) 364,500
GDP (constant 2000 $ in billions) 4,992.80
GDP per capita (constant 2000 $) 39,075
Merchandise and service export (% of World) 10.45
Applied trade-weighted average tariff (%) 1.75
673 668 776 771 569 564
5 6 7 10 3 5
InputMI 2006 OutcomeMI 2006
Climbing the TDI ladder Benchmarking TDI
34
64
4559
145
8166
94
17
81 85
0
20
40
60
80
100
120
140
160
HC PI FI DF IF IQ ET MS ES OT MA
146
419
0
50
100
150
200
250
300
350
400
450
TP EW
673 668
776 771
569 564
0
100
200
300
400
500
600
700
800
900
TDI2005 TDI2006 IMI2005 IMI2006 OMI2005 OMI2006
668
554
395467
542
640
509
0
100
200
300
400
500
600
700
800
TDI EAP LDC DVG EU10 DEV E7

DE
VE
LO
PIN
G C
OU
NT
RIE
S I
N I
NT
ER
NA
TIO
NA
L T
RA
DE
20
07
Tr
ad
e a
nd
dev
elo
pm
en
t i
nd
ex
120
CO
UN
TR
YP
RO
FIL
ES
Selected indicators (2005 or latest reporting year)
TDI profi le
TDI InputMI OutcomeMI
2005 2006 2005 2006 2005 2006
Score
Rank
Jordan
Population in millions 5.47
Area (km2) 88,240
GDP (constant 2000 $ in billions) 11.40
GDP per capita (constant 2000 $) 2,086
Merchandise and service export (% of World) 0.13
Applied trade-weighted average tariff (%) 12.05
469 478 615 617 323 338
60 60 41 42 79 80
InputMI 2006 OutcomeMI 2006
Climbing the TDI ladder Benchmarking TDI
31 34 3221
117
62 65
93
18
70 75
0
20
40
60
80
100
120
140
HC PI FI DF IF IQ ET MS ES OT MA
106
232
0
50
100
150
200
250
TP EW
469 478
615 617
323 338
0
100
200
300
400
500
600
700
TDI2005 TDI2006 IMI2005 IMI2006 OMI2005 OMI2006
478 477
395467
542
640
509
0
100
200
300
400
500
600
700
TDI MENA LDC DVG EU10 DEV E7

DE
VE
LO
PIN
G C
OU
NT
RIE
S IN
INT
ER
NA
TIO
NA
L T
RA
DE
20
07
Tr
ad
e a
nd
dev
elo
pm
en
t in
dex
121
CO
UN
TR
YP
RO
FIL
ES
TDI profi le
TDI InputMI OutcomeMI
2005 2006 2005 2006 2005 2006
Score
Rank
Selected indicators (2005 or latest reporting year)
Kenya
Population in millions 34.26
Area (km2) 569,140
GDP (constant 2000 $ in billions) 15.20
GDP per capita (constant 2000 $) 442
Merchandise and service export (% of World) 0.10
Applied trade-weighted average tariff (%) 7.40
449 441 534 522 363 359
71 81 86 100 61 63
InputMI 2006 OutcomeMI 2006
Climbing the TDI ladder Benchmarking TDI
27
411
43
127
4048
60
13
72 76
0
20
40
60
80
100
120
140
HC PI FI DF IF IQ ET MS ES OT MA
81
278
0
50
100
150
200
250
300
TP EW
449 441
534 522
363 359
0
100
200
300
400
500
600
TDI2005 TDI2006 IMI2005 IMI2006 OMI2005 OMI2006
441400 395
467542
640
509
0
100
200
300
400
500
600
700
TDI SSA LDC DVG EU10 DEV E7

DE
VE
LO
PIN
G C
OU
NT
RIE
S I
N I
NT
ER
NA
TIO
NA
L T
RA
DE
20
07
Tr
ad
e a
nd
dev
elo
pm
en
t i
nd
ex
122
CO
UN
TR
YP
RO
FIL
ES
Selected indicators (2005 or latest reporting year)
TDI profi le
TDI InputMI OutcomeMI
2005 2006 2005 2006 2005 2006
Score
Rank
Kuwait
Population in millions 2.54
Area (km2) 17,820
GDP (constant 2000 $ in billions) 52.20
GDP per capita (constant 2000 $) 20,578
Merchandise and service export (% of World) 0.51
Applied trade-weighted average tariff (%) 4.58
501 521 692 699 309 342
43 39 28 27 83 77
InputMI 2006 OutcomeMI 2006
Climbing the TDI ladder Benchmarking TDI
35
11
34
68
145
69 66
84
18
83 87
0
20
40
60
80
100
120
140
160
HC PI FI DF IF IQ ET MS ES OT MA
55
287
0
50
100
150
200
250
300
350
TP EW
501 521
692 699
309 342
0
100
200
300
400
500
600
700
800
TDI2005 TDI2006 IMI2005 IMI2006 OMI2005 OMI2006
521477
395467
542
640
509
0
100
200
300
400
500
600
700
TDI MENA LDC DVG EU10 DEV E7

DE
VE
LO
PIN
G C
OU
NT
RIE
S IN
INT
ER
NA
TIO
NA
L T
RA
DE
20
07
Tr
ad
e a
nd
dev
elo
pm
en
t in
dex
123
CO
UN
TR
YP
RO
FIL
ES
TDI profi le
TDI InputMI OutcomeMI
2005 2006 2005 2006 2005 2006
Score
Rank
Selected indicators (2005 or latest reporting year)
Latvia
Population in millions 2.30
Area (km2) 62,290
GDP (constant 2000 $ in billions) 11.60
GDP per capita (constant 2000 $) 5,029
Merchandise and service export (% of World) 0.12
Applied trade-weighted average tariff (%) 2.72
515 517 590 581 440 452
38 42 47 59 34 33
InputMI 2006 OutcomeMI 2006
Climbing the TDI ladder Benchmarking TDI
2939
18
47
63 65 64
79
12
7986
0102030405060708090
100
HC PI FI DF IF IQ ET MS ES OT MA
99
354
0
50
100
150
200
250
300
350
400
TP EW
515 517590 581
440 452
0
100
200
300
400
500
600
700
TDI2005 TDI2006 IMI2005 IMI2006 OMI2005 OMI2006
517 510
395467
542
640
509
0
100
200
300
400
500
600
700
TDI ECA LDC DVG EU10 DEV E7

DE
VE
LO
PIN
G C
OU
NT
RIE
S I
N I
NT
ER
NA
TIO
NA
L T
RA
DE
20
07
Tr
ad
e a
nd
dev
elo
pm
en
t i
nd
ex
124
CO
UN
TR
YP
RO
FIL
ES
Selected indicators (2005 or latest reporting year)
TDI profi le
TDI InputMI OutcomeMI
2005 2006 2005 2006 2005 2006
Score
Rank
Lebanon
Population in millions 3.58
Area (km2) 10,230
GDP (constant 2000 $ in billions) 20.30
GDP per capita (constant 2000 $) 5,672
Merchandise and service export (% of World) 0.02
Applied trade-weighted average tariff (%) 5.55
437 433 510 503 363 363
77 86 101 110 61 62
InputMI 2006 OutcomeMI 2006
Climbing the TDI ladder Benchmarking TDI
1910
3528
80
50
62
42
19
79 81
0
10
20
30
40
50
60
70
80
90
HC PI FI DF IF IQ ET MS ES OT MA
115
248
0
50
100
150
200
250
300
TP EW
437 433
510 503
363 363
0
100
200
300
400
500
600
TDI2005 TDI2006 IMI2005 IMI2006 OMI2005 OMI2006
433477
395467
542
640
509
0
100
200
300
400
500
600
700
TDI MENA LDC DVG EU10 DEV E7

DE
VE
LO
PIN
G C
OU
NT
RIE
S IN
INT
ER
NA
TIO
NA
L T
RA
DE
20
07
Tr
ad
e a
nd
dev
elo
pm
en
t in
dex
125
CO
UN
TR
YP
RO
FIL
ES
TDI profi le
TDI InputMI OutcomeMI
2005 2006 2005 2006 2005 2006
Score
Rank
Selected indicators (2005 or latest reporting year)
Lesotho
Population in millions 1.79
Area (km2) 30,350
GDP (constant 2000 $ in billions) 1.00
GDP per capita (constant 2000 $) 550
Merchandise and service export (% of World) 0.01
Applied trade-weighted average tariff (%) 16.61
403 432 503 539 302 324
95 89 107 89 86 85
InputMI 2006 OutcomeMI 2006
Climbing the TDI ladder Benchmarking TDI
45
7 310
136
54 55
78
12
68 72
0
20
40
60
80
100
120
140
160
HC PI FI DF IF IQ ET MS ES OT MA
93
231
0
50
100
150
200
250
TP EW
403432
503539
302 324
0
100
200
300
400
500
600
TDI2005 TDI2006 IMI2005 IMI2006 OMI2005 OMI2006
432400 395
467542
640
509
0
100
200
300
400
500
600
700
TDI SSA LDC DVG EU10 DEV E7

DE
VE
LO
PIN
G C
OU
NT
RIE
S I
N I
NT
ER
NA
TIO
NA
L T
RA
DE
20
07
Tr
ad
e a
nd
dev
elo
pm
en
t i
nd
ex
126
CO
UN
TR
YP
RO
FIL
ES
Selected indicators (2005 or latest reporting year)
TDI profi le
TDI InputMI OutcomeMI
2005 2006 2005 2006 2005 2006
Score
Rank
Lithuania
Population in millions 3.41
Area (km2) 62,680
GDP (constant 2000 $ in billions) 16.50
GDP per capita (constant 2000 $) 4,846
Merchandise and service export (% of World) 0.21
Applied trade-weighted average tariff (%) 2.72
537 526 618 590 456 462
31 35 40 53 26 25
InputMI 2006 OutcomeMI 2006
Climbing the TDI ladder Benchmarking TDI
36
1610
47
80
6962
90
14
7986
0102030405060708090
100
HC PI FI DF IF IQ ET MS ES OT MA
103
359
0
50
100
150
200
250
300
350
400
TP EW
537 526
618 590
456 462
0
100
200
300
400
500
600
700
TDI2005 TDI2006 IMI2005 IMI2006 OMI2005 OMI2006
526 510
395467
542
640
509
0
100
200
300
400
500
600
700
TDI ECA LDC DVG EU10 DEV E7

DE
VE
LO
PIN
G C
OU
NT
RIE
S IN
INT
ER
NA
TIO
NA
L T
RA
DE
20
07
Tr
ad
e a
nd
dev
elo
pm
en
t in
dex
127
CO
UN
TR
YP
RO
FIL
ES
TDI profi le
TDI InputMI OutcomeMI
2005 2006 2005 2006 2005 2006
Score
Rank
Selected indicators (2005 or latest reporting year)
Madagascar
Population in millions 18.61
Area (km2) 581,540
GDP (constant 2000 $ in billions) 4.30
GDP per capita (constant 2000 $) 233
Merchandise and service export (% of World) 0.03
Applied trade-weighted average tariff (%) 9.17
428 449 528 540 327 357
83 76 94 88 76 68
InputMI 2006 OutcomeMI 2006
Climbing the TDI ladder Benchmarking TDI
160 4
39
141
50 47
80
8
75 78
0
20
40
60
80
100
120
140
160
HC PI FI DF IF IQ ET MS ES OT MA
76
281
0
50
100
150
200
250
300
TP EW
428 449
528 540
327357
0
100
200
300
400
500
600
TDI2005 TDI2006 IMI2005 IMI2006 OMI2005 OMI2006
449400 395
467542
640
509
0
100
200
300
400
500
600
700
TDI SSA LDC DVG EU10 DEV E7

DE
VE
LO
PIN
G C
OU
NT
RIE
S I
N I
NT
ER
NA
TIO
NA
L T
RA
DE
20
07
Tr
ad
e a
nd
dev
elo
pm
en
t i
nd
ex
128
CO
UN
TR
YP
RO
FIL
ES
Selected indicators (2005 or latest reporting year)
TDI profi le
TDI InputMI OutcomeMI
2005 2006 2005 2006 2005 2006
Score
Rank
Malawi
Population in millions 12.88
Area (km2) 94,080
GDP (constant 2000 $ in billions) 2.00
GDP per capita (constant 2000 $) 154
Merchandise and service export (% of World) 0.01
Applied trade-weighted average tariff (%) 11.55
380 407 482 503 277 311
107 97 115 110 91 88
InputMI 2006 OutcomeMI 2006
Climbing the TDI ladder Benchmarking TDI
30
0 413
138
4740
73
12
71 74
0
20
40
60
80
100
120
140
160
HC PI FI DF IF IQ ET MS ES OT MA
60
251
0
50
100
150
200
250
300
TP EW
380407
482 503
277311
0
100
200
300
400
500
600
TDI2005 TDI2006 IMI2005 IMI2006 OMI2005 OMI2006
407 400 395467
542
640
509
0
100
200
300
400
500
600
700
TDI SSA LDC DVG EU10 DEV E7

DE
VE
LO
PIN
G C
OU
NT
RIE
S IN
INT
ER
NA
TIO
NA
L T
RA
DE
20
07
Tr
ad
e a
nd
dev
elo
pm
en
t in
dex
129
CO
UN
TR
YP
RO
FIL
ES
TDI profi le
TDI InputMI OutcomeMI
2005 2006 2005 2006 2005 2006
Score
Rank
Selected indicators (2005 or latest reporting year)
Malaysia
Population in millions 25.35
Area (km2) 328,550
GDP (constant 2000 $ in billions) 112.50
GDP per capita (constant 2000 $) 4,437
Merchandise and service export (% of World) 2.11
Applied trade-weighted average tariff (%) 4.29
562 556 716 707 407 404
25 27 24 25 44 46
InputMI 2006 OutcomeMI 2006
Climbing the TDI ladder Benchmarking TDI
3036
60
80
104
65 60
97
17
75 80
0
20
40
60
80
100
120
HC PI FI DF IF IQ ET MS ES OT MA
133
271
0
50
100
150
200
250
300
TP EW
562 556
716 707
407 404
0
100
200
300
400
500
600
700
800
TDI2005 TDI2006 IMI2005 IMI2006 OMI2005 OMI2006
556 554
395467
542
640
509
0
100
200
300
400
500
600
700
TDI EAP LDC DVG EU10 DEV E7

DE
VE
LO
PIN
G C
OU
NT
RIE
S I
N I
NT
ER
NA
TIO
NA
L T
RA
DE
20
07
Tr
ad
e a
nd
dev
elo
pm
en
t i
nd
ex
130
CO
UN
TR
YP
RO
FIL
ES
Selected indicators (2005 or latest reporting year)
TDI profi le
TDI InputMI OutcomeMI
2005 2006 2005 2006 2005 2006
Score
Rank
Mali
Population in millions 13.52
Area (km2) 1,220,190
GDP (constant 2000 $ in billions) 3.30
GDP per capita (constant 2000 $) 244
Merchandise and service export (% of World) 0.02
Applied trade-weighted average tariff (%) 10.99
376 398 538 569 213 227
110 101 82 67 117 117
InputMI 2006 OutcomeMI 2006
Climbing the TDI ladder Benchmarking TDI
20
09
43
141
5242
108
10
71 73
0
20
40
60
80
100
120
140
160
HC PI FI DF IF IQ ET MS ES OT MA
36
191
0
50
100
150
200
250
TP EW
376 398
538569
213 227
0
100
200
300
400
500
600
TDI2005 TDI2006 IMI2005 IMI2006 OMI2005 OMI2006
398 400 395467
542
640
509
0
100
200
300
400
500
600
700
TDI SSA LDC DVG EU10 DEV E7
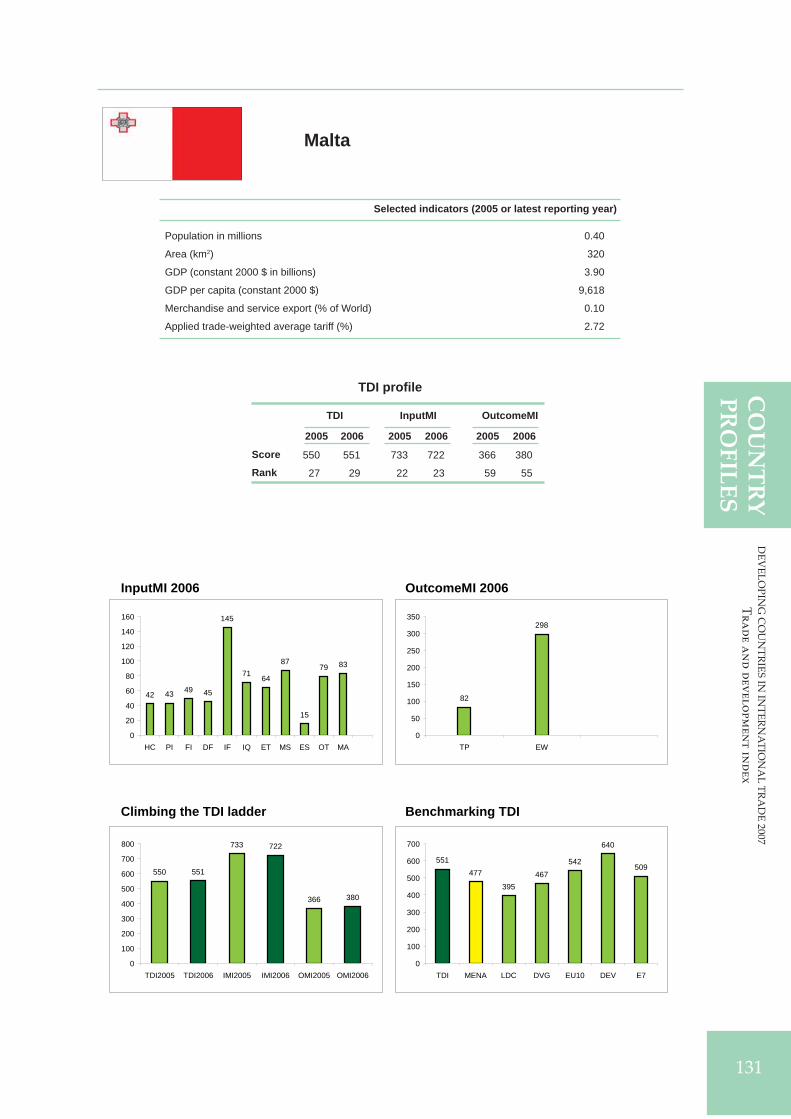
DE
VE
LO
PIN
G C
OU
NT
RIE
S IN
INT
ER
NA
TIO
NA
L T
RA
DE
20
07
Tr
ad
e a
nd
dev
elo
pm
en
t in
dex
131
CO
UN
TR
YP
RO
FIL
ES
TDI profi le
TDI InputMI OutcomeMI
2005 2006 2005 2006 2005 2006
Score
Rank
Selected indicators (2005 or latest reporting year)
Malta
Population in millions 0.40
Area (km2) 320
GDP (constant 2000 $ in billions) 3.90
GDP per capita (constant 2000 $) 9,618
Merchandise and service export (% of World) 0.10
Applied trade-weighted average tariff (%) 2.72
550 551 733 722 366 380
27 29 22 23 59 55
InputMI 2006 OutcomeMI 2006
Climbing the TDI ladder Benchmarking TDI
42 43 49 45
145
71 64
87
15
79 83
0
20
40
60
80
100
120
140
160
HC PI FI DF IF IQ ET MS ES OT MA
82
298
0
50
100
150
200
250
300
350
TP EW
550 551
733 722
366 380
0
100
200
300
400
500
600
700
800
TDI2005 TDI2006 IMI2005 IMI2006 OMI2005 OMI2006
551477
395467
542
640
509
0
100
200
300
400
500
600
700
TDI MENA LDC DVG EU10 DEV E7

DE
VE
LO
PIN
G C
OU
NT
RIE
S I
N I
NT
ER
NA
TIO
NA
L T
RA
DE
20
07
Tr
ad
e a
nd
dev
elo
pm
en
t i
nd
ex
132
CO
UN
TR
YP
RO
FIL
ES
Selected indicators (2005 or latest reporting year)
TDI profi le
TDI InputMI OutcomeMI
2005 2006 2005 2006 2005 2006
Score
Rank
Mauritania
Population in millions 3.07
Area (km2) 1,025,220
GDP (constant 2000 $ in billions) 1.30
GDP per capita (constant 2000 $) 429
Merchandise and service export (% of World) 0.00
Applied trade-weighted average tariff (%) 7.15
394 387 535 503 252 270
99 107 84 110 104 101
InputMI 2006 OutcomeMI 2006
Climbing the TDI ladder Benchmarking TDI
23
112
5
131
52 54
73
10
71 72
0
20
40
60
80
100
120
140
HC PI FI DF IF IQ ET MS ES OT MA
64
207
0
50
100
150
200
250
TP EW
394 387
535503
252 270
0
100
200
300
400
500
600
TDI2005 TDI2006 IMI2005 IMI2006 OMI2005 OMI2006
387 400 395467
542
640
509
0
100
200
300
400
500
600
700
TDI SSA LDC DVG EU10 DEV E7

DE
VE
LO
PIN
G C
OU
NT
RIE
S IN
INT
ER
NA
TIO
NA
L T
RA
DE
20
07
Tr
ad
e a
nd
dev
elo
pm
en
t in
dex
133
CO
UN
TR
YP
RO
FIL
ES
TDI profi le
TDI InputMI OutcomeMI
2005 2006 2005 2006 2005 2006
Score
Rank
Selected indicators (2005 or latest reporting year)
Mauritius
Population in millions 1.24
Area (km2) 2,030
GDP (constant 2000 $ in billions) 5.50
GDP per capita (constant 2000 $) 4,403
Merchandise and service export (% of World) 0.09
Applied trade-weighted average tariff (%) 1.93
473 490 598 623 347 357
58 50 45 40 66 68
InputMI 2006 OutcomeMI 2006
Climbing the TDI ladder Benchmarking TDI
22
39
26
57
7870
62
92
21
76 78
0102030405060708090
100
HC PI FI DF IF IQ ET MS ES OT MA
91
267
0
50
100
150
200
250
300
TP EW
473 490
598 623
347 357
0
100
200
300
400
500
600
700
TDI2005 TDI2006 IMI2005 IMI2006 OMI2005 OMI2006
490
400 395467
542
640
509
0
100
200
300
400
500
600
700
TDI SSA LDC DVG EU10 DEV E7

DE
VE
LO
PIN
G C
OU
NT
RIE
S I
N I
NT
ER
NA
TIO
NA
L T
RA
DE
20
07
Tr
ad
e a
nd
dev
elo
pm
en
t i
nd
ex
134
CO
UN
TR
YP
RO
FIL
ES
Selected indicators (2005 or latest reporting year)
TDI profi le
TDI InputMI OutcomeMI
2005 2006 2005 2006 2005 2006
Score
Rank
Mexico
Population in millions 103.09
Area (km2) 1,908,690
GDP (constant 2000 $ in billions) 636.30
GDP per capita (constant 2000 $) 6,172
Merchandise and service export (% of World) 2.79
Applied trade-weighted average tariff (%) 12.75
481 493 573 593 388 393
50 47 57 51 49 50
InputMI 2006 OutcomeMI 2006
Climbing the TDI ladder Benchmarking TDI
2616
7
51
122
59 64
84
16
6979
0
20
40
60
80
100
120
140
HC PI FI DF IF IQ ET MS ES OT MA
112
281
0
50
100
150
200
250
300
TP EW
481 493
573 593
388 393
0
100
200
300
400
500
600
700
TDI2005 TDI2006 IMI2005 IMI2006 OMI2005 OMI2006
493 472
395467
542
640
509
0
100
200
300
400
500
600
700
TDI LAC LDC DVG EU10 DEV E7

DE
VE
LO
PIN
G C
OU
NT
RIE
S IN
INT
ER
NA
TIO
NA
L T
RA
DE
20
07
Tr
ad
e a
nd
dev
elo
pm
en
t in
dex
135
CO
UN
TR
YP
RO
FIL
ES
TDI profi le
TDI InputMI OutcomeMI
2005 2006 2005 2006 2005 2006
Score
Rank
Selected indicators (2005 or latest reporting year)
Moldova
Population in millions 4.21
Area (km2) 32,870
GDP (constant 2000 $ in billions) 1.80
GDP per capita (constant 2000 $) 430
Merchandise and service export (% of World) 0.03
Applied trade-weighted average tariff (%) 3.06
466 473 506 518 426 427
62 65 104 103 40 40
InputMI 2006 OutcomeMI 2006
Climbing the TDI ladder Benchmarking TDI
29 32
917
98
3952
61
17
79 84
0
20
40
60
80
100
120
HC PI FI DF IF IQ ET MS ES OT MA
96
331
0
50
100
150
200
250
300
350
TP EW
466 473506 518
426 427
0
100
200
300
400
500
600
TDI2005 TDI2006 IMI2005 IMI2006 OMI2005 OMI2006
473510
395467
542
640
509
0
100
200
300
400
500
600
700
TDI ECA LDC DVG EU10 DEV E7

DE
VE
LO
PIN
G C
OU
NT
RIE
S I
N I
NT
ER
NA
TIO
NA
L T
RA
DE
20
07
Tr
ad
e a
nd
dev
elo
pm
en
t i
nd
ex
136
CO
UN
TR
YP
RO
FIL
ES
Selected indicators (2005 or latest reporting year)
TDI profi le
TDI InputMI OutcomeMI
2005 2006 2005 2006 2005 2006
Score
Rank
Morocco
Population in millions 30.17
Area (km2) 446,300
GDP (constant 2000 $ in billions) 40.90
GDP per capita (constant 2000 $) 1,356
Merchandise and service export (% of World) 0.41
Applied trade-weighted average tariff (%) 18.39
406 420 546 570 266 270
94 95 76 65 98 101
InputMI 2006 OutcomeMI 2006
Climbing the TDI ladder Benchmarking TDI
2518
25
51
122
60 56
83
11
56 62
0
20
40
60
80
100
120
140
HC PI FI DF IF IQ ET MS ES OT MA
95
175
020406080
100120140160180200
TP EW
406 420
546 570
266 270
0
100
200
300
400
500
600
TDI2005 TDI2006 IMI2005 IMI2006 OMI2005 OMI2006
420477
395467
542
640
509
0
100
200
300
400
500
600
700
TDI MENA LDC DVG EU10 DEV E7

DE
VE
LO
PIN
G C
OU
NT
RIE
S IN
INT
ER
NA
TIO
NA
L T
RA
DE
20
07
Tr
ad
e a
nd
dev
elo
pm
en
t in
dex
137
CO
UN
TR
YP
RO
FIL
ES
TDI profi le
TDI InputMI OutcomeMI
2005 2006 2005 2006 2005 2006
Score
Rank
Selected indicators (2005 or latest reporting year)
Mozambique
Population in millions 19.79
Area (km2) 784,090
GDP (constant 2000 $ in billions) 5.80
GDP per capita (constant 2000 $) 292
Merchandise and service export (% of World) 0.03
Applied trade-weighted average tariff (%) 9.09
392 404 503 510 280 297
100 99 107 106 90 92
InputMI 2006 OutcomeMI 2006
Climbing the TDI ladder Benchmarking TDI
21
0 1
41
136
47 52 55
10
72 75
0
20
40
60
80
100
120
140
160
HC PI FI DF IF IQ ET MS ES OT MA
56
241
0
50
100
150
200
250
300
TP EW
392 404
503 510
280 297
0
100
200
300
400
500
600
TDI2005 TDI2006 IMI2005 IMI2006 OMI2005 OMI2006
404 400 395467
542
640
509
0
100
200
300
400
500
600
700
TDI SSA LDC DVG EU10 DEV E7
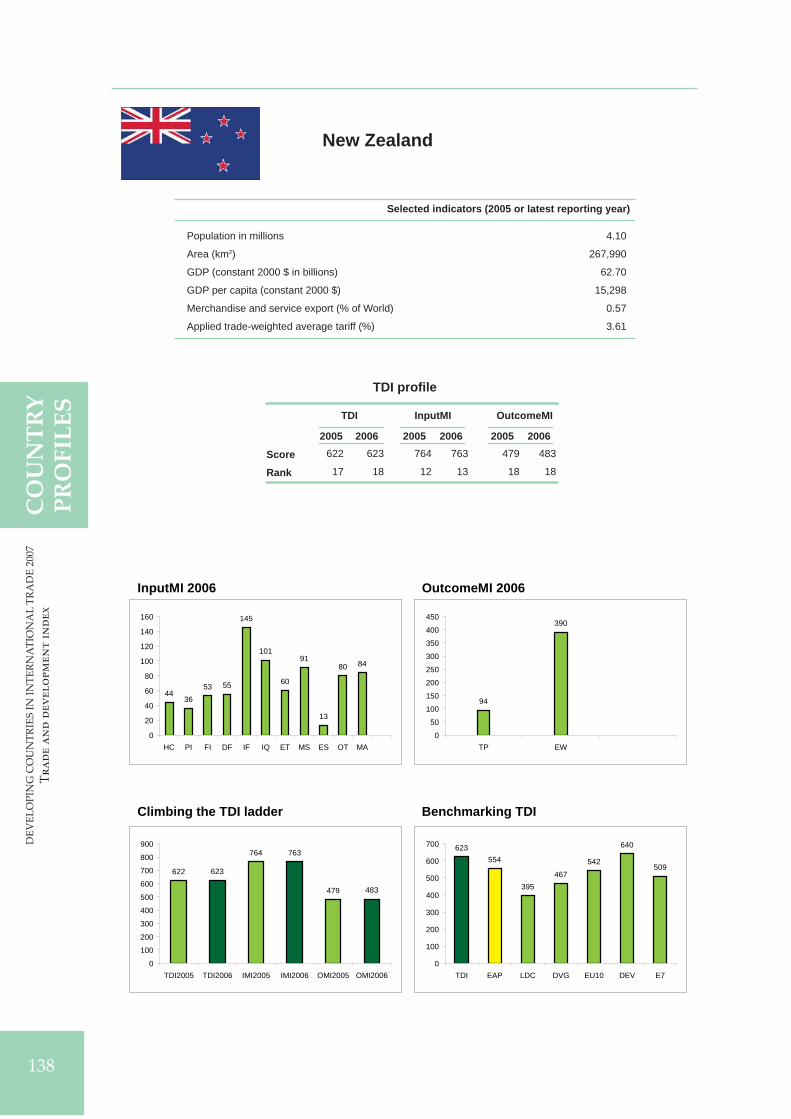
DE
VE
LO
PIN
G C
OU
NT
RIE
S I
N I
NT
ER
NA
TIO
NA
L T
RA
DE
20
07
Tr
ad
e a
nd
dev
elo
pm
en
t i
nd
ex
138
CO
UN
TR
YP
RO
FIL
ES
Selected indicators (2005 or latest reporting year)
TDI profi le
TDI InputMI OutcomeMI
2005 2006 2005 2006 2005 2006
Score
Rank
New Zealand
Population in millions 4.10
Area (km2) 267,990
GDP (constant 2000 $ in billions) 62.70
GDP per capita (constant 2000 $) 15,298
Merchandise and service export (% of World) 0.57
Applied trade-weighted average tariff (%) 3.61
622 623 764 763 479 483
17 18 12 13 18 18
InputMI 2006 OutcomeMI 2006
Climbing the TDI ladder Benchmarking TDI
4436
53 55
145
101
60
91
13
80 84
0
20
40
60
80
100
120
140
160
HC PI FI DF IF IQ ET MS ES OT MA
94
390
0
50
100
150
200
250
300
350
400
450
TP EW
622 623
764 763
479 483
0
100
200
300
400
500
600
700
800
900
TDI2005 TDI2006 IMI2005 IMI2006 OMI2005 OMI2006
623554
395467
542
640
509
0
100
200
300
400
500
600
700
TDI EAP LDC DVG EU10 DEV E7

DE
VE
LO
PIN
G C
OU
NT
RIE
S IN
INT
ER
NA
TIO
NA
L T
RA
DE
20
07
Tr
ad
e a
nd
dev
elo
pm
en
t in
dex
139
CO
UN
TR
YP
RO
FIL
ES
TDI profi le
TDI InputMI OutcomeMI
2005 2006 2005 2006 2005 2006
Score
Rank
Selected indicators (2005 or latest reporting year)
Nicaragua
Population in millions 5.15
Area (km2) 121,400
GDP (constant 2000 $ in billions) 4.60
GDP per capita (constant 2000 $) 889
Merchandise and service export (% of World) 0.02
Applied trade-weighted average tariff (%) 5.42
434 443 560 572 307 313
80 79 67 64 84 87
InputMI 2006 OutcomeMI 2006
Climbing the TDI ladder Benchmarking TDI
23
5 11
27
128
48 54
92
14
82 87
0
20
40
60
80
100
120
140
HC PI FI DF IF IQ ET MS ES OT MA
88
225
0
50
100
150
200
250
TP EW
434 443
560 572
307 313
0
100
200
300
400
500
600
700
TDI2005 TDI2006 IMI2005 IMI2006 OMI2005 OMI2006
443 472
395467
542
640
509
0
100
200
300
400
500
600
700
TDI LAC LDC DVG EU10 DEV E7

DE
VE
LO
PIN
G C
OU
NT
RIE
S I
N I
NT
ER
NA
TIO
NA
L T
RA
DE
20
07
Tr
ad
e a
nd
dev
elo
pm
en
t i
nd
ex
140
CO
UN
TR
YP
RO
FIL
ES
Selected indicators (2005 or latest reporting year)
TDI profi le
TDI InputMI OutcomeMI
2005 2006 2005 2006 2005 2006
Score
Rank
Niger
Population in millions 13.96
Area (km2) 1,266,700
GDP (constant 2000 $ in billions) 2.20
GDP per capita (constant 2000 $) 156
Merchandise and service export (% of World) 0.00
Applied trade-weighted average tariff (%) 11.93
349 362 490 502 207 222
119 120 112 112 120 118
InputMI 2006 OutcomeMI 2006
Climbing the TDI ladder Benchmarking TDI
160 3
34
143
40 40
81
6
69 70
0
20
40
60
80
100
120
140
160
HC PI FI DF IF IQ ET MS ES OT MA
49
173
020406080
100120140160180200
TP EW
349 362
490 502
207 222
0
100
200
300
400
500
600
TDI2005 TDI2006 IMI2005 IMI2006 OMI2005 OMI2006
362400 395
467542
640
509
0
100
200
300
400
500
600
700
TDI SSA LDC DVG EU10 DEV E7

DE
VE
LO
PIN
G C
OU
NT
RIE
S IN
INT
ER
NA
TIO
NA
L T
RA
DE
20
07
Tr
ad
e a
nd
dev
elo
pm
en
t in
dex
141
CO
UN
TR
YP
RO
FIL
ES
TDI profi le
TDI InputMI OutcomeMI
2005 2006 2005 2006 2005 2006
Score
Rank
Selected indicators (2005 or latest reporting year)
Nigeria
Population in millions 131.53
Area (km2) 910,770
GDP (constant 2000 $ in billions) 60.40
GDP per capita (constant 2000 $) 459
Merchandise and service export (% of World) 0.51
Applied trade-weighted average tariff (%) 11.58
334 350 483 511 185 188
120 121 114 105 121 121
InputMI 2006 OutcomeMI 2006
Climbing the TDI ladder Benchmarking TDI
90
7
72
127
33
52 56
13
69 73
0
20
40
60
80
100
120
140
HC PI FI DF IF IQ ET MS ES OT MA
23
165
0
20
40
60
80
100
120
140
160
180
TP EW
334 350
483511
185 188
0
100
200
300
400
500
600
TDI2005 TDI2006 IMI2005 IMI2006 OMI2005 OMI2006
350400 395
467542
640
509
0
100
200
300
400
500
600
700
TDI SSA LDC DVG EU10 DEV E7

DE
VE
LO
PIN
G C
OU
NT
RIE
S I
N I
NT
ER
NA
TIO
NA
L T
RA
DE
20
07
Tr
ad
e a
nd
dev
elo
pm
en
t i
nd
ex
142
CO
UN
TR
YP
RO
FIL
ES
Selected indicators (2005 or latest reporting year)
TDI profi le
TDI InputMI OutcomeMI
2005 2006 2005 2006 2005 2006
Score
Rank
Norway
Population in millions 4.62
Area (km2) 304,280
GDP (constant 2000 $ in billions) 184.80
GDP per capita (constant 2000 $) 39,969
Merchandise and service export (% of World) 2.11
Applied trade-weighted average tariff (%) 0.74
665 664 788 780 541 548
7 8 6 7 10 8
InputMI 2006 OutcomeMI 2006
Climbing the TDI ladder Benchmarking TDI
53 46
22
67
145
94
66
101
15
82 88
0
20
40
60
80
100
120
140
160
HC PI FI DF IF IQ ET MS ES OT MA
79
469
050
100150200250300350400450500
TP EW
665 664
788 780
541 548
0
100
200
300
400
500
600
700
800
900
TDI2005 TDI2006 IMI2005 IMI2006 OMI2005 OMI2006
664 651
395467
542
640
509
0
100
200
300
400
500
600
700
TDI WE LDC DVG EU10 DEV E7

DE
VE
LO
PIN
G C
OU
NT
RIE
S IN
INT
ER
NA
TIO
NA
L T
RA
DE
20
07
Tr
ad
e a
nd
dev
elo
pm
en
t in
dex
143
CO
UN
TR
YP
RO
FIL
ES
TDI profi le
TDI InputMI OutcomeMI
2005 2006 2005 2006 2005 2006
Score
Rank
Selected indicators (2005 or latest reporting year)
Oman
Population in millions 2.57
Area (km2) 309,500
GDP (constant 2000 $ in billions) 22.70
GDP per capita (constant 2000 $) 8,961
Merchandise and service export (% of World) 0.20
Applied trade-weighted average tariff (%) 4.75
426 453 642 651 209 255
84 73 36 38 118 107
InputMI 2006 OutcomeMI 2006
Climbing the TDI ladder Benchmarking TDI
23
616
68
102
7565
108
17
83 88
0
20
40
60
80
100
120
HC PI FI DF IF IQ ET MS ES OT MA
51
204
0
50
100
150
200
250
TP EW
426 453
642 651
209255
0
100
200
300
400
500
600
700
TDI2005 TDI2006 IMI2005 IMI2006 OMI2005 OMI2006
453 477
395467
542
640
509
0
100
200
300
400
500
600
700
TDI MENA LDC DVG EU10 DEV E7

DE
VE
LO
PIN
G C
OU
NT
RIE
S I
N I
NT
ER
NA
TIO
NA
L T
RA
DE
20
07
Tr
ad
e a
nd
dev
elo
pm
en
t i
nd
ex
144
CO
UN
TR
YP
RO
FIL
ES
Selected indicators (2005 or latest reporting year)
TDI profi le
TDI InputMI OutcomeMI
2005 2006 2005 2006 2005 2006
Score
Rank
Pakistan
Population in millions 155.77
Area (km2) 770,880
GDP (constant 2000 $ in billions) 92.80
GDP per capita (constant 2000 $) 596
Merchandise and service export (% of World) 0.28
Applied trade-weighted average tariff (%) 12.12
381 395 532 541 230 248
106 103 87 86 112 109
InputMI 2006 OutcomeMI 2006
Climbing the TDI ladder Benchmarking TDI
820
12
49
133
3851
78
15
67 70
0
20
40
60
80
100
120
140
HC PI FI DF IF IQ ET MS ES OT MA
80
169
0
20
40
60
80
100
120
140
160
180
TP EW
381 395
532 541
230 248
0
100
200
300
400
500
600
TDI2005 TDI2006 IMI2005 IMI2006 OMI2005 OMI2006
395426
395467
542
640
509
0
100
200
300
400
500
600
700
TDI SA LDC DVG EU10 DEV E7

DE
VE
LO
PIN
G C
OU
NT
RIE
S IN
INT
ER
NA
TIO
NA
L T
RA
DE
20
07
Tr
ad
e a
nd
dev
elo
pm
en
t in
dex
145
CO
UN
TR
YP
RO
FIL
ES
TDI profi le
TDI InputMI OutcomeMI
2005 2006 2005 2006 2005 2006
Score
Rank
Selected indicators (2005 or latest reporting year)
Panama
Population in millions 3.23
Area (km2) 74,430
GDP (constant 2000 $ in billions) 14.20
GDP per capita (constant 2000 $) 4,408
Merchandise and service export (% of World) 0.14
Applied trade-weighted average tariff (%) 7.16
523 522 657 653 389 390
35 37 33 37 48 51
InputMI 2006 OutcomeMI 2006
Climbing the TDI ladder Benchmarking TDI
31
6
4154
118
61 61
100
14
81 85
0
20
40
60
80
100
120
140
HC PI FI DF IF IQ ET MS ES OT MA
83
307
0
50
100
150
200
250
300
350
TP EW
523 522
657 653
389 390
0
100
200
300
400
500
600
700
TDI2005 TDI2006 IMI2005 IMI2006 OMI2005 OMI2006
522472
395467
542
640
509
0
100
200
300
400
500
600
700
TDI LAC LDC DVG EU10 DEV E7

DE
VE
LO
PIN
G C
OU
NT
RIE
S I
N I
NT
ER
NA
TIO
NA
L T
RA
DE
20
07
Tr
ad
e a
nd
dev
elo
pm
en
t i
nd
ex
146
CO
UN
TR
YP
RO
FIL
ES
Selected indicators (2005 or latest reporting year)
TDI profi le
TDI InputMI OutcomeMI
2005 2006 2005 2006 2005 2006
Score
Rank
Papua New Guinea
Population in millions 5.89
Area (km2) 452,860
GDP (constant 2000 $ in billions) 3.80
GDP per capita (constant 2000 $) 643
Merchandise and service export (% of World) 0.04
Applied trade-weighted average tariff (%) 2.18
418 432 510 513 326 351
87 89 101 104 78 72
InputMI 2006 OutcomeMI 2006
Climbing the TDI ladder Benchmarking TDI
22
1 5
51
112
4147
73
9
75 77
0
20
40
60
80
100
120
HC PI FI DF IF IQ ET MS ES OT MA
86
265
0
50
100
150
200
250
300
TP EW
418 432
510 513
326 351
0
100
200
300
400
500
600
TDI2005 TDI2006 IMI2005 IMI2006 OMI2005 OMI2006
432
554
395467
542
640
509
0
100
200
300
400
500
600
700
TDI EAP LDC DVG EU10 DEV E7

DE
VE
LO
PIN
G C
OU
NT
RIE
S IN
INT
ER
NA
TIO
NA
L T
RA
DE
20
07
Tr
ad
e a
nd
dev
elo
pm
en
t in
dex
147
CO
UN
TR
YP
RO
FIL
ES
TDI profi le
TDI InputMI OutcomeMI
2005 2006 2005 2006 2005 2006
Score
Rank
Selected indicators (2005 or latest reporting year)
Paraguay
Population in millions 5.90
Area (km2) 397,300
GDP (constant 2000 $ in billions) 8.00
GDP per capita (constant 2000 $) 1,361
Merchandise and service export (% of World) 0.05
Applied trade-weighted average tariff (%) 8.96
438 440 530 521 346 358
75 82 91 101 67 66
InputMI 2006 OutcomeMI 2006
Climbing the TDI ladder Benchmarking TDI
23
2 7
43
114
3648
81
15
7380
0
20
40
60
80
100
120
HC PI FI DF IF IQ ET MS ES OT MA
69
288
0
50
100
150
200
250
300
350
TP EW
438 440
530 521
346 358
0
100
200
300
400
500
600
TDI2005 TDI2006 IMI2005 IMI2006 OMI2005 OMI2006
440472
395467
542
640
509
0
100
200
300
400
500
600
700
TDI LAC LDC DVG EU10 DEV E7

DE
VE
LO
PIN
G C
OU
NT
RIE
S I
N I
NT
ER
NA
TIO
NA
L T
RA
DE
20
07
Tr
ad
e a
nd
dev
elo
pm
en
t i
nd
ex
148
CO
UN
TR
YP
RO
FIL
ES
Selected indicators (2005 or latest reporting year)
TDI profi le
TDI InputMI OutcomeMI
2005 2006 2005 2006 2005 2006
Score
Rank
Peru
Population in millions 27.97
Area (km2) 1,280,000
GDP (constant 2000 $ in billions) 65.40
GDP per capita (constant 2000 $) 2,337
Merchandise and service export (% of World) 0.23
Applied trade-weighted average tariff (%) 9.12
455 474 575 589 334 358
69 63 56 54 72 66
InputMI 2006 OutcomeMI 2006
Climbing the TDI ladder Benchmarking TDI
155
16
47
106
53 58
83
14
82 87
0
20
40
60
80
100
120
HC PI FI DF IF IQ ET MS ES OT MA
78
305
0
50
100
150
200
250
300
350
TP EW
475 474
570 565
380 383
0
100
200
300
400
500
600
TDI2005 TDI2006 IMI2005 IMI2006 OMI2005 OMI2006
474 472
395467
542
640
509
0
100
200
300
400
500
600
700
TDI LAC LDC DVG EU10 DEV E7

DE
VE
LO
PIN
G C
OU
NT
RIE
S IN
INT
ER
NA
TIO
NA
L T
RA
DE
20
07
Tr
ad
e a
nd
dev
elo
pm
en
t in
dex
149
CO
UN
TR
YP
RO
FIL
ES
TDI profi le
TDI InputMI OutcomeMI
2005 2006 2005 2006 2005 2006
Score
Rank
Selected indicators (2005 or latest reporting year)
Philippines
Population in millions 83.05
Area (km2) 298,170
GDP (constant 2000 $ in billions) 93.70
GDP per capita (constant 2000 $) 1,129
Merchandise and service export (% of World) 0.62
Applied trade-weighted average tariff (%) 3.75
475 474 570 565 380 383
56 63 59 71 50 54
InputMI 2006 OutcomeMI 2006
Climbing the TDI ladder Benchmarking TDI
177 9
52
128
59 60
89
11
77 82
0
20
40
60
80
100
120
140
HC PI FI DF IF IQ ET MS ES OT MA
78
280
0
50
100
150
200
250
300
TP EW
455 474
575 589
334 358
0
100
200
300
400
500
600
700
TDI2005 TDI2006 IMI2005 IMI2006 OMI2005 OMI2006
474
554
395467
542
640
509
0
100
200
300
400
500
600
700
TDI EAP LDC DVG EU10 DEV E7
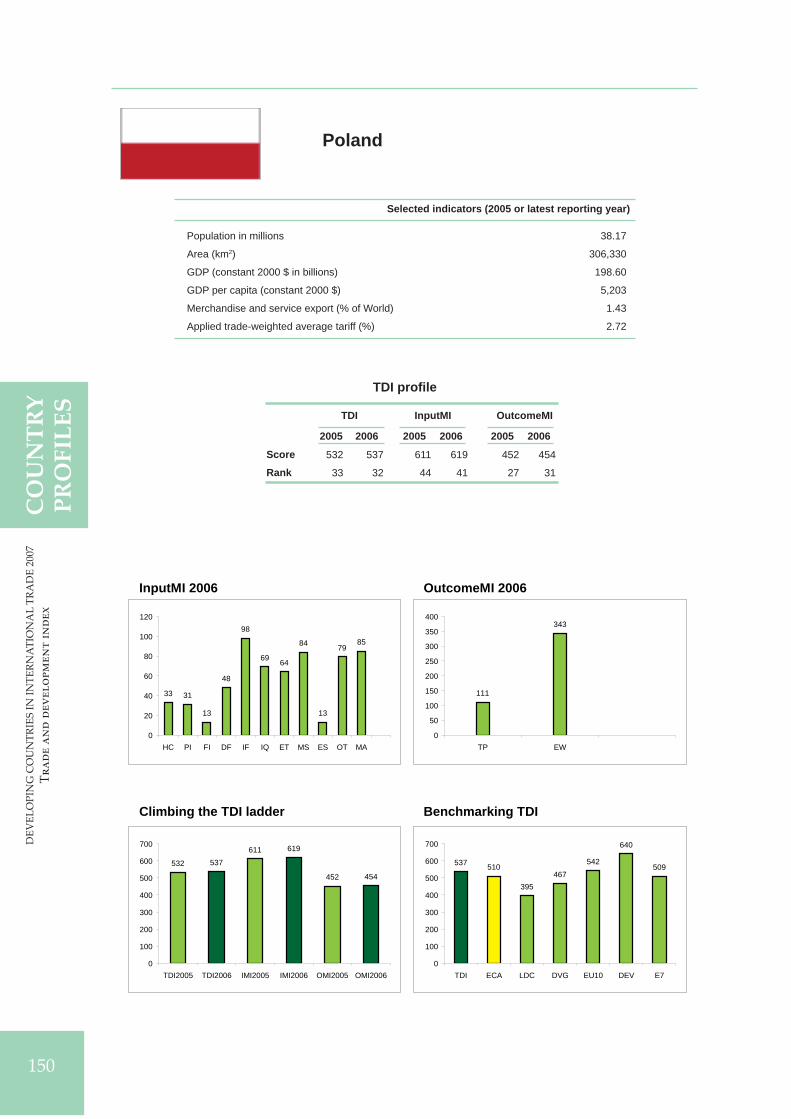
DE
VE
LO
PIN
G C
OU
NT
RIE
S I
N I
NT
ER
NA
TIO
NA
L T
RA
DE
20
07
Tr
ad
e a
nd
dev
elo
pm
en
t i
nd
ex
150
CO
UN
TR
YP
RO
FIL
ES
Selected indicators (2005 or latest reporting year)
TDI profi le
TDI InputMI OutcomeMI
2005 2006 2005 2006 2005 2006
Score
Rank
Poland
Population in millions 38.17
Area (km2) 306,330
GDP (constant 2000 $ in billions) 198.60
GDP per capita (constant 2000 $) 5,203
Merchandise and service export (% of World) 1.43
Applied trade-weighted average tariff (%) 2.72
532 537 611 619 452 454
33 32 44 41 27 31
InputMI 2006 OutcomeMI 2006
Climbing the TDI ladder Benchmarking TDI
33 31
13
48
98
69 64
84
13
7985
0
20
40
60
80
100
120
HC PI FI DF IF IQ ET MS ES OT MA
111
343
0
50
100
150
200
250
300
350
400
TP EW
532 537611 619
452 454
0
100
200
300
400
500
600
700
TDI2005 TDI2006 IMI2005 IMI2006 OMI2005 OMI2006
537 510
395467
542
640
509
0
100
200
300
400
500
600
700
TDI ECA LDC DVG EU10 DEV E7

DE
VE
LO
PIN
G C
OU
NT
RIE
S IN
INT
ER
NA
TIO
NA
L T
RA
DE
20
07
Tr
ad
e a
nd
dev
elo
pm
en
t in
dex
151
CO
UN
TR
YP
RO
FIL
ES
TDI profi le
TDI InputMI OutcomeMI
2005 2006 2005 2006 2005 2006
Score
Rank
Selected indicators (2005 or latest reporting year)
Portugal
Population in millions 10.55
Area (km2) 91,500
GDP (constant 2000 $ in billions) 116.30
GDP per capita (constant 2000 $) 11,023
Merchandise and service export (% of World) 1.02
Applied trade-weighted average tariff (%) 2.72
589 593 730 730 448 456
23 23 23 22 31 29
InputMI 2006 OutcomeMI 2006
Climbing the TDI ladder Benchmarking TDI
42
21
67
47
145
87
64
83
9
79 86
0
20
40
60
80
100
120
140
160
HC PI FI DF IF IQ ET MS ES OT MA
105
351
0
50
100
150
200
250
300
350
400
TP EW
589 593
730 730
448 456
0
100
200
300
400
500
600
700
800
TDI2005 TDI2006 IMI2005 IMI2006 OMI2005 OMI2006
593651
395467
542
640
509
0
100
200
300
400
500
600
700
TDI WE LDC DVG EU10 DEV E7

DE
VE
LO
PIN
G C
OU
NT
RIE
S I
N I
NT
ER
NA
TIO
NA
L T
RA
DE
20
07
Tr
ad
e a
nd
dev
elo
pm
en
t i
nd
ex
152
CO
UN
TR
YP
RO
FIL
ES
Selected indicators (2005 or latest reporting year)
TDI profi le
TDI InputMI OutcomeMI
2005 2006 2005 2006 2005 2006
Score
Rank
Republic of Korea
Population in millions 48.29
Area (km2) 98,730
GDP (constant 2000 $ in billions) 637.90
GDP per capita (constant 2000 $) 13,210
Merchandise and service export (% of World) 4.55
Applied trade-weighted average tariff (%) 9.22
596 599 734 738 457 460
20 21 21 20 25 27
InputMI 2006 OutcomeMI 2006
Climbing the TDI ladder Benchmarking TDI
22
63
45
68
145
69 64
84
17
78 82
0
20
40
60
80
100
120
140
160
HC PI FI DF IF IQ ET MS ES OT MA
122
338
0
50
100
150
200
250
300
350
400
TP EW
596 599
734 738
457 460
0
100
200
300
400
500
600
700
800
TDI2005 TDI2006 IMI2005 IMI2006 OMI2005 OMI2006
599554
395467
542
640
509
0
100
200
300
400
500
600
700
TDI EAP LDC DVG EU10 DEV E7

DE
VE
LO
PIN
G C
OU
NT
RIE
S IN
INT
ER
NA
TIO
NA
L T
RA
DE
20
07
Tr
ad
e a
nd
dev
elo
pm
en
t in
dex
153
CO
UN
TR
YP
RO
FIL
ES
TDI profi le
TDI InputMI OutcomeMI
2005 2006 2005 2006 2005 2006
Score
Rank
Selected indicators (2005 or latest reporting year)
Romania
Population in millions 21.63
Area (km2) 229,980
GDP (constant 2000 $ in billions) 48.90
GDP per capita (constant 2000 $) 2,259
Merchandise and service export (% of World) 0.44
Applied trade-weighted average tariff (%) 13.16
464 486 502 531 426 441
65 54 109 93 40 37
InputMI 2006 OutcomeMI 2006
Climbing the TDI ladder Benchmarking TDI
24 21
4
47
117
51 5747
12
66
83
0
20
40
60
80
100
120
140
HC PI FI DF IF IQ ET MS ES OT MA
103
338
0
50
100
150
200
250
300
350
400
TP EW
464 486 502531
426 441
0
100
200
300
400
500
600
TDI2005 TDI2006 IMI2005 IMI2006 OMI2005 OMI2006
486 510
395467
542
640
509
0
100
200
300
400
500
600
700
TDI ECA LDC DVG EU10 DEV E7

DE
VE
LO
PIN
G C
OU
NT
RIE
S I
N I
NT
ER
NA
TIO
NA
L T
RA
DE
20
07
Tr
ad
e a
nd
dev
elo
pm
en
t i
nd
ex
154
CO
UN
TR
YP
RO
FIL
ES
Selected indicators (2005 or latest reporting year)
TDI profi le
TDI InputMI OutcomeMI
2005 2006 2005 2006 2005 2006
Score
Rank
Russian Federation
Population in millions 143.11
Area (km2) 16,381,390
GDP (constant 2000 $ in billions) 349.90
GDP per capita (constant 2000 $) 2,445
Merchandise and service export (% of World) 2.98
Applied trade-weighted average tariff (%) 9.57
481 483 536 541 426 425
50 58 83 86 40 41
InputMI 2006 OutcomeMI 2006
Climbing the TDI ladder Benchmarking TDI
22 1810
68
119
34
63
3319
76 79
0
20
40
60
80
100
120
140
HC PI FI DF IF IQ ET MS ES OT MA
94
332
0
50
100
150
200
250
300
350
TP EW
481 483536 541
426 425
0
100
200
300
400
500
600
TDI2005 TDI2006 IMI2005 IMI2006 OMI2005 OMI2006
483 510
395467
542
640
509
0
100
200
300
400
500
600
700
TDI ECA LDC DVG EU10 DEV E7

DE
VE
LO
PIN
G C
OU
NT
RIE
S IN
INT
ER
NA
TIO
NA
L T
RA
DE
20
07
Tr
ad
e a
nd
dev
elo
pm
en
t in
dex
155
CO
UN
TR
YP
RO
FIL
ES
TDI profi le
TDI InputMI OutcomeMI
2005 2006 2005 2006 2005 2006
Score
Rank
Selected indicators (2005 or latest reporting year)
Rwanda
Population in millions 9.04
Area (km2) 24,670
GDP (constant 2000 $ in billions) 2.40
GDP per capita (constant 2000 $) 260
Merchandise and service export (% of World) 0.00
Applied trade-weighted average tariff (%) 16.73
409 425 535 523 282 327
92 92 84 98 89 83
InputMI 2006 OutcomeMI 2006
Climbing the TDI ladder Benchmarking TDI
140 5
28
142
4739
86
12
7178
0
20
40
60
80
100
120
140
160
HC PI FI DF IF IQ ET MS ES OT MA
63
264
0
50
100
150
200
250
300
TP EW
409 425
535 523
282327
0
100
200
300
400
500
600
TDI2005 TDI2006 IMI2005 IMI2006 OMI2005 OMI2006
425 400 395467
542
640
509
0
100
200
300
400
500
600
700
TDI SSA LDC DVG EU10 DEV E7

DE
VE
LO
PIN
G C
OU
NT
RIE
S I
N I
NT
ER
NA
TIO
NA
L T
RA
DE
20
07
Tr
ad
e a
nd
dev
elo
pm
en
t i
nd
ex
156
CO
UN
TR
YP
RO
FIL
ES
Selected indicators (2005 or latest reporting year)
TDI profi le
TDI InputMI OutcomeMI
2005 2006 2005 2006 2005 2006
Score
Rank
Saudi Arabia
Population in millions 23.12
Area (km2) 2,000,000
GDP (constant 2000 $ in billions) 229.10
GDP per capita (constant 2000 $) 9,910
Merchandise and service export (% of World) 1.69
Applied trade-weighted average tariff (%) 4.34
442 459 664 675 219 242
73 71 30 31 114 111
InputMI 2006 OutcomeMI 2006
Climbing the TDI ladder Benchmarking TDI
18 1725
82
145
60 64
89
17
79 80
0
20
40
60
80
100
120
140
160
HC PI FI DF IF IQ ET MS ES OT MA
49
193
0
50
100
150
200
250
TP EW
442 459
664 675
219 242
0
100
200
300
400
500
600
700
800
TDI2005 TDI2006 IMI2005 IMI2006 OMI2005 OMI2006
459 477
395467
542
640
509
0
100
200
300
400
500
600
700
TDI MENA LDC DVG EU10 DEV E7

DE
VE
LO
PIN
G C
OU
NT
RIE
S IN
INT
ER
NA
TIO
NA
L T
RA
DE
20
07
Tr
ad
e a
nd
dev
elo
pm
en
t in
dex
157
CO
UN
TR
YP
RO
FIL
ES
TDI profi le
TDI InputMI OutcomeMI
2005 2006 2005 2006 2005 2006
Score
Rank
Selected indicators (2005 or latest reporting year)
Senegal
Population in millions 11.66
Area (km2) 192,530
GDP (constant 2000 $ in billions) 5.50
GDP per capita (constant 2000 $) 474
Merchandise and service export (% of World) 0.05
Applied trade-weighted average tariff (%) 9.70
409 429 543 567 274 291
92 91 79 69 93 93
InputMI 2006 OutcomeMI 2006
Climbing the TDI ladder Benchmarking TDI
209 9
38
135
51 55
92
13
72 72
0
20
40
60
80
100
120
140
160
HC PI FI DF IF IQ ET MS ES OT MA
87
204
0
50
100
150
200
250
TP EW
409 429
543 567
274 291
0
100
200
300
400
500
600
TDI2005 TDI2006 IMI2005 IMI2006 OMI2005 OMI2006
429 400 395467
542
640
509
0
100
200
300
400
500
600
700
TDI SSA LDC DVG EU10 DEV E7

DE
VE
LO
PIN
G C
OU
NT
RIE
S I
N I
NT
ER
NA
TIO
NA
L T
RA
DE
20
07
Tr
ad
e a
nd
dev
elo
pm
en
t i
nd
ex
158
CO
UN
TR
YP
RO
FIL
ES
Selected indicators (2005 or latest reporting year)
TDI profi le
TDI InputMI OutcomeMI
2005 2006 2005 2006 2005 2006
Score
Rank
Singapore
Population in millions 4.34
Area (km2) 689
GDP (constant 2000 $ in billions) 112.20
GDP per capita (constant 2000 $) 25,845
Merchandise and service export (% of World) 3.93
Applied trade-weighted average tariff (%) 0.04
665 675 808 814 522 536
7 5 3 3 12 11
InputMI 2006 OutcomeMI 2006
Climbing the TDI ladder Benchmarking TDI
17
6549
86
145
108
66
86
14
87 90
0
20
40
60
80
100
120
140
160
HC PI FI DF IF IQ ET MS ES OT MA
180
356
0
50
100
150
200
250
300
350
400
TP EW
665 675
808 814
522 536
0
100
200
300
400
500
600
700
800
900
TDI2005 TDI2006 IMI2005 IMI2006 OMI2005 OMI2006
675
554
395467
542
640
509
0
100
200
300
400
500
600
700
800
TDI EAP LDC DVG EU10 DEV E7
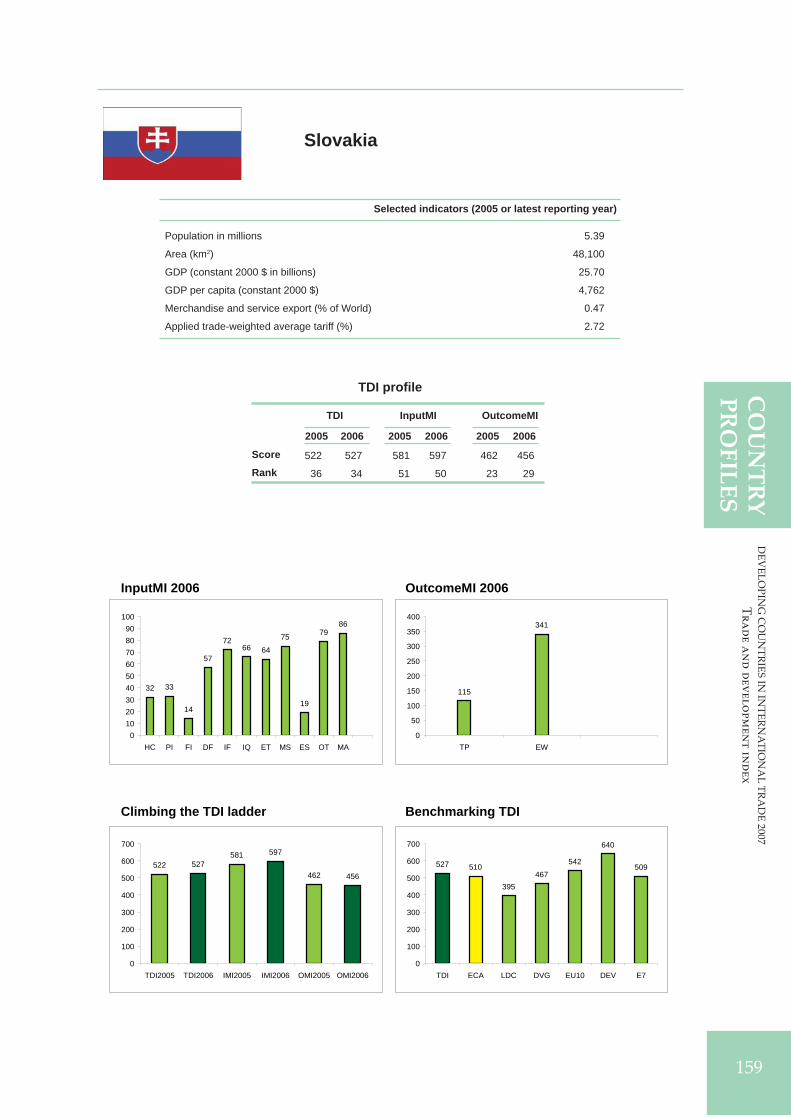
DE
VE
LO
PIN
G C
OU
NT
RIE
S IN
INT
ER
NA
TIO
NA
L T
RA
DE
20
07
Tr
ad
e a
nd
dev
elo
pm
en
t in
dex
159
CO
UN
TR
YP
RO
FIL
ES
TDI profi le
TDI InputMI OutcomeMI
2005 2006 2005 2006 2005 2006
Score
Rank
Selected indicators (2005 or latest reporting year)
Slovakia
Population in millions 5.39
Area (km2) 48,100
GDP (constant 2000 $ in billions) 25.70
GDP per capita (constant 2000 $) 4,762
Merchandise and service export (% of World) 0.47
Applied trade-weighted average tariff (%) 2.72
522 527 581 597 462 456
36 34 51 50 23 29
InputMI 2006 OutcomeMI 2006
Climbing the TDI ladder Benchmarking TDI
32 33
14
57
7266 64
75
19
7986
0102030405060708090
100
HC PI FI DF IF IQ ET MS ES OT MA
115
341
0
50
100
150
200
250
300
350
400
TP EW
522 527581 597
462 456
0
100
200
300
400
500
600
700
TDI2005 TDI2006 IMI2005 IMI2006 OMI2005 OMI2006
527 510
395467
542
640
509
0
100
200
300
400
500
600
700
TDI ECA LDC DVG EU10 DEV E7

DE
VE
LO
PIN
G C
OU
NT
RIE
S I
N I
NT
ER
NA
TIO
NA
L T
RA
DE
20
07
Tr
ad
e a
nd
dev
elo
pm
en
t i
nd
ex
160
CO
UN
TR
YP
RO
FIL
ES
Selected indicators (2005 or latest reporting year)
TDI profi le
TDI InputMI OutcomeMI
2005 2006 2005 2006 2005 2006
Score
Rank
Slovenia
Population in millions 2.00
Area (km2) 20,140
GDP (constant 2000 $ in billions) 22.90
GDP per capita (constant 2000 $) 11,432
Merchandise and service export (% of World) 0.32
Applied trade-weighted average tariff (%) 2.72
574 583 672 689 476 477
24 24 29 29 19 20
InputMI 2006 OutcomeMI 2006
Climbing the TDI ladder Benchmarking TDI
43 43
20
59
145
7665 62
12
7588
0
20
40
60
80
100
120
140
160
HC PI FI DF IF IQ ET MS ES OT MA
110
367
0
50
100
150
200
250
300
350
400
TP EW
574 583
672 689
476 477
0
100
200
300
400
500
600
700
800
TDI2005 TDI2006 IMI2005 IMI2006 OMI2005 OMI2006
583510
395467
542
640
509
0
100
200
300
400
500
600
700
TDI ECA LDC DVG EU10 DEV E7

DE
VE
LO
PIN
G C
OU
NT
RIE
S IN
INT
ER
NA
TIO
NA
L T
RA
DE
20
07
Tr
ad
e a
nd
dev
elo
pm
en
t in
dex
161
CO
UN
TR
YP
RO
FIL
ES
TDI profi le
TDI InputMI OutcomeMI
2005 2006 2005 2006 2005 2006
Score
Rank
Selected indicators (2005 or latest reporting year)
South Africa
Population in millions 46.89
Area (km2) 1,214,470
GDP (constant 2000 $ in billions) 159.70
GDP per capita (constant 2000 $) 3,406
Merchandise and service export (% of World) 0.90
Applied trade-weighted average tariff (%) 5.75
481 493 635 659 327 326
50 47 38 35 76 84
InputMI 2006 OutcomeMI 2006
Climbing the TDI ladder Benchmarking TDI
28
12
6249
115
65 64
92
16
76 80
0
20
40
60
80
100
120
140
HC PI FI DF IF IQ ET MS ES OT MA
98
228
0
50
100
150
200
250
TP EW
481 493
635 659
327 326
0
100
200
300
400
500
600
700
TDI2005 TDI2006 IMI2005 IMI2006 OMI2005 OMI2006
493
400 395467
542
640
509
0
100
200
300
400
500
600
700
TDI SSA LDC DVG EU10 DEV E7
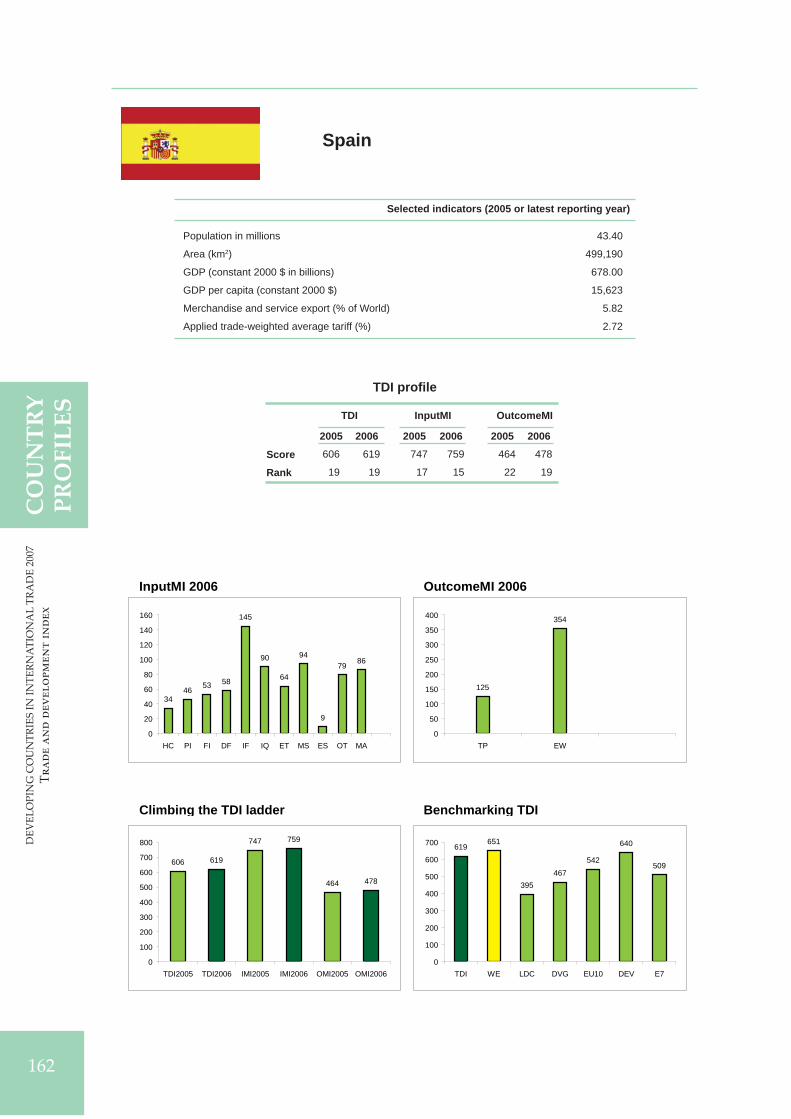
DE
VE
LO
PIN
G C
OU
NT
RIE
S I
N I
NT
ER
NA
TIO
NA
L T
RA
DE
20
07
Tr
ad
e a
nd
dev
elo
pm
en
t i
nd
ex
162
CO
UN
TR
YP
RO
FIL
ES
Selected indicators (2005 or latest reporting year)
TDI profi le
TDI InputMI OutcomeMI
2005 2006 2005 2006 2005 2006
Score
Rank
Spain
Population in millions 43.40
Area (km2) 499,190
GDP (constant 2000 $ in billions) 678.00
GDP per capita (constant 2000 $) 15,623
Merchandise and service export (% of World) 5.82
Applied trade-weighted average tariff (%) 2.72
606 619 747 759 464 478
19 19 17 15 22 19
InputMI 2006 OutcomeMI 2006
Climbing the TDI ladder Benchmarking TDI
3446 53 58
145
90
64
94
9
79 86
0
20
40
60
80
100
120
140
160
HC PI FI DF IF IQ ET MS ES OT MA
125
354
0
50
100
150
200
250
300
350
400
TP EW
606 619
747 759
464 478
0
100
200
300
400
500
600
700
800
TDI2005 TDI2006 IMI2005 IMI2006 OMI2005 OMI2006
619651
395467
542
640
509
0
100
200
300
400
500
600
700
TDI WE LDC DVG EU10 DEV E7

DE
VE
LO
PIN
G C
OU
NT
RIE
S IN
INT
ER
NA
TIO
NA
L T
RA
DE
20
07
Tr
ad
e a
nd
dev
elo
pm
en
t in
dex
163
CO
UN
TR
YP
RO
FIL
ES
TDI profi le
TDI InputMI OutcomeMI
2005 2006 2005 2006 2005 2006
Score
Rank
Selected indicators (2005 or latest reporting year)
Sri Lanka
Population in millions 19.63
Area (km2) 64,630
GDP (constant 2000 $ in billions) 19.70
GDP per capita (constant 2000 $) 1,002
Merchandise and service export (% of World) 0.14
Applied trade-weighted average tariff (%) 7.26
477 478 587 600 366 356
55 60 48 48 59 70
InputMI 2006 OutcomeMI 2006
Climbing the TDI ladder Benchmarking TDI
1226
14
47
133
58 54
86
14
77 80
0
20
40
60
80
100
120
140
HC PI FI DF IF IQ ET MS ES OT MA
89
267
0
50
100
150
200
250
300
TP EW
477 478
587 600
366 356
0
100
200
300
400
500
600
700
TDI2005 TDI2006 IMI2005 IMI2006 OMI2005 OMI2006
478426
395467
542
640
509
0
100
200
300
400
500
600
700
TDI SA LDC DVG EU10 DEV E7

DE
VE
LO
PIN
G C
OU
NT
RIE
S I
N I
NT
ER
NA
TIO
NA
L T
RA
DE
20
07
Tr
ad
e a
nd
dev
elo
pm
en
t i
nd
ex
164
CO
UN
TR
YP
RO
FIL
ES
Selected indicators (2005 or latest reporting year)
TDI profi le
TDI InputMI OutcomeMI
2005 2006 2005 2006 2005 2006
Score
Rank
Sudan
Population in millions 36.23
Area (km2) 2,376,000
GDP (constant 2000 $ in billions) 16.70
GDP per capita (constant 2000 $) 462
Merchandise and service export (% of World) 0.04
Applied trade-weighted average tariff (%) 15.90
319 326 454 466 183 185
123 123 119 118 122 122
InputMI 2006 OutcomeMI 2006
Climbing the TDI ladder Benchmarking TDI
142 3
46
111
3339
71
12
65 70
0
20
40
60
80
100
120
HC PI FI DF IF IQ ET MS ES OT MA
27
158
0
20
40
60
80
100
120
140
160
180
TP EW
319 326
454 466
183 185
050
100150200250300350400450500
TDI2005 TDI2006 IMI2005 IMI2006 OMI2005 OMI2006
326400 395
467542
640
509
0
100
200
300
400
500
600
700
TDI SSA LDC DVG EU10 DEV E7

DE
VE
LO
PIN
G C
OU
NT
RIE
S IN
INT
ER
NA
TIO
NA
L T
RA
DE
20
07
Tr
ad
e a
nd
dev
elo
pm
en
t in
dex
165
CO
UN
TR
YP
RO
FIL
ES
TDI profi le
TDI InputMI OutcomeMI
2005 2006 2005 2006 2005 2006
Score
Rank
Selected indicators (2005 or latest reporting year)
Sweden
Population in millions 9.02
Area (km2) 410,330
GDP (constant 2000 $ in billions) 270.30
GDP per capita (constant 2000 $) 29,954
Merchandise and service export (% of World) 3.04
Applied trade-weighted average tariff (%) 2.72
651 668 755 767 547 568
10 6 14 12 8 3
InputMI 2006 OutcomeMI 2006
Climbing the TDI ladder Benchmarking TDI
52
3447
56
145
102
6582
18
79 86
0
20
40
60
80
100
120
140
160
HC PI FI DF IF IQ ET MS ES OT MA
117
452
050
100150200250300350400450500
TP EW
651 668755 767
547 568
0
100
200
300
400
500
600
700
800
900
TDI2005 TDI2006 IMI2005 IMI2006 OMI2005 OMI2006
668 651
395467
542
640
509
0
100
200
300
400
500
600
700
800
TDI WE LDC DVG EU10 DEV E7

DE
VE
LO
PIN
G C
OU
NT
RIE
S I
N I
NT
ER
NA
TIO
NA
L T
RA
DE
20
07
Tr
ad
e a
nd
dev
elo
pm
en
t i
nd
ex
166
CO
UN
TR
YP
RO
FIL
ES
Selected indicators (2005 or latest reporting year)
TDI profi le
TDI InputMI OutcomeMI
2005 2006 2005 2006 2005 2006
Score
Rank
Switzerland
Population in millions 7.44
Area (km2) 40,000
GDP (constant 2000 $ in billions) 258.60
GDP per capita (constant 2000 $) 34,778
Merchandise and service export (% of World) 3.18
Applied trade-weighted average tariff (%) 0.00
668 650 776 777 559 523
6 10 7 9 5 12
InputMI 2006 OutcomeMI 2006
Climbing the TDI ladder Benchmarking TDI
42 40
7161
145
100
66
85
16
6982
0
20
40
60
80
100
120
140
160
HC PI FI DF IF IQ ET MS ES OT MA
112
411
0
50
100
150
200
250
300
350
400
450
TP EW
668 650
776 777
559 523
0
100
200
300
400
500
600
700
800
900
TDI2005 TDI2006 IMI2005 IMI2006 OMI2005 OMI2006
650 651
395467
542
640
509
0
100
200
300
400
500
600
700
TDI WE LDC DVG EU10 DEV E7
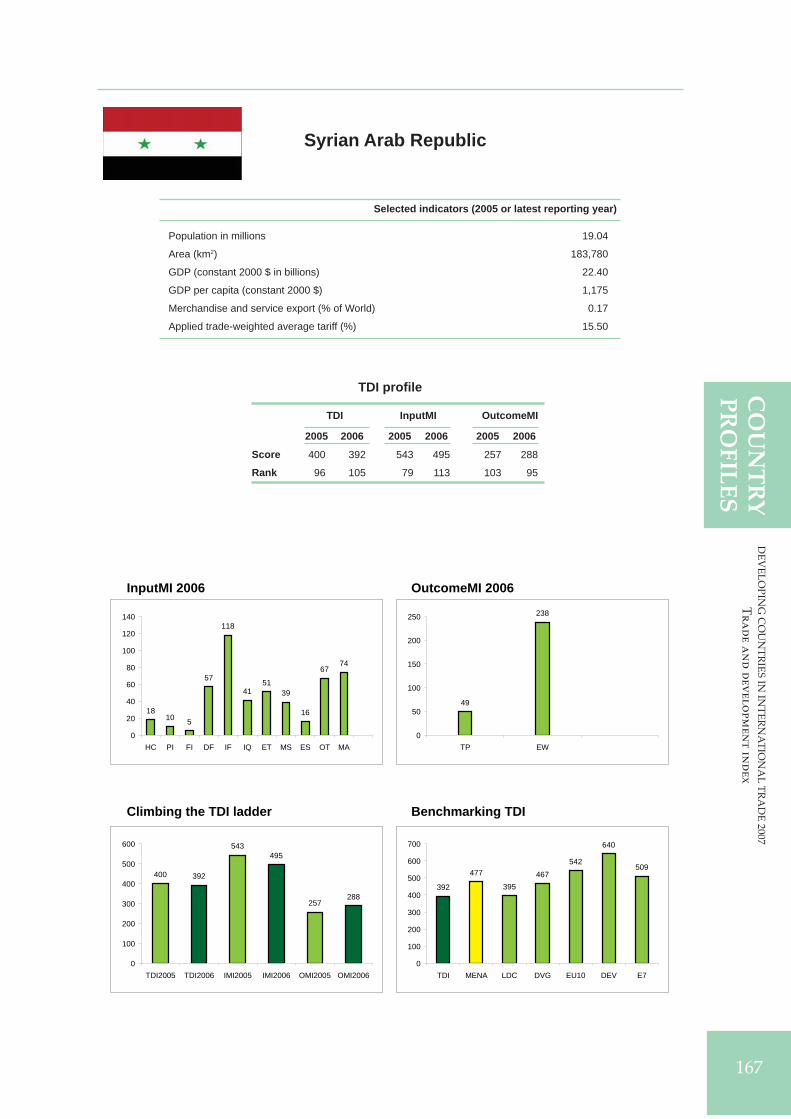
DE
VE
LO
PIN
G C
OU
NT
RIE
S IN
INT
ER
NA
TIO
NA
L T
RA
DE
20
07
Tr
ad
e a
nd
dev
elo
pm
en
t in
dex
167
CO
UN
TR
YP
RO
FIL
ES
TDI profi le
TDI InputMI OutcomeMI
2005 2006 2005 2006 2005 2006
Score
Rank
Selected indicators (2005 or latest reporting year)
Syrian Arab Republic
Population in millions 19.04
Area (km2) 183,780
GDP (constant 2000 $ in billions) 22.40
GDP per capita (constant 2000 $) 1,175
Merchandise and service export (% of World) 0.17
Applied trade-weighted average tariff (%) 15.50
400 392 543 495 257 288
96 105 79 113 103 95
InputMI 2006 OutcomeMI 2006
Climbing the TDI ladder Benchmarking TDI
1810 5
57
118
4151
39
16
6774
0
20
40
60
80
100
120
140
HC PI FI DF IF IQ ET MS ES OT MA
49
238
0
50
100
150
200
250
TP EW
400 392
543495
257288
0
100
200
300
400
500
600
TDI2005 TDI2006 IMI2005 IMI2006 OMI2005 OMI2006
392
477
395467
542
640
509
0
100
200
300
400
500
600
700
TDI MENA LDC DVG EU10 DEV E7

DE
VE
LO
PIN
G C
OU
NT
RIE
S I
N I
NT
ER
NA
TIO
NA
L T
RA
DE
20
07
Tr
ad
e a
nd
dev
elo
pm
en
t i
nd
ex
168
CO
UN
TR
YP
RO
FIL
ES
Selected indicators (2005 or latest reporting year)
TDI profi le
TDI InputMI OutcomeMI
2005 2006 2005 2006 2005 2006
Score
Rank
Thailand
Population in millions 64.23
Area (km2) 510,890
GDP (constant 2000 $ in billions) 156.80
GDP per capita (constant 2000 $) 2,441
Merchandise and service export (% of World) 1.92
Applied trade-weighted average tariff (%) 5.44
537 551 635 657 439 445
31 29 38 36 35 36
InputMI 2006 OutcomeMI 2006
Climbing the TDI ladder Benchmarking TDI
20
3845
66
102
59 60
101
17
72 77
0
20
40
60
80
100
120
HC PI FI DF IF IQ ET MS ES OT MA
124
321
0
50
100
150
200
250
300
350
TP EW
537 551
635 657
439 445
0
100
200
300
400
500
600
700
TDI2005 TDI2006 IMI2005 IMI2006 OMI2005 OMI2006
551 554
395467
542
640
509
0
100
200
300
400
500
600
700
TDI EAP LDC DVG EU10 DEV E7
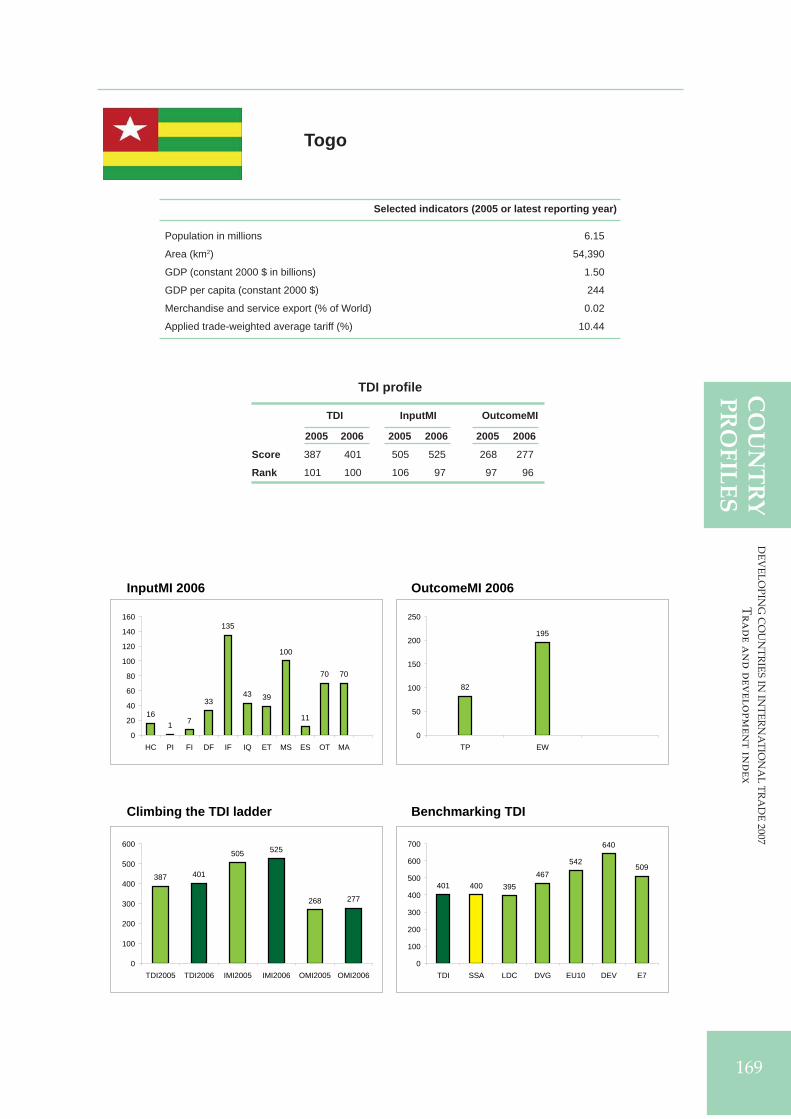
DE
VE
LO
PIN
G C
OU
NT
RIE
S IN
INT
ER
NA
TIO
NA
L T
RA
DE
20
07
Tr
ad
e a
nd
dev
elo
pm
en
t in
dex
169
CO
UN
TR
YP
RO
FIL
ES
TDI profi le
TDI InputMI OutcomeMI
2005 2006 2005 2006 2005 2006
Score
Rank
Selected indicators (2005 or latest reporting year)
Togo
Population in millions 6.15
Area (km2) 54,390
GDP (constant 2000 $ in billions) 1.50
GDP per capita (constant 2000 $) 244
Merchandise and service export (% of World) 0.02
Applied trade-weighted average tariff (%) 10.44
387 401 505 525 268 277
101 100 106 97 97 96
InputMI 2006 OutcomeMI 2006
Climbing the TDI ladder Benchmarking TDI
161 7
33
135
43 39
100
11
70 70
0
20
40
60
80
100
120
140
160
HC PI FI DF IF IQ ET MS ES OT MA
82
195
0
50
100
150
200
250
TP EW
387 401
505 525
268 277
0
100
200
300
400
500
600
TDI2005 TDI2006 IMI2005 IMI2006 OMI2005 OMI2006
401 400 395467
542
640
509
0
100
200
300
400
500
600
700
TDI SSA LDC DVG EU10 DEV E7

DE
VE
LO
PIN
G C
OU
NT
RIE
S I
N I
NT
ER
NA
TIO
NA
L T
RA
DE
20
07
Tr
ad
e a
nd
dev
elo
pm
en
t i
nd
ex
170
CO
UN
TR
YP
RO
FIL
ES
Selected indicators (2005 or latest reporting year)
TDI profi le
TDI InputMI OutcomeMI
2005 2006 2005 2006 2005 2006
Score
Rank
Tunisia
Population in millions 10.03
Area (km2) 155,360
GDP (constant 2000 $ in billions) 24.20
GDP per capita (constant 2000 $) 2,412
Merchandise and service export (% of World) 0.27
Applied trade-weighted average tariff (%) 19.65
436 455 567 592 304 318
78 72 60 52 85 86
InputMI 2006 OutcomeMI 2006
Climbing the TDI ladder Benchmarking TDI
3124 29
53
117
6558
80
14
5765
0
20
40
60
80
100
120
140
HC PI FI DF IF IQ ET MS ES OT MA
98
219
0
50
100
150
200
250
TP EW
436 455
567 592
304 318
0
100
200
300
400
500
600
700
TDI2005 TDI2006 IMI2005 IMI2006 OMI2005 OMI2006
455 477
395467
542
640
509
0
100
200
300
400
500
600
700
TDI MENA LDC DVG EU10 DEV E7

DE
VE
LO
PIN
G C
OU
NT
RIE
S IN
INT
ER
NA
TIO
NA
L T
RA
DE
20
07
Tr
ad
e a
nd
dev
elo
pm
en
t in
dex
171
CO
UN
TR
YP
RO
FIL
ES
TDI profi le
TDI InputMI OutcomeMI
2005 2006 2005 2006 2005 2006
Score
Rank
Selected indicators (2005 or latest reporting year)
Turkey
Population in millions 72.07
Area (km2) 769,630
GDP (constant 2000 $ in billions) 246.20
GDP per capita (constant 2000 $) 3,417
Merchandise and service export (% of World) 1.73
Applied trade-weighted average tariff (%) 3.84
445 453 544 558 346 348
72 73 78 75 67 73
InputMI 2006 OutcomeMI 2006
Climbing the TDI ladder Benchmarking TDI
3121
8
51
100
55 58 54
16
7887
0
20
40
60
80
100
120
HC PI FI DF IF IQ ET MS ES OT MA
107
240
0
50
100
150
200
250
300
TP EW
445 453
544 558
346 348
0
100
200
300
400
500
600
TDI2005 TDI2006 IMI2005 IMI2006 OMI2005 OMI2006
453510
395467
542
640
509
0
100
200
300
400
500
600
700
TDI ECA LDC DVG EU10 DEV E7

DE
VE
LO
PIN
G C
OU
NT
RIE
S I
N I
NT
ER
NA
TIO
NA
L T
RA
DE
20
07
Tr
ad
e a
nd
dev
elo
pm
en
t i
nd
ex
172
CO
UN
TR
YP
RO
FIL
ES
Selected indicators (2005 or latest reporting year)
TDI profi le
TDI InputMI OutcomeMI
2005 2006 2005 2006 2005 2006
Score
Rank
Uganda
Population in millions 28.82
Area (km2) 197,100
GDP (constant 2000 $ in billions) 7.80
GDP per capita (constant 2000 $) 270
Merchandise and service export (% of World) 0.03
Applied trade-weighted average tariff (%) 10.41
435 446 558 553 312 338
79 78 70 78 81 80
InputMI 2006 OutcomeMI 2006
Climbing the TDI ladder Benchmarking TDI
247 3
36
140
47 45
80
10
78 83
0
20
40
60
80
100
120
140
160
HC PI FI DF IF IQ ET MS ES OT MA
76
262
0
50
100
150
200
250
300
TP EW
435 446
558 553
312 338
0
100
200
300
400
500
600
TDI2005 TDI2006 IMI2005 IMI2006 OMI2005 OMI2006
446400 395
467542
640
509
0
100
200
300
400
500
600
700
TDI SSA LDC DVG EU10 DEV E7

DE
VE
LO
PIN
G C
OU
NT
RIE
S IN
INT
ER
NA
TIO
NA
L T
RA
DE
20
07
Tr
ad
e a
nd
dev
elo
pm
en
t in
dex
173
CO
UN
TR
YP
RO
FIL
ES
TDI profi le
TDI InputMI OutcomeMI
2005 2006 2005 2006 2005 2006
Score
Rank
Selected indicators (2005 or latest reporting year)
Ukraine
Population in millions 47.08
Area (km2) 579,380
GDP (constant 2000 $ in billions) 45.20
GDP per capita (constant 2000 $) 960
Merchandise and service export (% of World) 0.61
Applied trade-weighted average tariff (%) 4.01
508 522 584 610 431 434
41 37 50 45 36 39
InputMI 2006 OutcomeMI 2006
Climbing the TDI ladder Benchmarking TDI
2937
11
59
121
35
58
75
20
80 86
0
20
40
60
80
100
120
140
HC PI FI DF IF IQ ET MS ES OT MA
109
324
0
50
100
150
200
250
300
350
TP EW
508 522584 610
431 434
0
100
200
300
400
500
600
700
TDI2005 TDI2006 IMI2005 IMI2006 OMI2005 OMI2006
522 510
395467
542
640
509
0
100
200
300
400
500
600
700
TDI ECA LDC DVG EU10 DEV E7

DE
VE
LO
PIN
G C
OU
NT
RIE
S I
N I
NT
ER
NA
TIO
NA
L T
RA
DE
20
07
Tr
ad
e a
nd
dev
elo
pm
en
t i
nd
ex
174
CO
UN
TR
YP
RO
FIL
ES
Selected indicators (2005 or latest reporting year)
TDI profi le
TDI InputMI OutcomeMI
2005 2006 2005 2006 2005 2006
Score
Rank
United Arab Emirates
Population in millions 4.53
Area (km2) 83,600
GDP (constant 2000 $ in billions) 104.20
GDP per capita (constant 2000 $) 22,975
Merchandise and service export (% of World) 0.89
Applied trade-weighted average tariff (%) 4.64
511 521 695 698 327 343
40 39 27 28 76 76
InputMI 2006 OutcomeMI 2006
Climbing the TDI ladder Benchmarking TDI
14
48
23
74
145
7665 62
20
83 87
0
20
40
60
80
100
120
140
160
HC PI FI DF IF IQ ET MS ES OT MA
112
231
0
50
100
150
200
250
TP EW
511 521
695 698
327 343
0
100
200
300
400
500
600
700
800
TDI2005 TDI2006 IMI2005 IMI2006 OMI2005 OMI2006
521477
395467
542
640
509
0
100
200
300
400
500
600
700
TDI MENA LDC DVG EU10 DEV E7

DE
VE
LO
PIN
G C
OU
NT
RIE
S IN
INT
ER
NA
TIO
NA
L T
RA
DE
20
07
Tr
ad
e a
nd
dev
elo
pm
en
t in
dex
175
CO
UN
TR
YP
RO
FIL
ES
TDI profi le
TDI InputMI OutcomeMI
2005 2006 2005 2006 2005 2006
Score
Rank
Selected indicators (2005 or latest reporting year)
United Kingdom
Population in millions 60.23
Area (km2) 241,930
GDP (constant 2000 $ in billions) 1,619.50
GDP per capita (constant 2000 $) 26,891
Merchandise and service export (% of World) 11.92
Applied trade-weighted average tariff (%) 2.72
678 682 794 797 561 566
4 4 5 5 4 4
InputMI 2006 OutcomeMI 2006
Climbing the TDI ladder Benchmarking TDI
40
65 68
44
145
100
66
95
9
79 86
0
20
40
60
80
100
120
140
160
HC PI FI DF IF IQ ET MS ES OT MA
159
407
0
50
100
150
200
250
300
350
400
450
TP EW
678 682
794 797
561 566
0
100
200
300
400
500
600
700
800
900
TDI2005 TDI2006 IMI2005 IMI2006 OMI2005 OMI2006
682 651
395467
542
640
509
0
100
200
300
400
500
600
700
800
TDI WE LDC DVG EU10 DEV E7
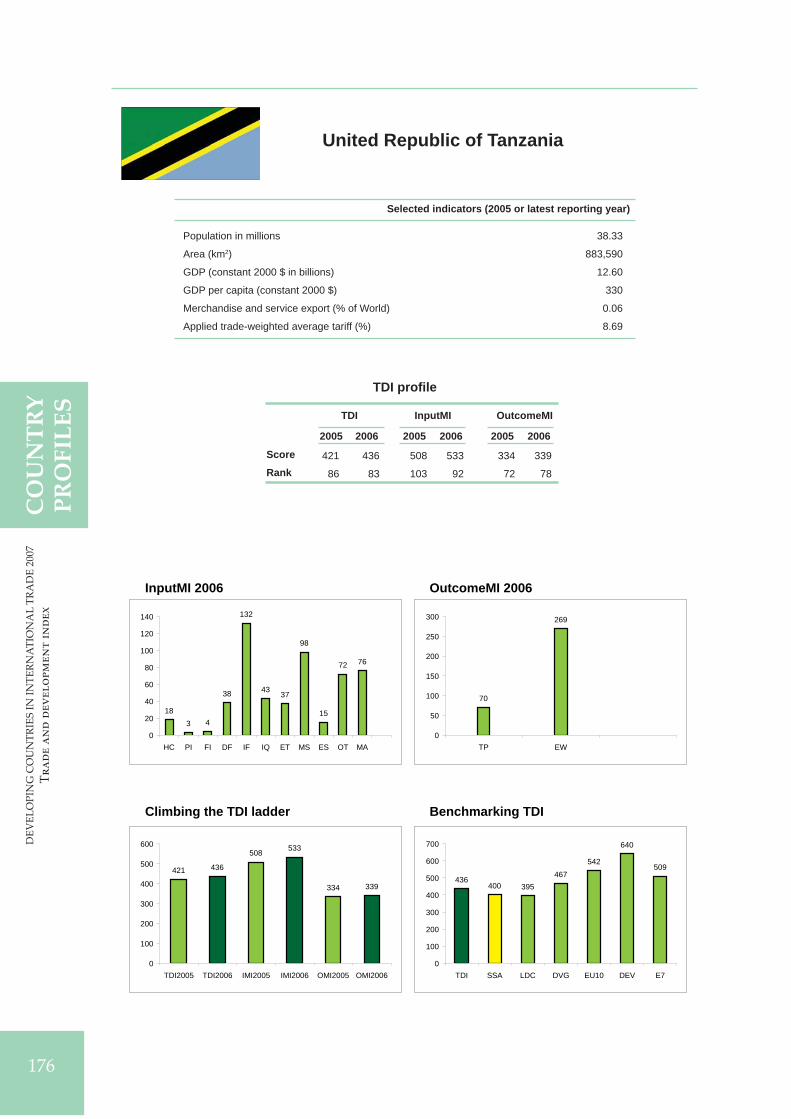
DE
VE
LO
PIN
G C
OU
NT
RIE
S I
N I
NT
ER
NA
TIO
NA
L T
RA
DE
20
07
Tr
ad
e a
nd
dev
elo
pm
en
t i
nd
ex
176
CO
UN
TR
YP
RO
FIL
ES
Selected indicators (2005 or latest reporting year)
TDI profi le
TDI InputMI OutcomeMI
2005 2006 2005 2006 2005 2006
Score
Rank
United Republic of Tanzania
Population in millions 38.33
Area (km2) 883,590
GDP (constant 2000 $ in billions) 12.60
GDP per capita (constant 2000 $) 330
Merchandise and service export (% of World) 0.06
Applied trade-weighted average tariff (%) 8.69
421 436 508 533 334 339
86 83 103 92 72 78
InputMI 2006 OutcomeMI 2006
Climbing the TDI ladder Benchmarking TDI
183 4
38
132
43 37
98
15
72 76
0
20
40
60
80
100
120
140
HC PI FI DF IF IQ ET MS ES OT MA
70
269
0
50
100
150
200
250
300
TP EW
421 436
508 533
334 339
0
100
200
300
400
500
600
TDI2005 TDI2006 IMI2005 IMI2006 OMI2005 OMI2006
436400 395
467542
640
509
0
100
200
300
400
500
600
700
TDI SSA LDC DVG EU10 DEV E7
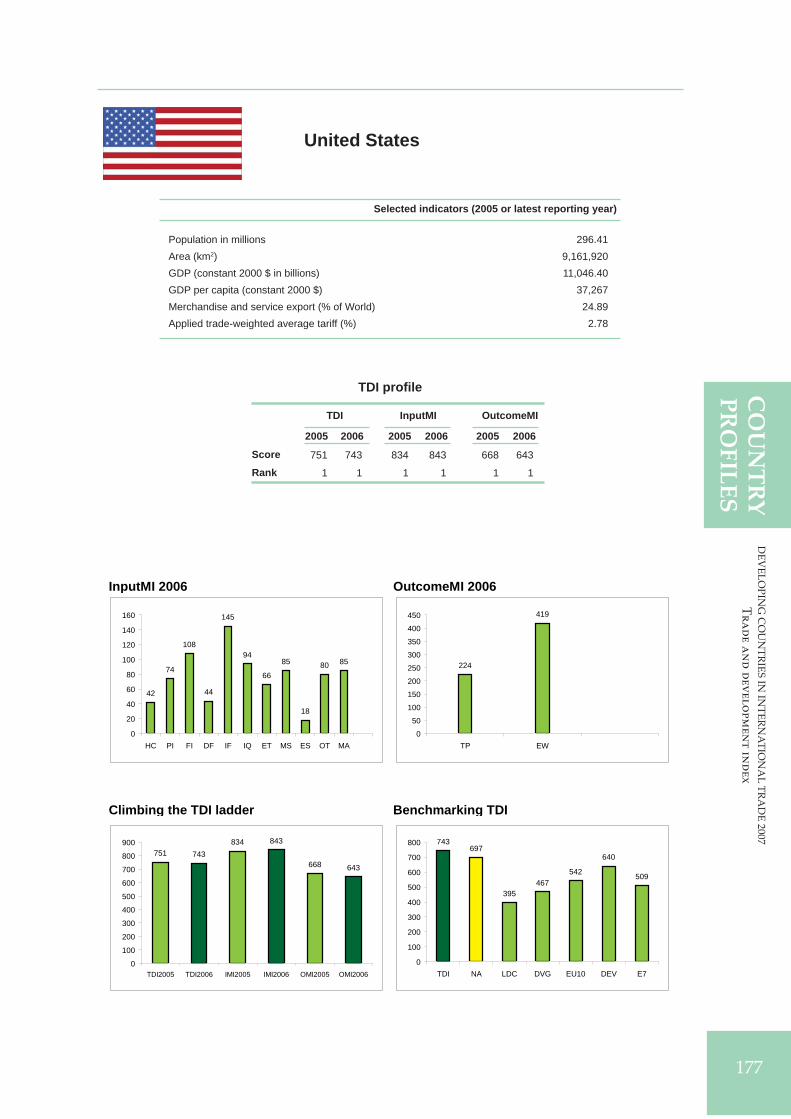
DE
VE
LO
PIN
G C
OU
NT
RIE
S IN
INT
ER
NA
TIO
NA
L T
RA
DE
20
07
Tr
ad
e a
nd
dev
elo
pm
en
t in
dex
177
CO
UN
TR
YP
RO
FIL
ES
TDI profi le
TDI InputMI OutcomeMI
2005 2006 2005 2006 2005 2006
Score
Rank
Selected indicators (2005 or latest reporting year)
United States
Population in millions 296.41Area (km2) 9,161,920GDP (constant 2000 $ in billions) 11,046.40GDP per capita (constant 2000 $) 37,267Merchandise and service export (% of World) 24.89Applied trade-weighted average tariff (%) 2.78
751 743 834 843 668 643
1 1 1 1 1 1
InputMI 2006 OutcomeMI 2006
Climbing the TDI ladder Benchmarking TDI
42
74
108
44
145
94
66
85
18
80 85
0
20
40
60
80
100
120
140
160
HC PI FI DF IF IQ ET MS ES OT MA
224
419
0
50
100
150
200
250
300
350
400
450
TP EW
751 743834 843
668 643
0
100
200
300
400
500
600
700
800
900
TDI2005 TDI2006 IMI2005 IMI2006 OMI2005 OMI2006
743697
395467
542
640
509
0
100
200
300
400
500
600
700
800
TDI NA LDC DVG EU10 DEV E7
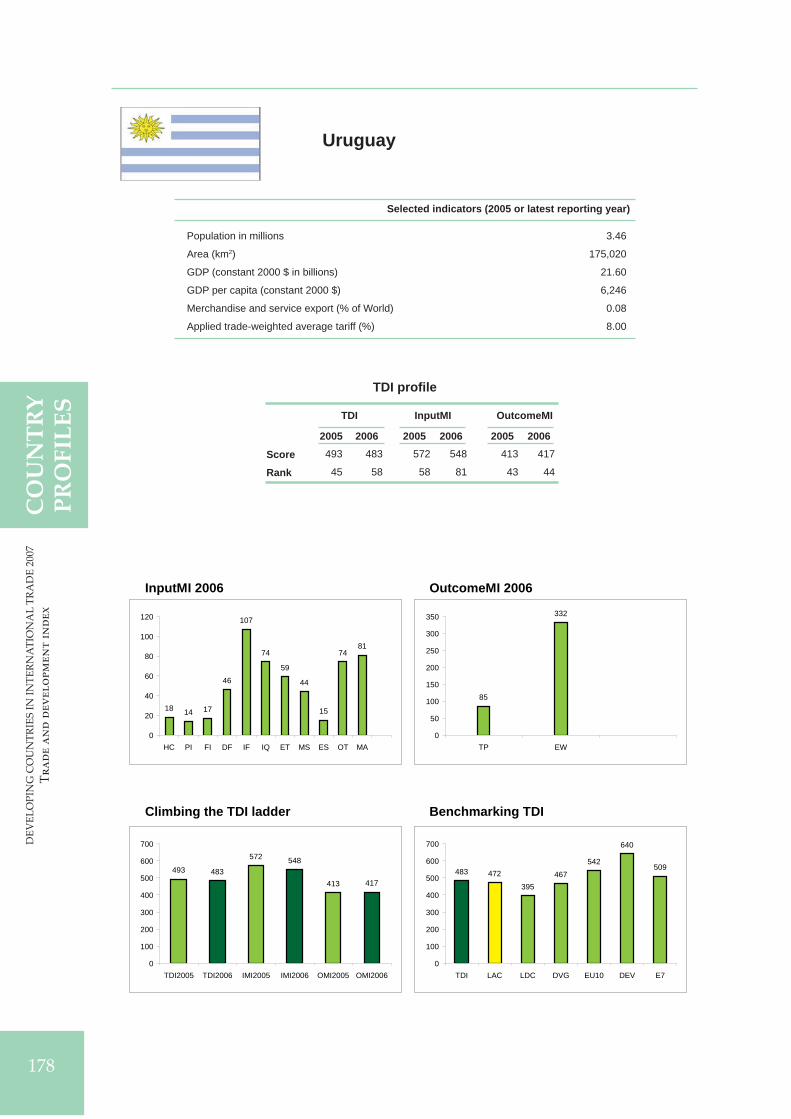
DE
VE
LO
PIN
G C
OU
NT
RIE
S I
N I
NT
ER
NA
TIO
NA
L T
RA
DE
20
07
Tr
ad
e a
nd
dev
elo
pm
en
t i
nd
ex
178
CO
UN
TR
YP
RO
FIL
ES
Selected indicators (2005 or latest reporting year)
TDI profi le
TDI InputMI OutcomeMI
2005 2006 2005 2006 2005 2006
Score
Rank
Uruguay
Population in millions 3.46
Area (km2) 175,020
GDP (constant 2000 $ in billions) 21.60
GDP per capita (constant 2000 $) 6,246
Merchandise and service export (% of World) 0.08
Applied trade-weighted average tariff (%) 8.00
493 483 572 548 413 417
45 58 58 81 43 44
InputMI 2006 OutcomeMI 2006
Climbing the TDI ladder Benchmarking TDI
18 14 17
46
107
74
59
44
15
7481
0
20
40
60
80
100
120
HC PI FI DF IF IQ ET MS ES OT MA
85
332
0
50
100
150
200
250
300
350
TP EW
493 483
572 548
413 417
0
100
200
300
400
500
600
700
TDI2005 TDI2006 IMI2005 IMI2006 OMI2005 OMI2006
483 472
395467
542
640
509
0
100
200
300
400
500
600
700
TDI LAC LDC DVG EU10 DEV E7
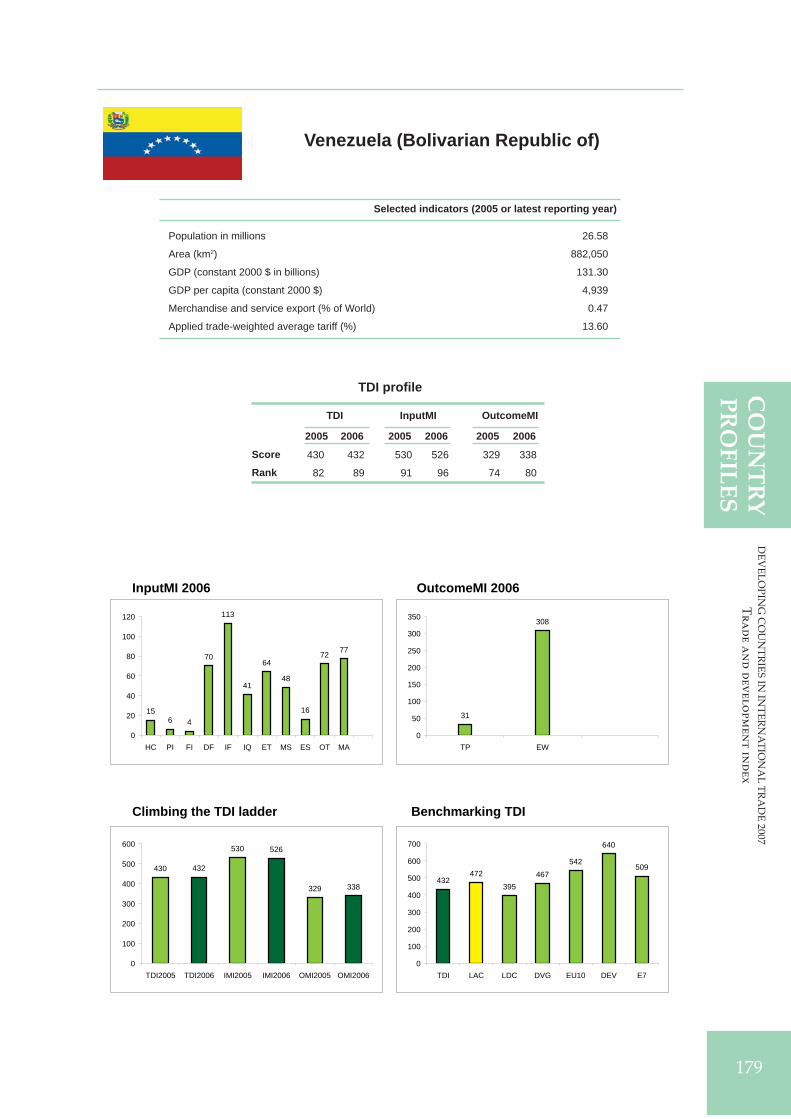
DE
VE
LO
PIN
G C
OU
NT
RIE
S IN
INT
ER
NA
TIO
NA
L T
RA
DE
20
07
Tr
ad
e a
nd
dev
elo
pm
en
t in
dex
179
CO
UN
TR
YP
RO
FIL
ES
TDI profi le
TDI InputMI OutcomeMI
2005 2006 2005 2006 2005 2006
Score
Rank
Selected indicators (2005 or latest reporting year)
Venezuela (Bolivarian Republic of)
Population in millions 26.58
Area (km2) 882,050
GDP (constant 2000 $ in billions) 131.30
GDP per capita (constant 2000 $) 4,939
Merchandise and service export (% of World) 0.47
Applied trade-weighted average tariff (%) 13.60
430 432 530 526 329 338
82 89 91 96 74 80
InputMI 2006 OutcomeMI 2006
Climbing the TDI ladder Benchmarking TDI
156 4
70
113
41
64
48
16
72 77
0
20
40
60
80
100
120
HC PI FI DF IF IQ ET MS ES OT MA
31
308
0
50
100
150
200
250
300
350
TP EW
430 432
530 526
329 338
0
100
200
300
400
500
600
TDI2005 TDI2006 IMI2005 IMI2006 OMI2005 OMI2006
432472
395467
542
640
509
0
100
200
300
400
500
600
700
TDI LAC LDC DVG EU10 DEV E7

DE
VE
LO
PIN
G C
OU
NT
RIE
S I
N I
NT
ER
NA
TIO
NA
L T
RA
DE
20
07
Tr
ad
e a
nd
dev
elo
pm
en
t i
nd
ex
180
CO
UN
TR
YP
RO
FIL
ES
Selected indicators (2005 or latest reporting year)
TDI profi le
TDI InputMI OutcomeMI
2005 2006 2005 2006 2005 2006
Score
Rank
Viet Nam
Population in millions 83.12
Area (km2) 310,070
GDP (constant 2000 $ in billions) 44.70
GDP per capita (constant 2000 $) 538
Merchandise and service export (% of World) 0.45
Applied trade-weighted average tariff (%) 14.70
496 503 563 566 428 439
44 44 63 70 37 38
InputMI 2006 OutcomeMI 2006
Climbing the TDI ladder Benchmarking TDI
194
24
62
133
4152
82
12
67 72
0
20
40
60
80
100
120
140
HC PI FI DF IF IQ ET MS ES OT MA
104
335
0
50
100
150
200
250
300
350
400
TP EW
496 503563 566
428 439
0
100
200
300
400
500
600
TDI2005 TDI2006 IMI2005 IMI2006 OMI2005 OMI2006
503554
395467
542
640
509
0
100
200
300
400
500
600
700
TDI EAP LDC DVG EU10 DEV E7

DE
VE
LO
PIN
G C
OU
NT
RIE
S IN
INT
ER
NA
TIO
NA
L T
RA
DE
20
07
Tr
ad
e a
nd
dev
elo
pm
en
t in
dex
181
CO
UN
TR
YP
RO
FIL
ES
TDI profi le
TDI InputMI OutcomeMI
2005 2006 2005 2006 2005 2006
Score
Rank
Selected indicators (2005 or latest reporting year)
Yemen
Population in millions 20.97
Area (km2) 527,970
GDP (constant 2000 $ in billions) 11.10
GDP per capita (constant 2000 $) 530
Merchandise and service export (% of World) 0.08
Applied trade-weighted average tariff (%) 6.93
362 370 561 569 163 170
115 117 66 67 123 123
InputMI 2006 OutcomeMI 2006
Climbing the TDI ladder Benchmarking TDI
38
2 3
40
138
4257
71
12
80 85
0
20
40
60
80
100
120
140
160
HC PI FI DF IF IQ ET MS ES OT MA
26
144
0
20
40
60
80
100
120
140
160
TP EW
362 370
561 569
163 170
0
100
200
300
400
500
600
TDI2005 TDI2006 IMI2005 IMI2006 OMI2005 OMI2006
370
477
395467
542
640
509
0
100
200
300
400
500
600
700
TDI MENA LDC DVG EU10 DEV E7

DE
VE
LO
PIN
G C
OU
NT
RIE
S I
N I
NT
ER
NA
TIO
NA
L T
RA
DE
20
07
Tr
ad
e a
nd
dev
elo
pm
en
t i
nd
ex
182
CO
UN
TR
YP
RO
FIL
ES
Selected indicators (2005 or latest reporting year)
TDI profi le
TDI InputMI OutcomeMI
2005 2006 2005 2006 2005 2006
Score
Rank
Zambia
Population in millions 11.67
Area (km2) 743,390
GDP (constant 2000 $ in billions) 4.10
GDP per capita (constant 2000 $) 350
Merchandise and service export (% of World) 0.03
Applied trade-weighted average tariff (%) 10.60
383 381 493 493 272 269
104 112 110 114 94 103
InputMI 2006 OutcomeMI 2006
Climbing the TDI ladder Benchmarking TDI
197 3
50
117
4552
37
13
73 77
0
20
40
60
80
100
120
140
HC PI FI DF IF IQ ET MS ES OT MA
55
213
0
50
100
150
200
250
TP EW
383 381
493 493
272 269
0
100
200
300
400
500
600
TDI2005 TDI2006 IMI2005 IMI2006 OMI2005 OMI2006
381 400 395467
542
640
509
0
100
200
300
400
500
600
700
TDI SSA LDC DVG EU10 DEV E7

DE
VE
LO
PIN
G C
OU
NT
RIE
S IN
INT
ER
NA
TIO
NA
L T
RA
DE
20
07
Tr
ad
e a
nd
dev
elo
pm
en
t in
dex
183
CO
UN
TR
YP
RO
FIL
ES
TDI profi le
TDI InputMI OutcomeMI
2005 2006 2005 2006 2005 2006
Score
Rank
Selected indicators (2005 or latest reporting year)
Zimbabwe
Population in millions 13.01
Area (km2) 386,850
GDP (constant 2000 $ in billions) 5.50
GDP per capita (constant 2000 $) 426
Merchandise and service export (% of World) 0.03
Applied trade-weighted average tariff (%) 17.33
380 395 447 453 313 337
107 103 120 123 80 82
InputMI 2006 OutcomeMI 2006
Climbing the TDI ladder Benchmarking TDI
25
714
34
127
25
55
18 16
65 67
0
20
40
60
80
100
120
140
HC PI FI DF IF IQ ET MS ES OT MA
94
243
0
50
100
150
200
250
300
TP EW
380 395447 453
313337
050
100150200250300350400450500
TDI2005 TDI2006 IMI2005 IMI2006 OMI2005 OMI2006
395 400 395467
542
640
509
0
100
200
300
400
500
600
700
TDI SSA LDC DVG EU10 DEV E7

QUESTIONNAIRE
DEVELOPING COUNTRIES IN INTERNATIONAL TRADE 2007Trade and Development Index
Readership Survey
Since 1999, the Trade Analysis Branch of the Division on International Trade in Goods
and Services, and Commodities of UNCTAD has been carrying out policy-oriented analytical
work aimed at improving the understanding of current and emerging issues in international
trade and development. In order to improve the quality of the work of the Branch, it would
be useful to receive the views of readers on this and other similar publications. It would
therefore be greatly appreciated if you could complete the following questionnaire and return
to:
Trade Analysis Branch, DITC
Rm. E-8076
United Nations Conference on Trade and Development
Palais des Nations
CH-1211 Geneva 10, Switzerland
1. Name and address of respondent (optional):
2. Which of the following describes your area of work?
Government Public enterprise
Private enterprise institution Academic or research
International organization Media
Not-for-profi t organization Other (specify) _________________
3. In which country do you work? _________________________________________
4. Did you fi nd this publication Very useful Of some use Little use
to your work?
5. What is your assessment of the contents of this publication?
Excellent Good Adequate Poor
6. Other comments: