Embed Size (px)
Citation preview

Trade and Climate Change in Emerging Economies: Trade and Climate Change in Emerging Economies: The Competitiveness, Technology, and Intellectual Property Rights DimensionThe Competitiveness, Technology, and Intellectual Property Rights DimensionInformal Dialogue organised by ICTSD in collaboration with RIS Informal Dialogue organised by ICTSD in collaboration with RIS
Trade Flows, Trade-Barriers and Market Drivers in Trade Flows, Trade-Barriers and Market Drivers in Climate-Friendly Technologies and Associated Climate-Friendly Technologies and Associated Goods: Where do Emerging Economies Stand?Goods: Where do Emerging Economies Stand?
RenRenéé Vossenaar Vossenaar

2ICTSD/RIS Informal Policy Dialogue, New Delhi, 30-31 March 2010
BACKGROUNDBACKGROUND
BackgroundBackground• The deployment of renewable energy (RE) technologies and the The deployment of renewable energy (RE) technologies and the
promotion of energy efficiency (EE) are crucial for climate promotion of energy efficiency (EE) are crucial for climate mitigation and provide opportunities for sustainable development mitigation and provide opportunities for sustainable development and trade gains. and trade gains.
• Trade can contribute to the diffusion of climate-friendly Trade can contribute to the diffusion of climate-friendly technologies:technologies:− Trade liberalisation (reducing costs of technologies/components). Trade liberalisation (reducing costs of technologies/components). − Market transformation. Market transformation.
This presentationThis presentation• Linking technology deployment with international tradeLinking technology deployment with international trade
− ICTSD studiesICTSD studies− Trade flowsTrade flows− Trade barriersTrade barriers− Market driversMarket drivers
• Some lessons learned for EGS negotiationsSome lessons learned for EGS negotiations

3ICTSD/RIS Informal Policy Dialogue, New Delhi, 30-31 March 2010
ICTSD STUDIESICTSD STUDIES
Issues covered in ICTSD project:Issues covered in ICTSD project:• Mapping of climate friendly Mapping of climate friendly
technologies technologies − Renewable energy (RE) Renewable energy (RE) − Energy efficiency (EE) Energy efficiency (EE)
• Identification of (internationally-traded) Identification of (internationally-traded) products and components associated products and components associated with these technologies, including HS with these technologies, including HS codescodes
• Drivers of technology deployment, tradeDrivers of technology deployment, trade• Trade, tariff and NTB analysisTrade, tariff and NTB analysis
− Market access conditionsMarket access conditions− Market opportunities that arise from Market opportunities that arise from
the deployment of such the deployment of such technologies, especially for technologies, especially for producers in emerging countriesproducers in emerging countries
• Policy conclusionsPolicy conclusions
Three sectors:Three sectors:• Renewable energy Renewable energy
supplysupply• Residential and Residential and
commercial buildingscommercial buildings• Transport Transport
Trade analysis can be Trade analysis can be linked to only part of linked to only part of the technology options the technology options identified in the identified in the mapping studiesmapping studies

4ICTSD/RIS Informal Policy Dialogue, New Delhi, 30-31 March 2010
CONCLUSIONSCONCLUSIONS
• The deployment of RE technologies and investment in EE are The deployment of RE technologies and investment in EE are largely driven by policy targets, regulations and incentives.largely driven by policy targets, regulations and incentives.
• Tariff liberalisation alone likely to have relatively little impact.Tariff liberalisation alone likely to have relatively little impact.• Need to look into NTBs and subsidies and how they affect Need to look into NTBs and subsidies and how they affect
opportunities for developing country producers to participate in opportunities for developing country producers to participate in global supply chains global supply chains
• Trade can help promote market transformation (beyond EGS Trade can help promote market transformation (beyond EGS negotiations).negotiations).
• Integrated packages are needed to stimulate the successful Integrated packages are needed to stimulate the successful deployment of RE and EE technologies in emerging economies.deployment of RE and EE technologies in emerging economies.
• The uptake of RE and EE technologies in many developing The uptake of RE and EE technologies in many developing countries will require a broad array of support measures (e.g. countries will require a broad array of support measures (e.g. sharing knowledge of the technologies and their components, sharing knowledge of the technologies and their components, financing and capacity-building).financing and capacity-building).

5ICTSD/RIS Informal Policy Dialogue, New Delhi, 30-31 March 2010
METHODOLOGICAL ISSUESMETHODOLOGICAL ISSUES
• HS codes often not specific enough to capture climate-friendly technologies: unrelated goods get included (“ex-out” items).
• Multiple-use: including non-environmental.
• Energy efficiency: in most cases tariff classifications cannot identify relatively energy-efficient products
• A good match between RE A good match between RE technologies and HS exists in technologies and HS exists in only very few cases. only very few cases. − In several proposed definitions In several proposed definitions
of (potential) EG, multiple-use of (potential) EG, multiple-use products represent around 80 products represent around 80 per cent of world imports.per cent of world imports.
• Consulting more detailed tariff schedules may sometimes be useful, but conclusions cannot be generalized.
• In most cases, expert opinions and industry surveys are needed to assess whether the deployment of climate-friendly technologies is a driver of trade− USITC study on US wind
industry
“Ex-outs”• Where multiple use is intrinsic
to the product, creating “ex-outs” is not a viable option.

6ICTSD/RIS Informal Policy Dialogue, New Delhi, 30-31 March 2010
MAPPING TECHNOLOGIES: RE SUPPLYMAPPING TECHNOLOGIES: RE SUPPLY
Key technologies:Key technologies:• Solar energySolar energy
− Concentrating solar power Concentrating solar power (CSP)(CSP)
− Solar heating and cooling Solar heating and cooling − Photovoltaic (PV) Photovoltaic (PV)
• Wind energyWind energy− OnshoreOnshore− OffshoreOffshore
• HydropowerHydropower• BiomassBiomass
− EquipmentEquipment− BiofuelsBiofuels
• Ocean energyOcean energy• Geothermal energyGeothermal energy
Trade analysis Trade analysis (largest number of products)(largest number of products)
• Single environmental useSingle environmental use− Finished products (examples)Finished products (examples)
• Solar PV panels (Ex Solar PV panels (Ex 8541.40)8541.40)
• SWH equipment (Ex SWH equipment (Ex 8419.19)8419.19)
• Wind-energy turbines Wind-energy turbines (850231)(850231)
− Hydraulic turbines (HS 8410)Hydraulic turbines (HS 8410)− Biofuels Biofuels
• Ex 2207Ex 2207• Ex 382490Ex 382490
• ComponentsComponents− Participation in supply chainsParticipation in supply chains
− Multiple use issues (and “ex-Multiple use issues (and “ex-out” issues)out” issues)

7ICTSD/RIS Informal Policy Dialogue, New Delhi, 30-31 March 2010
MAPPING TECGNOLOGIES: BUILDINGSMAPPING TECGNOLOGIES: BUILDINGS
Key technologies:Key technologies:• Improving energy efficiency (EE) Improving energy efficiency (EE)
in new and existing buildingsin new and existing buildings− Insulation materials Insulation materials − Efficient lightingEfficient lighting− Energy-efficient HVAC-R, hot Energy-efficient HVAC-R, hot
water, applianceswater, appliances
• Increasing renewable energy Increasing renewable energy (RE) use in buildings(RE) use in buildings − Active collection and Active collection and
transformation of solar energy transformation of solar energy − RE heating and cooling (REHC), RE heating and cooling (REHC),
such as geothermal heat pumps such as geothermal heat pumps and wood-pellet stovesand wood-pellet stoves
overlap with RE supplyoverlap with RE supply
Trade analysisTrade analysis
• Certain insulation materialsCertain insulation materials− excl multiple-use materialsexcl multiple-use materials
• Efficient lightingEfficient lighting− HS 8531.39HS 8531.39
• EE componentsEE componentse.g. control instruments e.g. control instruments (such as thermostats)(such as thermostats)
• Solar PV panels Solar PV panels − HS 8541.40 (includes LED)HS 8541.40 (includes LED)
• Solar water heatersSolar water heaters− HS Ex 8419.19HS Ex 8419.19
• Heat pumpsHeat pumps− HS Ex 8418.61HS Ex 8418.61

8ICTSD/RIS Informal Policy Dialogue, New Delhi, 30-31 March 2010
MAPPING TECHNOLOGIES: ROAD MAPPING TECHNOLOGIES: ROAD TRANSPORTTRANSPORT
Key technologies:Key technologies:
• More efficient petroleum-powered More efficient petroleum-powered vehiclesvehicles− Improvements to gasoline and diesel Improvements to gasoline and diesel
internal-combustion engines (ICE) internal-combustion engines (ICE) − Non-engine technologies; e.g. lighting Non-engine technologies; e.g. lighting
and air conditioning, rolling-resistant tyres and air conditioning, rolling-resistant tyres − Lightweight materials Lightweight materials
• Larger market penetration of alternative, Larger market penetration of alternative, low-carbon vehicles such as hybrid cars, low-carbon vehicles such as hybrid cars, plug-in hybrids and electric carsplug-in hybrids and electric cars− Electric carsElectric cars− Battery technologiesBattery technologies− Fuel cells Fuel cells
• Increased consumption of biofuelsIncreased consumption of biofuels
Trade analysisTrade analysis
• Electric carsElectric cars• Ex 8703.90Ex 8703.90• BatteriesBatteries
− Ex 8506.80Ex 8506.80− Ex 8507.80Ex 8507.80
• Fuel cellsFuel cells
• BiofuelsBiofuels− Ex 2207.10Ex 2207.10− Ex 2207.20Ex 2207.20− Ex 3824.90Ex 3824.90

9ICTSD/RIS Informal Policy Dialogue, New Delhi, 30-31 March 2010
TRADE IN CLIMATE-FRIENDLY TRADE IN CLIMATE-FRIENDLY TECHNOLOGIES/PRODUCTSTECHNOLOGIES/PRODUCTS
Based on ICTSD studies:Based on ICTSD studies:
• Although trade in products and components (that may be) Although trade in products and components (that may be) associated with climate-friendly technologies is significantly associated with climate-friendly technologies is significantly overestimated due to “ex-out” and multiple-use issues, it overestimated due to “ex-out” and multiple-use issues, it represents only around 2% of total world trade or around 3% of represents only around 2% of total world trade or around 3% of world trade in industrial products (HS 28-97). world trade in industrial products (HS 28-97).
• Developing country share in world exports (excluding intra-EU Developing country share in world exports (excluding intra-EU trade) increased from 32% in 2004 to 42% in 2008, in value trade) increased from 32% in 2004 to 42% in 2008, in value terms. terms.
• Very strong increase developing country share wind and solar Very strong increase developing country share wind and solar energy.energy.
• Their share in world imports remained stable at around 60%. Their share in world imports remained stable at around 60%. • The share in total developing country exports of industrial The share in total developing country exports of industrial
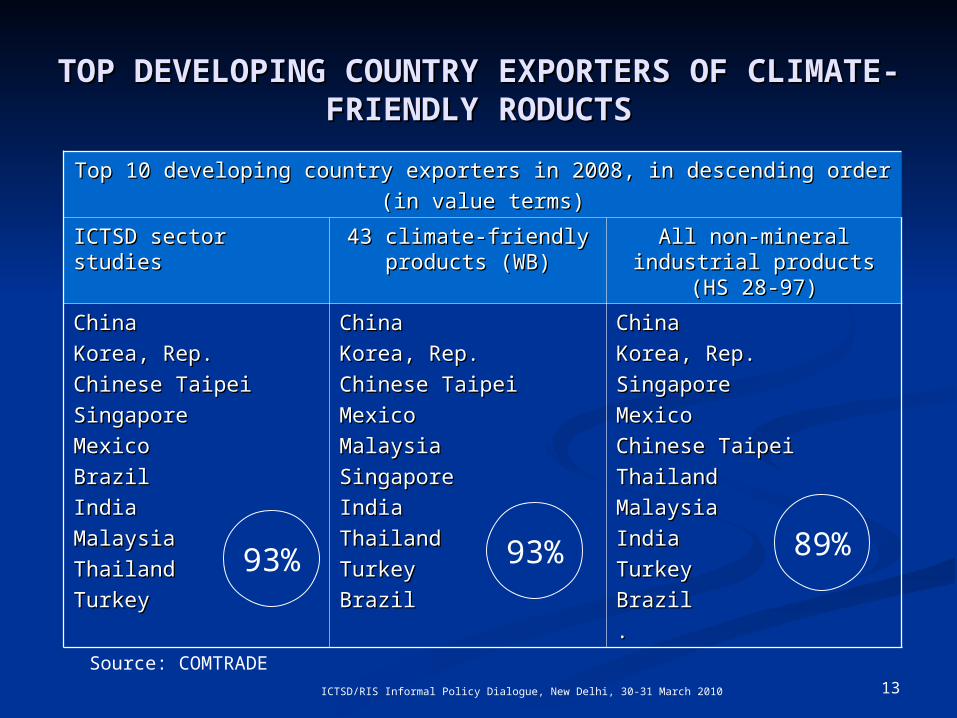
products increased gradually from 2% in 2004 to 3% in 2008.products increased gradually from 2% in 2004 to 3% in 2008.• Top developing country exporters of products and components Top developing country exporters of products and components
associated with climate-friendly technologies are no different from associated with climate-friendly technologies are no different from top exports of industrial products in general.top exports of industrial products in general.
Trade flows

10ICTSD/RIS Informal Policy Dialogue, New Delhi, 30-31 March 2010
SHARES IN WORLD EXPORTS OF RE SHARES IN WORLD EXPORTS OF RE TECHNOLOGIES/GOODSTECHNOLOGIES/GOODS
Shares in world exports (excluding intra-EU trade)Shares in world exports (excluding intra-EU trade)
20042004 20052005 20062006 20072007 20082008
Brazil, China, India and South AfricaBrazil, China, India and South Africa 1313 1515 1818 2020 2323
- ChinaChina 1111 1212 1515 1717 1919
- Brazil, India and South Africa- Brazil, India and South Africa 22 33 44 44 44
Other developing countriesOther developing countries 1818 1818 1818 1919 1818
Rest of the worldRest of the world 6969 6767 6464 6060 5959
TotalTotal 100100 100100 100100 100100 100100
Large emerging economies increased their share (in value terms) in world exports of goods and components associated with RE technologies during the period 2004-2008 (at the expense of developed countries)
Source: COMTRADE and ICTSD studies

11ICTSD/RIS Informal Policy Dialogue, New Delhi, 30-31 March 2010
DEVELOPING COUNTRY SHARE IN EXPORTS OF DEVELOPING COUNTRY SHARE IN EXPORTS OF WIND TURBINES UP SHARPLYWIND TURBINES UP SHARPLY
Top exportersTop exporters Exports (in US$ values)Exports (in US$ values)
20020044
20052005 20020066
20020077
20082008
WorldWorld 10710744
19161916 30930966
38638666
53925392
GermanyGermany 9797 590590 832832 969969 20042004
DenmarkDenmark 888888 998998 11811822
16716733
11861186
IndiaIndia 11 2424 199199 336336 651651
SpainSpain 3737 182182 327327 198198 479479
JapanJapan 00 88 143143 354354 469469
ChinaChina 00 00 00 33 211211
Developing countriesDeveloping countries 2020 6666 285285 525525 10101010
World World (excl-intra EU)(excl-intra EU) 561561 11041104 24624677
28028033
33353335
Share (%)Share (%) 44 66 1212 1919 3030
0
500
1000
1500
2000
2500
2004 2005 2006 2007 2008
Other exporters
Developing country exporters
Source: COMTRADE

12ICTSD/RIS Informal Policy Dialogue, New Delhi, 30-31 March 2010
EXPORTS OF PV CELLS AND MODULESEXPORTS OF PV CELLS AND MODULES
• Developing country share in world exports Developing country share in world exports (excl. intra-EU trade) of solar PV cells and (excl. intra-EU trade) of solar PV cells and modules has increased sharply in recent modules has increased sharply in recent yearsyears
• Chinese and Indian exports increased, Chinese and Indian exports increased, largely in response to rapidly increasing largely in response to rapidly increasing EU imports (in particular Spain and EU imports (in particular Spain and Germany) Germany)
0.0
5.0
10.0
15.0
20.0
25.0
30.0
35.0
2003 2004 2005 2006 2007 2008
World exports excl. intra-EU
Developing country exports
Exports by other countries
Developing country share (%)Developing country share (%)
20032003 20042004 20052005 20062006 20072007 20082008
2525 3535 3939 4646 5555 6464
Developing country exports of solar PV Developing country exports of solar PV cells/modules ($m)cells/modules ($m)
20042004 20052005 20062006 20072007 20082008
ChinaChina 644644 12581258 24602460 52525252 1174511745
IndiaIndia 8787 9494 134134 213213 529529
OtherOther 28812881 32783278 41974197 53425342 71857185
Source: COMTRADE
13ICTSD/RIS Informal Policy Dialogue, New Delhi, 30-31 March 2010
TOP DEVELOPING COUNTRY EXPORTERS OF TOP DEVELOPING COUNTRY EXPORTERS OF CLIMATE-FRIENDLY RODUCTSCLIMATE-FRIENDLY RODUCTS
Top 10 developing country exporters in 2008, in descending orderTop 10 developing country exporters in 2008, in descending order
(in value terms)(in value terms)
ICTSD sector studiesICTSD sector studies 43 climate-friendly 43 climate-friendly products (WB)products (WB)
All non-mineral industrial All non-mineral industrial products (HS 28-97)products (HS 28-97)
ChinaChina
Korea, Rep.Korea, Rep.
Chinese TaipeiChinese Taipei
SingaporeSingapore
MexicoMexico
BrazilBrazil
IndiaIndia
Malaysia Malaysia
ThailandThailand
Turkey Turkey
ChinaChina
Korea, Rep.Korea, Rep.
Chinese TaipeiChinese Taipei
MexicoMexico
MalaysiaMalaysia
Singapore Singapore
IndiaIndia
ThailandThailand
Turkey Turkey
BrazilBrazil
ChinaChina
Korea, Rep.Korea, Rep.
SingaporeSingapore
Mexico Mexico
Chinese TaipeiChinese Taipei
ThailandThailand
MalaysiaMalaysia
IndiaIndia
Turkey Turkey
BrazilBrazil
. .
93% 93% 89%
Source: COMTRADE

14ICTSD/RIS Informal Policy Dialogue, New Delhi, 30-31 March 2010
WHAT ARE THE IMPORTANT BARRIERS?WHAT ARE THE IMPORTANT BARRIERS?
• Tariffs are, in general, less significant as an explanatory variable Tariffs are, in general, less significant as an explanatory variable for increased exports or imports of RE equipment and components for increased exports or imports of RE equipment and components compared to other variables. compared to other variables. − However, bio-ethanol tariffs have significant impacts on trade (bio-However, bio-ethanol tariffs have significant impacts on trade (bio-
ethanol is an agricultural product).ethanol is an agricultural product). • WRI study on the wind-energy industry: non-tariff barriers (NTBs) WRI study on the wind-energy industry: non-tariff barriers (NTBs)
and formal and informal barriers that distort firms’ investment and formal and informal barriers that distort firms’ investment decisions (rather than import tariffs) are the principal obstacles to decisions (rather than import tariffs) are the principal obstacles to global integration.global integration.
• NTBs, subsidies and their effects on opportunities for developing NTBs, subsidies and their effects on opportunities for developing country producers to participate in global supply chains.country producers to participate in global supply chains.
The markets for RE technologies are distorted by subsidies, The markets for RE technologies are distorted by subsidies, preferential procurement policies, local-content provisions, tied preferential procurement policies, local-content provisions, tied aid and projects offering tariff and other concessionsaid and projects offering tariff and other concessions
Trade barriers

15ICTSD/RIS Informal Policy Dialogue, New Delhi, 30-31 March 2010
TARIFFS IN LARGE EMERGING ECONOMIESTARIFFS IN LARGE EMERGING ECONOMIES
Sample of products that may be associated with climate-friendly Sample of products that may be associated with climate-friendly technologies:technologies:
• China: MFN applied tariffs are mostly in the 8-12% range China: MFN applied tariffs are mostly in the 8-12% range − Simple average close to 10%. Simple average close to 10%.
• India: Most MFN applied tariffs are either 7.5 or 10% India: Most MFN applied tariffs are either 7.5 or 10% − Simple average of slightly above 8%. Simple average of slightly above 8%.
• Brazil: simple average of MFN applied rates around 14%. Brazil: simple average of MFN applied rates around 14%. • In South Africa, most tariffs are in the 0-15% range In South Africa, most tariffs are in the 0-15% range
− Simple average of around 5%Simple average of around 5%
• Solar PV cells and panels (part of HS 8541.40) enter most markets Solar PV cells and panels (part of HS 8541.40) enter most markets (including China, India and South Africa) duty-free. 99.5% per cent of (including China, India and South Africa) duty-free. 99.5% per cent of 2008 world imports of (in value terms, excluding intra-EU trade) 2008 world imports of (in value terms, excluding intra-EU trade) enjoyed zero MFN applied rates (for developing country importers: enjoyed zero MFN applied rates (for developing country importers: 98.5%).98.5%).− In Brazil: MFN applied rate of 12%In Brazil: MFN applied rate of 12%
• In many developing countries MFN applied rates for solar water heaters In many developing countries MFN applied rates for solar water heaters (part of HS 8419.19) are rather high (20% in Brazil and 35% in China).(part of HS 8419.19) are rather high (20% in Brazil and 35% in China).

16ICTSD/RIS Informal Policy Dialogue, New Delhi, 30-31 March 2010
TARIFF LIBERALISATION: SOME ISSUESTARIFF LIBERALISATION: SOME ISSUES
• It is sometimes suggested that tariff liberalisation could focus on It is sometimes suggested that tariff liberalisation could focus on finished products with predominantly single environmental use (to finished products with predominantly single environmental use (to minimise concerns related to multiple-use products).minimise concerns related to multiple-use products).− Preferred option for smaller developing countries? Preferred option for smaller developing countries? − Focusing liberalisation on finished products only might, in theory, affect Focusing liberalisation on finished products only might, in theory, affect
tariff structures and, in some cases, result in negative protection. tariff structures and, in some cases, result in negative protection.
• Developing countries with sufficiently large markets seek to develop Developing countries with sufficiently large markets seek to develop local manufacturing capacities and attract FDI. local manufacturing capacities and attract FDI. − Examples: wind energy in Brazil and China, National Solar Mission in India Examples: wind energy in Brazil and China, National Solar Mission in India
and SWH in South Africa.and SWH in South Africa.− Infant-industry arguments for tariff protection (but avoiding inefficiency)? Infant-industry arguments for tariff protection (but avoiding inefficiency)? − Liberalising key intermediate products (despite multiple-use issues)? Liberalising key intermediate products (despite multiple-use issues)?
• Some countries may have relatively high tariffs at the border, but Some countries may have relatively high tariffs at the border, but provide for significant fiscal incentives (e.g. internal tax reductions or provide for significant fiscal incentives (e.g. internal tax reductions or exemptions. Example: Brazilian incentives for solar and wind-energy exemptions. Example: Brazilian incentives for solar and wind-energy products) products)

17ICTSD/RIS Informal Policy Dialogue, New Delhi, 30-31 March 2010
TARIFFS, WIND ENERGY: TARIFFS, WIND ENERGY: FINISHED PRODUCTS AND COMPONENTSFINISHED PRODUCTS AND COMPONENTS
BrazilBrazil ChinaChina IndiaIndia South Africa South Africa
ApplieAppliedd
(2009)(2009)
BoundBound AppliedApplied
(2008)(2008)BoundBound ApplieApplie
dd
(2008(2008))
BoundBound ApplieAppliedd
(2007(2007))
BoundBound
Wind turbinesWind turbines 00
(14)(14)3535 88 88 88 2525 0 0 2020
ComponentsComponents
TowersTowers
BladesBlades
Ball bearingsBall bearings
GearboxesGearboxes
GeneratorsGenerators
Motor partsMotor parts
1414
1414
1616
1414
1414
1414
3535
3535
25-3525-35
25-3525-35
3535
3030
8.48.4
2-82-8
88
88
5.8-105.8-10
3-123-12
8.48.4
2-82-8
88
88
5.8-105.8-10
3-123-12
1010
88
88
88
88
88
4040
2525
4040
4040
4040
4040
7.57.5
00
00
00
00
5-155-15
1515
1515
3030
1010
3030
1515
Source: WTO Tariff Download Facility

18ICTSD/RIS Informal Policy Dialogue, New Delhi, 30-31 March 2010
INCENTIVES AND NTBsINCENTIVES AND NTBs
Incentives and subsidiesIncentives and subsidies− Incentives based on Government interventions (such as Feed-Incentives based on Government interventions (such as Feed-
in Tariffs) in Tariffs) − Governments subsidies (e.g. installation subsidies, tax credits, Governments subsidies (e.g. installation subsidies, tax credits,
preferential loans)preferential loans)− Manufacturing subsidies (e.g. section 48C of the American Manufacturing subsidies (e.g. section 48C of the American
Recovery and Reinvestment Act (ARRA))Recovery and Reinvestment Act (ARRA))
WRI study on wind-energy sector: NTBs more important than WRI study on wind-energy sector: NTBs more important than tariffs: tariffs:
− Local content requirements (in developed and developing countries)
− Different industrial standards and certification requirements.− Political quid-pro-quo expectations

19ICTSD/RIS Informal Policy Dialogue, New Delhi, 30-31 March 2010
KEY DRIVERS, POLICIES AND MEASURESKEY DRIVERS, POLICIES AND MEASURES
DriversDrivers• Climate change (in particular in developed countries) Climate change (in particular in developed countries) • Energy shortage, access to energy (in particular in developing Energy shortage, access to energy (in particular in developing
countries)countries)
Policies and measures (examples)Policies and measures (examples)
RE technologiesRE technologies• Renewable portfolio standards (which require electricity providers to obtain a Renewable portfolio standards (which require electricity providers to obtain a
minimum percentage of their power from RE resources by a certain date). minimum percentage of their power from RE resources by a certain date). • Feed-in tariffs to encourage the deployment of RE technologies for electricity Feed-in tariffs to encourage the deployment of RE technologies for electricity
generation.generation.
BuildingsBuildings • EE requirements in building codes, incentives for renovationsEE requirements in building codes, incentives for renovations• Minimum energy performance standards (MEPS) and labellingMinimum energy performance standards (MEPS) and labelling
TransportTransport•• Fuel-economy or CO2 emissions standards. Fuel-economy or CO2 emissions standards.
•• Blending mandatesBlending mandates
Market drivers

20ICTSD/RIS Informal Policy Dialogue, New Delhi, 30-31 March 2010
DRIVERS OF TRADEDRIVERS OF TRADE
DriversDrivers• Capacity additions are often an important driver of international trade.Capacity additions are often an important driver of international trade. • Nine of the 10 countries that most expanded their wind-energy Nine of the 10 countries that most expanded their wind-energy
capacity in 2008 are also among the top 20 importers of wind turbines capacity in 2008 are also among the top 20 importers of wind turbines (India being the exception). (India being the exception).
• USITC study: from 1998 to 2005 changes in US imports of wind USITC study: from 1998 to 2005 changes in US imports of wind turbines were closely correlated with changes in annual wind-turbine turbines were closely correlated with changes in annual wind-turbine installations.installations.
• Large additions in installed PV solar capacity in Spain and Germany (in Large additions in installed PV solar capacity in Spain and Germany (in particular in 2008) resulted in significant increases of imports. particular in 2008) resulted in significant increases of imports. − Chinese exports of solar PV modules jumped from $5.3 billion in 2007 to Chinese exports of solar PV modules jumped from $5.3 billion in 2007 to
$11.7 billion in 2008 with exports to Spain and Germany together $11.7 billion in 2008 with exports to Spain and Germany together accounting for almost 70 per cent of this increase. accounting for almost 70 per cent of this increase.
Developing country advantagesDeveloping country advantages• Abundant renewable resourcesAbundant renewable resources• Lower production costs (equipment, components) Lower production costs (equipment, components)

21ICTSD/RIS Informal Policy Dialogue, New Delhi, 30-31 March 2010
THE SOLAR PV MARKET: TRADE GENERATION THE SOLAR PV MARKET: TRADE GENERATION
• World solar PV market of 5.95 GW in 2008 World solar PV market of 5.95 GW in 2008 • Increase of 110% over 2007 (285% growth in Spain)Increase of 110% over 2007 (285% growth in Spain)
− A large part of demand was met by imports (from China, India)A large part of demand was met by imports (from China, India)
• Market grew 5% to 6.37 GW in 2009 (i.e. in terms of new capacity Market grew 5% to 6.37 GW in 2009 (i.e. in terms of new capacity installations; price decreases may have resulted in lower market installations; price decreases may have resulted in lower market values) values) − Negative factors: Negative factors: new installed capacity eligible for FiT capped to 500 new installed capacity eligible for FiT capped to 500
MW in Spain and recession MW in Spain and recession − Positive factors: New incentives (China, Japan) and strong demand Positive factors: New incentives (China, Japan) and strong demand
growth in Germany in anticipation of reduction of FiTgrowth in Germany in anticipation of reduction of FiT
• In 2008, PV market of 5.95 GW generated $30.5b of world trade.In 2008, PV market of 5.95 GW generated $30.5b of world trade.• Subsidies/FiT (which suddenly change) contributing to market Subsidies/FiT (which suddenly change) contributing to market
fluctuations fluctuations • Ambitious targets to strengthen the domestic market (e.g. India) Ambitious targets to strengthen the domestic market (e.g. India)

22ICTSD/RIS Informal Policy Dialogue, New Delhi, 30-31 March 2010
THE WIND-ENERGY MARKET: THE WIND-ENERGY MARKET: TRADE GENERATIONTRADE GENERATION
• World wind-energy market: 37.5 GW in 2009 World wind-energy market: 37.5 GW in 2009 • In 2009, China added more capacity (13.9 GW) than any other In 2009, China added more capacity (13.9 GW) than any other
country. country. • Imports into the US market have been key driver of Imports into the US market have been key driver of
international tradeinternational trade• In 2008: wind-energy market of 27.1 GW generated $3.3b of In 2008: wind-energy market of 27.1 GW generated $3.3b of
world imports of wind turrbines.world imports of wind turrbines. Annual wind-energy capacity additions (MW), 2004-2009 Annual wind-energy capacity additions (MW), 2004-2009
20042004 20052005 20062006 20072007 20082008 20092009
ChinaChina 197197 496496 13391339 33113311 63006300 1300013000
EU27EU27 57735773 61406140 75187518 85028502 84178417 1016310163
United StatesUnited States 353353 24242424 24262426 52495249 83468346 99229922
IndiaIndia 875875 14301430 18401840 15751575 18001800 12711271
WorldWorld 82078207 1153111531 1524515245 1986519865 2705127051 3746637466
Source: Global Wind Energy Council

23ICTSD/RIS Informal Policy Dialogue, New Delhi, 30-31 March 2010
TRADE INTENSITY MAY DIMINISHTRADE INTENSITY MAY DIMINISH
• Future capacity may generate less trade per MW Future capacity may generate less trade per MW
• The correlation between additions to RE installations and imports The correlation between additions to RE installations and imports may weaken over time, as local content increases: may weaken over time, as local content increases: − As (larger) countries add more installed capacity, domestic As (larger) countries add more installed capacity, domestic
industry will develop more capacity to supply RE equipment industry will develop more capacity to supply RE equipment and components.and components.
− Leading manufacturers may target growing markets through FDI (e.g. subsidiaries or joint ventures) rather than exports (e.g. subsidiaries or joint ventures) rather than exports (wind-industry)(wind-industry)
− Governments which play a key role in stimulating the take-off of RE capacity by providing incentives may seek to ensure maximum benefit for local (domestic and foreign-owned) firms and employment, in particular when incentives are provided through stimulus packages. This is done through This is done through formal local content requirements or political pressure.formal local content requirements or political pressure.

24ICTSD/RIS Informal Policy Dialogue, New Delhi, 30-31 March 2010
US: ANNUAL WIND CAPACITY ADDITIONS US: ANNUAL WIND CAPACITY ADDITIONS AND IMPORTS OF WIND TURBINESAND IMPORTS OF WIND TURBINES
1998 1999 2000 2001 2002 2003 2004 2005 2006 2007 2008 2009
Annual wind-energy capacity additions
Imports of wind turbines(US$ values)
(10 GW)
(US$2.3b)
Source: USITC, updated

25ICTSD/RIS Informal Policy Dialogue, New Delhi, 30-31 March 2010
LESSONS LEARNED FOR EGS LESSONS LEARNED FOR EGS NEGOTIATIONSNEGOTIATIONS
• EGS liberalisation may be relevant for only part of the technology EGS liberalisation may be relevant for only part of the technology options identified by IPCC.options identified by IPCC.
• Tariff policies only a small part of policy options and unlikely to have a Tariff policies only a small part of policy options and unlikely to have a significant impact if not supporting other (more targeted/efficient) significant impact if not supporting other (more targeted/efficient) policies. policies.
• Difficult to agree on which products to include in definition of EG. Difficult to agree on which products to include in definition of EG. • Only a limited number of products may have a clear environmental Only a limited number of products may have a clear environmental
benefit. benefit. • Most products involve multiple use and “ex-out” issues, with Most products involve multiple use and “ex-out” issues, with
environmental benefit, if any, depending on many factors. environmental benefit, if any, depending on many factors. − In countries where there are no strong RE and EE policies, 6-digit HS codes In countries where there are no strong RE and EE policies, 6-digit HS codes
are not likely to significantly include EG are not likely to significantly include EG
• Liberalising trade in a certain multiple-use products may be useful, Liberalising trade in a certain multiple-use products may be useful, but fast-tracking under paragraph 31(iii) may be difficult to justify.but fast-tracking under paragraph 31(iii) may be difficult to justify.
• Positive outcome of EGS negotiations may be important, politically. Positive outcome of EGS negotiations may be important, politically. • Developing countries need flexibility (e.g. through request and offer) Developing countries need flexibility (e.g. through request and offer)
to harness real possibilities for environmental and developmental to harness real possibilities for environmental and developmental gains.gains.
Lessons learned

26ICTSD/RIS Informal Policy Dialogue, New Delhi, 30-31 March 2010
THANK YOUTHANK YOU

27ICTSD/RIS Informal Policy Dialogue, New Delhi, 30-31 March 2010
TRADE BALANCES (2008)TRADE BALANCES (2008)ICTSD STUDIESICTSD STUDIES
NET EXPORTERSNET EXPORTERS $ $ millionsmillions
NET IMPORTERSNET IMPORTERS $ $ millionsmillions
ChinaChina 2067420674 United StatesUnited States -13762-13762
JapanJapan 2058620586 Hong Kong, ChinaHong Kong, China -11168-11168
EU (excluding intra-EU)EU (excluding intra-EU) 1061710617 Russian FederationRussian Federation -5144-5144
IsraelIsrael 21562156 CanadaCanada -3980-3980
Chinese TaipeiChinese Taipei 905905 United Arab EmiratesUnited Arab Emirates -3778-3778
SwitzerlandSwitzerland 885885 AustraliaAustralia -3001-3001
BrazilBrazil 882882 MexicoMexico -1766-1766
South Africa, RepublicSouth Africa, Republic -1276-1276
IndiaIndia -1150-1150
Developing countriesDeveloping countries -17017-17017Source: COMTRADE
ANNEX

28ICTSD/RIS Informal Policy Dialogue, New Delhi, 30-31 March 2010
TRADE BALANCES (2008)TRADE BALANCES (2008) 43 CLIMATE-FRIENDLY GOODS (WB) 43 CLIMATE-FRIENDLY GOODS (WB)
NET EXPORTERSNET EXPORTERS $ $ millionsmillions
NET IMPORTERSNET IMPORTERS $ $ millionsmillions
JapanJapan 1406214062 United StatesUnited States -5546-5546
EU27 (excl. intra-EU EU27 (excl. intra-EU trade)trade)
87818781 Hong Kong, ChinaHong Kong, China -4827-4827
ChinaChina 49124912 Russian FederationRussian Federation -3365-3365
Chinese TaipeiChinese Taipei 28102810 CanadaCanada -2534-2534
Korea, RepublicKorea, Republic 878878 TurkeyTurkey -2388-2388
MalaysiaMalaysia 798798 United Arab EmiratesUnited Arab Emirates -2329-2329
MexicoMexico 323323 AustraliaAustralia -1956-1956
SingaporeSingapore 181181
BrazilBrazil -1118-1118
South Africa, RepublicSouth Africa, Republic -845-845
IndiaIndia -431-431
Developing countriesDeveloping countries -14281-14281Source: COMTRADE

29ICTSD/RIS Informal Policy Dialogue, New Delhi, 30-31 March 2010
TRADE BALANCES (2008)TRADE BALANCES (2008)ICTSD STUDIES: PREDOMINANTLY SINGLE USEICTSD STUDIES: PREDOMINANTLY SINGLE USE
NET EXPORTERSNET EXPORTERS $ $ millionsmillions
NET IMPORTERSNET IMPORTERS $ $ millionsmillions
ChinaChina 1156911569 United StatesUnited States -4453-4453
JapanJapan 56895689 EU (excluding intra-EU)EU (excluding intra-EU) -4200-4200
Chinese TaipeiChinese Taipei 31673167 Hong KongHong Kong -2160-2160
IndiaIndia 714714 Korea, Rep.Korea, Rep. -1600-1600
BrazilBrazil -306-306
South AfricaSouth Africa -116-116
Developing countriesDeveloping countries 1015110151Source: COMTRADE

30ICTSD/RIS Informal Policy Dialogue, New Delhi, 30-31 March 2010
SELECTED PRODUCTS (12) WITH SELECTED PRODUCTS (12) WITH PREDOMINANTLY ENVIRONMENTAL USEPREDOMINANTLY ENVIRONMENTAL USE
Exports in 2008 (3 principal Exports in 2008 (3 principal products)products)
Imports in 2008 (3 principal Imports in 2008 (3 principal products) products)
HSHS ProductProduct $millio$millionn
HSHS ProductProduct $million$million
BrazilBrazil 117117 BrazilBrazil 424424841090841090 Hydraulic turbines, partsHydraulic turbines, parts 7272 853931853931 Fluorescent, hot cathode Fluorescent, hot cathode
lampslamps136136
853931853931 Fluorescent, hot cathode Fluorescent, hot cathode lampslamps
1515 850231850231 Wind turbinesWind turbines 122122
850231850231 Wind turbinesWind turbines 1414 854140854140 Solar PV cells and panelsSolar PV cells and panels 115115
ChinaChina 1608616086 ChinaChina 45174517854140854140 Solar PV cells and panelsSolar PV cells and panels 1174511745 854140854140 Solar PV cells and panelsSolar PV cells and panels 37443744
853931853931 Fluorescent, hot cathode Fluorescent, hot cathode lampslamps
47344734 841861841861 Heat pumpsHeat pumps 339339
850231850231 Wind turbinesWind turbines 211211 850231850231 Wind turbinesWind turbines 189189
IndiaIndia 12441244 IndiaIndia 530530850231850231 Wind turbinesWind turbines 651651 854140854140 Solar PV cells and panelsSolar PV cells and panels 422422
854140854140 Solar PV cells and panelsSolar PV cells and panels 529529 853931853931 Fluorescent, hot cathode Fluorescent, hot cathode lampslamps
3333
853931853931 Fluorescent, hot cathode Fluorescent, hot cathode lampslamps
2929 841090841090 Hydraulic turbines, partsHydraulic turbines, parts 1919
South AfricaSouth Africa 187187 South AfricaSouth Africa 304304854140854140 Solar PV cells and panelsSolar PV cells and panels 175175 854140854140 Solar PV cells and panelsSolar PV cells and panels 161161
841861841861 Heat pumpsHeat pumps 44 853931853931 Fluorescent, hot cathode Fluorescent, hot cathode lampslamps
5757
680610680610 Slag wool Slag wool 33 841861841861 Heat pumpsHeat pumps 3838
Source: COMTRADE