Embed Size (px)
Citation preview
Tracking Vital Signs During SleepLeveraging Off-the-shelf WiFi
Jian Liu†, Yan Wang†, Yingying Chen†, Jie Yang∗, Xu Chen†, Jerry Cheng§
†Stevens Institute of Technology, Hoboken, NJ 07030, USA∗Florida State University, Tallahassee, FL 32306, USA§Rutgers University, North Brunswick, NJ 08902, USA
†{jliu28, ywang48, yingying.chen}@stevens.edu, ∗[email protected], †[email protected],§[email protected]
ABSTRACTTracking human vital signs of breathing and heart rates
during sleep is important as it can help to assess the gen-eral physical health of a person and provide useful clues fordiagnosing possible diseases. Traditional approaches (e.g.,Polysomnography (PSG)) are limited to clinic usage. Recen-t radio frequency (RF) based approaches require specializeddevices or dedicated wireless sensors and are only able totrack breathing rate. In this work, we propose to track thevital signs of both breathing rate and heart rate during sleepby using off-the-shelf WiFi without any wearable or dedi-cated devices. Our system re-uses existing WiFi networkand exploits the fine-grained channel information to cap-ture the minute movements caused by breathing and heartbeats. Our system thus has the potential to be widely de-ployed and perform continuous long-term monitoring. Thedeveloped algorithm makes use of the channel informationin both time and frequency domain to estimate breathingand heart rates, and it works well when either individual ortwo persons are in bed. Our extensive experiments demon-strate that our system can accurately capture vital signsduring sleep under realistic settings, and achieve compara-ble or even better performance comparing to traditional andexisting approaches, which is a strong indication of providingnon-invasive, continuous fine-grained vital signs monitoringwithout any additional cost.
Categories and Subject Descriptors
H.4 [Information Systems Applications]: Miscella-neous
Keywords
Vital Signs; Channel State Information (CSI); WiFi; SleepMonitoring
1. INTRODUCTIONVital signs, such as breathing rate and heart rate, indicate
the state of a person’s essential body functions. They are theessential components to assess the general physical health ofa person and identify various disease problems. Correlating
Permission to make digital or hard copies of all or part of this work for personal or
classroom use is granted without fee provided that copies are not made or distributed
for profit or commercial advantage and that copies bear this notice and the full cita-
tion on the first page. Copyrights for components of this work owned by others than
ACM must be honored. Abstracting with credit is permitted. To copy otherwise, or re-
publish, to post on servers or to redistribute to lists, requires prior specific permission
and/or a fee. Request permissions from [email protected].
MobiHoc’15, June 22–25, 2015, Hangzhou, China.
Copyright c© 2015 ACM 978-1-4503-3489-1/15/06 ...$15.00.
http://dx.doi.org/10.1145/2746285.2746303.
the vital signs with our sleep quality can further enable sleepapnea diagnosis and treatment [1], treatment for asthma [2]and sleep stage detection [3]. However, the traditional wayto monitor vital signs during sleep requires a patient to per-form hospital visits and wear dedicated sensors [4], whichare intrusive and costly. The obtained results may be bi-ased because of the unfamiliar sleeping environments in thehospital. Moreover, it is difficult, if not possible, to run long-term sleep monitoring in clinical settings. Thus, a solutionthat can provide non-invasive, low-cost and long-term vitalsigns monitoring without requiring hospital visits is highlydesirable.
Recently, Radio Frequency (RF) based monitoring solu-tions [5, 6, 7, 8] have drawn considerable attention as theyprovide non-invasive breathing rate monitoring. For exam-ple, F. Adib et al. utilize Universal Software Radio Periph-eral (USRP) and Frequency Modulated Continuous Wave(FMCW) radar to monitor a person’s breathing rate by de-tecting the chest fluctuations caused by breathing [7, 8].Doppler radar [5] and ultra-band radar [6] are utilized tocatch a person’s breathing respectively. These systems in-volve specialized devices with high complexity, which pre-vent them from large-scale and long-term deployment. Fur-thermore, N. Patwari et al. [9, 10] use coarse-grained channelinformation (i.e., received signal strength (RSS)) extractedfrom wireless sensor nodes to detect breathing rate. Theirapproach requires additional wireless network infrastructure(i.e., dedicated sensor nodes), and the coarse-grained chan-nel information is not able to capture the vital signs of heartrate. Another new direction is using wearable sensors (suchas Fitbit [11] and Jawbone [12]) to track people’s fitness atany time. But they only have the capability of perform-ing coarse-grained sleep monitoring without capturing thebreathing rate, which is critical to many sleep problem diag-nosis including sleep apnea. Additionally, users are requiredto wear these fitness sensors even during their sleep, whichcould be a challenge for elder people.
To address these issues, our work aims to perform continu-ous long-term vital signs monitoring with low cost and with-out the requirement of wearing any sensor. We show that itis possible to track breathing rate and heart rate during sleepby using off-the-shelf WiFi. This will largely increase theopportunity for wide deployment and in-home use. Indeed,our system re-uses existing WiFi network for tracking vitalsigns without dedicated/wearable sensors or additional wire-less infrastructure. Furthermore, by exploiting fine-grainedchannel information, Channel State Information (CSI), pro-vided by off-the-shelf WiFi device, our system captures not
267
only the breathing rate but also heart rate. Specifically, oursystem utilizes the readily available channel information todetect the minute movements caused by breathing and heartbeats (i.e., inhaling, exhaling, diastole and systole).Using channel state information has significant implication
on how fine-grained minute movements can be captured forvital signs monitoring. Comparing to the traditional RSS,which only provides a single measurement of the power overthe whole channel bandwidth, the fine-grained CSI providesboth amplitude and phase information for multiple OFD-M subcarriers. For instance, the mainstream WiFi systemssuch as 802.11 a/g/n are based on OFDM where the rela-tively wideband 20MHz channel is partitioned into 52 sub-carriers. Due to the frequency diversity of these narrowbandsubcarriers, the multipath effect and shadow fading at dif-ferent subcarriers may result in significant difference in theobserved amplitudes. This means that a small movementin physical environment may lead to the change of CSI atsome subcarriers, whereas such change maybe smoothed outif we examine the signal strength over the whole channelbandwidth. Our system thus takes advantage of the fine-grained CSI provided by off-the-shelf WiFi device to capturethe minute movements for vital signs monitoring.Our system uses only a single pair of WiFi device and wire-
less AP for detecting the breathing rate and heart rate dur-ing sleep. The breathing rate detection algorithm first ob-tains time series of CSI from off-the-shelf WiFi device (e.g.,desktop, laptop, tablet, and smartphone) and then analyzesthe information in time domain and frequency domain. Itachieves high accuracy for both single and two-person in bedscenarios. To detect heart rate, our algorithm first appliesa bandpass filter to eliminate irrelevant frequency compo-nents, and then estimates the heart rate in the frequencydomain by locating the frequency peak in the normal heartrate range. Extensive experiments are conducted in lab en-vironment and two apartments with difference sizes. The re-sults show that our system provides accurate breathing rateand heart rate estimation not only under typical settings butalso covering challenging scenarios including long distancebetween the WiFi device and AP, none-line-of-sight (NLOS)situation and different sleep postures. This demonstratesthat our approach can provide device-free, continuous fine-grained vital signs monitoring without any additional cost.It has the capability to support large-scale deployment andlong-term vital signs monitoring in non-clinical settings.The main contributions of our work are summarized as
follows:
• We show that the existing WiFi network can be re-usedto capture vital signs of breathing rate and heart ratethrough using only one AP and a single WiFi device.Such an approach can also be extended to non-sleepscenarios when the user is stationary.
• Our proposed system extracts fine-grained channel s-tate information (CSI) from off-the-shelf WiFi deviceto detect the minute movements and provide accuratebreathing and heart rates estimation concurrently.
• We develop algorithms that have the capability to trackbreathing rates of a single person as well as two-personin bed cases, which cover typical in-home scenarios.
• Extensive experiments in both lab and two apartmentsover a three-month period show that our system canachieve comparable or even better performance as com-pared to existing dedicated sensor based approaches.
2. RELATED WORKBreathing rate, heart rate and statistics of sleep events are
important indicators for evaluating one’s sleep quality, stresslevel and various health conditions. In general, the methodsused to track such information during sleep can be catego-rized into four groups: dedicated sensor based, smartphoneand wearable sensor based, touch-free sensor based and RFsignal based.
Traditional approaches use dedicated sensors to measurevital signs during sleep. For example, Polysomnography(PSG) [4] measures body functions including breathing rate,eye movements (EOG), heart rhythm (ECG) and muscle ac-tivity by attaching multiple sensors to a patient. Such sys-tems incur high cost and are usually limited to clinical usage.Recent advances of smartphones and wearable sensors haveenabled in-home sleep monitoring by utilizing the built-in ac-celerometer and microphone [13, 14, 11, 12]. These methodsmainly provide coarse-grained monitoring including the de-tection of body movements, snoring, or regular sleep events,and are not able to monitor breathing rate, which is a criti-cal indication of sleep irregularity such as sleep apnea. Theyalso require users to place smartphones close-by and wearsensors during sleep. Touch-free sensor based solutions ei-ther use the sensors attached to the mattress [15] or installa camera to capture the chest movement for breathing rateestimation [16]. These systems however require professionalinstallations and cannot estimate heart rate.
Most related to our work is the RF signal based mon-itoring mechanisms, such as the use of Doppler radar [5],ultra-wideband [6], Frequency Modulated Continuous Wave(FMCW) radar [8, 7] or Received Signal Strength (RSS) [9,10] for monitoring the vital signs of breathing rate. In par-ticular, these mechanisms [5, 6, 7, 8] rely on specialized hard-ware including Universal Software Radio Peripheral (USRP),FMCW radar and Doppler radar. These systems incur highcost and high complexity, making them impractical for largescale deployment. N. Patwari et al. [9, 10] use received sig-nal strength (RSS) measurements (e.g., using 16 frequencychannels in IEEE 802.15.4) extracted from wireless sensor n-odes to detect the breathing rate. Their approaches requireadditional wireless network infrastructure and high-densityplacement of sensor nodes. And the coarse-grained channelinformation of RSS is not able to capture the heart rate.
Different from the previous work, our system re-uses ex-isting WiFi network for tracking vital signs of breathing andheart rates concurrently without dedicated/wearable sensorsor additional wireless infrastructure. By exploiting fine-grained channel state information provided by off-the-shelfWiFi devices, our system captures both the breathing rateas well as heart rate. Our system thus performs device-free,continuous fine-grained vital signs monitoring without anyadditional cost. It has the potential to be widely deployedin home and many other non-clinical environments.
3. SYSTEM DESIGNIn this section, we discuss the preliminaries, design chal-
lenges and overview of our system design.
3.1 PreliminariesWhile proliferating WiFi networks are usually used for
wireless Internet access and connecting local area networks,such as an in-home WiFi network involving both mobile andstationary devices (e.g., laptop, smartphone, tablet, desktop,smartTV), they have great potential to sense the environ-ment changes and capture the minute movements caused by
268
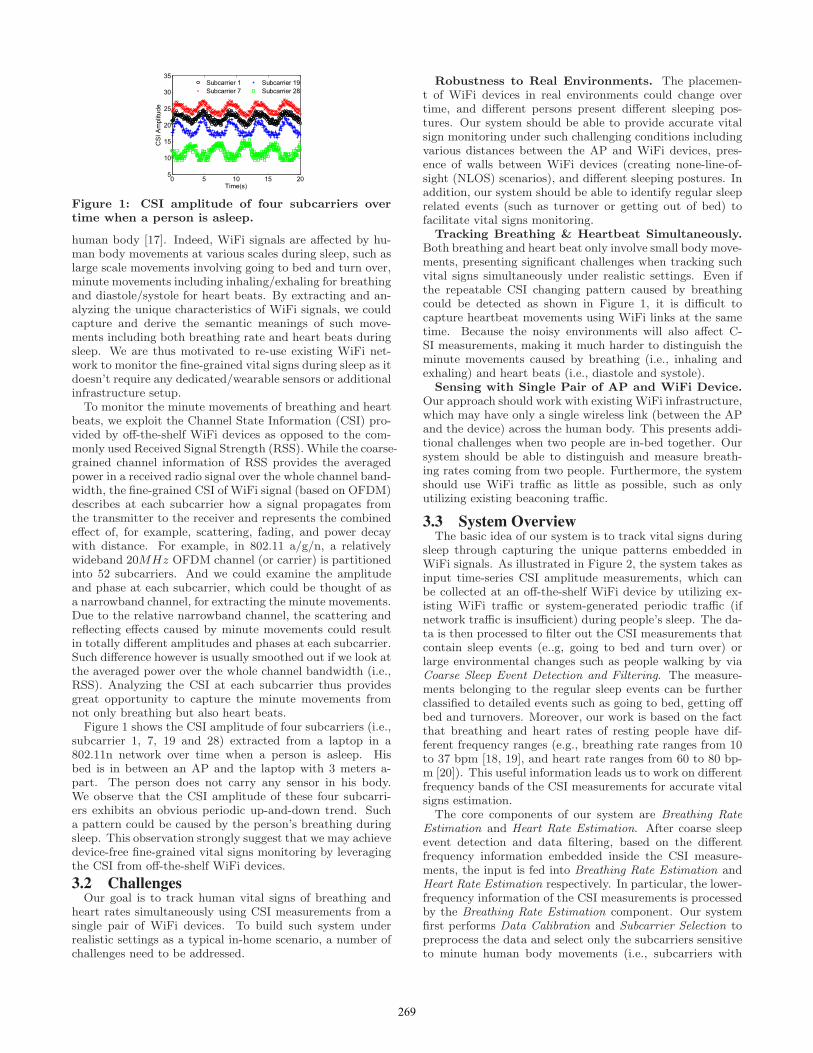
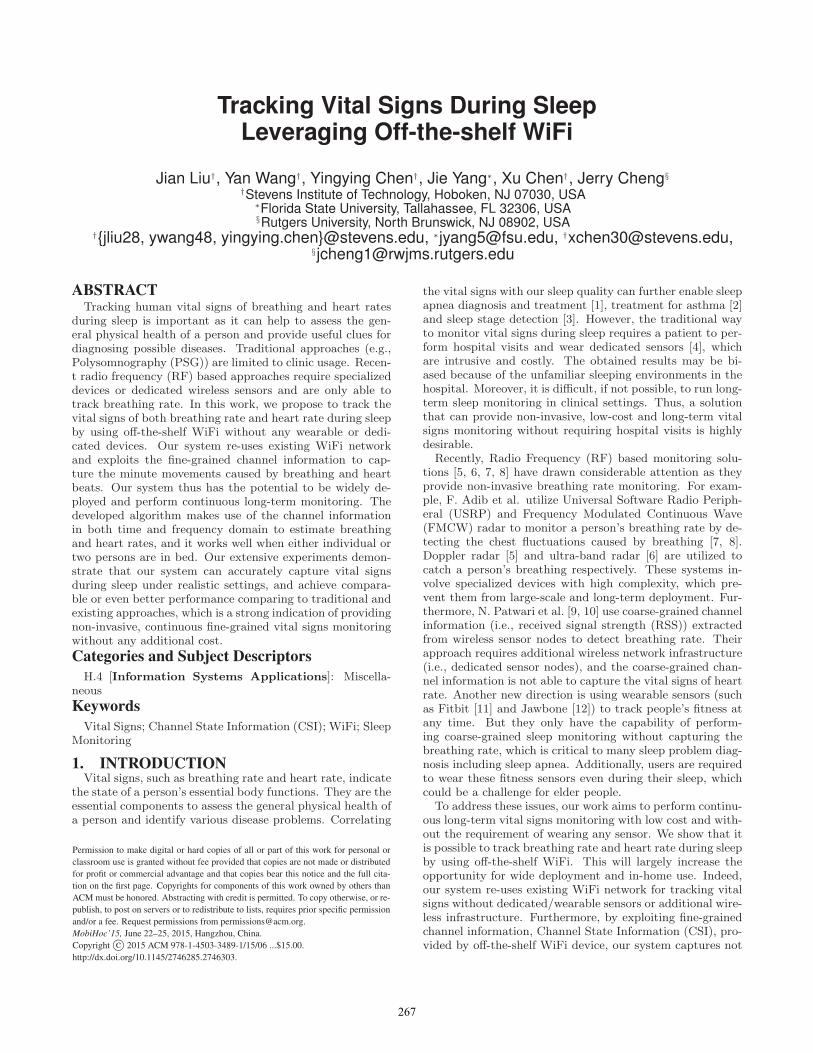
Figure 1: CSI amplitude of four subcarriers overtime when a person is asleep.
human body [17]. Indeed, WiFi signals are affected by hu-man body movements at various scales during sleep, such aslarge scale movements involving going to bed and turn over,minute movements including inhaling/exhaling for breathingand diastole/systole for heart beats. By extracting and an-alyzing the unique characteristics of WiFi signals, we couldcapture and derive the semantic meanings of such move-ments including both breathing rate and heart beats duringsleep. We are thus motivated to re-use existing WiFi net-work to monitor the fine-grained vital signs during sleep as itdoesn’t require any dedicated/wearable sensors or additionalinfrastructure setup.To monitor the minute movements of breathing and heart
beats, we exploit the Channel State Information (CSI) pro-vided by off-the-shelf WiFi devices as opposed to the com-monly used Received Signal Strength (RSS). While the coarse-grained channel information of RSS provides the averagedpower in a received radio signal over the whole channel band-width, the fine-grained CSI of WiFi signal (based on OFDM)describes at each subcarrier how a signal propagates fromthe transmitter to the receiver and represents the combinedeffect of, for example, scattering, fading, and power decaywith distance. For example, in 802.11 a/g/n, a relativelywideband 20MHz OFDM channel (or carrier) is partitionedinto 52 subcarriers. And we could examine the amplitudeand phase at each subcarrier, which could be thought of asa narrowband channel, for extracting the minute movements.Due to the relative narrowband channel, the scattering andreflecting effects caused by minute movements could resultin totally different amplitudes and phases at each subcarrier.Such difference however is usually smoothed out if we look atthe averaged power over the whole channel bandwidth (i.e.,RSS). Analyzing the CSI at each subcarrier thus providesgreat opportunity to capture the minute movements fromnot only breathing but also heart beats.Figure 1 shows the CSI amplitude of four subcarriers (i.e.,
subcarrier 1, 7, 19 and 28) extracted from a laptop in a802.11n network over time when a person is asleep. Hisbed is in between an AP and the laptop with 3 meters a-part. The person does not carry any sensor in his body.We observe that the CSI amplitude of these four subcarri-ers exhibits an obvious periodic up-and-down trend. Sucha pattern could be caused by the person’s breathing duringsleep. This observation strongly suggest that we may achievedevice-free fine-grained vital signs monitoring by leveragingthe CSI from off-the-shelf WiFi devices.
3.2 ChallengesOur goal is to track human vital signs of breathing and
heart rates simultaneously using CSI measurements from asingle pair of WiFi devices. To build such system underrealistic settings as a typical in-home scenario, a number ofchallenges need to be addressed.
Robustness to Real Environments. The placemen-t of WiFi devices in real environments could change overtime, and different persons present different sleeping pos-tures. Our system should be able to provide accurate vitalsign monitoring under such challenging conditions includingvarious distances between the AP and WiFi devices, pres-ence of walls between WiFi devices (creating none-line-of-sight (NLOS) scenarios), and different sleeping postures. Inaddition, our system should be able to identify regular sleeprelated events (such as turnover or getting out of bed) tofacilitate vital signs monitoring.
Tracking Breathing & Heartbeat Simultaneously.Both breathing and heart beat only involve small body move-ments, presenting significant challenges when tracking suchvital signs simultaneously under realistic settings. Even ifthe repeatable CSI changing pattern caused by breathingcould be detected as shown in Figure 1, it is difficult tocapture heartbeat movements using WiFi links at the sametime. Because the noisy environments will also affect C-SI measurements, making it much harder to distinguish theminute movements caused by breathing (i.e., inhaling andexhaling) and heart beats (i.e., diastole and systole).
Sensing with Single Pair of AP and WiFi Device.Our approach should work with existing WiFi infrastructure,which may have only a single wireless link (between the APand the device) across the human body. This presents addi-tional challenges when two people are in-bed together. Oursystem should be able to distinguish and measure breath-ing rates coming from two people. Furthermore, the systemshould use WiFi traffic as little as possible, such as onlyutilizing existing beaconing traffic.
3.3 System OverviewThe basic idea of our system is to track vital signs during
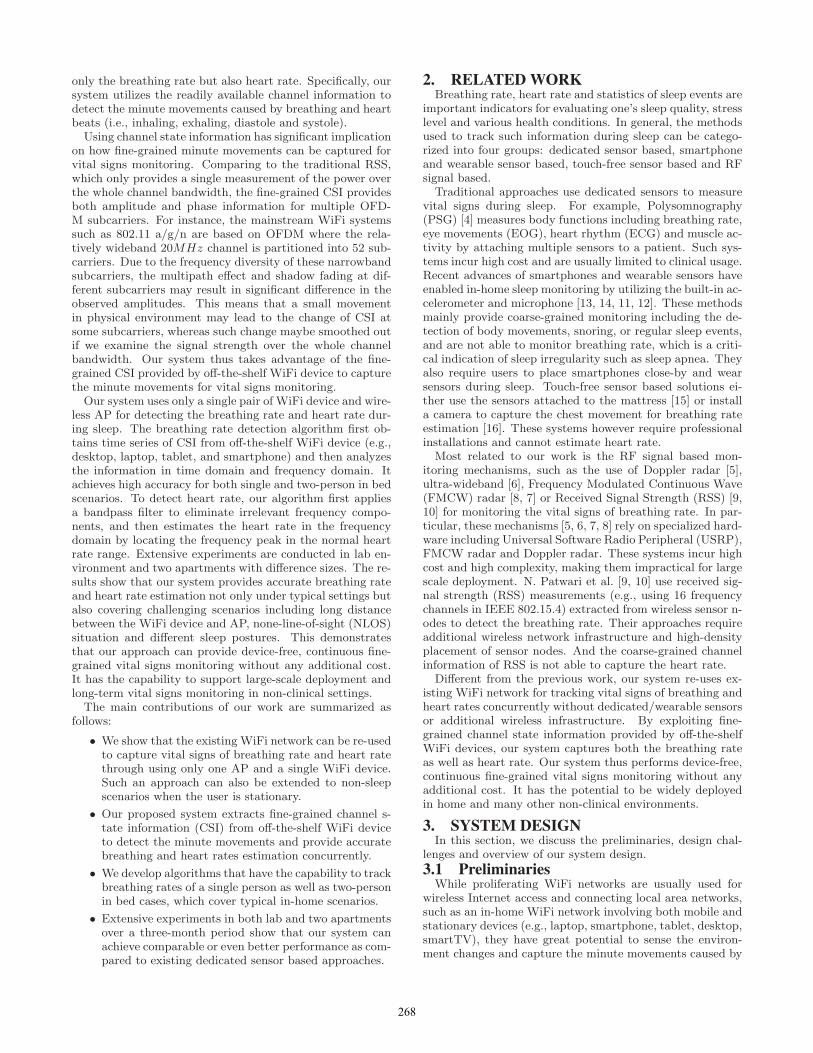
sleep through capturing the unique patterns embedded inWiFi signals. As illustrated in Figure 2, the system takes asinput time-series CSI amplitude measurements, which canbe collected at an off-the-shelf WiFi device by utilizing ex-isting WiFi traffic or system-generated periodic traffic (ifnetwork traffic is insufficient) during people’s sleep. The da-ta is then processed to filter out the CSI measurements thatcontain sleep events (e..g, going to bed and turn over) orlarge environmental changes such as people walking by viaCoarse Sleep Event Detection and Filtering. The measure-ments belonging to the regular sleep events can be furtherclassified to detailed events such as going to bed, getting offbed and turnovers. Moreover, our work is based on the factthat breathing and heart rates of resting people have dif-ferent frequency ranges (e.g., breathing rate ranges from 10to 37 bpm [18, 19], and heart rate ranges from 60 to 80 bp-m [20]). This useful information leads us to work on differentfrequency bands of the CSI measurements for accurate vitalsigns estimation.
The core components of our system are Breathing RateEstimation and Heart Rate Estimation. After coarse sleepevent detection and data filtering, based on the differentfrequency information embedded inside the CSI measure-ments, the input is fed into Breathing Rate Estimation andHeart Rate Estimation respectively. In particular, the lower-frequency information of the CSI measurements is processedby the Breathing Rate Estimation component. Our systemfirst performs Data Calibration and Subcarrier Selection topreprocess the data and select only the subcarriers sensitiveto minute human body movements (i.e., subcarriers with
269
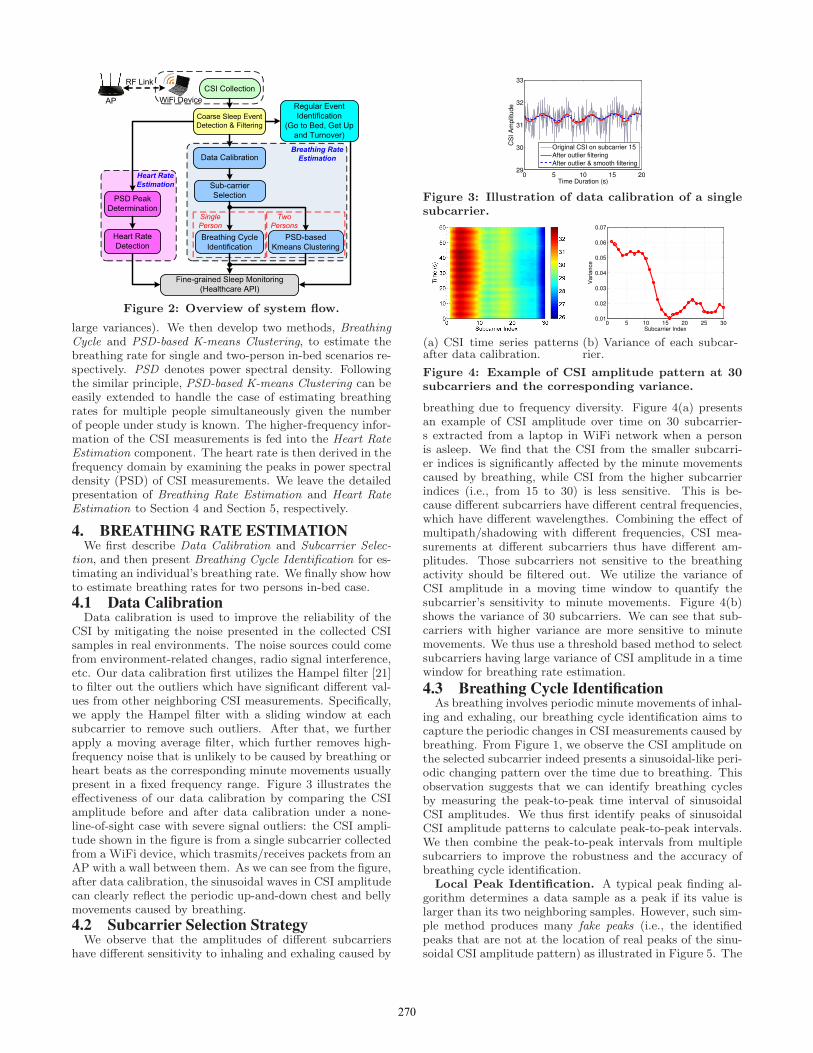
Figure 2: Overview of system flow.
large variances). We then develop two methods, BreathingCycle and PSD-based K-means Clustering, to estimate thebreathing rate for single and two-person in-bed scenarios re-spectively. PSD denotes power spectral density. Followingthe similar principle, PSD-based K-means Clustering can beeasily extended to handle the case of estimating breathingrates for multiple people simultaneously given the numberof people under study is known. The higher-frequency infor-mation of the CSI measurements is fed into the Heart RateEstimation component. The heart rate is then derived in thefrequency domain by examining the peaks in power spectraldensity (PSD) of CSI measurements. We leave the detailedpresentation of Breathing Rate Estimation and Heart RateEstimation to Section 4 and Section 5, respectively.
4. BREATHING RATE ESTIMATIONWe first describe Data Calibration and Subcarrier Selec-
tion, and then present Breathing Cycle Identification for es-timating an individual’s breathing rate. We finally show howto estimate breathing rates for two persons in-bed case.
4.1 Data CalibrationData calibration is used to improve the reliability of the
CSI by mitigating the noise presented in the collected CSIsamples in real environments. The noise sources could comefrom environment-related changes, radio signal interference,etc. Our data calibration first utilizes the Hampel filter [21]to filter out the outliers which have significant different val-ues from other neighboring CSI measurements. Specifically,we apply the Hampel filter with a sliding window at eachsubcarrier to remove such outliers. After that, we furtherapply a moving average filter, which further removes high-frequency noise that is unlikely to be caused by breathing orheart beats as the corresponding minute movements usuallypresent in a fixed frequency range. Figure 3 illustrates theeffectiveness of our data calibration by comparing the CSIamplitude before and after data calibration under a none-line-of-sight case with severe signal outliers: the CSI ampli-tude shown in the figure is from a single subcarrier collectedfrom a WiFi device, which trasmits/receives packets from anAP with a wall between them. As we can see from the figure,after data calibration, the sinusoidal waves in CSI amplitudecan clearly reflect the periodic up-and-down chest and bellymovements caused by breathing.
4.2 Subcarrier Selection StrategyWe observe that the amplitudes of different subcarriers
have different sensitivity to inhaling and exhaling caused by
0 5 10 15 2029
30
31
32
33
Time Duration (s)
CS
I A
mp
litu
de
Original CSI on subcarrier 15
After outlier filtering
After outlier & smooth filtering
Figure 3: Illustration of data calibration of a singlesubcarrier.
(a) CSI time series patternsafter data calibration.
0 5 10 15 20 25 300.01
0.02
0.03
0.04
0.05
0.06
0.07
Subcarrier Index
Va
ria
nce
(b) Variance of each subcar-rier.
Figure 4: Example of CSI amplitude pattern at 30subcarriers and the corresponding variance.
breathing due to frequency diversity. Figure 4(a) presentsan example of CSI amplitude over time on 30 subcarrier-s extracted from a laptop in WiFi network when a personis asleep. We find that the CSI from the smaller subcarri-er indices is significantly affected by the minute movementscaused by breathing, while CSI from the higher subcarrierindices (i.e., from 15 to 30) is less sensitive. This is be-cause different subcarriers have different central frequencies,which have different wavelengthes. Combining the effect ofmultipath/shadowing with different frequencies, CSI mea-surements at different subcarriers thus have different am-plitudes. Those subcarriers not sensitive to the breathingactivity should be filtered out. We utilize the variance ofCSI amplitude in a moving time window to quantify thesubcarrier’s sensitivity to minute movements. Figure 4(b)shows the variance of 30 subcarriers. We can see that sub-carriers with higher variance are more sensitive to minutemovements. We thus use a threshold based method to selectsubcarriers having large variance of CSI amplitude in a timewindow for breathing rate estimation.
4.3 Breathing Cycle IdentificationAs breathing involves periodic minute movements of inhal-
ing and exhaling, our breathing cycle identification aims tocapture the periodic changes in CSI measurements caused bybreathing. From Figure 1, we observe the CSI amplitude onthe selected subcarrier indeed presents a sinusoidal-like peri-odic changing pattern over the time due to breathing. Thisobservation suggests that we can identify breathing cyclesby measuring the peak-to-peak time interval of sinusoidalCSI amplitudes. We thus first identify peaks of sinusoidalCSI amplitude patterns to calculate peak-to-peak intervals.We then combine the peak-to-peak intervals from multiplesubcarriers to improve the robustness and the accuracy ofbreathing cycle identification.
Local Peak Identification. A typical peak finding al-gorithm determines a data sample as a peak if its value islarger than its two neighboring samples. However, such sim-ple method produces many fake peaks (i.e., the identifiedpeaks that are not at the location of real peaks of the sinu-soidal CSI amplitude pattern) as illustrated in Figure 5. The
270
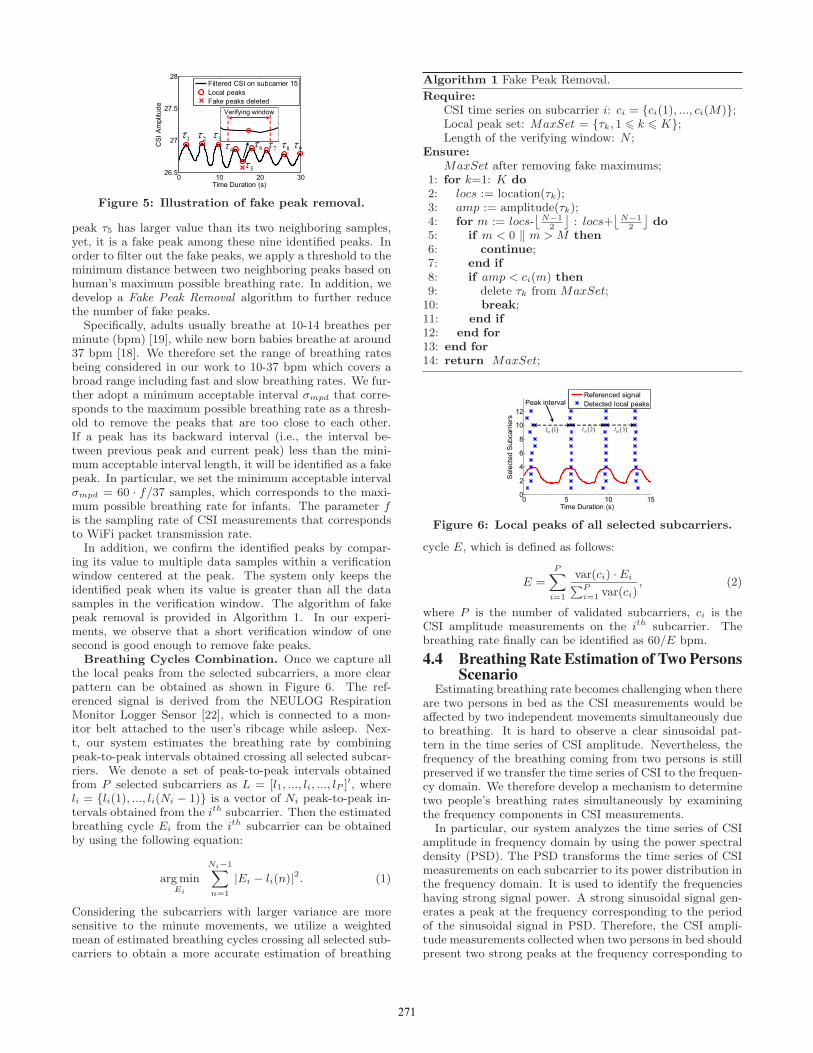
Figure 5: Illustration of fake peak removal.
peak τ5 has larger value than its two neighboring samples,yet, it is a fake peak among these nine identified peaks. Inorder to filter out the fake peaks, we apply a threshold to theminimum distance between two neighboring peaks based onhuman’s maximum possible breathing rate. In addition, wedevelop a Fake Peak Removal algorithm to further reducethe number of fake peaks.Specifically, adults usually breathe at 10-14 breathes per
minute (bpm) [19], while new born babies breathe at around37 bpm [18]. We therefore set the range of breathing ratesbeing considered in our work to 10-37 bpm which covers abroad range including fast and slow breathing rates. We fur-ther adopt a minimum acceptable interval σmpd that corre-sponds to the maximum possible breathing rate as a thresh-old to remove the peaks that are too close to each other.If a peak has its backward interval (i.e., the interval be-tween previous peak and current peak) less than the mini-mum acceptable interval length, it will be identified as a fakepeak. In particular, we set the minimum acceptable intervalσmpd = 60 · f/37 samples, which corresponds to the maxi-mum possible breathing rate for infants. The parameter fis the sampling rate of CSI measurements that correspondsto WiFi packet transmission rate.In addition, we confirm the identified peaks by compar-
ing its value to multiple data samples within a verificationwindow centered at the peak. The system only keeps theidentified peak when its value is greater than all the datasamples in the verification window. The algorithm of fakepeak removal is provided in Algorithm 1. In our experi-ments, we observe that a short verification window of onesecond is good enough to remove fake peaks.Breathing Cycles Combination. Once we capture all
the local peaks from the selected subcarriers, a more clearpattern can be obtained as shown in Figure 6. The ref-erenced signal is derived from the NEULOG RespirationMonitor Logger Sensor [22], which is connected to a mon-itor belt attached to the user’s ribcage while asleep. Nex-t, our system estimates the breathing rate by combiningpeak-to-peak intervals obtained crossing all selected subcar-riers. We denote a set of peak-to-peak intervals obtainedfrom P selected subcarriers as L = [l1, ..., li, ..., lP ]
′, whereli = {li(1), ..., li(Ni − 1)} is a vector of Ni peak-to-peak in-tervals obtained from the ith subcarrier. Then the estimatedbreathing cycle Ei from the ith subcarrier can be obtainedby using the following equation:
argminEi
Ni−1∑
n=1
|Ei − li(n)|2. (1)
Considering the subcarriers with larger variance are moresensitive to the minute movements, we utilize a weightedmean of estimated breathing cycles crossing all selected sub-carriers to obtain a more accurate estimation of breathing
Algorithm 1 Fake Peak Removal.
Require:CSI time series on subcarrier i: ci = {ci(1), ..., ci(M)};Local peak set: MaxSet = {τk, 1 6 k 6 K};Length of the verifying window: N ;
Ensure:MaxSet after removing fake maximums;
1: for k=1: K do2: locs := location(τk);3: amp := amplitude(τk);4: for m := locs-
⌊
N−1
2
⌋
: locs+⌊
N−1
2
⌋
do5: if m < 0 ‖ m > M then6: continue;7: end if8: if amp < ci(m) then9: delete τk from MaxSet;10: break;11: end if12: end for13: end for14: return MaxSet;
Figure 6: Local peaks of all selected subcarriers.
cycle E, which is defined as follows:
E =P∑
i=1
var(ci) · Ei∑P
i=1var(ci)
, (2)
where P is the number of validated subcarriers, ci is theCSI amplitude measurements on the ith subcarrier. Thebreathing rate finally can be identified as 60/E bpm.
4.4 Breathing Rate Estimation of Two PersonsScenario
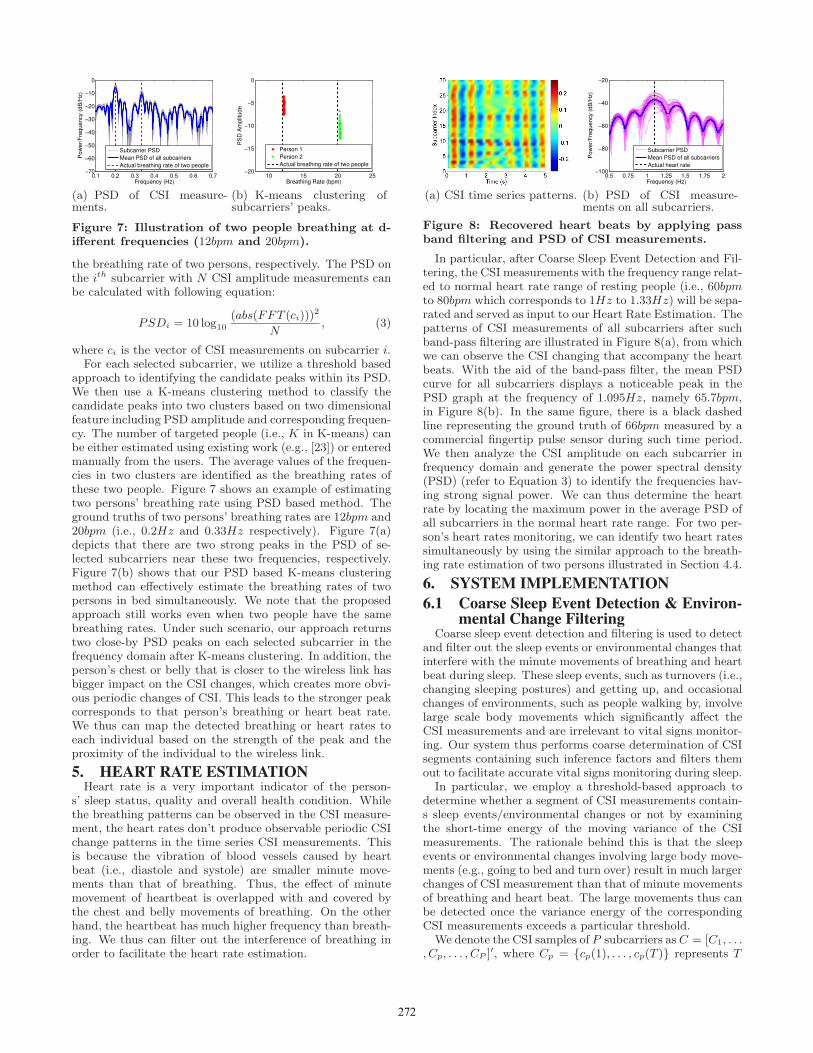
Estimating breathing rate becomes challenging when thereare two persons in bed as the CSI measurements would beaffected by two independent movements simultaneously dueto breathing. It is hard to observe a clear sinusoidal pat-tern in the time series of CSI amplitude. Nevertheless, thefrequency of the breathing coming from two persons is stillpreserved if we transfer the time series of CSI to the frequen-cy domain. We therefore develop a mechanism to determinetwo people’s breathing rates simultaneously by examiningthe frequency components in CSI measurements.
In particular, our system analyzes the time series of CSIamplitude in frequency domain by using the power spectraldensity (PSD). The PSD transforms the time series of CSImeasurements on each subcarrier to its power distribution inthe frequency domain. It is used to identify the frequencieshaving strong signal power. A strong sinusoidal signal gen-erates a peak at the frequency corresponding to the periodof the sinusoidal signal in PSD. Therefore, the CSI ampli-tude measurements collected when two persons in bed shouldpresent two strong peaks at the frequency corresponding to
271
0.1 0.2 0.3 0.4 0.5 0.6 0.7−70
−60
−50
−40
−30
−20
−10
0
Frequency (Hz)
Po
we
r/F
req
ue
ncy (
dB
/Hz)
Subcarrier PSD
Mean PSD of all subcarriers
Actual breathing rate of two people
(a) PSD of CSI measure-ments.
10 15 20 25−20
−15
−10
−5
0
Breathing Rate (bpm)
PS
D A
mp
litu
de
Person 1
Person 2
Actual breathing rate of two people
(b) K-means clustering ofsubcarriers’ peaks.
Figure 7: Illustration of two people breathing at d-ifferent frequencies (12bpm and 20bpm).
the breathing rate of two persons, respectively. The PSD onthe ith subcarrier with N CSI amplitude measurements canbe calculated with following equation:
PSDi = 10 log10
(abs(FFT (ci)))2
N, (3)
where ci is the vector of CSI measurements on subcarrier i.For each selected subcarrier, we utilize a threshold based
approach to identifying the candidate peaks within its PSD.We then use a K-means clustering method to classify thecandidate peaks into two clusters based on two dimensionalfeature including PSD amplitude and corresponding frequen-cy. The number of targeted people (i.e., K in K-means) canbe either estimated using existing work (e.g., [23]) or enteredmanually from the users. The average values of the frequen-cies in two clusters are identified as the breathing rates ofthese two people. Figure 7 shows an example of estimatingtwo persons’ breathing rate using PSD based method. Theground truths of two persons’ breathing rates are 12bpm and20bpm (i.e., 0.2Hz and 0.33Hz respectively). Figure 7(a)depicts that there are two strong peaks in the PSD of se-lected subcarriers near these two frequencies, respectively.Figure 7(b) shows that our PSD based K-means clusteringmethod can effectively estimate the breathing rates of twopersons in bed simultaneously. We note that the proposedapproach still works even when two people have the samebreathing rates. Under such scenario, our approach returnstwo close-by PSD peaks on each selected subcarrier in thefrequency domain after K-means clustering. In addition, theperson’s chest or belly that is closer to the wireless link hasbigger impact on the CSI changes, which creates more obvi-ous periodic changes of CSI. This leads to the stronger peakcorresponds to that person’s breathing or heart beat rate.We thus can map the detected breathing or heart rates toeach individual based on the strength of the peak and theproximity of the individual to the wireless link.
5. HEART RATE ESTIMATIONHeart rate is a very important indicator of the person-
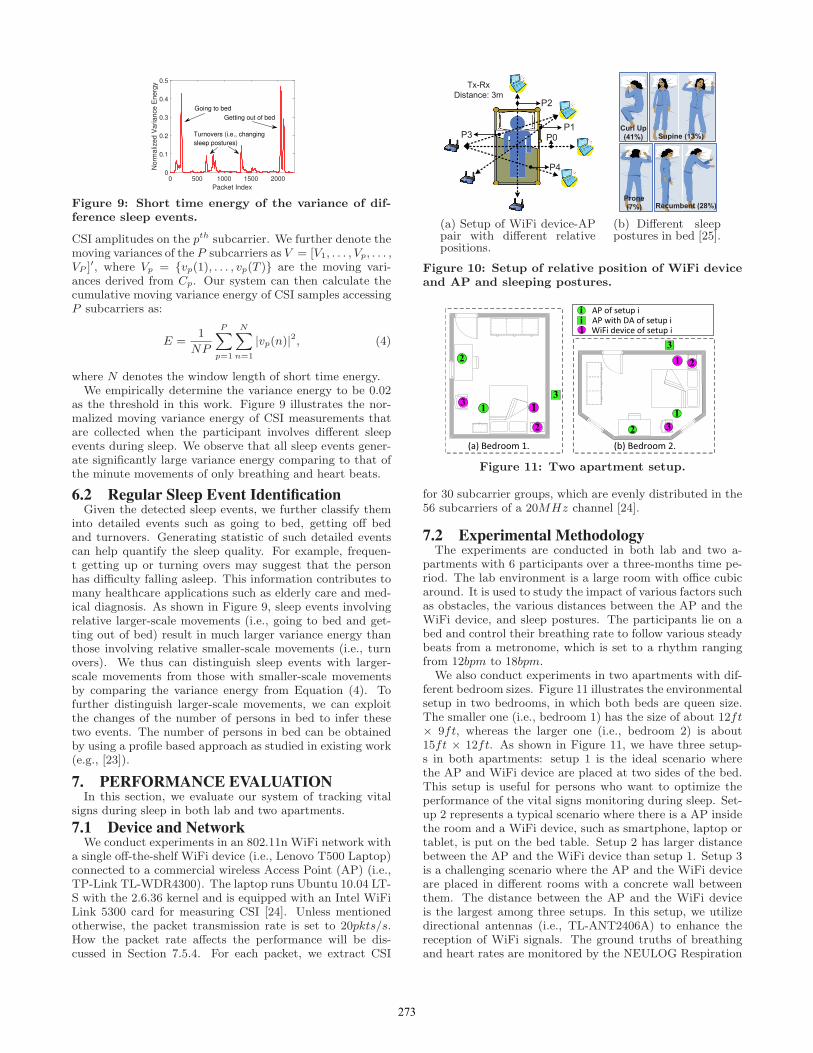
s’ sleep status, quality and overall health condition. Whilethe breathing patterns can be observed in the CSI measure-ment, the heart rates don’t produce observable periodic CSIchange patterns in the time series CSI measurements. Thisis because the vibration of blood vessels caused by heartbeat (i.e., diastole and systole) are smaller minute move-ments than that of breathing. Thus, the effect of minutemovement of heartbeat is overlapped with and covered bythe chest and belly movements of breathing. On the otherhand, the heartbeat has much higher frequency than breath-ing. We thus can filter out the interference of breathing inorder to facilitate the heart rate estimation.
(a) CSI time series patterns.
0.5 0.75 1 1.25 1.5 1.75 2−100
−80
−60
−40
−20
Frequency (Hz)
Po
we
r/F
req
ue
ncy (
dB
/Hz)
Subcarrier PSD
Mean PSD of all subcarriers
Actual heart rate
(b) PSD of CSI measure-ments on all subcarriers.
Figure 8: Recovered heart beats by applying passband filtering and PSD of CSI measurements.
In particular, after Coarse Sleep Event Detection and Fil-tering, the CSI measurements with the frequency range relat-ed to normal heart rate range of resting people (i.e., 60bpmto 80bpm which corresponds to 1Hz to 1.33Hz) will be sepa-rated and served as input to our Heart Rate Estimation. Thepatterns of CSI measurements of all subcarriers after suchband-pass filtering are illustrated in Figure 8(a), from whichwe can observe the CSI changing that accompany the heartbeats. With the aid of the band-pass filter, the mean PSDcurve for all subcarriers displays a noticeable peak in thePSD graph at the frequency of 1.095Hz, namely 65.7bpm,in Figure 8(b). In the same figure, there is a black dashedline representing the ground truth of 66bpm measured by acommercial fingertip pulse sensor during such time period.We then analyze the CSI amplitude on each subcarrier infrequency domain and generate the power spectral density(PSD) (refer to Equation 3) to identify the frequencies hav-ing strong signal power. We can thus determine the heartrate by locating the maximum power in the average PSD ofall subcarriers in the normal heart rate range. For two per-son’s heart rates monitoring, we can identify two heart ratessimultaneously by using the similar approach to the breath-ing rate estimation of two persons illustrated in Section 4.4.
6. SYSTEM IMPLEMENTATION
6.1 Coarse Sleep Event Detection & Environ-mental Change Filtering
Coarse sleep event detection and filtering is used to detectand filter out the sleep events or environmental changes thatinterfere with the minute movements of breathing and heartbeat during sleep. These sleep events, such as turnovers (i.e.,changing sleeping postures) and getting up, and occasionalchanges of environments, such as people walking by, involvelarge scale body movements which significantly affect theCSI measurements and are irrelevant to vital signs monitor-ing. Our system thus performs coarse determination of CSIsegments containing such inference factors and filters themout to facilitate accurate vital signs monitoring during sleep.
In particular, we employ a threshold-based approach todetermine whether a segment of CSI measurements contain-s sleep events/environmental changes or not by examiningthe short-time energy of the moving variance of the CSImeasurements. The rationale behind this is that the sleepevents or environmental changes involving large body move-ments (e.g., going to bed and turn over) result in much largerchanges of CSI measurement than that of minute movementsof breathing and heart beat. The large movements thus canbe detected once the variance energy of the correspondingCSI measurements exceeds a particular threshold.
We denote the CSI samples of P subcarriers as C = [C1, . . ., Cp, . . . , CP ]
′, where Cp = {cp(1), . . . , cp(T )} represents T
272
Packet Index
0 500 1000 1500 2000
Norm
aliz
ed V
ariance E
nerg
y
0
0.1
0.2
0.3
0.4
0.5
Going to bed
Getting out of bed
Turnovers (i.e., changing
sleep postures)
Figure 9: Short time energy of the variance of dif-ference sleep events.
CSI amplitudes on the pth subcarrier. We further denote themoving variances of the P subcarriers as V = [V1, . . . , Vp, . . . ,VP ]
′, where Vp = {vp(1), . . . , vp(T )} are the moving vari-ances derived from Cp. Our system can then calculate thecumulative moving variance energy of CSI samples accessingP subcarriers as:
E =1
NP
P∑
p=1
N∑
n=1
|vp(n)|2, (4)
where N denotes the window length of short time energy.We empirically determine the variance energy to be 0.02
as the threshold in this work. Figure 9 illustrates the nor-malized moving variance energy of CSI measurements thatare collected when the participant involves different sleepevents during sleep. We observe that all sleep events gener-ate significantly large variance energy comparing to that ofthe minute movements of only breathing and heart beats.
6.2 Regular Sleep Event IdentificationGiven the detected sleep events, we further classify them
into detailed events such as going to bed, getting off bedand turnovers. Generating statistic of such detailed eventscan help quantify the sleep quality. For example, frequen-t getting up or turning overs may suggest that the personhas difficulty falling asleep. This information contributes tomany healthcare applications such as elderly care and med-ical diagnosis. As shown in Figure 9, sleep events involvingrelative larger-scale movements (i.e., going to bed and get-ting out of bed) result in much larger variance energy thanthose involving relative smaller-scale movements (i.e., turnovers). We thus can distinguish sleep events with larger-scale movements from those with smaller-scale movementsby comparing the variance energy from Equation (4). Tofurther distinguish larger-scale movements, we can exploitthe changes of the number of persons in bed to infer thesetwo events. The number of persons in bed can be obtainedby using a profile based approach as studied in existing work(e.g., [23]).
7. PERFORMANCE EVALUATIONIn this section, we evaluate our system of tracking vital
signs during sleep in both lab and two apartments.
7.1 Device and NetworkWe conduct experiments in an 802.11n WiFi network with
a single off-the-shelf WiFi device (i.e., Lenovo T500 Laptop)connected to a commercial wireless Access Point (AP) (i.e.,TP-Link TL-WDR4300). The laptop runs Ubuntu 10.04 LT-S with the 2.6.36 kernel and is equipped with an Intel WiFiLink 5300 card for measuring CSI [24]. Unless mentionedotherwise, the packet transmission rate is set to 20pkts/s.How the packet rate affects the performance will be dis-cussed in Section 7.5.4. For each packet, we extract CSI
P1
P0
P2
P4
P3
Tx-Rx
Distance: 3m
(a) Setup of WiFi device-APpair with different relativepositions.
Curl Up
(41%) Supine (13%)
Prone
(7%) Recumbent (28%)
(b) Different sleeppostures in bed [25].
Figure 10: Setup of relative position of WiFi deviceand AP and sleeping postures.
Figure 11: Two apartment setup.
for 30 subcarrier groups, which are evenly distributed in the56 subcarriers of a 20MHz channel [24].
7.2 Experimental MethodologyThe experiments are conducted in both lab and two a-
partments with 6 participants over a three-months time pe-riod. The lab environment is a large room with office cubicaround. It is used to study the impact of various factors suchas obstacles, the various distances between the AP and theWiFi device, and sleep postures. The participants lie on abed and control their breathing rate to follow various steadybeats from a metronome, which is set to a rhythm rangingfrom 12bpm to 18bpm.
We also conduct experiments in two apartments with dif-ferent bedroom sizes. Figure 11 illustrates the environmentalsetup in two bedrooms, in which both beds are queen size.The smaller one (i.e., bedroom 1) has the size of about 12ft× 9ft, whereas the larger one (i.e., bedroom 2) is about15ft × 12ft. As shown in Figure 11, we have three setup-s in both apartments: setup 1 is the ideal scenario wherethe AP and WiFi device are placed at two sides of the bed.This setup is useful for persons who want to optimize theperformance of the vital signs monitoring during sleep. Set-up 2 represents a typical scenario where there is a AP insidethe room and a WiFi device, such as smartphone, laptop ortablet, is put on the bed table. Setup 2 has larger distancebetween the AP and the WiFi device than setup 1. Setup 3is a challenging scenario where the AP and the WiFi deviceare placed in different rooms with a concrete wall betweenthem. The distance between the AP and the WiFi deviceis the largest among three setups. In this setup, we utilizedirectional antennas (i.e., TL-ANT2406A) to enhance thereception of WiFi signals. The ground truths of breathingand heart rates are monitored by the NEULOG Respiration
273
2 3 4 5 6 7 8 9 100
0.2
0.4
0.6
0.8
1
Distance between WiFi device and AP (m)
Me
an
Estim
atio
n E
rro
r (b
pm
)
CSI based
RSS based
(a) Mean estimation error.
0 0.5 1 1.5 20
0.2
0.4
0.6
0.8
1
Estimation Error (bpm)
CD
F
Best case (2m)
Typical case (3−7m)
Challenge case (8−10m)
(b) CDF of estimation error.
Figure 12: Performance under different distancesbetween WiFi device and AP.
1 2 30
0.2
0.4
0.6
0.8
1
Setup Index
Me
an
Estim
atio
n E
rro
r (b
pm
)
Bedroom 1Bedroom 2
(a) Mean estimation error.
0 0.5 1 1.5 20
0.2
0.4
0.6
0.8
1
Estimation Error (bpm)
CD
F
Setup 1− BR1
Setup 1− BR2
Setup 2− BR1
Setup 2− BR2
Setup 3− BR1
Setup 3− BR2
(b) CDF of estimation error.
Figure 13: Performance in two real apartments.
Monitor Logger Sensor [22] and a fingertip pulse oximeter,respectively.
7.3 Evaluation of Breathing Rate EstimationWe evaluate the overall performance of breathing rate esti-
mation under different scenarios including different distancesbetween the AP and WiFi, evaluation in two real apartmentsand two persons in bed case.
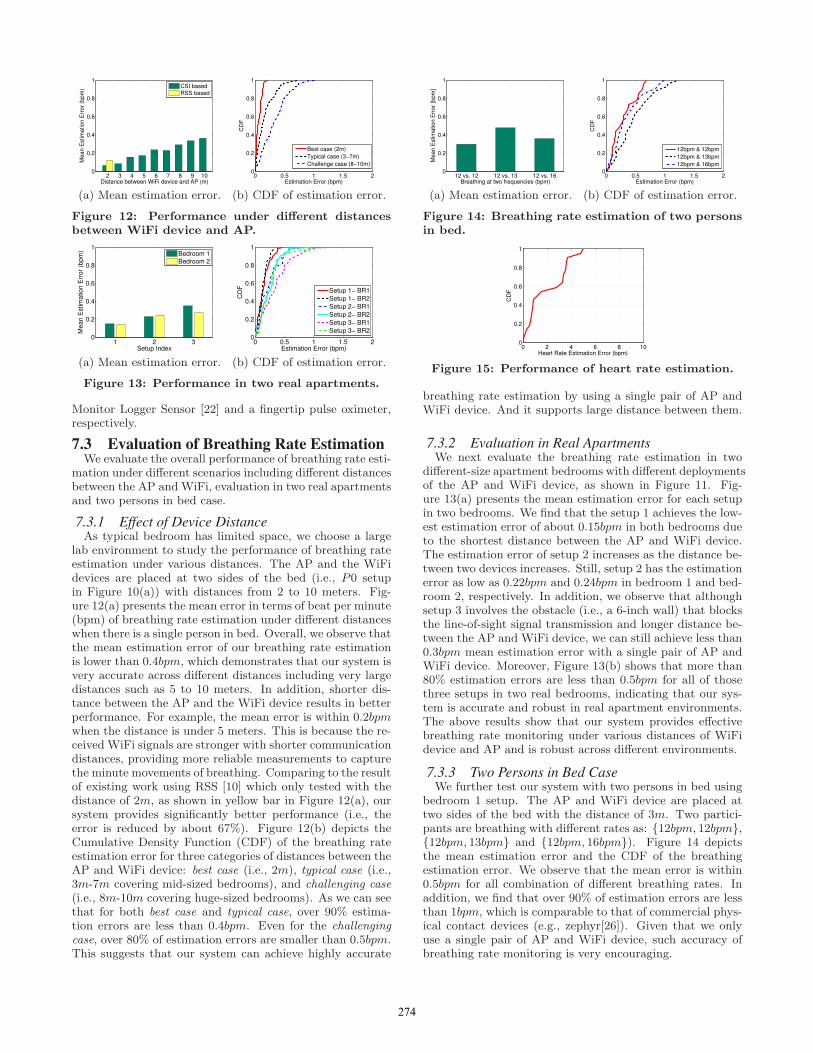
7.3.1 Effect of Device DistanceAs typical bedroom has limited space, we choose a large
lab environment to study the performance of breathing rateestimation under various distances. The AP and the WiFidevices are placed at two sides of the bed (i.e., P0 setupin Figure 10(a)) with distances from 2 to 10 meters. Fig-ure 12(a) presents the mean error in terms of beat per minute(bpm) of breathing rate estimation under different distanceswhen there is a single person in bed. Overall, we observe thatthe mean estimation error of our breathing rate estimationis lower than 0.4bpm, which demonstrates that our system isvery accurate across different distances including very largedistances such as 5 to 10 meters. In addition, shorter dis-tance between the AP and the WiFi device results in betterperformance. For example, the mean error is within 0.2bpmwhen the distance is under 5 meters. This is because the re-ceived WiFi signals are stronger with shorter communicationdistances, providing more reliable measurements to capturethe minute movements of breathing. Comparing to the resultof existing work using RSS [10] which only tested with thedistance of 2m, as shown in yellow bar in Figure 12(a), oursystem provides significantly better performance (i.e., theerror is reduced by about 67%). Figure 12(b) depicts theCumulative Density Function (CDF) of the breathing rateestimation error for three categories of distances between theAP and WiFi device: best case (i.e., 2m), typical case (i.e.,3m-7m covering mid-sized bedrooms), and challenging case(i.e., 8m-10m covering huge-sized bedrooms). As we can seethat for both best case and typical case, over 90% estima-tion errors are less than 0.4bpm. Even for the challengingcase, over 80% of estimation errors are smaller than 0.5bpm.This suggests that our system can achieve highly accurate
12 vs. 12 12 vs. 13 12 vs. 160
0.2
0.4
0.6
0.8
1
Breathing at two frequencies (bpm)
Me
an
Estim
atio
n E
rro
r [b
pm
]
(a) Mean estimation error.
0 0.5 1 1.5 20
0.2
0.4
0.6
0.8
1
Estimation Error (bpm)
CD
F
12bpm & 12bpm
12bpm & 13bpm
12bpm & 16bpm
(b) CDF of estimation error.
Figure 14: Breathing rate estimation of two personsin bed.
0 2 4 6 8 100
0.2
0.4
0.6
0.8
1
Heart Rate Estimation Error (bpm)
CD
F
Figure 15: Performance of heart rate estimation.
breathing rate estimation by using a single pair of AP andWiFi device. And it supports large distance between them.
7.3.2 Evaluation in Real ApartmentsWe next evaluate the breathing rate estimation in two
different-size apartment bedrooms with different deploymentsof the AP and WiFi device, as shown in Figure 11. Fig-ure 13(a) presents the mean estimation error for each setupin two bedrooms. We find that the setup 1 achieves the low-est estimation error of about 0.15bpm in both bedrooms dueto the shortest distance between the AP and WiFi device.The estimation error of setup 2 increases as the distance be-tween two devices increases. Still, setup 2 has the estimationerror as low as 0.22bpm and 0.24bpm in bedroom 1 and bed-room 2, respectively. In addition, we observe that althoughsetup 3 involves the obstacle (i.e., a 6-inch wall) that blocksthe line-of-sight signal transmission and longer distance be-tween the AP and WiFi device, we can still achieve less than0.3bpm mean estimation error with a single pair of AP andWiFi device. Moreover, Figure 13(b) shows that more than80% estimation errors are less than 0.5bpm for all of thosethree setups in two real bedrooms, indicating that our sys-tem is accurate and robust in real apartment environments.The above results show that our system provides effectivebreathing rate monitoring under various distances of WiFidevice and AP and is robust across different environments.
7.3.3 Two Persons in Bed CaseWe further test our system with two persons in bed using
bedroom 1 setup. The AP and WiFi device are placed attwo sides of the bed with the distance of 3m. Two partici-pants are breathing with different rates as: {12bpm, 12bpm},{12bpm, 13bpm} and {12bpm, 16bpm}). Figure 14 depictsthe mean estimation error and the CDF of the breathingestimation error. We observe that the mean error is within0.5bpm for all combination of different breathing rates. Inaddition, we find that over 90% of estimation errors are lessthan 1bpm, which is comparable to that of commercial phys-ical contact devices (e.g., zephyr[26]). Given that we onlyuse a single pair of AP and WiFi device, such accuracy ofbreathing rate monitoring is very encouraging.
274
Supine Curl up Recumbent Prone0
0.2
0.4
0.6
0.8
1
Sleep Postures
Me
an
Estim
atio
n E
rro
r (b
pm
)
(a) Mean estimation error.
0 0.2 0.4 0.6 0.8 10
0.2
0.4
0.6
0.8
1
Estimation Error (bpm)
CD
F
Supine
Curl up
Recumbent
Prone
(b) CDF of estimation error.
Figure 16: Effect of sleep postures.
Frame Door Wall0
0.2
0.4
0.6
0.8
1
Obstacle Materials
Me
an
Estim
atio
n E
rro
r (b
pm
)
Omni−Antenna
Directional Antenna
(a) Mean estimation error.
0 0.5 1 1.5 20
0.2
0.4
0.6
0.8
1
Estimation Error (bpm)
CD
F
Frame (Omni−Antenna)
Frame (Directional Antenna)
Door (Omni−Antenna)
Door (Directional Antenna)
Wall (Omni−Antenna)
Wall (Directional Antenna)
(b) CDF of estimation error.
Figure 17: Effect of obstacle between WiFi deviceand AP.
7.4 Performance of Heart Rate EstimationFigure 15 illustrates the CDF of heart rate estimation er-
ror when one person is in bed using setup 1 in bedroom 1with the AP equipped with directional antennas. We observethat about 57% of estimation errors are less than 2bpm andover 90% of estimation errors are less than 4bpm. The resultsare very encouraging as our system achieves comparable ac-curacy to that of commercial sensors, e.g., Zephyr [26] andSleepIQ [15]. Comparing with these commercial products,our system re-uses existing WiFi network without dedicat-ed/wearable sensors or additional cost. Our system thus isable to support large-scale deployment and long-term vitalsigns monitoring in non-clinical settings. To the best of ourknowledge, our work is the first to achieve device-free heartrate estimation leveraging off-the-shelf WiFi.
7.5 Impact of Various FactorsIn this subsection, we perform detailed study of breathing
rate estimation under various factors.
7.5.1 Sleep PosturesWe experiment with different sleep postures as shown in
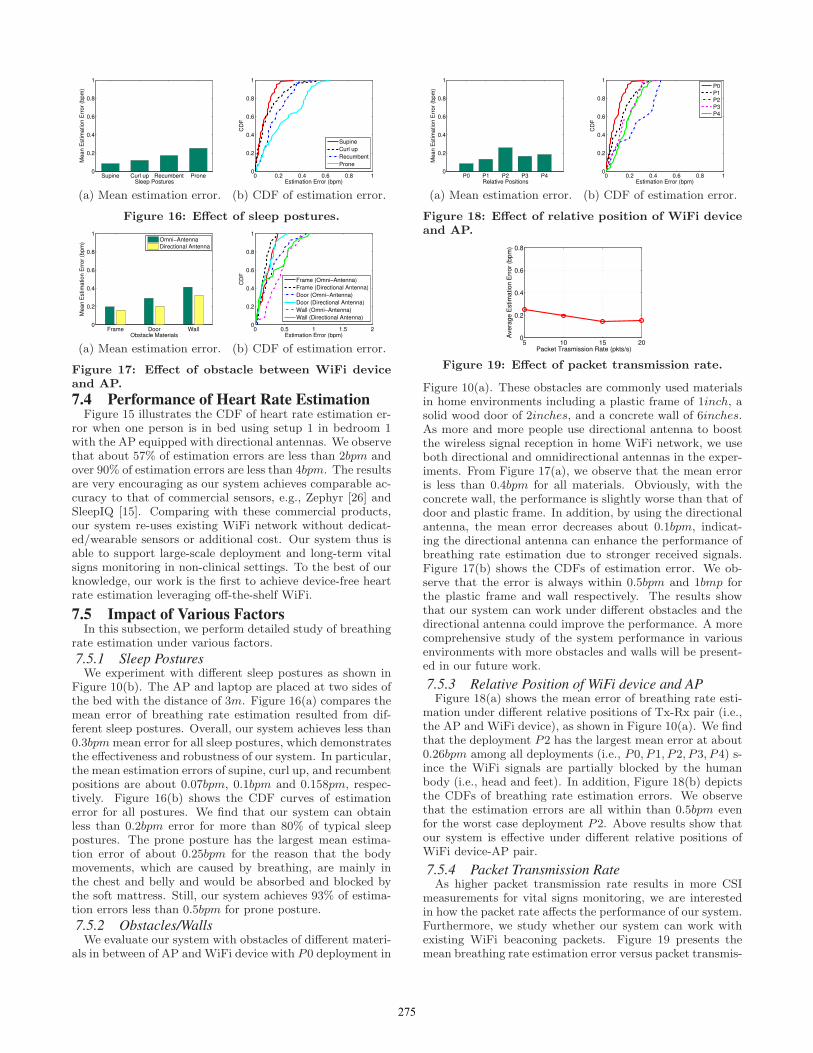
Figure 10(b). The AP and laptop are placed at two sides ofthe bed with the distance of 3m. Figure 16(a) compares themean error of breathing rate estimation resulted from dif-ferent sleep postures. Overall, our system achieves less than0.3bpmmean error for all sleep postures, which demonstratesthe effectiveness and robustness of our system. In particular,the mean estimation errors of supine, curl up, and recumbentpositions are about 0.07bpm, 0.1bpm and 0.158pm, respec-tively. Figure 16(b) shows the CDF curves of estimationerror for all postures. We find that our system can obtainless than 0.2bpm error for more than 80% of typical sleeppostures. The prone posture has the largest mean estima-tion error of about 0.25bpm for the reason that the bodymovements, which are caused by breathing, are mainly inthe chest and belly and would be absorbed and blocked bythe soft mattress. Still, our system achieves 93% of estima-tion errors less than 0.5bpm for prone posture.
7.5.2 Obstacles/WallsWe evaluate our system with obstacles of different materi-
als in between of AP and WiFi device with P0 deployment in
P0 P1 P2 P3 P40
0.2
0.4
0.6
0.8
1
Relative Positions
Me
an
Estim
atio
n E
rro
r (b
pm
)
(a) Mean estimation error.
0 0.2 0.4 0.6 0.8 10
0.2
0.4
0.6
0.8
1
Estimation Error (bpm)
CD
F
P0
P1
P2
P3
P4
(b) CDF of estimation error.
Figure 18: Effect of relative position of WiFi deviceand AP.
5 10 15 200
0.2
0.4
0.6
0.8
Packet Trasmission Rate (pkts/s)
Ave
rag
e E
stim
atio
n E
rro
r (b
pm
)
Figure 19: Effect of packet transmission rate.
Figure 10(a). These obstacles are commonly used materialsin home environments including a plastic frame of 1inch, asolid wood door of 2inches, and a concrete wall of 6inches.As more and more people use directional antenna to boostthe wireless signal reception in home WiFi network, we useboth directional and omnidirectional antennas in the exper-iments. From Figure 17(a), we observe that the mean erroris less than 0.4bpm for all materials. Obviously, with theconcrete wall, the performance is slightly worse than that ofdoor and plastic frame. In addition, by using the directionalantenna, the mean error decreases about 0.1bpm, indicat-ing the directional antenna can enhance the performance ofbreathing rate estimation due to stronger received signals.Figure 17(b) shows the CDFs of estimation error. We ob-serve that the error is always within 0.5bpm and 1bmp forthe plastic frame and wall respectively. The results showthat our system can work under different obstacles and thedirectional antenna could improve the performance. A morecomprehensive study of the system performance in variousenvironments with more obstacles and walls will be present-ed in our future work.
7.5.3 Relative Position of WiFi device and APFigure 18(a) shows the mean error of breathing rate esti-
mation under different relative positions of Tx-Rx pair (i.e.,the AP and WiFi device), as shown in Figure 10(a). We findthat the deployment P2 has the largest mean error at about0.26bpm among all deployments (i.e., P0, P1, P2, P3, P4) s-ince the WiFi signals are partially blocked by the humanbody (i.e., head and feet). In addition, Figure 18(b) depictsthe CDFs of breathing rate estimation errors. We observethat the estimation errors are all within than 0.5bpm evenfor the worst case deployment P2. Above results show thatour system is effective under different relative positions ofWiFi device-AP pair.
7.5.4 Packet Transmission RateAs higher packet transmission rate results in more CSI
measurements for vital signs monitoring, we are interestedin how the packet rate affects the performance of our system.Furthermore, we study whether our system can work withexisting WiFi beaconing packets. Figure 19 presents themean breathing rate estimation error versus packet transmis-
275
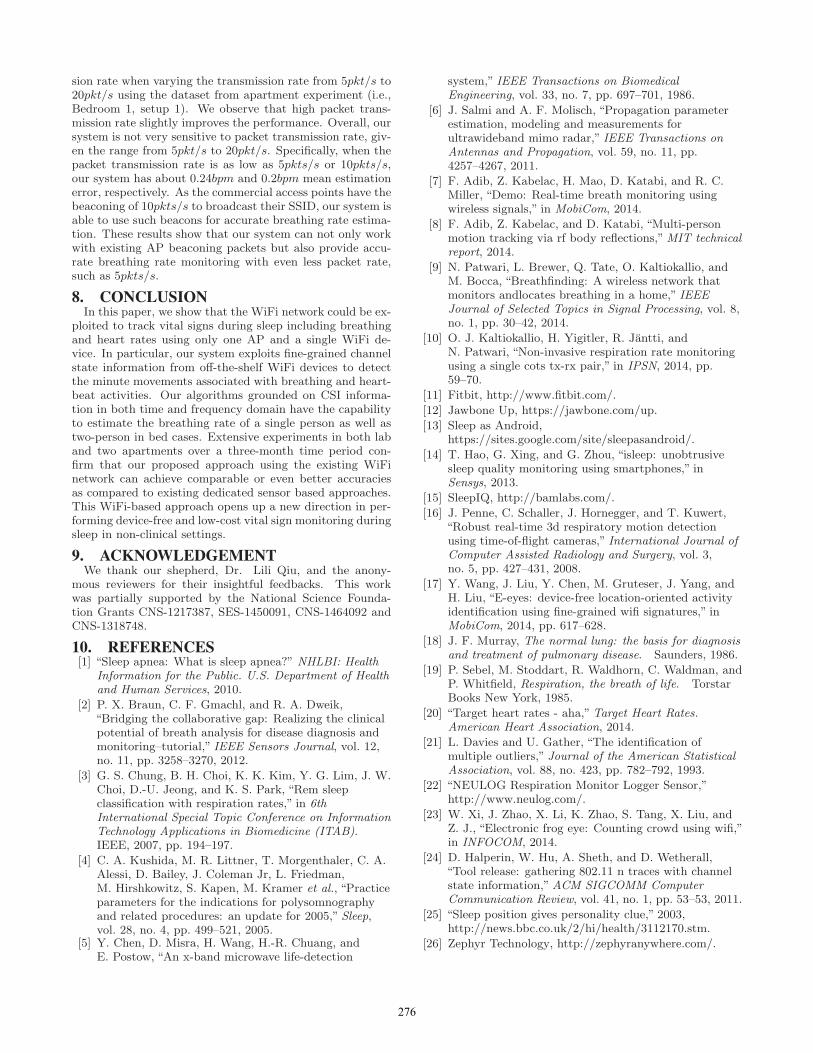
sion rate when varying the transmission rate from 5pkt/s to20pkt/s using the dataset from apartment experiment (i.e.,Bedroom 1, setup 1). We observe that high packet trans-mission rate slightly improves the performance. Overall, oursystem is not very sensitive to packet transmission rate, giv-en the range from 5pkt/s to 20pkt/s. Specifically, when thepacket transmission rate is as low as 5pkts/s or 10pkts/s,our system has about 0.24bpm and 0.2bpm mean estimationerror, respectively. As the commercial access points have thebeaconing of 10pkts/s to broadcast their SSID, our system isable to use such beacons for accurate breathing rate estima-tion. These results show that our system can not only workwith existing AP beaconing packets but also provide accu-rate breathing rate monitoring with even less packet rate,such as 5pkts/s.
8. CONCLUSIONIn this paper, we show that the WiFi network could be ex-
ploited to track vital signs during sleep including breathingand heart rates using only one AP and a single WiFi de-vice. In particular, our system exploits fine-grained channelstate information from off-the-shelf WiFi devices to detectthe minute movements associated with breathing and heart-beat activities. Our algorithms grounded on CSI informa-tion in both time and frequency domain have the capabilityto estimate the breathing rate of a single person as well astwo-person in bed cases. Extensive experiments in both laband two apartments over a three-month time period con-firm that our proposed approach using the existing WiFinetwork can achieve comparable or even better accuraciesas compared to existing dedicated sensor based approaches.This WiFi-based approach opens up a new direction in per-forming device-free and low-cost vital sign monitoring duringsleep in non-clinical settings.
9. ACKNOWLEDGEMENTWe thank our shepherd, Dr. Lili Qiu, and the anony-
mous reviewers for their insightful feedbacks. This workwas partially supported by the National Science Founda-tion Grants CNS-1217387, SES-1450091, CNS-1464092 andCNS-1318748.
10. REFERENCES[1] “Sleep apnea: What is sleep apnea?” NHLBI: Health
Information for the Public. U.S. Department of Healthand Human Services, 2010.
[2] P. X. Braun, C. F. Gmachl, and R. A. Dweik,“Bridging the collaborative gap: Realizing the clinicalpotential of breath analysis for disease diagnosis andmonitoring–tutorial,” IEEE Sensors Journal, vol. 12,no. 11, pp. 3258–3270, 2012.
[3] G. S. Chung, B. H. Choi, K. K. Kim, Y. G. Lim, J. W.Choi, D.-U. Jeong, and K. S. Park, “Rem sleepclassification with respiration rates,” in 6thInternational Special Topic Conference on InformationTechnology Applications in Biomedicine (ITAB).IEEE, 2007, pp. 194–197.
[4] C. A. Kushida, M. R. Littner, T. Morgenthaler, C. A.Alessi, D. Bailey, J. Coleman Jr, L. Friedman,M. Hirshkowitz, S. Kapen, M. Kramer et al., “Practiceparameters for the indications for polysomnographyand related procedures: an update for 2005,” Sleep,vol. 28, no. 4, pp. 499–521, 2005.
[5] Y. Chen, D. Misra, H. Wang, H.-R. Chuang, andE. Postow, “An x-band microwave life-detection
system,” IEEE Transactions on BiomedicalEngineering, vol. 33, no. 7, pp. 697–701, 1986.
[6] J. Salmi and A. F. Molisch, “Propagation parameterestimation, modeling and measurements forultrawideband mimo radar,” IEEE Transactions onAntennas and Propagation, vol. 59, no. 11, pp.4257–4267, 2011.
[7] F. Adib, Z. Kabelac, H. Mao, D. Katabi, and R. C.Miller, “Demo: Real-time breath monitoring usingwireless signals,” in MobiCom, 2014.
[8] F. Adib, Z. Kabelac, and D. Katabi, “Multi-personmotion tracking via rf body reflections,”MIT technicalreport, 2014.
[9] N. Patwari, L. Brewer, Q. Tate, O. Kaltiokallio, andM. Bocca, “Breathfinding: A wireless network thatmonitors andlocates breathing in a home,” IEEEJournal of Selected Topics in Signal Processing, vol. 8,no. 1, pp. 30–42, 2014.
[10] O. J. Kaltiokallio, H. Yigitler, R. Jantti, andN. Patwari, “Non-invasive respiration rate monitoringusing a single cots tx-rx pair,” in IPSN, 2014, pp.59–70.
[11] Fitbit, http://www.fitbit.com/.
[12] Jawbone Up, https://jawbone.com/up.
[13] Sleep as Android,https://sites.google.com/site/sleepasandroid/.
[14] T. Hao, G. Xing, and G. Zhou, “isleep: unobtrusivesleep quality monitoring using smartphones,” inSensys, 2013.
[15] SleepIQ, http://bamlabs.com/.
[16] J. Penne, C. Schaller, J. Hornegger, and T. Kuwert,“Robust real-time 3d respiratory motion detectionusing time-of-flight cameras,” International Journal ofComputer Assisted Radiology and Surgery, vol. 3,no. 5, pp. 427–431, 2008.
[17] Y. Wang, J. Liu, Y. Chen, M. Gruteser, J. Yang, andH. Liu, “E-eyes: device-free location-oriented activityidentification using fine-grained wifi signatures,” inMobiCom, 2014, pp. 617–628.
[18] J. F. Murray, The normal lung: the basis for diagnosisand treatment of pulmonary disease. Saunders, 1986.
[19] P. Sebel, M. Stoddart, R. Waldhorn, C. Waldman, andP. Whitfield, Respiration, the breath of life. TorstarBooks New York, 1985.
[20] “Target heart rates - aha,”Target Heart Rates.American Heart Association, 2014.
[21] L. Davies and U. Gather, “The identification ofmultiple outliers,” Journal of the American StatisticalAssociation, vol. 88, no. 423, pp. 782–792, 1993.
[22] “NEULOG Respiration Monitor Logger Sensor,”http://www.neulog.com/.
[23] W. Xi, J. Zhao, X. Li, K. Zhao, S. Tang, X. Liu, andZ. J., “Electronic frog eye: Counting crowd using wifi,”in INFOCOM, 2014.
[24] D. Halperin, W. Hu, A. Sheth, and D. Wetherall,“Tool release: gathering 802.11 n traces with channelstate information,”ACM SIGCOMM ComputerCommunication Review, vol. 41, no. 1, pp. 53–53, 2011.
[25] “Sleep position gives personality clue,” 2003,http://news.bbc.co.uk/2/hi/health/3112170.stm.
[26] Zephyr Technology, http://zephyranywhere.com/.
276