Embed Size (px)
Citation preview
Tracking Nutrition Trends VI
August 2006
An Initiative of the Canadian Council of Food and Nutrition
The Canadian Council of Food and Nutrition (CCFN) is a national, non-profit organization established in 2004 through the union of the mandates of the National Institute of Nutrition and the Canadian Food Information Council. The vision of CCFN is to be the multi-sectoral trusted voice for science-based food and nutrition policy and information in Canada. To successfully achieve its vision, CCFN acts as a catalyst in advancing the nutritional health and well-being of all Canadians by:
• Championing evidence-based solutions to key nutrition issues affecting the nutritional health of Canadians
• Advocating for evidence-based nutrition policy in Canada • Promoting public understanding of food and nutrition issues
Canadian Council of Food and Nutrition 3800 Steeles Avenue West, Suite 301A Woodbridge, Ontario L4L 4G9 Telephone: 905-265-9124 Fax: 905-265-9372 Email: [email protected]

i
Acknowledgements The Canadian Council of Food and Nutrition would like to thank the following individuals and organizations:
The sponsors for their valuable support and commitment, without which this project would not have been possible:
– Dairy Farmers of Canada – GCI Group – Health Canada – Kellogg Canada – Unilever Canada
The advisory committee members for giving their time, providing their valuable insights and sharing their expertise in developing this Tracking Nutrition Trends VI survey:
– Dr. Loretta DiFrancesco, Ph.D., RD, MBA, Consultant, Source! Nutrition – Lydia Dumais, RD, Head, Nutrition Labelling & Claims, Health Canada Food Directorate – Dr. Susan Evers, Ph.D., RD, Professor, Applied Human Nutrition, University of Guelph – Johanne Trudeau, RD, Director, Nutrition & Consumer Affairs, Kellogg Canada Inc.
Sheryl Conrad, RD, for her expertise in providing a final review and edit of the report.
The research company, and in particular the lead researcher, for their expertise in developing the survey tool, collecting and analyzing the data, and reporting the results as presented in this TNT VI report.
– TNS Canadian Facts – Richard Jenkins, Ph.D., Vice President & Corporate Director of Public Opinion
Research, TNS Canadian Facts
ii
Contents
Acknowledgements i Executive Summary 5
Introduction 5
Key Findings 6
Knowledge and Understanding of Nutrition 6
Food Safety Concerns 6
Information about Food and Nutrition 7
Food Product Labelling 7
Food Choices 8
Changes in Eating Habits 9
Résumé 10
Introduction 10
Résultats clés 11
Connaissance et compréhension de la nutrition 11
Inquiétudes quant à l’inocuité des aliments 12
Information sur l’alimentation et la nutrition 12
Étiquetage nutritionnel 13
Choix d’aliments 13
Changements dans les habitudes alimentaires 15
Methodology 16
Detailed Findings 18
Overall Approach 18
Attitudes about Food and Nutrition 19
Self-rated Knowledge 19
Food Safety Concerns 21
Public Understanding of Nutrition 23
Dietary Fibre 23
iii
Carbohydrates and the Glycemic Index 28
Cholesterol 28
Fat Content of Margarine and Butter 31
Trans Fatty Acids 32
Omega-3 Fatty Acids 32
Sources of Information about Food and Nutrition 33
Source of Food and Nutrition Information 33
Recall of Specific Health Claims or Statements (Past Year) 36
Specific Claim Recalled 37
Food Product Labels 39
Frequency of Reading Labels 39
Ability to Find Information on Labels 41
Use of Information on Labels 42
Perceived Importance of Specific Label Information 44
Factors Affecting Food Choices 46
Self-rated Eating Habits and Health 46
Taste, Nutrition, Cost and Convenience 48
Perceptions of What Makes a Food Healthy 50
Factors Affecting Food Choice 51
Selection of Food Based on Nutrient Content 55
Importance of Added Vitamins and Minerals on Food Selection 56
Awareness of Functional Foods 57
Lifestyle-Related Choices 58
Eating Meals Prepared at Home versus Out 58
Availability of Nutrition Information When Eating Out 60
Personal Changes to Eating Habits 62
Type of Change or Improvement 63
Popular Diets 65
iv
Appendix 1: Questionnaire 68
English 68
French 92
Appendix 2: Additional Methodological Information 116
Record of Call 116
Actual and Weighted Completions 117
Executive Summary
5
Executive Summary
Introduction
This report presents the results of the 2006 Tracking Nutrition Trends (TNT VI) survey. The former National Institute of Nutrition (NIN) launched the Tracking Nutrition Trends series in 1989 to investigate the self-reported knowledge, attitudes and behaviours of the adult Canadian population with respect to food and nutrition. The Canadian Council of Food and Nutrition is continuing this legacy. Each wave of the series (I through VI) has built on the previous findings and tracked changes in attitudes, self-reported knowledge and behaviours of adult Canadians. Previous surveys are:
• TNT I (1989) • TNT II (1994) • TNT III (1997) • TNT IV (2002) • TNT V (2004)
In addition to tracking questions on nutrition knowledge, attitudes and behaviour, the 2006 survey (TNT VI) was designed to obtain additional information on the importance of emerging factors in Canadians’ eating choices. In addition, the section on nutrition labelling was expanded and modified to address the new labelling formats.
The intent of the TNT series has always been to provide policy makers, health professionals, academics, and the food industry with insight into Canadians’ perspectives on the importance of nutrition and their self-reported knowledge and behaviours. TNT VI is presented in the same spirit – to give insight in formulating policies, in developing communications on the role of food and nutrition in health, in directing further nutrition research projects, and in making decisions on the development and marketing of food products.
Executive Summary
6
Key Findings
Knowledge and Understanding of Nutrition
Knowledge is critical in the modern world and a distinction between information and knowledge must be made. The amount of information and the speed and variety of the channels by which it is communicated have increased and continue to do so. Information is provided by a number of sources to a number of different ends and what may matter the most is the knowledge Canadians bring to the store when they make food choices.
Eighty-seven per cent of Canadians believe they have some knowledge of nutrition, with a relatively core group of 26 per cent who think they are very knowledgeable (the informed). This is virtually unchanged from the TNT V survey. There is room to increase the proportion that is informed and clear deficiencies exist with respect to knowledge. Younger Canadians, men and those with less formal education are less confident about their knowledge. Wider knowledge deficiencies also exist on relatively new topics, such as the glycemic index and trans fatty acids.
Knowledgeable people are better positioned to make informed food choices and the self-evaluations provide a very good predictor of their knowledge and how they behave. Those in the informed core think and act differently when it comes to food and nutrition.
• Self-rated knowledge is a good predictor of knowledge about specific nutrition issues in the survey and a strong driver of nutrition-related decisions and lifestyle choices. For example, people who think they are very knowledgeable about nutrition are more likely to agree that some types of dietary fibre can reduce the blood cholesterol level.
• Those who see themselves as informed are much more likely to eat breakfast every day than those who are less knowledgeable.
How people use the knowledge they have and whether they seek to improve their stock of knowledge will reflect what they care about when it comes to eating well.
Food Safety Concerns
There is no single dominant food safety issue or category of issues that concerns Canadians. Key concerns are the handling, preparation or storage of food (23%), the content of specific nutrients in food (12%), the additives and other chemicals in food (13%) and the use of pesticides (13%). Interestingly, concern with the use of pesticides emerged as a much bigger food safety issue this year (13%) than in TNT V (6%).
Executive Summary
7
Information about Food and Nutrition
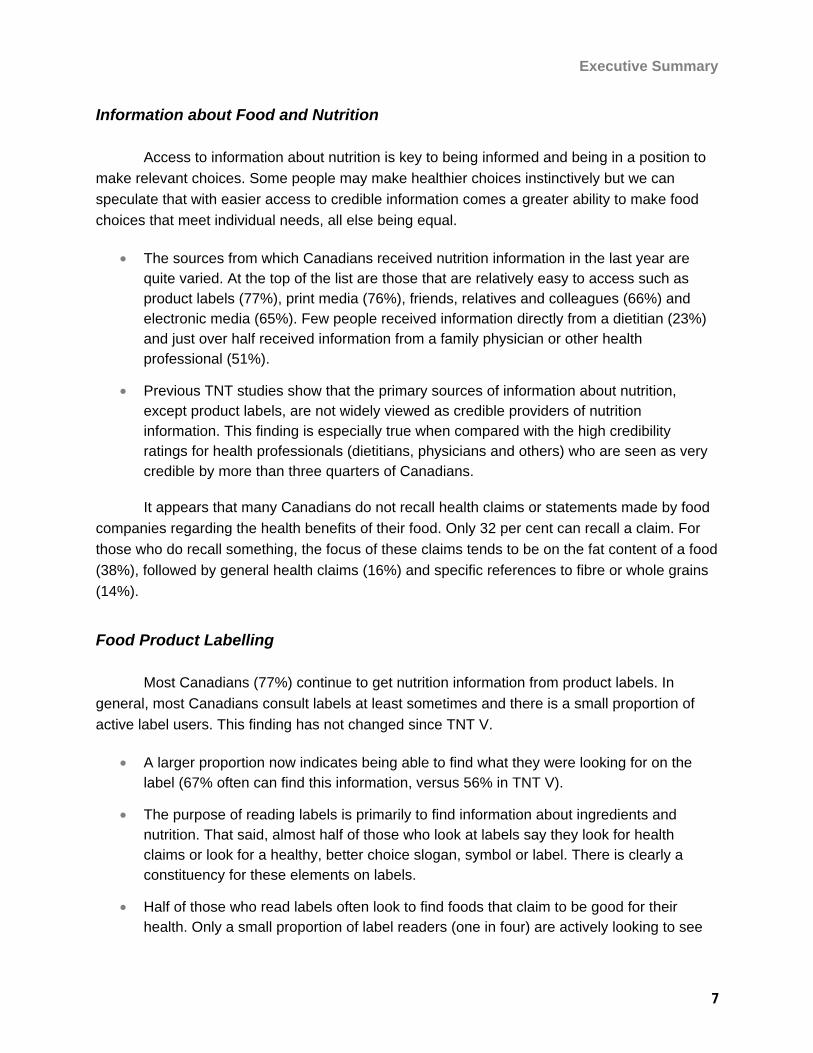
Access to information about nutrition is key to being informed and being in a position to make relevant choices. Some people may make healthier choices instinctively but we can speculate that with easier access to credible information comes a greater ability to make food choices that meet individual needs, all else being equal.
• The sources from which Canadians received nutrition information in the last year are quite varied. At the top of the list are those that are relatively easy to access such as product labels (77%), print media (76%), friends, relatives and colleagues (66%) and electronic media (65%). Few people received information directly from a dietitian (23%) and just over half received information from a family physician or other health professional (51%).
• Previous TNT studies show that the primary sources of information about nutrition, except product labels, are not widely viewed as credible providers of nutrition information. This finding is especially true when compared with the high credibility ratings for health professionals (dietitians, physicians and others) who are seen as very credible by more than three quarters of Canadians.
It appears that many Canadians do not recall health claims or statements made by food companies regarding the health benefits of their food. Only 32 per cent can recall a claim. For those who do recall something, the focus of these claims tends to be on the fat content of a food (38%), followed by general health claims (16%) and specific references to fibre or whole grains (14%).
Food Product Labelling
Most Canadians (77%) continue to get nutrition information from product labels. In general, most Canadians consult labels at least sometimes and there is a small proportion of active label users. This finding has not changed since TNT V.
• A larger proportion now indicates being able to find what they were looking for on the label (67% often can find this information, versus 56% in TNT V).
• The purpose of reading labels is primarily to find information about ingredients and nutrition. That said, almost half of those who look at labels say they look for health claims or look for a healthy, better choice slogan, symbol or label. There is clearly a constituency for these elements on labels.
• Half of those who read labels often look to find foods that claim to be good for their health. Only a small proportion of label readers (one in four) are actively looking to see
Executive Summary
8
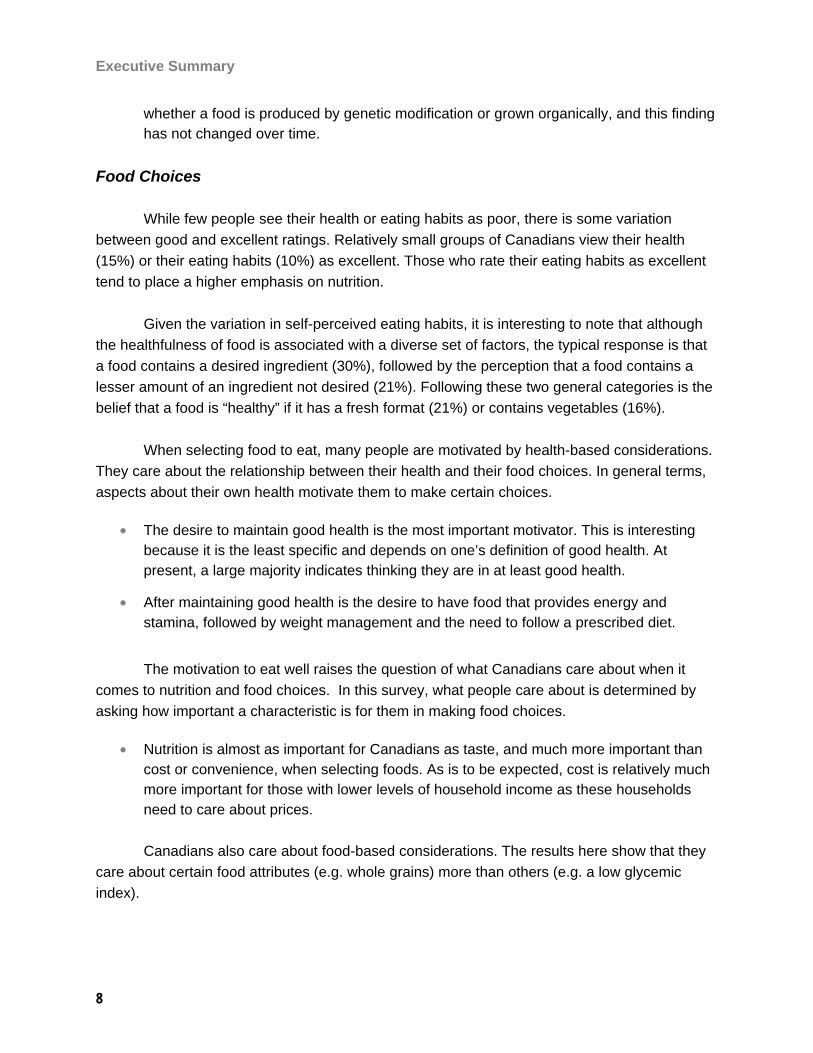
whether a food is produced by genetic modification or grown organically, and this finding has not changed over time.
Food Choices
While few people see their health or eating habits as poor, there is some variation between good and excellent ratings. Relatively small groups of Canadians view their health (15%) or their eating habits (10%) as excellent. Those who rate their eating habits as excellent tend to place a higher emphasis on nutrition.
Given the variation in self-perceived eating habits, it is interesting to note that although the healthfulness of food is associated with a diverse set of factors, the typical response is that a food contains a desired ingredient (30%), followed by the perception that a food contains a lesser amount of an ingredient not desired (21%). Following these two general categories is the belief that a food is “healthy” if it has a fresh format (21%) or contains vegetables (16%).
When selecting food to eat, many people are motivated by health-based considerations. They care about the relationship between their health and their food choices. In general terms, aspects about their own health motivate them to make certain choices.
• The desire to maintain good health is the most important motivator. This is interesting because it is the least specific and depends on one’s definition of good health. At present, a large majority indicates thinking they are in at least good health.
• After maintaining good health is the desire to have food that provides energy and stamina, followed by weight management and the need to follow a prescribed diet.
The motivation to eat well raises the question of what Canadians care about when it comes to nutrition and food choices. In this survey, what people care about is determined by asking how important a characteristic is for them in making food choices.
• Nutrition is almost as important for Canadians as taste, and much more important than cost or convenience, when selecting foods. As is to be expected, cost is relatively much more important for those with lower levels of household income as these households need to care about prices.
Canadians also care about food-based considerations. The results here show that they care about certain food attributes (e.g. whole grains) more than others (e.g. a low glycemic index).
Executive Summary
9
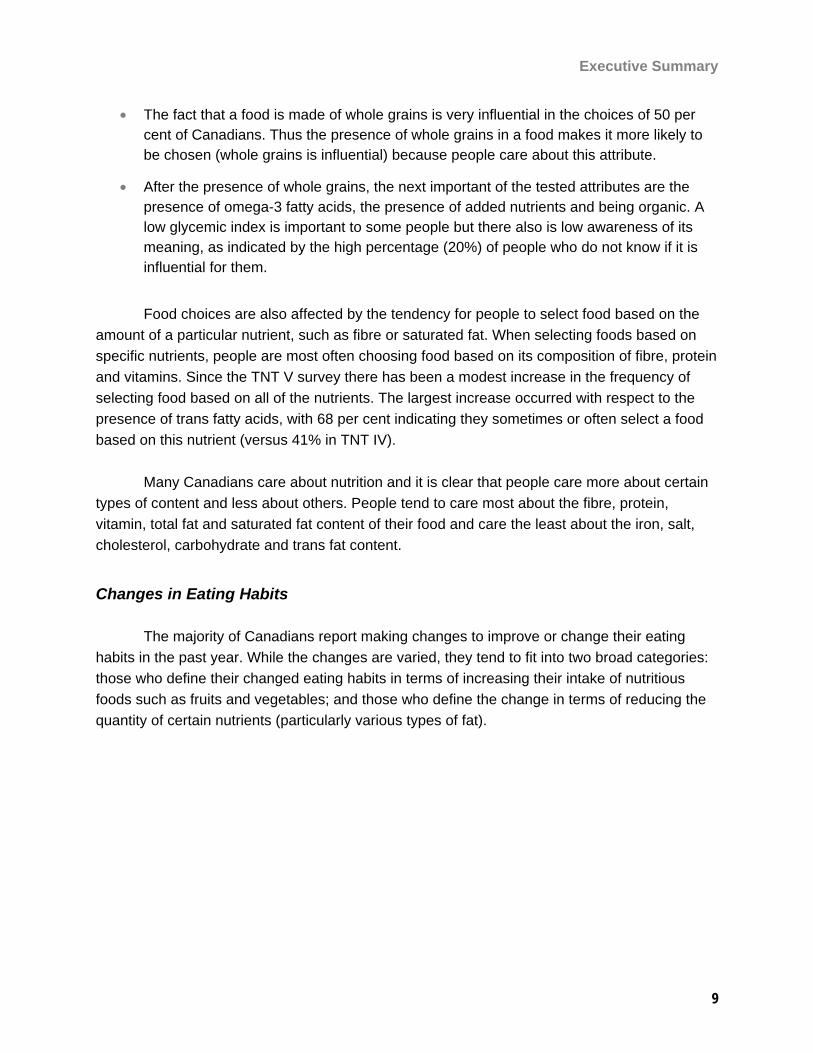
• The fact that a food is made of whole grains is very influential in the choices of 50 per cent of Canadians. Thus the presence of whole grains in a food makes it more likely to be chosen (whole grains is influential) because people care about this attribute.
• After the presence of whole grains, the next important of the tested attributes are the presence of omega-3 fatty acids, the presence of added nutrients and being organic. A low glycemic index is important to some people but there also is low awareness of its meaning, as indicated by the high percentage (20%) of people who do not know if it is influential for them.
Food choices are also affected by the tendency for people to select food based on the amount of a particular nutrient, such as fibre or saturated fat. When selecting foods based on specific nutrients, people are most often choosing food based on its composition of fibre, protein and vitamins. Since the TNT V survey there has been a modest increase in the frequency of selecting food based on all of the nutrients. The largest increase occurred with respect to the presence of trans fatty acids, with 68 per cent indicating they sometimes or often select a food based on this nutrient (versus 41% in TNT IV).
Many Canadians care about nutrition and it is clear that people care more about certain types of content and less about others. People tend to care most about the fibre, protein, vitamin, total fat and saturated fat content of their food and care the least about the iron, salt, cholesterol, carbohydrate and trans fat content.
Changes in Eating Habits
The majority of Canadians report making changes to improve or change their eating habits in the past year. While the changes are varied, they tend to fit into two broad categories: those who define their changed eating habits in terms of increasing their intake of nutritious foods such as fruits and vegetables; and those who define the change in terms of reducing the quantity of certain nutrients (particularly various types of fat).
Résumé
10
Résumé
Introduction
Ce rapport présente les résultats du Sondage 2006 sur les Tendances de consommation (Nutrition : évolution et tendances VI). L’ancien Institut national de la nutrition (L’INN) a lancé en 1989 une série d’enquêtes intitulée «Nutrition : évolution et tendances» (NÉT) pour obtenir de l’information relative aux connaissances, aux attitudes et aux comportements déclarés de la population adulte canadienne en matière de nutrition et d’alimentation. Le Conseil canadien des aliments et de la nutrition poursuit cette tradition. Chaque vague de la série (I à VI) s’est inspirée des résultats précédents et a suivi l’évolution des changements dans les attitudes, connaissances et comportements déclarés des adultes canadiens. La présente étude fait suite aux études précédentes, soit :
• NÉT I (1989) • NÉT II (1994) • NÉT III (1997) • NÉT IV (2002) • NÉT V (2004)
En plus de faire le suivi de nombreuses questions sur les connaissances, attitudes et comportements en matière de nutrition, le sondage de 2006 (NÉT VI) visait à obtenir des informations additionnelles sur l’importance des facteurs qui émergent quant aux choix alimentaires des Canadiens. De plus, la section sur l’étiquetage nutritionnel a été étendue et modifiée afin de répondre aux nouveaux formats d’étiquetage.
Le but de la série d’enquêtes NÉT a toujours été d’éclairer les décideurs, professionnels de la santé, académiciens et l’industrie de l’alimentation sur les perspectives des Canadiens quant à l’importance de la nutrition et leurs connaissances et comportements déclarés. L’enquête NÉT VI est présentée dans le même esprit, c’est-à-dire qu’elle vise à donner un aperçu qui permet de formuler des politiques, développer les communications sur le rôle des aliments et de la nutrition dans la santé, servir de guide pour les projets de recherche futurs sur la nutrition et prendre des décisions quant au développement et marketing de produits alimentaires.
Résumé
11
Résultats clés
Connaissance et compréhension de la nutrition
La connaissance est essentielle dans le monde où nous vivons et il faut faire la distinction entre l’information et la connaissance. La somme d’information et la rapidité et la variété des réseaux par lesquels cette information est communiquée ont augmenté et continuent d’augmenter. L’information provient de toutes sortes de sources qui servent à différentes fins et les connaissances que les Canadiens apportent au magasin lorsqu’ils font leurs choix alimentaires est l’aspect le plus important.
Quatre-vingt-sept pour cent des Canadiens croient qu’ils ont certaines connaissances en matière de nutrition, avec un groupe central de 26 pour cent qui se disent très bien renseignés (les informés). Les résultats demeurent pratiquement inchangés par rapport à l’enquête NÉT V. Il y aurait lieu d’augmenter la proportion des consommateurs informés et il y a un manque évident de connaissances. Les Canadiens un peu plus jeunes, les hommes et les personnes qui ont moins d’instruction doutent plus de leurs connaissances. Il y a aussi un plus grand manque de connaissances sur des sujets relativement nouveaux comme l’indice glycémique et les acides gras trans.
Les gens renseignés sont dans une meilleure position pour faire des choix alimentaires informés et les auto-évaluations fournissent un très bon indicateur prévisionnel de leurs connaissances et de leurs comportements. Ceux qui sont dans le groupe central des informés pensent et agissent différemment lorsqu’il s’agit d’alimentation et de nutrition.
• Les connaissances auto-évaluées sont un bon indicateur prévisionnel des connaissances relatives aux questions spécifiques de nutrition dans le sondage et un très bon motivateur quant aux décisions relatives à la nutrition et les choix de style de vie. Par exemple, les gens qui se disent très bien renseignés en matière de nutrition sont plus susceptibles d’être d’accord que certains types de fibres alimentaires peuvent faire baisser le taux de cholestérol dans le sang.
• Ceux qui se disent informés sont beaucoup plus susceptibles de prendre leur petit-déjeuner chaque matin que ceux qui sont moins bien renseignés.
La façon dont les gens utilisent leurs connaissances et les efforts qu’ils mettent à améliorer leur somme de connaissances reflète ce qui est important pour eux lorsqu’il s’agit de bien s’alimenter.
Résumé
12
Inquiétudes quant à l’inocuité des aliments
Il n’y a pas une question dominante ou une catégorie de questions sur l’inocuité des aliments qui préoccupe les Canadiens. Les Canadiens sont avant tout préoccupés par la manipulation, la préparation ou la conservation d’aliments (23 %), le contenu de nutriments spécifiques dans les aliments (12 %), les additifs ou autres produits chimiques dans les aliments (13 %) et l’utilisation de pesticides (13 %). Fait intéressant, les inquiétudes quant à l’utilisation de pesticides se sont avérées beaucoup plus grandes cette année (13%) que dans l’enquête NÉT V (6 %).
Information sur l’alimentation et la nutrition
L’accès à l’information sur la nutrition est essentiel si on veut être bien informé et dans une position où l’on peut faire des choix pertinents. Il se peut que certaines personnes fassent de meilleurs choix santé instinctivement, mais il y a lieu de croire qu’avec un accès plus facile à de l’information crédible il y a de plus grandes possibilités de faire des choix alimentaires qui répondent aux besoins individuels, toutes autres choses étant égales.
• Les sources auprès desquelles les Canadiens ont reçu de l’information nutritionnelle au cours de la dernière année sont plutôt variées. En tête de liste, il y a celles qui sont relativement faciles d’accès comme les étiquettes sur les produits (77 %), les médias imprimés (76 %), les amis, parents et collègues (66 %) et les médias électroniques (65 %). Peu de gens ont reçu de l’information directement d’un(e) diététiste (23 %) et seulement un peu plus de la moitié ont reçu de l’information par l’entremise de leur médecin de famille ou d’un autre professionnel de la santé (51 %).
• Les enquêtes NÉT précédentes révèlent que les principales sources d’information nutritionnelle, à l’exception des étiquettes sur les produits, ne sont pas considérées d’emblée comme étant des sources crédibles d’information nutritionnelle. Cette information est particulièrement évidente à la lumière des très hautes notes accordées à la crédibilité des professionnels de la santé (diététistes, médecins et autres) qui sont considérés comme étant très crédibles par plus des trois quarts des Canadiens.
Il semble que bon nombre de Canadiens ne se souviennent pas des allégations ou affirmations faites par les compagnies de produits alimentaires relativement aux bienfaits de leurs aliments pour la santé. Seulement 32 pour cent se souviennent d’une affirmation. Ceux qui se souviennent de quelque chose ont tendance à mettre l’accent sur le contenu en matières grasses (38 %), suivi d’allégations générales sur la santé (16 %) et de références spécifiques aux fibres ou grains entiers (14 %).
Résumé
13
Étiquetage nutritionnel
La plupart des Canadiens (77 %) continuent d’obtenir l’information nutritionnelle sur les étiquettes de produits. En général, la plupart des Canadiens consulent les étiquettes au moins à l’occasion, et il y a une faible proportion d’utilisateurs actifs d’étiquettes. Ce résultat demeure inchangé depuis l’enquête NÉT V.
• Une plus grande proportion de gens indiquent maintenant qu’ils sont capables de trouver ce qu’ils cherchent sur l’étiquette (67 % peuvent souvent trouver cette information versus 56 % dans l’enquête NÉT V).
• On lit les étiquettes principalement pour trouver de l’information sur les ingrédients et la nutrition. Cela étant dit, près de la moitié de ceux qui lisent les étiquettes disent qu’ils cherchent des allégations relatives à la santé ou cherchent un slogan, symbole ou logo «choix santé» ou «meilleur choix». On recherche clairement ces éléments précis sur les étiquettes.
• La moitié de ceux qui lisent les étiquettes cherchent souvent des aliments qui se réclament bons pour leur santé. Seulement une faible proportion de gens qui lisent les étiquettes (une personne sur quatre) cherchent activement à savoir si un aliment est biologique ou s’il a été génétiquement modifié, et ce résultat n’a pas changé au fil des ans.
Choix d’aliments
Bien que peu de gens qualifient leurs habitudes en matière de santé ou d’alimentation comme étant mauvaises, il y a un certain écart dans les évaluations de «bonnes» à «excellentes». De petits groupes de Canadiens considèrent leurs habitudes santé (15 %) ou habitudes alimentaires (10 %) comme étant excellentes. Ceux qui trouvent que leurs habitudes alimentaires sont excellentes ont tendance à mettre plus d’accent sur la nutrition.
Étant donné l’écart entre les habitudes alimentaires perçues, il est intéressant de noter que bien que l’aspect santé des aliments est associé à une série de facteurs variés, la réponse type est qu’un aliment contient un ingrédient désiré (30 %), suivi par la perception qu’un aliment contient une quantité moindre d’un ingrédient non désiré (21 %). Ces deux catégories générales sont suivies par la croyance qu’un aliment est «sain» s’il est frais, c’est-à-dire non transformé (21 %) ou s’il contient des légumes (16 %).
Lorsqu’elles choisissent des aliments, bon nombre de personnes sont motivées par des considérations de santé. Elles se préoccupent de la relation entre leur santé et leurs choix d’aliments. En général, les aspects qui ont trait à leur propre santé les motivent à faire certains choix.
Résumé
14
• Le désir de maintenir une bonne santé est le motivateur le plus important. Ce fait est intéressant puisqu’il est le moins spécifique et qu’il dépend largement de la définition que chaque personne a de ce qu’est une bonne santé. Présentement, une vaste majorité semblent penser qu’ils sont au moins en bonne santé.
• Après le maintien d’une bonne santé vient le désir d’avoir des aliments qui fournissent de l’énergie et de la résistance par le contrôle du poids et le besoin de suivre un régime prescrit.
La motivation de manger sainement soulève la question à savoir ce qui préoccupe les Canadiens lorsqu’il s’agit de nutrition et de choix d’aliments. Dans cette enquête, les préoccupations des gens ont été déterminées en leur demandant dans quelle mesure une caractéristique était importante pour eux lorsqu’ils faisaient des choix alimentaires.
• Les Canadiens accordent presque autant d’importance à la nutrition qu’au goût, et la nutrition est nettement plus importante que le coût ou l’aspect pratique lorsqu’ils choisissent leurs aliments. Comme prévu, le coût est relativement beaucoup plus important pour ceux dont le revenu familial est plus bas puisque ces gens doivent se préoccuper des prix.
Les Canadiens se préoccupent aussi de considérations relatives à l’aliment. Les résultats ici démontrent qu’ils se préoccupent de certaines caractéristiques de l’aliment (p. ex. les grains entiers) plus que de certaines autres (p. ex. un faible indice glycémique).
• Le fait qu’un aliment soit fait de grains entiers influence beaucoup les choix de 50 pour cent des Canadiens. Par conséquent, la présence de grains entiers dans un aliment le rend plus susceptible d’être choisi (les grains entiers constituent un facteur influent) parce que les gens accordent une importance à cette caractéristique.
• Après la présence de grains entiers, les caractéristiques les plus importantes, parmi celles qu’on a évaluées, semblent être la présence d’acides gras oméga-3, la présence de nutriments additionnels et le fait que l’aliment soit biologique. Un faible indice glycémique est important pour certaines personnes, mais on note aussi le peu de connaissances qu’on a de sa signification, tel qu’indiqué par le haut pourcentage (20 %) des gens qui ne savent pas si ce facteur influence leurs choix.
Les choix alimentaires sont aussi affectés par la tendance qu’ont les gens de sélectionner des aliments en fonction d’un nutriment en particulier, comme les fibres ou les gras saturés. Lorsqu’ils choisissent des aliments en fonction de nutriments spécifiques, les gens choisissent le plus souvent des aliments selon leur composition en fibres, protéines et vitamines. Depuis l’enquête NÉT V, on note une faible augmentation quant au nombre de fois qu’on sélectionne des aliments en fonction de tous les nutriments. L’augmentation la plus forte

Résumé
15
concerne la présence d’acides gras trans, 68 pour cent des gens indiquant qu’ils choisissent parfois ou souvent un aliment en fonction de ce nutriment (versus 41 % dans l’enquête NÉT IV).
Bon nombre de Canadiens se préoccupent de la nutrition et il est évident que les gens se préoccupent davantage de certains types d’ingrédients et moins de certains autres. Les gens ont tendance à se préoccuper le plus du contenu en fibres, protéines, vitamines, matières grasses et gras saturés de leurs aliments et se préoccupent le moins du contenu en fer, sel, cholestérol, glucides et gras trans.
Changements dans les habitudes alimentaires
Les majorité des Canadiens indiquent qu’ils ont fait des efforts pour améliorer ou changer leurs habitudes alimentaires au cours de la dernière année. Bien que les changements soient variés, ils ont tendance à s’inscrire dans deux grandes catégories : ceux qui définissent leurs nouvelles habitudes alimentaires en termes d’avoir augmenté leur consommation d’aliments nutritifs comme des fruits et des légumes, et ceux qui définissent le changement en termes d’avoir réduit la quantité de certains nutriments (particulièrement divers types de gras).
Methodology
16
Methodology
The Tracking Nutrition Trends (TNT) survey was first established in 1989 to examine Canadians’ perceptions of fat and fibre. The 2006 survey (TNT VI) is the sixth national survey of Canadians conducted since its establishment. The surveys have traditionally focused on the self-reported knowledge, attitudes and behaviour of adult Canadians toward food and nutrition, because the interplay between these three is key to understanding changes in how Canadian consumers view nutrition and health.
Historically, the TNT surveys attempted to examine Canadians’ perceptions of fat and fibre. Although the interest in the perception and understanding of these issues remains high, key events over the past years since the first TNT survey have necessitated expanding the focus of the TNT surveys. Most recent examples of these events are:
• The introduction of mandatory nutrition labelling;
• The identified concern about increased rates of obesity among children and adults;
• The popularity of diets and/or products such as low carbohydrate diets; and,
• The increase in availability of specialized products (which have become mainstream) such as organic foods or soy-based products.
Since the baseline study conducted in 1989, the TNT survey has continued to track key attitudes about fat and fibre, while incorporating emerging nutrition-related health issues.
The methodology for TNT VI involved a telephone survey of 2014 Canadians between May 24 and June 12, 2006. The first three iterations of the TNT survey (TNT I, TNT II and TNT III) involved personal interviews and this methodology was changed to a telephone survey with the TNT IV study (Appendix 2).
The data are weighted to be nationally representative of the Canadian population 18 years of age and older on the basis of age, gender and region (based on the 2001 Canadian Census). With a national sample of 2014, one can say with certainty that the overall results are within plus or minus 2.0 points of the actual adult population in Canada (Appendix 3). The original sample was drawn using a Plus Digit, Random Digit Dialing process to select the household. In this method, telephone numbers are randomly generated using an Advanced Plus Digit sampling procedure that ensures the inclusion of newly listed and unlisted numbers. Interviews lasted on average 20 minutes.
All fieldwork, data processing and analysis were conducted in-house by TNS Canadian Facts. The company’s roots go back to 1932 when Canadian Facts was established as the
Methodology
17
country's first survey research organization. TNS Canadian Facts, one of Canada's largest marketing and social research firms, is a full-service research company facilitating business decisions.
The survey instrument, which was designed to build on and expand previous efforts, was developed in consultation with the Canadian Council of Food and Nutrition and its advisory team.
This report presents the key findings of the survey in text and summary charts. Some of the percentages may not add to 100 because of rounding or because “don’t know” and “refused” responses are not shown. All of the comparisons between groups discussed in this study are statistically significant at the 95% confidence level using a t-test of the difference between two percentages.
Detailed Findings
18
Detailed Findings
Overall Approach
The following sections provide a more detailed analysis of the survey findings within the context of the historical trends in self-reported knowledge, attitudes and behaviours toward food and nutrition. The report is divided into six thematic sections:
• Attitudes about Food and Nutrition • Public Understanding of Nutrition • Sources of Information about Food and Nutrition • Food Product Labels • Factors Affecting Food Choices (including Self-rated Eating Habits and Health) • Lifestyle-Related Choices
The overall results for the public as a whole are provided in figures (exhibits) and tables throughout the report along with a narrative discussion of the main points. Where possible, results from previous surveys are described to identify patterns of change or stability.
To better understand the findings, differences between sub-groups of the population where they are statistically and substantively interesting are reported. Throughout the report a focus on differences in the responses to the questions is provided based on the following demographic and attitudinal groups:
• Age • Gender • Education • Income • Region and language • Knowledge about nutrition (self-rated) • Eating habits (self-rated)
Detailed Findings
19
Attitudes about Food and Nutrition
Self-rated Knowledge
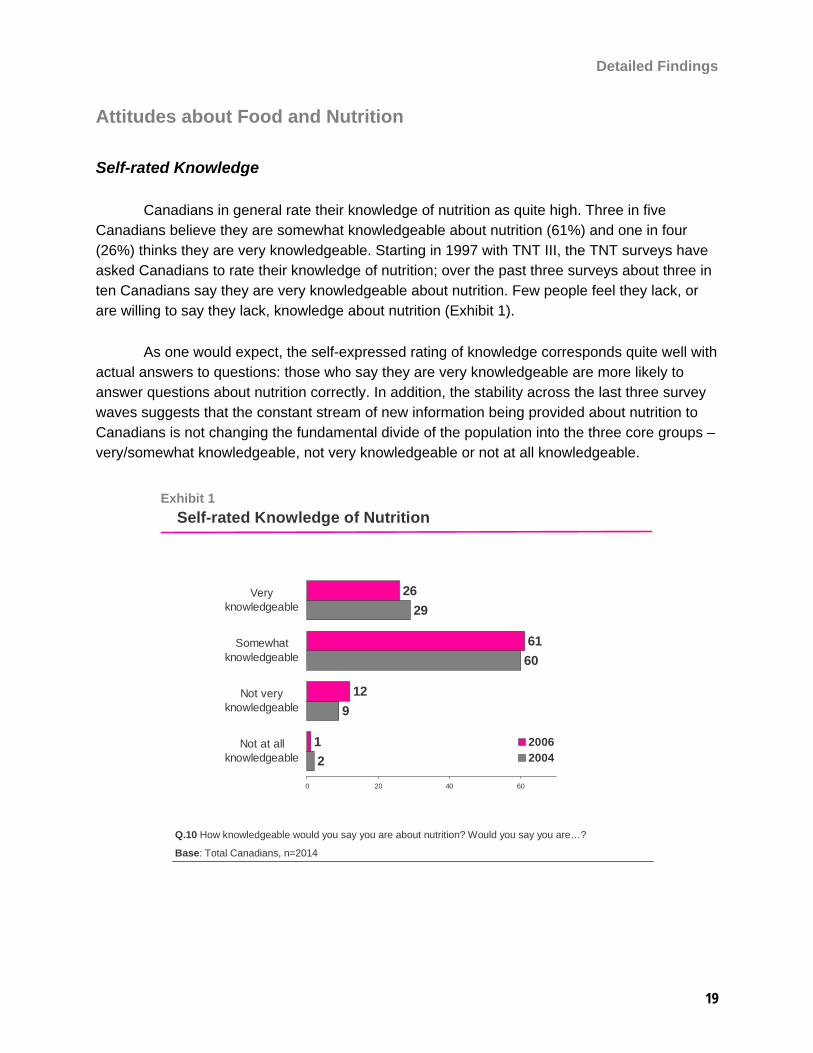
Canadians in general rate their knowledge of nutrition as quite high. Three in five Canadians believe they are somewhat knowledgeable about nutrition (61%) and one in four (26%) thinks they are very knowledgeable. Starting in 1997 with TNT III, the TNT surveys have asked Canadians to rate their knowledge of nutrition; over the past three surveys about three in ten Canadians say they are very knowledgeable about nutrition. Few people feel they lack, or are willing to say they lack, knowledge about nutrition (Exhibit 1).
As one would expect, the self-expressed rating of knowledge corresponds quite well with actual answers to questions: those who say they are very knowledgeable are more likely to answer questions about nutrition correctly. In addition, the stability across the last three survey waves suggests that the constant stream of new information being provided about nutrition to Canadians is not changing the fundamental divide of the population into the three core groups – very/somewhat knowledgeable, not very knowledgeable or not at all knowledgeable.
Exhibit 1Self-rated Knowledge of Nutrition
Q.10 How knowledgeable would you say you are about nutrition? Would you say you are…?
Base: Total Canadians, n=2014
2
9
60
29
1
12
61
26
0 20 40 60
Not at allknowledgeable
Not veryknowledgeable
Somewhatknowledgeable
Veryknowledgeable
20062004
Detailed Findings
20
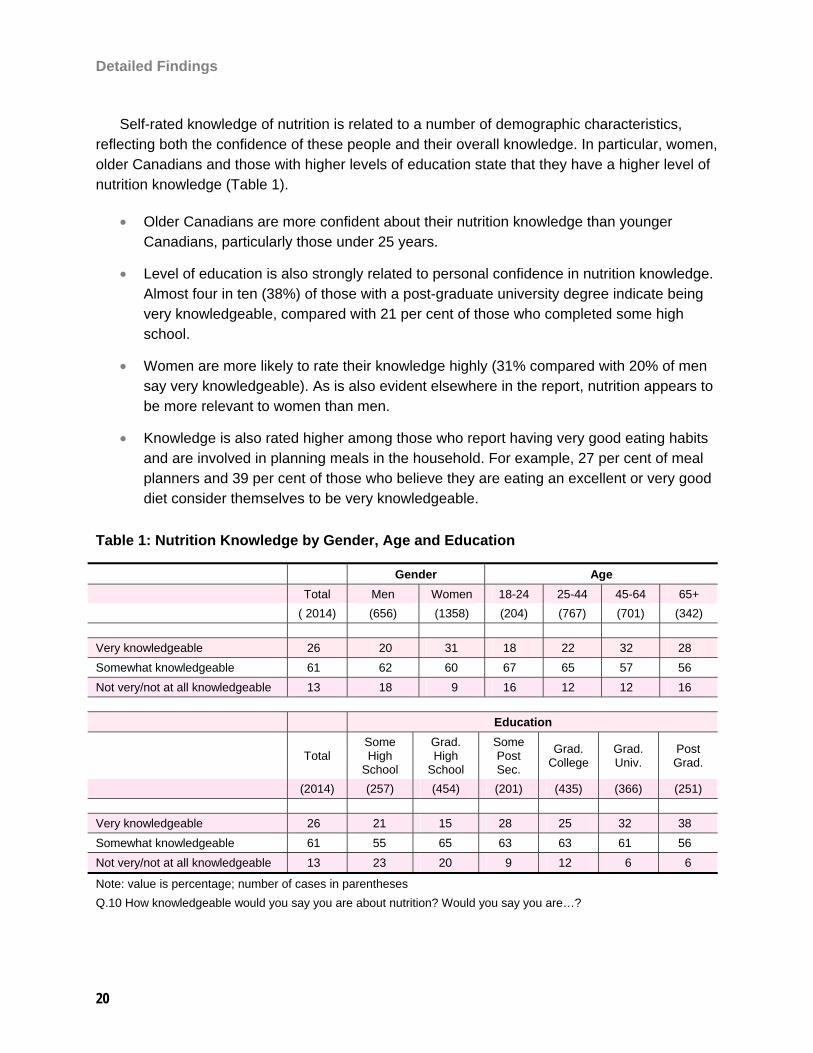
Self-rated knowledge of nutrition is related to a number of demographic characteristics, reflecting both the confidence of these people and their overall knowledge. In particular, women, older Canadians and those with higher levels of education state that they have a higher level of nutrition knowledge (Table 1).
• Older Canadians are more confident about their nutrition knowledge than younger Canadians, particularly those under 25 years.
• Level of education is also strongly related to personal confidence in nutrition knowledge. Almost four in ten (38%) of those with a post-graduate university degree indicate being very knowledgeable, compared with 21 per cent of those who completed some high school.
• Women are more likely to rate their knowledge highly (31% compared with 20% of men say very knowledgeable). As is also evident elsewhere in the report, nutrition appears to be more relevant to women than men.
• Knowledge is also rated higher among those who report having very good eating habits and are involved in planning meals in the household. For example, 27 per cent of meal planners and 39 per cent of those who believe they are eating an excellent or very good diet consider themselves to be very knowledgeable.
Table 1: Nutrition Knowledge by Gender, Age and Education
Gender Age Total Men Women 18-24 25-44 45-64 65+ ( 2014) (656) (1358) (204) (767) (701) (342)
Very knowledgeable 26 20 31 18 22 32 28 Somewhat knowledgeable 61 62 60 67 65 57 56 Not very/not at all knowledgeable 13 18 9 16 12 12 16
Education
Total Some High
School
Grad. High
School
Some Post Sec.
Grad. College
Grad. Univ.
Post Grad.
(2014) (257) (454) (201) (435) (366) (251)
Very knowledgeable 26 21 15 28 25 32 38 Somewhat knowledgeable 61 55 65 63 63 61 56 Not very/not at all knowledgeable 13 23 20 9 12 6 6
Note: value is percentage; number of cases in parentheses Q.10 How knowledgeable would you say you are about nutrition? Would you say you are…?
Detailed Findings
21
Food Safety Concerns
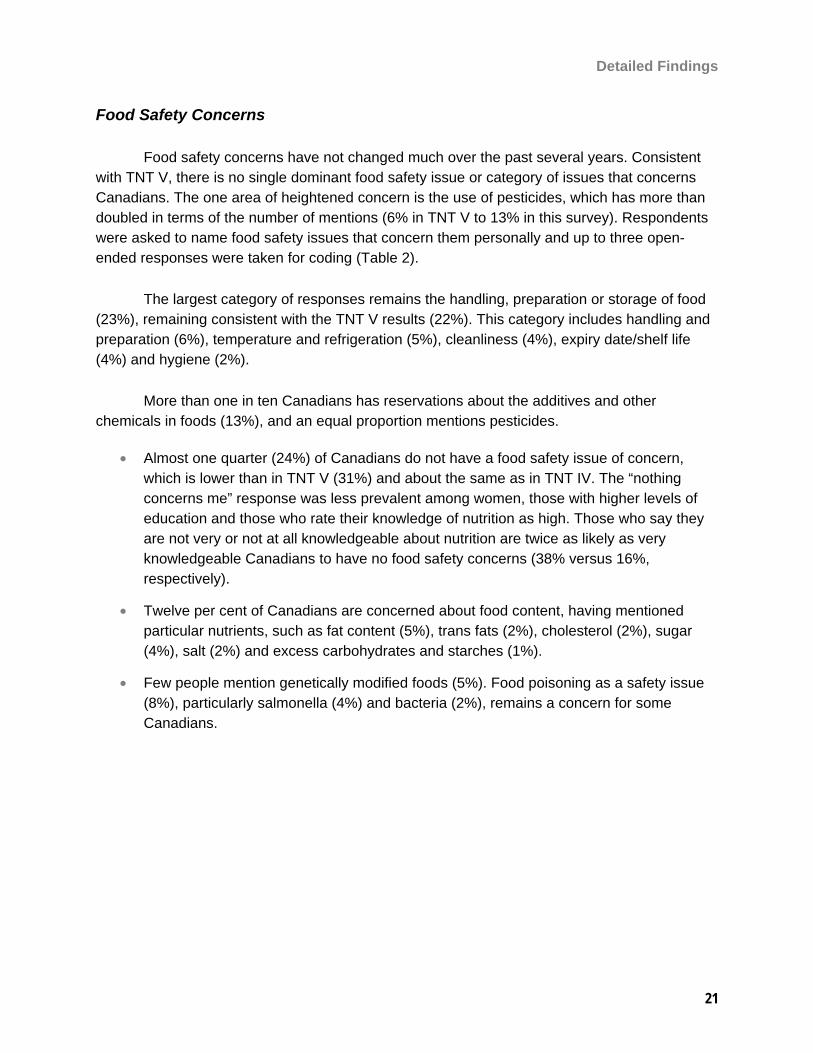
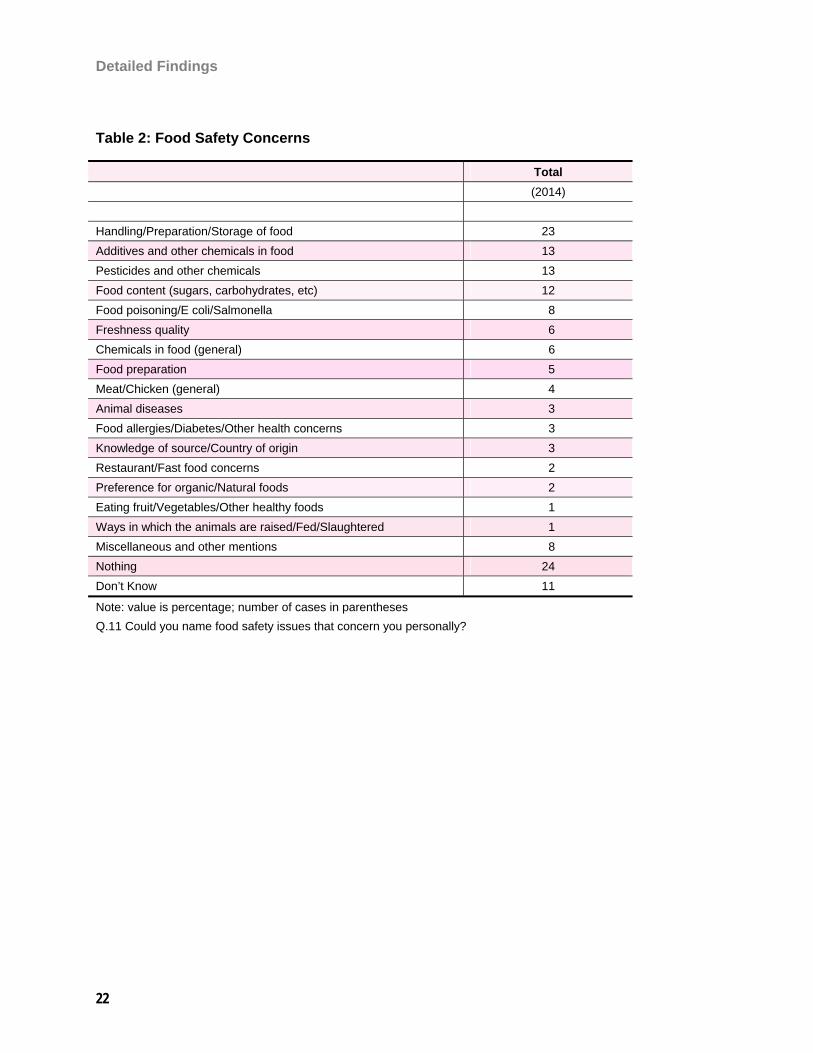
Food safety concerns have not changed much over the past several years. Consistent with TNT V, there is no single dominant food safety issue or category of issues that concerns Canadians. The one area of heightened concern is the use of pesticides, which has more than doubled in terms of the number of mentions (6% in TNT V to 13% in this survey). Respondents were asked to name food safety issues that concern them personally and up to three open-ended responses were taken for coding (Table 2).
The largest category of responses remains the handling, preparation or storage of food (23%), remaining consistent with the TNT V results (22%). This category includes handling and preparation (6%), temperature and refrigeration (5%), cleanliness (4%), expiry date/shelf life (4%) and hygiene (2%).
More than one in ten Canadians has reservations about the additives and other chemicals in foods (13%), and an equal proportion mentions pesticides.
• Almost one quarter (24%) of Canadians do not have a food safety issue of concern, which is lower than in TNT V (31%) and about the same as in TNT IV. The “nothing concerns me” response was less prevalent among women, those with higher levels of education and those who rate their knowledge of nutrition as high. Those who say they are not very or not at all knowledgeable about nutrition are twice as likely as very knowledgeable Canadians to have no food safety concerns (38% versus 16%, respectively).
• Twelve per cent of Canadians are concerned about food content, having mentioned particular nutrients, such as fat content (5%), trans fats (2%), cholesterol (2%), sugar (4%), salt (2%) and excess carbohydrates and starches (1%).
• Few people mention genetically modified foods (5%). Food poisoning as a safety issue (8%), particularly salmonella (4%) and bacteria (2%), remains a concern for some Canadians.
Detailed Findings
22
Table 2: Food Safety Concerns
Total (2014) Handling/Preparation/Storage of food 23 Additives and other chemicals in food 13 Pesticides and other chemicals 13 Food content (sugars, carbohydrates, etc) 12 Food poisoning/E coli/Salmonella 8 Freshness quality 6 Chemicals in food (general) 6 Food preparation 5 Meat/Chicken (general) 4 Animal diseases 3 Food allergies/Diabetes/Other health concerns 3 Knowledge of source/Country of origin 3 Restaurant/Fast food concerns 2 Preference for organic/Natural foods 2 Eating fruit/Vegetables/Other healthy foods 1 Ways in which the animals are raised/Fed/Slaughtered 1 Miscellaneous and other mentions 8 Nothing 24 Don’t Know 11
Note: value is percentage; number of cases in parentheses Q.11 Could you name food safety issues that concern you personally?
Detailed Findings
23
Public Understanding of Nutrition
As noted earlier, 26 per cent of Canadians consider themselves to be very knowledgeable about nutrition. However, self-reported knowledge is reliant on a good self-assessment, which is fairly closely related to how a person understands nutrition. People who think they are more knowledgeable appear to be able to understand nutrition more completely.
To better gauge Canadians’ knowledge of nutrition, we asked people to agree or disagree with nine nutrition-related statements. The statements cover a range of areas including some that have recently received fairly high levels of media attention, such as trans fatty acids. While in some cases trend information is available from the earlier surveys, many of the questions have been changed to address these emerging topics or to make the questions more relevant to current nutrition issues.
This section is divided into six nutrition-related themes, ordered as follows: dietary fibre; carbohydrates and the glycemic index; cholesterol; fat content of margarine and butter; trans fatty acids; and omega-3 fatty acids.
Dietary Fibre
Two of the statements used to gauge the knowledge of Canadians about nutrition relate to the role of dietary fibre in the body; both have been tracked since TNT I. Canadians were asked if “Some types of dietary fibre can help reduce cholesterol in your blood“ and if “A high fibre diet may help prevent colon cancer“. It is apparent that there is a clear understanding of dietary fibre that has not shifted substantively over the years.
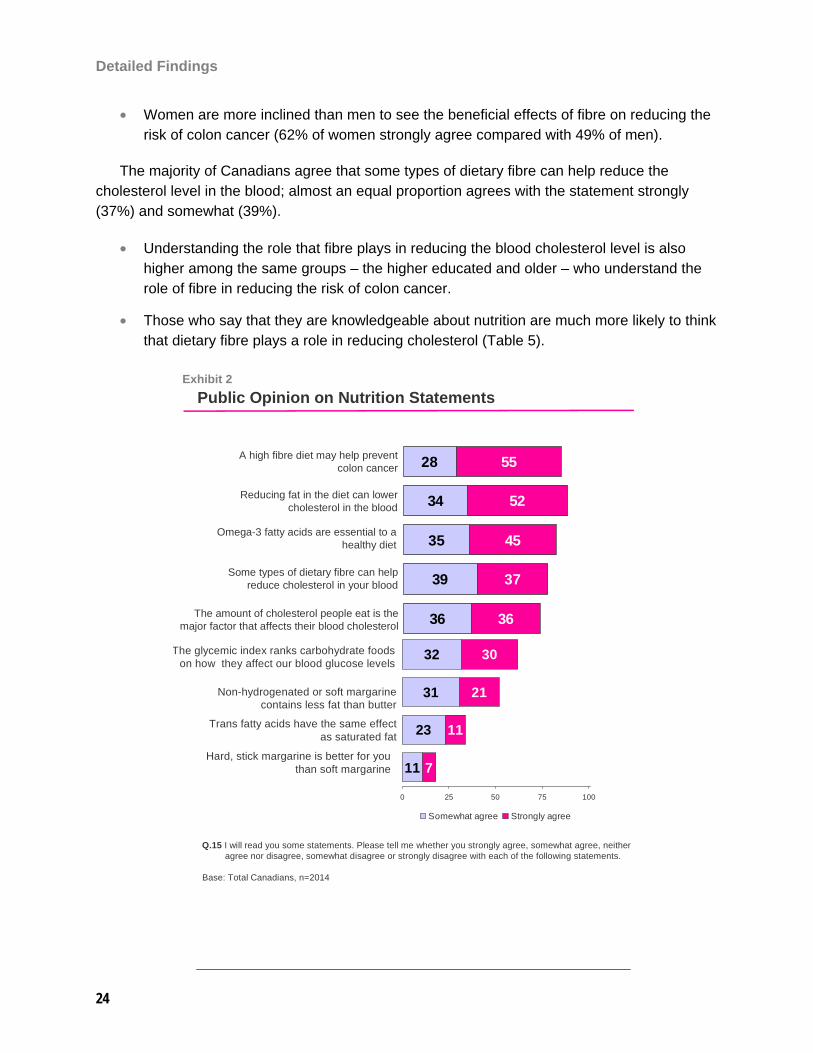
Canadians believe that a high fibre diet helps to prevent colon cancer. One in two Canadians strongly agree and one in four somewhat agree that a high fibre diet plays this role compared with only a small number who disagree (Exhibit 2). This is virtually unchanged over the past 17 years (Table 3).
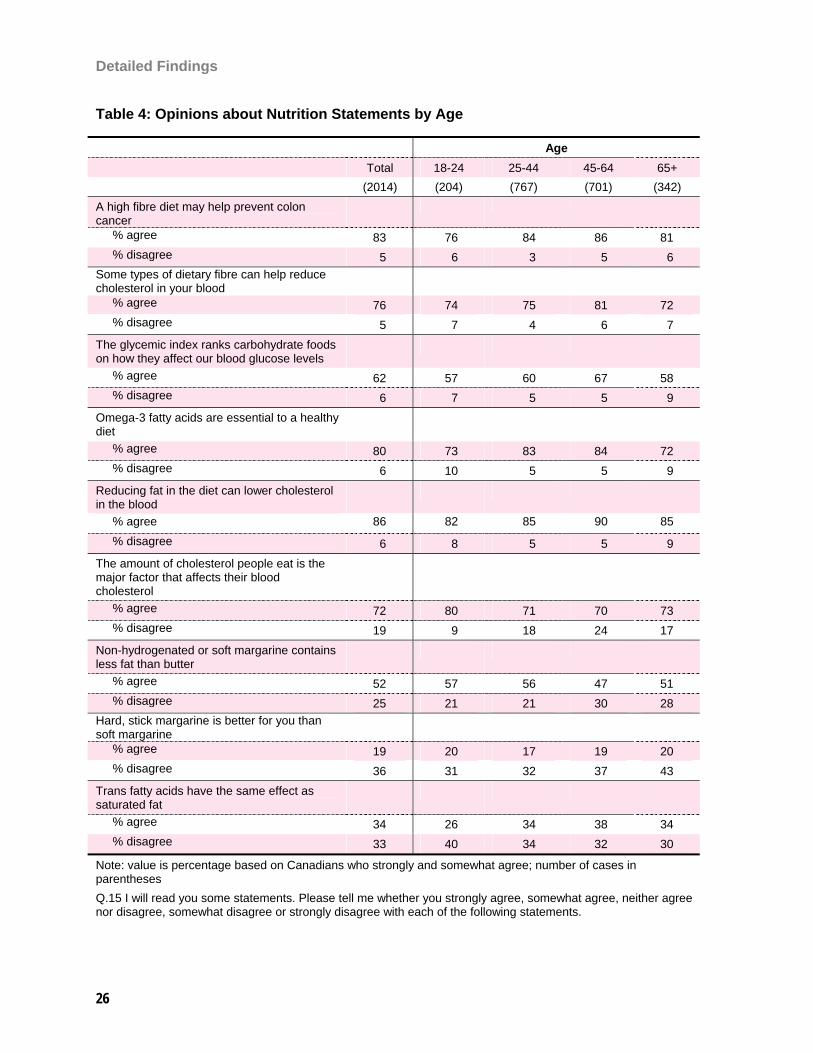
• Younger Canadians (Table 4) are less likely to agree (76% of those under 25 agree), especially compared with the middle age groups, 25 to 44 (84%) and 45 to 64 (86%). The age-related difference is associated with a higher percentage of “don’t know” or neutral responses among younger people.
• Although a majority of those in all education groups agree with the statement, agreement is higher among those with higher education. For example, Canadians with no more than a high school education are less likely to agree (74%) compared with those with an undergraduate education (81%).
Detailed Findings
24
• Women are more inclined than men to see the beneficial effects of fibre on reducing the risk of colon cancer (62% of women strongly agree compared with 49% of men).
The majority of Canadians agree that some types of dietary fibre can help reduce the cholesterol level in the blood; almost an equal proportion agrees with the statement strongly (37%) and somewhat (39%).
• Understanding the role that fibre plays in reducing the blood cholesterol level is also higher among the same groups – the higher educated and older – who understand the role of fibre in reducing the risk of colon cancer.
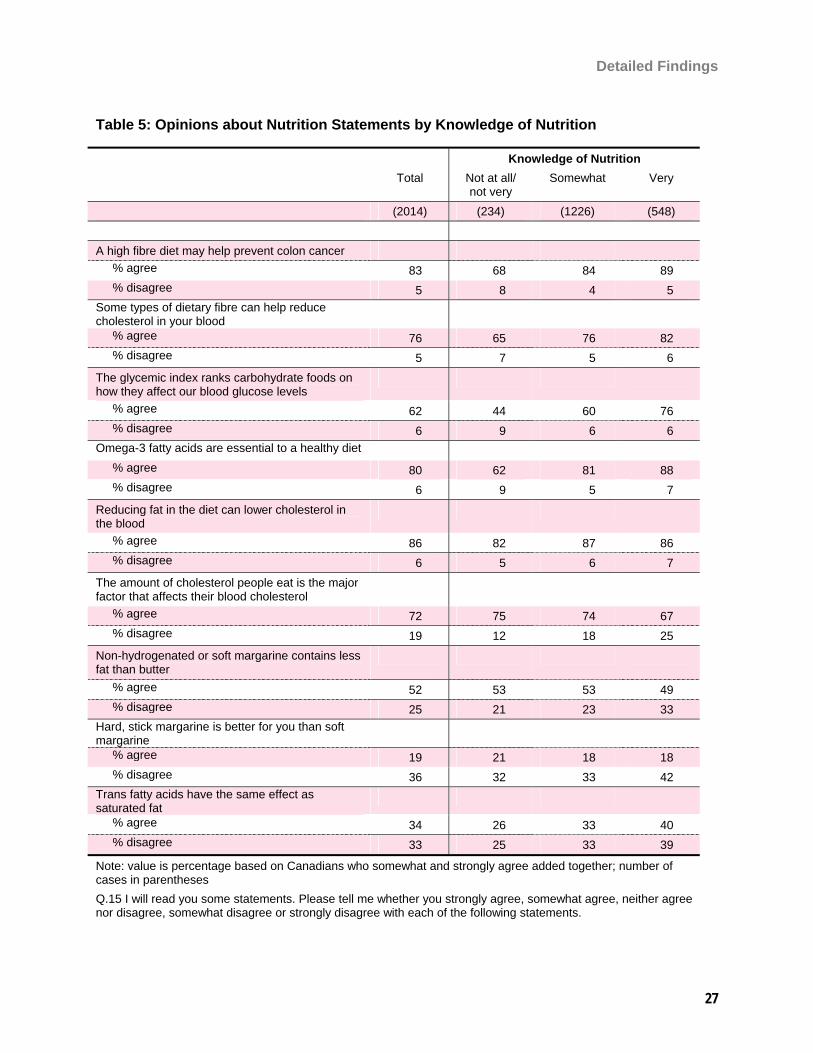
• Those who say that they are knowledgeable about nutrition are much more likely to think that dietary fibre plays a role in reducing cholesterol (Table 5).
Exhibit 2Public Opinion on Nutrition Statements
36
39
35
34
28
36
37
45
52
55
0 25 50 75 100
Somewhat agree Strongly agree
Reducing fat in the diet can lower cholesterol in the blood
Omega-3 fatty acids are essential to a healthy diet
Some types of dietary fibre can help reduce cholesterol in your blood
A high fibre diet may help prevent colon cancer
The amount of cholesterol people eat is the major factor that affects their blood cholesterol
11
23
31
32
7
11
21
30
0 25 50 75 100
Somewhat agree Strongly agree
Q.15 I will read you some statements. Please tell me whether you strongly agree, somewhat agree, neither agree nor disagree, somewhat disagree or strongly disagree with each of the following statements.
Base: Total Canadians, n=2014
Non-hydrogenated or soft margarine contains less fat than butter
Trans fatty acids have the same effect as saturated fat
Hard, stick margarine is better for you than soft margarine
The glycemic index ranks carbohydrate foods on how they affect our blood glucose levels
Detailed Findings
25
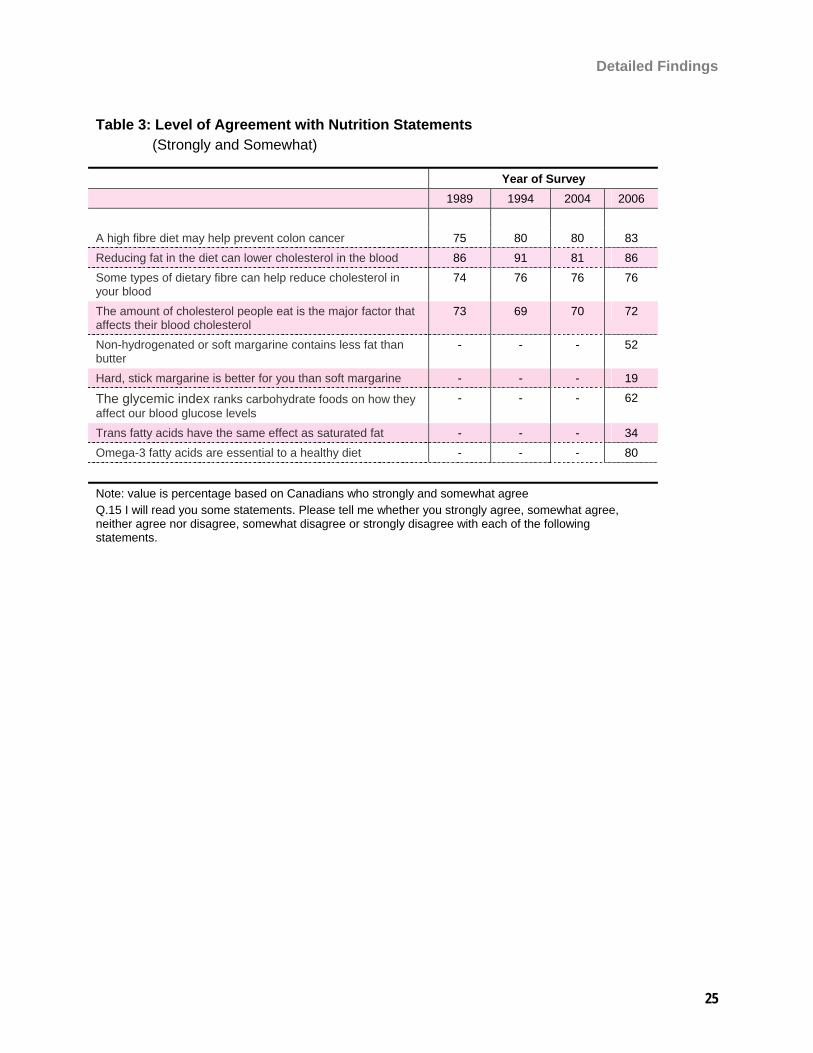
Table 3: Level of Agreement with Nutrition Statements (Strongly and Somewhat)
Year of Survey 1989 1994 2004 2006 A high fibre diet may help prevent colon cancer 75 80 80 83 Reducing fat in the diet can lower cholesterol in the blood 86 91 81 86 Some types of dietary fibre can help reduce cholesterol in your blood
74 76 76 76
The amount of cholesterol people eat is the major factor that affects their blood cholesterol
73 69 70 72
Non-hydrogenated or soft margarine contains less fat than butter
- - - 52
Hard, stick margarine is better for you than soft margarine - - - 19
The glycemic index ranks carbohydrate foods on how they affect our blood glucose levels
- - - 62
Trans fatty acids have the same effect as saturated fat - - - 34 Omega-3 fatty acids are essential to a healthy diet - - - 80
Note: value is percentage based on Canadians who strongly and somewhat agree Q.15 I will read you some statements. Please tell me whether you strongly agree, somewhat agree, neither agree nor disagree, somewhat disagree or strongly disagree with each of the following statements.
Detailed Findings
26
Table 4: Opinions about Nutrition Statements by Age
Age Total 18-24 25-44 45-64 65+ (2014) (204) (767) (701) (342) A high fibre diet may help prevent colon cancer
% agree 83 76 84 86 81 % disagree 5 6 3 5 6 Some types of dietary fibre can help reduce cholesterol in your blood
% agree 76 74 75 81 72 % disagree 5 7 4 6 7 The glycemic index ranks carbohydrate foods on how they affect our blood glucose levels
% agree 62 57 60 67 58 % disagree 6 7 5 5 9 Omega-3 fatty acids are essential to a healthy diet
% agree 80 73 83 84 72 % disagree 6 10 5 5 9 Reducing fat in the diet can lower cholesterol in the blood
% agree 86 82 85 90 85 % disagree 6 8 5 5 9 The amount of cholesterol people eat is the major factor that affects their blood cholesterol
% agree 72 80 71 70 73 % disagree 19 9 18 24 17 Non-hydrogenated or soft margarine contains less fat than butter
% agree 52 57 56 47 51 % disagree 25 21 21 30 28 Hard, stick margarine is better for you than soft margarine
% agree 19 20 17 19 20 % disagree 36 31 32 37 43 Trans fatty acids have the same effect as saturated fat
% agree 34 26 34 38 34 % disagree 33 40 34 32 30
Note: value is percentage based on Canadians who strongly and somewhat agree; number of cases in parentheses Q.15 I will read you some statements. Please tell me whether you strongly agree, somewhat agree, neither agree nor disagree, somewhat disagree or strongly disagree with each of the following statements.
Detailed Findings
27
Table 5: Opinions about Nutrition Statements by Knowledge of Nutrition
Knowledge of Nutrition Total Not at all/
not very Somewhat Very
(2014) (234) (1226) (548) A high fibre diet may help prevent colon cancer % agree 83 68 84 89 % disagree 5 8 4 5 Some types of dietary fibre can help reduce cholesterol in your blood
% agree 76 65 76 82 % disagree 5 7 5 6 The glycemic index ranks carbohydrate foods on how they affect our blood glucose levels
% agree 62 44 60 76 % disagree 6 9 6 6 Omega-3 fatty acids are essential to a healthy diet % agree 80 62 81 88 % disagree 6 9 5 7 Reducing fat in the diet can lower cholesterol in the blood
% agree 86 82 87 86 % disagree 6 5 6 7 The amount of cholesterol people eat is the major factor that affects their blood cholesterol
% agree 72 75 74 67 % disagree 19 12 18 25 Non-hydrogenated or soft margarine contains less fat than butter
% agree 52 53 53 49 % disagree 25 21 23 33 Hard, stick margarine is better for you than soft margarine
% agree 19 21 18 18 % disagree 36 32 33 42 Trans fatty acids have the same effect as saturated fat
% agree 34 26 33 40 % disagree 33 25 33 39
Note: value is percentage based on Canadians who somewhat and strongly agree added together; number of cases in parentheses Q.15 I will read you some statements. Please tell me whether you strongly agree, somewhat agree, neither agree nor disagree, somewhat disagree or strongly disagree with each of the following statements.
Detailed Findings
28
Carbohydrates and the Glycemic Index
New to the TNT survey, Canadians were asked if “The Glycemic Index ranks carbohydrate foods on how they affect our blood glucose levels”. Most Canadians (62%) seem to have some knowledge of the glycemic index and understand its purpose (Exhibit 2). Thirty-eight per cent do not think it ranks carbohydrates (17%) or say they do not know (21%). These results suggest that a substantive proportion of the population has low awareness of the glycemic index or its function.
• Those aged 45 to 64 years tend to be the most likely age group (Table 4) to know the role of the glycemic index (67% agree with the statement).
• Similar to the results for the role of dietary fibre, there is a modest relationship between knowledge and education; people with higher levels of education are more likely to know the role of the glycemic index. For example, Canadians with a university education are more likely to strongly agree (38%) compared with those with high school or less education (27%).
• Those who are confident about their own nutrition knowledge are more likely to identify the role of the glyecemic index (Table 5). In contrast, those who identify themselves as having limited knowledge of nutrition are almost three times as likely (30%) as Canadians who are knowledgeable about nutrition (12%) to not know about the glycemic index or its function.
Cholesterol
As noted earlier, a majority of Canadians agree that some types of dietary fibre can reduce cholesterol in the blood. While previous TNT surveys have shown that Canadians understand the role that dietary fat plays in one’s blood cholesterol level, when asked if “Reducing fat in the diet can lower cholesterol in the blood” there is less knowledge about the role of diet versus lifestyle and other factors affecting a person’s blood cholesterol level.
Eighty-six per cent think that reducing fat in the diet can lower cholesterol in the blood. Among those who agree, one in two strongly agrees (52%). Although the proportion of respondents who agree rose in TNT VI after faltering slightly in TNT V, the overall trend is flat.
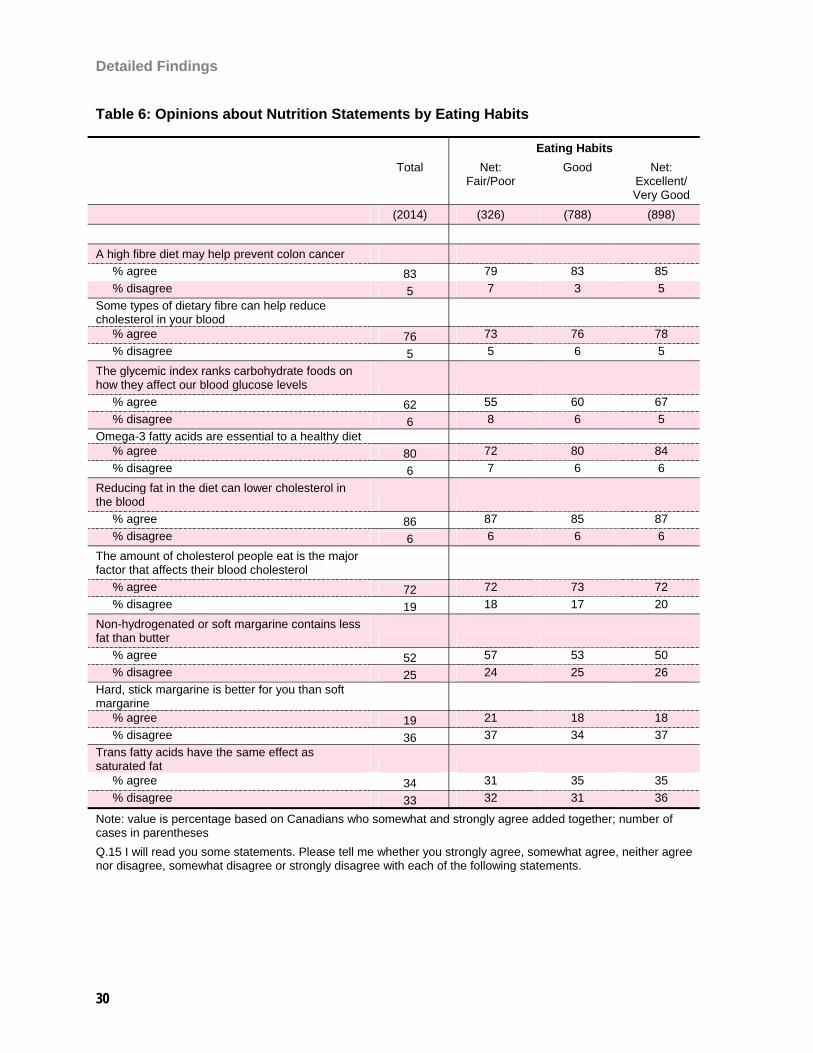
• In general, the better one’s self-reported eating habits the more one understands the relationship between blood cholesterol level and dietary fat (Table 6).
• Self-reported knowledge of nutrition is also related to understanding the relationship between blood cholesterol and dietary fat.
Detailed Findings
29
Seven in ten people believe that the amount of cholesterol that people eat is the major factor that affects their blood cholesterol; this has not changed since earlier surveys (Table 3).
• Though a majority of all groups agree with this statement, people with higher levels of education are slightly more likely to disagree (25% of post-graduates versus 13% with high school or less).
• Almost one in four people (25%) who consider themselves very knowledgeable about nutrition do not think that the amount of cholesterol people eat is the major factor, compared with 12 per cent of those who consider themselves not at all or not very knowledgeable about nutrition (Table 5).
Detailed Findings
30
Table 6: Opinions about Nutrition Statements by Eating Habits
Eating Habits Total Net:
Fair/Poor Good Net:
Excellent/ Very Good
(2014) (326) (788) (898) A high fibre diet may help prevent colon cancer % agree 83 79 83 85 % disagree 5 7 3 5 Some types of dietary fibre can help reduce cholesterol in your blood % agree 76 73 76 78 % disagree 5 5 6 5 The glycemic index ranks carbohydrate foods on how they affect our blood glucose levels % agree 62 55 60 67 % disagree 6 8 6 5 Omega-3 fatty acids are essential to a healthy diet % agree 80 72 80 84 % disagree 6 7 6 6 Reducing fat in the diet can lower cholesterol in the blood % agree 86 87 85 87 % disagree 6 6 6 6 The amount of cholesterol people eat is the major factor that affects their blood cholesterol % agree 72 72 73 72 % disagree 19 18 17 20 Non-hydrogenated or soft margarine contains less fat than butter % agree 52 57 53 50 % disagree 25 24 25 26 Hard, stick margarine is better for you than soft margarine % agree 19 21 18 18 % disagree 36 37 34 37 Trans fatty acids have the same effect as saturated fat % agree 34 31 35 35 % disagree 33 32 31 36
Note: value is percentage based on Canadians who somewhat and strongly agree added together; number of cases in parentheses Q.15 I will read you some statements. Please tell me whether you strongly agree, somewhat agree, neither agree nor disagree, somewhat disagree or strongly disagree with each of the following statements.
Detailed Findings
31
Fat Content of Margarine and Butter
Previous TNT studies (TNT IV and TNT V) have shown a large difference of opinion among Canadians about the difference in the amount of fat in margarine versus in butter. In TNT II, one in two (50%) believed margarine contains the same amount of fat as butter does.
Given the significant changes to margarine in the past decade, two new agreement questions were added to the survey for 2006:1
• “Non-hydrogenated or soft margarine contains less fat than butter”, and
• “Hard, stick margarine is better for you than soft margarine”.
Half of Canadians (52%) think that non-hydrogenated or soft margarine contains less fat than butter while few Canadians (19%) think that hard, stick margarine is better for you than soft margarine (Exhibit 2). However, a greater percentage (26%) is uncertain about whether soft margarine is better than hard, stick margarine as reflected in their “don’t know” response to the question. These results indicate that many Canadians are uncertain or uninformed about the distinctions between the various types of margarine and butter, and the fat content of these products.
• Those with some high school or less education (30%) are more likely to think that non-hydrogenated or soft margarine contains less fat than butter compared with Canadians with at least post-secondary education (ranges between 20% and 14%).
• As one might suspect, those who rate their nutrition knowledge highly, more strongly disagree with the statement that hard, stick margarine is better for you than soft margarine (42%) compared with those who claim to have limited knowledge (32%).
• Residents of the Atlantic region are most likely to disagree (42%) with hard, stick margarine being better for you than soft margarine, while those from Quebec are least likely to disagree (30%).
1 One of the reasons for these two new agreement questions is that margarine has clearly become a more complex food over the past few years and to treat it monolithically may not be a useful approach going forward.
Detailed Findings
32
Trans Fatty Acids
Trans fat was introduced in foods as a replacement for saturated fat. Its health effects have since been found to be similar to those of saturated fat in that its consumption can increase the risk of heart disease. One in five respondents (21%) does not know whether trans fatty acids have the same role as saturated fat, and an additional one in ten (11%) neither agrees nor disagrees. In TNT V a slightly different question wording was used: “Trans fatty acids have about the same role in the diet as do saturated fats” compared with the current “Trans fatty acids have the same effect as saturated fat“. Although the changed question wording means that we need to treat any comparison with caution, the results from 2004 (36% agree and 21% do not know), suggest that awareness has not increased over the past two years.
• Education is associated with a higher level of disagreement with the TNT VI statement and a lower level of uncertainty (fewer “don’t know” responses). For example, four in ten of those with a graduate degree disagree, compared with three in ten of those with a high school or less education.
• Interestingly, those who claim to be very knowledgeable about nutrition are equally likely to agree (Table 5) as they are to disagree with the statement (40% and 39%, respectively).
Omega-3 Fatty Acids
Omega-3 fatty acids recently have received exposure in the media. Consumption of this specific type of fatty acids is essential for good health because the body cannot synthesize it naturally. Although the TNT VI statement “Omega-3 fatty acids are essential to a healthy diet“ is general in approach, it is the overall consensus among the population that omega-3 fatty acids are essential to a healthy diet (80%). Less than one respondent in ten is not familiar with the essentiality of omega-3 in a healthy diet (9%).
• Those between the ages of 45 and 64 years (52%) are most likely to understand that omega-3 fatty acids are essential in a healthy diet, compared with Canadians in the 18 to 24 year age group (32%).
• A high socioeconomic status – education and household income – is also associated with the strong belief that omega-3 fatty acids are essential to a healthy diet.
Detailed Findings
33
Sources of Information about Food and Nutrition
Source of Food and Nutrition Information
Today, consumers have a wide range of potential sources of food and nutrition information. Canadians were asked whether they personally got information from eleven sources during the past year, which represented a slightly reduced list than used in previous surveys.2 Most Canadians continue to obtain their food and nutrition information from sources that are accessible and timely, such as food product labels, as compared with other methods (e.g. family physician/health professional and government materials).
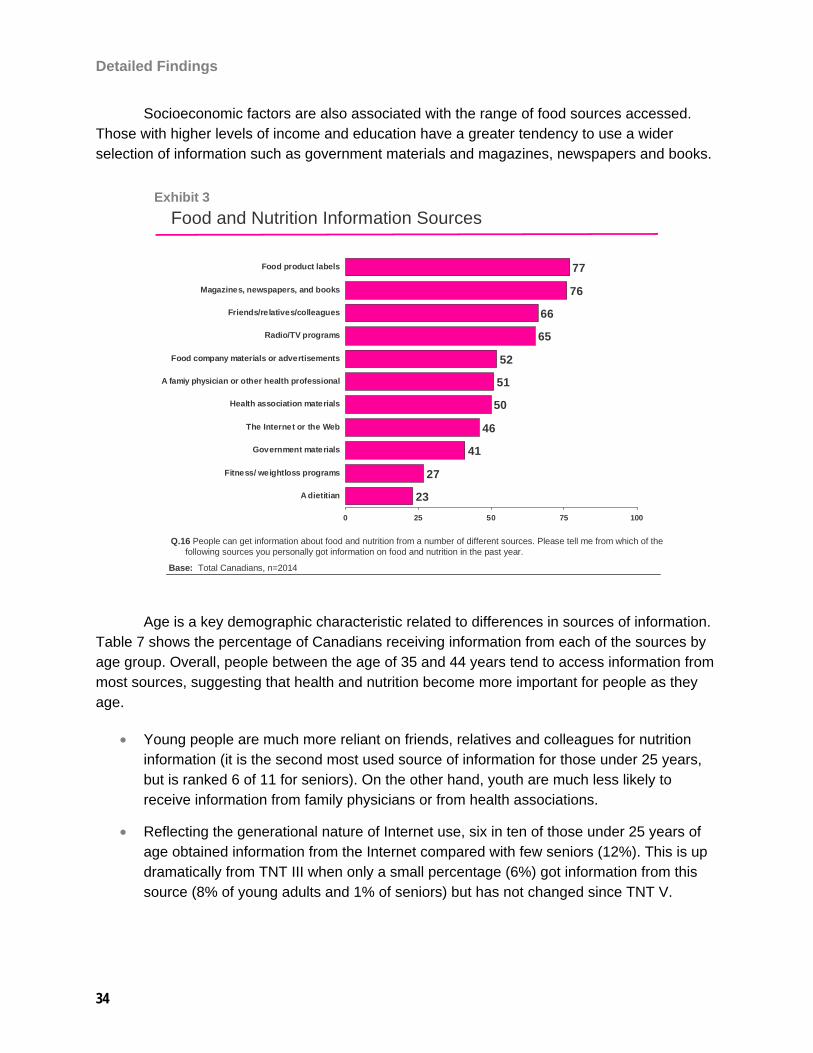
Exhibit 3 ranks the information sources by the proportion of Canadians who indicated receiving health and nutrition information from them in the previous year.
The sources that most people use (used by more than two in three) include product labels (77%), people in one’s social sphere (66%), print media (magazines, newspapers and books; 76%) and electronic media (radio/television programs; 65%). These rankings have remained relatively constant over the years.
• Many Canadians also receive information from health personnel, such as a health association (50%), or a family physician or another health professional (51%). Older Canadians (52% of seniors versus 40% of those under 25 years) and women (54%) are more likely to get information from a family physician.
• Related to, but clearly different than labels, 52 per cent receive information from food company materials or advertisements. This is similar to the results for “food advertisements” (52%) in TNT V but not for the more general “food company materials” (36%).
• The least likely sources of information are specialty type sources such as dietitians (23%) and fitness programs (27%).
• A number of other sources are used by a significant proportion of Canadians. Forty-six per cent use the Internet and 41 per cent use government materials; both of these are modest upward shifts (3 points higher than in TNT V).
2 Changes in TNT VI include: books are merged with magazines and newspapers; family physician is merged with other health professionals; food company materials is merged with advertisements; and nutritionist is no longer included with dietitian.
Detailed Findings
34
Socioeconomic factors are also associated with the range of food sources accessed. Those with higher levels of income and education have a greater tendency to use a wider selection of information such as government materials and magazines, newspapers and books.
Exhibit 3Food and Nutrition Information Sources
23
27
41
46
50
51
52
65
66
76
77
0 25 50 75 100
A dietitian
Fitness/ weightloss programs
Government materials
The Internet or the Web
Health association materials
A famiy physician or other health professional
Food company materials or advertisements
Radio/TV programs
Friends/relatives/colleagues
Magazines, newspapers, and books
Food product labels
Q.16 People can get information about food and nutrition from a number of different sources. Please tell me from which of the following sources you personally got information on food and nutrition in the past year.
Base: Total Canadians, n=2014
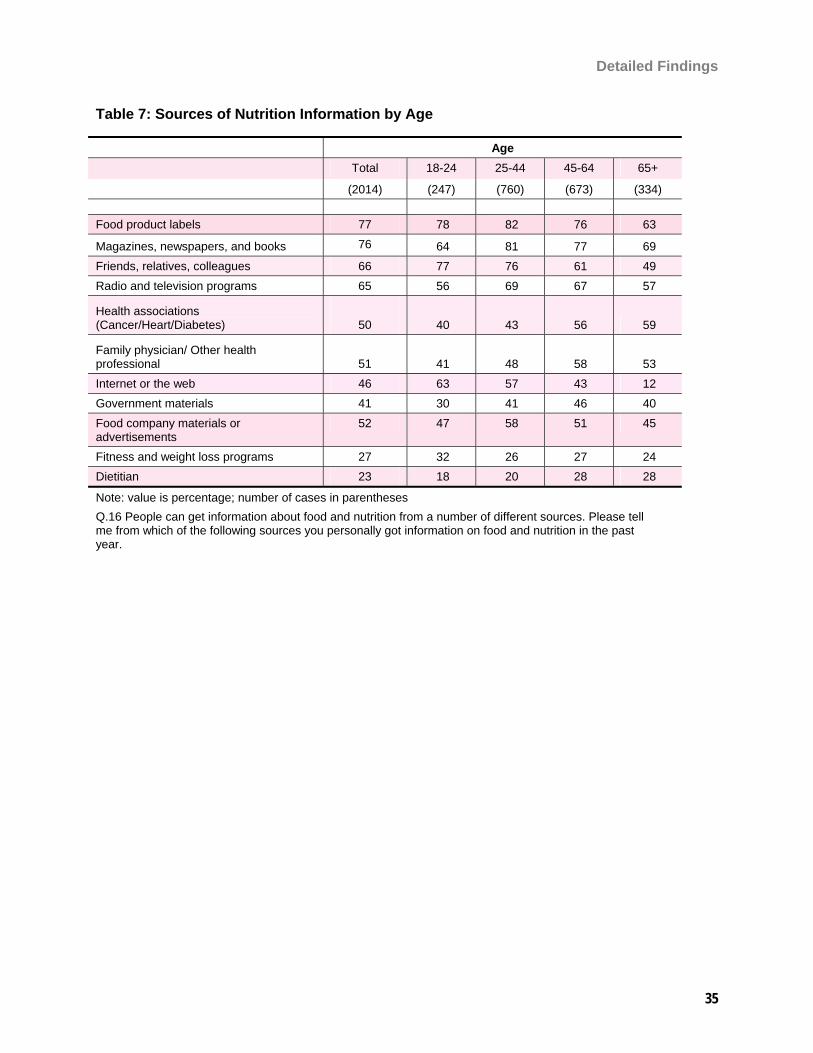
Age is a key demographic characteristic related to differences in sources of information. Table 7 shows the percentage of Canadians receiving information from each of the sources by age group. Overall, people between the age of 35 and 44 years tend to access information from most sources, suggesting that health and nutrition become more important for people as they age.
• Young people are much more reliant on friends, relatives and colleagues for nutrition information (it is the second most used source of information for those under 25 years, but is ranked 6 of 11 for seniors). On the other hand, youth are much less likely to receive information from family physicians or from health associations.
• Reflecting the generational nature of Internet use, six in ten of those under 25 years of age obtained information from the Internet compared with few seniors (12%). This is up dramatically from TNT III when only a small percentage (6%) got information from this source (8% of young adults and 1% of seniors) but has not changed since TNT V.
Detailed Findings
35
Table 7: Sources of Nutrition Information by Age
Age Total 18-24 25-44 45-64 65+
(2014) (247) (760) (673) (334) Food product labels 77 78 82 76 63
Magazines, newspapers, and books 76 64 81 77 69 Friends, relatives, colleagues 66 77 76 61 49 Radio and television programs 65 56 69 67 57
Health associations (Cancer/Heart/Diabetes)
50 40 43 56 59
Family physician/ Other health professional
51 41 48 58 53
Internet or the web 46 63 57 43 12 Government materials 41 30 41 46 40 Food company materials or advertisements
52 47 58 51 45
Fitness and weight loss programs 27 32 26 27 24 Dietitian 23 18 20 28 28
Note: value is percentage; number of cases in parentheses Q.16 People can get information about food and nutrition from a number of different sources. Please tell me from which of the following sources you personally got information on food and nutrition in the past year.
Detailed Findings
36
Recall of Specific Health Claims or Statements (Past Year)
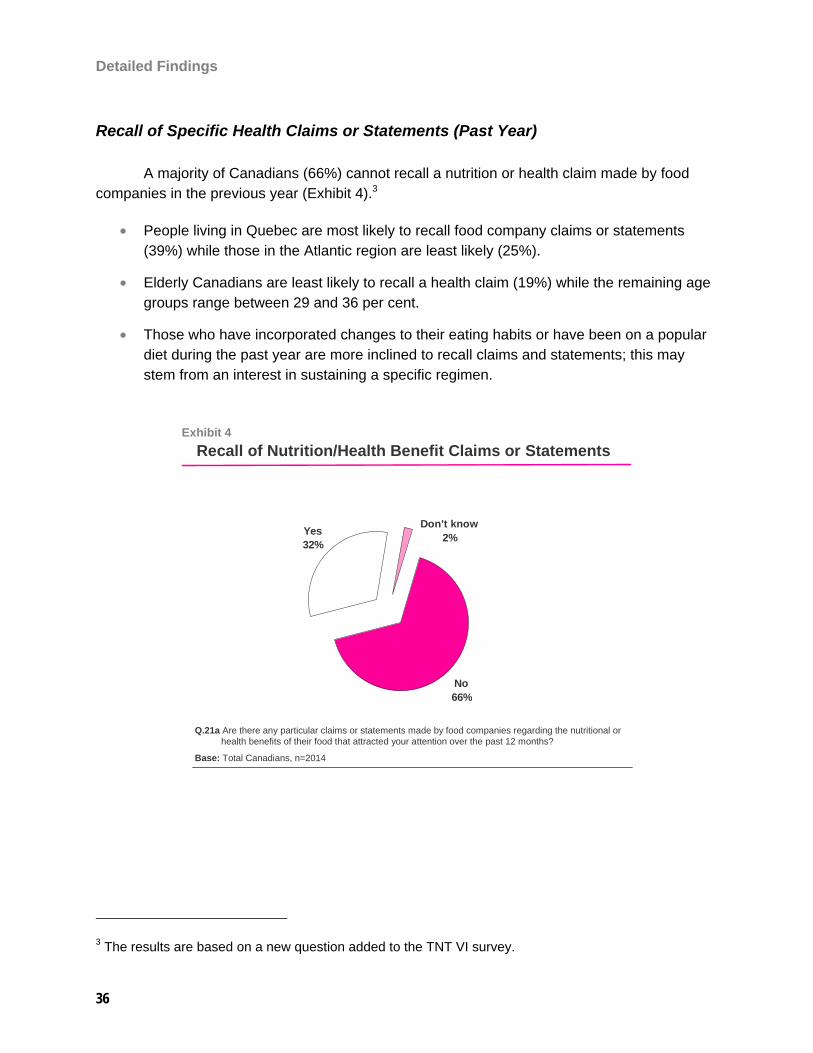
A majority of Canadians (66%) cannot recall a nutrition or health claim made by food companies in the previous year (Exhibit 4).3
• People living in Quebec are most likely to recall food company claims or statements (39%) while those in the Atlantic region are least likely (25%).
• Elderly Canadians are least likely to recall a health claim (19%) while the remaining age groups range between 29 and 36 per cent.
• Those who have incorporated changes to their eating habits or have been on a popular diet during the past year are more inclined to recall claims and statements; this may stem from an interest in sustaining a specific regimen.
3 The results are based on a new question added to the TNT VI survey.
Exhibit 4Recall of Nutrition/Health Benefit Claims or Statements
Q.21a Are there any particular claims or statements made by food companies regarding the nutritional or health benefits of their food that attracted your attention over the past 12 months?
Base: Total Canadians, n=2014
No66%
Yes32%
Don't know 2%
Detailed Findings
37
Specific Claim Recalled
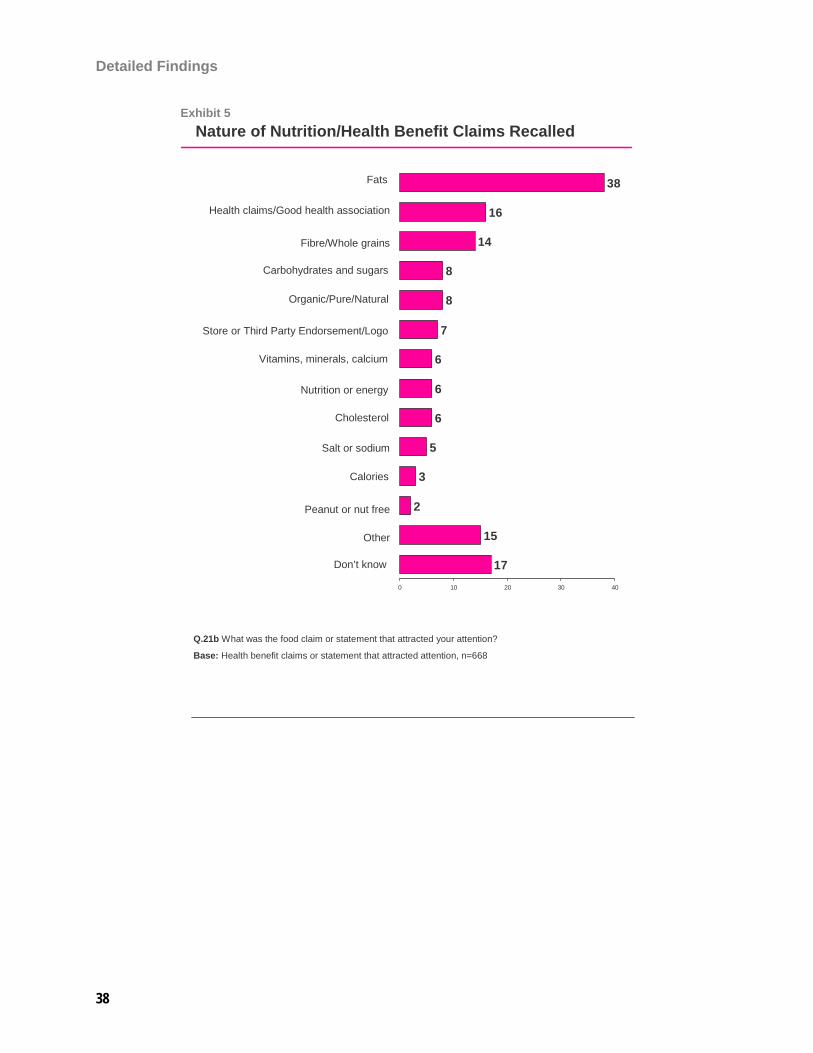
Among those who recall food claims (Exhibit 5), references to fats are most remembered (38%). This category includes specific mentions of claims related to omega-3 or omega-6 fatty acids (13%), zero trans fats (11%), reduced and lower fat (9%), no fat (4%) and reduced trans fats (2%).
Sixteen per cent recall statements that suggest direct links to healthy benefits as a result of consumption of a food; for example, a product label that carries health claims such as, part of a “healthy” diet (6%), to help reduce the risk of heart disease (3%) and to help reduce the risk of cancer (3%). The next specific claims recalled are related to fibre and whole grains (14%), and to carbohydrates and sugars (8%), such as reduced sugar (3%), sugar free (2%) and lower/reduced carbohydrates (1%).
Other categories of mentions include: organic-specific claims (8%); store, third party, and logo endorsements (7%); vitamin, mineral or calcium content (6%); nutrition and energy statements (6%); cholesterol (6%); salt/sodium (5%); and calories (3%).
There is, however, a small yet significant proportion (17%) who cannot recall the type of nutrition or health benefit that attracted their attention.
• Consistent with other findings, those with a high school education or less (29%) are almost three times as likely as those with an undergraduate degree (11%) not to recall the type of claim that attracted their attention.
• Those who earn less than $35,000 are more likely than those with a household income of $50,000 or more not to recall the claim that attracted their attention (35% and 10%, respectively, “don’t know”).
Detailed Findings
38
Exhibit 5Nature of Nutrition/Health Benefit Claims Recalled
6
7
8
8
14
16
38
0 10 20 30 40
Fats
Health claims/Good health association
Fibre/Whole grains
Carbohydrates and sugars
Organic/Pure/Natural
Store or Third Party Endorsement/Logo
Vitamins, minerals, calcium
17
15
2
3
5
6
6
0 10 20 30 40
Nutrition or energy
Cholesterol
Salt or sodium
Calories
Peanut or nut free
Other
Don’t know
Q.21b What was the food claim or statement that attracted your attention?
Base: Health benefit claims or statement that attracted attention, n=668
Detailed Findings
39
Food Product Labels
As the results in the previous section showed, most Canadians (77%) report getting nutrition information from product labels at least once in the previous year. In addition, TNT V showed that people tend to attach credibility to product labels. Labels are considered more credible on average than mass media outlets, interpersonal relationships or other types of food company materials.
In general, most Canadians consult labels at least sometimes (75%), with one third of those being active label consulters (24%). The purpose of reading labels is primarily to find information about ingredients and about nutrition. To the extent labels are read, they also appear to provide the information Canadians need.
Frequency of Reading Labels
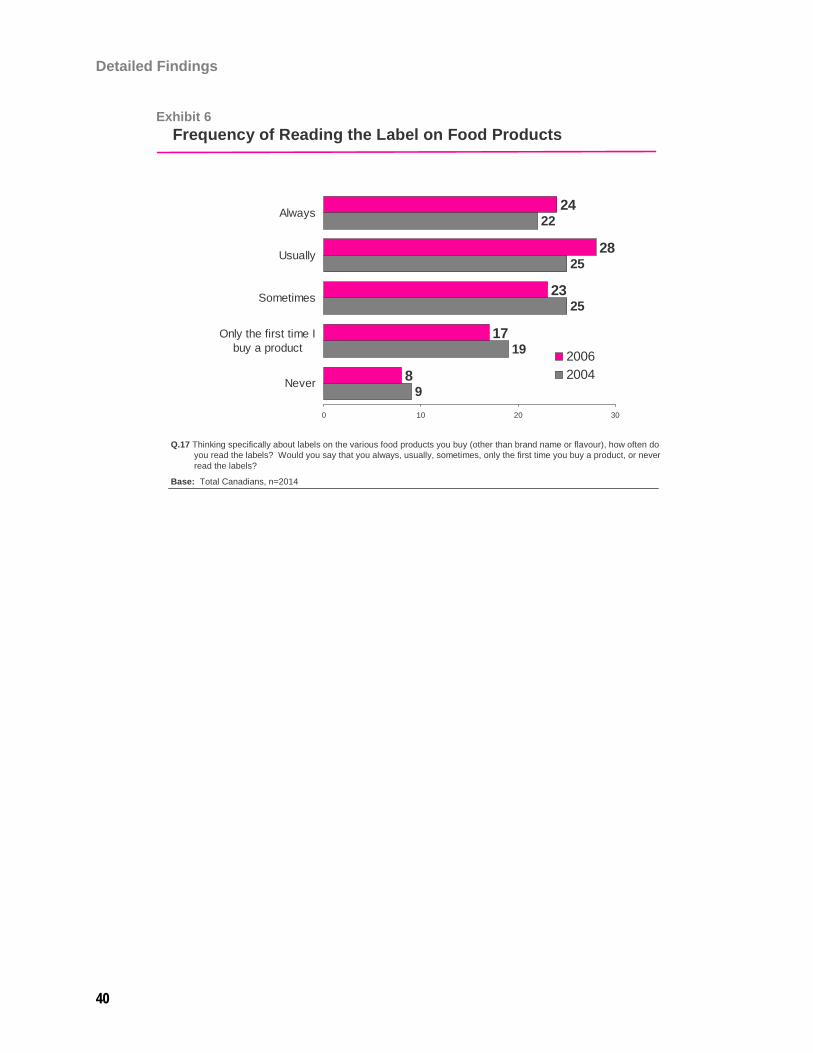
Consistent with the sources of information used, slightly more than half of Canadians read labels at least usually (52%), which is up slightly from the TNT V survey (47%). An additional 17 per cent read labels only the first time they buy a product or brand (Exhibit 6). There is a fairly even distribution among those who sometimes read the label on food products (23%), usually read the label (28%) and always consult the label (24%).
• Women (58%) are more likely than men (45%) to read labels at least usually, as are older Canadians. For example, those between the ages of 45 and 64 years are more likely to read labels at least usually (55%) compared with younger Canadians between the ages of 18 and 24 years (41%).
• Canadians who believe they have excellent or very good eating habits are more likely to always check labels (31%) than those who rate their eating habits as fair or poor (17%). Similarly, people who claim to be very knowledgeable about nutrition tend to always check product labels (42%) compared with those who profess limited nutrition knowledge (7%). While people with higher levels of education are less likely to “never” check labels, they are not particularly likely to “always” check them.
Detailed Findings
40
Exhibit 6Frequency of Reading the Label on Food Products
Q.17 Thinking specifically about labels on the various food products you buy (other than brand name or flavour), how often do you read the labels? Would you say that you always, usually, sometimes, only the first time you buy a product, or never read the labels?
Base: Total Canadians, n=2014
9
19
25
25
22
8
17
23
28
24
0 10 20 30
Never
Only the first time Ibuy a product
Sometimes
Usually
Always
20062004
Detailed Findings
41
Ability to Find Information on Labels
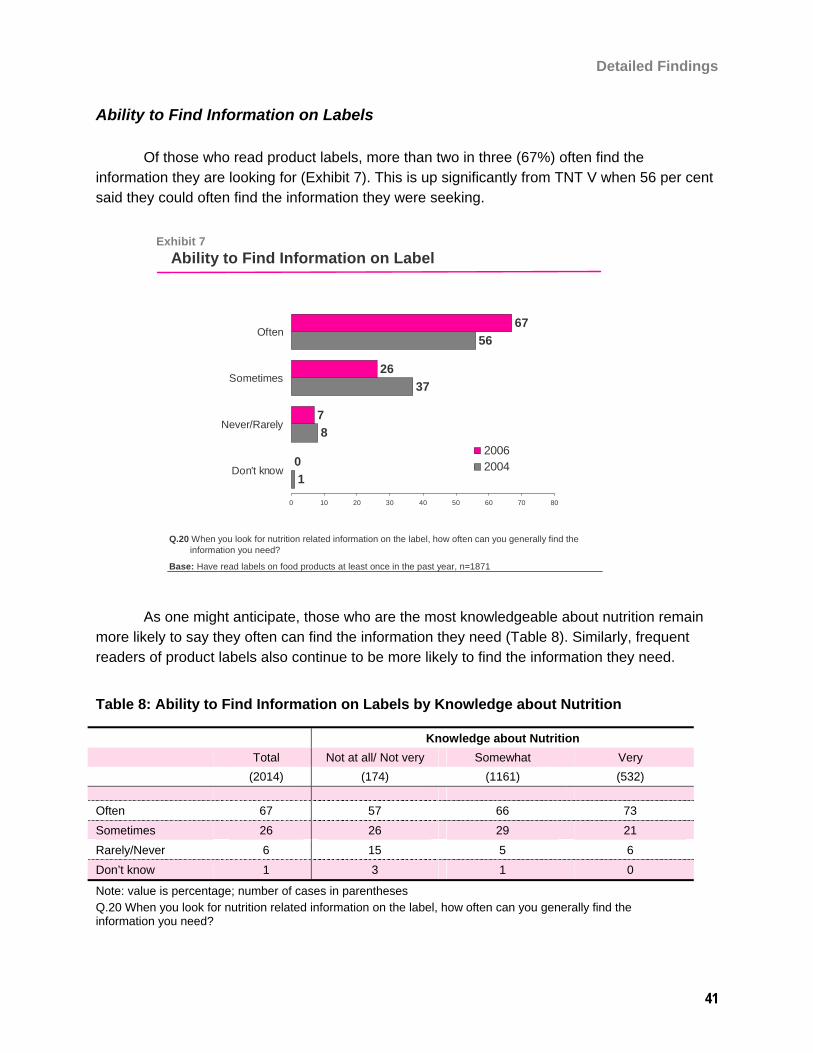
Of those who read product labels, more than two in three (67%) often find the information they are looking for (Exhibit 7). This is up significantly from TNT V when 56 per cent said they could often find the information they were seeking.
Exhibit 7Ability to Find Information on Label
Q.20 When you look for nutrition related information on the label, how often can you generally find the information you need?
Base: Have read labels on food products at least once in the past year, n=1871
1
8
37
56
0
7
26
67
0 10 20 30 40 50 60 70 80
Don't know
Never/Rarely
Sometimes
Often
20062004
As one might anticipate, those who are the most knowledgeable about nutrition remain more likely to say they often can find the information they need (Table 8). Similarly, frequent readers of product labels also continue to be more likely to find the information they need.
Table 8: Ability to Find Information on Labels by Knowledge about Nutrition
Knowledge about Nutrition Total Not at all/ Not very Somewhat Very (2014) (174) (1161) (532) Often 67 57 66 73 Sometimes 26 26 29 21 Rarely/Never 6 15 5 6 Don’t know 1 3 1 0
Note: value is percentage; number of cases in parentheses Q.20 When you look for nutrition related information on the label, how often can you generally find the information you need?
Detailed Findings
42
Use of Information on Labels
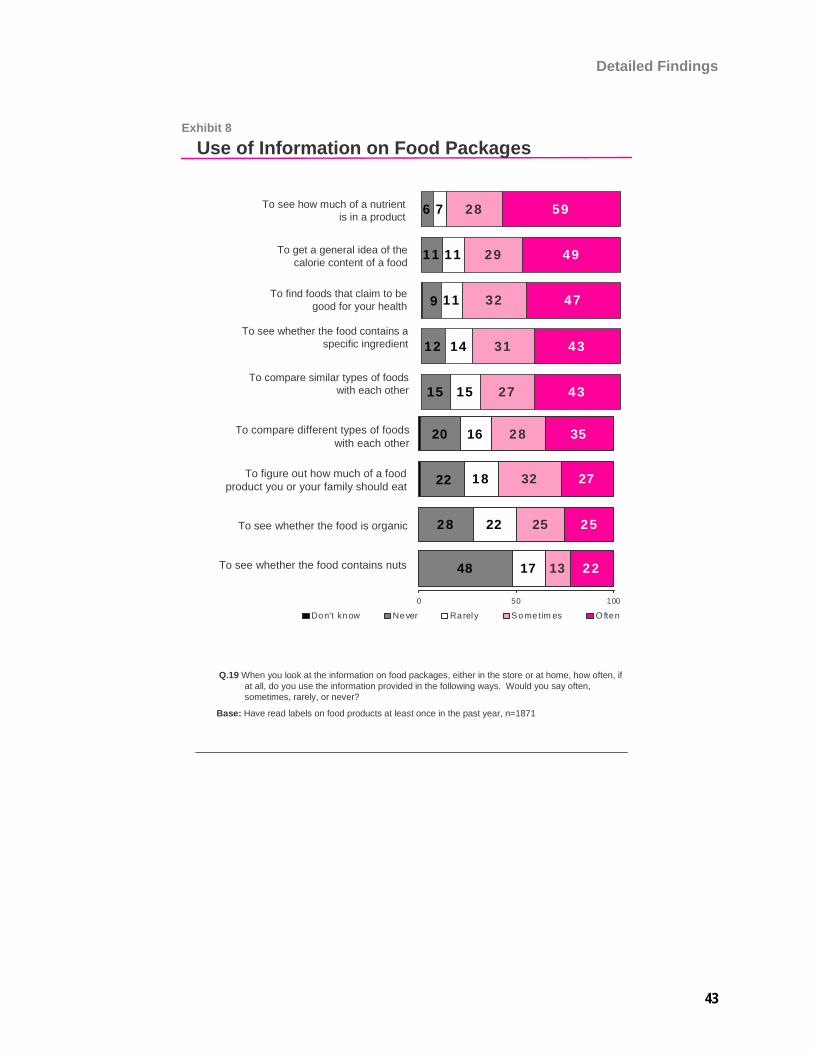
Given that one of the primary reasons for reading labels is to get nutrition information, it is important to understand the ways in which people are using the nutrition information on food packages. The information people are seeking can be general (for example, Is this food good for me? How much should I, or my family, eat?); it can be the basis of comparison (either between different kinds of food such as granola bars and cookies, or between similar kinds of food such as two different brands of crackers); or it can be specific, reflecting health or food concerns (for example, whether a food is kosher, contains nuts, or is organic).
Most Canadians who have read labels (Exhibit 8) use the information to see the amount of specific nutrients a product contains (87% at least sometimes; 59% often) and to find foods that claim to be good for your health (79% sometimes or often). This is consistent with the TNT V survey, which found that 86 per cent looked at the amount of nutrients and 83 per cent found foods that claim to be good for your health, sometimes or more frequently. These label readers also utilize the information for calorie content (78% at least sometimes), to search for a specific ingredient (74% at least sometimes) and to compare similar types of foods with each other (70%) or to compare different types of foods (63%).
Many individuals indicate that they use label information for comparison or serving size purposes. Fifty-nine per cent at least sometimes use the information to determine how much (the serving size) of the product should be eaten. Fewer people use the label to find information about whether a food is organically produced. In fact, more people never check the label for this specific type of information (28%) than check for it often (22%).
Detailed Findings
43
Exhibit 8
Use of Information on Food Packages
15
12
6
15
14
11
11
7
27
31
32
29
28
43
43
47
49
59
9
11
0 50 100
Don't know Never Rarely Sometimes Often
To see how much of a nutrientis in a product
To find foods that claim to be good for your health
To get a general idea of thecalorie content of a food
To see whether the food contains a specific ingredient
To compare similar types of foodswith each other
48
28
17
22
18
16
13
25
32
28
22
25
27
35
22
20
0 50 100
Don't know Never Rarely Sometim es O ften
To compare different types of foodswith each other
To figure out how much of a food product you or your family should eat
To see whether the food is organic
To see whether the food contains nuts
Q.19 When you look at the information on food packages, either in the store or at home, how often, if at all, do you use the information provided in the following ways. Would you say often, sometimes, rarely, or never?
Base: Have read labels on food products at least once in the past year, n=1871
Detailed Findings
44
Perceived Importance of Specific Label Information
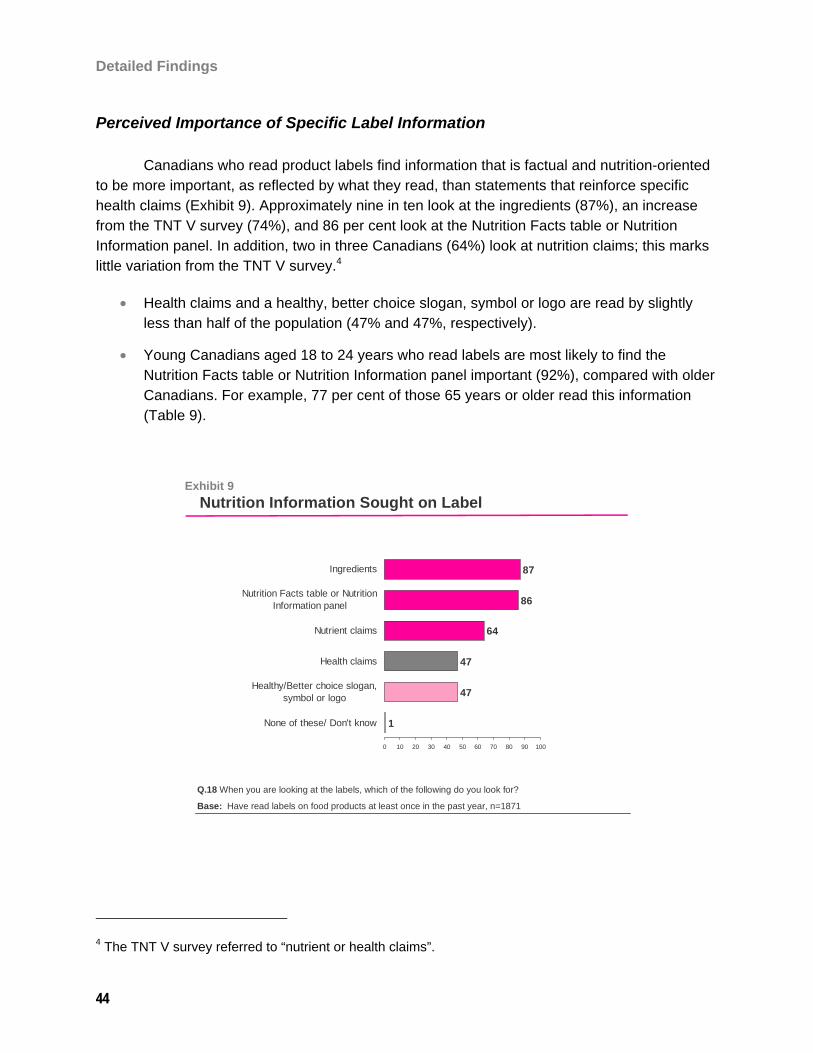
Canadians who read product labels find information that is factual and nutrition-oriented to be more important, as reflected by what they read, than statements that reinforce specific health claims (Exhibit 9). Approximately nine in ten look at the ingredients (87%), an increase from the TNT V survey (74%), and 86 per cent look at the Nutrition Facts table or Nutrition Information panel. In addition, two in three Canadians (64%) look at nutrition claims; this marks little variation from the TNT V survey.4
• Health claims and a healthy, better choice slogan, symbol or logo are read by slightly less than half of the population (47% and 47%, respectively).
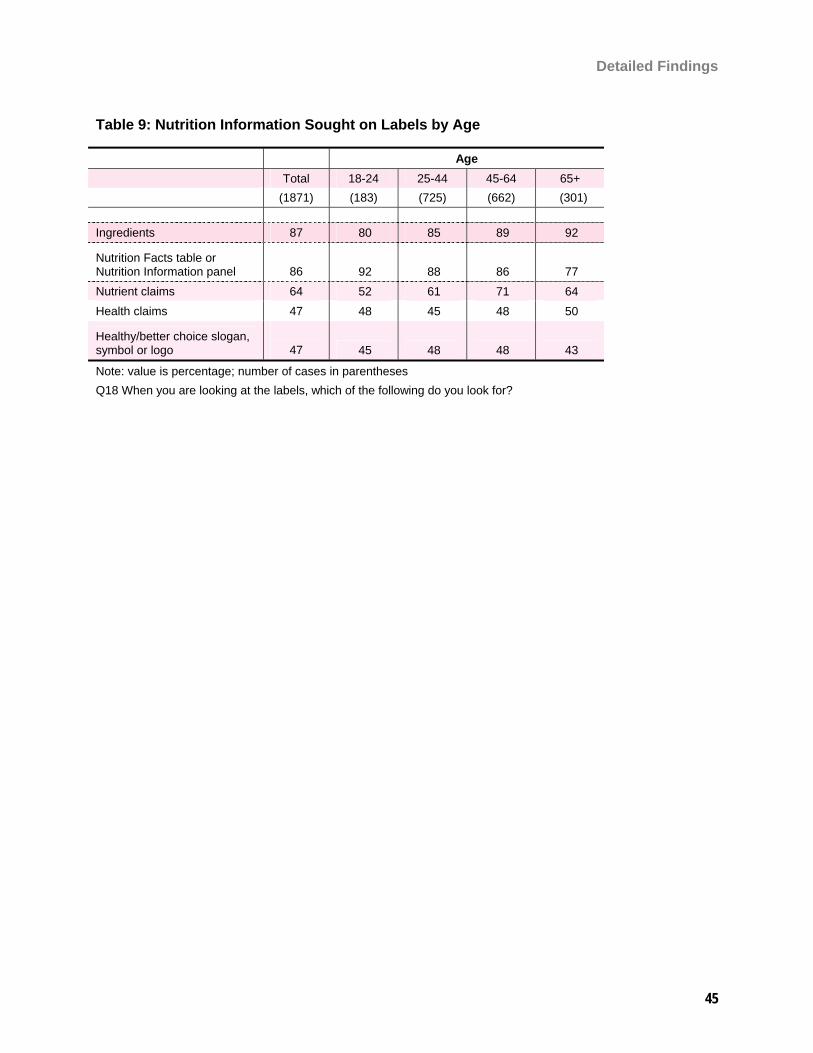
• Young Canadians aged 18 to 24 years who read labels are most likely to find the Nutrition Facts table or Nutrition Information panel important (92%), compared with older Canadians. For example, 77 per cent of those 65 years or older read this information (Table 9).
Exhibit 9 Nutrition Information Sought on Label
Q.18 When you are looking at the labels, which of the following do you look for?
Base: Have read labels on food products at least once in the past year, n=1871
1
47
47
64
86
87
0 10 20 30 40 50 60 70 80 90 100
None of these/ Don't know
Healthy/Better choice slogan,symbol or logo
Health claims
Nutrient claims
Nutrition Facts table or NutritionInformation panel
Ingredients
4 The TNT V survey referred to “nutrient or health claims”.
Detailed Findings
45
Table 9: Nutrition Information Sought on Labels by Age
Age Total 18-24 25-44 45-64 65+ (1871) (183) (725) (662) (301) Ingredients 87 80 85 89 92
Nutrition Facts table or Nutrition Information panel
86 92 88 86 77
Nutrient claims 64 52 61 71 64 Health claims 47 48 45 48 50
Healthy/better choice slogan, symbol or logo
47 45 48 48 43
Note: value is percentage; number of cases in parentheses Q18 When you are looking at the labels, which of the following do you look for?
Detailed Findings
46
Factors Affecting Food Choices
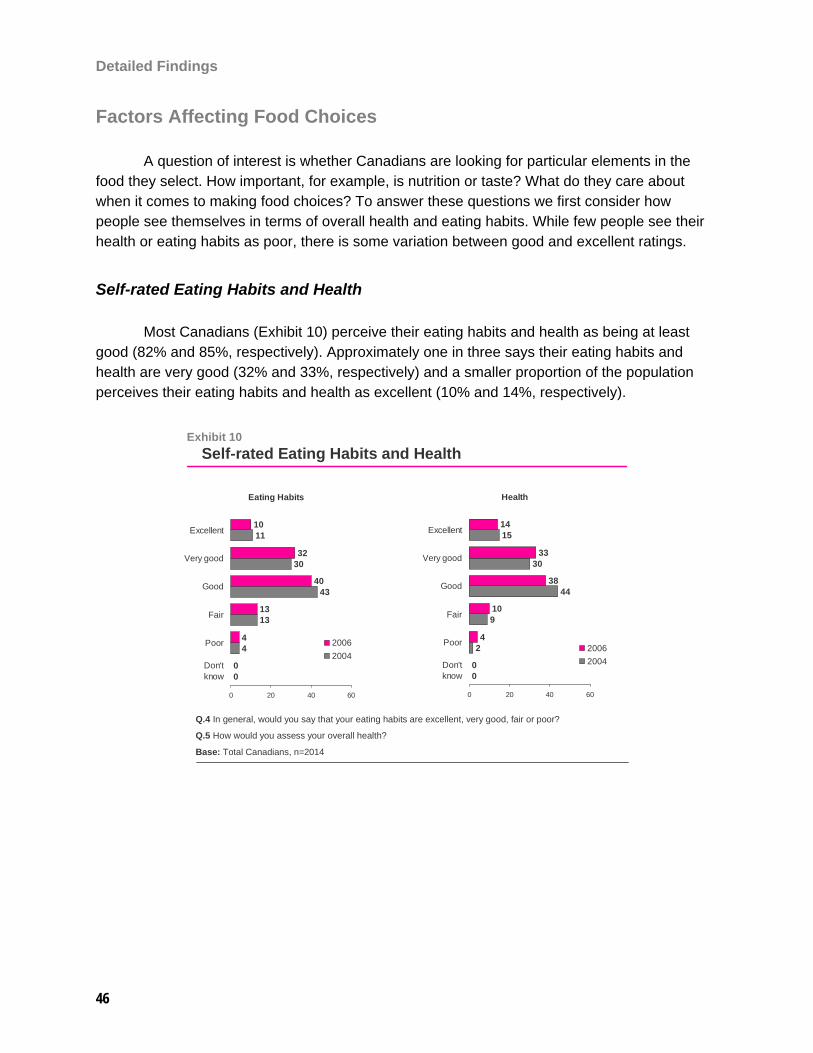
A question of interest is whether Canadians are looking for particular elements in the food they select. How important, for example, is nutrition or taste? What do they care about when it comes to making food choices? To answer these questions we first consider how people see themselves in terms of overall health and eating habits. While few people see their health or eating habits as poor, there is some variation between good and excellent ratings.
Self-rated Eating Habits and Health
Most Canadians (Exhibit 10) perceive their eating habits and health as being at least good (82% and 85%, respectively). Approximately one in three says their eating habits and health are very good (32% and 33%, respectively) and a smaller proportion of the population perceives their eating habits and health as excellent (10% and 14%, respectively).
Exhibit 10 Self-rated Eating Habits and Health
Q.4 In general, would you say that your eating habits are excellent, very good, fair or poor?
Q.5 How would you assess your overall health?
Base: Total Canadians, n=2014
Health
0
2
9
15
0
4
10
38
33
14
30
44
0 20 40 60
Don'tknow
Poor
Fair
Good
Very good
Excellent
20062004
Eating Habits
0
4
13
30
11
0
4
13
40
32
10
43
0 20 40 60
Don'tknow
Poor
Fair
Good
Very good
Excellent
20062004
Detailed Findings
47
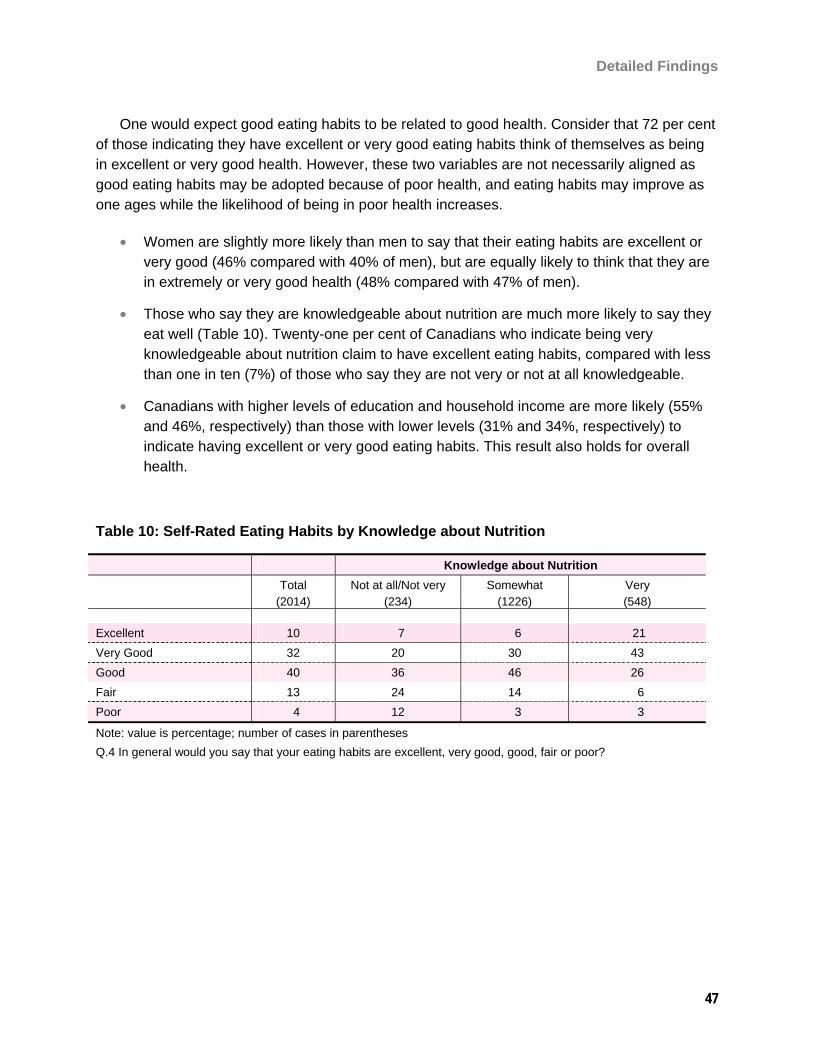
One would expect good eating habits to be related to good health. Consider that 72 per cent of those indicating they have excellent or very good eating habits think of themselves as being in excellent or very good health. However, these two variables are not necessarily aligned as good eating habits may be adopted because of poor health, and eating habits may improve as one ages while the likelihood of being in poor health increases.
• Women are slightly more likely than men to say that their eating habits are excellent or very good (46% compared with 40% of men), but are equally likely to think that they are in extremely or very good health (48% compared with 47% of men).
• Those who say they are knowledgeable about nutrition are much more likely to say they eat well (Table 10). Twenty-one per cent of Canadians who indicate being very knowledgeable about nutrition claim to have excellent eating habits, compared with less than one in ten (7%) of those who say they are not very or not at all knowledgeable.
• Canadians with higher levels of education and household income are more likely (55% and 46%, respectively) than those with lower levels (31% and 34%, respectively) to indicate having excellent or very good eating habits. This result also holds for overall health.
Table 10: Self-Rated Eating Habits by Knowledge about Nutrition
Knowledge about Nutrition Total Not at all/Not very Somewhat Very (2014) (234) (1226) (548) Excellent 10 7 6 21 Very Good 32 20 30 43 Good 40 36 46 26 Fair 13 24 14 6 Poor 4 12 3 3
Note: value is percentage; number of cases in parentheses Q.4 In general would you say that your eating habits are excellent, very good, good, fair or poor?
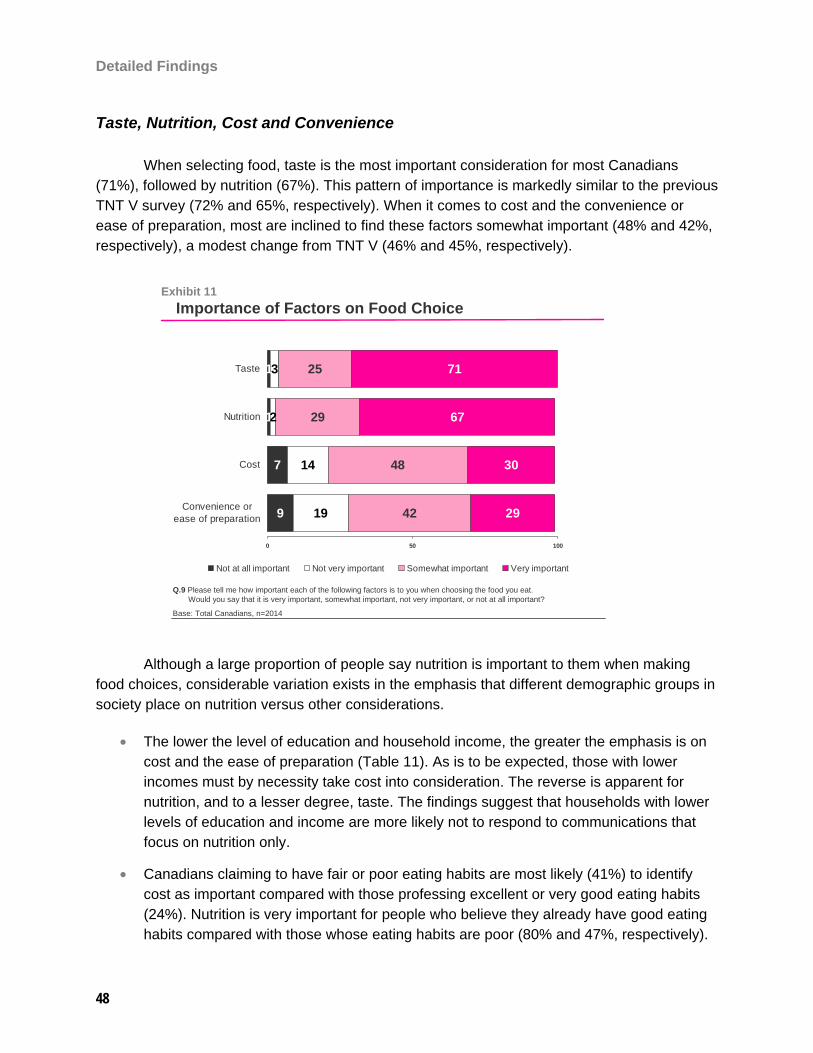
Detailed Findings
48
Taste, Nutrition, Cost and Convenience
When selecting food, taste is the most important consideration for most Canadians (71%), followed by nutrition (67%). This pattern of importance is markedly similar to the previous TNT V survey (72% and 65%, respectively). When it comes to cost and the convenience or ease of preparation, most are inclined to find these factors somewhat important (48% and 42%, respectively), a modest change from TNT V (46% and 45%, respectively).
Exhibit 11Importance of Factors on Food Choice
9
7
1
1
19
14
2
3
42
48
29
25
29
30
67
71
0 50 100
Convenience orease of preparation
Cost
Nutrition
Taste
Not at all important Not very important Somewhat important Very important
Q.9 Please tell me how important each of the following factors is to you when choosing the food you eat. Would you say that it is very important, somewhat important, not very important, or not at all important?
Base: Total Canadians, n=2014
Although a large proportion of people say nutrition is important to them when making food choices, considerable variation exists in the emphasis that different demographic groups in society place on nutrition versus other considerations.
• The lower the level of education and household income, the greater the emphasis is on cost and the ease of preparation (Table 11). As is to be expected, those with lower incomes must by necessity take cost into consideration. The reverse is apparent for nutrition, and to a lesser degree, taste. The findings suggest that households with lower levels of education and income are more likely not to respond to communications that focus on nutrition only.
• Canadians claiming to have fair or poor eating habits are most likely (41%) to identify cost as important compared with those professing excellent or very good eating habits (24%). Nutrition is very important for people who believe they already have good eating habits compared with those whose eating habits are poor (80% and 47%, respectively).
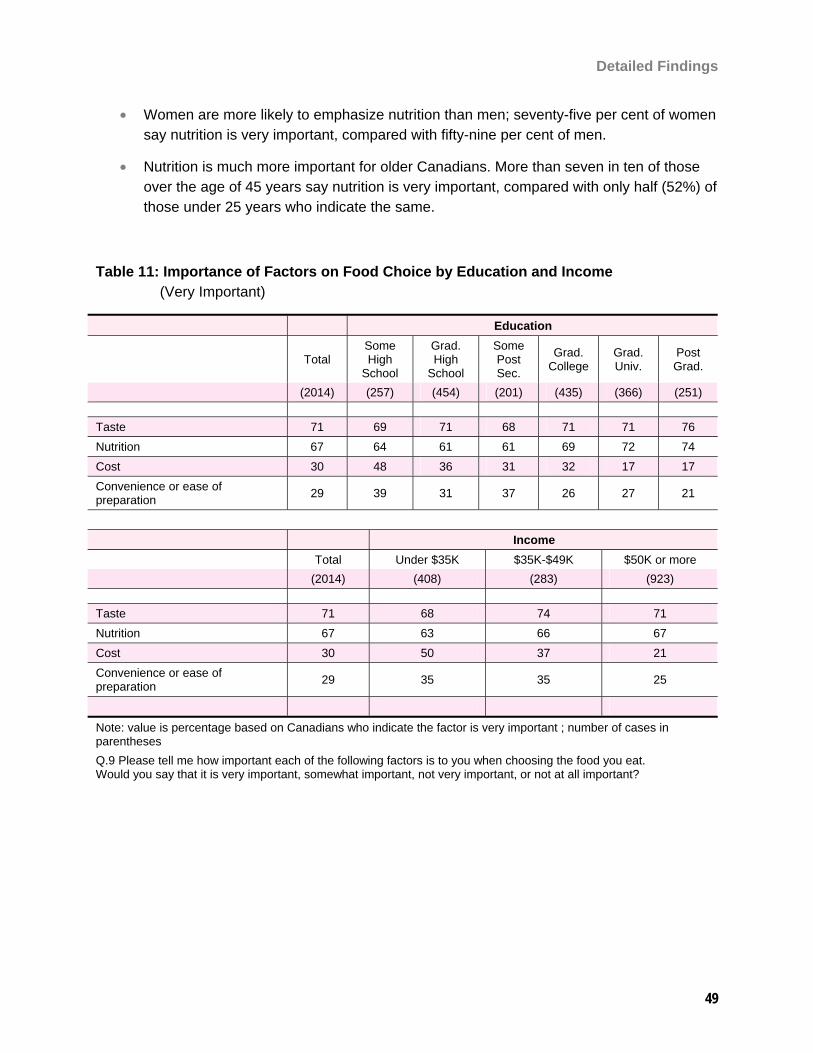
Detailed Findings
49
• Women are more likely to emphasize nutrition than men; seventy-five per cent of women say nutrition is very important, compared with fifty-nine per cent of men.
• Nutrition is much more important for older Canadians. More than seven in ten of those over the age of 45 years say nutrition is very important, compared with only half (52%) of those under 25 years who indicate the same.
Table 11: Importance of Factors on Food Choice by Education and Income (Very Important)
Education
Total Some High
School
Grad. High
School
Some Post Sec.
Grad. College
Grad. Univ.
Post Grad.
(2014) (257) (454) (201) (435) (366) (251)
Taste 71 69 71 68 71 71 76 Nutrition 67 64 61 61 69 72 74 Cost 30 48 36 31 32 17 17 Convenience or ease of preparation 29 39 31 37 26 27 21
Income Total Under $35K $35K-$49K $50K or more (2014) (408) (283) (923)
Taste 71 68 74 71 Nutrition 67 63 66 67 Cost 30 50 37 21 Convenience or ease of preparation 29 35 35 25
Note: value is percentage based on Canadians who indicate the factor is very important ; number of cases in parentheses Q.9 Please tell me how important each of the following factors is to you when choosing the food you eat. Would you say that it is very important, somewhat important, not very important, or not at all important?
Detailed Findings
50
Perceptions of What Makes a Food Healthy
Canadians associate the healthfulness of food with a number of diverse factors as reflected in a new question added in 2006. One in three mentions the presence of healthful ingredients such as whole grains, fibre, omega-3 fats and vitamins (Exhibit 12). To a lesser degree, 21 per cent mention low amounts or the absence of negative nutrients, including trans fats, salt and sugar, as factors that make a food healthy. Some Canadians also are likely to perceive fresh food formats and unprocessed food as healthy (21%).
Vegetables are seen as healthy foods, and incorporating a variety of vegetables in the diet resonates as a healthy diet pattern among Canadians (16%). As we note later, when it comes to changing one’s food choices, eating more fruits and vegetables is key from the public’s perspective.
Other factors include natural food (12%) and fruit or a variety of fruit (9%). Nine per cent mention content such as the absence of trans fats, saturated fat and salt as being “healthy”. Mentions also include a balance and variety of food (8%), food from various food groups (6%), organic produce (6%) and no preservatives (5%) as factors that make food healthy. Finally, a large group of Other mentions (21%) includes a variety of factors such as: meat, particularly lean meats, chicken without the skin, consuming smaller portions and little or no meat (5%); homemade and homegrown food (2%); and low(er) calorie foods (1%). A small percentage of the population (9%) has no opinion on what makes a food healthy.
Canadians who are more mindful of their eating habits and who read labels are most inclined to think of health in terms of nutrients. For example, those who usually read labels are most likely to mention fresh format (27%) as a factor that makes a food healthy compared with those who read labels “only the first time” or “never” (16%).
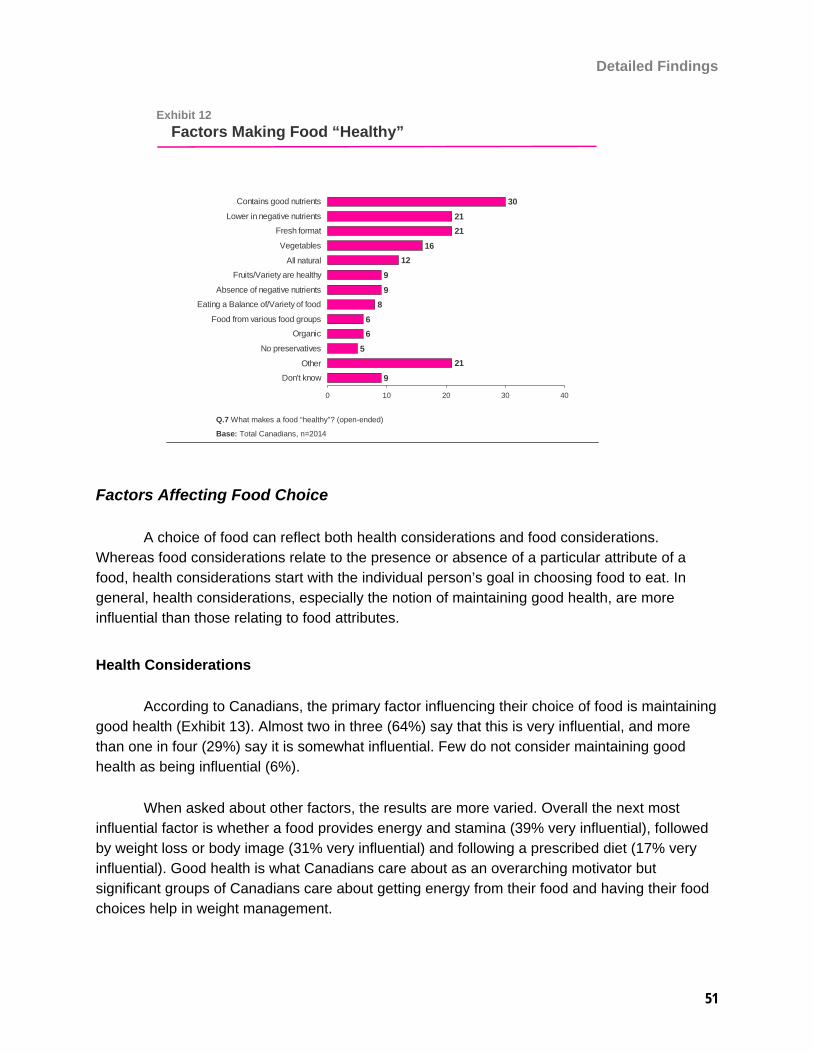
Detailed Findings
51
Exhibit 12Factors Making Food “Healthy”
Q.7 What makes a food “healthy”? (open-ended)
Base: Total Canadians, n=2014
9
215
66
89
9
1216
2121
30
0 10 20 30 40
Don't know
Other
No preservatives
Organic
Food from various food groups
Eating a Balance of/Variety of food
Absence of negative nutrients
Fruits/Variety are healthy
All natural
Vegetables
Fresh format
Lower in negative nutrients
Contains good nutrients
Factors Affecting Food Choice
A choice of food can reflect both health considerations and food considerations. Whereas food considerations relate to the presence or absence of a particular attribute of a food, health considerations start with the individual person’s goal in choosing food to eat. In general, health considerations, especially the notion of maintaining good health, are more influential than those relating to food attributes.
Health Considerations
According to Canadians, the primary factor influencing their choice of food is maintaining good health (Exhibit 13). Almost two in three (64%) say that this is very influential, and more than one in four (29%) say it is somewhat influential. Few do not consider maintaining good health as being influential (6%).
When asked about other factors, the results are more varied. Overall the next most influential factor is whether a food provides energy and stamina (39% very influential), followed by weight loss or body image (31% very influential) and following a prescribed diet (17% very influential). Good health is what Canadians care about as an overarching motivator but significant groups of Canadians care about getting energy from their food and having their food choices help in weight management.
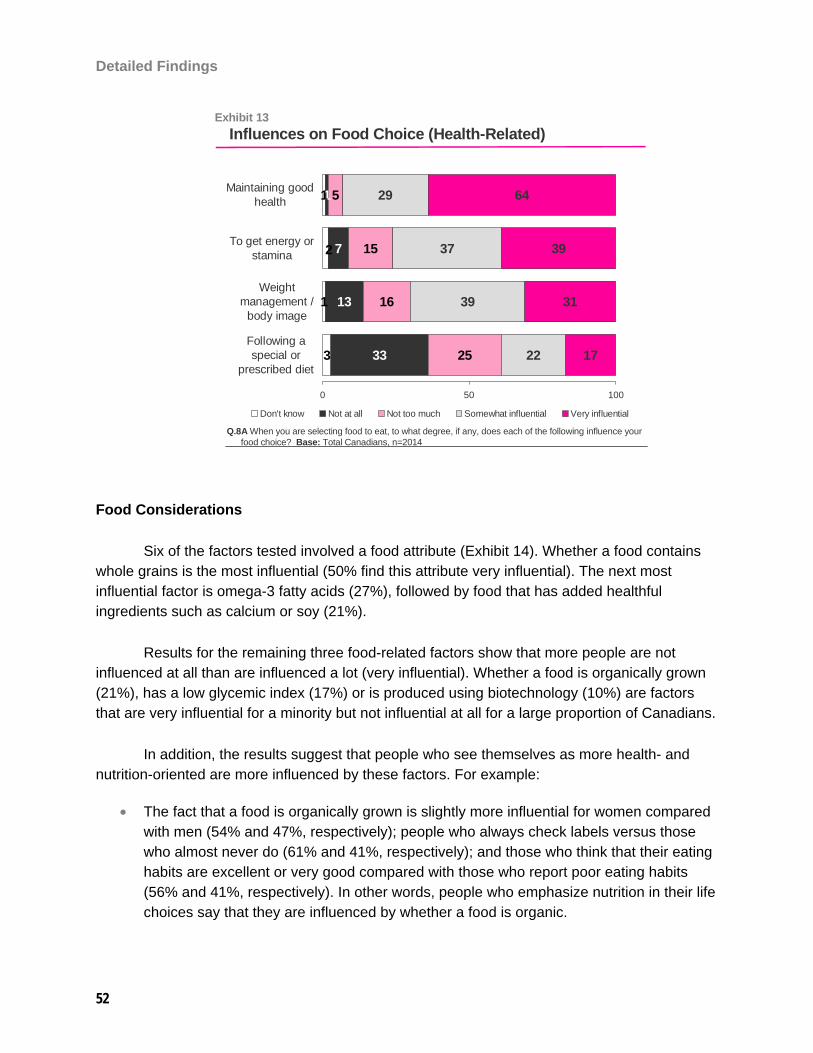
Detailed Findings
52
Exhibit 13Influences on Food Choice (Health-Related)
3
1
33
13
7
1
25
16
15
5
22
39
37
29
17
31
39
641
2
0 50 100
Following aspecial or
prescribed diet
Weightmanagement /
body image
To get energy orstamina
Maintaining goodhealth
Don't know Not at all Not too much Somewhat influential Very influential
Q.8A When you are selecting food to eat, to what degree, if any, does each of the following influence your food choice? Base: Total Canadians, n=2014
Food Considerations
Six of the factors tested involved a food attribute (Exhibit 14). Whether a food contains whole grains is the most influential (50% find this attribute very influential). The next most influential factor is omega-3 fatty acids (27%), followed by food that has added healthful ingredients such as calcium or soy (21%).
Results for the remaining three food-related factors show that more people are not influenced at all than are influenced a lot (very influential). Whether a food is organically grown (21%), has a low glycemic index (17%) or is produced using biotechnology (10%) are factors that are very influential for a minority but not influential at all for a large proportion of Canadians.
In addition, the results suggest that people who see themselves as more health- and nutrition-oriented are more influenced by these factors. For example:
• The fact that a food is organically grown is slightly more influential for women compared with men (54% and 47%, respectively); people who always check labels versus those who almost never do (61% and 41%, respectively); and those who think that their eating habits are excellent or very good compared with those who report poor eating habits (56% and 41%, respectively). In other words, people who emphasize nutrition in their life choices say that they are influenced by whether a food is organic.
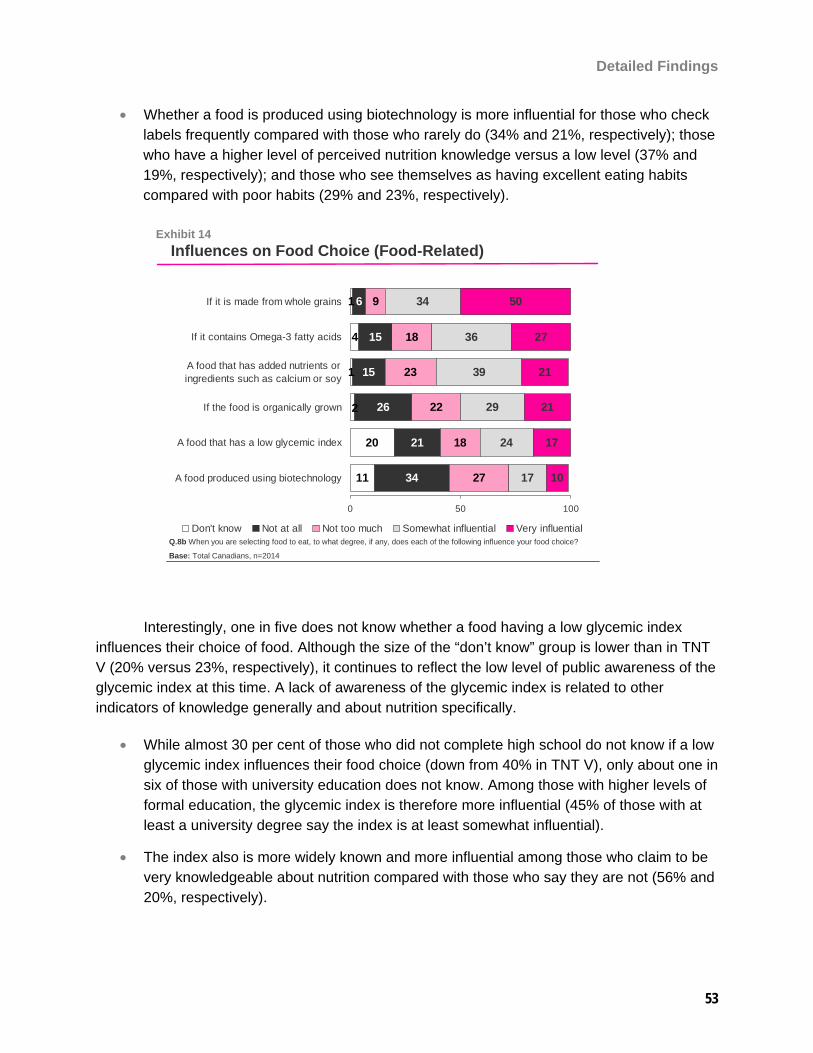
Detailed Findings
53
• Whether a food is produced using biotechnology is more influential for those who check labels frequently compared with those who rarely do (34% and 21%, respectively); those who have a higher level of perceived nutrition knowledge versus a low level (37% and 19%, respectively); and those who see themselves as having excellent eating habits compared with poor habits (29% and 23%, respectively).
Exhibit 14Influences on Food Choice (Food-Related)
11
20
4
1
34
21
26
15
15
6
27
18
22
23
18
9
17
24
29
39
36
34
10
17
21
21
27
50
1
2
0 50 100
A food produced using biotechnology
A food that has a low glycemic index
If the food is organically grown
A food that has added nutrients oringredients such as calcium or soy
If it contains Omega-3 fatty acids
If it is made from whole grains
Don't know Not at all Not too much Somewhat influential Very influentialQ.8b When you are selecting food to eat, to what degree, if any, does each of the following influence your food choice?
Base: Total Canadians, n=2014
Interestingly, one in five does not know whether a food having a low glycemic index influences their choice of food. Although the size of the “don’t know” group is lower than in TNT V (20% versus 23%, respectively), it continues to reflect the low level of public awareness of the glycemic index at this time. A lack of awareness of the glycemic index is related to other indicators of knowledge generally and about nutrition specifically.
• While almost 30 per cent of those who did not complete high school do not know if a low glycemic index influences their food choice (down from 40% in TNT V), only about one in six of those with university education does not know. Among those with higher levels of formal education, the glycemic index is therefore more influential (45% of those with at least a university degree say the index is at least somewhat influential).
• The index also is more widely known and more influential among those who claim to be very knowledgeable about nutrition compared with those who say they are not (56% and 20%, respectively).
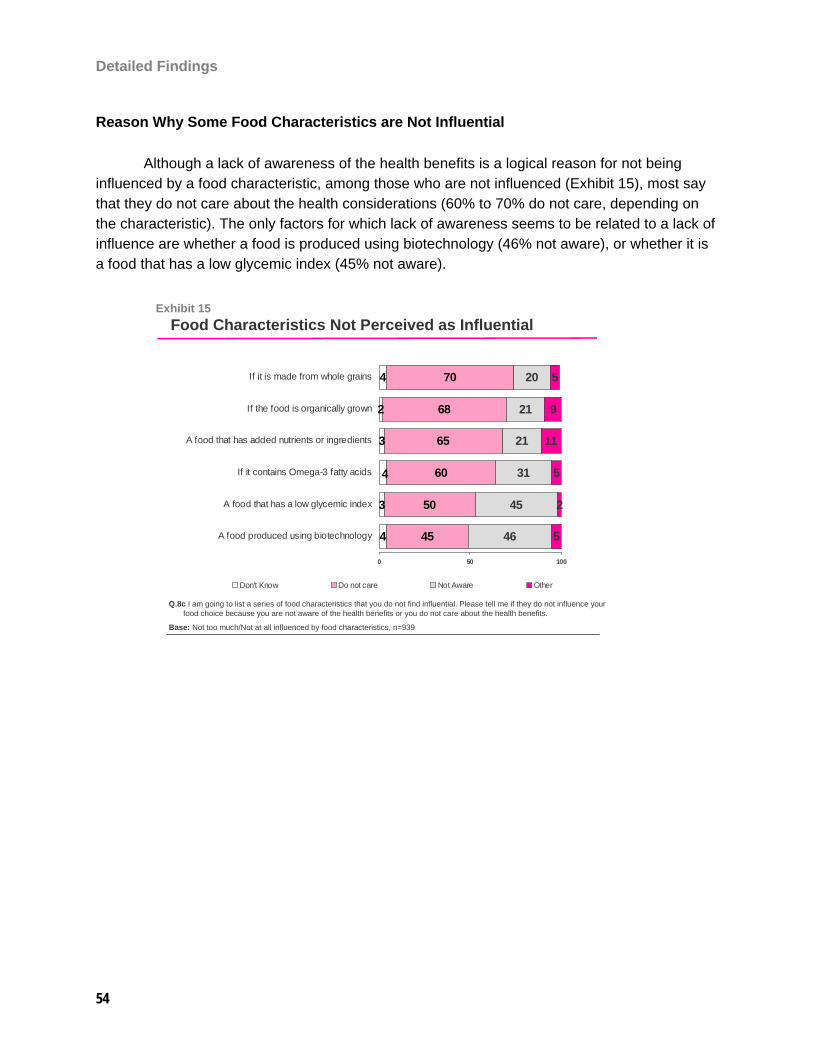
Detailed Findings
54
Reason Why Some Food Characteristics are Not Influential
Although a lack of awareness of the health benefits is a logical reason for not being influenced by a food characteristic, among those who are not influenced (Exhibit 15), most say that they do not care about the health considerations (60% to 70% do not care, depending on the characteristic). The only factors for which lack of awareness seems to be related to a lack of influence are whether a food is produced using biotechnology (46% not aware), or whether it is a food that has a low glycemic index (45% not aware).
Exhibit 15Food Characteristics Not Perceived as Influential
4
3
2
4
45
50
60
65
68
70
46
45
31
21
21
20
5
2
5
11
9
5
4
3
0 50 100
A food produced using biotechnology
A food that has a low glycemic index
If it contains Omega-3 fatty acids
A food that has added nutrients or ingredients
If the food is organically grown
If it is made from whole grains
Don't Know Do not care Not Aware Other
Q.8c I am going to list a series of food characteristics that you do not find influential. Please tell me if they do not influence your food choice because you are not aware of the health benefits or you do not care about the health benefits.
Base: Not too much/Not at all influenced by food characteristics, n=939

Detailed Findings
55
Selection of Food Based on Nutrient Content
While Canadians are able to make judgments about the relevant importance or influence of different food and nutrition factors on their food choices, many decisions reflect more specific nutrition information, such as the amount of fibre or the amount of calories in a food. This section shows the frequency with which the Canadians who think nutrition is important select food based on fourteen different nutrients. The results indicate that the various nutrients often are used in selecting foods and that among Canadians who think nutrition is important, people care more about fibre, protein, vitamins, total fat and saturated fat than they do about iron, salt, cholesterol, carbohydrates and trans fat.
In general, the TNT VI results show that, for each nutrient, those who consider nutrition important to them are more likely than in previous years to think their food choice is at least sometimes based on the amount of the nutrient (Table 12). The ranking of nutrients is very similar to the past results, with one major exception to the pattern, trans fatty acids.
Food choices based on trans fatty acids continue to significantly increase in relation to the other listed food contents. The findings show that Canadians are twelve percentage points more likely than in TNT V, and 22 percentage points higher than in TNT IV, to often or sometimes consider the presence or absence of this nutrient. Those with higher levels of education and household income are more likely to choose a food based on this factor.
Table 12: Choice of Foods based on Various Nutrients
Percentage Often Percentage Often and Sometimes 2006 2004 2006 2004 Difference (1954) (2304) (1954) (2304) Fibre 54 50 82 76 +6 Protein 48 48 79 75 +4 Vitamins 45 46 77 73 +4 Total fat 47 45 74 70 +4 Saturated fat 45 45 71 67 +4 Sugar 45 43 74 70 +4 Calcium 38 41 71 70 +1 Cholesterol 40 40 67 64 +3 Calories and energy 40 39 76 71 +5 Salt and sodium 34 35 63 60 +3 Carbohydrate 31 35 66 64 +2 Trans fatty acids 42 34 68 56 +12 Iron 27 27 59 55 +4
Note: value is percentage based on Canadians who think that nutrition is at least somewhat important; number of cases in parentheses
Q.12 How often, if ever, do you select the foods that you eat based on the amount of a specific nutrient that the food contains? As I read you each item, please tell me whether you select the foods based on the content of this nutrient often, sometimes, rarely or never.
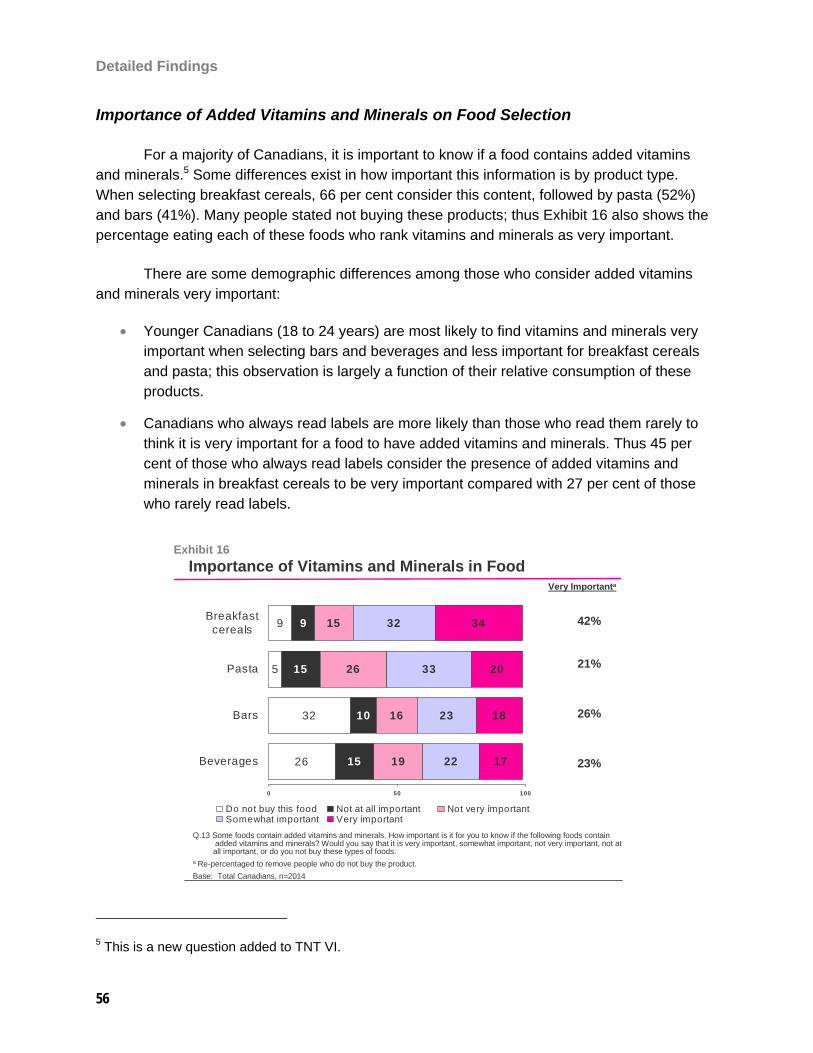
Detailed Findings
56
Importance of Added Vitamins and Minerals on Food Selection
For a majority of Canadians, it is important to know if a food contains added vitamins and minerals.5 Some differences exist in how important this information is by product type. When selecting breakfast cereals, 66 per cent consider this content, followed by pasta (52%) and bars (41%). Many people stated not buying these products; thus Exhibit 16 also shows the percentage eating each of these foods who rank vitamins and minerals as very important.
There are some demographic differences among those who consider added vitamins and minerals very important:
• Younger Canadians (18 to 24 years) are most likely to find vitamins and minerals very important when selecting bars and beverages and less important for breakfast cereals and pasta; this observation is largely a function of their relative consumption of these products.
• Canadians who always read labels are more likely than those who read them rarely to think it is very important for a food to have added vitamins and minerals. Thus 45 per cent of those who always read labels consider the presence of added vitamins and minerals in breakfast cereals to be very important compared with 27 per cent of those who rarely read labels.
5 This is a new question added to TNT VI.
Exhibit 16Importance of Vitamins and Minerals in Food
26
32
5
9
15
10
15
9
19
16
26
15
22
23
33
32
17
18
20
34
0 50 100
Beverages
Bars
Pasta
Breakfastcereals
Do not buy this food Not at all important Not very importantSomewhat important Very important
Q.13 Some foods contain added vitamins and minerals. How important is it for you to know if the following foods containadded vitamins and minerals? Would you say that it is very important, somewhat important, not very important, not at all important, or do you not buy these types of foods.
a Re-percentaged to remove people who do not buy the product.Base: Total Canadians, n=2014
Very Importanta
42%
21%
26%
23%
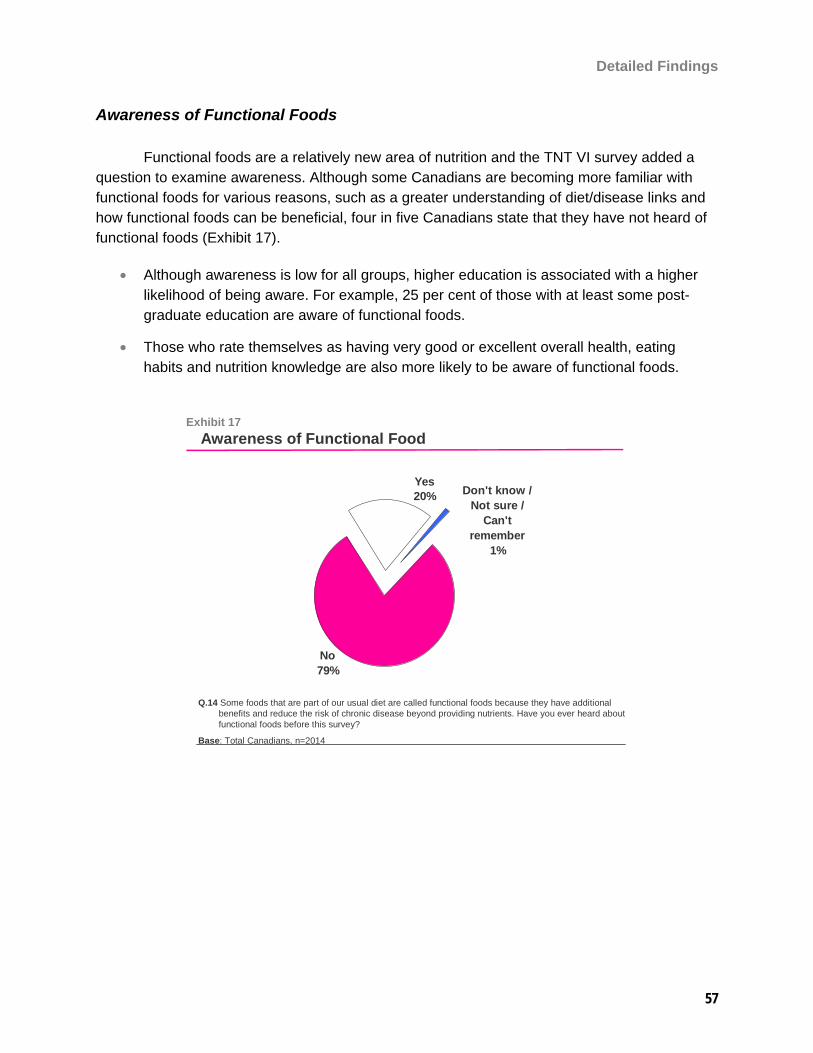
Detailed Findings
57
Awareness of Functional Foods
Functional foods are a relatively new area of nutrition and the TNT VI survey added a question to examine awareness. Although some Canadians are becoming more familiar with functional foods for various reasons, such as a greater understanding of diet/disease links and how functional foods can be beneficial, four in five Canadians state that they have not heard of functional foods (Exhibit 17).
• Although awareness is low for all groups, higher education is associated with a higher likelihood of being aware. For example, 25 per cent of those with at least some post-graduate education are aware of functional foods.
• Those who rate themselves as having very good or excellent overall health, eating habits and nutrition knowledge are also more likely to be aware of functional foods.
Exhibit 17Awareness of Functional Food
Q.14 Some foods that are part of our usual diet are called functional foods because they have additional benefits and reduce the risk of chronic disease beyond providing nutrients. Have you ever heard about functional foods before this survey?
Base: Total Canadians, n=2014
Don't know / Not sure /
Can't remember
1%
No79%
Yes20%
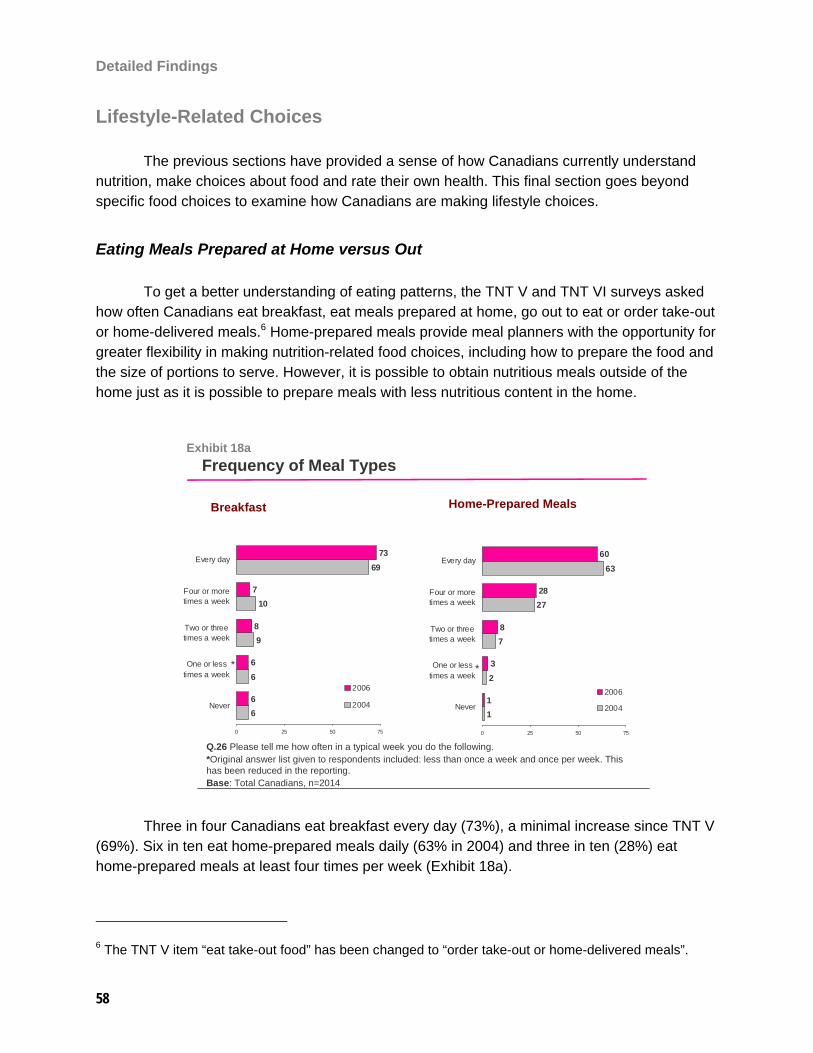
Detailed Findings
58
Lifestyle-Related Choices
The previous sections have provided a sense of how Canadians currently understand nutrition, make choices about food and rate their own health. This final section goes beyond specific food choices to examine how Canadians are making lifestyle choices.
Eating Meals Prepared at Home versus Out
To get a better understanding of eating patterns, the TNT V and TNT VI surveys asked how often Canadians eat breakfast, eat meals prepared at home, go out to eat or order take-out or home-delivered meals.6 Home-prepared meals provide meal planners with the opportunity for greater flexibility in making nutrition-related food choices, including how to prepare the food and the size of portions to serve. However, it is possible to obtain nutritious meals outside of the home just as it is possible to prepare meals with less nutritious content in the home.
Three in four Canadians eat breakfast every day (73%), a minimal increase since TNT V (69%). Six in ten eat home-prepared meals daily (63% in 2004) and three in ten (28%) eat home-prepared meals at least four times per week (Exhibit 18a).
6 The TNT V item “eat take-out food” has been changed to “order take-out or home-delivered meals”.
Exhibit 18aFrequency of Meal Types
6
6
9
10
69
6
6
8
7
73
0 25 50 75
Never
One or lesstimes a week
Two or threetimes a week
Four or moretimes a week
Every day
2006
2004
Breakfast
Q.26 Please tell me how often in a typical week you do the following.*Original answer list given to respondents included: less than once a week and once per week. This has been reduced in the reporting.Base: Total Canadians, n=2014
Home-Prepared Meals
1
2
7
27
63
1
3
8
28
60
0 25 50 75
Never
One or lesstimes a week
Two or threetimes a week
Four or moretimes a week
Every day
2006
2004
* *
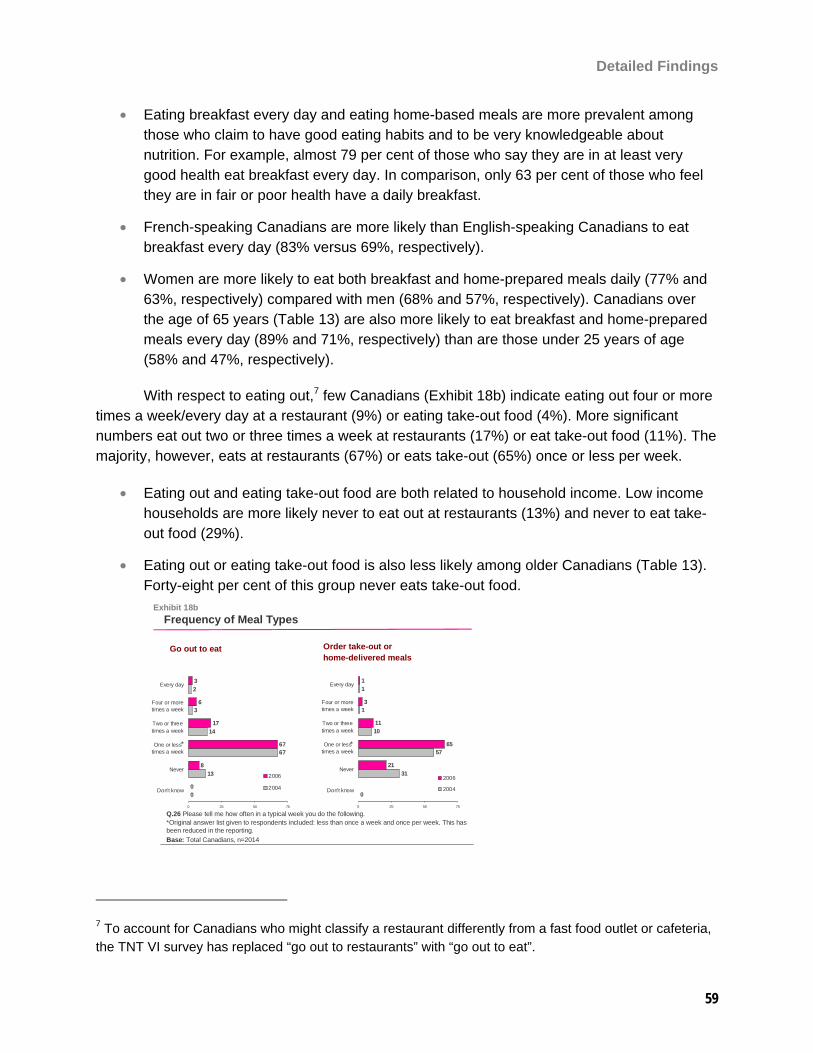
Detailed Findings
59
• Eating breakfast every day and eating home-based meals are more prevalent among those who claim to have good eating habits and to be very knowledgeable about nutrition. For example, almost 79 per cent of those who say they are in at least very good health eat breakfast every day. In comparison, only 63 per cent of those who feel they are in fair or poor health have a daily breakfast.
• French-speaking Canadians are more likely than English-speaking Canadians to eat breakfast every day (83% versus 69%, respectively).
• Women are more likely to eat both breakfast and home-prepared meals daily (77% and 63%, respectively) compared with men (68% and 57%, respectively). Canadians over the age of 65 years (Table 13) are also more likely to eat breakfast and home-prepared meals every day (89% and 71%, respectively) than are those under 25 years of age (58% and 47%, respectively).
With respect to eating out,7 few Canadians (Exhibit 18b) indicate eating out four or more times a week/every day at a restaurant (9%) or eating take-out food (4%). More significant numbers eat out two or three times a week at restaurants (17%) or eat take-out food (11%). The majority, however, eats at restaurants (67%) or eats take-out (65%) once or less per week.
• Eating out and eating take-out food are both related to household income. Low income households are more likely never to eat out at restaurants (13%) and never to eat take-out food (29%).
• Eating out or eating take-out food is also less likely among older Canadians (Table 13). Forty-eight per cent of this group never eats take-out food.
Exhibit 18bFrequency of Meal Types
0
13
67
14
3
2
0
8
67
17
6
3
0 25 50 75
Don't know
Never
One or lesstimes a week
Two or threetimes a week
Four or moretimes a week
Every day
2006
2004
Go out to eat
Q.26 Please tell me how often in a typical week you do the following.*Original answer list given to respondents included: less than once a week and once per week. This has been reduced in the reporting.Base: Total Canadians, n=2014
Order take-out or home-delivered meals
0
31
57
10
1
1
21
65
11
3
1
0 25 50 75
Don't know
Never
One or lesstimes a week
Two or threetimes a week
Four or moretimes a week
Every day
2006
2004
* *
7 To account for Canadians who might classify a restaurant differently from a fast food outlet or cafeteria, the TNT VI survey has replaced “go out to restaurants” with “go out to eat”.
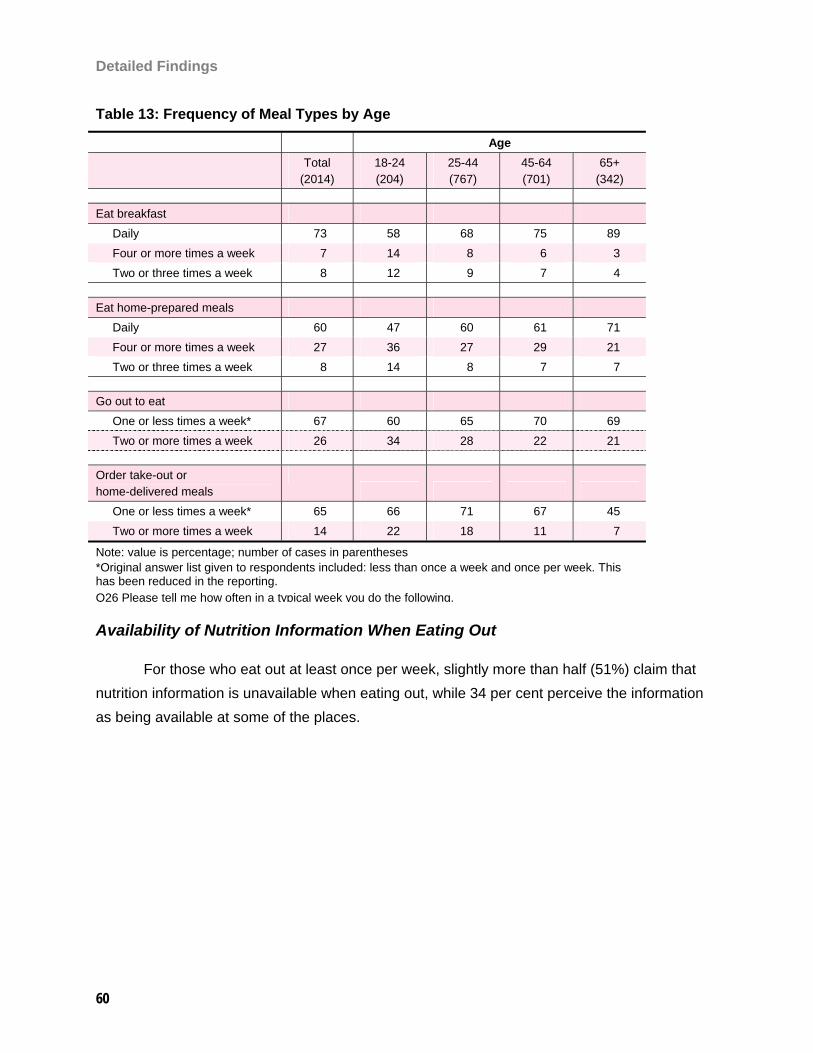
Detailed Findings
60
Table 13: Frequency of Meal Types by Age
Age Total
(2014) 18-24 (204)
25-44 (767)
45-64 (701)
65+ (342)
Eat breakfast Daily 73 58 68 75 89 Four or more times a week 7 14 8 6 3 Two or three times a week 8 12 9 7 4 Eat home-prepared meals Daily 60 47 60 61 71 Four or more times a week 27 36 27 29 21 Two or three times a week 8 14 8 7 7 Go out to eat One or less times a week* 67 60 65 70 69 Two or more times a week 26 34 28 22 21 Order take-out or home-delivered meals
One or less times a week* 65 66 71 67 45 Two or more times a week 14 22 18 11 7
Note: value is percentage; number of cases in parentheses *Original answer list given to respondents included: less than once a week and once per week. This has been reduced in the reporting. Q26 Please tell me how often in a typical week you do the following.
Availability of Nutrition Information When Eating Out
For those who eat out at least once per week, slightly more than half (51%) claim that nutrition information is unavailable when eating out, while 34 per cent perceive the information as being available at some of the places.
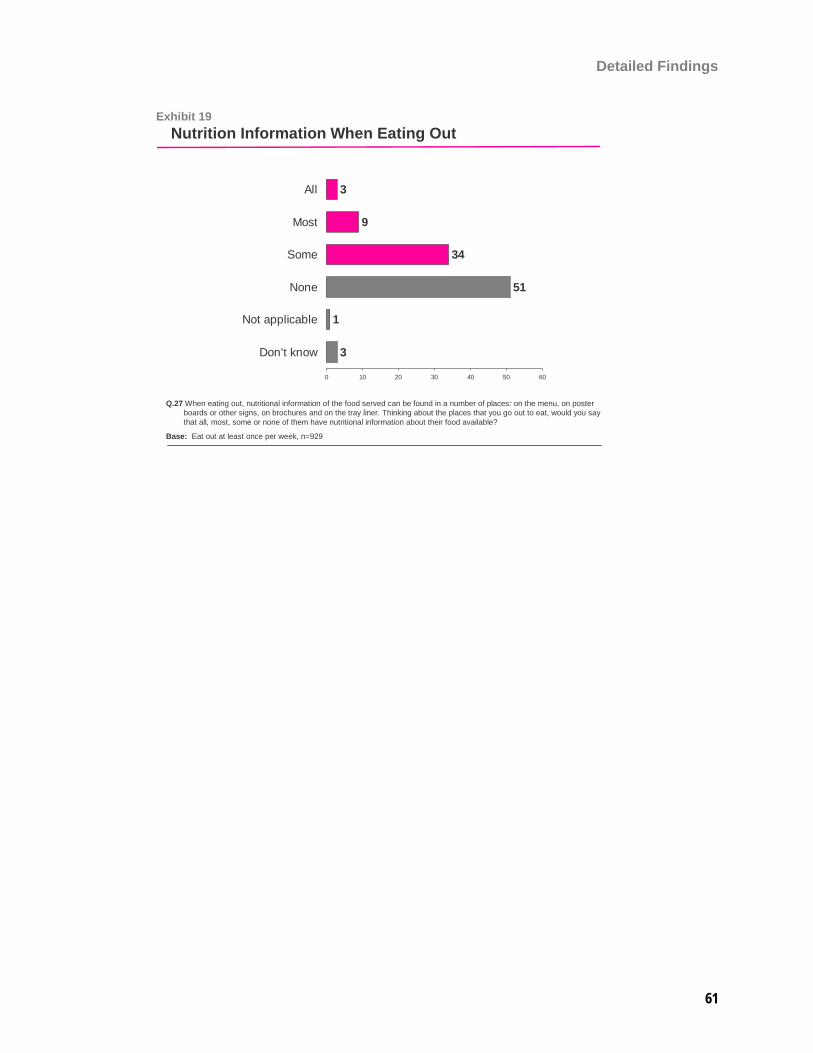
Detailed Findings
61
Exhibit 19Nutrition Information When Eating Out
Q.27 When eating out, nutritional information of the food served can be found in a number of places: on the menu, on poster boards or other signs, on brochures and on the tray liner. Thinking about the places that you go out to eat, would you say that all, most, some or none of them have nutritional information about their food available?
Base: Eat out at least once per week, n=929
3
1
51
34
9
3
0 10 20 30 40 50 60
Don't know
Not applicable
None
Some
Most
All
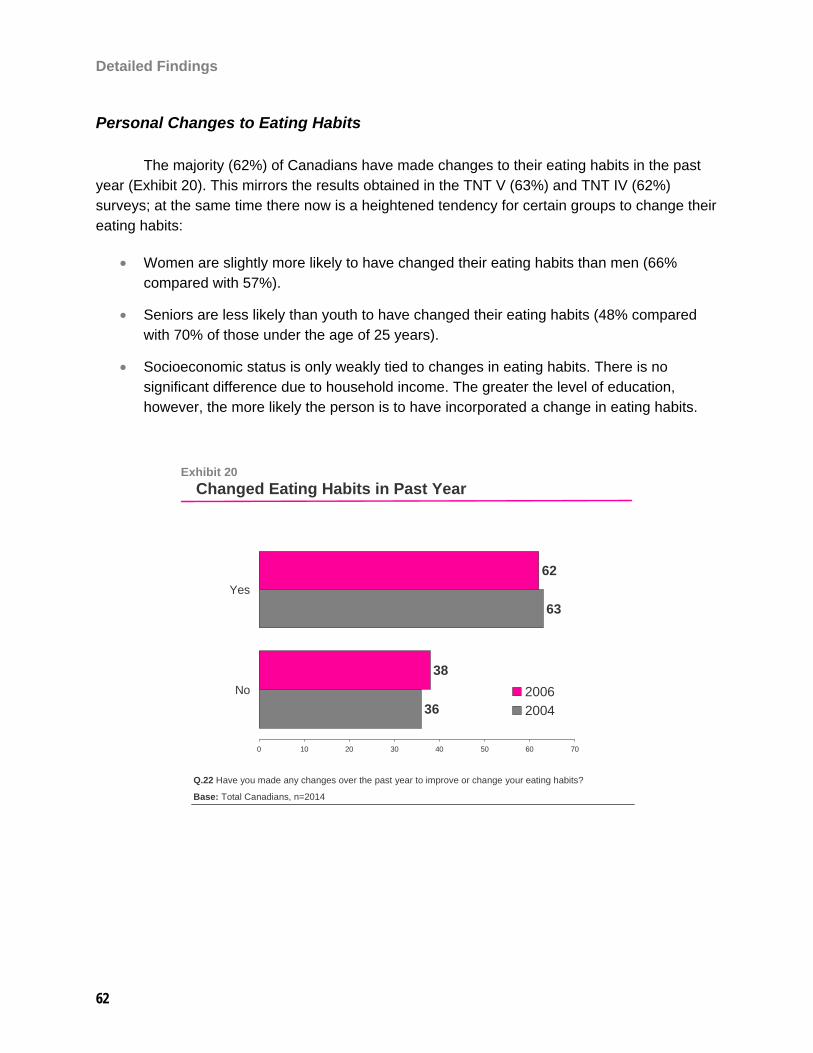
Detailed Findings
62
Personal Changes to Eating Habits
The majority (62%) of Canadians have made changes to their eating habits in the past year (Exhibit 20). This mirrors the results obtained in the TNT V (63%) and TNT IV (62%) surveys; at the same time there now is a heightened tendency for certain groups to change their eating habits:
• Women are slightly more likely to have changed their eating habits than men (66% compared with 57%).
• Seniors are less likely than youth to have changed their eating habits (48% compared with 70% of those under the age of 25 years).
• Socioeconomic status is only weakly tied to changes in eating habits. There is no significant difference due to household income. The greater the level of education, however, the more likely the person is to have incorporated a change in eating habits.
Exhibit 20Changed Eating Habits in Past Year
Q.22 Have you made any changes over the past year to improve or change your eating habits?
Base: Total Canadians, n=2014
36
63
38
62
0 10 20 30 40 50 60 70
No
Yes
20062004
Detailed Findings
63
Type of Change or Improvement
Among those who have changed their eating habits in the past year, no single type of change has occurred. Rather, changes and improvements are varied and diverse, a finding that is consistent with the results from the previous surveys. There is, however, a notable pattern and the occasional change from last year in eating habits.
Thirty-five per cent of Canadians think of their diet changes in terms of increasing the amount of fruits and vegetables they consume (Exhibit 21). This mention has modestly increased from the TNT V study where fruits and vegetables accounted for 32 per cent of the mentions.
Trying to consume less fat is also important for many Canadians (20%). Almost one in five (19%) tried to reduce sugar intake and 15 per cent to eat more fibre, whole grain or roughage. Some tried to reduce calorie intake (12%); eat more natural food, food with less chemicals, less processed food or less fast food (10%); consume less trans fat (8%); reduce salt intake (8%); restrict carbohydrates (8%) and eat well-balanced healthy meals (6%).
The various changes and improvements demonstrate a wide array of general knowledge Canadians who changed their eating habits have on the value of nutrition and healthful eating. Over the past three iterations of TNT surveys, there have been more and more mentions of increasing intake of fruits and vegetables. The proportion of people who say they are reducing their carbohydrate intake more than doubled between TNT IV and TNT V (from 7% to 16%) but it has fallen now to 8 per cent. Though Canadians who have changed their habits are preoccupied with fat (20%), fewer have made an attempt to eat less trans fatty acids (8%), the same as in TNT V.
Meanwhile, other mentions remain virtually unchanged from the TNT V survey results, including trying to eat less meat (4% in TNT V; 5 % in TNT VI), eat organic food (4% in both TNT V and TNT VI) and drink more water (2% in TNT V; 4% in TNT VI).
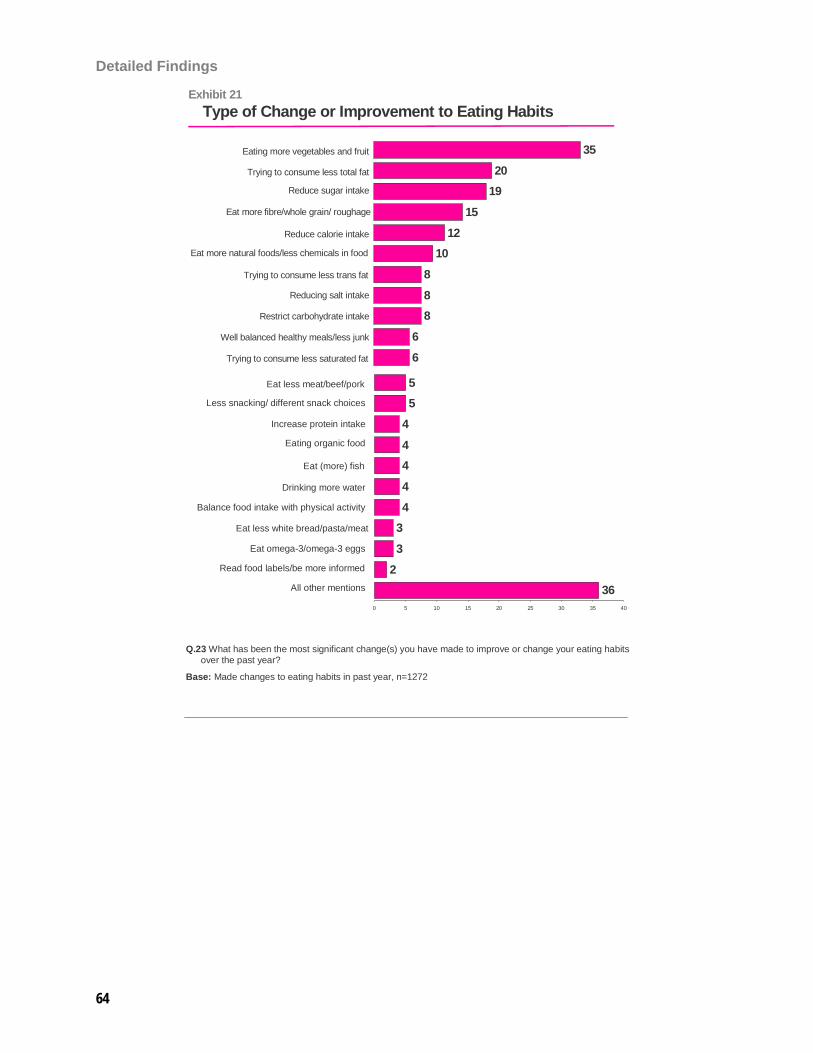
Detailed Findings
64
6
6
88
8
1012
15
1920
35
0 5 10 15 20 25 30 35 40
Exhibit 21Type of Change or Improvement to Eating Habits
Eating more vegetables and fruit
Trying to consume less total fat
Reduce sugar intake
Reduce calorie intake
Eat more natural foods/less chemicals in food
Trying to consume less trans fat
Reducing salt intake
Restrict carbohydrate intake
Well balanced healthy meals/less junk
Trying to consume less saturated fat
Eat more fibre/whole grain/ roughage
3623
344
44
455
0 5 10 15 20 25 30 35 40
Eat less meat/beef/pork
Less snacking/ different snack choices
Increase protein intake
Eating organic food
Eat (more) fish
Drinking more water
Balance food intake with physical activity
Eat less white bread/pasta/meat
Eat omega-3/omega-3 eggs
All other mentions
Q.23 What has been the most significant change(s) you have made to improve or change your eating habits over the past year?
Base: Made changes to eating habits in past year, n=1272
Read food labels/be more informed
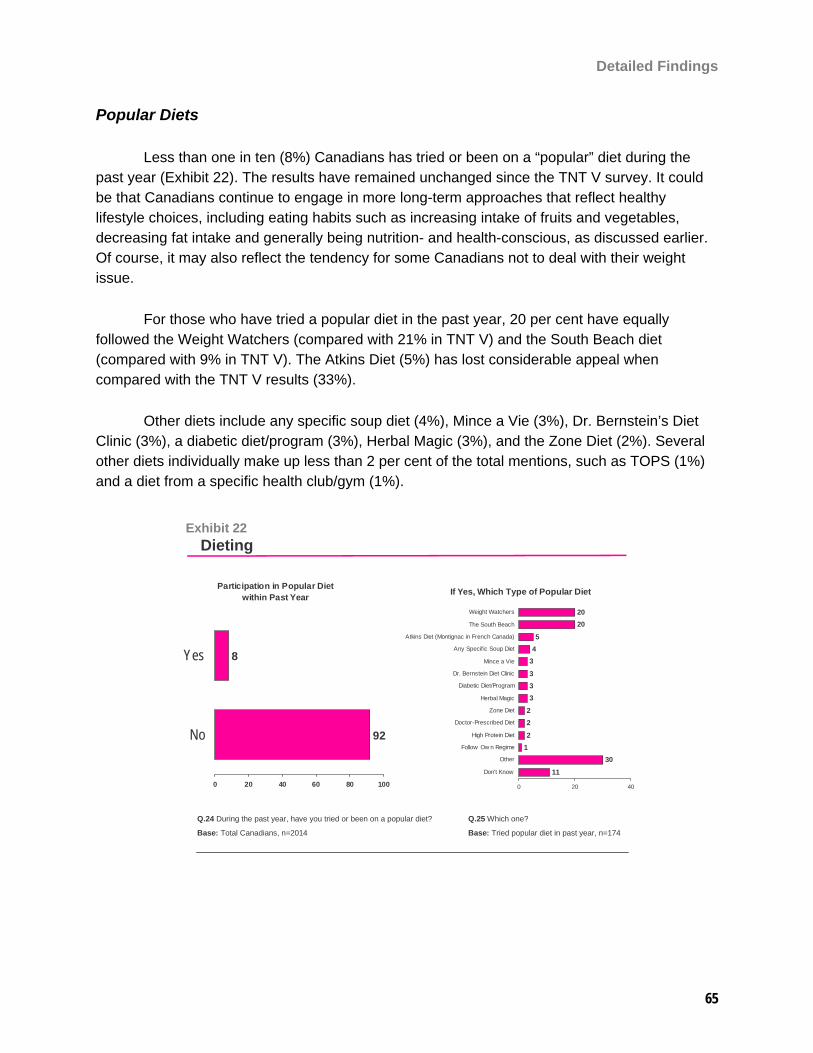
Detailed Findings
65
Popular Diets
Less than one in ten (8%) Canadians has tried or been on a “popular” diet during the past year (Exhibit 22). The results have remained unchanged since the TNT V survey. It could be that Canadians continue to engage in more long-term approaches that reflect healthy lifestyle choices, including eating habits such as increasing intake of fruits and vegetables, decreasing fat intake and generally being nutrition- and health-conscious, as discussed earlier. Of course, it may also reflect the tendency for some Canadians not to deal with their weight issue.
For those who have tried a popular diet in the past year, 20 per cent have equally followed the Weight Watchers (compared with 21% in TNT V) and the South Beach diet (compared with 9% in TNT V). The Atkins Diet (5%) has lost considerable appeal when compared with the TNT V results (33%).
Other diets include any specific soup diet (4%), Mince a Vie (3%), Dr. Bernstein’s Diet Clinic (3%), a diabetic diet/program (3%), Herbal Magic (3%), and the Zone Diet (2%). Several other diets individually make up less than 2 per cent of the total mentions, such as TOPS (1%) and a diet from a specific health club/gym (1%).
Participation in Popular Diet within Past Year
92
8
0 20 40 60 80 100
No
Yes
Exhibit 22Dieting
Q.24 During the past year, have you tried or been on a popular diet? Q.25 Which one?
Base: Total Canadians, n=2014 Base: Tried popular diet in past year, n=174
If Yes, Which Type of Popular Diet
11
3012
22
333
345
2020
0 20 40
Don't Know
Other
Follow Ow n Regime
High Protein Diet
Doctor-Prescribed Diet
Zone Diet
Herbal Magic
Diabetic Diet/Program
Dr. Bernstein Diet Clinic
Mince a Vie
Any Specif ic Soup Diet
Atkins Diet (Montignac in French Canada)
The South Beach
Weight Watchers
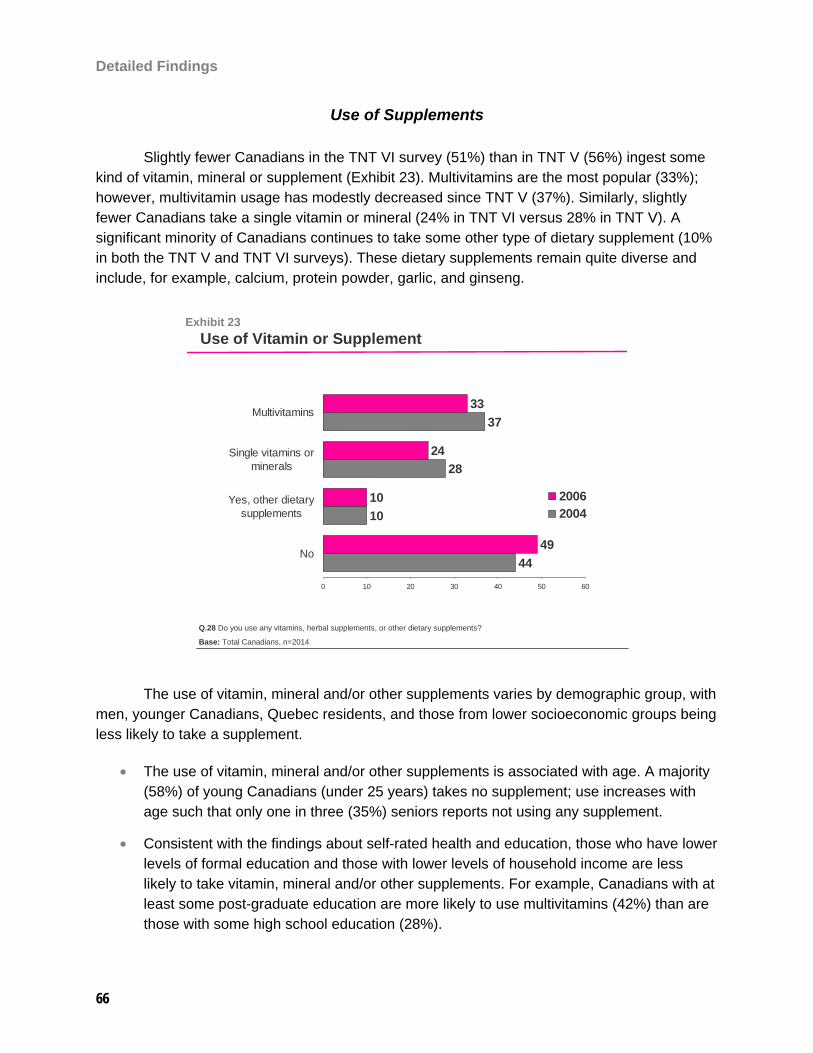
Detailed Findings
66
Use of Supplements
Slightly fewer Canadians in the TNT VI survey (51%) than in TNT V (56%) ingest some kind of vitamin, mineral or supplement (Exhibit 23). Multivitamins are the most popular (33%); however, multivitamin usage has modestly decreased since TNT V (37%). Similarly, slightly fewer Canadians take a single vitamin or mineral (24% in TNT VI versus 28% in TNT V). A significant minority of Canadians continues to take some other type of dietary supplement (10% in both the TNT V and TNT VI surveys). These dietary supplements remain quite diverse and include, for example, calcium, protein powder, garlic, and ginseng.
Exhibit 23Use of Vitamin or Supplement
Q.28 Do you use any vitamins, herbal supplements, or other dietary supplements?
Base: Total Canadians, n=2014
44
10
28
37
49
10
24
33
0 10 20 30 40 50 60
No
Yes, other dietarysupplements
Single vitamins orminerals
Multivitamins
20062004
The use of vitamin, mineral and/or other supplements varies by demographic group, with men, younger Canadians, Quebec residents, and those from lower socioeconomic groups being less likely to take a supplement.
• The use of vitamin, mineral and/or other supplements is associated with age. A majority (58%) of young Canadians (under 25 years) takes no supplement; use increases with age such that only one in three (35%) seniors reports not using any supplement.
• Consistent with the findings about self-rated health and education, those who have lower levels of formal education and those with lower levels of household income are less likely to take vitamin, mineral and/or other supplements. For example, Canadians with at least some post-graduate education are more likely to use multivitamins (42%) than are those with some high school education (28%).
Detailed Findings
67
• Men are more likely than women not to take any form of vitamin, mineral and/or other supplement (58% and 41%, respectively).
• In addition, those who rate their eating habits better and those who claim to be knowledgeable about nutrition are more likely to use vitamin, mineral and/or other supplements. For example, Canadians who say they are very knowledgeable about nutrition (37%) are more likely than those with little knowledge (20%) to use multivitamins.
• Residents of Quebec are less likely to use single vitamin or mineral supplements (14%) than are Canadians in the British Columbia region (34%).

Appendix
68
Appendix 1: Questionnaire
English Serial: Q, RANGE 1 .. 99999 DEF 99999,
QT Serial number
Hello, my name is [INTERVIEWER] and I'm calling from TNS Canadian Facts, an international research company. Today we are conducting a survey about nutrition and would like to ask you some questions. The study will take approximately 15 minutes to complete and I can assure you that we are not selling anything.
To randomly select a person in your household , may I speak to the individual living in your household, who is 18 years or older who had the most recent birthday, and is presently at home.
USE STANDARD CALL OUTCOME CODING
WHEN SPEAKING TO CORRECT PERSON
REPEAT INTRO IF NECESSARY
Please be aware this call may be monitored for quality control purposes.
Q3: S,
QT RECORD GENDER OF RESPONDENT
(DO NOT READ)
AL MALE
FEMALE
SECTION 1 - EATING HABITS
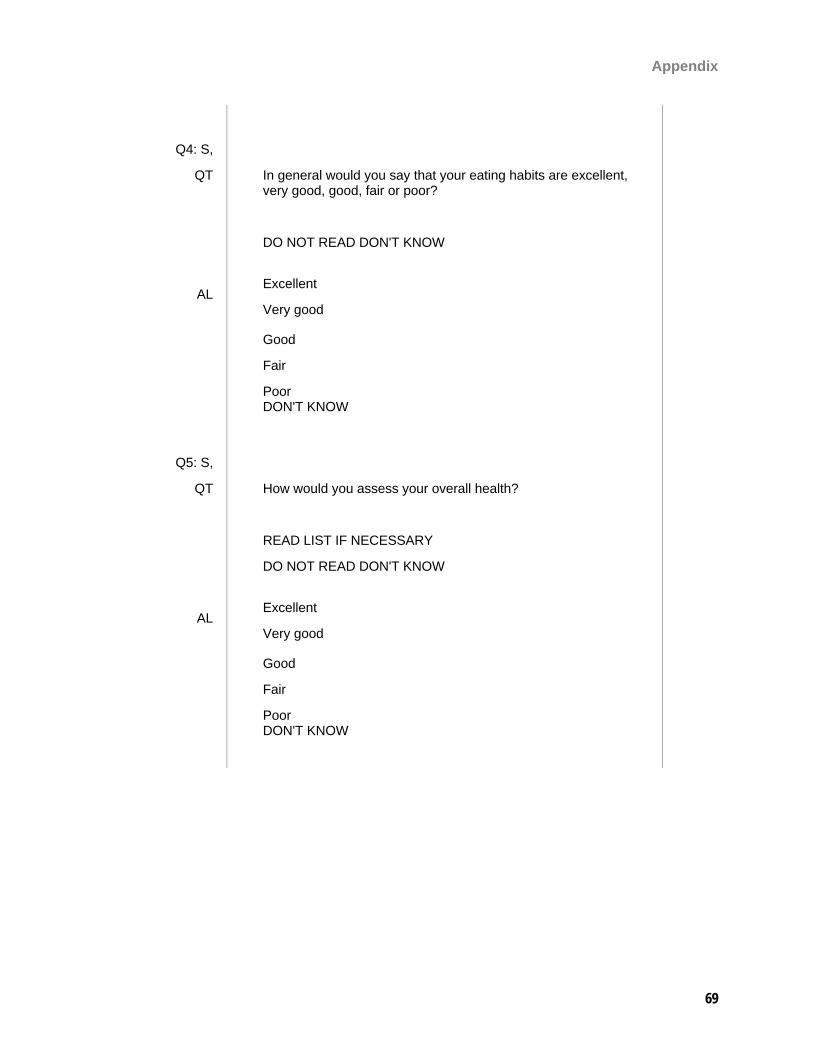
Appendix
69
Q4: S,
QT In general would you say that your eating habits are excellent, very good, good, fair or poor?
DO NOT READ DON'T KNOW
AL Excellent
Very good Good
Fair
Poor
DON'T KNOW
Q5: S,
QT How would you assess your overall health?
READ LIST IF NECESSARY
DO NOT READ DON'T KNOW
AL Excellent
Very good Good
Fair
Poor
DON'T KNOW
Appendix
70
Q6: S,
QT Are you the primary meal planner in your household?
READ ANSWER LIST IF NECESSARY
DO NOT READ DON'T KNOW
AL Yes
No Shared equally DON'T KNOW
SECTION 2 - ATTITUDES ABOUT FOOD AND NUTRITION
Q7: S,
QT What makes a food "healthy"?
RECORD FIRST THREE MENTIONS
DO NOT READ LIST
AL Absence of negative nutrients (trans free, sat fat free, salt free)
Lower in negative nutrients (trans, fat, salt, sugar) Contains good nutrients (whole grains, fibre, omega 3, vitamins
and minerals)
Fresh format (not processed)
No preservatives, artificial flavour or colour, no MSG
Organic
Natural, all natural
GMO Free
Has an endorsement on pack (third party)
Has company endorsement on pack (manufacturer logo)
OTHER SPECIFY
Appendix
71
Q8A: S,
QT When you are selecting food to eat, to what degree, if any, does each of the following influence your food choice?
(How much influence is...)
RANDOMIZE MT LIST
READ ANSWER LIST AS OFTEN AS NECESSARY
DO NOT READ "DON'T KNOW" OR "REFUSED"
AL Very influential
Somewhat influential Not too much
Not at all
DON'T KNOW
REFUSED
RANDOMIZE LIST
Maintaining good health
Following a special or prescribed diet
Weight Management/Body Image
To get energy or stamina
Appendix
72
Q8B: S,
QT When you are selecting food to eat, to what degree, if any, does each of the following influence your food choice?
(How much influence is...)
RANDOMIZE MT LIST
READ ANSWER LIST AS OFTEN AS NECESSARY
DO NOT READ "DON'T KNOW" OR "REFUSED"
NOTE TO INTERVIEWERS: IF RESPONDENT IS NOT AWARE OF WHAT LOW GLYCEMIC INDEX IS, PLEASE CODE AS "DON'T KNOW"
DO NOT READ "DON'T KNOW" OR "REFUSED"
AL Very influential
Somewhat influential Not too much
Not at all
DON'T KNOW
REFUSED
RANDOMIZE LIST
If the food is organically grown
A food that has added nutrients or ingredients such as calcium or soy
A food produced using biotechnology
A food that has a low glycemic index
If it is made from whole grains
If it contains Omega-3 fatty acids
Appendix
73
IF "NOT AT ALL" OR "NOT TOO MUCH" TO ANY OF THE FOOD CHARACTERISTICS LISTED ASK Q8C OTHERS SKIP TO Q9.
READ ONLY THOSE THAT RESPONDENT ANSWERED "NOT TOO MUCH" OR "NOT AT ALL"
Q8C: S,
QT I am going to list a series of food characteristics that you do not find influential. Please tell me if they do not influence your food choice because you are not aware of the health benefits or you do not care about the health benefits.
AL Not Aware
Do not care OTHER SPECIFY (VOLUNTEERED) Don't know
If the food is organically grown
A food that has added nutrients or ingredients such as calcium or soy
A food produced using biotechnology
A food that has a low glycemic index
If it is made from whole grains
If it contains Omega-3 fatty acids
Appendix
74
ASK ALL
Q9: S,
QT Please tell me how important each of the following factors is to you when choosing the food you eat. Would you say that it is very important, somewhat important, not very important,
or not at all important?
(How important is...)
RANDOMIZE MT LIST
READ ANSWER LIST AS OFTEN AS NECESSARY
DO NOT READ "DON'T KNOW" OR "REFUSED"
AL Very Important
Somewhat important Not very important
Not at all important
DON'T KNOW
REFUSED
Nutrition
Taste
Convenience or ease of preparation
Cost
Q10: S,
QT How knowledgeable would you say you are about nutrition? Would you say you are...?
READ LIST.
DO NOT READ NO OPINION - DON'T KNOW
Appendix
75
AL Very knowledgeable
Somewhat knowledgeable Not very knowledgeable
Not at all knowledgeable
NO OPINION - DON'T KNOW
Q11: M* OPEN,
QT Could you name food safety issues that concern you personally?
OPEN ENDED. TAKE UP TO THREE MENTIONS.
IF AT Q9 "NUTRITION" IS "VERY IMPORTANT" OR "SOMEWHAT IMPORTANT", ASK Q12.
OTHERS SKIP TO Q13.
Q12: S,
QT How often, if ever, do you select the foods that you eat based on the amount of a specific nutrient that the food contains? As I read you each item, please tell me whether you select the foods based on the content of this nutrient often, sometimes, rarely or never.
RANDOMIZE MT LIST
READ ANSWER LIST AS OFTEN AS NECESSARY
DO NOT READ "DON'T KNOW"
AL Often
Sometimes Rarely
Never
DON'T KNOW
Appendix
76
RANDOMIZE LIST
Calories/Energy
Total Fat
Saturated Fat
Trans Fatty Acids
Cholesterol
Carbohydrate
Fibre
Sugar
Protein
Salt/Sodium
Vitamins
Iron
Calcium
ASK ALL
Q13: S,
QT Some foods contain added vitamins and minerals. How important is it for you to know if the following foods contain added vitamins and minerals? Would you say that it is very important, somewhat important, not very important, not at all important, or do you not buy these types of foods.
RANDOMIZE LIST
AL Very important
Somewhat important Not very important
Not at all important
I do not buy this type of food
DON'T KNOW
Appendix
77
Pasta
Bars (if asked, energy/snack/cereal)
Breakfast cereals
Beverages such as flavoured drinks or carbonated beverages
Q14: S,
QT Some foods that are part of our usual diet are called functional foods because they have additional benefits and reduce the risk of chronic disease beyond providing nutrients. Have you ever heard about functional foods before this survey?
AL YES
NO DON'T KNOW
Q15: S,
QT I will read you some statements. Please tell me whether you strongly agree, somewhat agree, neither agree nor disagree, somewhat disagree or strongly disagree with each of the following statements.
RANDOMIZE MT LIST
READ ANSWER LIST AS OFTEN AS NECESSARY
DO NOT READ "DON'T KNOW"
AL Strongly agree
Somewhat agree Neither
Somewhat disagree
Strongly disagree
DON'T KNOW
Appendix
78
RANDOMIZE LIST
Some types of dietary fibre can help reduce cholesterol in your blood.
Trans fatty acids have the same effect as saturated fat.
Reducing fat in the diet can lower cholesterol in the blood.
A high fibre diet may help prevent colon cancer.
The amount of cholesterol people eat is the major factor that affects their blood cholesterol.
Non-hydrogenated or soft margarine contains less fat than butter.
Hard, stick margarine is better for you than soft margarine.
The glycemic index ranks carbohydrate foods on how they affect our blood glucose levels.
Omega-3 fatty acids are essential to a healthy diet.
SECTION 3 - SOURCES OF INFORMATION
Q16: S,
QT People can get information about food and nutrition from a number of different sources. Please tell me from which of the following sources you personally got information on food and nutrition in the past year.
(Did you get food and nutrition information in the past year from.. INSERT MT?)
RANDOMIZE MT LIST
DO NOT READ "DON'T KNOW"
AL YES
NO DON'T KNOW
Appendix
79
RANDOMIZE LIST
A Family Physician or other health professional
A Dietitian
Magazines, newspapers, and books
Government Materials
Food Company Materials or advertisements
Radio/TV Programs
Food product labels
Friends/Relatives/Colleagues
Fitness/Weight Loss Programs
Health Association Materials(Cancer/Heart/Diabetic Association)
The Internet or the Web
SECTION 4 - LABELLING
Q17: S,
QT Thinking specifically about labels on the various food products you buy (other than brand name or flavour), how often do you read the labels? Would you say that you always, usually, sometimes, only the first time you buy a product, or never read the labels?
AL Always
Usually Sometimes
Only the first time I buy a product/brand
Never
Appendix
80
IF OTHER THAN "NEVER" AT Q17 ASK Q18, Q19 AND Q20
IF "NEVER" AT Q17 SKIP TO Q21
Q18: S,
QT When you are looking at the labels, which of the following do you look for?
READ LIST EXCEPT "NONE OF THESE"
AL The nutrition facts table or nutrition information panel
Ingredients Nutrient claims such as the amount of a particular ingredient
Health claims such as statements on the benefits of eating the food for your health
A healthy or better choices slogan, symbol or logo
NONE OF THESE
Q19: S,
QT When you look at the Information on food packages, either in the store or at home, how often, if at all, do you use the information provided in the following ways. Would you say often, sometimes, rarely or never?
(How often do you use the information...)
RANDOMIZE MT LIST
READ ANSWER LIST AS OFTEN AS NECESSARY
DO NOT READ "DON'T KNOW"
AL Often
Sometimes Rarely
Never
DON'T KNOW
Appendix
81
a) to compare different types of foods with each other, for example, to compare granola bars and cookies.
b) to compare similar types of foods with each other, for example, to compare two different brands of crackers.
c) to figure out how much of a food product you or your family should eat.
d) to get a general idea of the calorie content of a food.
e) to see whether the food contains a specific ingredient.
f) to see whether the food contains nuts.
g) to see how much of a nutrient is in a product,such as the amount of fat, carbohydrate, fibre or vitamins.
h) to find foods that claim to be good for your health (for example, "A healthy diet rich in a variety of vegetables and fruit may help reduce the risk of some types of cancer").
i) to see whether the food is organic.
Q20: S,
QT When you look for nutrition related information on the label, how often can you generally find the information you need?
READ ANSWER LIST
DO NOT READ "DON'T KNOW"
AL Often
Sometimes Rarely
Never
DON'T KNOW
Appendix
82
ASK ALL
Q21A: S,
QT Are there any particular claims or statements made by food companies regarding the nutritional or health benefits of their food that attracted your attention over the past 12 months?
AL YES
NO DON"T KNOW
ASK Q21B IF "YES" TO Q21A
OTHERS GO TO Q22
Q21B: M* OPEN,
QT What was the food claim or statement that attracted your attention?
SECTION 5 - LIFESTYLE
ASK ALL
Q22: S,
QT Have you made any changes over the past year to improve or change your eating habits?
DO NOT READ LIST
AL YES
NO DON'T KNOW - NOT SURE - CAN'T REMEMBER
Appendix
83
IF YES TO Q22 ASK Q23
IF NO OR DON'T KNOW AT Q22 SKIP TO Q24
Q23: S,
QT What has been the most significant change(s) you have made to improve or change your eating habits over the past year?
DO NOT READ LIST. ACCEPT ALL MENTIONS
PROGRAMMER NB OTHER SPECIFY
AL INCREASE PROTEIN INTAKE
RESTRICT CARBOHYDRATES INTAKE REDUCING SALT INTAKE
TRYING TO CONSUME LESS TOTAL FAT
TRYING TO CONSUME LESS SATURATED FAT
TRYING TO CONSUME LESS TRANS FAT
EATING MORE VEGETABLES
EATING MORE FRUITS
EATING ORGANIC FOOD
LESS SNACKING
DIFFERENT SNACK CHOICES
REDUCE SUGAR INTAKE
REDUCING CALORIE INTAKE - EATING LESS - WATCHING WEIGHT
REDUCING CAFFEINE INTAKE
TAKING VITAMINS - MINERAL SUPPLEMENTS
EAT MORE FIBRE/ROUGHAGE
EAT MORE WHOLE GRAINS
EAT YOGURT
BALANCE FOOD INTAKE WITH PHYSICAL ACTIVITY
OTHER DIET-RELATED (SPECIFY)
DON'T KNOW (VOLUNTEERED)

Appendix
84
ASK ALL
Q24: S,
QT During the past year, have you tried or been on a popular diet?
AL Yes
No Refused
IF YES TO Q24 ASK Q25
OTHERS SKIP TO Q26
Q25: S,
QT IF YES TO Q24
Which one?
DO NOT READ LIST
ACCEPT ALL MENTIONS
AL WEIGHT WATCHERS
ATKINS DIET (MONTIGNAC IN FRENCH CANADA) JENNY CRAIG
DR. BERNSTEIN DIET CLINIC
ZONE DIET
SCARSDALE DIET
L.A. PLAN
SLIM FAST - MEAL REPLACEMENTS
DIET PILLS
HERBAL LIFE
OTHER SPECIFY

Appendix
85
Q26: S,
QT Please tell me how often in a typical week you do the following:
READ ANSWER LIST AS OFTEN AS NECESSARY
DO NOT READ "DON'T KNOW"
AL Every day
Four or more times a week Two or three times a week
Once per week
Less than once a week
Never
DON'T KNOW
DO NOT RANDOMIZE LIST
a) Eat home-prepared meals (IF ASKED, INCLUDES BREAKFAST, LUNCH AND DINNER)
b) Order take-out or home delivered meals (IF ASKED, INCLUDES BREAKFAST, LUNCH AND DINNER)
c) Eat breakfast
d) Go out to eat (IF ASKED, INCLUDES BREAKFAST, LUNCH AND DINNER; IF ASKED, RESTAURANTS, FAST FOOD OUTLETS AND CAFETERIAS)
IF "GO OUT TO EAT" AT LEAST ONCE PER WEEK IN Q26, ASK Q27
OTHERS SKIP TO Q28
Appendix
86
Q27: S,
QT When eating out, nutritional information of the food served can be found in a number of places: on the menu, on posterboards or other signs, on brochures and on the tray liner. Thinking about the places that you go out to eat, would you say that all, most, some or none of them have nutritional information about their food available.
AL All
Most Some
None
NOT APPLICABLE
DON'T KNOW
ASK ALL
Q28: S,
QT Do you use any vitamins, herbal supplements, or other dietary supplements?
NB SPECIFY
AL Yes, multi-vitamins
Yes, single vitamins or mineral Yes, other dietary supplements SPECIFY
No
Appendix
87
SECTION 6 - DEMOGRAPHICS
I have just a few more questions to help us classify your responses.
D1: S,
QT What is your current marital status?
READ LIST IF NECESSARY
DO NOT READ REFUSED
AL Single, never married
Married Living together or common law
Divorced
Separated
Widowed
REFUSED
D2: Q,
QT How many people are living in your household?
D3: S,
QT IF >1 AT D2
Do you have any children under the age of 18 who currently live at home with you?
AL YES
NO Refused

Appendix
88
D4: S,
QT IF CHILDREN UNDER 18 AT D3
How many of these children are...
RECORD NUMBER FOR EACH AGE
AL newborn to 5 years
6 to 11 years 12 to 17 years
D5: S,
QT Which of the following categories includes your age?
READ LIST
DO NOT READ REFUSED
AL 18 to 24
25 to 34 35 to 44
45 to 54
55 to 64
65 to 75
Over 75
REFUSED
D6: S,
QT What is the highest level of formal education you have completed?
READ LIST IF NECESSARY
DO NOT READ DON'T KNOW/REFUSED

Appendix
89
AL SOME GRADE/PRIMARY SCHOOL
GRADUATED GRADE/PRIMARY SCHOOL SOME HIGH/SECONDARY SCHOOL
GRADUATED HIGH/SECONDARY SCHOOL
SOME COMMUNITY COLLEGE/TECHNICAL COLLEGE/CEGEP
GRADUATED COMMUNITY COLLEGE/TECHNICAL COLLEGE/CEGEP
SOME UNDERGRADUATE UNIVERSITY
GRADUATED UNDERGRADUATE UNIVERSITY
SOME POST-GRADUATE UNIVERSITY
GRADUATED POST-GRADUATE UNIVERSITY
OTHER
DON'T KNOW/REFUSED
D7: S,
QT For statistical purposes only, what is the total household income before taxes, that is, the total income of all members in this household? Would it be $50,000 or more, or would it be less than $50,000 per year?
AL $50,000 OR OVER
UNDER $50,000 DON'T KNOW
REFUSED
IF D7 UNDER $50,000 ASK D8
IF D7 OVER $50,000 ASK D9

Appendix
90
D8: S,
QT Would it be...
READ LIST
DO NOT READ DON'T KNOW/REFUSED
AL $45,000 to $49,999
$35,000 to $44,999 $25,000 to $34,999
$15,000 to $24,999
Less than $15,000
DON'T KNOW
REFUSED
D9: S,
QT Would it be...?
READ LIST.
DO NOT READ DON'T KNOW OR REFUSED
AL $50,000 to $59,999
$60,000 to $74,999 $75,000 to $79,999
$80,000 to $99,999
$100,000 or more
DON'T KNOW
REFUSED
TIMING FOR REGULAR SURVEY TO STOP HERE.
ASK NEXT QUESTIONS ONLY DURING PRETEST.
Appendix
91
PT1: S,
QT How clear do you feel this survey was?
READ LIST IF NECESSARY
DO NOT READ DON'T KNOW
AL Very Clear
Somewhat Clear Somewhat Unclear
Very Unclear
DON'T KNOW/NOT SURE
PT2: M* OPEN,
QT Do you have any comments about this survey, for example, was there anything you could not understand or that could be clarified?
RECORD VERBATIM RESPONSE. NOT TO BE CODED - PROVIDE AS VERBATIM ONLY
Thank you very much for participating in this survey.
Appendix
92
French Serial: Q, RANGE 1 .. 99999 DEF 99999,
QT Serial number
Bonjour/Bonsoir, mon nom est [INTERVIEWEUR] de TNS Canadian Facts, une firme internationale de recherche. Aujourd'hui, nous effectuons un sondage sur la nutrition et nous aimerions vous poser quelques questions. Le sondage prendra environ 15 minutes et je peux vous assurer que nous ne vendons rien.
Afin de sélectionner aléatoirement une personne dans votre foyer, puis-je parler à la personne de 18 ans ou plus dans votre foyer, qui a été la dernière à avoir son anniversaire de naissance et qui est présentement à la maison.
UTILISEZ LE CODAGE DE RÉSULTATS D'APPELS STANDARD
LORSQUE VOUS AVEZ LA BONNE PERSONNE EN LIGNE
RÉPÉTEZ L'INTRODUCTION AU BESOIN
Afin d'assurer le contrôle de la qualité il se peut que quelqu'un d'autre écoute cet appel.
Q3: S,
QT INSCRIVEZ LE SEXE DU RÉPONDANT
(NE LISEZ PAS)
AL HOMME
FEMME
Appendix
93
SECTION 1 - HABITUDES ALIMENTAIRES
Q4: S,
QT Diriez-vous qu'en général vos habitudes alimentaires sont excellentes, très bonnes, bonnes, passables ou mauvaises?
NE LISEZ PAS «NE SAIT PAS»
AL Excellentes
Très bonnes Bonnes
Passables
Mauvaises
NE SAIT PAS
Q5: S,
QT Comment évalueriez-vous votre état de santé général?
LISEZ LA LISTE AU BESOIN
NE LISEZ PAS «NE SAIT PAS»
AL Excellent
Très bon Bon
Passable
Mauvais
NE SAIT PAS
Q6: S,
QT Êtes-vous principalement responsable de la planification des repas dans votre foyer?
LISEZ LA LISTE AU BESOIN
NE LISEZ PAS «NE SAIT PAS»
Appendix
94
AL Oui
Non Vous la partagez à parts égales avec quelqu'un d'autre
NE SAIT PAS
SECTION 2 - ATTITUDES ENVERS LA NOURRITURE ET LA NUTRITION
Q7: S,
QT Quelles sont les caractéristiques d'un aliment «sain»?
ENTREZ LES 3 PREMIÈRES MENTIONS
NE LISEZ PAS LA LISTE
AL Ne contient pas de nutriments négatifs (sans gras trans, sans gras saturés, sans sel)
Contient moins de nutriments négatifs (trans, gras, sel, sucre)
Contient de bons nutriments (grains entiers, fibres, oméga-3, vitamines et minéraux)
Est frais (pas transformé)
Sans agents de conservation, saveur ou colorant artificiel, sans MSG
Biologique
Naturel, tout naturel
Sans OGM
A un endossement sur l'emballage (tierce partie)
A l'endossement de la compagnie sur l'emballage (logo du fabricant)
AUTRE PRÉCISEZ
Appendix
95
Q8A: S,
QT Quand vous choisissez des aliments à manger, dans quelle mesure chacun des éléments suivants a-t-il une influence sur votre choix d'aliments?
(Diriez-vous que l'élément suivant a beaucoup, assez, pas tellement ou aucune influence sur votre choix?)
RANDOMIZE MT LIST
LISEZ LA LISTE AUSSI SOUVENT QU'IL LE FAUT
NE LISEZ PAS «NE SAIT PAS» OU «REFUSE»
AL Beaucoup d'influence
Assez d'influence Pas tellement d'influence
Aucune influence
NE SAIT PAS
REFUSE
RANDOMIZE LIST
Maintenir une bonne santé
Suivre un régime alimentaire spécial ou prescrit
Gérer son poids/image corporelle
Pour avoir de l'énergie ou de l'endurance

Appendix
96
Q8B: S,
QT Quand vous choisissez des aliments à manger, dans quelle mesure chacun des éléments suivants a-t-il une influence sur votre choix d'aliments?
(Diriez-vous que l'élément suivant a beaucoup, assez, pas tellement ou aucune influence sur votre choix?)
RANDOMIZE MT LIST
LISEZ LA LISTE AUSSI SOUVENT QU'IL LE FAUT
NE LISEZ PAS «NE SAIT PAS» OU «REFUSE»
NOTE TO INTERVIEWERS: SI LE RÉPONDANT NE SAIT PAS CE QU'EST UN INDICE GLYCÉMIQUE FAIBLE, VEUILLEZ CODER COMME «NE SAIT PAS»
NE LISEZ PAS «NE SAIT PAS» OU «REFUSE»
AL Beaucoup d'influence
Assez d'influence Pas tellement d'influence
Aucune influence
NE SAIT PAS
REFUSE
RANDOMIZE LIST
Si l'aliment est biologique
Un aliment enrichi de nutriments ou d'ingrédients comme le calcium ou le soya
Un aliment issu de la biotechnologie
Un aliment qui a un faible indice glycémique
Est fait à partir de grains entiers
Contient des acides gras oméga-3

Appendix
97
IF "NOT AT ALL" OR "NOT TOO MUCH" TO ANY OF THE FOOD CHARACTERISTICS LISTED ASK Q8C OTHERS SKIP TO Q9.
READ ONLY THOSE THAT RESPONDENT ANSWERED "NOT TOO MUCH" OR "NOT AT ALL"
Q8C: S,
QT Je vais vous lire une série de caractéristiques sur les aliments qui ne vous influencent pas. Veuillez me dire si la caractéristique n'a pas d'influence sur votre choix d'aliments parce que vous ne connaissez pas ses bienfaits sur la santé ou parce que ses bienfaits sur la santé n'ont pas d'importance pour vous.
AL Ne connaît pas ses bienfaits
Les bienfaits n'ont pas d'importance AUTRE PRÉCISEZ (VOLONTAIRE)
Ne sait pas
Si l'aliment est biologique
Un aliment enrichi de nutriments ou d'ingrédients comme le calcium ou le soya
Un aliment issu de la biotechnologie
Un aliment qui a un faible indice glycémique
Est fait à partir de grains entiers
Contient des acides gras oméga-3
POSEZ À TOUS
Appendix
98
Q9: S,
QT Veuillez me dire dans quelle mesure chacun des facteurs suivants est important pour vous lorsque vous choisissez les aliments que vous mangez. Diriez-vous que ce facteur est très important, assez important, pas très important ou pas du tout important?
RANDOMIZE MT LIST
LISEZ LA LISTE AUSSI SOUVENT QU'IL LE FAUT
NE LISEZ PAS «NE SAIT PAS» OU «REFUSE»
AL Très important
Assez important Pas très important
Pas du tout important
NE SAIT PAS
REFUSE
La nutrition
Le goût
L'aspect pratique ou la facilité de préparation
Le coût
Q10: S,
QT Dans quelle mesure diriez-vous que vous êtes renseigné(e) sur la nutrition? Diriez-vous que vous êtes...?
LISEZ LA LISTE.
NE LISEZ PAS SANS OPINION - NE SAIT PAS
AL Très renseigné(e)
Assez renseigné(e) Pas très renseigné(e)
Pas du tout renseigné(e)
SANS OPINION - NE SAIT PAS

Appendix
99
Q11: M* OPEN,
QT Pouvez-vous nommer des problèmes de salubrité alimentaire qui vous préoccupent personnellement?
QUESTION OUVERTE. ENTREZ JUSQU'À TROIS MENTIONS.
IF AT Q9 "NUTRITION" IS "VERY IMPORTANT" OR "SOMEWHAT IMPORTANT", ASK Q12.
OTHERS SKIP TO Q13.
Q12: S,
QT À quelle fréquence, s'il y a lieu, choisissez-vous les aliments que vous mangez en fonction de la quantité d'un nutriment spécifique que l'aliment contient? À mesure que je lirai chaque élément, veuillez me dire si vous choisissez souvent, parfois, rarement ou jamais les aliments selon le contenu de ce nutriment.
RANDOMIZE MT LIST
LISEZ LA LISTE AUSSI SOUVENT QU'IL LE FAUT
NE LISEZ PAS "NE SAIT PAS"
AL Souvent
Parfois Rarement
Jamais
NE SAIT PAS
Appendix
100
RANDOMIZE LIST
Calories/Énergie
Total des matières grasses
Gras saturés
Acides gras trans
Cholestérol
Glucides
Fibres
Sucre
Protéines
Sel/Sodium
Vitamines
Fer
Calcium
POSEZ À TOUS
Q13: S,
QT Certains aliments contiennent des vitamines et minéraux ajoutés. Dans quelle mesure est-il important pour vous de savoir que les aliments suivants contiennent des vitamines et minéraux ajoutés? Diriez-vous que c'est très important, assez important, pas très important, ou pas du tout important, ou est-ce possible que vous n'achetez pas ces types d'aliments.
RANDOMIZE LIST
AL Très important
Assez important Pas très important
Pas du tout important
Je n'achète pas ce type d'aliments
NE SAIT PAS
Appendix
101
Les pâtes
Les barres (si on demande, d'énergie/de collation/de céréales)
Les céréales pour le déjeuner
Les breuvages comme les boissons aromatisées ou les boissons gazeuses
Q14: S,
QT Certains aliments qui font partie de notre régime habituel sont appelés aliments fonctionnels parce qu'ils offrent des bienfaits additionnels et qu'il réduisent les risques de maladies chroniques en plus de fournir des nutriments. Aviez-vous déjà entendu parler d'aliments fonctionnels avant ce sondage?
AL OUI
NON NE SAIT PAS
Q15: S,
QT Je vais vous lire certains énoncés. Veuillez me dire si vous êtes fortement d'accord, assez d'accord, ni d'accord ni en désaccord, assez en désaccord ou fortement en désaccord avec chacun des énoncés suivants.
RANDOMIZE MT LIST
LISEZ LA LISTE AUSSI SOUVENT QU'IL LE FAUT
NE LISEZ PAS "NE SAIT PAS"
AL Fortement d'accord
Assez d'accord Ni d'accord ni en désaccord
Assez d'accord
Fortement en désaccord
NE SAIT PAS
Appendix
102
RANDOMIZE LIST
Certains types de fibres alimentaires peuvent aider à faire baisser le cholestérol sanguin.
Les acides gras trans ont le même rôle que les gras saturés.
Réduire les gras dans le régime alimentaire peut faire baisser le cholestérol sanguin.
Un régime alimentaire riche en fibres peut aider à prévenir le cancer du côlon.
La quantité de cholestérol que les gens mangent constitue le facteur principal qui affecte leur cholestérol sanguin.
La margarine non hydrogénée ou margarine molle contient moins de gras que le beurre.
La margarine solide ou en bâton est meilleure pour vous que la margarine molle.
L'indice glycémique classe les aliments riches en glucide en fonction de la façon dont ils influencent nos taux de glycémie.
Les acides gras oméga-3 sont essentiels à un régime alimentaire sain.
SECTION 3 - SOURCES D'INFORMATION
Q16: S,
QT Les gens peuvent obtenir de l'information sur les aliments et la nutrition auprès de sources différentes. Veuillez me dire auprès de quelles sources d'information suivantes vous avez personnellement obtenu de l'information sur les aliments et la nutrition au cours de la dernière année.
(Au cours de la dernière année, avez-vous obtenu de l'information sur les aliments et la nutrition auprès de la source suivante... INSERT MT?)
AL OUI
NON NE SAIT PAS
Appendix
103
RANDOMIZE LIST
D'un médecin de famille ou autre professionnel de la santé
D'un ou une diététiste
Dans des magazines, journaux et livres
De la documentation du gouvernement
De la documentation ou des publicités de fabricants de produits alimentaires
Des émissions à la radio/télé
Des étiquettes de produits alimentaires
D'amis/de la parenté/de collègues
Des programmes de conditionnement physique/de perte de poids
De la documentation d'associations de santé (Société du Cancer/Fondation des maladies du coeur/Association du diabète)
Sur Internet ou le Web
SECTION 4 - ÉTIQUETAGE
Q17: S,
QT En pensant spécifiquement aux étiquettes des différents produits alimentaires que vous achetez, à quelle fréquence lisez-vous les étiquettes (en plus de la marque ou de la saveur)? Diriez-vous que vous lisez les étiquettes toujours, habituellement, parfois, seulement la première fois que vous achetez un produit ou jamais?
AL Toujours
Habituellement Parfois
Seulement la première fois que j'achète un produit/une marque
Jamais

Appendix
104
IF OTHER THAN "NEVER" AT Q17 ASK Q18, Q19 AND Q20
IF "NEVER" AT Q17 SKIP TO Q21
Q18: S,
QT Lorsque vous lisez les étiquettes, lesquels des éléments suivants recherchez-vous?
LISEZ LA LISTE SAUF «AUCUNE DE CES RÉPONSES»
AL Le tableau sur la valeur nutritive ou le panneau d'information nutritionnelle
Les ingrédients
Les allégations sur les nutriments comme la quantité d'un ingrédient en particulier
Les allégations sur la santé comme les énoncés sur les bienfaits pour votre santé de manger l'aliment
Un slogan, symbole ou logo «choix santé» ou «meilleur choix»
AUCUNE DE CES RÉPONSES
Q19: S,
QT Quand vous regardez l'information sur les emballages de produits alimentaires, soit au magasin ou à la maison, à quelle fréquence utilisez-vous cette information pour les raisons suivantes? Diriez-vous souvent, parfois, rarement ou jamais?
(À quelle fréquence utilisez-vous l'information...)
RANDOMIZE MT LIST
LISEZ LA LISTE AUSSI SOUVENT QU'IL LE FAUT
NE LISEZ PAS «NE SAIT PAS»
AL Souvent
Parfois Rarement
Jamais
NE SAIT PAS

Appendix
105
a) pour comparer différents types d'aliments, comme comparer des barres granola et des biscuits.
b) pour comparer des types d'aliments similaires, comme comparer deux marques différentes de craquelins.
c) pour savoir quelle quantité d'un produit alimentaire vous et votre famille devriez manger.
d) pour avoir une idée générale de la teneur en calories d'un aliment.
e) pour voir si l'aliment contient un ingrédient spécifique.
f) pour voir si l'aliment contient des noix.
g) pour voir combien un produit contient de nutriments comme la quantité de matières grasses, de glucides, de fibres ou de vitamines.
h) pour trouver des aliments qui se réclament bons pour la santé (par exemple, «Une saine alimentation, comportant une grande variété de légumes et de fruits, peut aider à réduire le risque de certains types de cancer»).
i) pour voir si le produit est biologique.
Q20: S,
QT Quand vous cherchez de l'information nutritionnelle sur l'étiquette, à quelle fréquence trouvez-vous habituellement l'information dont vous avez besoin?
LISEZ LA LISTE
NE LISEZ PAS "NE SAIT PAS"
AL Souvent
Parfois Rarement
Jamais
NE SAIT PAS

Appendix
106
POSEZ À TOUS
Q21A: S,
QT Y a-t-il des allégations ou énoncés exprimés par les compagnies de produits alimentaires au sujet des avantages nutritionnels ou bienfaits sur la santé de leurs aliments qui ont attiré votre attention au cours des 12 derniers mois?
AL OUI
NON NE SAIT PAS
ASK Q21B IF "YES" TO Q21A
OTHERS GO TO Q22
Q21B: M* OPEN,
QT Quel est l'allégation ou l'énoncé qui a attiré votre attention?
SECTION 5 - STYLE DE VIE
POSEZ À TOUS
Q22: S,
QT Avez-vous amélioré ou changé vos habitudes alimentaires au cours de la dernière année?
NE LISEZ PAS LA LISTE
AL OUI
NON NE SAIT PAS - INCERTAIN(E) - NE SE SOUVIENT PAS
IF YES TO Q22 ASK Q23
IF NO OR DON'T KNOW AT Q22 SKIP TO Q24

Appendix
107
Q23: S,
QT Quel est ou quels sont les changements les plus significatifs que vous avez faits pour améliorer ou changer vos habitudes alimentaires au cours de la dernière année?
NE LISEZ PAS LA LISTE. ACCEPTEZ TOUTES LES MENTIONS
PROGRAMMER NB OTHER SPECIFY
AL A AUGMENTÉ SA CONSOMMATION DE PROTÉINES
LIMITE SA CONSOMMATION DE GLUCIDES A RÉDUIT SA CONSOMMATION DE SEL
ESSAIE DE CONSOMMER MOINS DE MATIÈRES GRASSES
ESSAIE DE CONSOMMER MOINS DE GRAS SATURÉS
ESSAIE DE CONSOMMER MOINS DE GRAS TRANS
MANGE PLUS DE LÉGUMES
MANGE PLUS DE FRUITS
MANGE DES ALIMENTS BIOLOGIQUES
MOINS DE COLLATIONS
CHOIX DE COLLATIONS DIFFÉRENTS
A RÉDUIT SA CONSOMMATION DE SUCRE
A RÉDUIT SA CONSOMMATION DE CALORIES - A MANGÉ MOINS - A SURVEILLÉ SON POIDS
A RÉDUIT SA CONSOMMATION DE CAFÉINE
PREND DES SUPPLÉMENTS VITAMINIQUES/MINÉRAUX
MANGE PLUS DE FIBRES, DE FIBRES ALIMENTAIRES
MANGE PLUS DE GRAINS ENTIERS
MANGE DU YOGOURT
ÉQUILIBRE LA RATION ALIMENTAIRE AVEC LES ACTIVITÉS PHYSIQUES
AUTRE AYANT TRAIT AU RÉGIME ALIMENTAIRE (PRÉCISEZ)
NE SAIT PAS (SPONTANÉMENT)

Appendix
108
POSEZ À TOUS
Q24: S,
QT Au cours de la dernière année, avez-vous essayé ou adopté un régime alimentaire en vogue?
AL Oui
Non Refuse
IF YES TO Q24 ASK Q25
OTHERS SKIP TO Q26
Q25: S,
QT IF YES TO Q24
Lequel?
NE LISEZ PAS LA LISTE
ACCEPTEZ TOUTES LES MENTIONS
AL WEIGHT WATCHERS
ATKINS (MONTIGNAC AU QUÉBEC) JENNY CRAIG
CLINIQUE DU DR. BERNSTEIN
ZONE
SCARSDALE
SOUTH BEACH
SLIM FAST - REMPLACEMENT DE REPAS
PILULES POUR MAIGRIR
HERBAL LIFE
AUTRE PRÉCISEZ

Appendix
109
Q26: S,
QT Veuillez me dire à quelle fréquence vous faites ce qui suit au cours d'une semaine type :
LISEZ LA LISTE AUSSI SOUVENT QU'IL LE FAUT
NE LISEZ PAS "NE SAIT PAS"
AL Tous les jours
Quatre fois ou plus par semaine Deux ou trois fois par semaine
Une fois par semaine
Moins d'une fois par semaine
Jamais
NE SAIT PAS
DO NOT RANDOMIZE LIST
a) Mangez des repas préparés à la maison (SI ON DEMANDE, COMPREND LE PETIT-DÉJEUNER, LE REPAS DU MIDI ET LE SOUPER)
b) Commandez des repas pour emporter ou faire livrer à la maison (SI ON DEMANDE, COMPREND LE PETIT-DÉJEUNER, LE REPAS DU MIDI ET LE SOUPER)
c) Prenez un petit-déjeuner
d) Mangez à l'extérieur du foyer (SI ON DEMANDE, COMPREND LE PETIT-DÉJEUNER, LE REPAS DU MIDI ET LE SOUPER; SI ON DEMANDE, RESTAURANTS, ÉTABLISSEMENTS DE RESTAURATION RAPIDE ET CAFÉTÉRIAS)
IF "GO OUT TO EAT" AT LEAST ONCE PER WEEK IN Q26, ASK Q27
OTHERS SKIP TO Q28

Appendix
110
Q27: S,
QT Lorsque vous mangez au restaurant, l'information nutritionnelle sur les aliments servis peut se retrouver à plusieurs endroits : sur le menu, sur des affiches ou autres enseignes, dans des brochures et sur la feuille qui recouvre le plateau. En pensant aux endroits où vous allez manger, diriez-vous que tous les endroits, la plupart ou certains des endroits affichent l'information nutritionnelle sur les aliments qu'ils servent, ou diriez-vous qu'aucun ne l'affiche?
AL Tous
La plupart Certains
Aucun
SANS OBJET
NE SAIT PAS
POSEZ À TOUS
Q28: S,
QT Prenez-vous des vitamines, des suppléments à base de plantes ou d'autres suppléments alimentaires?
NB PRÉCISEZ
AL Oui, des multivitamines
Oui, des vitamines ou des minéraux individuels Oui, d'autres suppléments alimentaires PRÉCISEZ
Non
Appendix
111
SECTION 6 - DEMOGRAPHIQUES
Il ne me reste que quelques questions qui serviront à classifier vos réponses.
D1: S,
QT Quel est votre état matrimonial actuel?
LISEZ LA LISTE AU BESOIN
NE LISEZ PAS «REFUSE»
AL Célibataire, jamais marié(e)
Marié(e) En union de fait
Divorcé(e)
Séparé(e)
Veuf/veuve
REFUSE
D2: Q,
QT Combien de personnes y a-t-il dans votre foyer?
D3: S,
QT IF >1 AT D2
Avez-vous des enfants de moins de 18 ans qui demeurent actuellement avec vous?
AL OUI
NON Refuse

Appendix
112
D4: S,
QT IF CHILDREN UNDER 18 AT D3
Combien de ces enfants se situent dans les groupes d'âge suivants...?
ENTREZ LE NOMBRE POUR CHAQUE GROUPE D'ÂGE
AL Nouveau-né à 5 ans
6 à 11 ans 12 à 17 ans
D5: S,
QT Dans lequel des groupes d'âge suivants vous situez-vous?
LISEZ LA LISTE
NE LISEZ PAS «REFUSE»
AL 18 à 24 ans
25 à 34 ans 35 à 44 ans
45 à 54 ans
55 à 64 ans
65 à 75 ans
Plus de 75 ans
REFUSE
D6: S,
QT Quel est le niveau d'études le plus élevé que vous avez terminé?
LISEZ LA LISTE AU BESOIN
NE LISEZ PAS «NE SAIT PAS/REFUSE»

Appendix
113
AL COURS PRIMAIRE EN PARTIE
COURS PRIMAIRE AU COMPLET COURS SECONDAIRE EN PARTIE
COURS SECONDAIRE AU COMPLET
CÉGEP/COURS TECHNIQUE/COLLÈGE COMMUNAUTAIRE EN PARTIE
CÉGEP/COURS TECHNIQUE/COLLÈGE COMMUNAUTAIRE AU COMPLET
UNIVERSITÉ (1ER CYCLE) EN PARTIE
UNIVERSITÉ (1ER CYCLE) AU COMPLET
UNIVERSITÉ (2E-3E CYCLE) EN PARTIE
UNIVERSITÉ (2E-3E CYCLE) AU COMPLET
AUTRE
NE SAIT PAS/REFUSE
D7: S,
QT À des fins statistiques seulement, quel est le revenu total de votre foyer avant impôts, c'est-à-dire le revenu total de tous les membres de votre foyer? Est-il de 50 000 $ ou plus, ou est-il de moins de 50 000 $ par année?
AL 50 000 $ OU PLUS
MOINS DE 50 000 $ NE SAIT PAS
REFUSE
IF D7 UNDER $50,000 ASK D8
IF D7 OVER $50,000 ASK D9
D8: S,
QT Est-il de...?
LISEZ LA LISTE.
NE LISEZ PAS «NE SAIT PAS/REFUSE»

Appendix
114
AL 45 000 $ à 49 999 $
35 000 $ à 44 999 $ 25 000 $ à 34 999 $
15 000 $ à 24 999 $
Moins de 15 000 $
NE SAIT PAS
REFUSE
D9: S,
QT Est-il de...?
LISEZ LA LISTE
NE LISEZ PAS «NE SAIT PAS/REFUSE»
AL 50 000 $ à 59 999 $
60 000 $ à 74 999 $ 75 000 $ à 79 999 $
80 000 $ à 99 999 $
100 000 $ ou plus
NE SAIT PAS
REFUSE
TIMING FOR REGULAR SURVEY TO STOP HERE.
POSEZ LES QUESTIONS SUIVANTES SEULEMENT PENDANT LE PRÉTEST.
Appendix
115
PT1: S,
QT Dans quelle mesure avez-vous trouvé que ce sondage était clair?
LISEZ LA LISTE AU BESOIN
NE LISEZ PAS «NE SAIT PAS»
AL Très clair
Assez clair Pas tellement clair
Pas du tout clair
NE SAIT PAS/INCERTAIN(E)
PT2: M* OPEN,
QT Avez-vous des commentaires concernant ce sondage, par exemple, y a-t-il quelque chose que vous n'avez pas compris ou qui pourrait être clarifié?
ENTREZ LA RÉPONSE MOT À MOT. NOT TO BE CODED - PROVIDE AS VERBATIM ONLY
Merci beaucoup d'avoir participé à ce sondage.
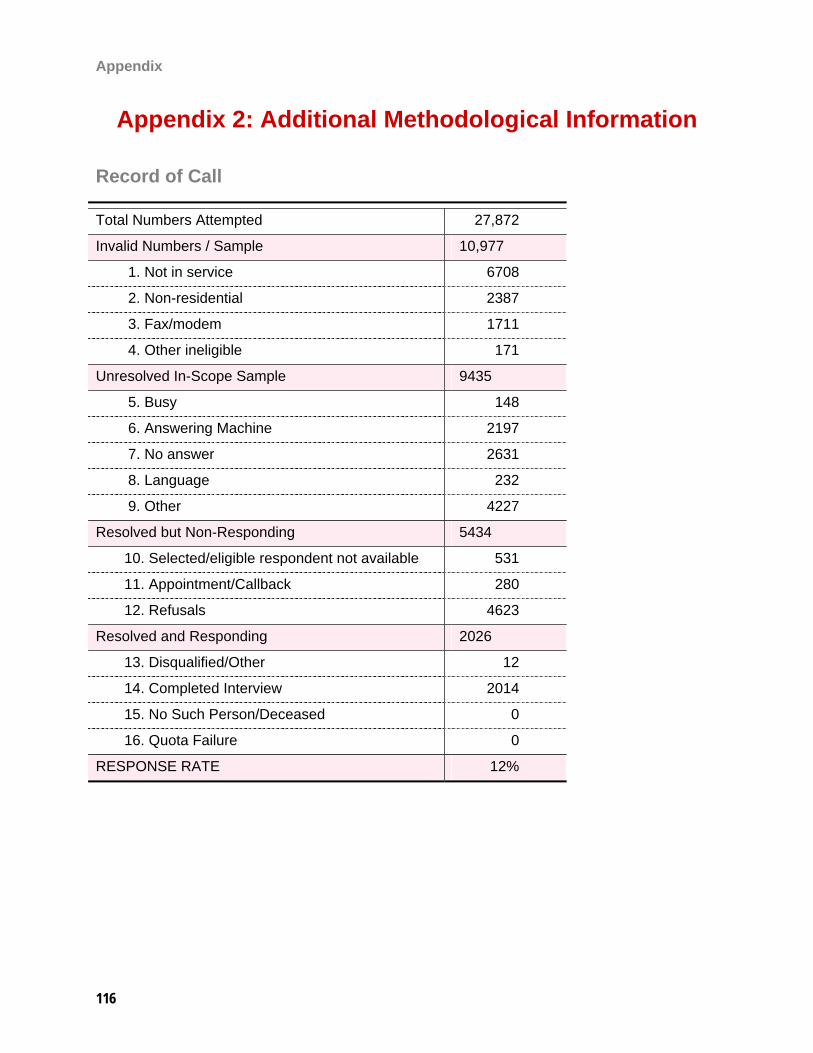
Appendix
116
Appendix 2: Additional Methodological Information
Record of Call
Total Numbers Attempted 27,872
Invalid Numbers / Sample 10,977
1. Not in service 6708
2. Non-residential 2387
3. Fax/modem 1711
4. Other ineligible 171
Unresolved In-Scope Sample 9435
5. Busy 148
6. Answering Machine 2197
7. No answer 2631
8. Language 232
9. Other 4227
Resolved but Non-Responding 5434
10. Selected/eligible respondent not available 531
11. Appointment/Callback 280
12. Refusals 4623
Resolved and Responding 2026
13. Disqualified/Other 12
14. Completed Interview 2014
15. No Such Person/Deceased 0
16. Quota Failure 0
RESPONSE RATE 12%
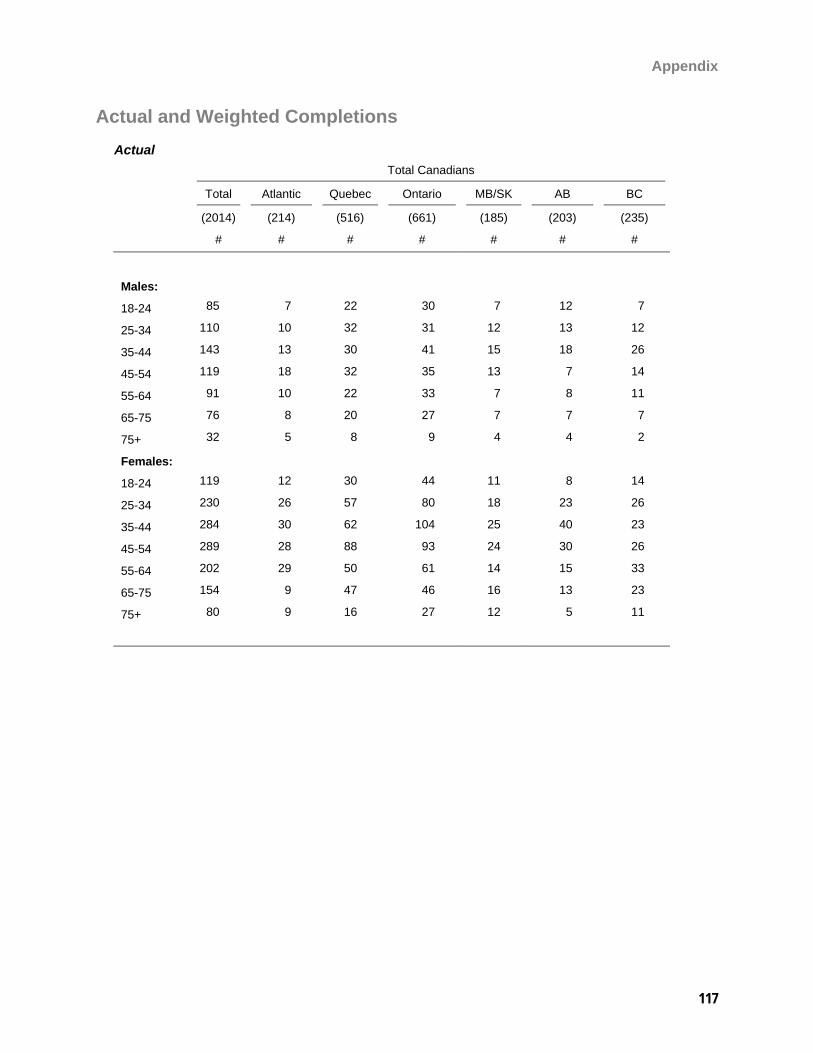
Appendix
117
Actual and Weighted Completions Actual
Total Canadians
Total Atlantic Quebec Ontario MB/SK AB BC
(2014) (214) (516) (661) (185) (203) (235)
# # # # # # #
Males:
18-24 85 7 22 30 7 12 7
25-34 110 10 32 31 12 13 12
35-44 143 13 30 41 15 18 26
45-54 119 18 32 35 13 7 14
55-64 91 10 22 33 7 8 11
65-75 76 8 20 27 7 7 7
75+ 32 5 8 9 4 4 2
Females:
18-24 119 12 30 44 11 8 14
25-34 230 26 57 80 18 23 26
35-44 284 30 62 104 25 40 23
45-54 289 28 88 93 24 30 26
55-64 202 29 50 61 14 15 33
65-75 154 9 47 46 16 13 23
75+ 80 9 16 27 12 5 11
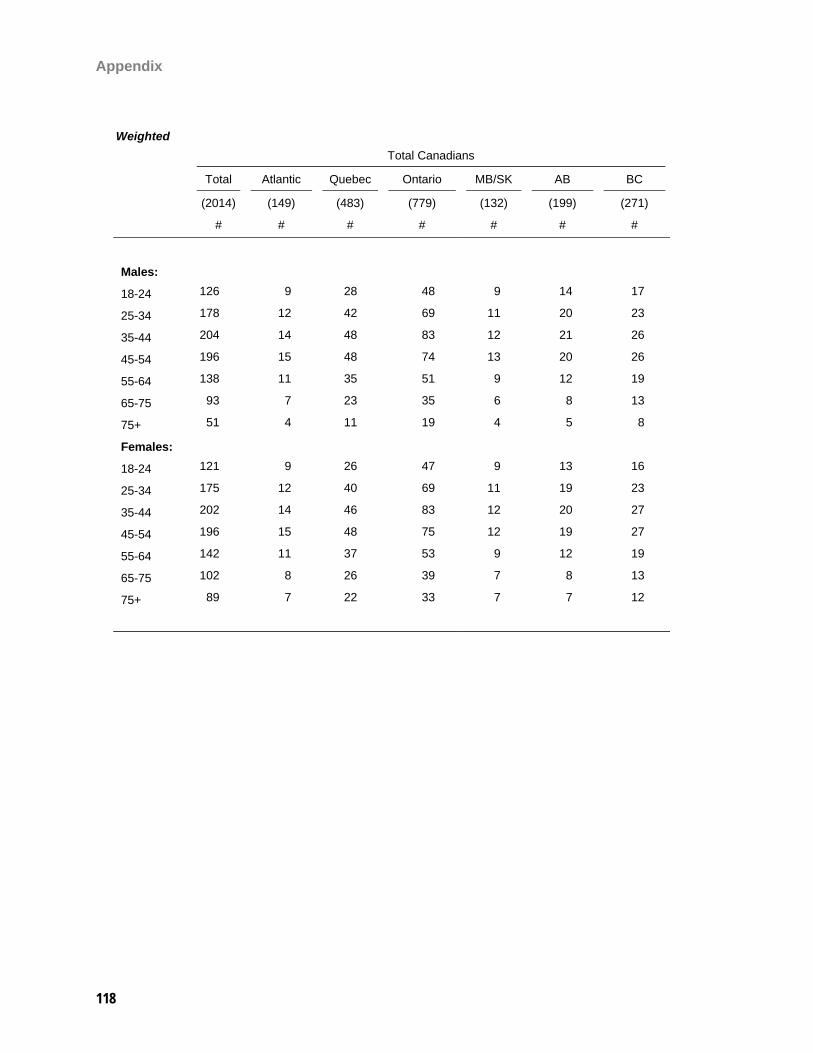
Appendix
118
Weighted
Total Canadians
Total Atlantic Quebec Ontario MB/SK AB BC
(2014) (149) (483) (779) (132) (199) (271)
# # # # # # #
Males:
18-24 126 9 28 48 9 14 17
25-34 178 12 42 69 11 20 23
35-44 204 14 48 83 12 21 26
45-54 196 15 48 74 13 20 26
55-64 138 11 35 51 9 12 19
65-75 93 7 23 35 6 8 13
75+ 51 4 11 19 4 5 8
Females:
18-24 121 9 26 47 9 13 16
25-34 175 12 40 69 11 19 23
35-44 202 14 46 83 12 20 27
45-54 196 15 48 75 12 19 27
55-64 142 11 37 53 9 12 19
65-75 102 8 26 39 7 8 13
75+ 89 7 22 33 7 7 12
Appendix
119
For More Information Please Contact:
Richard W. Jenkins, Ph.D. Vice President Corporate Director, Public Opinion Research TNS Canadian Facts
Phone (613) 230-4408 Email [email protected] Web www.tns-global.com
Professional Staff Involved in this Project:
-Richard Jenkins, Vice President
-Nancy Vouloukos, Research Associate
TNS Study Number C1062