Embed Size (px)
Citation preview
TRACKING FOREST AND OPEN AREA EFFECTS ON SNOW ACCUMULATION BY UNMANNED AERIAL VEHICLE PHOTOGRAMMETRY
T. Lendziocha, J. Langhammer a, M. Jenicek a,
a Charles University in Prague, Faculty of Science, Department of Physical and Geoecology, Prague, Czech Republic -
COMISSION ICWG I/Vb
KEY WORDS: Unmanned Aerial Vehicle, Digital Photogrammetry, Structure from Motion, Snow Depth, Leaf Area Index, Snowpack modelling.
ABSTRACT: Airborne digital photogrammetry is undergoing a renaissance. The availability of low-cost Unmanned Aerial Vehicle (UAV) platforms well adopted for digital photography and progress in software development now gives rise to apply this technique to different areas of research. Especially in determining snow depth spatial distributions, where repetitive mapping of cryosphere dynamics is crucial. Here, we introduce UAV-based digital photogrammetry as a rapid and robust approach for evaluating snow accumulation over small local areas (e.g., dead forest, open areas) and to reveal impacts related to changes in forest and snowpack. Due to the advancement of the technique, snow depth of selected study areas such as of healthy forest, disturbed forest, succession, dead forest, and of open areas can be estimated at a 1 cm spatial resolution. The approach is performed in two steps: 1) developing a high resolution Digital Elevation Model during snow-free and 2) during snow-covered conditions. By substracting these two models the snow depth can be accurately retrieved and volumetric changes of snow depth distribution can be achieved. This is a first proof-of-concept study combining snow depth determination and Leaf Area Index (LAI) retrieval to monitor the impact of forest canopy metrics on snow accumulation in coniferous forest within the Šumava National Park, Czech Republic. Both, downward-looking UAV images and upward-looking LAI-2200 canopy analyser measurements were applied to reveal the LAI, controlling interception and transmitting radiation. For the performance of downward-looking images the snow background instead of the sky fraction was used. In contrast to the classical determination of LAI by hemispherical photography or by LAI plant canopy analyser, our approach will also test the accuracy of LAI measurements by UAV that are taken simultaneously during the snow cover mapping campaigns. Since the LAI parameter is important for snowpack modelling, this method presents the potential of simplifying LAI retrieval and mapping of snow dynamics while reducing running costs and time.
1. INTRODUCTION
Current research applying Unmanned Aerial Vehicle (UAV) platforms encompasses a wide field of applications such as archeological surveys, landslide deformation, glacier dynamics, vegetation monitoring, hydrological and geomorphological studies (Eisenbeiss and Zang, 2006; Jaakkola et al., 2010; Lucieer et al., 2013; Ryan et al., 2014; Mirijovsky and Langhammer, 2015). Due to the miniaturization of navigation sensors, it is now possible to integrate different camera systems spanning from heavy-weight LiDAR (Light Detection And Ranging) mapping cameras to light-weight mini-multispectral systems (Wallace et al., 2012). This enables unforeseen new research directions and makes it especially attractive for high-resolution remote sensing applications in Earth Sciences (Harder et al., 2016), including snow monitoring. Recently, the usage of UAV techniques for snow cover monitoring has been increased due to the additional advantage of Structure from Motion (SfM; Harder et al., 2016). This algorithm enables to reconstruct georeferenced point clouds, high precision digital elevation models (DEMs), and orthomosaics by automatic matching of common features from a set of overlapping images (Westoboy et al., 2012; Cimoli and Marcer, 2014; Harder et al., 2016). The utilization of SfM for snow surfaces is considered problematic due to the homogenous surface and high reflectance (Nolan et al., 2015), but recent attempts combining it with UAV-based photogrammetry show promising results (e.g., Bühler et al., 2015; Bühler et al., 2016; Harder et al.,
2016; De Michele et al., 2016). Nolan et al. (2015) compared airborne measurements with 6000 ground measurements of snow depth in Alaska revealing a difference of 10 cm (1) between these two data sets. By applying a similar method in Switzerland, Bühler et al. (2016) determined snow depth values with a root of square error (RMSE) ranging from 7 cm to 15 cm on meadows and rocks, and a RMSE of 30 cm on areas covered by bushes or tall grass. Instead, De Michele et al. (2016) revealed an average RMSE of 14 cm at snow peak accumulation in the western Val Grosina valley, N. Italy. This new technique proofs accurate solutions that may be used to obtain not only snow depth at centimeter resolution (De Michele et al., 2016), but also gives information about snow processes such as snow accumulation and snow melting in forests. It is well established that snow accumulation and ablation are affected by forest cover (Varhola et al., 2010), whereas the reduction of forest cover generally results in increased snow accumulation and more rapid ablation (Winkler et al., 2010b). Therefore, the amount of forest canopy is often described by estimates of canopy closure, gap fraction or leaf area (Metcalfe and Buttle, 1998). The maximum interception capacity of the canopy is described by the leaf area index (LAI) and serves as a crucial input parameter for snowpack models (Pomeroy et al., 1998; Stahli and Gustafsson, 2006; Lehning et al., 2006; Strasser et al., 2007). Since UAV platforms reach equal image quality as traditional airborne photogrammetry, downward-looking UAV imagery can be used for LAI estimates as an indirect method, which is
The International Archives of the Photogrammetry, Remote Sensing and Spatial Information Sciences, Volume XLI-B1, 2016 XXIII ISPRS Congress, 12–19 July 2016, Prague, Czech Republic
This contribution has been peer-reviewed. doi:10.5194/isprsarchives-XLI-B1-917-2016
917

basically comparable to hemispherical photo analysis (Jonckheere at al. 2004; Miller, 1967). The only difference is the background, by using the snow covered terrain instead of the sky (Manninen et al., 2009). We here report first results of snow depth patterns of two different environments such as open area and dead spruce forest stand (i.e., bark beetle infected spruce stand). Snow depth measurements by UAV are accompanied by ground snow probing to test the accuracy of our approach. The effect of vegetation is revealed by simultaneous LAI analyses based on UAV measurements and on ground-based LAI measurements of the forest zone. Repeated UAV surveys of these areas were designed. In a first step, the DEMs of the bare ground and snow free forest were mapped. In a second step, the same area was monitored after fresh snow accumulation to determine the DEM of the snow cover.
2. METHODS
2.1 Study site description
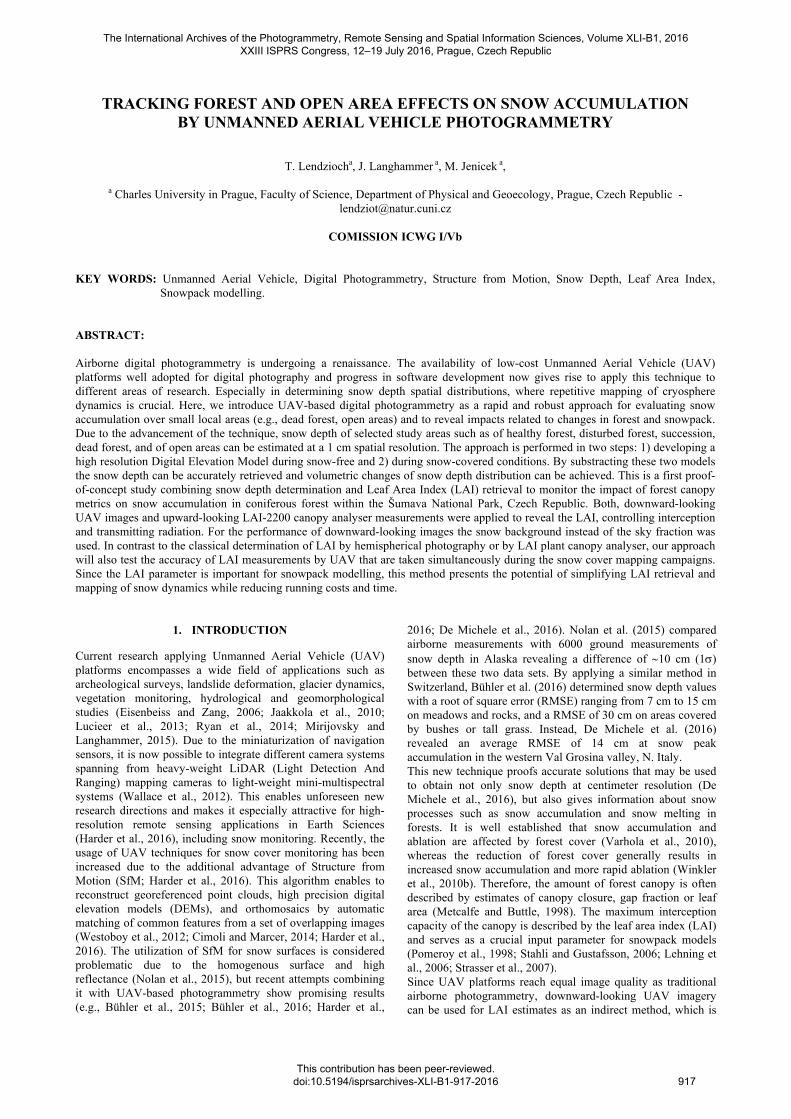
The study area is located in the Šumava National Park, Southwestern Czech Republic. It covers two different localities of the National Park (Fig. 1):
- an open area with meadow coverage (49° 1'32.67"N,
13°30'58.38"E); - a defoliated forest area (48° 59' 8.591" N, 13° 30' 30.998"
E) with standing trees of Norway Spruce (Picea abies). Both sites are between 1,076 m and 1,135 m asl in the forest vegetation zone. The open area (25,900 m2) is characterized by
grass coverage and sparse tree vegetation. A small meandering creek cuts the topography. Slopes are NW-SE and NE-SW oriented. Snow conditions are generally undisturbed. The dead spruce forest area (4,590 m2), which is affected by bark beetle (Ips typographus) outbreaks since 1990 (Langhammer et al., 2015), reveals large canopy gaps due to several fallen dead trees. The remaining forest canopy is around 30 m tall. At its peak accumulation in March, the snow cover can reach snow depths up to 1.5 m as measured in our study. 2.2 UAV acquisition
For imagery acquisition of snow depth distribution and LAI retrieval, two different UAV platforms such as DJI Phantom 2 Vision+ and DJI Inspire 1 PRO have been used. Both platforms are multi-rotors UAVs that are prone to monitor smaller areas. The utilized cameras are a custom system for the DJI Phantom and a Zenmuse X5 for the DJI Inspire. Two imaging campaigns were performed, one in November 2015 at snow-free conditions and one in the middle of February 2016 close to snow peak accumulation. The first monitoring of snow free areas was operated by the DJI Phantom using a camera with a fixed focal length of 5 mm. For the second acquisition of snow covered areas the DJI Inspire and the attached Zenmuse with a fixed focal length of 15 mm were used. To prevent blurred images, the shutter speed was set to very high level. During both campaigns the flight speed was maintained at a lower value to ensure an overlap of 60% to 80% and thus avoid uncovered areas. To achieve a very high spatial resolution of ~1 cm ground sampling distance (GSD) the approximate flight altitude was set between 32 m and 35 m depending on the focal length. Each flight lasted around 20 min to 25 min.
13°30'70"E13°26'90"E13°23'10"E13°19'30"E13°15'50"E
49
°5'0
0"N
49
°1'0
0"N
48
°57
'0"N
49
°5'0
0"N
49
°1'0
0"N
48
°57
'0"N
13°30'70"E13°26'90"E13°23'10"E13°19'30"E13°15'50"E
Rivers
Upper Vydra basin
0 1 2 3 4km
Prague
Germany
Germ
any
Poland
AustriaSlova
kia
Upper Vydra Basin
Filipova Hut’ (open area)
Ptači Brook (dead forest)
Modrava
Figure 1. Location of both study sites. Red box shows the open area, the green box displays the dead forest zone.
The International Archives of the Photogrammetry, Remote Sensing and Spatial Information Sciences, Volume XLI-B1, 2016 XXIII ISPRS Congress, 12–19 July 2016, Prague, Czech Republic
This contribution has been peer-reviewed. doi:10.5194/isprsarchives-XLI-B1-917-2016
918

Well-distributed predefined Ground Control Points (GCPs) were placed on the snow free and snow covered grounds to significantly increase the accuracy of the measurements. Some GCPs were marked on fixed boulders to secure the same collection of GCPs also during snow cover. For accurate positioning of GCPs the Global Navigation Satellite System Topcon HiPer SR in Real Time Kinematics mode was used. This device measures GCPs with a precision of ~2 cm. 2.3 Image processing
Image processing has been performed with Agisoft PhotoScan Pro software (Agisoft LLC, 2013) to reconstruct snow free and snow covered DEMs together with maps of snow depth distributions and orthomosaics from both study sites. The detailed description of the processing procedure and 3D model generation of surfaces by SfM is given by Verhoeven (2011) and Koutsoudis et al. (2014). Total processing times ranged from 2 h to 24 h, depending on size of the area and processing resolution. 2.4 Ground field measurements
2.4.1 Manual snow probing
During the surveys, supplementary manual snow depth probes have been sampled exactly above the measured GCP positions (Fig. 2c, 3c), that the x, y and z position of GCPs and the position of the corresponding snow probes could be measured simultaneously. These ground measurements of snow depth were used to compare and to verify our snow depth analyses taken by UAV. The mean, standard deviation (SD) and RMSE of the differences between manual and UAV-based measurements are shown in Tables 3 and 4. 2.4.2 LAI ground measurements To test the reliability of the UAV-based LAI, ground-based measurements by using Li-Cor LAI-2200 (Danne et al., 2015) plant canopy analyser and hemispherical photography have been conducted. These optical methods are for indirect field measurements of LAI, producing the so called effective LAI index (LAIeff; Morsdorf et al., 2005). LAI analyses with LAI-2200 are based on diffuse radiation attenuation caused by canopy in blue part of spectra, which is driven by gap fraction (Kundela, 2009). The LAI ground measurements of the dead forest stand were taken in the morning under clear sky conditions. According to this and the fact that most of the trees were almost totally defoliated, a sparse canopy environment was present. In this case, a narrow view cap of 45° was used to avoid the influence of direct sun (Danner et al., 2015). The measurements were acquired 1 m above the ground and taken approximately every 5 m2. The distance to trees was kept at ~1 m. Overall 21 LAI measurements have been performed. Post processing was conducted with the FV2000 software. To avoid multiple scattering effects at larger zenith angles, ring 4 and ring 5 of the Li-Cor LAI-2200 were excluded during data processing. Hence, the view of the zenith angles corresponded to 43°. 2.4.3 Digital hemispherical photography Digital Hemispherical Photography (DHP) was acquired nearly at the same positions as LAI-2200, using a digital camera with a fisheye lens (Sigma Circular Fisheye, focal length 4.5 mm). Only zenith angles of 0-60° were utilized to correspond to the
LAI measurements conducted by the Li-Cor LAI-2200 with maximum zenith angle of 43°. The camera was mounted on a tripod in a fixed height of 1 m above the ground. The lens aperture was fixed and the expositional time was set to auto-mode. The geographic orientation and circular extent of the hemispherical image was applied in north direction, which corresponds to 0°. In total, 36 plots were measured. LAI was processed using the Gap Light Analyzer (GLA) software (Frazer et al., 1997). 2.4.4 UAV-based LAI retrieval The UAV flights for LAI retrieval were carried out during the DEM snow cover acquisition in completely overcast conditions. These conditions are preferable over clear sky to avoid shadows at the forest floor (Manninen et al., 2009), which can hamper exact LAI retreaval. The range of flight height varied around 35 m and 40 m to match the image area with that of the ground measurements. The same spatial resolution of the GSD of ~1 cm was as also used for the snow depth analysis. The images for the LAI retrieval, were taken from nadir position with a field of view of 94°. The images were analyzed using the GLA software. GLA offers either the processing of custom fisheye lens distortions and also of standard lens projections. Here, instead of polar projection, which is basically used for fisheye lenses, an orthographic standard projection for rectangle images was used. In all, 22 images have been analyzed trying to capture almost the same position as taken by the other two optical methods.
3. RESULTS
3.1 DEM processing Using the Agisoft Photoscan software, a total of four DEMs and orthoimages of ~1 cm spatial resolution were generated from the two field surveys. The accuracy of the DEMs is summarized in Table 1 and 2 by presenting the RMSE for x, y and z coordinates together with the area total error and pixel error. The total error represents the RMSE of the Euclidean distance from the reference GCPs to the corresponding estimated points in the 3D model. The pixel error represents the average projection error for tie points on each image. The accuracy of the DEM’s for individual flights varies from 0.012 to 0.485 m.
Area
XY (m)
Z (m)
RMSE (m)
RMSE (pixel)
Open area 0.167 0.455 0.485 1.017 Dead forest 0.067 0.036 0.076 0.446
Table 1. Summary of accuracy of bare soil generated UAV DEMs.
Area
XY (m)
Z (m)
RMSE (m)
RMSE (pixel)
Open area 0.012 0.002 0.012 0.156 Dead forest 0.036 0.026 0.044 0.345
Table 2. Summary of accuracy of snow depth generated UAV DEMs.
3.2 Snow depth estimation
Figure 2a,b and Figure 3a,b display the orthomosaics for open area and dead forest zone respectively, before and after snowfall and their corresponding DEMs at a 2 cm resolution
The International Archives of the Photogrammetry, Remote Sensing and Spatial Information Sciences, Volume XLI-B1, 2016 XXIII ISPRS Congress, 12–19 July 2016, Prague, Czech Republic
This contribution has been peer-reviewed. doi:10.5194/isprsarchives-XLI-B1-917-2016
919

(Figs. 2c,d and 3c,d). The location of GCPs and manual snow probes are shown in Figures 2c and 3c. The difference between the estimated snow depth DEMs (HUAV; Fig. 2e) and the interpolated snow depth probes (HT; Fig. 2f), taken at GCP positions, show maximum and minimum differences for the open area of 9.52 m and 0.20 m and for the dead forest of 1.54 m and 0.20 m. The interpolated DEMs, based on manual snow probes, show for both areas (Figs. 2f, 3f) slightly lower snow depths of 2.78 m for open area and of 1.30 m for dead forest zone. The high discrepancy between HUAV and HT of the open area is caused by single trees inducing distortion of the snow covered DEM. Usually, minimum snow depth values appear negative in both maps, which can be attributed to the effect of compressible vegetation (Nolan et al., 2015), but these values have been replaced by the lowest snow depth values, measured on the ground. Table 3 and 4 summarize a comparison between HT and HUAV snow depth measurements at GCP positions of both sites. Differences span from 0.27 m to -0.39 m for open area and from 0.83 m to -0.28 m for dead forest area, while the average difference between measurements is equal to 7 cm in the open area and to 25 cm in the dead forest zone.
ID
HT
(m) HUAV
(m) HT - HUAV
(m) HUAV/HT
(%)
1 0.22 0.08 0.14 64 2 0.30 0.62 -0.32 106 3 0.38 0.40 -0.02 5 4 0.20 0.59 -0.39 194 5 0.25 0.42 -0.17 68 6 0.25 0.35 -0.10 40 7 0.27 0.003 0.27 99 8 0.32 0.39 -0.07 22 9 0.20 0.42 -0.22 110
10 0.26 0.08 0.18 70 averagediff (m) -0.07
SDdiff (m) 0.22 RMSE (m) 0.22
Table 3. Comparison of manual tube (HT) and UAV (HUAV) snow depth measurements in open area.
ID
HT (m)
HUAV (m)
HT - HUAV
(m) HUAV/HT
(%)
1 0.70 0.52 0.18 26
2 0.72 0.45 0.25 34
3 0.61 0.54 0.07 12
4 0.66 0.50 0.16 25
5 1.05 0.35 0.70 67
6 0.20 0.46 -0.26 129
7 0.80 0.43 0.37 46
8 0.20 0.48 -0.28 139
9 0.90 0.07 0.83 92
10 0.90 0.44 0.46 51
averagediff (m) 0.25
SDdiff (m) 0.36
RMSE (m) 0.42
Table 4. Comparison of manual tube (HT) and UAV (HUAV) snow depth measurements in dead forest area.
200 m
9.52 0.20H
UAV (m) 2.78
0.20H
T (m)
A B
C
E F
D
³
GCPs & snow depth position
Figure 2. (a,b) Orthophotos of the open area before and after snowfall. (c,d) Digital elevation models (DEMs) before and after snowfall, GCPs and positions of manual snow depth probes in c. (e) Map of the differences between UAV-based DEMs. (f) Map of the interpolated snow depth values of manual snow probes. The RMSE varies between 22 cm and 42 cm between both sites. However, the amount of data that have been used is very small, and snow depths at manually taken probe positions vary between 0.20 m and 0.38 m for open area and between 0.20 m and 1.05 m for dead forest (Table 3, 4). 3.3 UAV-based volume vs. snow points interpolation The manual snow point measurements were interpolated using ordinary kriging interpolation with a spherical semivariogram model in ArcGIS. The newly created surface was subtracted from the bare soil DEM to get a DEM with snow depth, taken in the field. Based on these DEMs, the volume was estimated at both sites to compare the estimations of snow volume operated by the UAV (2 cm resolution) (Table 5). Results of the UAV-based snow volume estimations and the interpolation technique show a difference of ~10% for open area and of ~55% for the dead forest. Table 6 presents the comparison between the snow volume taken by UAV and the one obtained via interpolation technique in terms of absolute values. Observing the interpolation results of the manual snow depth probes, the technique replies a mighty overestimated volume of snow at both study sites.
Area
Resolution(cm)
Pixels
Hmean (m)
Hmax (m)
Hmin (m)
V (m3)
Open area 2 58672741 0.18 9.53 -13.65 4213
Dead forest 2 5659776 0.14 1.54 -2.40 310
Table 5. Snow volume calculations based on UAV DEMs.
The International Archives of the Photogrammetry, Remote Sensing and Spatial Information Sciences, Volume XLI-B1, 2016 XXIII ISPRS Congress, 12–19 July 2016, Prague, Czech Republic
This contribution has been peer-reviewed. doi:10.5194/isprsarchives-XLI-B1-917-2016
920

Area Technique VT (m3) VUAV - VT (m3)
Open area Kriging 4694 -480
Dead forest Kriging 702 -393
Table 6. UAV-based vs. interpolated snow tube volume at open and dead forest area.
3.4 Optical indirect estimation of LAIeff Mean and SD values of effective leaf area index measurements for dead Norway spruce forest are presented in Table 7. The estimates of UAV-based LAIeff were generally lower in comparison to LAI-2200 and DHP estimates. The highest LAIeff values were measured by LAI-2200 canopy analyzer. Figure 4 presents one-to-one relationships between the three different methods of LAIeff. Only minor differences between all the three tested methods are observed.
0.02 Kilometers
200 m 1.540.20
HUAV
(m) 1.300.20
HT (m)
A B
C
E F
D
³
GCPs & snow depth position
Figure 3. (a,b) Orthophotos of dead forest before and after snowfall. (c,d) Digital elevation models (DEMs) before and after snowfall, GCPs and positions of manual snow depth probes in c. (e) Map of the differences between UAV-based DEMs. (f) Map of the interpolated snow depth values of manual snow probes. LAI-2200 DHP UAV-based Mean 1.71 1.04 0.81SD 0.62 0.44 0.40
Table 7. Summary of mean values and standard deviations of LAIeff of all optical methods.
y = 0.70x-0.15 R² = 0.97RMSE= 0.26
0.0
0.5
1.0
1.5
2.0
2.5
3.0
0.0 0.5 1.0 1.5 2.0 2.5 3.0LAIeff of LAI-2200
LAIeff
of LAI-2200 vs. LAIeff
of DHP
LAIeff
of LAI-2200 vs. LAIeff
of UAV
LAIeff
of DHP vs. LAIeff
of UAV
y = 0.64x-0.28 R² = 0.94RMSE= 0.69
y = 0.90x-0.13 R² = 0.94RMSE= 0.93
LAI eff
of D
HP/U
AV
parison of effective leaf area index values
4. DISCUSSION
The first batch of 10 s ow point measurements at each site
Figure 4. Comproduced by LAI-2200, hemispherical digital photographs and UAV processed in FV2000 and Gap Light Analyzer software.
nallows a preliminary evaluation, since the main focus is to map snow depth at different snow stages and in diverse locations (e.g., healthy forest, disturbed forest, and succession). Hence, more data are needed to perform an ultimate evaluation (De Michele et al., 2016). However, the validated snow depth statistics are coherent with previous studies of Jagt et al. (2015) and Bühler et al. (2016), giving RMSEs of 9.6 cm to 18.4 cm for snow depth distributions in Tasmania (study area of ~7,000 m2) and RMSEs of 7 cm to 30 cm for snow depth distributions in Switzerland (study areas of 363,000 m2 and 57,000 m2), respectively. Similar achievements have been found using digital photogrammetry for snow depth distributions by UAV (Nolan et al., 2015; Bühler et al., 2016). Recent investigations by De Michele et al. (2016), using the same approach, provided UAV-based snow depth values with a precision of ~10 cm. This confirms that UAV application is able to reach high quality snow depth estimates of different environments and varying vegetation. In this study, the precision of UAV-based snow depth analyses is slightly lower with values of 22 cm in the open area and of 45 cm in the dead forest zone. The reason for higher errors might have resulted from minor differences in the position of manual measurements and UAV estimates, from dead wood lying at the base of snow cover or from vegetation effects as already stated by Jagt et al. (2015) and Bühler et al. (2016). However, as the amount of ground-based snow depth measurements is very small, these data represent only a reduced variability with respect to the complete range of variation of UAV-based snow depth evaluation. The tested kriging interpolation technique, that is used for snow point measurements, is not fully representative due to the limited amount of snow point measurements in the field. In both study sites, the topography varies within short distance and the underlying vegetation causes untrue elevation values. More tests of interpolation techniques are sufficient. Additionally, the snow volume obtained by the UAV is affected by uncertainties and noise and should be not considered as the best estimate (Table 5). The main purpose of LAI measurements was to test if
The International Archives of the Photogrammetry, Remote Sensing and Spatial Information Sciences, Volume XLI-B1, 2016 XXIII ISPRS Congress, 12–19 July 2016, Prague, Czech Republic
This contribution has been peer-reviewed. doi:10.5194/isprsarchives-XLI-B1-917-2016
921

UAV application is able to produce sufficient LAI values that can serve as a predictor and response variable in snowpack modelling (Jenicek et al., 2015). The UAV-based LAIeff values are the lowest in comparison to the LAI-2200 plant canopy analyser and DHP derived analyses, but the achieved accuracy is comparable to the ground measurements. These slightly lower UAV-based LAIeff values could be caused by the flight height, as airborne LAI values are highly dependent on the flight altitude (Manninen et al., 2009). The lower the flight height the larger the variation of diverse scenes that the camera captures, while high altitude flights produce more averaged LAI values. There is no certain optimal flight altitude for LAI determination, but the flight altitude should be providently chosen to capture about the same study size as taken by the ground measurements (Manninen et al., 2009).
5. CONCLUSION AND OUTLOOK
Our results demonstrate the potential of digital photogrammetry
ACKNOWLEDGEMENTS
The research was supported by the EU COST Action 1306
REFERENCES
AgiSoft LLC: AgiSoft PhotoScan, available at:
for snow depth mapping and LAI determination by UAV techniques. The average difference obtained between ground-based and UAV-based measurements of snow depth is 7.1 cm with higher values obtained by UAV. The SD of 22 cm for the open area seems competitive with the typical precision of point measurements (De Michele et al., 2016). In contrast, the average difference in dead forest area equals to 25 cm with lower values obtained by UAV and a SD of 36 cm, which is in agreement with the RMSE of 30 cm reported by Bühler et al. (2015a). The UAV-based LAI measurements reveal the lowest LAIeff values and the plant canopy analyser LAI-2200 the highest LAIeff values. The biggest bias of LAIeff was observed between LAI-2200 and UAV-based analyses. It is evident that UAV-based LAI retrieval can provide reasonable estimates of LAI values for dead forest stand. In the Šumava Mountains, where the effect of large-scale forest disturbance on hydrological regime was studied (Langhammer et al. 2015), such kind of research hasn´t been obtained yet. Using UAV photogrammetry for both research approaches, snow depth volumetric changes and forest LAI estimates of different areas, is extremely important to provide accurate and high resolution DEMs and can be an alternative technique for LAI estimation in areas featuring variable structure and health status of the forest canopy.
project LD15130 “Impact of landscape disturbance on the stream and basin connectivity”.
http://www.agisoft. ru/products/photoscan/ (last access: 14 February 2014), 2013.
Bühler, Y., Marty, M., Egli, L., Veitinger, J., Jonas, T., Thee, P., and Ginzler, C., 2015a. Snow depth mapping in high-alpine catchments using digital photogrammetry. The Cryosphere, 9(1), pp. 229-243.
Bühler, Y, Adams, M. S., Bösch, R., and Stoffel, A., 2016. Mapping snow depth in alpine terrain with unmanned aerial systems (UAS): potential and limitations. The Cryosphere Discussion, in review.
Cimoli, E., 2015. Determining Snow Depth Distribution from Unmanned Aerial Vehicles and Digital Photogrammetry. Technical University of Denmark, Copenhagen, MSc Thesis.
Cimoli, E., and Marcer, M., 2014. Digital Elevation Model Reconstruction of a Glaciarized Basin Using Land-Based Structure from Motion, Copenhagen: Arctic Technology Centre.
Colbeck, S. C., 1982. An overview of seasonal snow metamorphism. Reviews of Geophysics, 20(1), pp. 45- 61.
Danner, M., Locherer, M., Hank, T., and Richter, K., 2015. Measuring Leaf Area Index (LAI) with the LI-Cor LAI 2200C or LAI-2200 (+2200Clear Kit) - Theory, Measurement, Problems, Interpretation. EnMAP Field Guide Technical Report, GFZ Data Services.
De Michele, C., Avanzi, F., Passoni, D., Barzaghi, R., Pinto, L., Dosso, P., Ghezzi, A., Gianatti, R., and Della Vedova, G., 2016. Using a fixed-wing UAS to map snow depth distribution: an evaluation at peak accumulation. The Cryosphere, 10, pp. 511-522. Eisenbeiss, H. and Zhang, L., 2006. Comparison of DSMs generated from mini UAV imagery and terrestrial laser scanner in a cultural heritage application. International Archives of Photogrammetry, Remote Sensing and Spatial Information Sciences XXXVI-5, pp. 90-96.
Frazer, G. W., Lertzman, K. P. and Trofymow, J. A., 1997. A method for estimating canopy openness, effective leaf area index, and photosynthetically active photon flux density using hemispherical photography and computerized image analysis techniques. Victoria, BC: Pacific Forestry Centre, 373.
Harder, P., Schirmer, M., Pomeroy, J. and Helgason, W., 2016. Accuracy of snow depth estimation in montain and prairie environment by an unmanned aerial vehicle. The Cryosphere Discussion, pp. 2016-2019, in review.
Jaakkola, A., Hyyppä, J., Kukko, A., Yu, X., Kaartinen, H., Lehtomäki, M. and Lin, Y., 2010. A low-cost multi-sensoral mobile mapping system and its feasibility for tree measurements. ISPRS Journal of Photogrammetry and Remote Sensing, 65, pp. 514-522.
Jeníček, M., Pevná, H., and Matějka, O., 2015. Snow accumulation and ablation in three forested mountain catchments. Acta Hydrologica Slovaca, 16, pp. 208-216.
Jonckheere, I., Fleck, S., Nackaerts, K., Muys, B., Coppin, P., Weiss, M., and Baret, F., 2004. Review of methods for in situ leaf area index determination: Part I. Theories, sensors and hemispherical photography. Agricultural and forest meteorology, 121(1), 19-35.
Koutsoudis, A., Vidmar, B., Ioannakis, G., Arnaoutoglou, F., Pavlidis, G., and Chamzas, C., 2014. Multi-image 3D reconstruction data evaluation. Journal of Cultural Heritage, 15(1), pp. 73-79.
Kundela, A., 2009. Leaf Area Index estimation and radiation interception measurements in Chinese subtropical forests: assessment of methods in heterogeneous topography. University of Zurich, Institute of Evolutionary Biology and Environmental Studies, Doctoral dissertation, Master thesis.
The International Archives of the Photogrammetry, Remote Sensing and Spatial Information Sciences, Volume XLI-B1, 2016 XXIII ISPRS Congress, 12–19 July 2016, Prague, Czech Republic
This contribution has been peer-reviewed. doi:10.5194/isprsarchives-XLI-B1-917-2016
922

Jagt, B. V., Lucieer, A., Wallace, L., Turner, D., and Durand, M., 2015. Snow depth retrieval with UAS using photogrammetric techniques. Geosciences, 5(3), pp. 264-285.
Lehning, M., Völksch, I., Gustafsson, D., Nguyen, T. A., Stähli, M., and Zappa, M., 2006. ALPINE3D: a detailed model of mountain surface processes and its application to snow hydrology. Hydrological Processes, 20(10), 2111-2128.
Langhammer, J., Su, Y., and Bernsteinova, J., 2015. Runoff Response to Climate Warming and Forest Disturbance in a Mid-Mountain Basin. Water, 7, pp. 3320-3342.
Li-Cor, 1992. LAI-2200 Plant Canopy Analyzer; Operating Manual, Li-Cor, Inc., Lincoln, NE.
López-Moreno, J., Fassnacht, S.R., Heath, J.T., Musselman, K.N., Revuelto, J., Latron, E., Morán-Tejeda, E., and Jonas, T., 2013. Small scale spatial variability of snow density and depth over complex alpine terrain: Implications for estimating snow water equivalent. Advances in Water Resources, 55, pp. 40-52. Manninen, T., Korhonen, L., Viopio, P., Lahtinen, P., and Stenberg, P., 2009. Leaf Area Index (LAI) Estimation of Boreal Forest Using Wide Optics Airborne Winter Photos. Remote Sensing, 1(4), pp. 1380-94.
Metcalfe, R. A,. and Buttle, J. M., 1998. A statistical model of spatially distributed snowmelt rates in a boreal forest basin. Hydrological Processes, 12(1011), pp. 1701-1722.
Miller, J. B., 1967. A formula for average foliage density. Australian Journal of Botany, 15(1), pp. 141-144.
Miřijovský, J., and Langhammer, J., 2015. Multitemporal Monitoring of the Morphodynamics of a Mid-Mountain Stream Using UAS Photogrammetry. Remote Sensing, 7(7), pp. 8586-8609.
Nolan, M., Larsen, C., and Sturm, M., 2015. Mapping snow depth from manned aircraft on landscape scales at centimeter resolution using structure-from-motion photogrammetry. The Cryosphere, 9, pp. 1445-1463.
Pomeroy, J. W., Parviainen, J., Hedstrom, N., and Gray, D. M., 1998. Coupled modelling of forest snow interception and sublimation. Hydrological processes, 12(15), pp. 2317-2337.
Ryan, J. C., Hubbard, A. L., Todd, J. , Carr, J. R., Box, J. E, Christoffersen, P., Holt, T. O., and Snooke, N., 2014. Repeat UAV photogrammetry to assess calving front dynamics at a large outlet glacier draining the Greenland Ice Sheet. Cryosphere Discussions, 8(2), pp. 2243-2275.
Sommerfeld, R. A., and Lachapelle, E., 1970. The classification of snow metamorphism. Journal of Glaciology, 9(55), pp. 3-17.
Stähli, M., and Gustafsson, D., 2006. Long-term investigations of the snow cover in a subalpine semi-forested catchment. Hydrological Processes, 20(2), pp. 411-428.
Strasser, U., Bernhardt, M., Weber, M., Liston, G. E., and Mauser, W. (2008). Is snow sublimation important in the alpine water balance? The Cryosphere, 2(1), pp. 53-66.
Varhola, A., Coops, N. C., Weiler, M., and Moore, R. D. (2010). Forest canopy effects on snow accumulation and
ablation: An integrative review of empirical results. Journal of Hydrology, 392(3), pp. 219-233.
Verhoeven, G., 2011. Taking computer vision aloft–archaeological three-dimensional reconstructions from aerial photographs with photoscan. Archaeological Prospection, 18(1), pp. 67-73.
Wallace, L., Lucieer, A., Watson, C., and Turner, D., 2012. Development of a UAS-LiDAR system with application to forest inventory. Remote Sensing, 4, pp. 1519-1543.
Westoby, M., Brasington, J., Glasser, N., and Hambrey, M., 2012. ‘Structure-from-Motion’ photogrammetry: A low-cost, effective tool for geoscience applications. Geomorphology, 179, pp. 300-314.
Winkler, R. D., Moore, R. D., Redding, T. E., Spittlehouse, D. L., Smerdon, B. D., and Carlyle-Moses, D. E., 2010. The Effects of Forest Disturbance on Hydrologic Processes and Watershed. Compendium of forest hydrology and geomorphology in British Columbia. BC Min. For. Range, 66, 179.
The International Archives of the Photogrammetry, Remote Sensing and Spatial Information Sciences, Volume XLI-B1, 2016 XXIII ISPRS Congress, 12–19 July 2016, Prague, Czech Republic
This contribution has been peer-reviewed. doi:10.5194/isprsarchives-XLI-B1-917-2016
923