Embed Size (px)
Citation preview
REPORT FROM THE EIM-EFRTC-CER WORKING GROUP ON MARKET STRATEGIES FOR
Track Maintenance & RenewalFOLLOW UP TO THE CONCLUSIONS OF EC INNOTRACK PROJECT/WP5
Printed on behalf of Working Group A, by Network Rail
1
Foreword by EIM, EFRTC & CER //
Infrastructure Managers in Europe are spending a total of some 15 to 25 billion Euros annually for railway infrastructure maintenance and renewal. The conclusions of the INNOTRACK project suggested that significant savings in these costs may be achieved not just through the implementation of innovative solutions in technology but also by improving the logistics, planning and execution of track maintenance and renewal works. The project established that in these areas in particular, a much closer and more open relationship between Infrastructure Managers and Contractors, working together, and especially reviewing industry processes, could drive best value from the supply chain to the benefit of the whole industry.
As a follow-up to this, EIM, EFRTC and CER accordingly agreed to set up joint working groups in order to look at a number of the key issues identified in the relationship between Infrastructure Managers and Contractors.
Among these joint groups, Working Group A – Market Strategies – was formed with a remit to develop a generally accepted methodology and a set of criteria to assess the benefits/costs of contracting out track maintenance & renewals. The methodology and criteria were based on current good practice, whilst also exploring the scope for new processes. EIM, EFRTC and CER engaged in this activity with the belief that they had the potential to improve the overall efficiency and performance of track maintenance and renewal works across Europe.
This document aims to illustrate some of the key principles and commonly used criteria that have emerged from our discussions and from the input provided by a number of European companies through a series of questionnaires. A second objective is to provide an overview of good practice already in place, so part of the document consists of a collection of case studies of good practice from across Europe.
Given the nature of the topic this work has resulted in what can be considered a guidebook for both Infrastructure Managers and Contractors to help encourage open dialogue, develop transparency, promote value-adding behaviours, and showcase good practice. We commend it to the industry accordingly.
In itself its development and production has been an excellent example of cross industry collaboration and cooperation and we thank all those who have contributed.
Monika Heiming, Executive Director, EIM
Jeremy Candfield, Chairman of the Policy and Research Committee, EFRTC
Libor Lochman, Executive Director, CER
32
Contents //
ChaIRMan’s sUMMaRY ....................... 3
BaCKGROUnD
I – INNOTRACK report .................................... 5
II – Initiative from EIM, EFRTC and CER to establish joint working groups ................... 6
III – Companies involved and working method .. 7
IV – Understanding the European landscape .... 8
PaRT 1 // Decision making criteria
I – Criteria of IM for in- and outsourcing track maintenance and renewal ............... 10
II – Measuring performance of maintenance and renewal works .............. 13
III – Refining and weighting range of criteria identified ....................................... 18
PaRT 2 // Understanding the importance of behaviour
I – Value-adding behaviours .......................... 21
II – Value-destroying behaviours .................... 22
Concluding remarks ................................. 23
PaRT 3 // Catalogue of best practice examples
I – Introduction .............................................. 25
II – Case studies – examples:
• Finland ................................................... 26
• France .................................................... 29
• The Netherlands .................................... 32
• Switzerland ............................................ 36
• United Kingdom .................................... 39
PaRT 4 // appendices
1 – European landscape matrix
2– Questionnaire for understanding the value added behaviours
3 – Questionnaire for understanding value destroying behaviours
4 – Remit of A Market Strategy Working Group for joint EIM/EFRTC/CER Working Group
Chairman’s summary //
A joint EIM-EFRTC-CER working group on Market strategies was established in 2009 as part of a suite of activity leading on from the INNOTRACK Project. A broad range of Infrastructure Managers and Contractors contributed to the development of this report through meetings and workshops.
From the initial discussions of market strategies it was clear that this is a multi-layered subject and that the degrees of freedom available in the decision making process were influenced by a wide range of factors that differ between countries. As such it became apparent that this would preclude any overly prescriptive approach to addressing this question. It was determined that the question could best be addressed by an exploration of three key areas:
• Decision making Criteria used by Infrastructure Managers and their relative importance
• The importance of behaviours in the IM/Contractor relationship
• Examples of good practice in the area of market strategy
Thanks to the effort of those participating, we have produced an industry first: a european-wide guide to assisting Infrastructure Managers and track contractors alike in developing best practice across the IM-contractor interface. I believe this is a valuable tool in our shared goals of delivering railways across Europe efficiently and offering best value to our contractors and funders.
Martin Arter Chairman Working Group A Director, Infrastructure Programme Management Network Rail
54
ThE OUTCOME OF ThIs BODY OF wORK Falls InTO TwO CaTEGORIEs:
1. a framework for engagement and constructive dialogue
Firstly the sections on decision making criteria and behaviours in the Infrastructure Manager (IM) /Contractor relationship offer a constructive and non-threatening framework for dialogue between Infrastructure Managers and Contractors. The analysis indicates decision-making criteria that can be discussed in each specific circumstance between the parties both before and after any change in market strategy as an aid to more transparency and clarity.
Some of the highest rated criteria included:
• Skills available in-house vs those in the market
• Competition in the market
• Access to innovation and modern technology
The section on behaviours allows any parties engaged in collaboration to assess the extent to which they can maximise value adding behaviours and minimise value destroying ones.
Key value adding behaviours are believed to be:
• Openness of work scheduled in the medium term
• Collaboration and concise, clear, timely communications
• Clarity and simplicity of standards
Key value destroying behaviours are believed to include:
• Lack of clarity of scope of work
• Short term and late notice of contract award
It is evident that in most countries track maintenance is carried out in-house while track renewal is outsourced on the basis of competitive tendering. There are some exceptions where IMs are carrying out most types of works using their own resources and they contract only for peak requirements or special works. On the other hand there are good examples of full outsourcing of both track maintenance and renewal and/or close and sound cooperation between clients and contractors with benefits for both IMs and contractors.
2. a set of established ‘Good Practice’ that can be used as a resource by the industry
Secondly during the course of this study a number of examples of Market Strategy good practice have been identified. It is important to note that these studies are not presented as ‘best practice’ or ‘exemplars’. They are approaches that have driven genuine benefit and value for those that have deployed them and as such are a valuable resource from which others can draw lessons or ideas. They include how Finland manages its product lifecycle collaboratively, how the Netherlands managed maintenance outsourcing and how the UK utilises a balanced scorecard to assess contractors’ performance.
Encouragingly, the work highlights a high degree of commonality in the criteria that are important in developing market strategies between Infrastructure managers, and also between IMs and Contractors in what behaviours add value.
Included in the report is also an assessment of the scale and content of the European rail infrastructure landscape.
This section aims to give the background to this initiative and previous activities that led to the establishment of a joint EIM-EFRTC-CER working group on Market Strategies, which produced the present ‘guidebook’ as its final report.
I – InnOTRaCK Report
One of the outcomes of the INNOTRACK Project (Work Package 5) was to establish that a much closer and more open relationship between Infrastructure Managers and contractors, working together, and especially reviewing industry processes, could drive best value from the supply chain to the benefit of the whole industry. These conclusions came from analysing a set of interviews carried out with a number of Infrastructure Managers and Contractors.
Excerpt from final InnOTRaCK report:
The report presents the results of the studies on interface between contractors and infrastructure managers based on extensive and structured interviews targeting the project objective for the improvement in cost efficiency and performance of track maintenance and renewal works. In total, representatives of twelve trackworks contractors and seven infrastructure managers were interviewed.
To assure an openness and critical approach, the interviews have been carried by an independent consultant with significant experience on the topic. The interviews have been analysed, findings discussed at workshop seminars both with contractors and infrastructure managers and finally processed in order to provide a consistent set of findings and recommendations.
The main section of the report briefly presents the approach and methodology, and provides summary records of interviews with each contractor and infrastructure manager. The interviews were conducted bearing in mind that the records will be presented in an anonymous way in order to preserve an open-minded and critical approach, and to get a truly objective and representative picture regarding current practices and potential improvements.
At the final stage a joint workshop was held with the involvement of all stakeholders concerned ie. European infrastructure managers outside the project (and in particular decision-makers) in order to build up consensus with European coverage and to identify the most promising areas for the improvement. Key conclusions were tested and double checked during this workshop with representatives from both sides.
The numerous findings as resulting from the processing of interviews were finally grouped in the following seven clusters:
A – Market approach and environment
B – Long-term funding, planning and contracting
C – Cross-acceptance of rules and regulations
D – Best value from the supply chain
E – Fragmentation of work and interfaces between parties involved
F – Industrial Engineering, process optimisation and innovations
G – Cost of plant and heavy machinery
Background //
76
II – Initiative from EIM, EFRTC and CER to establish joint working groups
A joint workshop was held in Paris, bringing IMs and contractors together to discuss the INNOTRACK conclusions and how to take forward the issues of mutual interest.
It was agreed that each of these topics should be taken forward. However, it was also accepted that not all topics could be worked on at once due to the limited resources of the associations.
EIM, CER and EFRTC agreed at a further meeting to prioritise four of the topics, including Market Strategies.
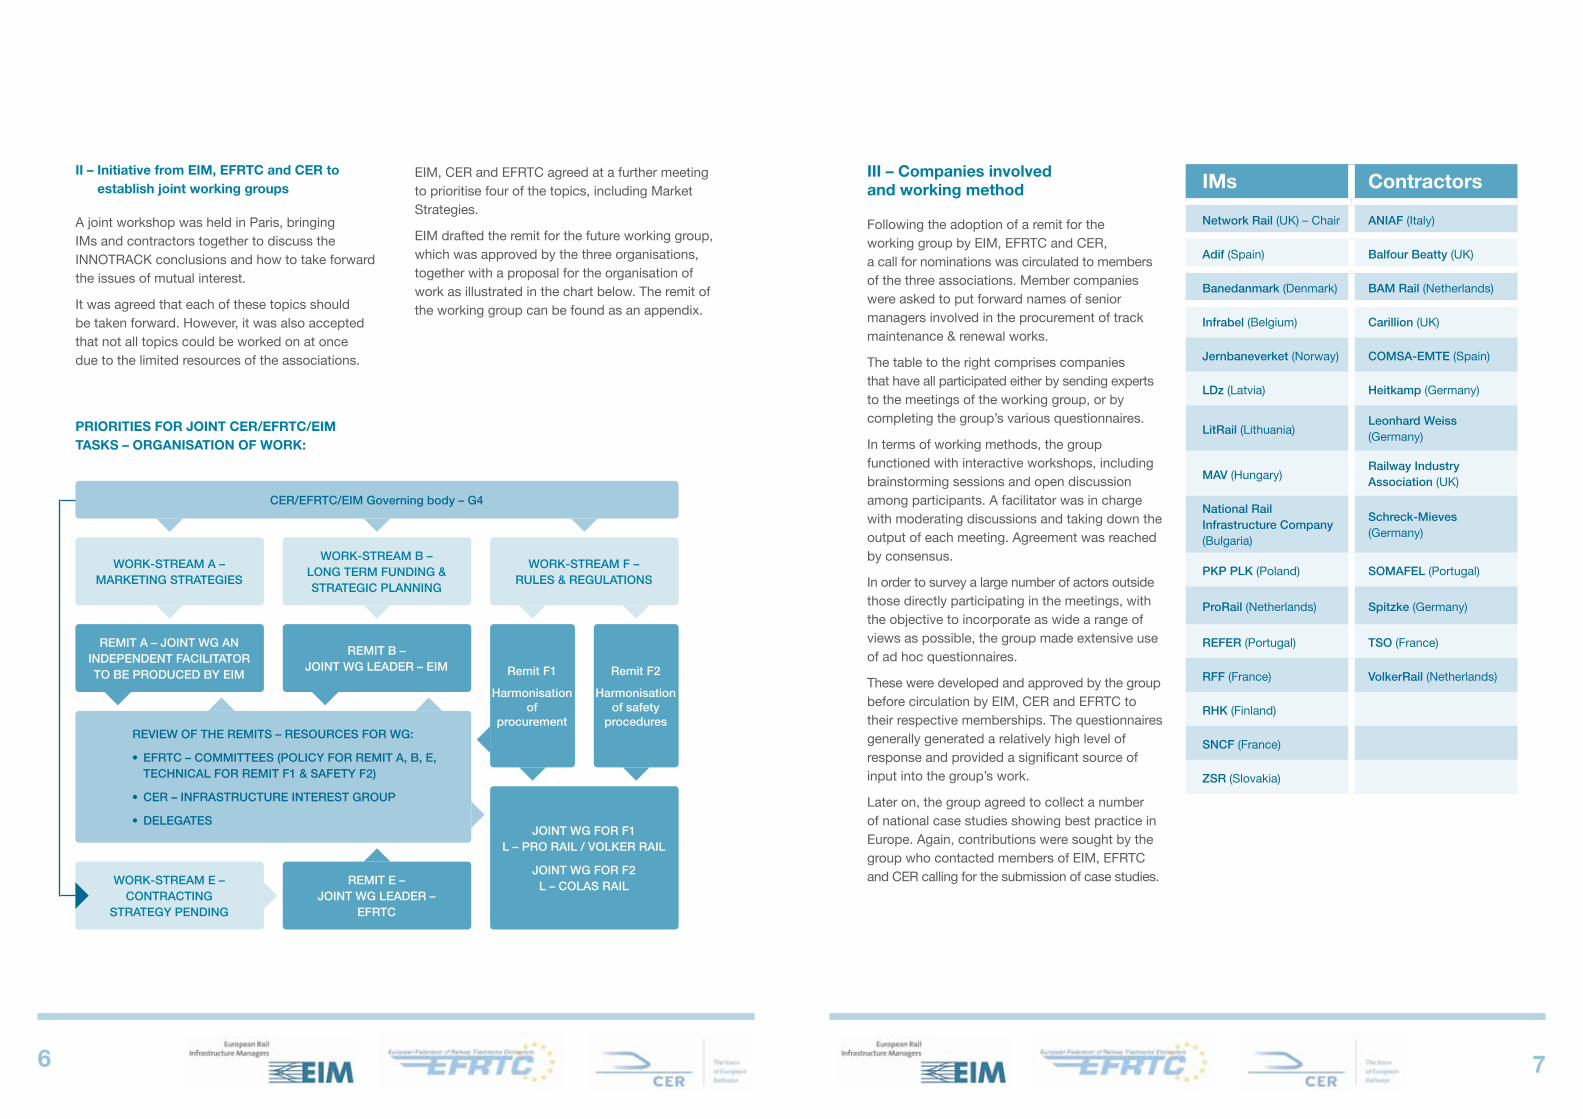
EIM drafted the remit for the future working group, which was approved by the three organisations, together with a proposal for the organisation of work as illustrated in the chart below. The remit of the working group can be found as an appendix.
PRIORITIEs FOR JOInT CER/EFRTC/EIM TasKs – ORGanIsaTIOn OF wORK:
JOINT WG FOR F1 L – PRO RAIL / VOLKER RAIL
JOINT WG FOR F2 L – COLAS RAIL
WORK-STREAM A – MARKETING STRATEGIES
WORK-STREAM B – LONG TERM FUNDING & STRATEGIC PLANNING
REMIT E – JOINT WG LEADER –
EFRTC
CER/EFRTC/EIM Governing body – G4
REMIT A – JOINT WG AN INDEPENDENT FACILITATOR TO BE PRODUCED BY EIM
REMIT B – JOINT WG LEADER – EIM
WORK-STREAM F – RULES & REGULATIONS
Remit F2
Harmonisation of safety
procedures
WORK-STREAM E – CONTRACTING
STRATEGY PENDING
Remit F1
Harmonisation of
procurementREVIEW OF THE REMITS – RESOURCES FOR WG:
•�� �EFRTC�–�COMMITTEES�(POLICY�FOR�REMIT�A,�B,�E, TECHNICAL FOR REMIT F1 & SAFETY F2)
•�� �CER�–�INFRASTRUCTURE�INTEREST�GROUP
•�� �DELEGATES
III – Companies involved and working method
Following the adoption of a remit for the working group by EIM, EFRTC and CER, a call for nominations was circulated to members of the three associations. Member companies were asked to put forward names of senior managers involved in the procurement of track maintenance & renewal works.
The table to the right comprises companies that have all participated either by sending experts to the meetings of the working group, or by completing the group’s various questionnaires.
In terms of working methods, the group functioned with interactive workshops, including brainstorming sessions and open discussion among participants. A facilitator was in charge with moderating discussions and taking down the output of each meeting. Agreement was reached by consensus.
In order to survey a large number of actors outside those directly participating in the meetings, with the objective to incorporate as wide a range of views as possible, the group made extensive use of ad hoc questionnaires.
These were developed and approved by the group before circulation by EIM, CER and EFRTC to their respective memberships. The questionnaires generally generated a relatively high level of response and provided a significant source of input into the group’s work.
Later on, the group agreed to collect a number of national case studies showing best practice in Europe. Again, contributions were sought by the group who contacted members of EIM, EFRTC and CER calling for the submission of case studies.
IMs Contractors
Network Rail (UK) – Chair ANIAF (Italy)
Adif (Spain) Balfour Beatty (UK)
Banedanmark (Denmark) BAM Rail (Netherlands)
Infrabel (Belgium) Carillion (UK)
Jernbaneverket (Norway) COMSA-EMTE (Spain)
LDz (Latvia) Heitkamp (Germany)
LitRail (Lithuania)Leonhard Weiss (Germany)
MAV (Hungary)Railway Industry Association (UK)
National Rail Infrastructure Company (Bulgaria)
Schreck-Mieves (Germany)
PKP PLK (Poland) SOMAFEL (Portugal)
ProRail (Netherlands) Spitzke (Germany)
REFER (Portugal) TSO (France)
RFF (France) VolkerRail (Netherlands)
RHK (Finland)
SNCF (France)
ZSR (Slovakia)
98
IV – Understanding the European landscape
From the beginning, the group felt it was essential and a prerequisite to better understand the variety of the European landscape of rail maintenance and renewal. To this end, data from every country was compiled into a matrix format, showing the length and characteristics of the national rail networks and the average annual expenditure on maintenance and renewals, as well as the current in/outsourcing policy in each country.
The complete European landscape matrix with explanatory notes can be found in the annexes of this report. It was produced with the aim of obtaining the best possible estimates of average annual spending on track maintenance and renewal costs by European Infrastructure Managers in relation to:
• Some basic characteristics of the network
• Traffic volume for both passengers and goods carried
• Administration of the network
• Total turnover
• Resources performing the works
• Available data on costs of track maintenance and renewal and separately for maintenance and renewal of networks
• Others – total investments and public spending for the railway infrastructure for some IM
The matrix shows there is a variety in administration of the networks and that in spite of European legislation at least the following different cases can be identified:
• Independent Infrastructure Manager either state or privately owned
• Infrastructure Manager in holding of Railway Undertaking
• No separation of IM as independent entity from Railway Undertaking
• Special case where responsibility for track maintenance and renewal is delegated by RFF to SNCF
The variety in administration and management of Infrastructure Managers has an impact, along with the other issues dealt with by this study in the following chapters, on the IMs’ policy for in-sourcing/outsourcing of track maintenance and renewal. Three general and two specific patterns can be observed, namely:
• All track maintenance is performed by in-house resources (5 countries)
• All track M & R is outsourced to contractors (7 countries)
• Track maintenance is mainly performed in-house and renewal is outsourced (8 countries)
• 2 specific cases, one in France where RFF outsourced track maintenance to SNCF, and Germany, where most track maintenance is performed in house by DB Netz but also some track renewal; demands in the period of peak workloads are mainly outsourced to contractors
From the above distribution and figures in the matrix in the appendix it can be stated (as a rough estimate) that about half of works on track maintenance and renewal is performed in-house and about the same proportion is outsourced. The market volume for contractors may therefore represent between 40 to 60 % of the total infrastructure managers’ spending on track maintenance and renewal.
However, all figures concerning the IM spending on track maintenance and renewal have to be considered solely as best estimates because:
• There is no clear definition for the costs covered by track maintenance and renewal (some works falling to both categories, cost of materials, structures, etc.)
• Most of the networks provide only overall figures for railway infrastructure maintenance and renewal which includes signalling, overhead lines and sometimes also structures and buildings (see CER statistics and definitions also attached to the report)
• In some cases track renewal is included in the network upgrading and is considered as investment costs
All available data for each network were therefore examined on an individual basis. The following was found:
• For some networks, the data were available and confirmed also by contractors, eg. the Netherlands, Switzerland, Spain, France, Germany, etc.
• For some networks, total investments were available along with some information for maintenance and renewal of non-track related infrastructure which were then deducted from total spending
• Where only total costs were available, an assumption was made (based on the data available for other networks) that track maintenance and renewal represents about 70 % of total costs
• For some CEEC networks, actual EC funding was taken as the basis for estimates based on the assumption that these countries had to invest about 20 % of their own resources in railway infrastructure
It is obvious that estimates produced on the basis of assumptions may be high or low for some IMs. However, the total of about €20 billions average annual spending on track maintenance and renewal per year matches well with the similar estimates made by consultants and by ERRAC.
They seem also to be in proportion to the EFRTC estimates on average annual turnover of the works carried out by contractors which represents for all European contractors about 40 % of total market ie. in total about 8 billion Euros/year.
1110
From the initial discussions on insourcing/outsourcing it was clear that this is a multi-layered subject and that the degrees of freedom available in the decision-making process were influenced by a wide range of factors that differ between countries. As such it became apparent that this would preclude any overly prescriptive approach to addressing this question.
However it was concluded that an exploration of the range of criteria and their relative importance would provide a valuable resource for discussions between IMs and contractors. In addition an exploration of the way the delivery performance of renewal activity is measured would also provide valuable insights into what is deemed important in terms of delivering value.
I – Identification of decision-making criteria
The first key part of the group’s work was to identify what criteria lead an Infrastructure Manager to decide to either bring in-house or outsource maintenance works.
As a first step, the group focussed on identifying as many relevant criteria as possible, without yet seeking to establish a clear hierarchy in terms of importance.
This was done through a first questionnaire, and circulated to all Infrastructure Managers in Europe in membership of EIM and CER.
In an effort to keep the questionnaire short and focussed, and thus maximise the chances to see a large number of experts respond, a single open question was asked and categories were then proposed for the respondents to elaborate on.
13 IMs in total replied to this question, with 9 using the proposed categories and 4 making general remarks.
Excerpt from first questionnaire:
1. What criteria and/or performance measures do you (IMs) use to make decisions on in-sourcing or contracting-out track maintenance and renewals?
PLEASE ANSWER USING ThE FOLLOWING CATEGORIES:
A – Technical
eg. criticality of activity/service, IM capability to bring activity in-house (skill-set, know how, etc.), coordination/synergies across activities, ease of contracting and control (availability of asset and performance data, incentives alignment).
B – Financial Cost
eg. outside supplier’s capacity to optimise resource utilisation compared to IMs, outside supplier’s capacity to drive sourcing economies compared to IMs, outside supplier’s unit labour cost compared to IMs, switching costs and level of competition in market-place.
C – Market
eg. synergies / successful use by other clients / industries.
D – Stakeholders
eg. public or employee concern.
E – Innovation
eg. Outside supplier’s or IM’s ability and motivation to innovate and to fund innovation.
F – Risk
eg. transaction / switching risk or outside supplier’s capacity to manage & delivery the necessary work.
G – Legal
eg. legal implications of switching.
h – Other
Any other important considerations.
PaRT 1 // Decision-making criteria used by Infrastructure Managers and their relative importance
Commentary
Some respondents remarked that there was a general policy in their company/country as to in/outsourcing, to the effect that either all or specific, predetermined parts of the works must be contracted out, or on the contrary that the entirety of the works were performed in-house. Respondents pointed out that this significantly reduces the scope for the IM’s assessment and decision.
Since this report cannot address each national legal situation, it may only be used for guidance within the specific framework in place.
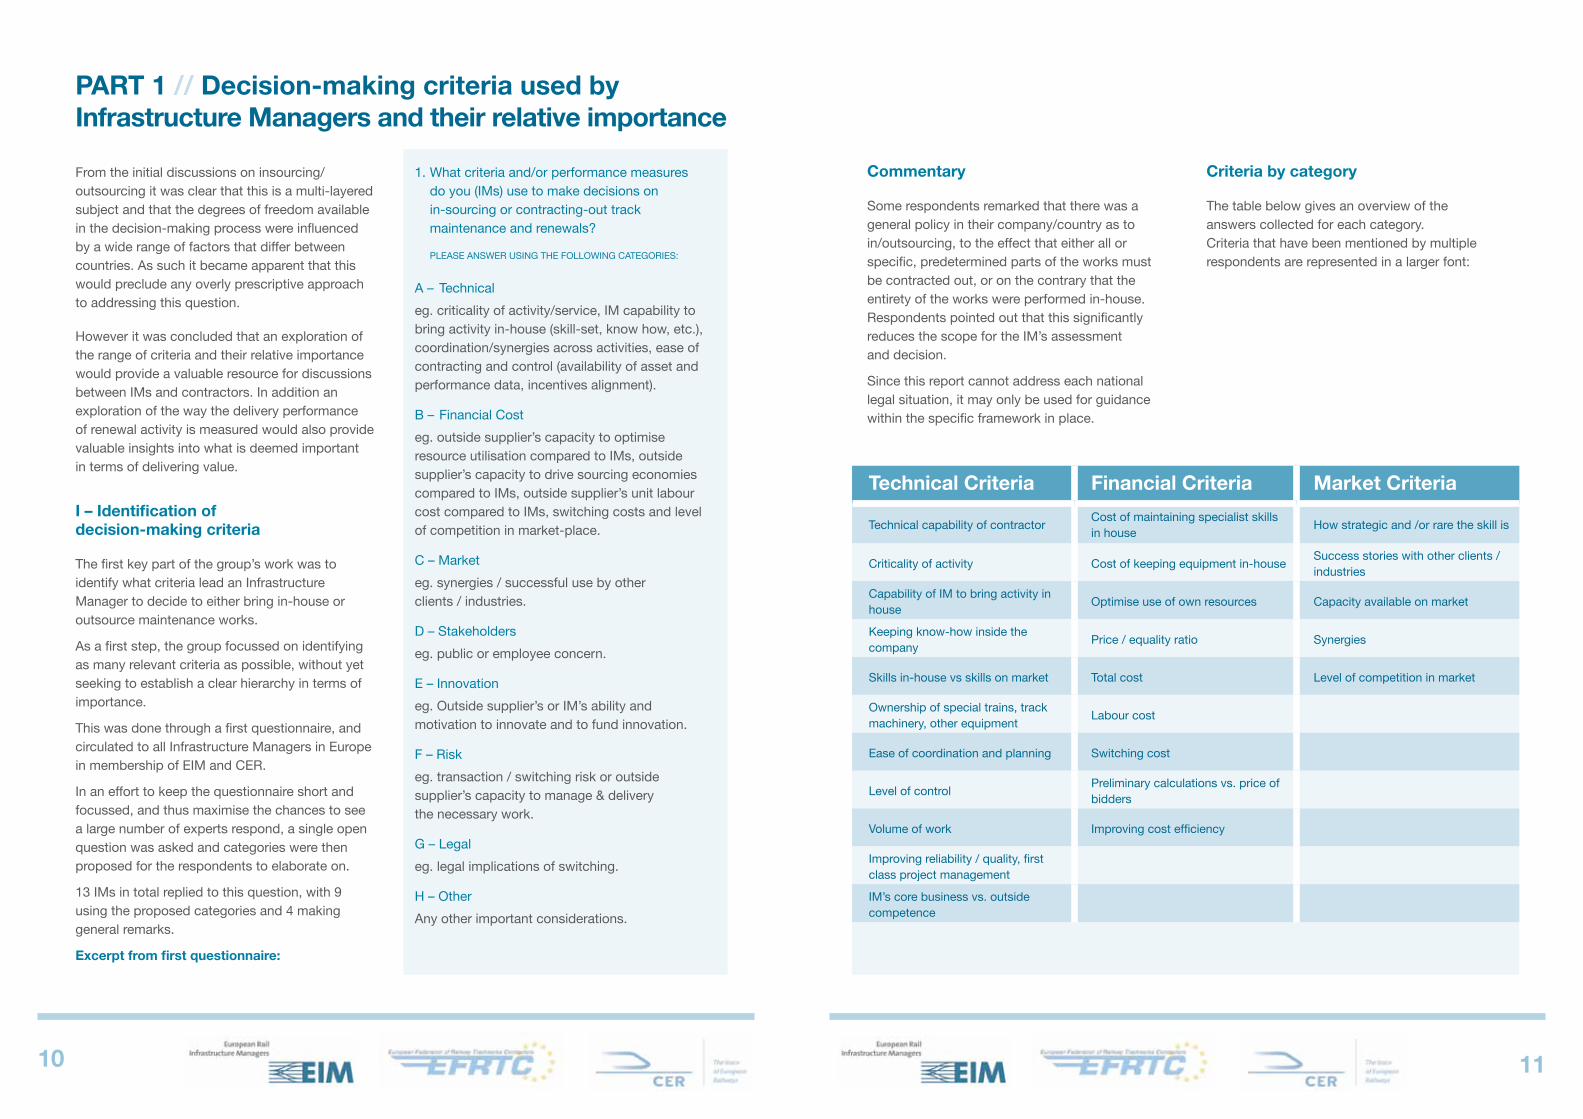
Criteria by category
The table below gives an overview of the answers collected for each category. Criteria that have been mentioned by multiple respondents are represented in a larger font:
Technical Criteria Financial Criteria Market Criteria
Technical capability of contractorCost of maintaining specialist skills in house
How strategic and /or rare the skill is
Criticality of activity Cost of keeping equipment in-houseSuccess stories with other clients / industries
Capability of IM to bring activity in house
Optimise use of own resources Capacity available on market
Keeping know-how inside the company
Price / equality ratio Synergies
Skills in-house vs skills on market Total cost Level of competition in market
Ownership of special trains, track machinery, other equipment
Labour cost
Ease of coordination and planning Switching cost
Level of controlPreliminary calculations vs. price of bidders
Volume of work Improving cost efficiency
Improving reliability / quality, first class project management
IM’s core business vs. outside competence
1312
Commentary
• Technical Criteria
This category attracted the highest response from respondents. They saw a number of criteria falling into this category as being important.
The capability of the IM to perform the activity in-house, the skills available in-house vs those n the market, as well as the criticality of the activity, stand out in particular.
• Financial Criteria
A number of cost factors were quoted under this category, however none of them was particularly dominant.
• Market-based Criteria
The level of competition in the contractors’ market stands out as a key item of interest to IMs.
• Stakeholders
Stakeholders are part of most of the responding IMs’ choices. They include own employees as well as the State, which in many cases is the owner of the IM as well as ‘buying’ a service from the IM, which entails a number of legal and contractual obligations.
• Innovation
According to a large majority of respondents, access to innovation and modern technology is one of the key factors in outsourcing decisions.
• Risk
The risk factor is considered by half of the responding IMs. It is covered through risk models, contracts, or by requesting documented evidence from the contractors.
The latter can relate to economic viability as well as technical capability and is requested as part of the tendering process.
• Legal
Legal aspects are not seen as driving factors by most IMs in outsourcing decisions. They are limited to regular procurement or labour laws in place in the country.
stakeholder Innovation Risk legal
All stakeholders consideredAccess to innovation and modern technology
Risk analysis or modellingProcurement and competition law
Presence of in-house employees
Covered in contracts Labour law
State (owner + “buyer” of IM’s services)
Contractor to provide evidence of capability
Contractor to demonstrate economic and financial soundness in tendering process
summary of Criteria & Conclusions
The feedback received from Infrastructure Managers illustrated that key criteria in their decisions to in/outsource works were often mainly technical or financial in nature. However, they also relate to the competence and resources which IMs feel a contractor can bring to a project. IMs are also sensitive to developments in the contractor market and to success stories.
A number of IMs already own machinery or have qualified staff in-house. They strive to optimise the use of these internal resources. In that case, day-to-day maintenance is usually kept in-house, while they will be looking to tender out renewals and projects that require specific competence, strong leadership, additional resources, or access to innovation. Volume is also a key factor, as these IMs will only look for contractors’ support where a sufficiently large volume of work is reached which exceeds their internal capacity.
II – Measuring Performance of Maintenance and Renewal works
The second part of the questionnaire addressed the question of how to measure the performance of maintenance & renewals, whether they were performed in-house or contracted out. Four different points were dealt with in the questionnaire to explore how performance is measured, what influences performance, and what other measures would be useful.
The four areas covered were:
1. Criteria used in the assessment of performance
2. European benchmarking
3. Infrastructure characteristics and increased complexity
4. Charging for possession time
Question 1:what criteria do you use to assess the performance of your contractors or in-house teams in charge with maintenance and renewal works?
THESE CRITERIA MAy (BUT DO NOT HAVE TO) FALL INTO ThE FOLLOWING CATEGORIES:
A – Engineering compliance
B – Cost
C – Volume
D – Health, Safety & Environment
E – Timeliness
F – Other
This question was answered by 12 companies from 12 different EU countries. It helped identify the key elements of a good performance from the IM’s perspective. Most of the respondents used the five proposed categories or covered them in their answers.
1514
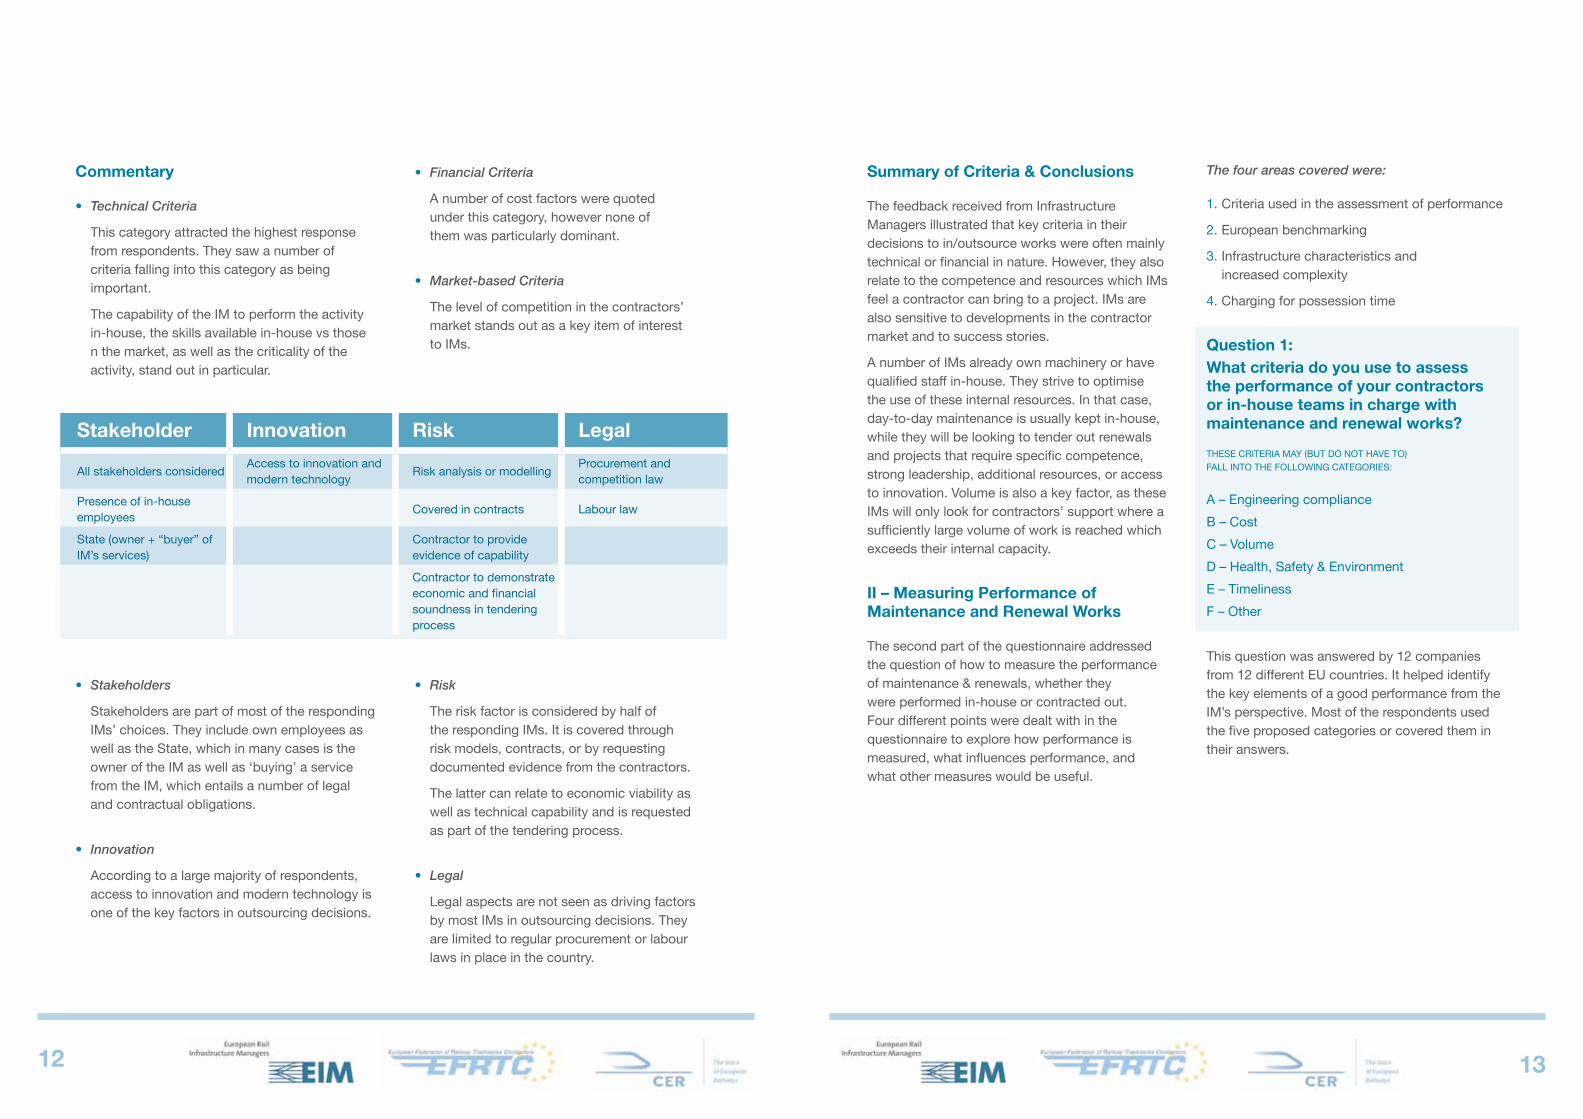
Commentary
It appears that Timeliness, Engineering compliance and Cost are key aspects for a large majority of the IMs. health, Safety and Environment concerns were also quoted by half of the respondents. Volume only appeared in three answers.
In addition to the proposed categories, four respondents referred to ‘Quality’ of the works, without elaborating on the concept of general quality. It can be assumed that Quality probably includes engineering compliance but also goes beyond, and is a broader concept encompassing several other aspects.
Two respondents also referred to the ability to deliver competence and resources as required by the project as another criterion.
The comments showed that IMs have developed different tools and procedures specifically to monitor and assess performance levels on track works against their own set of criteria.
Some of these different practices are listed below:
• Balanced score card
• Dynamic track testing
• Routines(planning activities), quality audits, and service level agreements
• A specific procedure is defined and implemented by the purchasing department
• Monthly monitoring procedure & quarterly evaluation
Engineering compliance
Cost Volume HSE Timeliness
8 8
3
6
10
What criteria do you use to assess the performance level for M&R works?
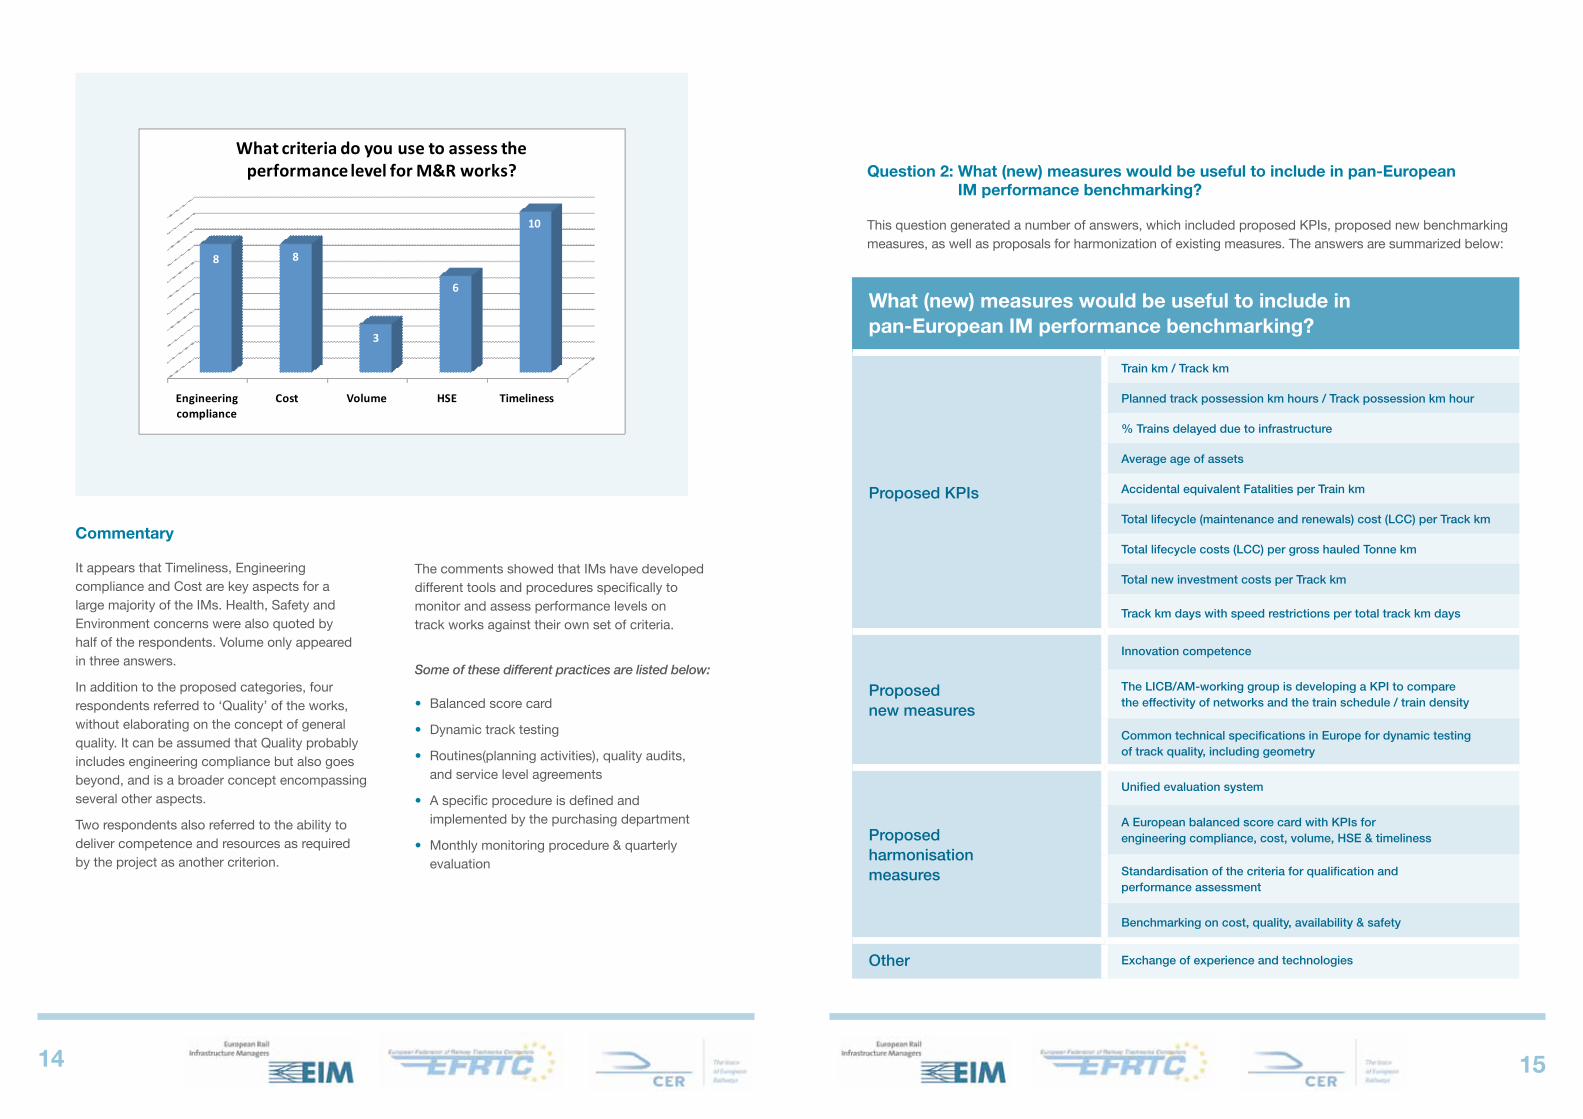
Question 2: what (new) measures would be useful to include in pan-European IM performance benchmarking?
what (new) measures would be useful to include in pan-European IM performance benchmarking?
Proposed KPIs
Train km / Track km
Planned track possession km hours / Track possession km hour
% Trains delayed due to infrastructure
Average age of assets
Accidental equivalent Fatalities per Train km
Total�lifecycle�(maintenance�and�renewals)�cost�(LCC)�per�Track�km
Total�lifecycle�costs�(LCC)�per�gross�hauled�Tonne�km
Total new investment costs per Track km
Track km days with speed restrictions per total track km days
Proposed new measures
Innovation competence
The LICB/AM-working group is developing a KPI to compare the effectivity of networks and the train schedule / train density
Common technical specifications in Europe for dynamic testing of track quality, including geometry
Proposed harmonisation measures
Unified evaluation system
A European balanced score card with KPIs for engineering compliance, cost, volume, HSE & timeliness
Standardisation of the criteria for qualification and performance assessment
Benchmarking on cost, quality, availability & safety
Other Exchange of experience and technologies
This question generated a number of answers, which included proposed KPIs, proposed new benchmarking measures, as well as proposals for harmonization of existing measures. The answers are summarized below:
1716
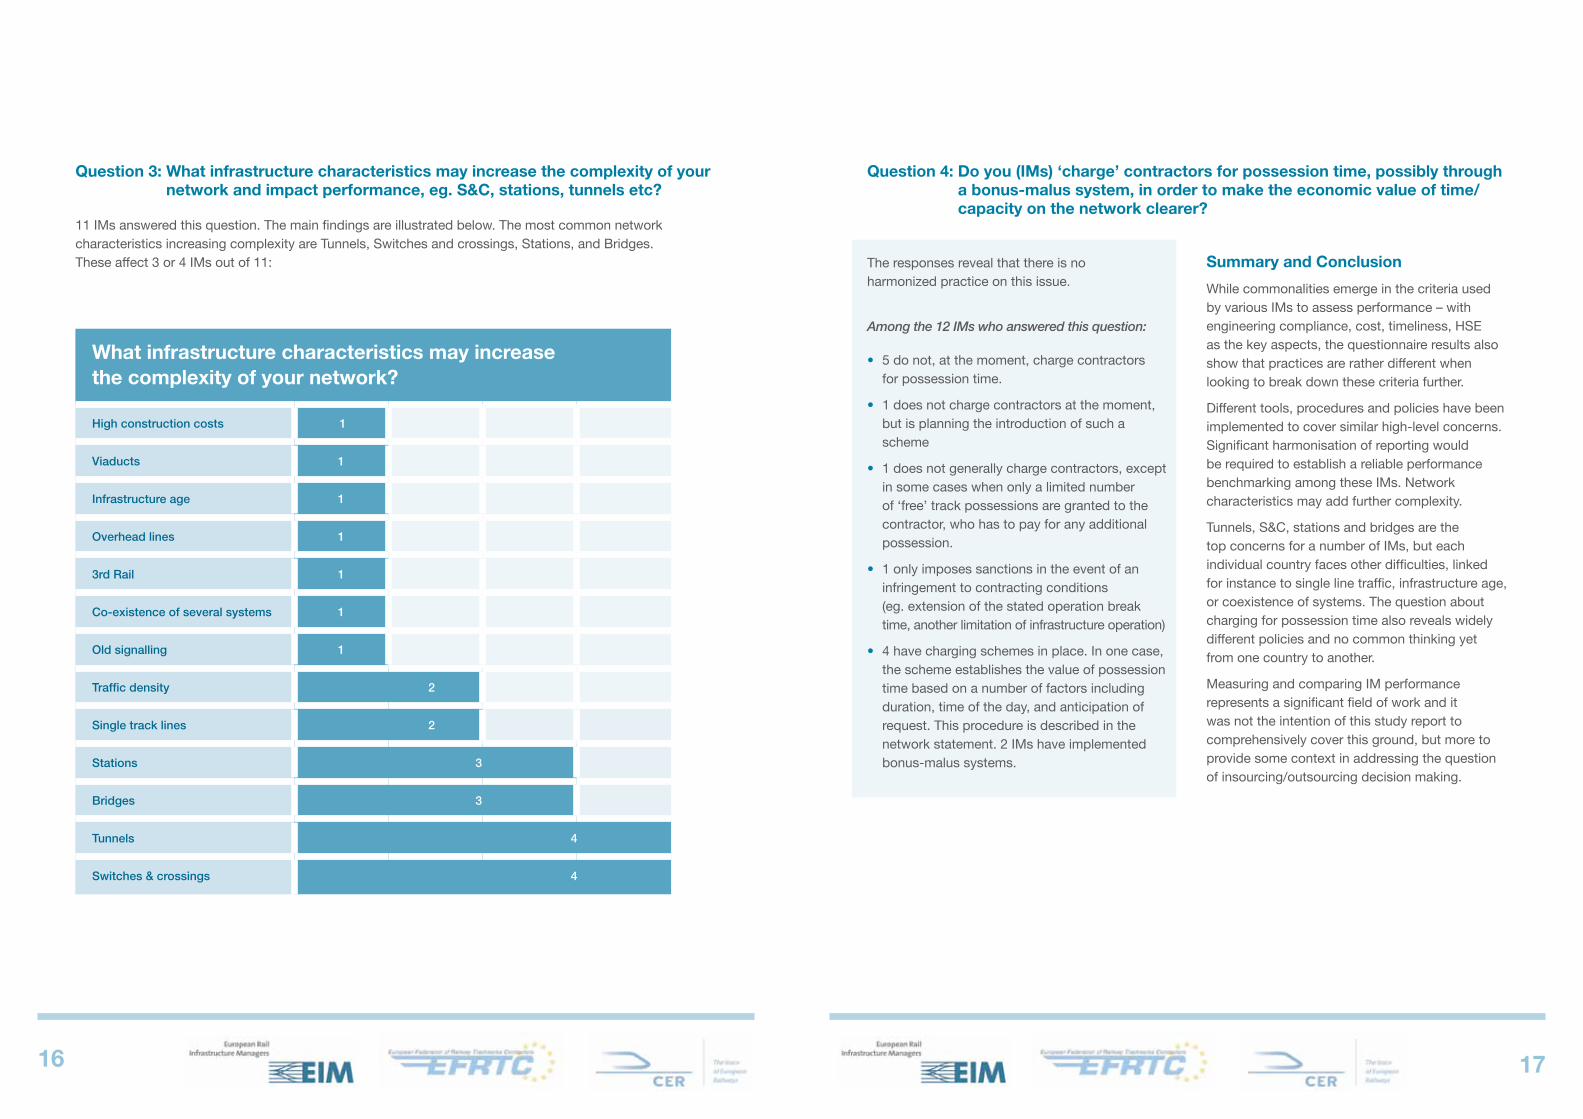
what infrastructure characteristics may increase the complexity of your network?
High construction costs 1
Viaducts 1
Infrastructure age 1
Overhead lines 1
3rd Rail 1
Co-existence of several systems 1
Old signalling 1
Traffic density 2
Single track lines 2
Stations 3
Bridges 3
Tunnels 4
Switches & crossings 4
Question 3: what infrastructure characteristics may increase the complexity of your network and impact performance, eg. s&C, stations, tunnels etc?
11 IMs answered this question. The main findings are illustrated below. The most common network characteristics increasing complexity are Tunnels, Switches and crossings, Stations, and Bridges. These affect 3 or 4 IMs out of 11:
Question 4: Do you (IMs) ‘charge’ contractors for possession time, possibly through a bonus-malus system, in order to make the economic value of time/capacity on the network clearer?
The responses reveal that there is no harmonized practice on this issue.
Among the 12 IMs who answered this question:
• 5 do not, at the moment, charge contractors for possession time.
• 1 does not charge contractors at the moment, but is planning the introduction of such a scheme
• 1 does not generally charge contractors, except in some cases when only a limited number of ‘free’ track possessions are granted to the contractor, who has to pay for any additional possession.
• 1 only imposes sanctions in the event of an infringement to contracting conditions (eg. extension of the stated operation break time, another limitation of infrastructure operation)
• 4 have charging schemes in place. In one case, the scheme establishes the value of possession time based on a number of factors including duration, time of the day, and anticipation of request. This procedure is described in the network statement. 2 IMs have implemented bonus-malus systems.
summary and Conclusion
While commonalities emerge in the criteria used by various IMs to assess performance – with engineering compliance, cost, timeliness, hSE as the key aspects, the questionnaire results also show that practices are rather different when looking to break down these criteria further.
Different tools, procedures and policies have been implemented to cover similar high-level concerns. Significant harmonisation of reporting would be required to establish a reliable performance benchmarking among these IMs. Network characteristics may add further complexity.
Tunnels, S&C, stations and bridges are the top concerns for a number of IMs, but each individual country faces other difficulties, linked for instance to single line traffic, infrastructure age, or coexistence of systems. The question about charging for possession time also reveals widely different policies and no common thinking yet from one country to another.
Measuring and comparing IM performance represents a significant field of work and it was not the intention of this study report to comprehensively cover this ground, but more to provide some context in addressing the question of insourcing/outsourcing decision making.
1918
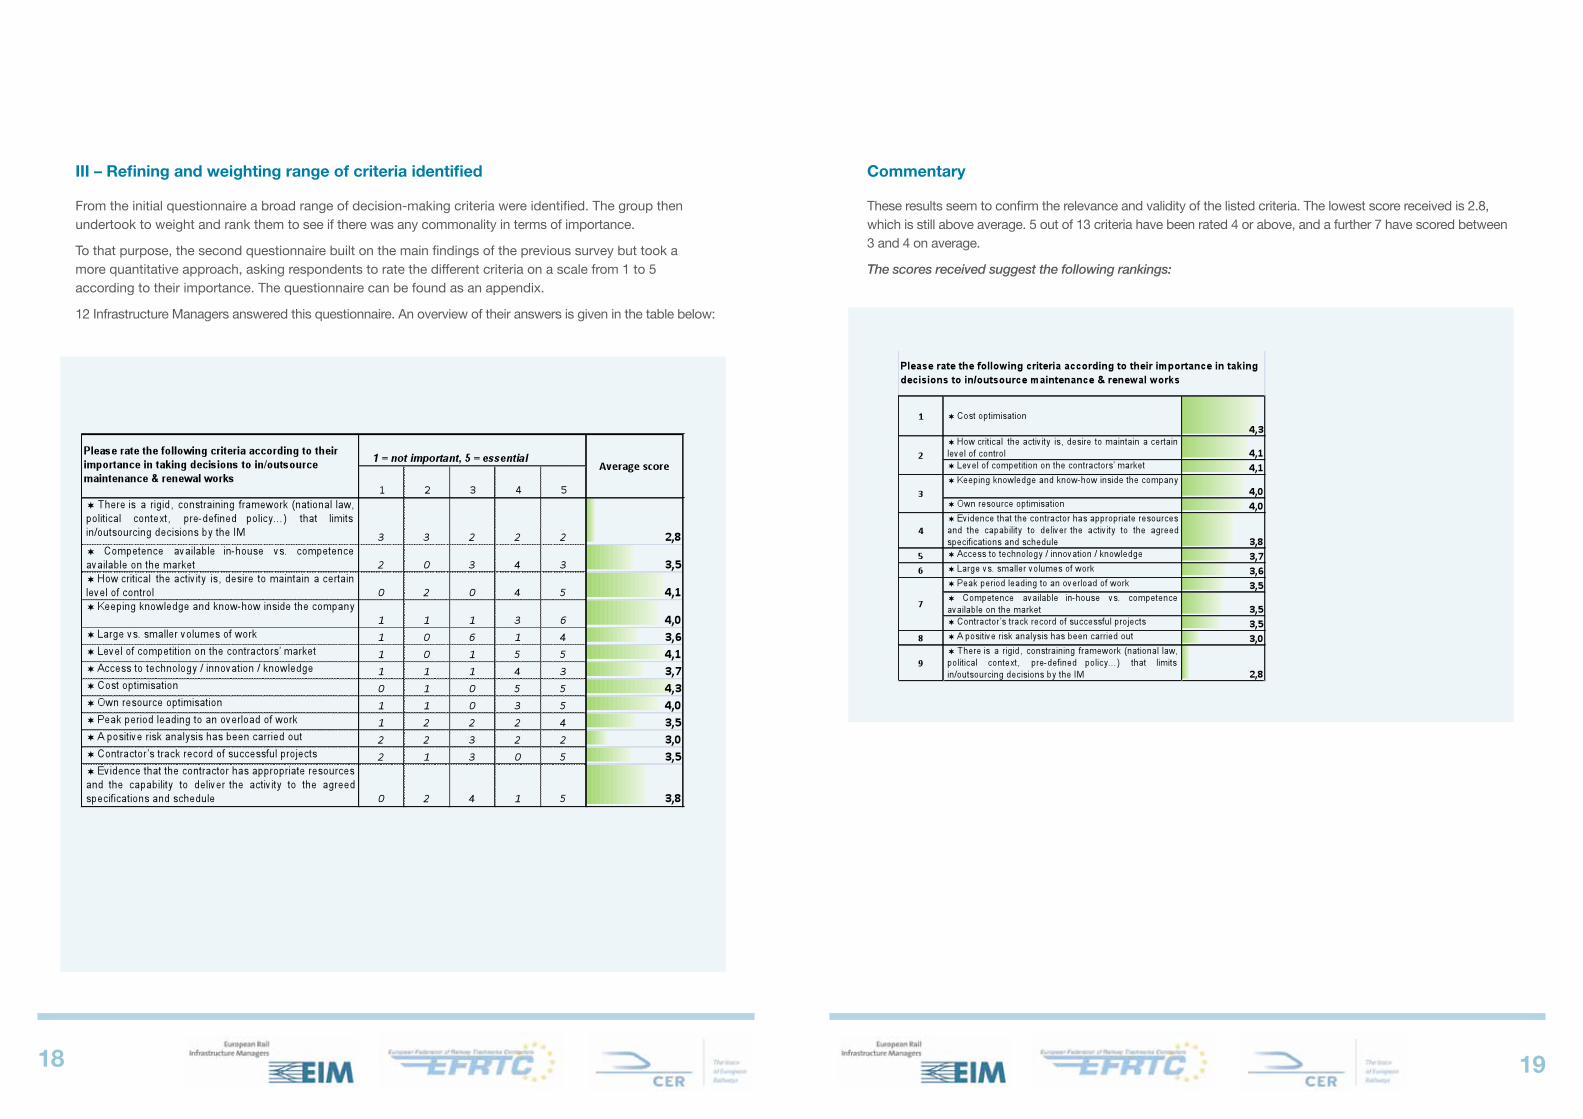
III – Refining and weighting range of criteria identified
From the initial questionnaire a broad range of decision-making criteria were identified. The group then undertook to weight and rank them to see if there was any commonality in terms of importance.
To that purpose, the second questionnaire built on the main findings of the previous survey but took a more quantitative approach, asking respondents to rate the different criteria on a scale from 1 to 5 according to their importance. The questionnaire can be found as an appendix.
12 Infrastructure Managers answered this questionnaire. An overview of their answers is given in the table below:
Commentary
These results seem to confirm the relevance and validity of the listed criteria. The lowest score received is 2.8, which is still above average. 5 out of 13 criteria have been rated 4 or above, and a further 7 have scored between 3 and 4 on average.
The scores received suggest the following rankings:
2120
Commentary
The top five items in the eyes of IMs are as follows: • cost optimization, criticality of the activity,
• level of competition on contractors’ market,
• keeping knowledge and know-how in the company,
• own resource optimization.
The IM’s choice appears to focus on optimizing costs and resources, looking both at the internal situation (how critical the activity is to the IM, what resources are available internally, what skills and knowledge are available) and the contractors’ market – and especially, how competitive this market is.
These are followed by a group of criteria rated between 3,5 and 3,8, including evidence of the contractors’ resources and capability, access to technology / innovation / knowledge, volume of work, overload of work during peak period, competence available in-house vs. that available on the market, contractor’s track record of successful projects. Again, there is a blend of internal considerations (volume of work, peak period, in-house competence) and external factors, with particular focus on the contractor’s competence and
evidence of it (resources, capability, track record, access to technology and innovation).
A positive risk analysis does not always seem to be perceived as essential, with a score of 3,0. While this low score surprised the members of the working group, they felt that it may simply reflect the fact that a full formal analysis is not always done, even though risk is always considered. This result could partly be explained by the specific wording used in the question: respondents may have felt that they do not systematically carry out a formal risk analysis, which prompted them to give a low rate to this item.
However, it is believed that they do have potential risks and their assessment high in their mind when making decisions.
A rigid, constraining framework is the lowest ranking criterion, which is not particularly surprising since this one typically describes the national situation. Some countries have laid down a more constraining framework than others, leaving more restricted possibilities for IMs to make decisions to in/outsource maintenance and renewals. On the other hand, some IMs have very little constraint in defining their own policy, while most companies experience intermediate situations along the spectrum.
An open discussion during the second meeting of the working group saw a general agreement that behaviours play an essential part in the IM-Contractor relationship and significantly influence the overall performance. All participants shared the opinion that specific behaviours may lead to value being added, or may destroy value.
The group decided that studying this aspect was an important addition to the report. A list of value-adding vs. value-destroying behaviours was prepared as part of the group’s second questionnaire and circulated to all IMs.
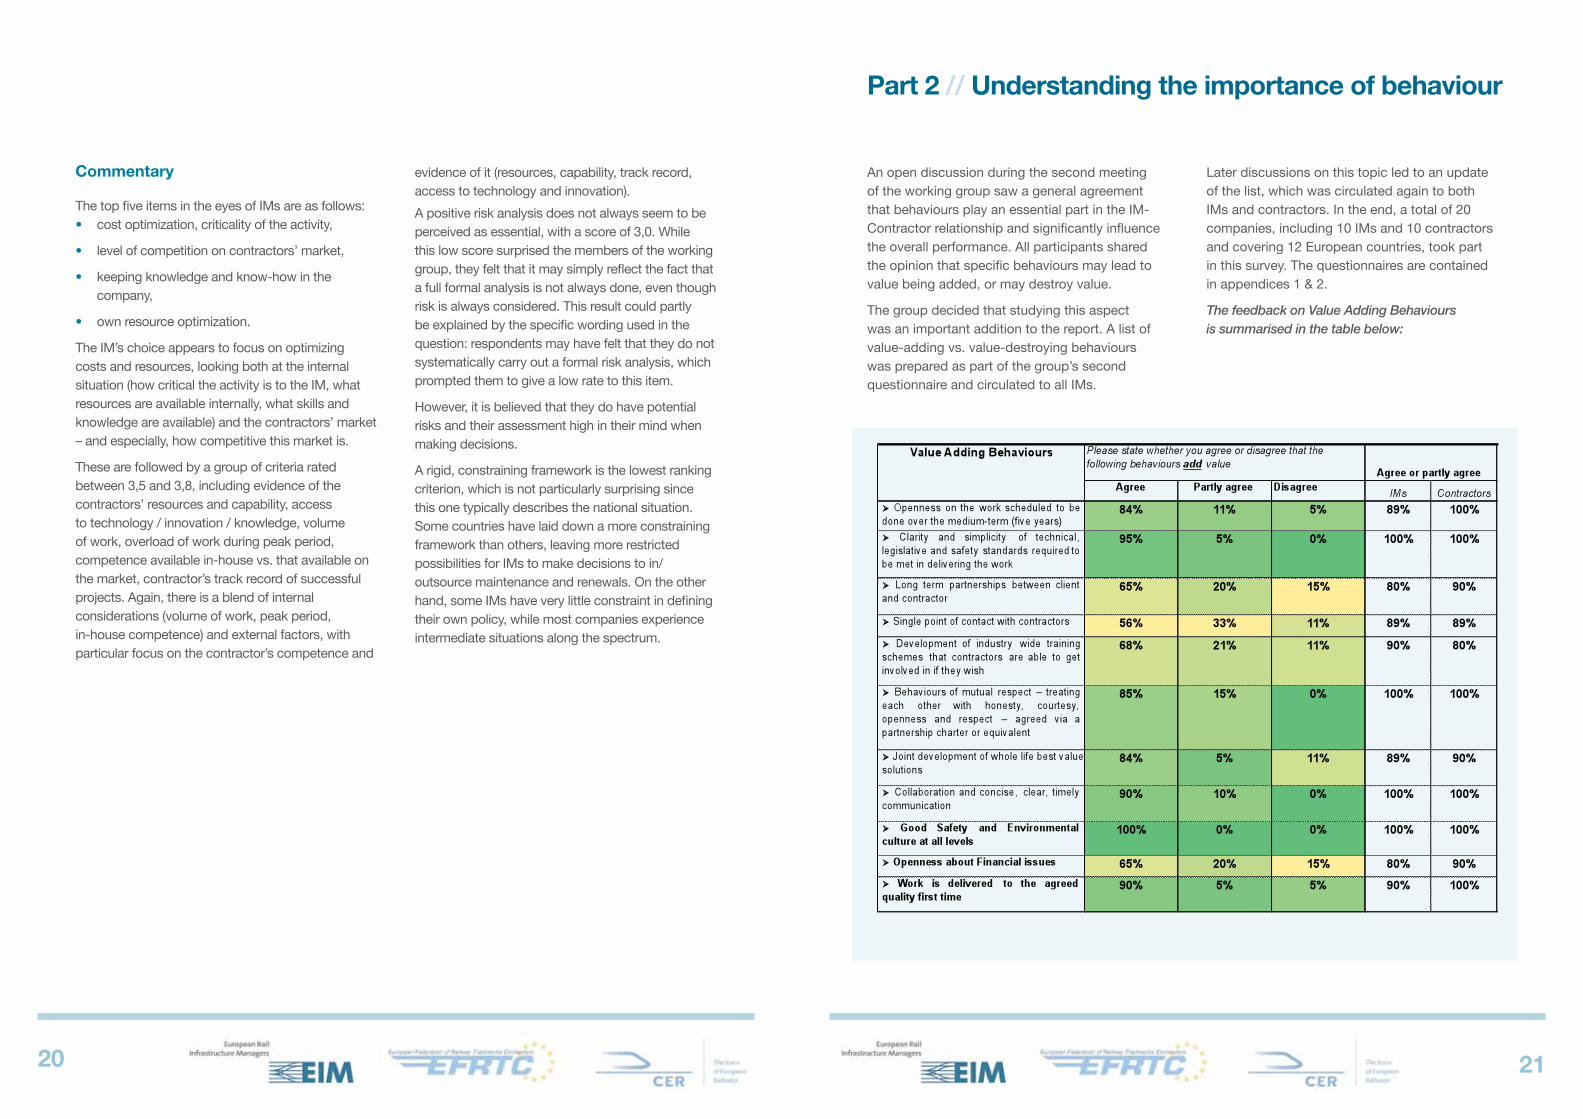
Later discussions on this topic led to an update of the list, which was circulated again to both IMs and contractors. In the end, a total of 20 companies, including 10 IMs and 10 contractors and covering 12 European countries, took part in this survey. The questionnaires are contained in appendices 1 & 2.
The feedback on Value Adding Behaviours is summarised in the table below:
Part 2 // Understanding the importance of behaviour

2322
Commentary
The list of value-adding behaviours seems to be mostly supported by both IMs and contractors. Generally, the correlation between IM’s and contractors’ answers is also fairly high, as shown in the last column below. Only minor differences in scores can be observed.
The items showing discrepancies were discussed during a meeting of the group, with the following conclusions:
• Openness of the work scheduled to be done over medium-term (five years): comments from responding IMs point out that schedules are not always available five years out, hence a less positive feedback. While the principle of openness is generally supported, some IMs feel that the suggested five years was too long a time period.
• Single point of contact with contractors: it was agreed that this question was slightly misleading as ‘single point of contact’ could be interpreted in different ways, eg. ‘single contact person’ or ‘single source of information’, leading to a lower level of support from both IMs and contractors.
• Development of industry wide training schemes: it seemed very surprising to participants that not all contractors would be in favour of this. No satisfactory explanation of principle could be found, with the group agreeing that this may be a wording issue, rather than representing an actual lack of support for the proposal.
• As a general remark, it was agreed that with hindsight, some of the questions could have been better phrased. More reliable results could have been obtained on some specific issues if the questions had been more straightforward, leading to a more consistent interpretation by the different respondents. This is a lesson learned for future similar projects.
Feedback on Value Destroying Behaviours is summarised in the table overleaf.
Commentary
The feedback showed than most proposals on the list had strong agreement both by IMs and contractors. It is therefore reasonable to assume that all are commonly believed to be value destroying behaviours.
Concluding remarks – Parts 1 & 2 summary
Key criteria in Infrastructure Managers’ (IMs’) decisions for in/outsourcing works are often mainly technical or financial in nature. However, they also relate to the competence and resources which IMs feel a contractor can bring to a project. IMs are also sensitive to developments in the contractor market and to success stories.
A number of IMs already own machinery or have qualified staff in-house. They strive to optimise the use of these internal resources. In that case, day-to-day maintenance is usually kept in-house, while they will be looking to tender out renewals and projects that require specific competence, strong leadership, additional resources, or access to innovation. Volume is also a key factor, as these IMs will only look for contractors’ support where a sufficiently large volume of work is reached which exceeds their internal capacity.
While commonalities emerge in the criteria used by various IMs to assess performance – with engineering compliance, cost, timeliness, and HSE (Health, Safety and Environment) compliance as the key aspects - the questionnaire results also show that practices are rather different when looking to break down these criteria further. Different tools, procedures and policies have been implemented to cover similar high-level concerns. The question about charging for possession time also reveals widely different policies and no common thinking yet from one country to another.
Measuring and comparing IM performance represents a significant field of work and it was not the intention of this study report to comprehensively cover this ground, but more to provide some context in addressing the question of insourcing/outsourcing decision making.
Following the evaluation of quantitative assessment of the IMs’ responses the top priority in decision making for in-outsourcing is given to cost optimization, criticality of the activity, level of competition in contractors’ market, keeping knowledge and know-how in the company, and own resource optimization. The IMs’ choice appears to focus on optimizing costs and resources, looking both at the internal situation (how critical the activity is to the IM, what resources are available internally, what skills and knowledge are available) and the contractors’ market - and especially, how competitive this market is.
On the second rank is a group of criteria including evidence of the contractors’ resources and capability, access to technology / innovation / knowledge, volume of work, overload of work during peak period, competence available in-house vs. that available on the market, and the contractor’s track record of successful projects. Again, there is a blend of internal considerations (volume of work, peak period, in-house competence) and external factors, with particular focus on the contractor’s competence and evidence of it (resources, capability, track record, access to technology and innovation).
2524
A positive risk analysis does not always seem to be perceived as essential. This is believed to be mainly due to the fact that not all IMs carry out formal risk analyses systematically. However, it can be assumed that they are well aware of potential risks and that their assessment is high in their mind when making decisions.
A rigid, constraining framework is the lowest ranking criterion, which is not particularly surprising since this one typically describes the national situation.
The evaluation of responses to value-adding and value-destroying behaviour in relationships between IMs and contractors shows fairly high correlations between IMs and contractors with some minor discrepancies which are explained in the report.
Concerning value-added issues the top four obtaining more than 90 % agreement were:
• Good safety and environmental culture at all levels
• Clarity and simplicity of technical, legislative and safety standards required to be met in delivering the works
• Collaboration and concise, clear, timely communication
• Work is delivered to the agreed quality first time
With regard to value destroying issues the top four above 90% agreement were:
• Lack of clarity in scope of work to be done, frequent uncontrolled and late changes by client, specifications, standards and capacity
• Poor site management or pressure to take short cuts
• Short notice change to track access requirements or availability
• Poor quality work requiring corrective actions and thus reducing track capacities for operators
The above findings demonstrate the variety of approaches of IMs to in/outsourcing so it is not surprising that the scale of in/outsourcing varies starting from performing most work in-house to outsourcing all works to contractors. The case studies were selected to demonstrate various patterns observed in Europe.
It is evident however that in most countries track maintenance is carried out in-house while track renewal is outsourced on the basis of competitive tendering. There are some exceptions where IMs are carrying out most types of work using their own resources and contracting only for peak requirements or special works.
On the other hand there are good examples of full outsourcing of both track maintenance and renewal and/or close and sound cooperation between clients and contractors with benefits for both IMs and contractors.
Part 3 // Catalogue of good practice examples
I – Introduction
During the course of this study a number of examples of Market Strategy good practice have been identified. It is important to note that these studies are not presented as ‘best practice’ or ‘exemplars’. They are approaches that have driven genuine benefit and value for those that have deployed them and as such are a valuable resource from which others can draw lessons or ideas.
II – Individual Case studies
The following case studies are described in this Part:
• Case Study 1 – Finland
• Case Study 2 – France
• Case Study 3 – Netherlands
• Case Study 4 – Switzerland
• Case Study 5 – UK
• Case Study 6 – UK
All the Case Studies except 4 and 6 were provided by Infrastructure Managers or rail administrations.
The Switzerland report comes from one contractor but the findings have been validated and confirmed by Swiss infrastructure managers.
The Finland case study does not deal with track maintenance and renewal but with signalling, but was included because the proposed methodology can be adopted for track maintenance and renewal.
The Netherlands case study was selected as an example of a country where all track maintenance is outsourced, to demonstrate that both Infrastructure Manager and contractors can each concentrate on their respective core business – the IM on asset management and contractors on performing track maintenance and renewal, while both parties keep their core competencies and know-how.
The French example presents the performance contract between the state and RFF which provides stability of planning and funding while defining performance criteria essential for decision making for contracting.
2726
Case study 1 // Finland: a collaborative process of product lifecycle management for railway signalling infrastructure
aki härkönen
Finnish Rail Administration, Rail Network Department. Helsinki 2008. Publications of the Finnish Rail Administration A 13/2008. 93 pages and 5 appendices. ISBN 978-952-445-245-8, ISBN 978-952-445-246-5 (pdf), ISSN 1455-2604, ISSN 1797-6995 (pdf).
Key words: Product Lifecycle Management, PLM, collaboration management, rail infra structure management, railway signalling maintenance
abstract
The purpose of this study is to define a collaborative process of Product Lifecycle Management (PLM) for railway signalling infrastructure.
In the theoretical part of the study different methods of Product Lifecycle Management and collaboration management and their principles are discussed as they provide a basis for the empirical part of the study, depending on which, a collaborative process of PLM for railway signalling infrastructure is created.
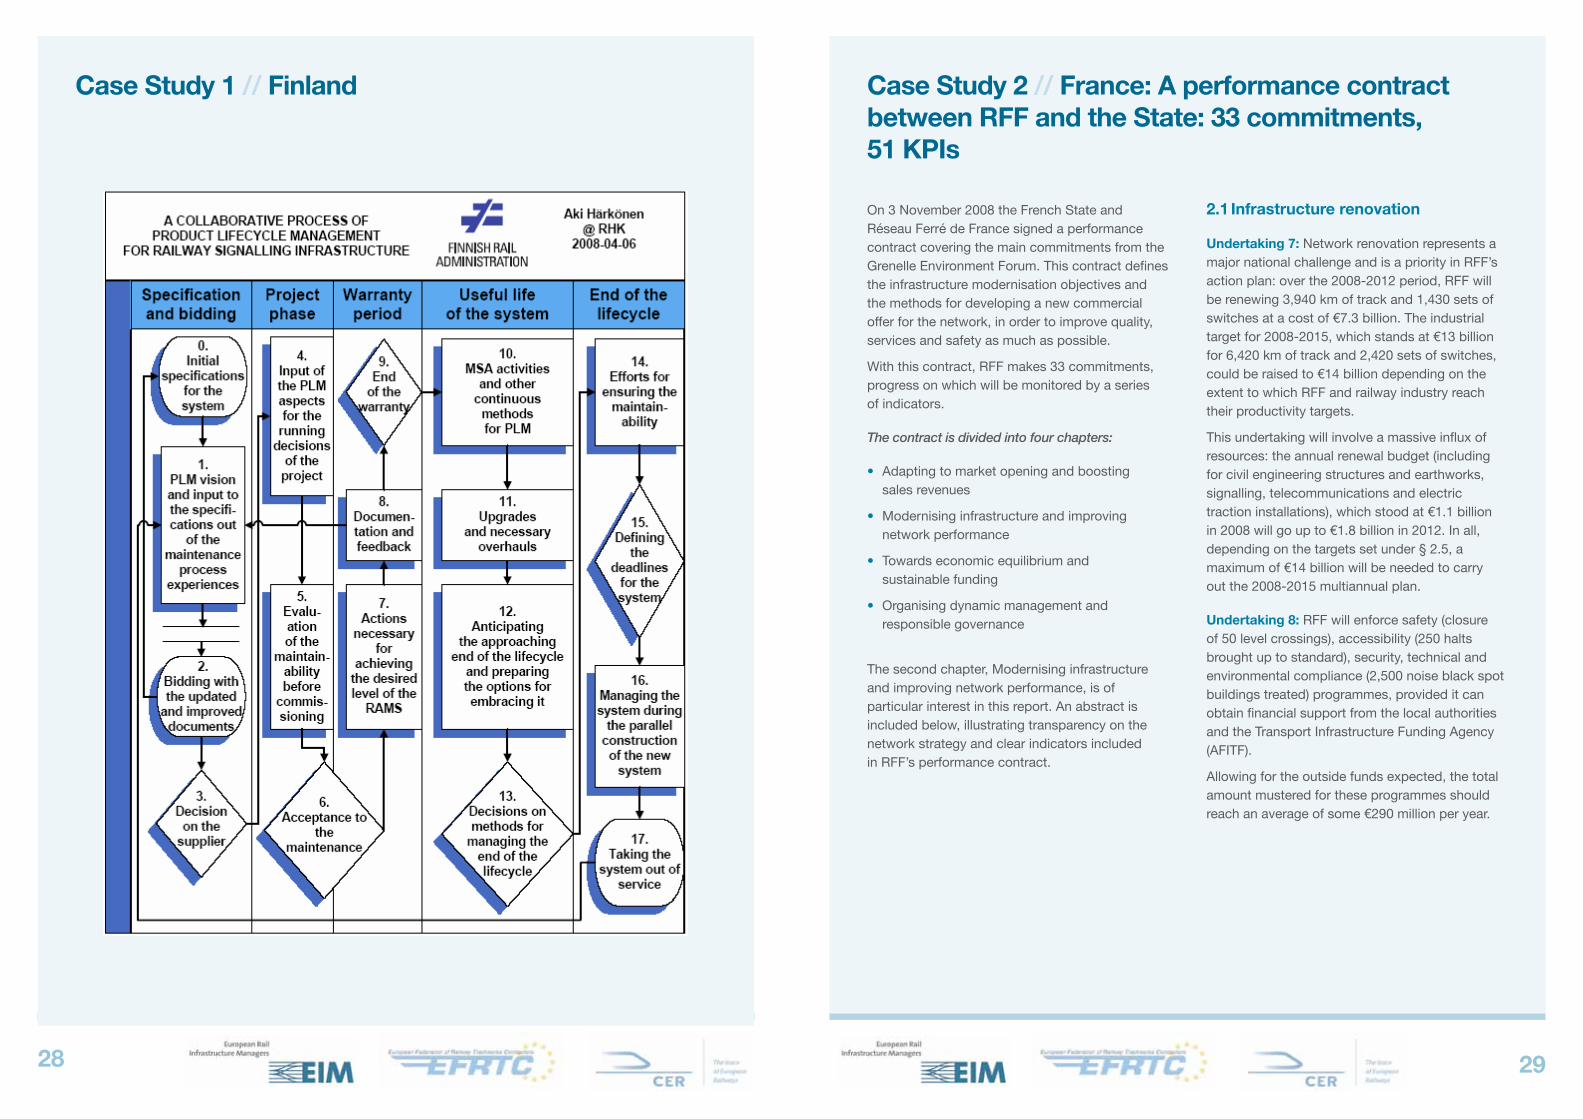
The collaborative process of PLM describes a set of methods of PLM, which the partners involved can utilize in order to facilitate the process of an optimal and continuously improvable railway signalling infrastructure management.
The collaborative process of PLM facilitates railway signalling management at the Finnish Rail Administration (RHK). It highlights the collaboration between the rail infrastructure manager with the signalling suppliers, and railway signalling maintenance contractors and eventually improves the quality of the service of the railway signalling.
The study was conducted by having interactive interview sessions with chosen representatives of signalling suppliers and maintenance contractors. The sessions were led by the researcher and they sought after the areas of improvement and suitable practices to be utilized in the relations between the partners: the purchaser, the signalling supplier and the maintenance contractor.
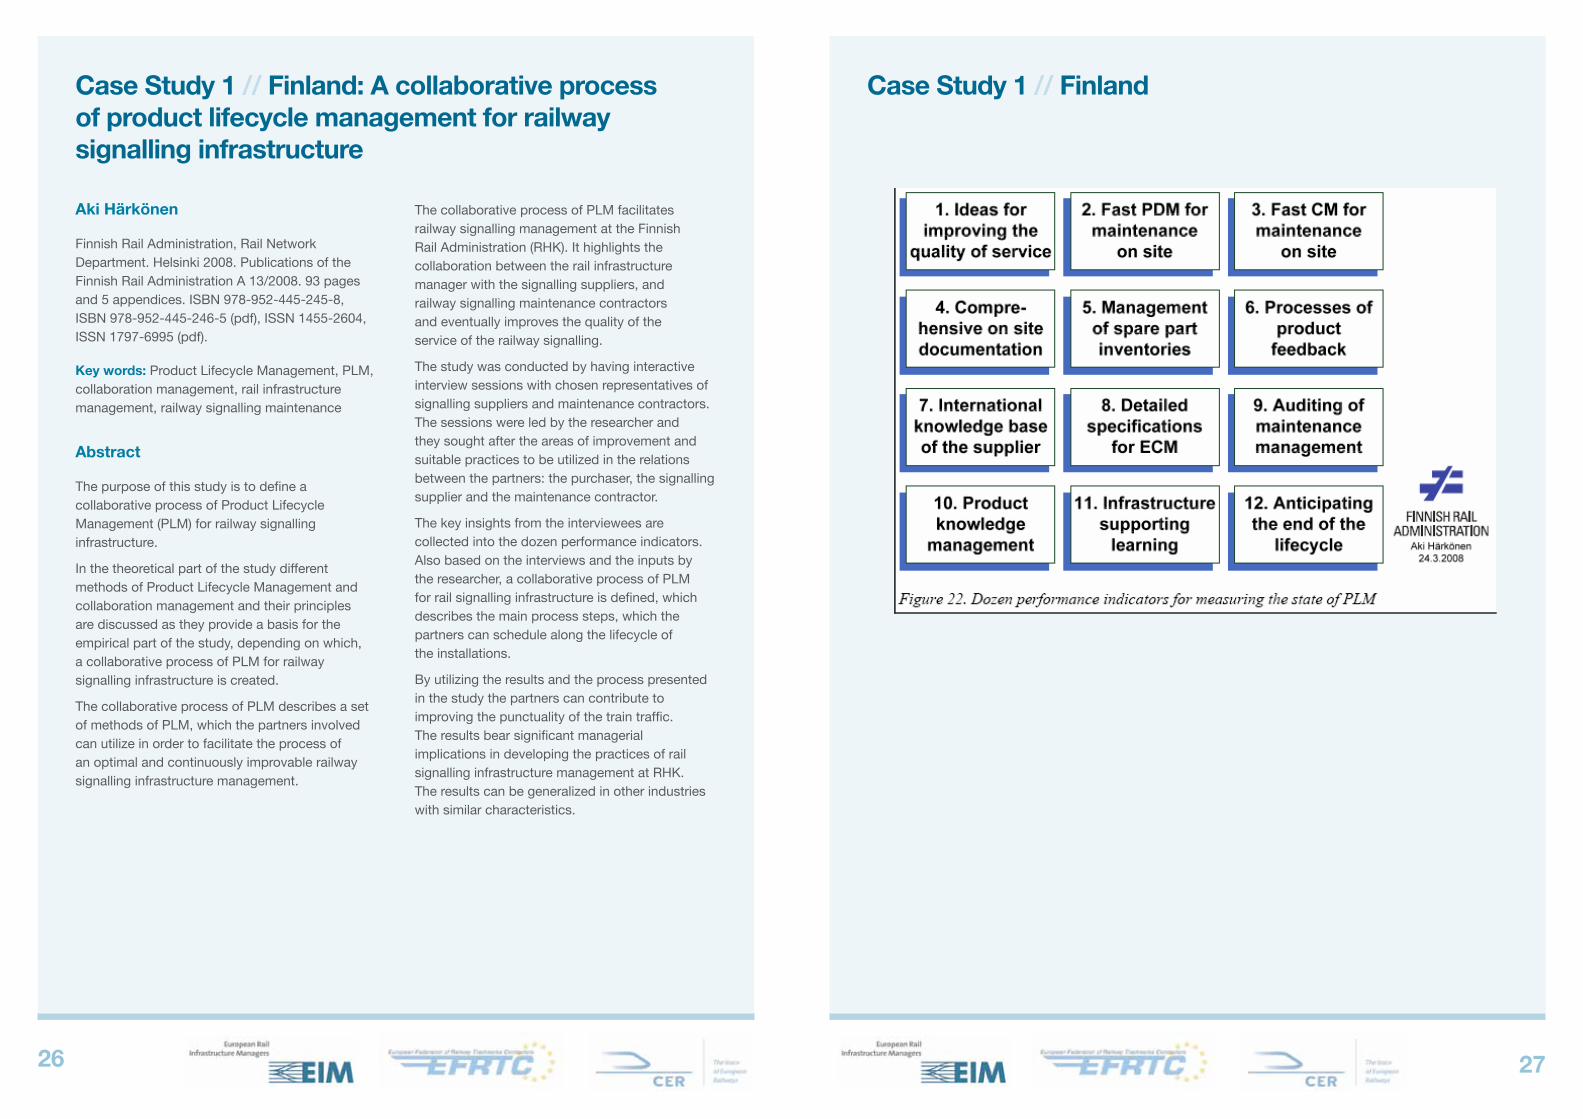
The key insights from the interviewees are collected into the dozen performance indicators. Also based on the interviews and the inputs by the researcher, a collaborative process of PLM for rail signalling infrastructure is defined, which describes the main process steps, which the partners can schedule along the lifecycle of the installations.
By utilizing the results and the process presented in the study the partners can contribute to improving the punctuality of the train traffic. The results bear significant managerial implications in developing the practices of rail signalling infrastructure management at RhK. The results can be generalized in other industries with similar characteristics.
Case Study 1 // Finland
2928
Case Study 1 // Finland
Case study 2 // France: a performance contract between RFF and the state: 33 commitments, 51 KPIs
On 3 November 2008 the French State and Réseau Ferré de France signed a performance contract covering the main commitments from the Grenelle Environment Forum. This contract defines the infrastructure modernisation objectives and the methods for developing a new commercial offer for the network, in order to improve quality, services and safety as much as possible.
With this contract, RFF makes 33 commitments, progress on which will be monitored by a series of indicators.
The contract is divided into four chapters:
• Adapting to market opening and boosting sales revenues
• Modernising infrastructure and improving network performance
• Towards economic equilibrium and sustainable funding
• Organising dynamic management and responsible governance
The second chapter, Modernising infrastructure and improving network performance, is of particular interest in this report. An abstract is included below, illustrating transparency on the network strategy and clear indicators included in RFF’s performance contract.
2.1 Infrastructure renovation
Undertaking 7: Network renovation represents a major national challenge and is a priority in RFF’s action plan: over the 2008-2012 period, RFF will be renewing 3,940 km of track and 1,430 sets of switches at a cost of €7.3 billion. The industrial target for 2008-2015, which stands at €13 billion for 6,420 km of track and 2,420 sets of switches, could be raised to €14 billion depending on the extent to which RFF and railway industry reach their productivity targets.
This undertaking will involve a massive influx of resources: the annual renewal budget (including for civil engineering structures and earthworks, signalling, telecommunications and electric traction installations), which stood at €1.1 billion in 2008 will go up to €1.8 billion in 2012. In all, depending on the targets set under § 2.5, a maximum of €14 billion will be needed to carry out the 2008-2015 multiannual plan.
Undertaking 8: RFF will enforce safety (closure of 50 level crossings), accessibility (250 halts brought up to standard), security, technical and environmental compliance (2,500 noise black spot buildings treated) programmes, provided it can obtain financial support from the local authorities and the Transport Infrastructure Funding Agency (AFITF).
Allowing for the outside funds expected, the total amount mustered for these programmes should reach an average of some €290 million per year.
3130
2.2: Keeping renewal investment costs under control
Undertaking 9: RFF will launch a plan to reduce the mean cost per km of track renewal by 15% at constant rates in euros on conventional lines in UIC groups 1 to 6.
The main lines of thrust of this plan (‘GOPEQ’) will be better deployment of heavy track machines (rapid sequences), grouping works operations together over longer periods - an area where trade-offs will be necessary on the part of RFF to strike a balance between maintenance cost savings and loss of sales revenues – , development of the contractual arrangements with SNCF in its acting contract manager and prime contractor capacity, increased recourse to competitive tendering and adaptation of the payment conditions for the companies carrying out civil engineering work, incentive-based supply and procurement policy.
Undertaking 10: For the renovation plan to succeed, multiannual funding arrangements for renewal work must be completely transparent.
In point of fact, predictability as regards the funding earmarked for the works to be done will give extra security to contractual relations with the various suppliers (including SNCF) and confer added legitimacy on the more ambitious targets of cost control. By planning ahead in this way, RFF and Government will have a clear view of the resources that will be required over time, on a 5-year sliding basis.
2.3: Modernisation of maintenance
Undertaking 11: Network maintenance operations will be carried out and managed, in particular at regional level, under the present contract, whilst ensuring greater consistency between maintenance and renewal policies and collecting all the elements for appreciation and for progressing preparations for the next contract.
RFF is taking steps better to understand and more precisely gauge the results of inspection campaigns and preventive and remedial maintenance with a view to greater efficiency in the future: this objective will depend to a large extent on local action conducted in partnership with the decentralised agencies of SNCF.
At the same time, by exerting broader control over maintenance operations, RFF will be far better placed to ensure that services are performed as ordered, which should provide clients and the regulator with sufficient assurance that maintenance service standards in practice and the prices levied for infrastructure use are suitably matched.
To meet maintenance productivity targets, RFF will build the extended works periods specified in the management agreement into its schedules, in both volume and quality terms, whilst keeping the overall availability level of its network at acceptable levels, where necessary by routing traffic over parallel routes.
Case Study 2 // France
One of the conclusions of the 2005 audit related to the overall inadequacy of the resources allotted to maintenance and the atypical proportion of resources devoted in France to renewal (30%) as opposed to those spent on maintenance (70%): once it has been possible to catch up the backlog of outstanding work through the renovation plan, the ultimate target is to achieve a better balance and thereby a minimum average annual maintenance cost guaranteeing a quality network.
Optimising maintenance consists essentially of looking for synergies between the investment programmes and the maintenance schedule.
To prepare the ground for the next maintenance contract and optimise maintenance in relation to the actual use made of the network, RFF is substantially boosting its maintenance engineering through multiannual plans that include modernisation of methods, allocation of resources in relation to pre-set required performance standards and adaptation of the relative proportions of renewal and maintenance investment in flexible and effective fashion.
2.4 segmentation of network management policies
Undertaking 12: For 2010 RFF will be proposing a rational model to assist in decisions on functional and economic targets and on network marketing, maintenance and modernisation policies, applied at the level of the different network segments.
2.5 Organisation of network maintenance choices
Undertaking 13: In 2010 RFF will introduce a system for monitoring maintenance costs per subnetwork, corridor and region enabling the wisdom of the maintenance strategies adopted to be measured ex-ante and ex-post, against economic and physical criteria.
Case Study 2 // France
3332
Case study 3 // The netherlands: The history of outsourcing rail infrastructure maintenance in the netherlands
Jan swier, strategic Consultant, ProRail aM
The begin of the beginning
It became clear in the late 1980s that the Dutch national rail operator, NV Nederlandse Spoorwegen, or NS, was ripe for restructuring. There were three reasons for doing so: (1) expansion of the rail network, (2) the liberalization of the European rail transport market, and (3) a need to increase efficiency and effectiveness.
In 1990 all engineering consultancy and asset management activities were organised in separate organisations. Four years later engineering was outsourced. Also in 1994, the upkeep organisation was divided up into a management organisation, NS Railinfrabeheer, with 700 staff, and an operational unit, NS Infra Services, with 2800 staff.
In the same year was the launch of the ‘Tracks to ‘96’ operation. This culminated in 1996 in the administrative separation of the transport and rail infrastructure activities. The final financial and organisational separation of the two organisations had to await a new Railways Act in 2003.
In 1995 the decision was made to outsource maintenance to increase efficiency and improve performance. Towards the end of 1997, some 2800 NS employees were distributed between three newly formed and equivalent rail maintenance companies. All three are capable of undertaking the complete package of maintenance and upgrade work.
The consequences of outsourcing maintenance for the organisations involved and their employees have been enormous.
Consequences
Maintenance outsourcing changed everyone’s position and job description. Possibly the greatest change was for Railinfrabeheer staff, who slowly but surely saw all operational activities to be outsourced.
The remaining management task had never been explicitly identified and organised, which manifested itself mainly in the changing requirements set on the knowledge, skill and orientation of a great many staff.
The task orientation shifted from almost completely technical to commercial with support from technical specialists. An entirely new identity and culture had to be created, new tasks and processes defined, and missing instruments and procedures developed.
It looks with hindsight as if the government and NS had left rail infrastructure management and maintenance more or less to fend for themselves. NS Railinfrabeheer and the maintenance contractors alike were thrown in at the deep end, with no opportunity to prepare.
In all probability, it is thanks to the many (ex) NS staff with their informal contacts and highly regarded dedication that a complete loss of control (as happened in Great Britain) was avoided. They filled the gap created when informal contacts made way for formal contracts, but before management had the instruments to control them.
Maintenance outsourcing was therefore certainly not a prime example of a well thought out and properly prepared tendering policy. With hindsight, there is evidence of a degree of naivety and innocence. There are several possible reasons for this state of affairs: (1) outsourcing was fashionable in the 1990s, (2) all management attention was occupied with the separation of transport and infrastructure and (3) there was no commercial experience with outsourcing.
There appeared to be little awareness of the burden on both the client and the contractors in controlling processes and deploying advanced management instruments to make maintenance outsourcing work.
Unusual and tricky
Maintenance outsourcing is tricky because the result to be achieved is difficult to specify and measure. The output is not a tangible product but a performance measure. A complicating factor is that the average lifetime of rail infrastructure objects is more than fifty years, while a maintenance contract runs for a mere five. Another factor is that maintenance is a people business.
The craftsmanship, experience and dedication of employees are crucial determinants of the short and long term impact of maintenance. The work they do is neither spectacular nor glamorous, but the impact is considerable: ‘If you think maintenance is expensive, try an accident’.
To be in a position to outsource maintenance in a controlled, efficient and effective way, alongside an experienced and competitive market there also has to be sufficient management knowledge and experience and organisations does not automatically possess these competencies.
There was no maintenance market in the Netherlands or elsewhere in Europe in 1998. NS Railinfrabeheer and the three process contractors were by no means ready for outsourcing at that time, and even less ready for the public tendering of a performance contract.
However, from 1998 on, both parties have grown into their new roles and have worked energetically on developing missing management skills and instruments, and on setting up and managing predominantly new processes.
Contract history
ProRail started in 1998 on management by work plan and upkeep specifications. Four years later, about 2002, a clause was added to the OPC contract to facilitate and encourage partnership between the client and the contractor; the OPC+ contract was born.
There was an accompanying shift in control, based on the principle of ‘managing by quality and settlement of completed units’; a sort of management by input and output mix. The complexity of this management mix started to become clear in 2005 or 2006. There was seen to be too sharp a focus on settlement and the administrative process.
It was duly decided to base the first contract to be put out to public tender in 2006-2007 and the decision to draw up a performance based maintenance (PBM) contract was taken in 2005. The contract was based on a market analysis and a detailed model of how to structure and define management by performance. It was clear that some necessary management skills and instruments were missing, especially in the field of risk management. It also was clear that the original specification concept was still applicable.
Case Study 3 // The Netherlands
3534
Case Study 3 // The Netherlands
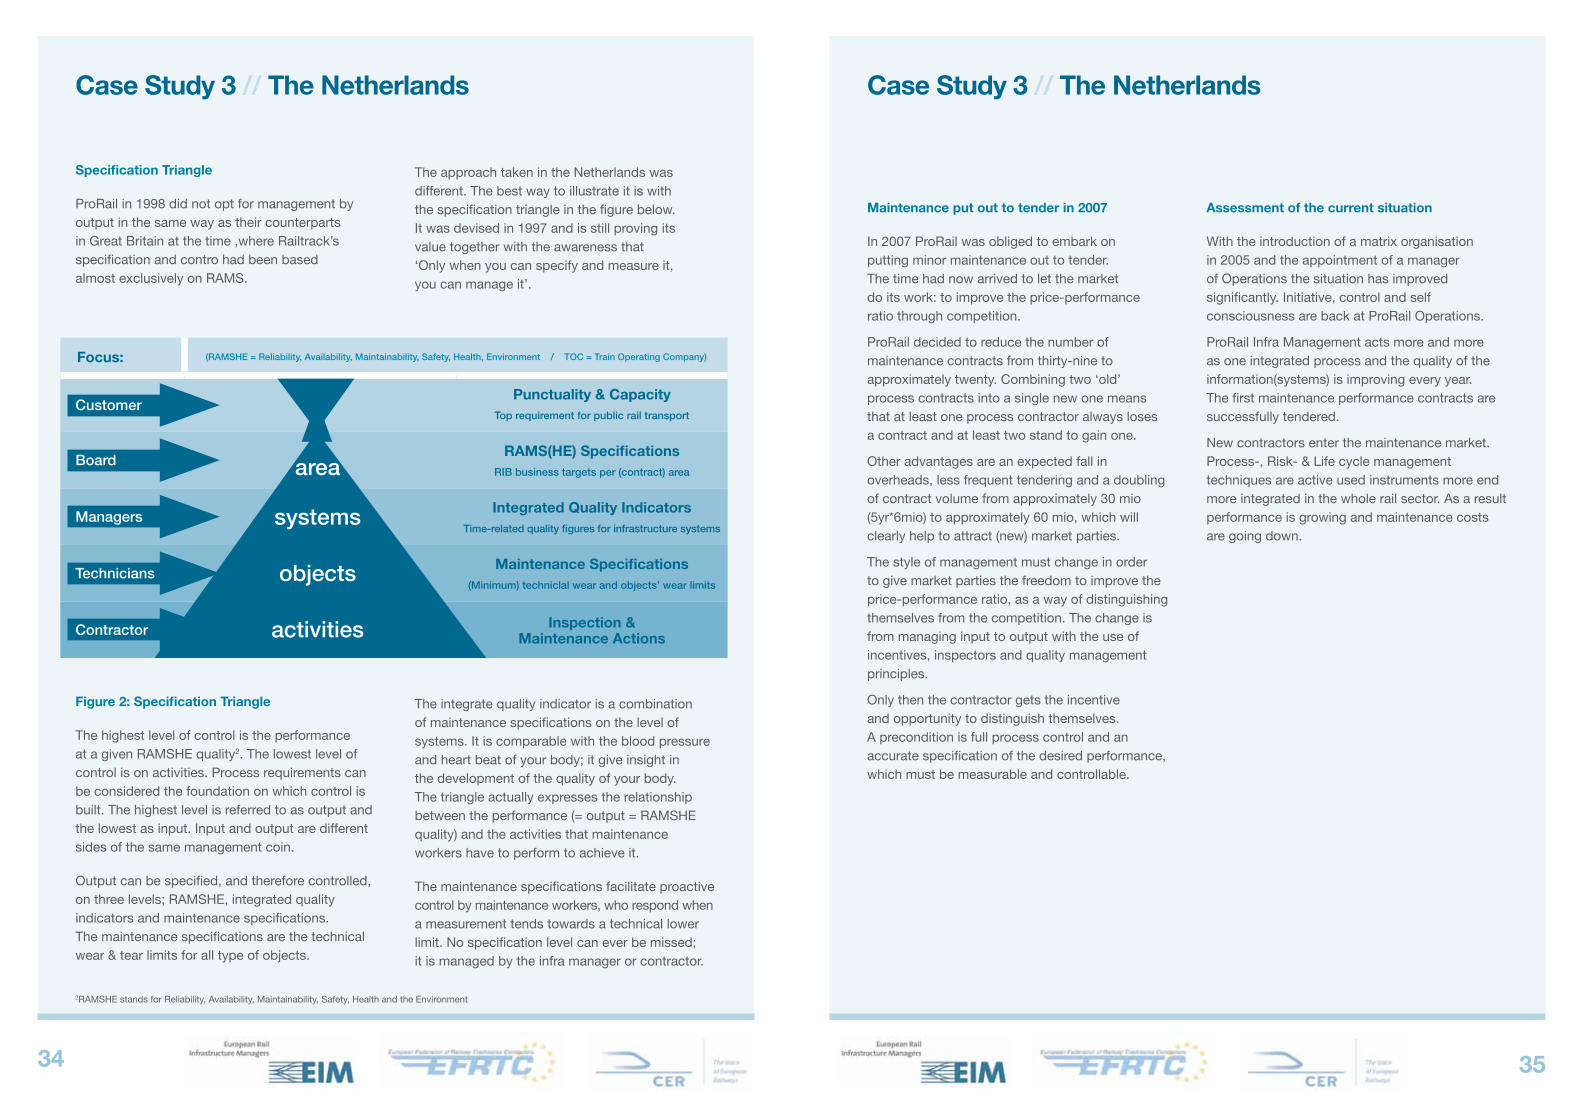
specification Triangle
ProRail in 1998 did not opt for management by output in the same way as their counterparts in Great Britain at the time ,where Railtrack’s specification and contro had been based almost exclusively on RAMS.
The approach taken in the Netherlands was different. The best way to illustrate it is with the specification triangle in the figure below. It was devised in 1997 and is still proving its value together with the awareness that ‘Only when you can specify and measure it, you can manage it’.
Figure 2: specification Triangle
The highest level of control is the performance at a given RAMSHE quality2. The lowest level of control is on activities. Process requirements can be considered the foundation on which control is built. The highest level is referred to as output and the lowest as input. Input and output are different sides of the same management coin.
Output can be specified, and therefore controlled, on three levels; RAMSHE, integrated quality indicators and maintenance specifications. The maintenance specifications are the technical wear & tear limits for all type of objects.
The integrate quality indicator is a combination of maintenance specifications on the level of systems. It is comparable with the blood pressure and heart beat of your body; it give insight in the development of the quality of your body. The triangle actually expresses the relationship between the performance (= output = RAMSHE quality) and the activities that maintenance workers have to perform to achieve it.
The maintenance specifications facilitate proactive control by maintenance workers, who respond when a measurement tends towards a technical lower limit. No specification level can ever be missed; it is managed by the infra manager or contractor.
Focus: (RAMSHE�=�Reliability,�Availability,�Maintainability,�Safety,�Health,�Environment����/����TOC�=�Train�Operating�Company)
Punctuality & CapacityTop requirement for public rail transport
RaMs(hE) specificationsRIB�business�targets�per�(contract)�area
Integrated Quality IndicatorsTime-related quality figures for infrastructure systems
Maintenance specifications(Minimum)�techniclal�wear�and�objects’�wear�limits
Inspection & Maintenance actions
area
systems
objects
activities
Customer
Board
Managers
Technicians
Contractor
2RAMSHE stands for Reliability, Availability, Maintainability, Safety, Health and the Environment
Maintenance put out to tender in 2007
In 2007 ProRail was obliged to embark on putting minor maintenance out to tender. The time had now arrived to let the market do its work: to improve the price-performance ratio through competition.
ProRail decided to reduce the number of maintenance contracts from thirty-nine to approximately twenty. Combining two ‘old’ process contracts into a single new one means that at least one process contractor always loses a contract and at least two stand to gain one.
Other advantages are an expected fall in overheads, less frequent tendering and a doubling of contract volume from approximately 30 mio (5yr*6mio) to approximately 60 mio, which will clearly help to attract (new) market parties.
The style of management must change in order to give market parties the freedom to improve the price-performance ratio, as a way of distinguishing themselves from the competition. The change is from managing input to output with the use of incentives, inspectors and quality management principles.
Only then the contractor gets the incentive and opportunity to distinguish themselves. A precondition is full process control and an accurate specification of the desired performance, which must be measurable and controllable.
assessment of the current situation
With the introduction of a matrix organisation in 2005 and the appointment of a manager of Operations the situation has improved significantly. Initiative, control and self consciousness are back at ProRail Operations.
ProRail Infra Management acts more and more as one integrated process and the quality of the information(systems) is improving every year. The first maintenance performance contracts are successfully tendered.
New contractors enter the maintenance market. Process-, Risk- & Life cycle management techniques are active used instruments more end more integrated in the whole rail sector. As a result performance is growing and maintenance costs are going down.
Case Study 3 // The Netherlands
3736
Case study 4 // switzerland
In many regards, the practices of Infrastructure Manager (IM) in Switzerland can be considered by contractors as good examples. This covers work planning and funding, the supply chain, worksite management and also contracting and procurement.
Currently, signal maintenance is done in-house by IM. For overhead power supply (‘catenary’) maintenance is contracted out, however, this is a mere provision of workforce, machinery and task responsibility remain with IM.
New construction on the other hand is entirely sourced from the market. Here projects cover the full scope, ie. roadbed and track plus signalling and power supply equipment.
This provides contractors with optimisation opportunities in planning and operational work programming.
Worksite logistics and material supply are – as a standard practice - organised in Switzerland by IM. A dedicated department for “work and construction logistics” has comprehensive and centralised responsibility and, from the contractors’ point-of-view performs remarkably well. IM does the procurement of material and gets preferable prices and conditions due to the bundling of volumes. IM also organises the material transport to the worksites including the provision of traction.
The achieved level of dependability and reliability of actual worksite provision is very high (‘hardly any failures or delays in a hundred projects’). This eliminates almost entirely the otherwise very costly effects of perturbations.
The work logistics department adheres to a very stringent planning procedure and manages the coordination between commercial train operations and work trains seamlessly. Work is planned on the basis of a rolling-forward 3-year programme. An operational work programme for 2008 for instance has been fixed and communicated in the summer of 2007. Deviations from a plan at a later stage need to be defended and authorized in front of/by the top management.
One of the key success factors for planning compliance is, that already at an early stage projects are ‘simulated’ and configured in detail on an operational level (e.g. regarding track-possessions). This avoids costly surprises and makes the preparation of work execution far more efficient. For the various types of maintenance and renewal work, IM and contractors use a very limited set of well defined standard-processes, which again makes sure that ‘boundary conditions’ of project execution are clear and staff is familiar with them. This provides learning-curve effects.
By using these well defined standard-modules, IM and contractors create a ‘virtuous circle’ which is success-critical for the ‘clockwork’ process of track-interventions. Standard practices make efficient use of track possessions and enable a high degree of compliance with time windows, which keeps perturbations out of commercial train operations. The logistics and transport function on the other hand is then capable (and complies with) to deliver logistics services to the worksite on-time – a pre-requisite again for efficient project execution.
IM ‘work logistics’ and contractors hold regular meetings in a constructive, open-minded fashion, where recent experience and improvements are discussed systematically.
Case Study 4 // Switzerland
Regarding procurement of contractor services, IM has more recently moved towards 5-year contracts. Whilst the scope was previously limited to heavy plant and crews, ancillary and smaller scale work is now also sourced from the contractors. Contractors are now in a better position to integrate and optimise different tasks, which has already generated benefits. Two key functions remain with Railway Undertaking and – as far as the interview-partner is concerned – are allocated there most effectively; these are ‘safety’ and ‘transport’ (ie. material and equipment).
The 5-year contract is of a framework-type, which is eminently important in order to reconcile formal procurement rules (‘no interference during the bidding process’) with the economic necessities to discuss and jointly optimise processes at an operational planning stage. As a matter of fact these discussions do take place very intensively, once a framework-contract has been awarded.
In terms of pricing and contractors’ compensation the more recent contracts make a distinction of two equipment categories:
• Category 1 uses ‘annual volume’ agreements, which in effect cover fixed costs of equipment plus a variable fee per shift delivered; 90 % of work falls into this category.
• Category 2 applies for peak resources and is compensated by variable fees per shift. This includes cases, where a buffer is needed in category 1 as a production reserve.
• Some remarks were made as contrasts of this planning and contracting philosophy with some neighbouring countries using semi-annual tendering processes where typically awarded work has to be commenced immediately and similar practice, where work then has to start virtually ‘over night’.
Functions, under-utilised and peak-load driven plant requirements and inevitable process-perturbations drive substantive waste and inefficiencies into such a system.
Out of contractor’s experience, a centralised, well-coordinated and thorough planning/work programming is a ‘must’ for good practice infrastructure asset management.
Regarding quality monitoring of work execution the IM’s practice is twofold. For track geometry etc., where measurements are well-defined, contractors have to demonstrate themselves to IM that requirements are met, verifications by IM are only done in a sampling approach.
Other countries sometimes still have a costly practice where the infrastructure manager sends entire groups of his own people to the worksite to do oversight. This is inefficient.
Where IM needs to do more testing and verification, is track foundations and sub grade, because quality is less obvious to determine; this also is done in a sampling approach.
With the new contracts in place the contractor was able to launch substantial innovation, it has never before invested as much into cost-efficiency improvements and/or output enhancement. Innovation for instance regarding other equipment combinations has helped the contractor a great deal to increase their own competitiveness. In a situation where for example one piece of equipment can substitute what three pieces have done previously, there are also positive side effects for the client, like less need for track possessions and a reduction in safety and worksite protection staff requirements.
3938
Case Study 4 // Switzerland
Very interestingly, the contractor has, against some resistance but ultimately successfully lobbied the IM, so that in the evaluation of bids for work, ‘opportunity costs’ for the client are measured and integrated into the decision-making. In terms of good supply-chain management, this is to be considered a major achievement – still an area of vital discontent in other countries.
The contractor is of the opinion that ‘ignorance’ of these aspects he observed in some countries (and aggravated by National Railway Authority) could have ‘catastrophic’ impact on cost efficiency of track maintenance and renewal.
Case study 5 // United Kingdom
a balanced scorecard to assess performance of track renewals
In December 2006 Network Rail announced its intention to reduce the number of framework track contractors it employed on renewals from 6 to 4. A key factor in this decision was a substantial increasing volume of automated “high output” delivery.
The 6 suppliers were advised that they would be measured against a number of key criteria for a period of six months. The areas covered by the assessment were:
• Safety records
• Work volumes delivered (km plain line & Switch & Crossing units)
• “On time” completion of jobs
• Unit costs
• Business behaviours
Network Rail developed 19 key performance indicators and used a balanced scorecard to inform their assessment. These scorecards were used to produce league tables for overall performance and also each of the 5 areas listed above.
In September 2007 Network Rail confirmed the results of their assessment and the 4 successful suppliers. The scorecards were critical to equitable selection of the final suppliers.
Since 2007 Network Rail has continued to use the balanced scorecard to measure the performance of its track contractors and regional teams.
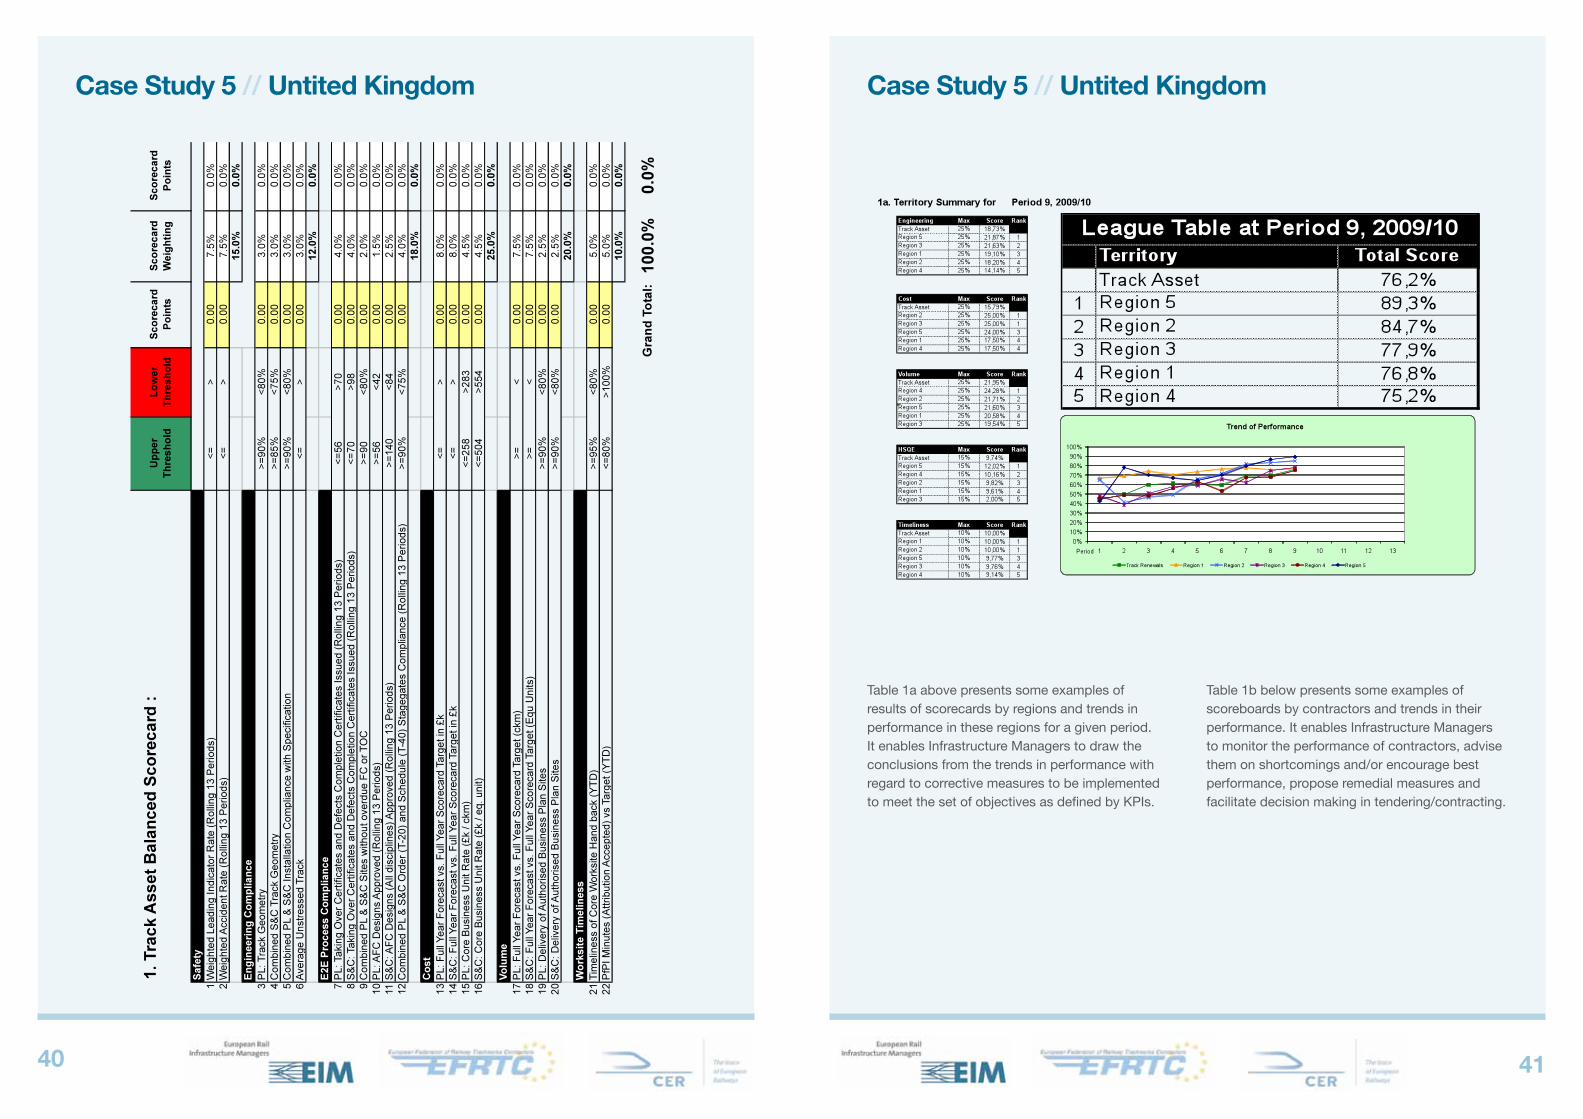
The latest version of the scorecard, below, now includes 22 KPIs split between:
• Safety
• Engineering Compliance
• End to End (E2E) Process Compliance - “On time” delivery
• Cost
• Volume
• Worksite Timeliness (Disruption measures)
4140
Case Study 5 // Untited Kingdom
Case Study 5 // Untited Kingdom
Table 1a above presents some examples of results of scorecards by regions and trends in performance in these regions for a given period. It enables Infrastructure Managers to draw the conclusions from the trends in performance with regard to corrective measures to be implemented to meet the set of objectives as defined by KPIs.
Table 1b below presents some examples of scoreboards by contractors and trends in their performance. It enables Infrastructure Managers to monitor the performance of contractors, advise them on shortcomings and/or encourage best performance, propose remedial measures and facilitate decision making in tendering/contracting.
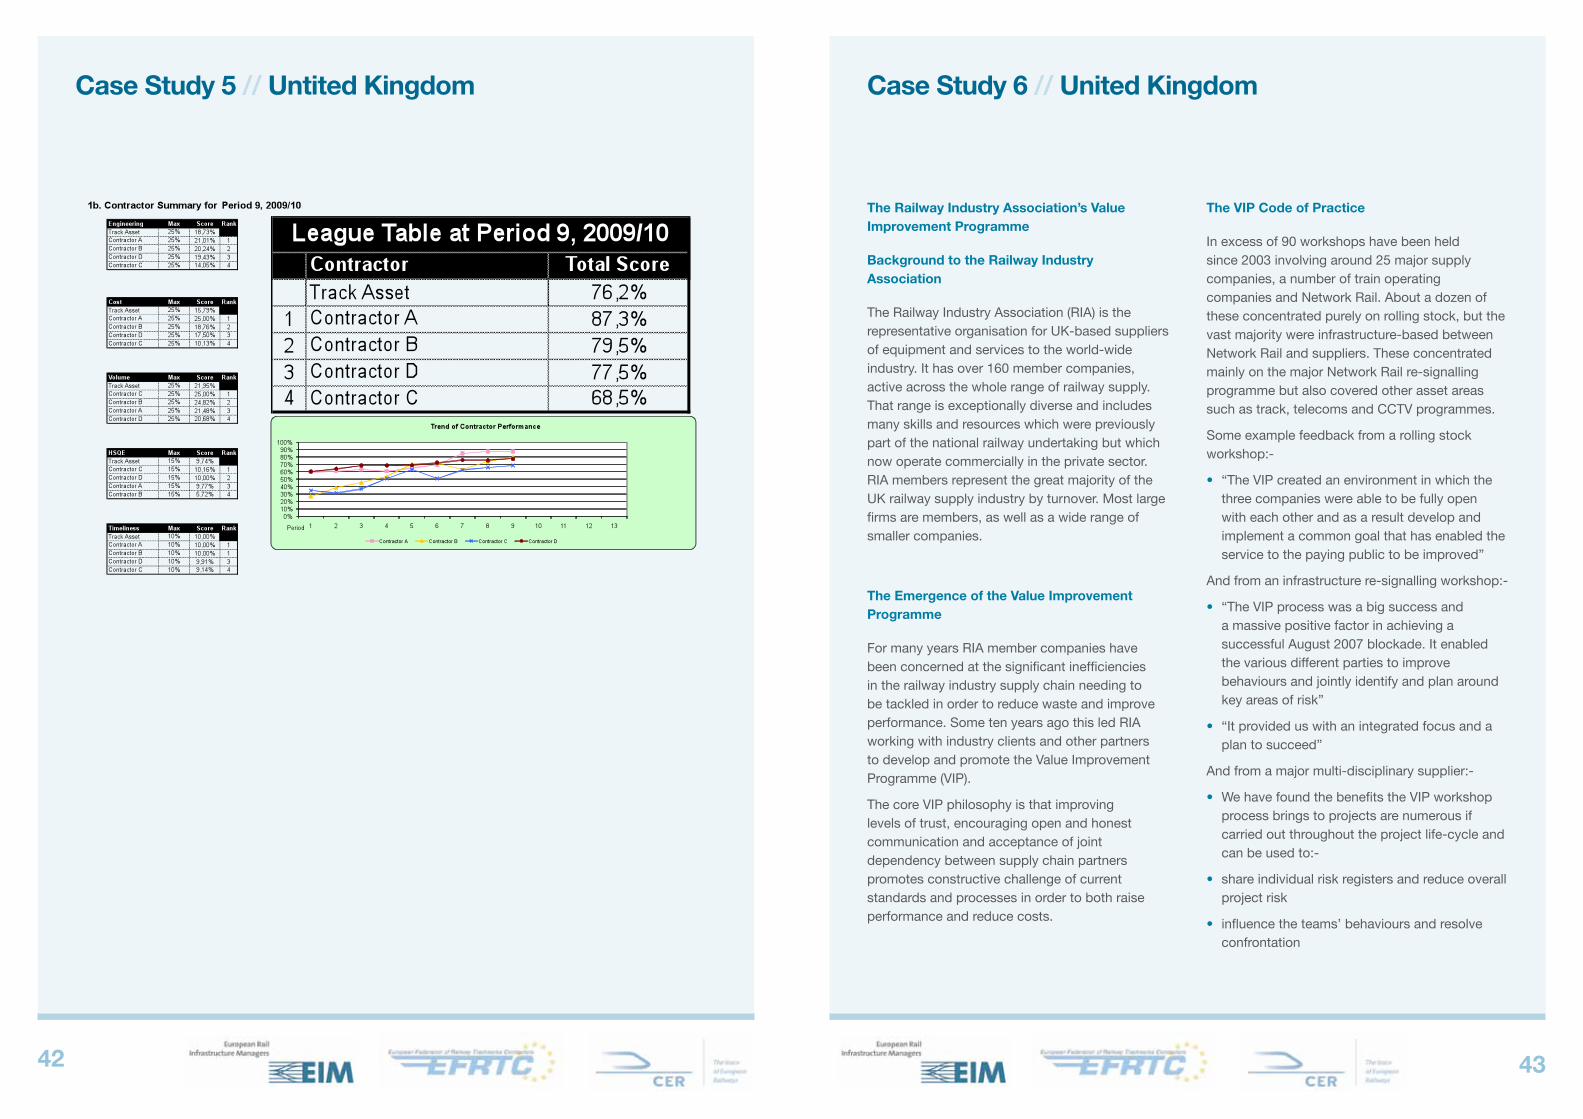
4342
Case Study 5 // Untited Kingdom
Case study 6 // United Kingdom
The Railway Industry association’s Value Improvement Programme
Background to the Railway Industry association
The Railway Industry Association (RIA) is the representative organisation for UK-based suppliers of equipment and services to the world-wide industry. It has over 160 member companies, active across the whole range of railway supply. That range is exceptionally diverse and includes many skills and resources which were previously part of the national railway undertaking but which now operate commercially in the private sector. RIA members represent the great majority of the UK railway supply industry by turnover. Most large firms are members, as well as a wide range of smaller companies.
The Emergence of the Value Improvement Programme
For many years RIA member companies have been concerned at the significant inefficiencies in the railway industry supply chain needing to be tackled in order to reduce waste and improve performance. Some ten years ago this led RIA working with industry clients and other partners to develop and promote the Value Improvement Programme (VIP).
The core VIP philosophy is that improving levels of trust, encouraging open and honest communication and acceptance of joint dependency between supply chain partners promotes constructive challenge of current standards and processes in order to both raise performance and reduce costs.
The VIP Code of Practice
In excess of 90 workshops have been held since 2003 involving around 25 major supply companies, a number of train operating companies and Network Rail. About a dozen of these concentrated purely on rolling stock, but the vast majority were infrastructure-based between Network Rail and suppliers. These concentrated mainly on the major Network Rail re-signalling programme but also covered other asset areas such as track, telecoms and CCTV programmes.
Some example feedback from a rolling stock workshop:-
• “The VIP created an environment in which the three companies were able to be fully open with each other and as a result develop and implement a common goal that has enabled the service to the paying public to be improved”
And from an infrastructure re-signalling workshop:-
• “The VIP process was a big success and a massive positive factor in achieving a successful August 2007 blockade. It enabled the various different parties to improve behaviours and jointly identify and plan around key areas of risk”
• “It provided us with an integrated focus and a plan to succeed”
And from a major multi-disciplinary supplier:-
• We have found the benefits the VIP workshop process brings to projects are numerous if carried out throughout the project life-cycle and can be used to:-
• share individual risk registers and reduce overall project risk
• influence the teams’ behaviours and resolve confrontation
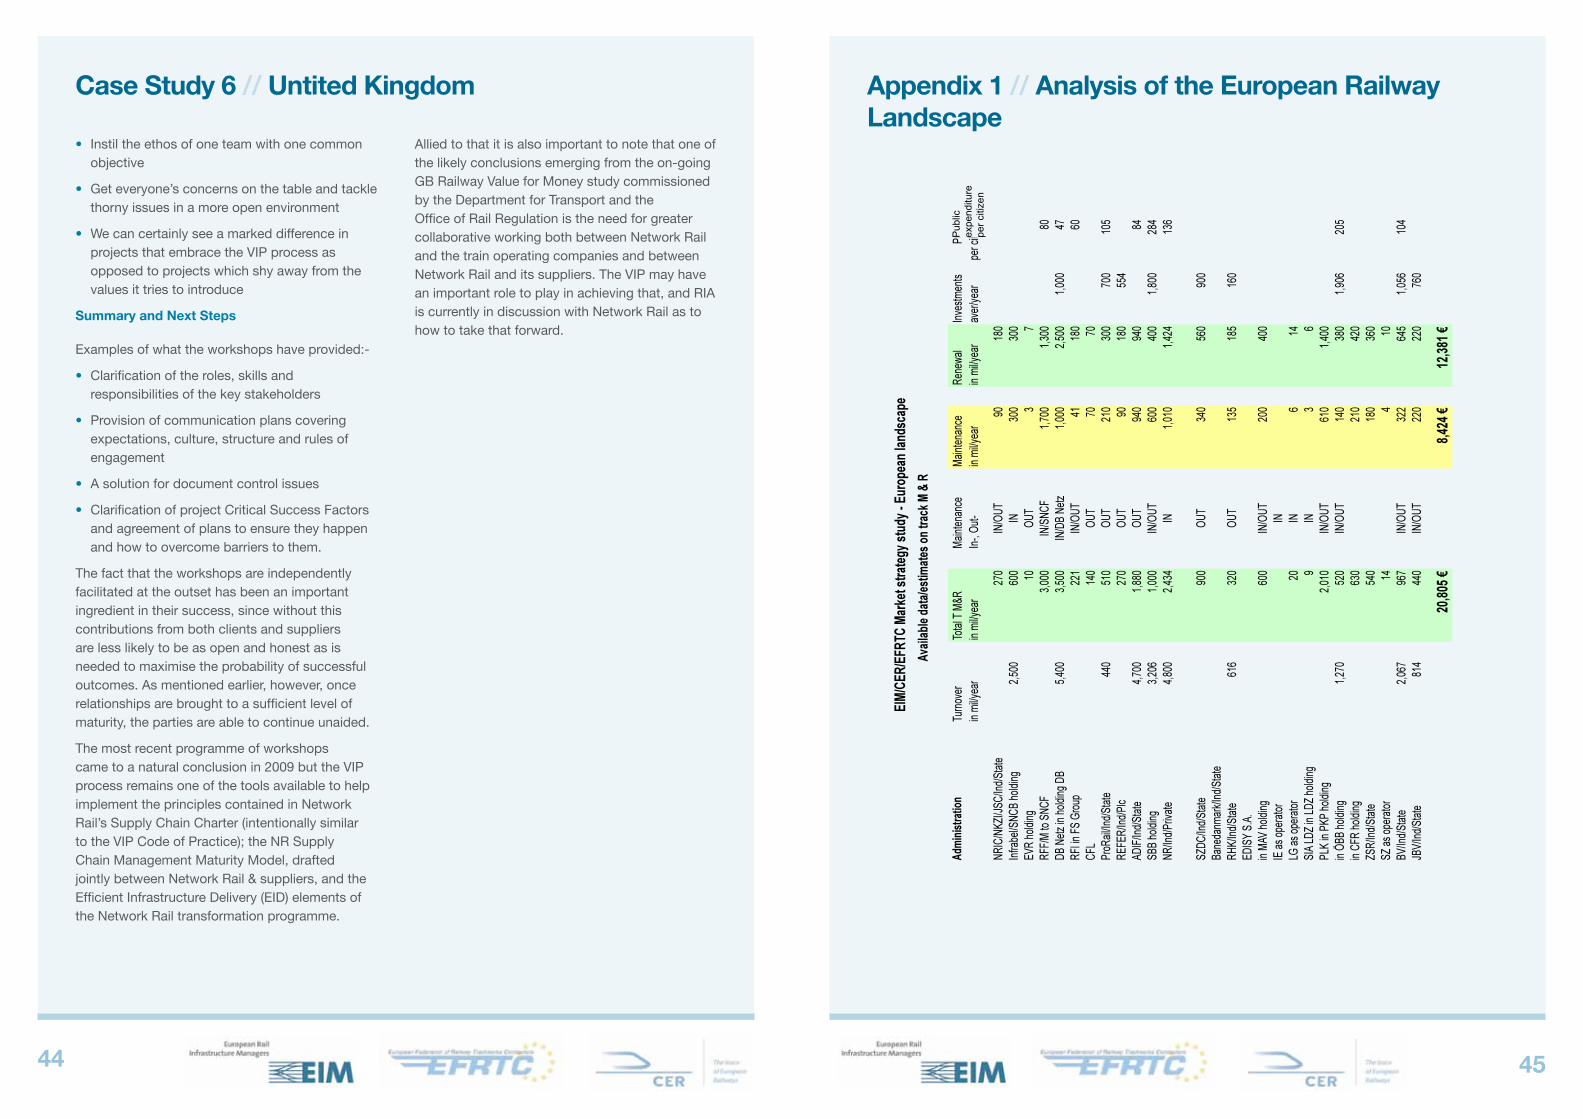
4544
• Instil the ethos of one team with one common objective
• Get everyone’s concerns on the table and tackle thorny issues in a more open environment
• We can certainly see a marked difference in projects that embrace the VIP process as opposed to projects which shy away from the values it tries to introduce
summary and next steps
Examples of what the workshops have provided:-
• Clarification of the roles, skills and responsibilities of the key stakeholders
• Provision of communication plans covering expectations, culture, structure and rules of engagement
• A solution for document control issues
• Clarification of project Critical Success Factors and agreement of plans to ensure they happen and how to overcome barriers to them.
The fact that the workshops are independently facilitated at the outset has been an important ingredient in their success, since without this contributions from both clients and suppliers are less likely to be as open and honest as is needed to maximise the probability of successful outcomes. As mentioned earlier, however, once relationships are brought to a sufficient level of maturity, the parties are able to continue unaided.
The most recent programme of workshops came to a natural conclusion in 2009 but the VIP process remains one of the tools available to help implement the principles contained in Network Rail’s Supply Chain Charter (intentionally similar to the VIP Code of Practice); the NR Supply Chain Management Maturity Model, drafted jointly between Network Rail & suppliers, and the Efficient Infrastructure Delivery (EID) elements of the Network Rail transformation programme.
Allied to that it is also important to note that one of the likely conclusions emerging from the on-going GB Railway Value for Money study commissioned by the Department for Transport and the Office of Rail Regulation is the need for greater collaborative working both between Network Rail and the train operating companies and between Network Rail and its suppliers. The VIP may have an important role to play in achieving that, and RIA is currently in discussion with Network Rail as to how to take that forward.
Case Study 6 // Untited Kingdom
appendix 1 // analysis of the European Railway landscape
Pub
lic
expe
nditu
re
per c
itize
n

4746
Appendix 1
Den
mar
k
Gre
ece
Irla
nd
DRAFT
APPENDIX 2
Value-‐adding behaviours questionnaire
Value Adding Behaviours
Please state whether you agree or disagree that the following behaviours add value. If you only partly agree, please include a comment stating to what extent you agree and on what particular aspect you disagree.
Agree
Partly agree
Disagree
Openness on the work scheduled to be done over the medium-term (five years)
This includes regular updates on changes to the scope of the work in an open and timely manner.
Comments:
Clarity and simplicity of technical, legislative and safety standards required to be met in delivering the work
Long product acceptance procedures and complex design and testing standards create inefficiency
Comments:
Long term partnerships between client and contractor
Value is added through openness and trust established over time. However, where competition in the market is strong, partnerships do not always represent the best value for the client
Comments:
Single point of contact with contractors
Good examples of such would be ‘Hub And Spoke’ type models
Comments:
Development of industry wide training schemes that contractors are able to get involved in if they wish
Encourage the perception of “one team” and help remove the “them and us” philosophy
Comments:
appendix 2
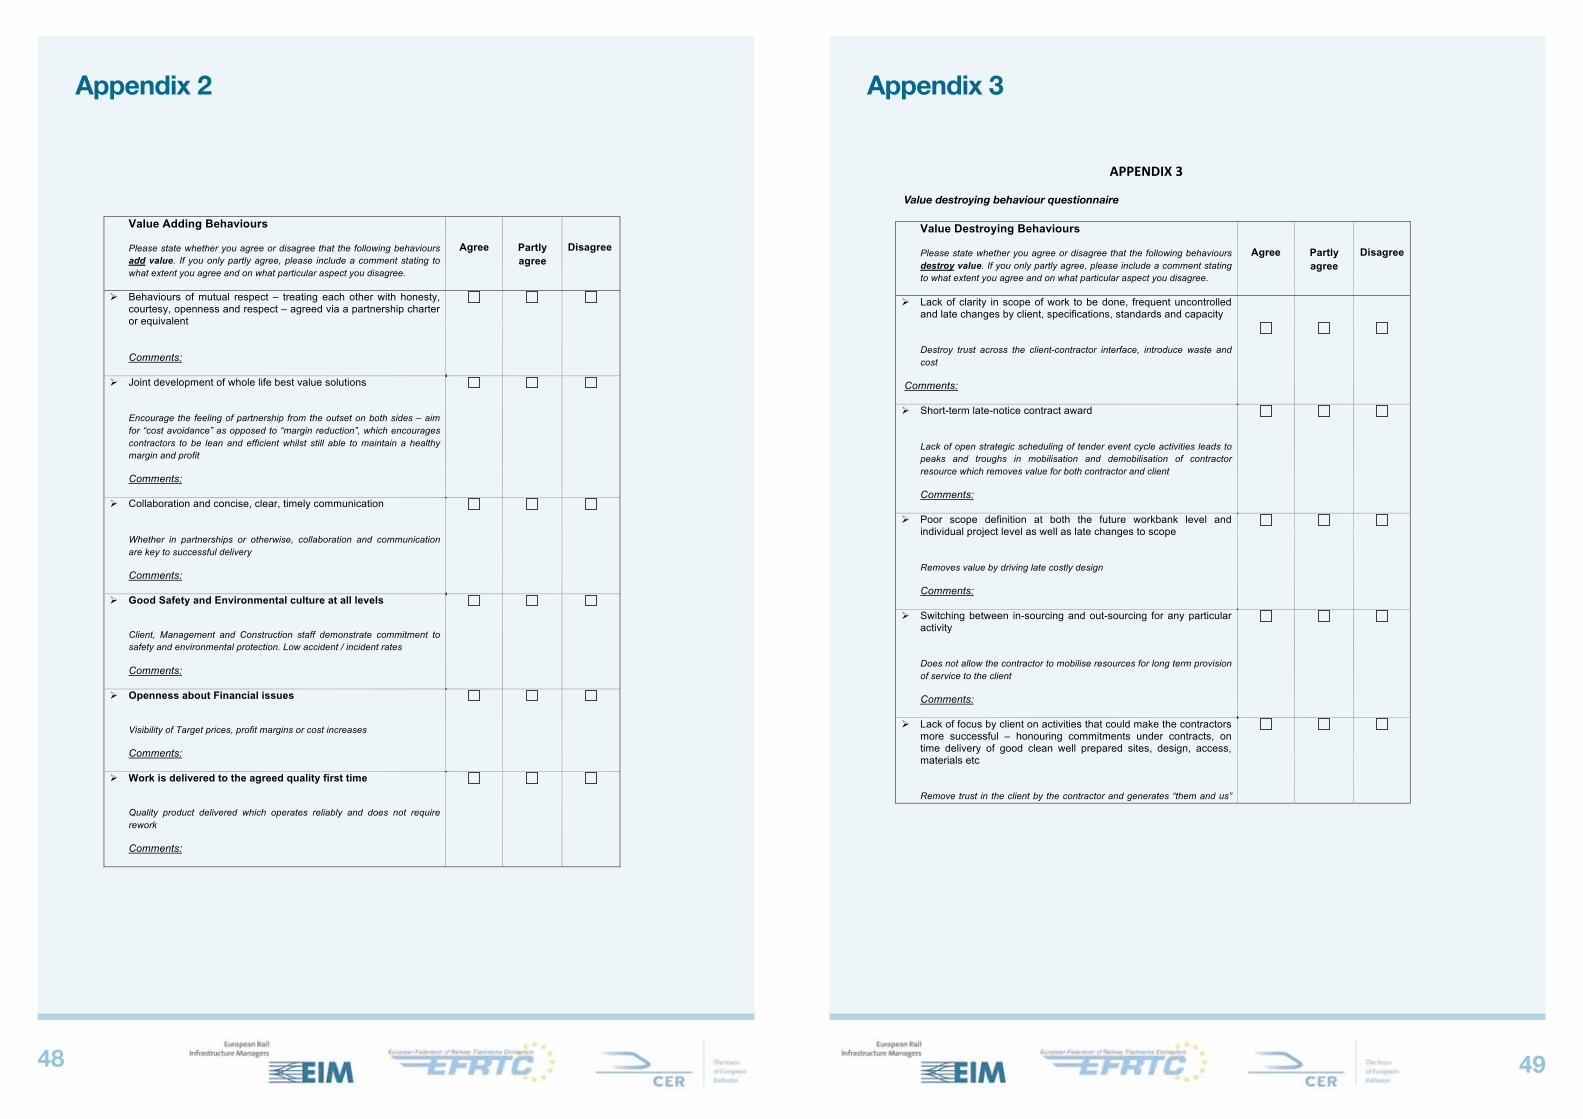
4948
DRAFT
Value Adding Behaviours
Please state whether you agree or disagree that the following behaviours add value. If you only partly agree, please include a comment stating to what extent you agree and on what particular aspect you disagree.
Agree
Partly agree
Disagree
Behaviours of mutual respect – treating each other with honesty, courtesy, openness and respect – agreed via a partnership charter or equivalent
Comments:
Joint development of whole life best value solutions
Encourage the feeling of partnership from the outset on both sides – aim for “cost avoidance” as opposed to “margin reduction”, which encourages contractors to be lean and efficient whilst still able to maintain a healthy margin and profit
Comments:
Collaboration and concise, clear, timely communication
Whether in partnerships or otherwise, collaboration and communication are key to successful delivery
Comments:
Good Safety and Environmental culture at all levels
Client, Management and Construction staff demonstrate commitment to safety and environmental protection. Low accident / incident rates
Comments:
Openness about Financial issues
Visibility of Target prices, profit margins or cost increases
Comments:
Work is delivered to the agreed quality first time
Quality product delivered which operates reliably and does not require rework
Comments:
Appendix 2
DRAFT
APPENDIX 3
Value-‐destroying behaviourquestionnaire
Value Destroying Behaviours
Please state whether you agree or disagree that the following behaviours destroy value. If you only partly agree, please include a comment stating to what extent you agree and on what particular aspect you disagree.
Agree
Partly agree
Disagree
Lack of clarity in scope of work to be done, frequent uncontrolled and late changes by client, specifications, standards and capacity
Destroy trust across the client-contractor interface, introduce waste and cost
Comments:
Short-term late-notice contract award
Lack of open strategic scheduling of tender event cycle activities leads to peaks and troughs in mobilisation and demobilisation of contractor resource which removes value for both contractor and client
Comments:
Poor scope definition at both the future workbank level and individual project level as well as late changes to scope
Removes value by driving late costly design
Comments:
Switching between in-sourcing and out-sourcing for any particular activity
Does not allow the contractor to mobilise resources for long term provision of service to the client
Comments:
Lack of focus by client on activities that could make the contractors more successful – honouring commitments under contracts, on time delivery of good clean well prepared sites, design, access, materials etc
Remove trust in the client by the contractor and generates “them and us”
Appendix 3
Value destroying behaviour questionnaire
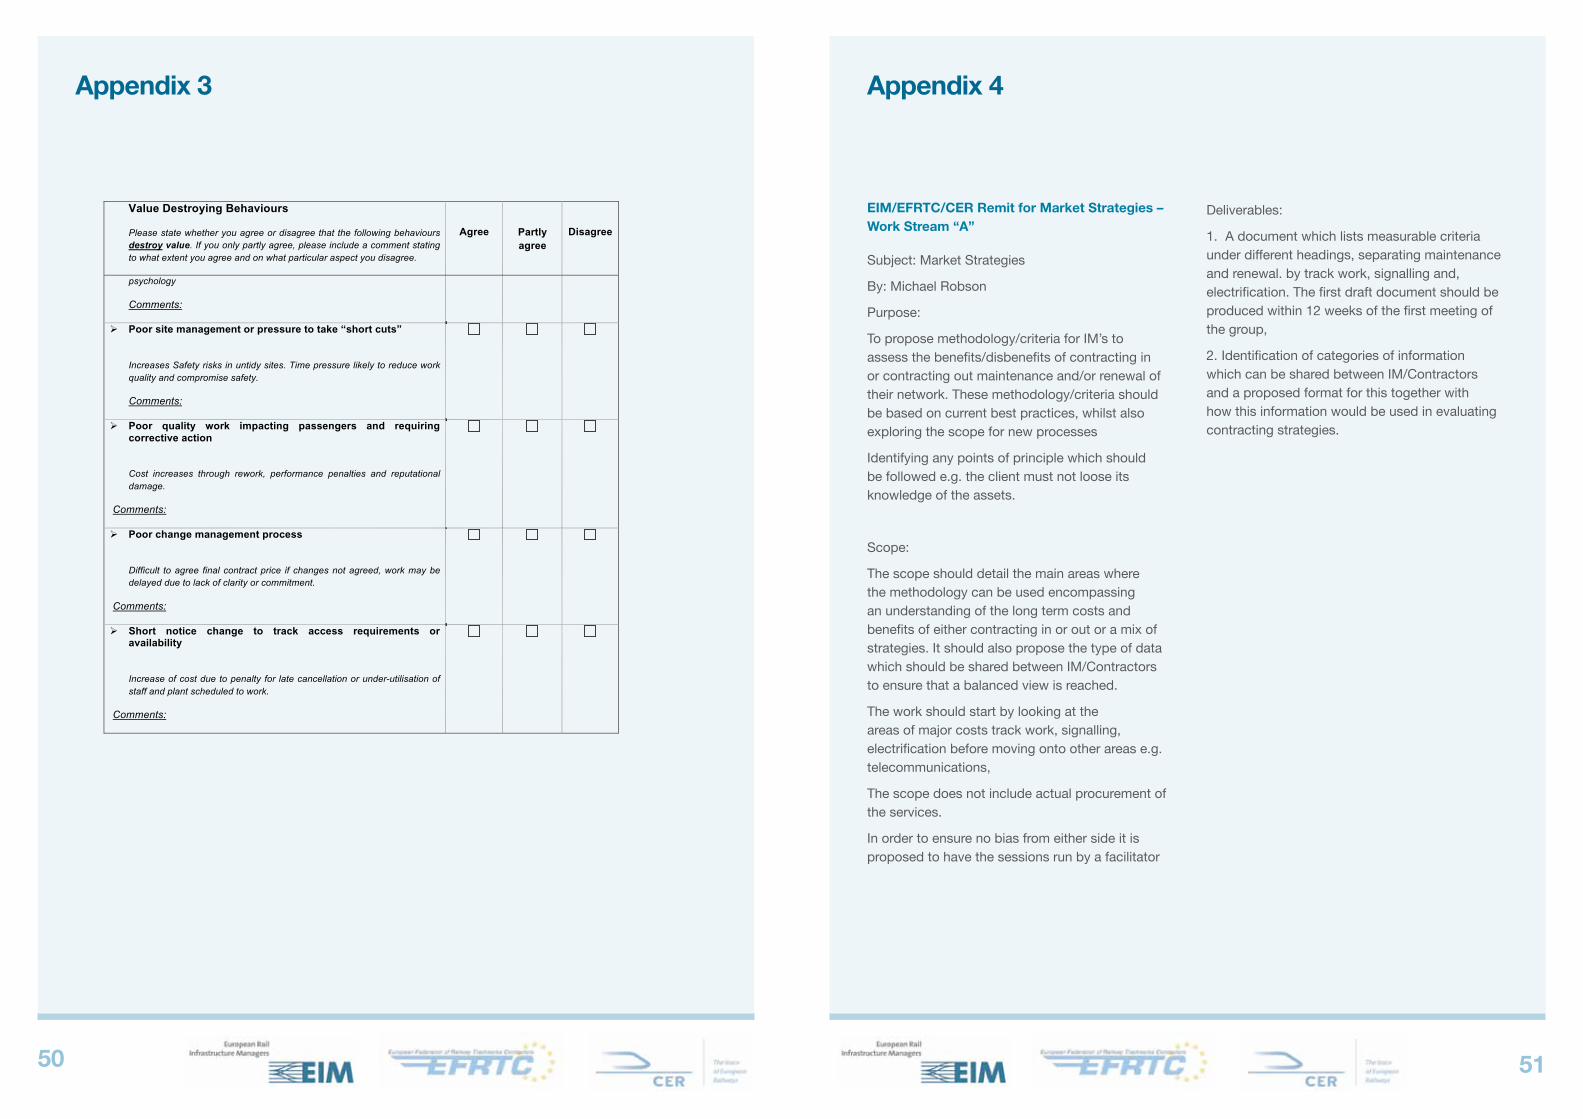
5150
DRAFT
Value Destroying Behaviours
Please state whether you agree or disagree that the following behaviours destroy value. If you only partly agree, please include a comment stating to what extent you agree and on what particular aspect you disagree.
Agree
Partly agree
Disagree
psychology
Comments:
Poor site management or pressure to take “short cuts”
Increases Safety risks in untidy sites. Time pressure likely to reduce work quality and compromise safety.
Comments:
Poor quality work impacting passengers and requiring corrective action
Cost increases through rework, performance penalties and reputational damage.
Comments:
Poor change management process
Difficult to agree final contract price if changes not agreed, work may be delayed due to lack of clarity or commitment.
Comments:
Short notice change to track access requirements or availability
Increase of cost due to penalty for late cancellation or under-utilisation of staff and plant scheduled to work.
Comments:
Appendix 3 appendix 4
EIM/EFRTC/CER Remit for Market strategies – work stream “a”
Subject: Market Strategies
By: Michael Robson
Purpose:
To propose methodology/criteria for IM’s to assess the benefits/disbenefits of contracting in or contracting out maintenance and/or renewal of their network. These methodology/criteria should be based on current best practices, whilst also exploring the scope for new processes
Identifying any points of principle which should be followed e.g. the client must not loose its knowledge of the assets.
Scope:
The scope should detail the main areas where the methodology can be used encompassing an understanding of the long term costs and benefits of either contracting in or out or a mix of strategies. It should also propose the type of data which should be shared between IM/Contractors to ensure that a balanced view is reached.
The work should start by looking at the areas of major costs track work, signalling, electrification before moving onto other areas e.g. telecommunications,
The scope does not include actual procurement of the services.
In order to ensure no bias from either side it is proposed to have the sessions run by a facilitator
Deliverables:
1. A document which lists measurable criteria under different headings, separating maintenance and renewal. by track work, signalling and, electrification. The first draft document should be produced within 12 weeks of the first meeting of the group,
2. Identification of categories of information which can be shared between IM/Contractors and a proposed format for this together with how this information would be used in evaluating contracting strategies.
5352