Tracing Sources and Biogeochemical Cycling of NH4 and · PDF file19.08.2009 ·...
38
Tracing Sources and Biogeochemical Cycling of NH4 and NO3 in the Sacramento River, Delta, and Northern Bay using Stable Isotope Techniques Carol Kendall, Megan Young, Steve Silva and Tamara Kraus (USGS) Alex Parker and Dick Dugdale (SFSU) Marianne Guerin (RMA)
Tracing Sources and Biogeochemical Cycling of NH4 and · PDF file19.08.2009 · Animations were removed and some additional slides were added for improved explanation of isotope terminology
Tracing Sources and Biogeochemical Cycling of NH4 and NO3 in the Sacramento River, Delta, and
Northern Bay using Stable Isotope Techniques
Carol Kendall, Megan Young, Steve Silva and Tamara Kraus(USGS)
Alex Parker and Dick Dugdale(SFSU)
Marianne Guerin(RMA)
This file contains an updated version of the presentation made on August 19, 2009 at the CA Waterboards-sponsored NH4 Summit meeting in Rancho Cordova, CA.Animations were removed and some additional slides were added for improved explanation of isotope terminology and fundamentals.
This PDF file includes the “speaker notes” that were added to the original Powerpoint
file, and then saved during the pdf
conversion. Click on the comment boxes in upper left of most slides. This feature can be toggled off and on.
Presenter
Presentation Notes
NOTE: The USGS data on these slides are unpublished. Hence, all the data and interpretations should be viewed as preliminary until peer-reviewed..
Isotope Terminology
( )( ) 10001
N/NN/N
AIR1415
sample1415
×⎥⎥⎦
⎤
⎢⎢⎣
⎡−⎟
⎟⎠
⎞⎜⎜⎝
⎛
( )( ) 10001
O/OO/O
VSMOW1618
sample1618
×⎥⎥⎦
⎤
⎢⎢⎣
⎡−⎟⎟⎠
⎞⎜⎜⎝
⎛
δ15N =
δ18O =
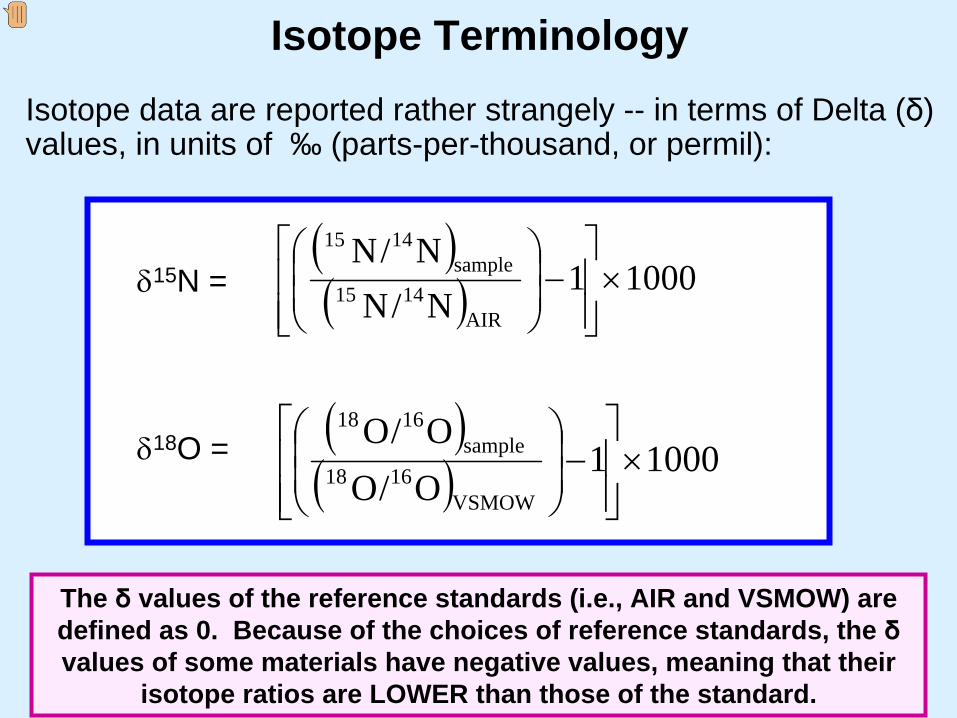
Isotope data are reported rather strangely --
in terms of Delta (δ) values, in units of ‰ (parts-per-thousand, or permil):
The δ
values of the reference standards (i.e., AIR and VSMOW) are defined as 0. Because of the choices of reference standards, the δ
values of some materials have negative values, meaning that their isotope ratios are LOWER than those of the standard.
Presenter
Presentation Notes
But don’t get side-tracked with this weird terminology (which is an historical artifact) and just treat the terms as “isotope” concentration units, not too different from ppm.
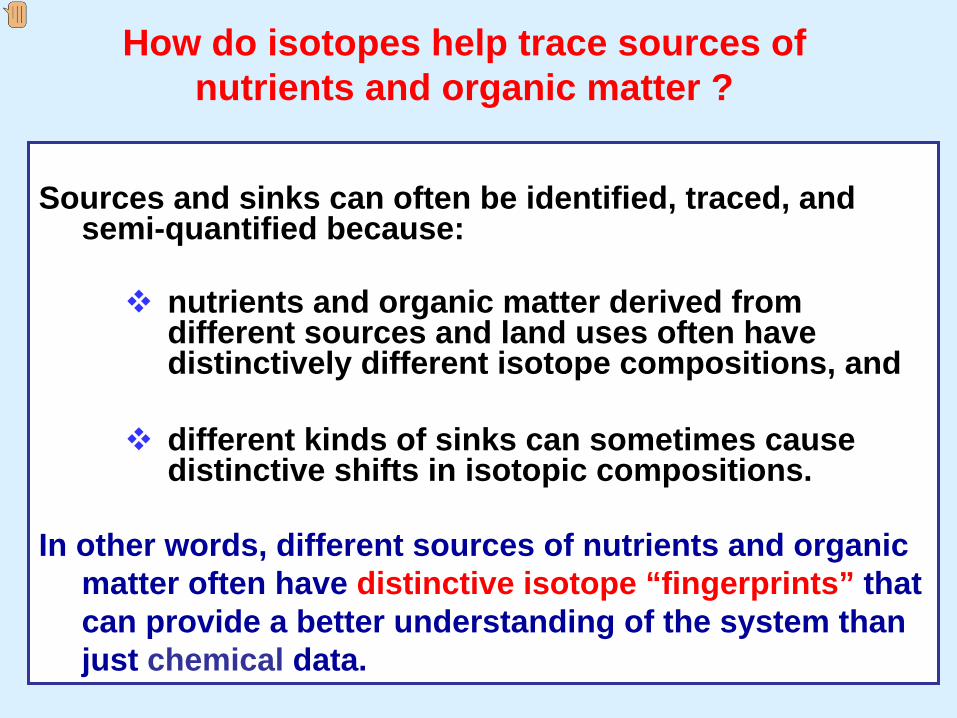
Sources and sinks can often be identified, traced, and semi-quantified because:
nutrients and organic matter derived from different sources and land uses often have distinctively different isotope compositions, and
different kinds of sinks can sometimes cause distinctive shifts in isotopic compositions.
In other words, different sources of nutrients and organic matter often have distinctive isotope “fingerprints”
that
can provide a better understanding of the system than just chemical
data.
How do isotopes help trace sources of nutrients and organic matter ?
Presenter
Presentation Notes
This is the reason scientists have used stable isotope measurements for environmental studies for ~50 years: isotopes are useful tools for many kinds of studies. The more isotopes and other tracers measured, the more constraints you have on your models and interpretation. The next slide shows how different sources of NO3 often have distinctive d15N and d18O values.
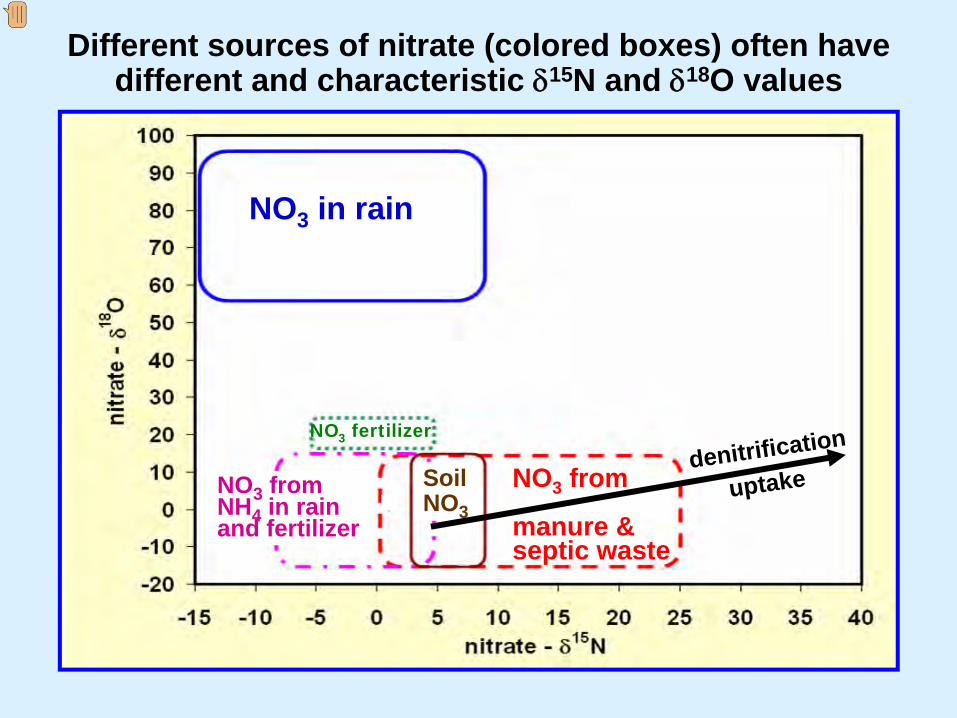
Different sources of nitrate (colored boxes) often have different and characteristic δ15N and δ18O values
NO3
in rain
manure & septic waste
Soil NO3
NO3
from NH4
in rain and fertilizer
NO3 fertilizer
NO3
fromdenitrification
uptake
Presenter
Presentation Notes
If the measured nitrate isotope values plot within a box on this plot, then this is a very likely source of the nitrate (assuming minimal N-cycling). Intermediate values represent mixtures. This schematic applies best to groundwater and river samples, and needs to be modified when dealing with a marine end-member, as we have in the SFB and Delta. The black arrow shows how d15N and d18O values increase during progressive denitrification and uptake. If there is significant N cycling (e.g., denitrification or uptake), the d15N and d18O values of remaining nitrate can be significantly altered (increased along the line), making source determination more complicated.
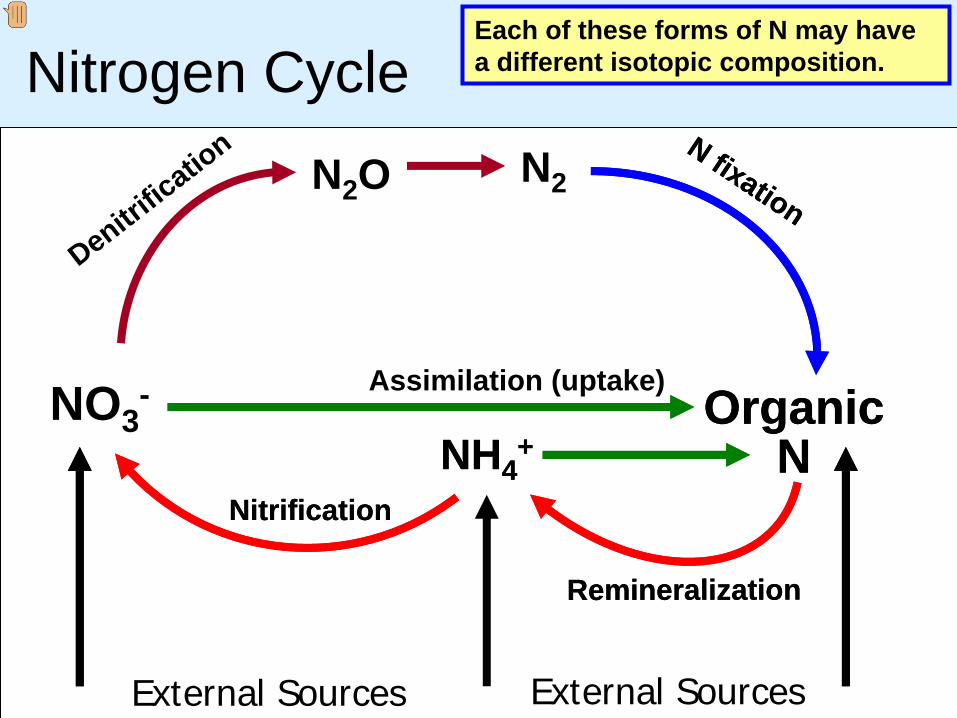
Nitrogen CycleDen
itrific
ation
Each of these forms of N may have a different isotopic composition.
Assimilation (uptake)Organic
NNitrification
NO3-
Remineralization
NH4+
N fixation
External Sources
N2N2
O
Denitrific
ation
External Sources
Organic N
Nitrification
Remineralization
NH4+
N fixation
Presenter
Presentation Notes
Each transformation of the different forms of N involves an isotope fractionation, meaning a change in the d15N value of each material. For example, when NH4 is nitrified to NO3, the newly formed NO3 has a lower d15N than the residual NH4. The difference in the d15N value between source and product is called the isotope fractionation and is denoted as “ε” (epsilon). Thus, if the difference in d15N values between the source and product is 20‰, this is equivalent to ε =20‰.
Incr
easi
ng δ
15N
NH4
NO3
NH4 Algae
NH4
Algae
NO3
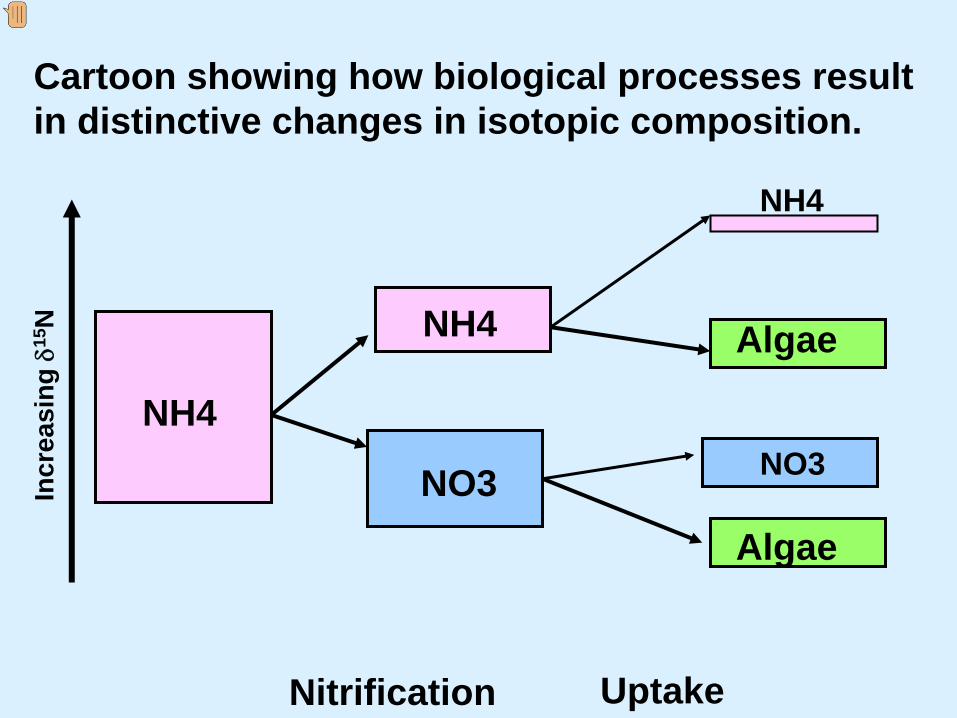
Cartoon showing how biological processes result in distinctive changes in isotopic composition.
Nitrification Uptake
Presenter
Presentation Notes
This cartoon shows how various amounts of nitrification and uptake can cause a wide range of isotope values of the resulting NH4, NO3, and algae. The sizes of the boxes reflect the relative amount of N, and the relative positions of boxes reflect their relative d15N values. The main principle is that biogeochemical processes preferentially utilize more of the lower-mass isotopes (e.g., 14N instead of 15N), resulting in “isotope fractionation” that gives new products lower d15N values than the starting compositions and residual substrates higher d15N values.
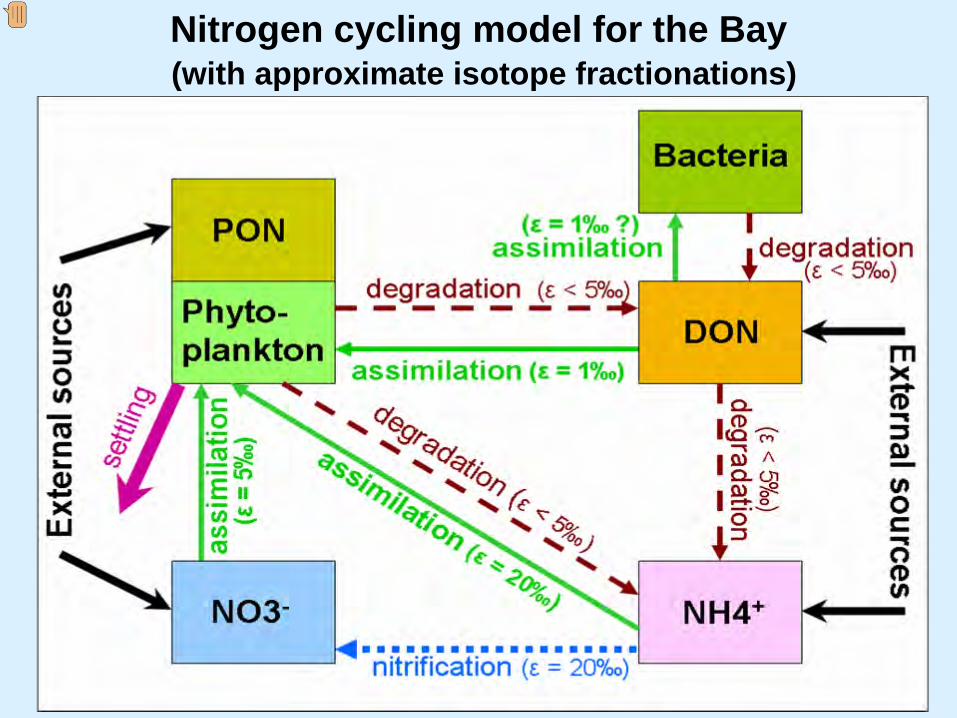
Nitrogen cycling model for the Bay(with approximate isotope fractionations)
Presenter
Presentation Notes
This is an example of the kind of sophisticated N cycling model we plan to develop with our isotope dataset. Measurement of isotopic compositions of “field samples” provides a way to determine the ACTUAL reaction rates in the water column, and are a useful complement to the kind of 15N-spiked experiments in carboys that the Dugdale-Parker group are doing to measure uptake rates.
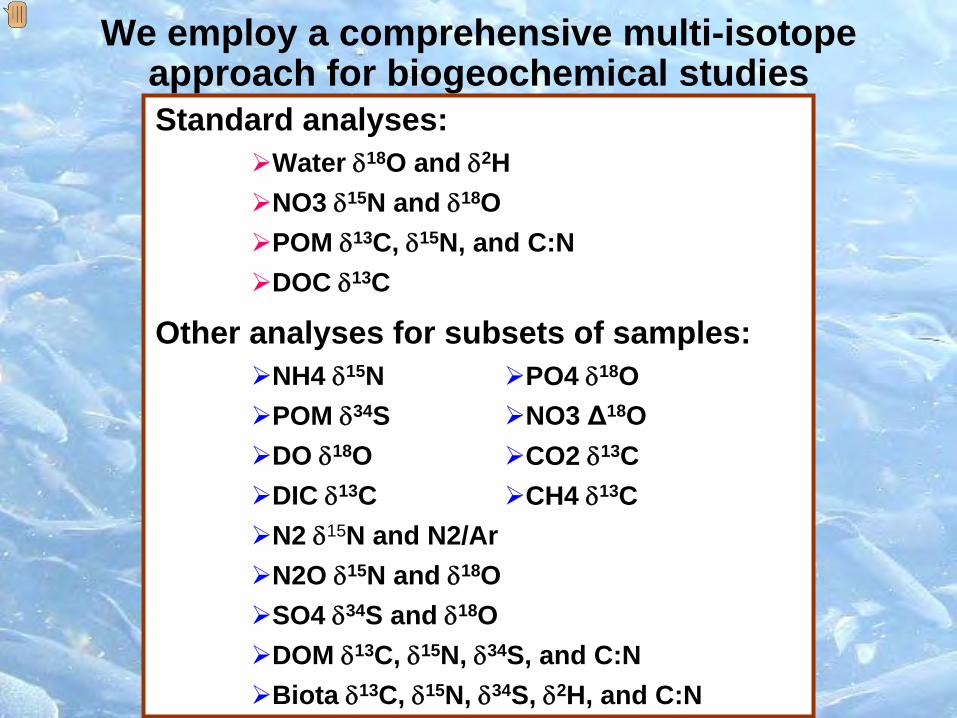
We employ a comprehensive multi-isotope approach for biogeochemical studiesStandard analyses:
Water δ18O and δ2HNO3 δ15N and δ18OPOM δ13C, δ15N, and C:N DOC δ13C
Other analyses for subsets of samples:NH4 δ15NPOM δ34SDO δ18ODIC δ13CN2 δ15N and N2/ArN2O δ15N and δ18OSO4 δ34S and δ18ODOM δ13C, δ15N, δ34S, and C:NBiota δ13C, δ15N, δ34S, δ2H, and C:N
PO4 δ18ONO3 Δ18OCO2 δ13CCH4 δ13C
Presenter
Presentation Notes
Almost all of these samples are easy to collect, involve minimal efforts to preserve (filtration, additions of acid or base, chilling or freezing), and are readily archived for future analyses. For example, we archived NH4, DOM, and SO4 isotope samples from the PIN700 project, pending future interest and/or funding. If the NH4 samples from the PIN700 project prove to be adequately preserved, we intend to analyze many samples from important Delta and Bay sites for NH4-d15N.
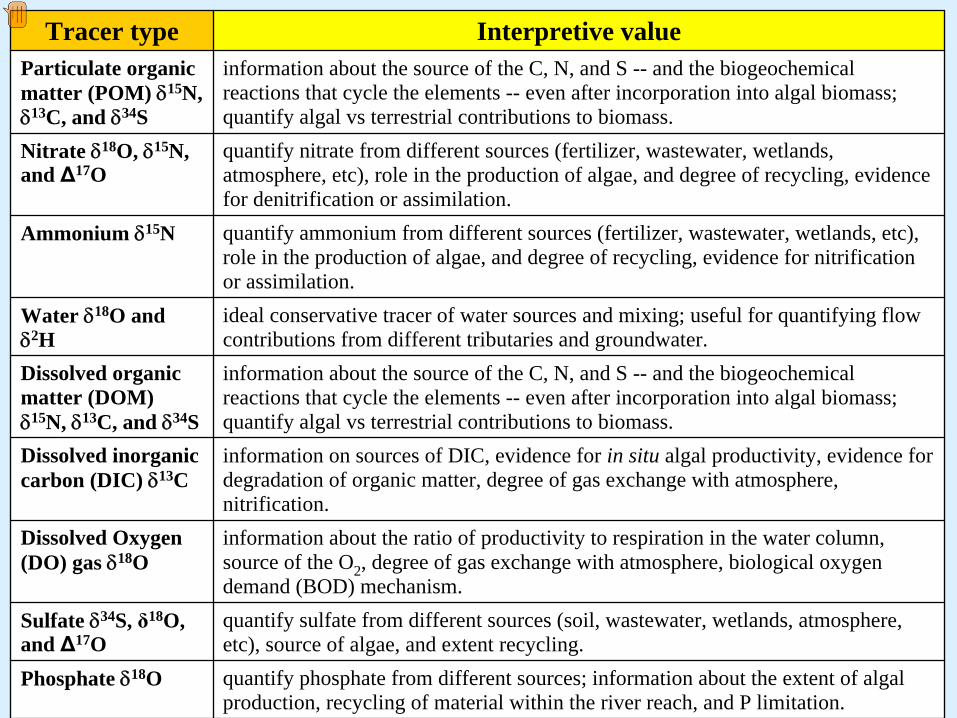
Tracer type Interpretive valueParticulate organic matter (POM) δ15N, δ13C, and δ34S
information about the source of the C, N, and S -- and the biogeochemical reactions that cycle the elements -- even after incorporation into algal biomass; quantify algal vs terrestrial contributions to biomass.
Nitrate δ18O, δ15N, and Δ17O
quantify nitrate from different sources (fertilizer, wastewater, wetlands, atmosphere, etc), role in the production of algae, and degree of recycling, evidence for denitrification or assimilation.
Ammonium δ15N quantify ammonium from different sources (fertilizer, wastewater, wetlands, etc), role in the production of algae, and degree of recycling, evidence for nitrification or assimilation.
Water δ18O and δ2H
ideal conservative tracer of water sources and mixing; useful for quantifying flow contributions from different tributaries and groundwater.
Dissolved organic matter (DOM) δ15N, δ13C, and δ34S
information about the source of the C, N, and S -- and the biogeochemical reactions that cycle the elements -- even after incorporation into algal biomass; quantify algal vs terrestrial contributions to biomass.
Dissolved inorganic carbon (DIC) δ13C
information on sources of DIC, evidence for in situ algal productivity, evidence for degradation of organic matter, degree of gas exchange with atmosphere, nitrification.
Dissolved Oxygen (DO) gas δ18O
information about the ratio of productivity to respiration in the water column, source of the O2 , degree of gas exchange with atmosphere, biological oxygen demand (BOD) mechanism.
Sulfate δ34S, δ18O, and Δ17O
quantify sulfate from different sources (soil, wastewater, wetlands, atmosphere, etc), source of algae, and extent recycling.
Phosphate δ18O quantify phosphate from different sources; information about the extent of algal production, recycling of material within the river reach, and P limitation.
Presenter
Presentation Notes
These isotope tracers can provide information about sources of materials (e.g., source of nitrate) and biogeochemical processes (e.g., quantify the relative rates of nitrification vs uptake as NH4 sinks).
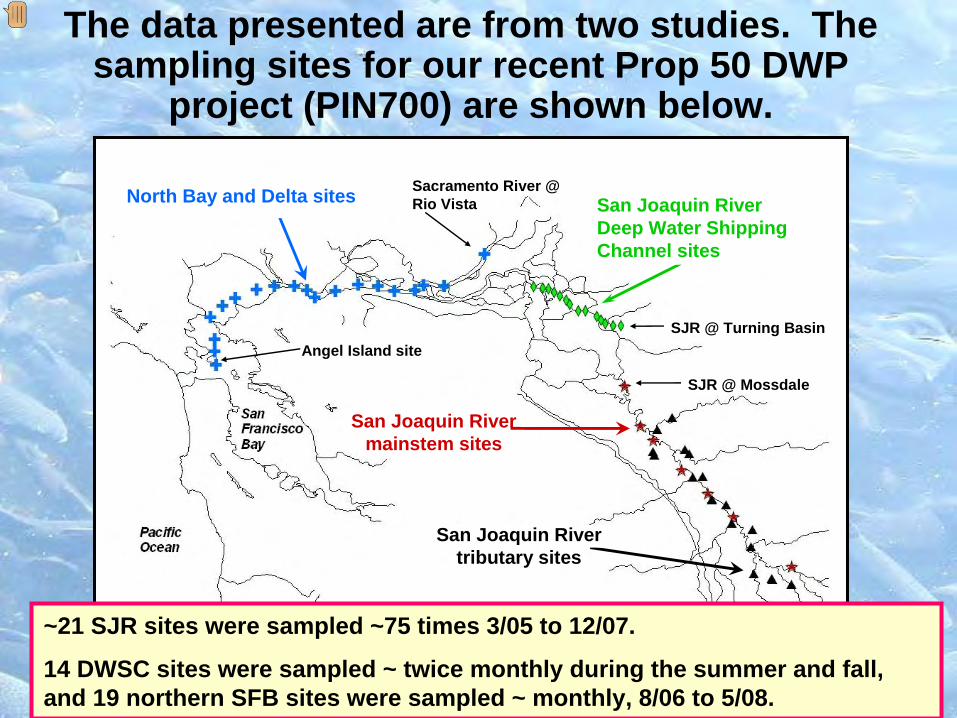
North Bay and Delta sites San Joaquin RiverDeep Water Shipping Channel sites
San Joaquin River mainstem sites
San Joaquin River tributary sites
SJR @ Mossdale
Sacramento River @ Rio Vista
SJR @ Turning BasinAngel Island site
~21 SJR sites were sampled ~75 times 3/05 to 12/07.
14 DWSC sites were sampled ~ twice monthly during the summer and
fall, and 19 northern SFB sites were sampled ~ monthly, 8/06 to 5/08.
The data presented are from two studies. The sampling sites for our recent Prop 50 DWP
project (PIN700) are shown below.
Presenter
Presentation Notes
This is a site map from our CALFED-funded PIN700 project, aimed primarily at tracing sources of nitrate and organic matter in the San Joaquin River, but extended through the Delta and Bay since nutrient and organic matter sources and cycling are an important issue for the entire ecosystem.
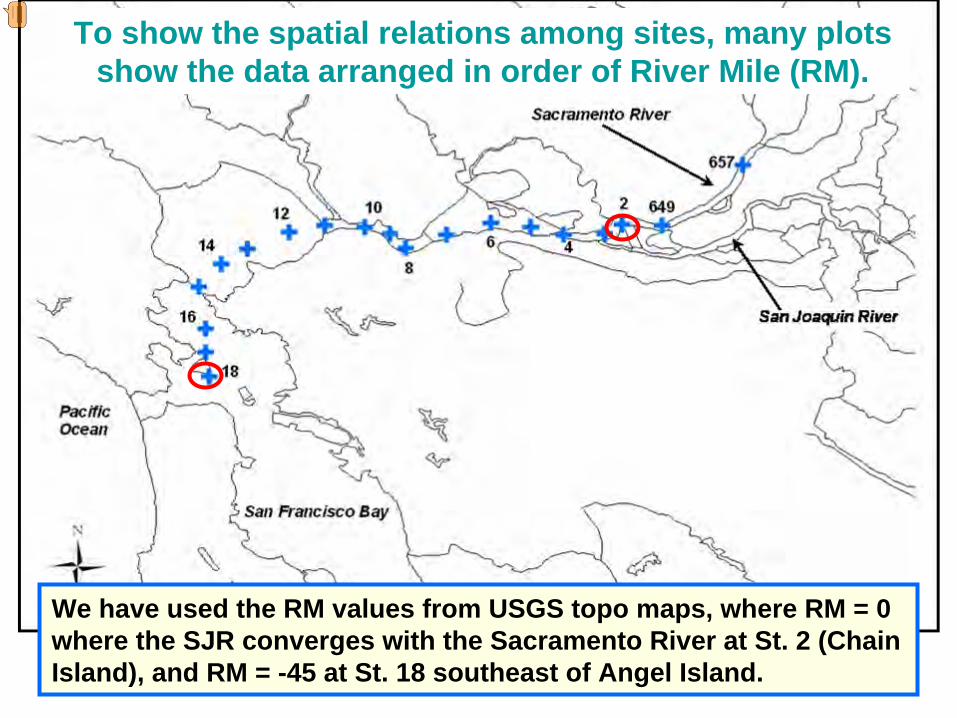
To show the spatial relations among sites, many plots show the data arranged in order of River Mile (RM).
We have used the RM values from USGS topo
maps, where RM = 0 where the SJR converges with the Sacramento River at St. 2 (Chain Island), and RM = -45 at St. 18 southeast of Angel Island.
Presenter
Presentation Notes
This map is a blow-up of the previous map, showing the San Francisco Bay sites (and site numbers) sampled by the USGS RV Polaris. We piggybacked on these cruises to collect samples for isotopic analysis in 2006-08. On subsequent contour maps, we have “projected” the data from the two sites on Sacramento River (site #649 and site #657) onto the delta section of the San Joaquin River transect.
-40 -20 0 20 40 60 80 100 120River Mile
Jun-05
Dec-05
Jun-06
Dec-06
Jun-07
Dec-07
River Mile
No data
Jun-05
Dec-05
Jun-06
Dec-06
Jun-07
Dec-07
Jun-05
Dec-05
Jun-06
Dec-06
Jun-07
Dec-07
River Mile
No dataNo data
LanderAngel Is.
Rio VistaMossdale
Turning B.
Prison. Pt.
Patterson
Martinez
LanderAngel Is.
Rio VistaMossdale
Turning B.
Prison. Pt.
Patterson
Martinez
Angel Is.
Rio VistaMossdale
Turning B.
Prison. Pt.
Patterson
Martinez
FLOWFLOWFLOW
No dataNo dataNo data
NO3 (uMol)
051015202550100150200250300350400
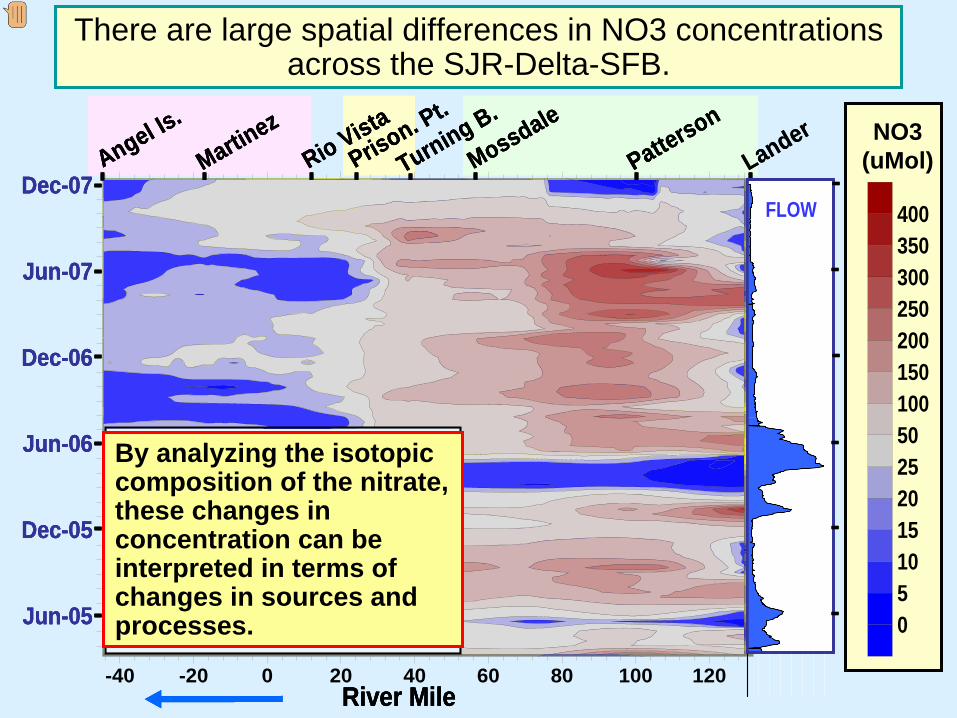
There are large spatial differences in NO3 concentrations across the SJR-Delta-SFB.
By analyzing the isotopic composition of the nitrate, these changes in concentration can be interpreted in terms of changes in sources and processes.
Presenter
Presentation Notes
This contour plot was made using ~1000 measurements of NO3 concentrations from 2005-07 from the sites on the earlier site map. The SJR data are from the DO TMDL project, and the Delta and Bay data are from measurements by our Isotope Tracers project (see Kendall et al. 2008 report from the PIN700 project). The colored boxes behind the site names indicate the three sections of the transect where samples were collected.
NO3-δ15N
1
5
9
13
17
-40 -20 0 20 40 60 80 100 120River Mile
Jun-05
Dec-05
Jun-06
Dec-06
Jun-07
Dec-07
River Mile
No data
Jun-05
Dec-05
Jun-06
Dec-06
Jun-07
Dec-07
Jun-05
Dec-05
Jun-06
Dec-06
Jun-07
Dec-07
River Mile
No dataNo data
LanderAngel Is.
Rio VistaMossdale
Turning B.
Prison. Pt.
Patterson
Martinez
LanderAngel Is.
Rio VistaMossdale
Turning B.
Prison. Pt.
Patterson
Martinez
Angel Is.
Rio VistaMossdale
Turning B.
Prison. Pt.
Patterson
Martinez
FLOWFLOWFLOW
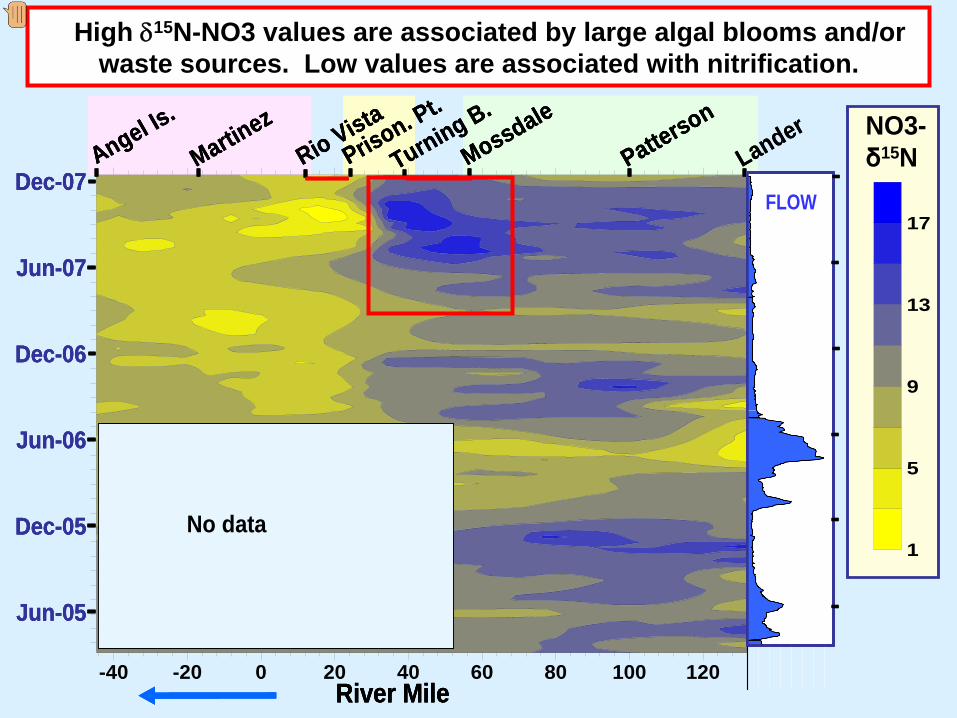
High δ15N-NO3 values are associated by large algal blooms and/or waste sources. Low values are associated with nitrification.
Presenter
Presentation Notes
These data show temporal and spatial changes in NO3-d15N over ~170 miles of the estuary, from the Lander Avenue site on the SJR to near Angel Island in the SFB. Seasonal changes in flow from various SJR tributaries, which drain different landuses with different sources of NO3, explain a large percent of the variability in d15N. The high values downstream of Mossdale are caused by nutrient from the Stockton WWTP and subsequent N cycling.
FLOWFLOWFLOW
-40 -20 0 20 40 60 80 100 120River Mile
Jun-05
Dec-05
Jun-06
Dec-06
Jun-07
Dec-07
River Mile
No data
Jun-05
Dec-05
Jun-06
Dec-06
Jun-07
Dec-07
Jun-05
Dec-05
Jun-06
Dec-06
Jun-07
Dec-07
River Mile
No dataNo data
LanderAngel Is.
Rio VistaMossdale
Turning B.
Prison. Pt.
Patterson
Martinez
LanderAngel Is.
Rio VistaMossdale
Turning B.
Prison. Pt.
Patterson
Martinez
Angel Is.
Rio VistaMossdale
Turning B.
Prison. Pt.
Patterson
Martinez
No data
NO3-δ18O
-9
-6
-3
0
3
6
9
12
15
NO3-δ18O
-9
-6
-3
0
3
6
9
12
15
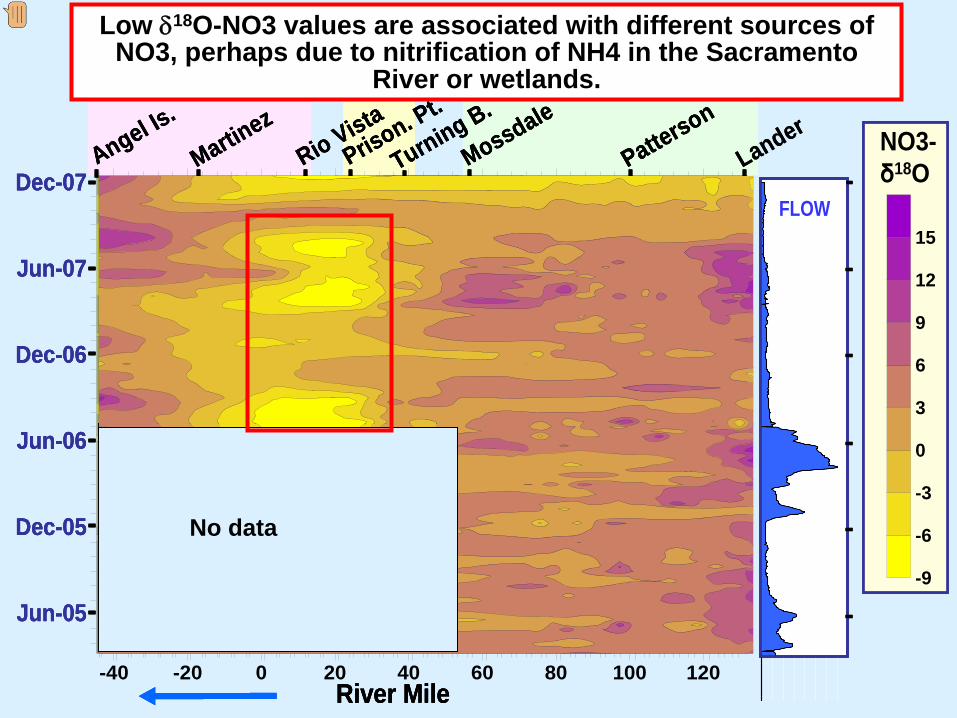
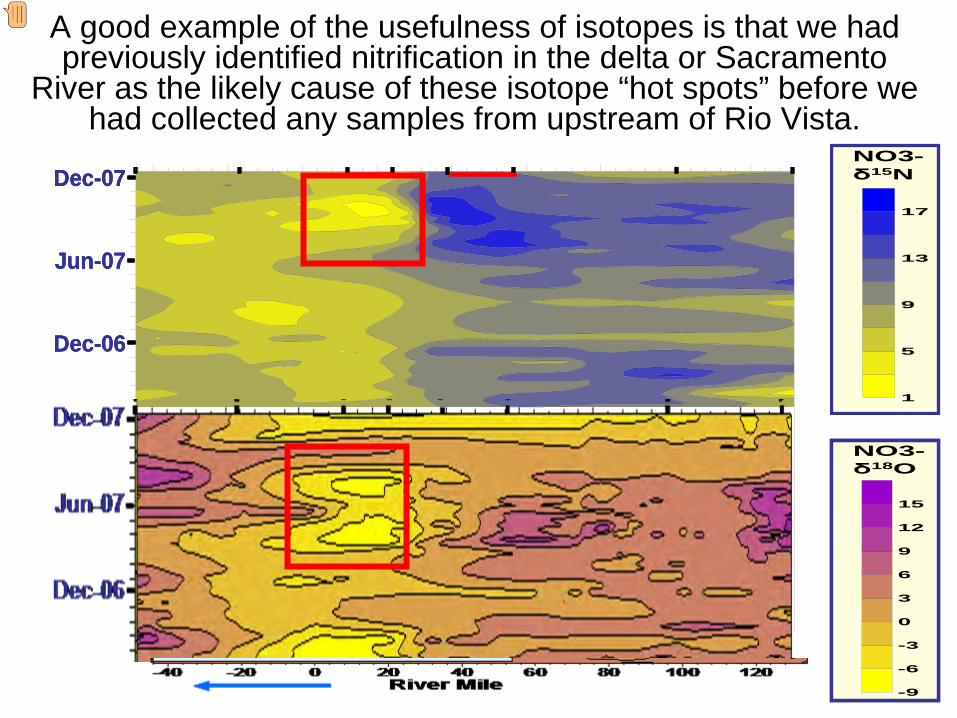
Low δ18O-NO3 values are associated with different sources of NO3, perhaps due to nitrification of NH4 in the Sacramento
River or wetlands.
Presenter
Presentation Notes
These data show temporal and spatial changes in NO3-d18O over ~170 miles of the estuary. Changes in d18O mainly reflect environmental conditions where the nitrate was formed. The “hotspots” of low d18O values at some Sacramento River and delta sites probably reflect intensive nitrification.
MAIN QUESTIONS
Can isotope techniques:
1)
identify sources of NH4 and NO3 at key locations?
2)
determine relative biogeochemical reactions rates of different nutrients at different locations?
3)
identify the sources of dissolved and particulate organic matter?
These are similar to our goals in the SJR study except that we are (1) adding analysis of NH4 for δ15N and POM for δ34S, including archived samples, (2) working closely with plankton ecologists, and (3) working closely with a DSM2 modeler.
Presenter
Presentation Notes
These were the main goals of this part of our new SWC-funded project. The term “POM” means particulate organic matter, and is composed of algae, bacteria, and terrestrial organic matter. Less than 50% of the POM is from terrestrial sources. The combination of d13C, d15N, C:N, and d34S can be used to estimate the isotopic compositions and relative proportions of these 3 main sources of POM.
Why do we want to analyze NH4Why do we want to analyze NH4--δδ1515N?N?
1)
To see if NH4 from different sources have distinctive δ15N values.
2)
To determine the spatial and temporal variability in the sources
of NH4.
3)
So that we can use NH4-
δ15N along with NO3-δ15N and δ18O (and our other data) to calculate the temporal and spatial variability in N sources to phytoplankton, as an independent test of the model developed by the Dugdale
et al group based primarily on 15N-additions.
Presenter
Presentation Notes
An advantage of using “natural” isotope variations, as opposed to isotope addition studies, is that the natural isotope samples integrate insitu sources and processes in the natural environment at the time that the sample was collected. A disadvantage is that interpretation of the natural isotope variation is more complicated.
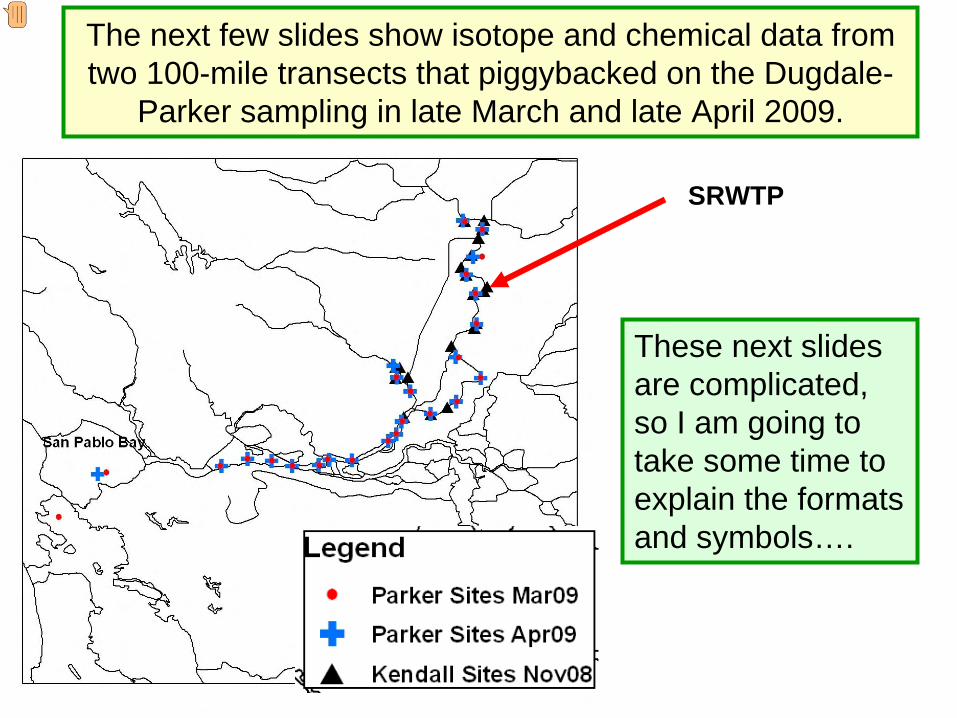
The next few slides show isotope and chemical data from two 100-mile transects that piggybacked on the Dugdale-
Parker sampling in late March and late April 2009.
These next slides are complicated, so I am going to take some time to explain the formats and symbols….
SRWTP
Presenter
Presentation Notes
This presentation will only show data from the March and April transects, and not from our shorter November 2008 transect.
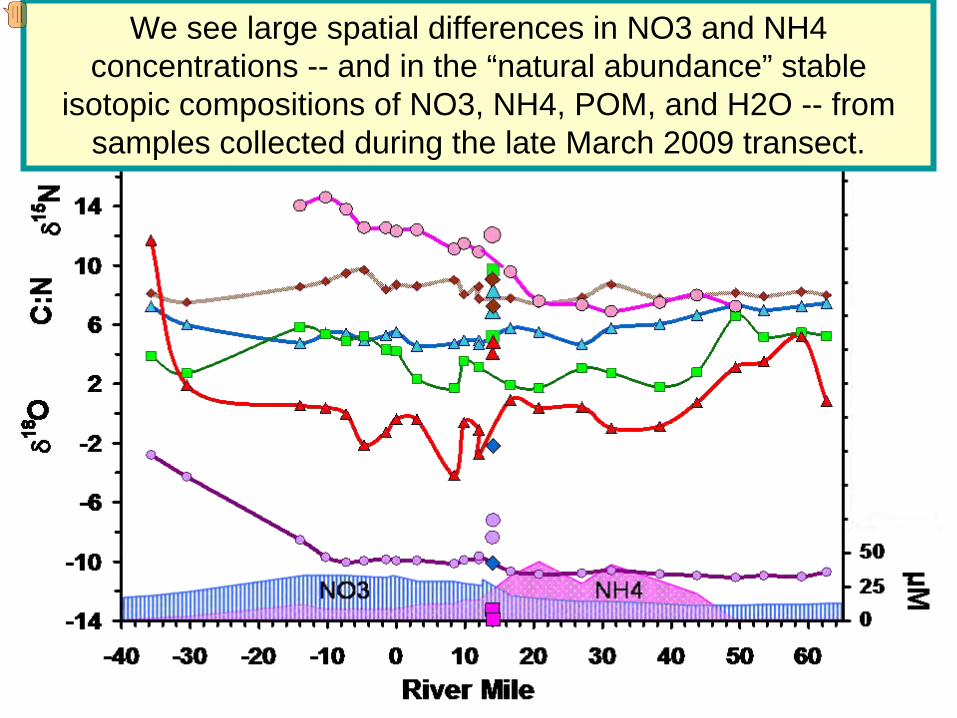
We see large spatial differences in NO3 and NH4 concentrations --
and in the “natural abundance” stable
isotopic compositions of NO3, NH4, POM, and H2O --
from samples collected during the late March 2009 transect.
Presenter
Presentation Notes
This slide shows an example of what the next few slides of transect data look like. The next slide will explain the format. POM is particulate organic matter, which in this system is mostly comprised of algae and bacteria.
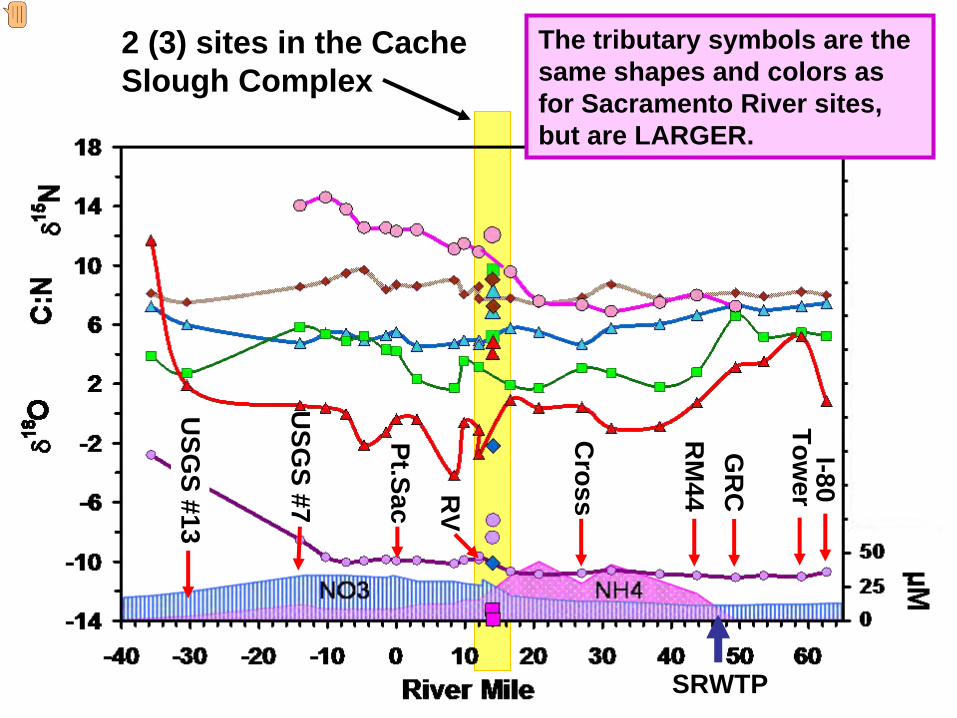
2 (3) sites in the Cache Slough Complex
SRWTP
Tower
GR
CR
M44
Cross
Pt.Sac
USG
S #13
The tributary symbols are the same shapes and colors as for Sacramento River sites, but are LARGER.
RV
I-80
USG
S #7
Presenter
Presentation Notes
Data from the tributary sites (individual colored symbols highlited within the yellow band) are shown with larger symbols than the transect samples (transect data are connected with lines to indicate their spatial relations). The NO3 and NH4 concentrations (in uM) of the transect samples are shown at the bottom of the plots as colored areas (keyed to the right y axis). The NH4 (hot pink squares) and NO3 (dark blue diamonds) concentrations of the Slough sites are shown as similarly colored symbols. The locations of selected sites are shown with red arrows.
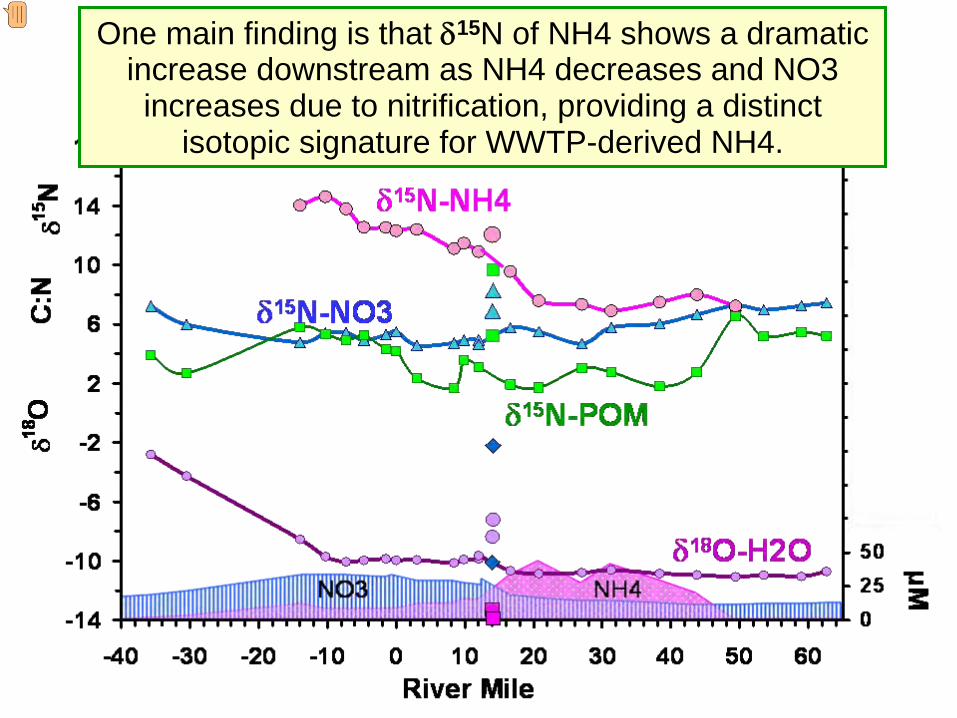
One main finding is that δ15N of NH4 shows a dramatic increase downstream as NH4 decreases and NO3 increases due to nitrification, providing a distinct
isotopic signature for WWTP-derived NH4.
Presenter
Presentation Notes
The d15N of NH4 is ~ constant while NH4 concentrations are high, and then increased rapidly as NH4 concentrations drop. The spatial variations of these data, especially the NH4-d15N values, clearly show the effect of gradual nitrification of NH4 to NO3, and uptake of the new NO3 and residual NH4 to form algae (and possibly bacteria). These data are from samples collected in late March during the Dugdale-Parker cruise; not all the NH4 samples have yet been analyzed. These samples were also analyzed for POM-d13C and H2O-d2H (not shown). Samples will soon be analyzed for DOC-d13C and POM-d34S.
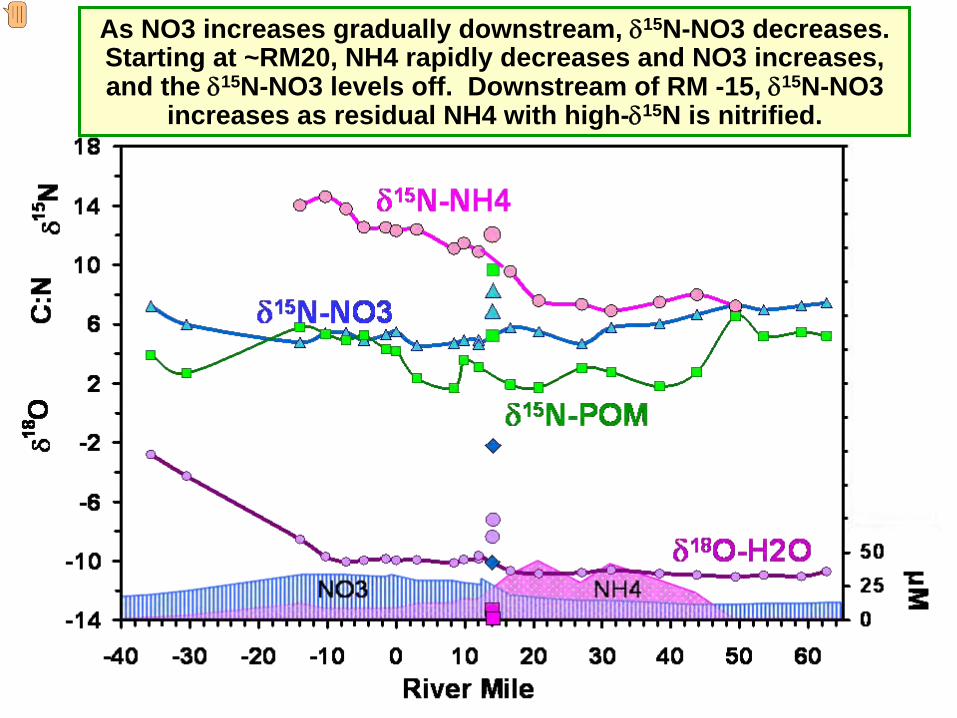
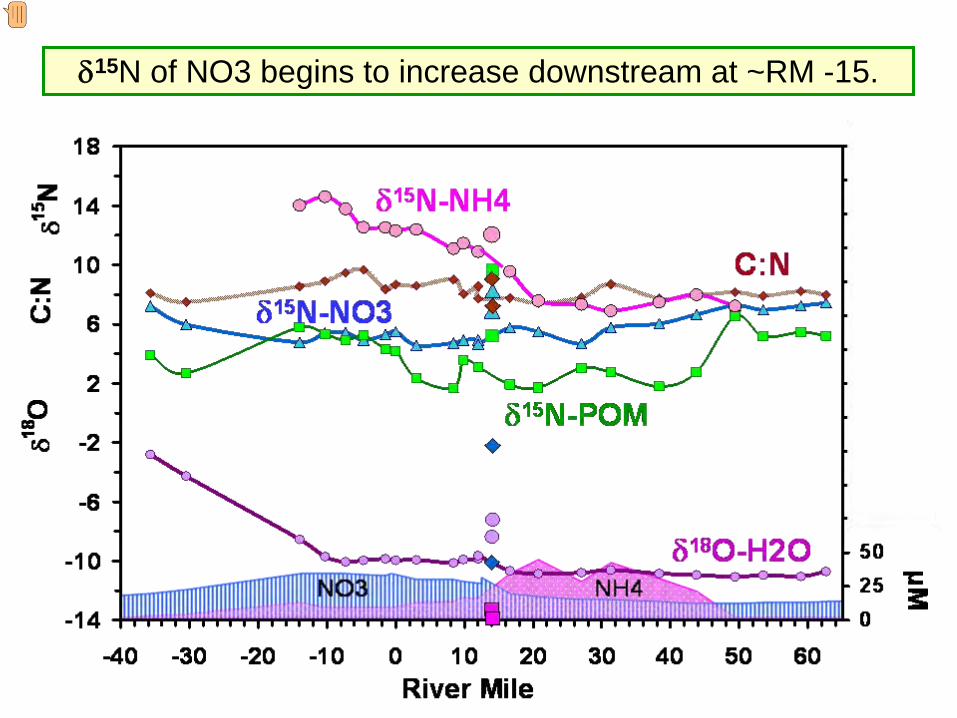
As NO3 increases gradually downstream, δ15N-NO3 decreases. Starting at ~RM20, NH4 rapidly decreases and NO3 increases, and the δ15N-NO3 levels off. Downstream of RM -15, δ15N-NO3
increases as residual NH4 with high-δ15N is nitrified.
Presenter
Presentation Notes
As NH4 is converted to NO3, the d15N of the NO3 becomes lower while the d15N of the remaining NH4 becomes higher. The relative changes in concentration and isotopes reflect the isotope fractionation of the nitrification process. When algae and bacteria use the NH4 and/or NO3 to grow, the C:N of the POM decreases and the changes in the d15N of the POM reflect which nutrient (NH4 or NO3) is currently being utilized for insitu growth. Algal growth will also be reflected in chlorophyll increases whereas bacterial growth won’t.
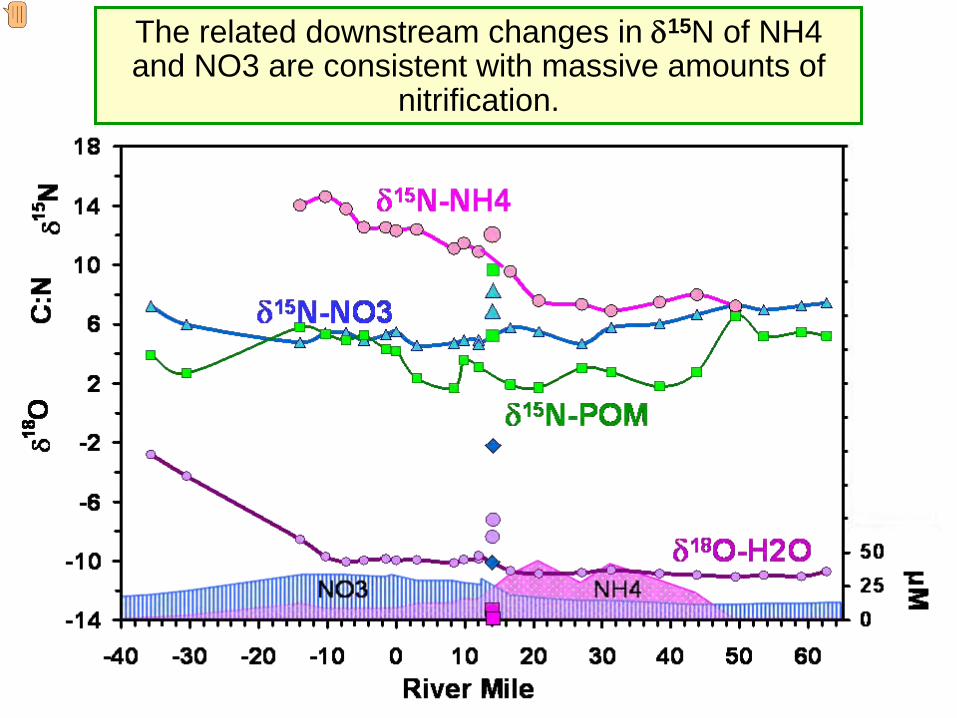
The related downstream changes in δ15N of NH4 and NO3 are consistent with massive amounts of
nitrification.
Presenter
Presentation Notes
The analytical uncertainties of these data are about the same size or smaller than the symbols. Hence, the small oscillations in values reflect signal NOT noise, and potentially interpretable parts of the story.
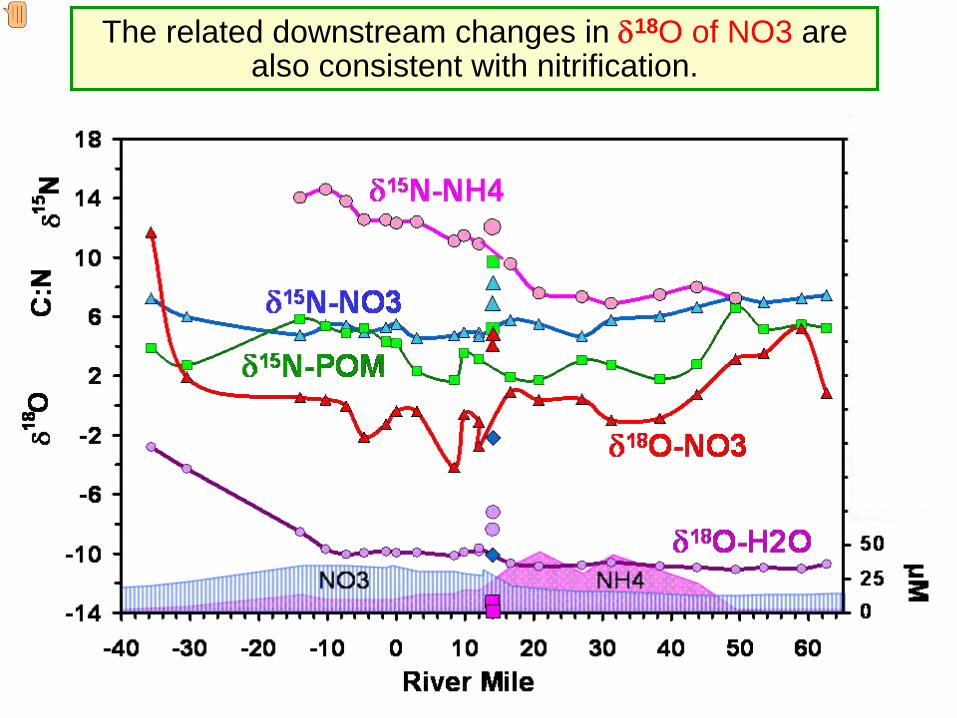
The related downstream changes in δ18O of NO3
are also consistent with nitrification.
Presenter
Presentation Notes
This plot shows huge changes in the d18O of NO3, providing clear evidence of nitrification. The downstream increase in d18O-NO3 at Delta and Bay sites (downstream of RM = 0) parallels the increase in d18O of water.
Dec-06
Jun-07
Dec-07
Dec-06
Jun-07
Dec-07
Dec-06
Jun-07
Dec-07
A good example of the usefulness of isotopes is that we had previously identified nitrification in the delta or Sacramento
River as the likely cause of these isotope “hot spots” before we had collected any samples from upstream of Rio Vista.
NO3-δ15N
1
5
9
13
17
NO3-δ18O
-9
-6
-3
0
3
6
9
12
15
NO3-δ18O
-9
-6
-3
0
3
6
9
12
15
Presenter
Presentation Notes
Thus, the transect data provide strong support of our earlier interpretation of the 2006-2007 contour data from the earlier PIN700 study. Nitrification of NH4 usually results in NO3 with relatively low d15N and d18O values.
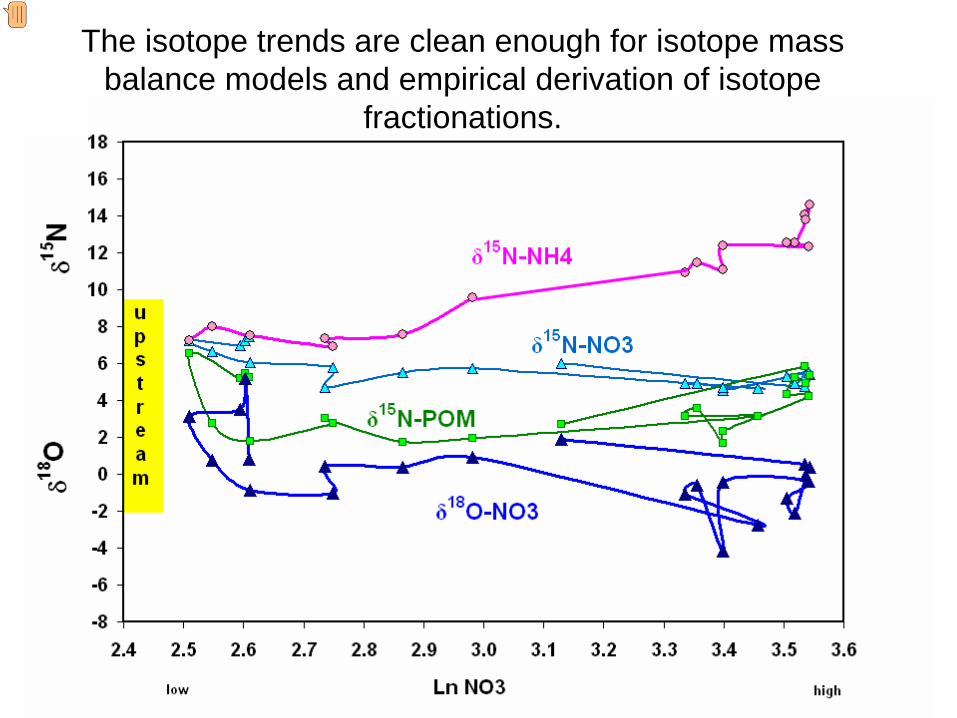
The isotope trends are clean enough for isotope mass balance models and empirical derivation of isotope
fractionations.
Presenter
Presentation Notes
When isotope geochemists are trying to determine if a trend in isotopes is due to mixing of sources vs fractionation, it is useful to plot the isotope values vs the natural log of concentration. If the data can be explained by a fractionating process (which would show an exponential instead of hyperbolic relation), plotting the isotope values relative to Ln NO3 or Ln NH4 will show linear relations. The d15N-NH4 data show a clear linear relation, strongly suggesting that fractionation is responsible for the trend. Portions of the d15N-NO3 and d15N-POM datasets appear linear too.
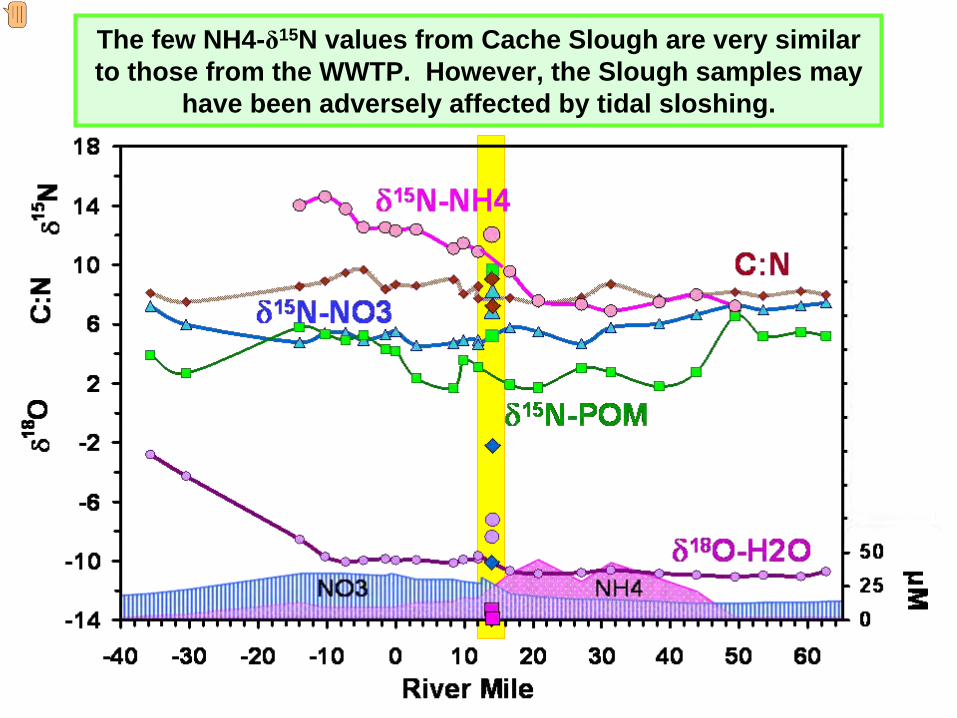
The few NH4-δ15N values from Cache Slough are very similar to those from the WWTP. However, the Slough samples may
have been adversely affected by tidal sloshing.
Presenter
Presentation Notes
Future plans: We have splits of all of Chris Foe’s samples collected starting in May, so can analyze more samples from Cache Slough and from near the WWTP to assess temporal variability. We also have archived NH4 samples from almost all the PIN700 samples, including ~600 from Rio Vista (RM12) downstream to Angel Island. If these samples prove to be adequately preserved (something we will be determining later this fall), we can analyze them to obtain more information on the d15N of NH4 from different landuses and sites from 2005-08. There are also several other isotopic approaches for identifying waste vs wetlands sources of nutrients and OM.
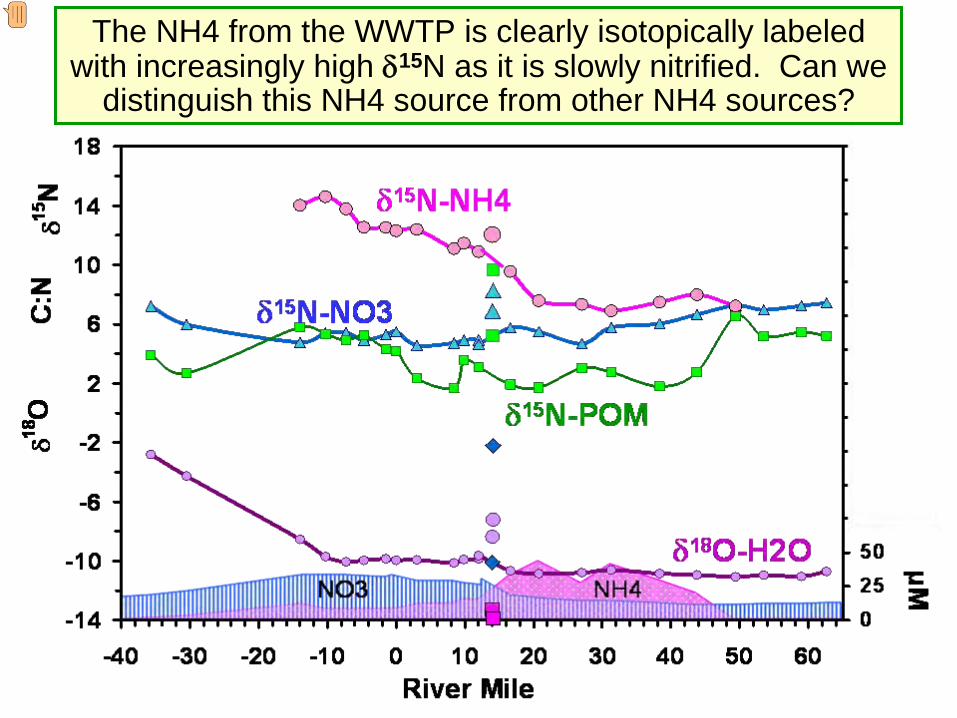
The NH4 from the WWTP is clearly isotopically labeled with increasingly high δ15N as it is slowly nitrified. Can we
distinguish this NH4 source from other NH4 sources?
Presenter
Presentation Notes
One main question that this study hoped to answer was: does NH4 from the WWTP have a distinctive d15N value? We find that the further the NH4 from the WWTP moves downstream, the more distinctive (higher) the d15N signature. Unfortunately, we see this same high d15N value in the few NH4 samples analyzed thus far from mixed agricultural landuses (ie, Cache Slough). More samples, especially ones clearly upstream of tidal sloshing, are needed to determine if the WWTP NH4 can be distinguished from other landuses that potentially contribute NH4 to the river, Delta, and Bay.
δ15N of NO3 begins to increase downstream at ~RM -15.
Presenter
Presentation Notes
One explanation of the increase in d15N-NO3 here is because high-d15N NH4 is being nitrified. At this location, we also see abrupt decreases in NO3 and NH4, and a sharp increase in the % ocean water (as indicated by salinity and the d18O of water). These data may reflect tidal sloshing while sampling downstream on increasing tide levels.
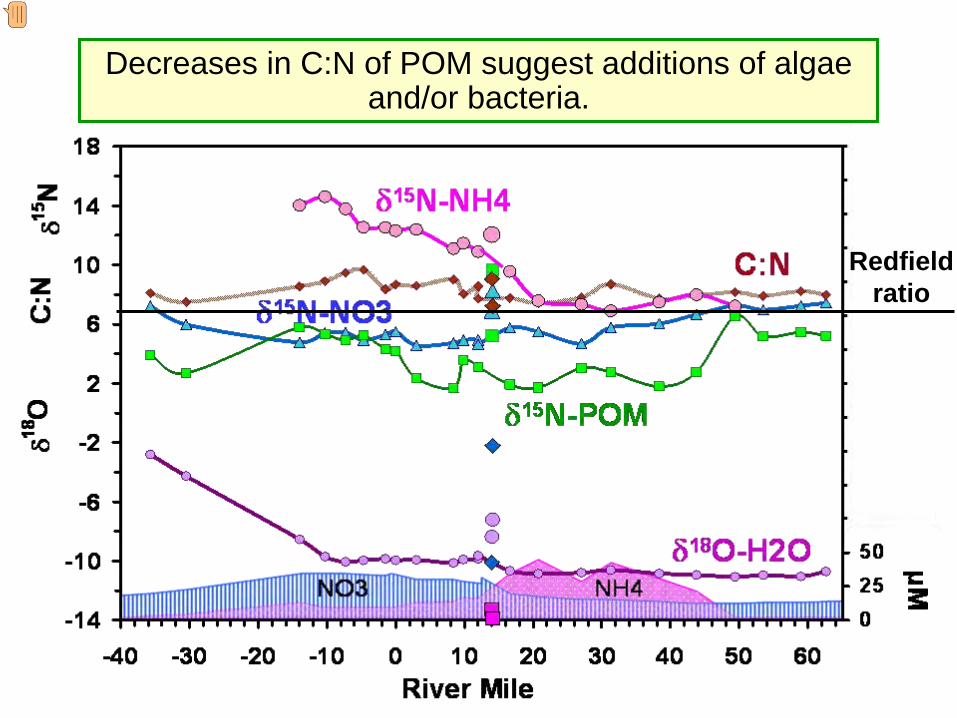
Redfield ratio
Decreases in C:N of POM suggest additions of algae and/or bacteria.
Presenter
Presentation Notes
The horizontal black line shows the “Redfield Ratio” – the theoretical C:N of algae (actual C:N of algae range from 6-8). Bacteria can have C:N as low as ~4. During uptake of NH4 or NO3, the algal and bacteria preferentially assimilate low-d15N and their d15N values often “track” the d15N of the N source.
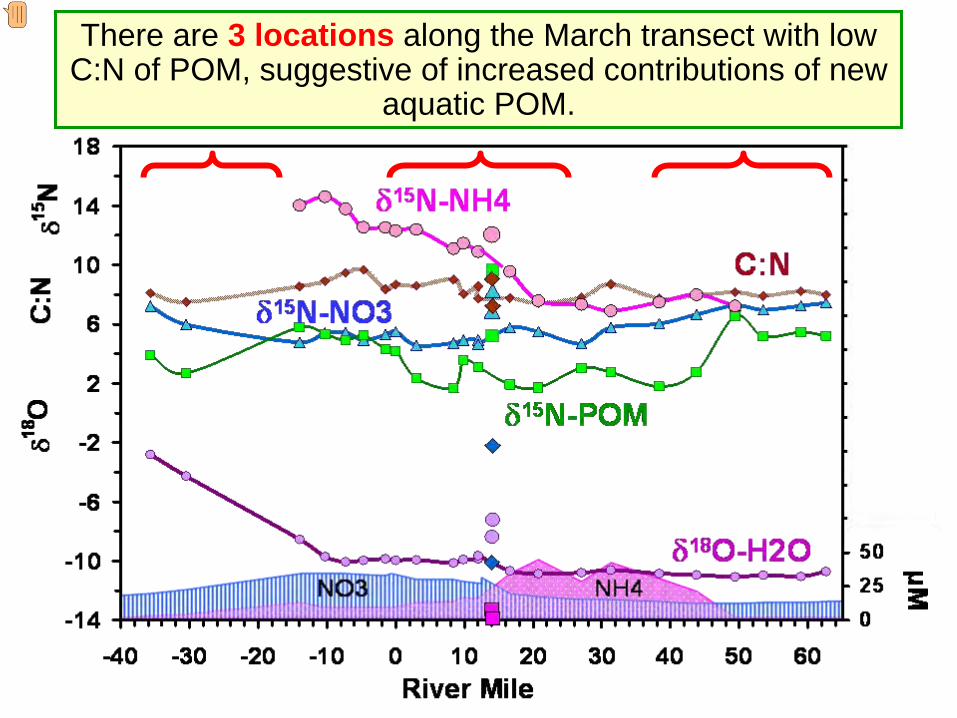
There are 3 locations
along the March transect with low C:N of POM, suggestive of increased contributions of new
aquatic POM.
Presenter
Presentation Notes
The upstream and downstream locations both have low NH4 and probably indicate assimilation of NO3, but the middle location (where NH4 is high) is a puzzle. Maybe bacterial growth is the cause of the low C:N?
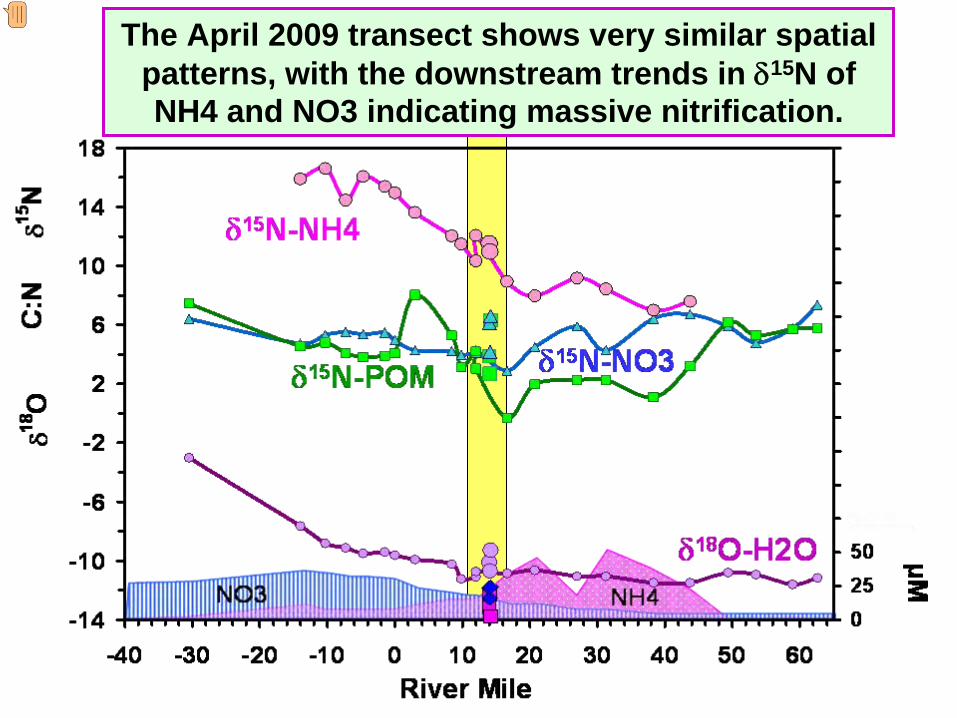
The April 2009 transect shows very similar spatial patterns, with the downstream trends in δ15N of NH4 and NO3 indicating massive nitrification.
Presenter
Presentation Notes
The d15N of NH4 from Cache Slough sites is again very similar to the d15N value of NH4 derived from the WWTP and fractionated ~5‰ during progressive nitrification. The Slough samples may also be adversely affected by tidal sloshing and not be representative of NH4 from the Sloughs.
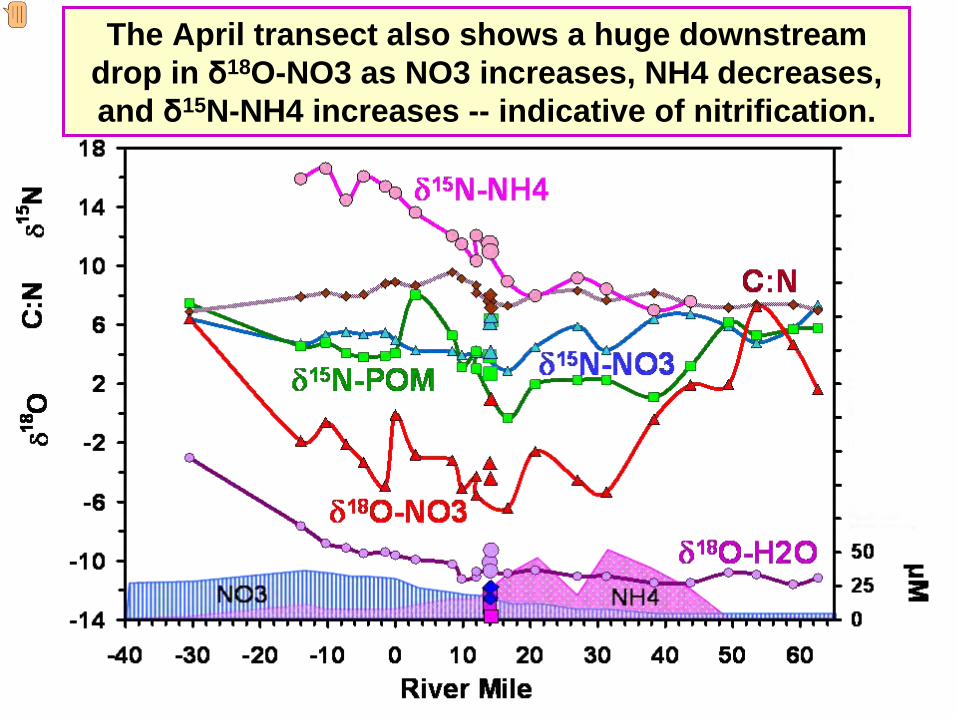
The April transect also shows a huge downstream drop in δ18O-NO3 as NO3 increases, NH4 decreases, and δ15N-NH4 increases --
indicative of nitrification.
Presenter
Presentation Notes
The increase in d18O-NO3 starting at ~RM0 is probably due to tidal sloshing. The higher values could reflect mixing with NO3 derived from the Bay or from formation of nitrate IN water derived from mixing of river and Bay water. We should have the data to distinguish between these two hypotheses because the former suggests that NO3 is mixing conservatively and the latter does not.
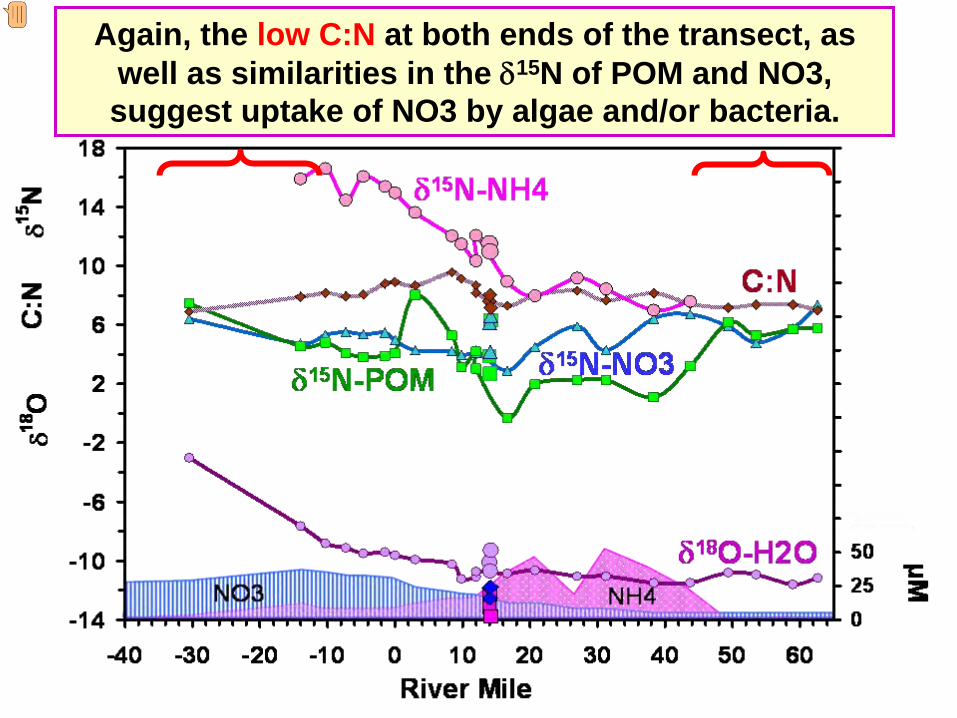
Again, the low C:N
at both ends of the transect, as well as similarities in the δ15N of POM and NO3, suggest uptake of NO3 by algae and/or bacteria.
Presenter
Presentation Notes
The d13C of POM (not shown) is also useful for identifying algal blooms.
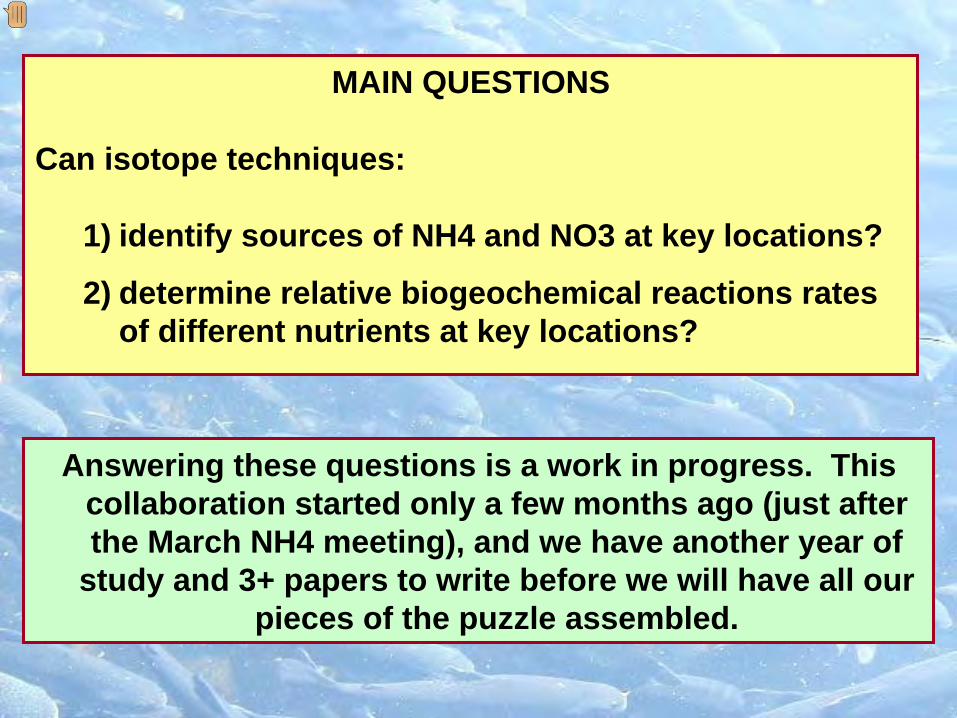
Answering these questions is a work in progress. This collaboration started only a few months ago (just after the March NH4 meeting), and we have another year of
study and 3+ papers to write before we will have all our pieces of the puzzle assembled.
MAIN QUESTIONS
Can isotope techniques:
1)
identify sources of NH4 and NO3 at key locations?
2)
determine relative biogeochemical reactions rates of different nutrients at key locations?
Presenter
Presentation Notes
What we can say is that nitrification imparts a very distinctive spatial pattern of increasing d15N values to the NH4 from the WWTP. This makes it possible to distinguish whether algae and bacteria in this region are primarily using NH4 or NO3. The spatial isotope patterns will make it possible to calculate reaction rates for different biogeochemical processes.
-100
-80
-60
-40
-20
0
20
40
60
80
RE
SID
UA
L (%
)
NO3 NH4 PO4 Chl-a Si
JAN MAR APRIL SEPT NOV
Measured>
Predicted
Measured<
Predicted
2007
RIV
ER
OC
EA
N
RIV
ER
OC
EA
N
RIV
ER
OC
EA
N
RIV
ER
OC
EA
N
RIV
ER
OC
EA
N
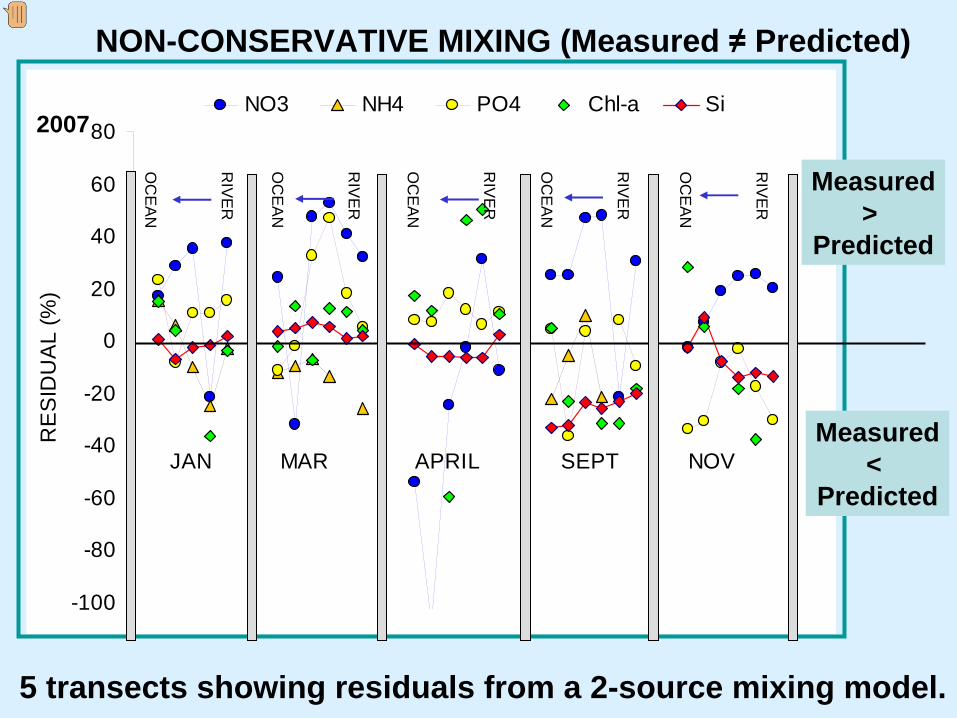
NON-CONSERVATIVE MIXING (Measured ≠
Predicted)
5 transects showing residuals from a 2-source mixing model.
Presenter
Presentation Notes
This is an example of how we are combining simple mixing model approaches (in this case using a simple two component mixing model based on salinity) to see spatial and temporal changes in non-conservative behavior in the delta and bay (using PIN700 project data). The examples above show times when measured values of NO3, NH4, PO4, Chl-a, and Si at sites are either higher or lower than would be predicted by a simple two-component mixing model. These discrepancies could mean that the end-members are incorrect -- or that there are additional sources that add constituents, or different processes that remove nutrients, along these reaches of the Delta and Bay. Isotopes are useful tools for testing hypotheses about non-conservative behavior.
a recent short-course at Oregon State University in June 2009 where I gave a few lectures: http://oregonstate.edu/groups/hydro/IsotopeWorkshop/IsotopeWorkshop.html(click on the Kendall links further down on the page).
an informal presentation at the SJR DO TMDL technical working group (TWG) meeting in March 2006 about the status of our DO TMDL-related research: http://www.sjrdotmdl.org/meetings013.html (click on the Kendall link further down on the page).
a USGS seminar in May 2005 about tracing causes of hypoxia at: http://wwwrcamnl.wr.usgs.gov/wrdseminar/pastseminars2005.html (click on the Kendall link further down on the page).
a CUAHSI seminar in April 2005 about tracing sources of organics and nutrients in watersheds at: http://www.cuahsi.org/sem-archive.html (click on the Kendall link further down on the page).
a seminar about tracing agricultural contaminants with isotopes given at an EPA workshop on Animal Feeding Operations (AFOs) in December 2004 at: http://www.epa.gov/osp/regions/afo.htm (click on the Kendall link further down on the page).
For information about using isotopes to trace sources of nitrate and organic matter, I have several web-based
seminars that can be accessed from the following URLs:
Presenter
Presentation Notes
For more information about tracing sources and processes using isotopes, a list of references is posted at: http://wwwrcamnl.wr.usgs.gov/isoig/res/texts.html . A brief description of isotope fundamentals is given at: http://wwwrcamnl.wr.usgs.gov/isoig/res/funda.html .