Embed Size (px)
Citation preview
Tracing Informal Recruitment Relationshipsthrough a Panel Survey of Migrants
International Forum on Migration Statistics, Paris. January 15-16, 2018
Bilesha Weeraratne, PhD.
Institute of Policy Studies of Sri Lanka.
21
Informal Recruitment
1 Introduction
Theoretical Framework
Research Questions
Innovation
Design
Data
Descriptive Statistics
Methodology
Results
Migrants’ Perception
Impact of Maturity inrecruitment process
Impact of migration
Findings
Bilesha Weeraratne, PhD.
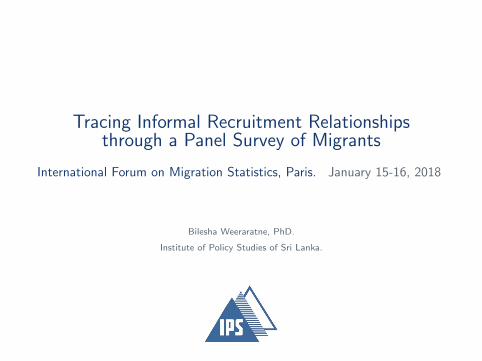
Motivation
I Labour migration is an important component of the SriLankan economy.
I Recruitment involves formal recruitment agents & informalSub-Agents (SA).
I Involvement of SA’s are common in South Asian Countries -i.e. Bangladesh, India, Nepal, & Pakistan.
I These countries are grappling to regulate SA’s
I India : SA’s are illegal/ banned
I Nepal : SA’s are licensed through formal agents.
I B’desh: regulation to recruit from a national database ornews paper ads. to circumvent SA’s.
I Sri Lanka: trying introduce yet another new scheme ofregulations
21
Informal Recruitment
2 Introduction
Theoretical Framework
Research Questions
Innovation
Design
Data
Descriptive Statistics
Methodology
Results
Migrants’ Perception
Impact of Maturity inrecruitment process
Impact of migration
Findings
Bilesha Weeraratne, PhD.
Objectives
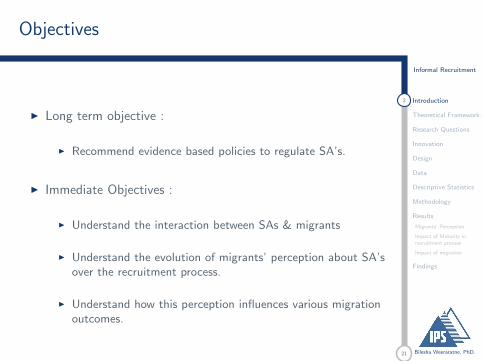
I Long term objective :
I Recommend evidence based policies to regulate SA’s.
I Immediate Objectives :
I Understand the interaction between SAs & migrants
I Understand the evolution of migrants’ perception about SA’sover the recruitment process.
I Understand how this perception influences various migrationoutcomes.
21
Informal Recruitment
Introduction
3 Theoretical Framework
Research Questions
Innovation
Design
Data
Descriptive Statistics
Methodology
Results
Migrants’ Perception
Impact of Maturity inrecruitment process
Impact of migration
Findings
Bilesha Weeraratne, PhD.
Theoretical Background
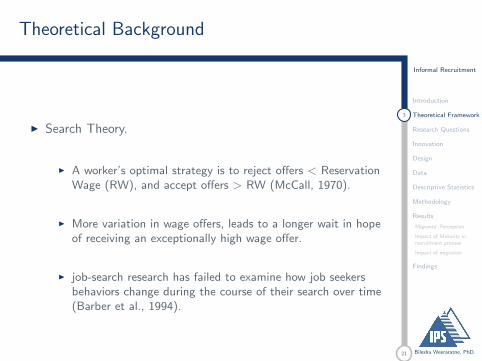
I Search Theory.
I A worker’s optimal strategy is to reject offers < ReservationWage (RW), and accept offers > RW (McCall, 1970).
I More variation in wage offers, leads to a longer wait in hopeof receiving an exceptionally high wage offer.
I job-search research has failed to examine how job seekersbehaviors change during the course of their search over time(Barber et al., 1994).

21
Informal Recruitment
Introduction
4 Theoretical Framework
Research Questions
Innovation
Design
Data
Descriptive Statistics
Methodology
Results
Migrants’ Perception
Impact of Maturity inrecruitment process
Impact of migration
Findings
Bilesha Weeraratne, PhD.
Theoretical Background
I Manpower placement agencies.
I Manpower placement agencies assembles offers of anddemand for employment and makes job search more effective.
I The existence of agencies is justified if, in their absenceindividual decisions results in an insufficient allocation ofresources devoted to job searching.
I Job search networks.
I Workers connected to workers with earning high wages drawfrom a better wage offer distribution, than workers connectedto workers earning low wages (Schmutte,2015).
I There are wage differentials between jobs found throughinformal and formal methods (Pellizzari, 2010).
21
Informal Recruitment
Introduction
Theoretical Framework
5 Research Questions
Innovation
Design
Data
Descriptive Statistics
Methodology
Results
Migrants’ Perception
Impact of Maturity inrecruitment process
Impact of migration
Findings
Bilesha Weeraratne, PhD.
Research Questions
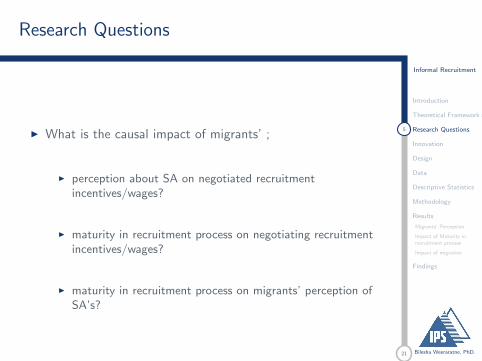
I What is the causal impact of migrants’ ;
I perception about SA on negotiated recruitmentincentives/wages?
I maturity in recruitment process on negotiating recruitmentincentives/wages?
I maturity in recruitment process on migrants’ perception ofSA’s?
21
Informal Recruitment
Introduction
Theoretical Framework
Research Questions
6 Innovation
Design
Data
Descriptive Statistics
Methodology
Results
Migrants’ Perception
Impact of Maturity inrecruitment process
Impact of migration
Findings
Bilesha Weeraratne, PhD.
What’s innovative ?
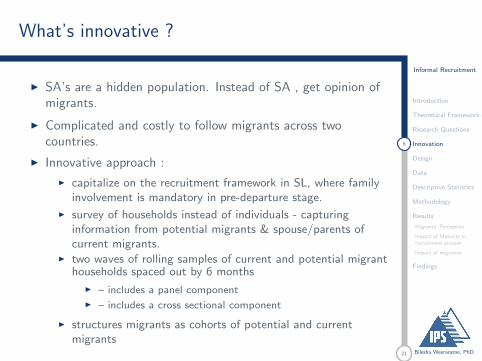
I SA’s are a hidden population. Instead of SA , get opinion ofmigrants.
I Complicated and costly to follow migrants across twocountries.
I Innovative approach :
I capitalize on the recruitment framework in SL, where familyinvolvement is mandatory in pre-departure stage.
I survey of households instead of individuals - capturinginformation from potential migrants & spouse/parents ofcurrent migrants.
I two waves of rolling samples of current and potential migranthouseholds spaced out by 6 months
I – includes a panel componentI – includes a cross sectional component
I structures migrants as cohorts of potential and currentmigrants
21
Informal Recruitment
Introduction
Theoretical Framework
Research Questions
Innovation
7 Design
Data
Descriptive Statistics
Methodology
Results
Migrants’ Perception
Impact of Maturity inrecruitment process
Impact of migration
Findings
Bilesha Weeraratne, PhD.
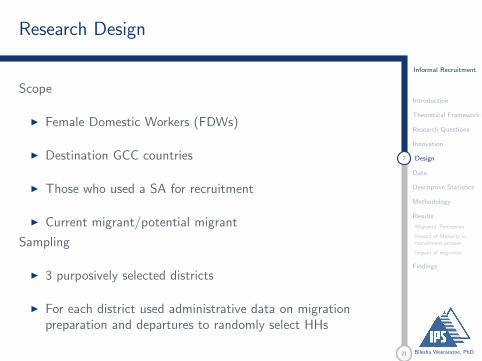
Research Design
Scope
I Female Domestic Workers (FDWs)
I Destination GCC countries
I Those who used a SA for recruitment
I Current migrant/potential migrant
Sampling
I 3 purposively selected districts
I For each district used administrative data on migrationpreparation and departures to randomly select HHs
21
Informal Recruitment
Introduction
Theoretical Framework
Research Questions
Innovation
Design
8 Data
Descriptive Statistics
Methodology
Results
Migrants’ Perception
Impact of Maturity inrecruitment process
Impact of migration
Findings
Bilesha Weeraratne, PhD.
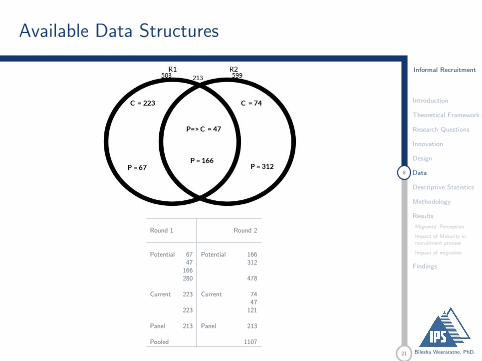
Available Data Structures
Round 1 Round 2
Potential 67 Potential 16647 312
166280 478
Current 223 Current 7447
223 121
Panel 213 Panel 213
Pooled 1107
21
Informal Recruitment
Introduction
Theoretical Framework
Research Questions
Innovation
Design
Data
9 Descriptive Statistics
Methodology
Results
Migrants’ Perception
Impact of Maturity inrecruitment process
Impact of migration
Findings
Bilesha Weeraratne, PhD.
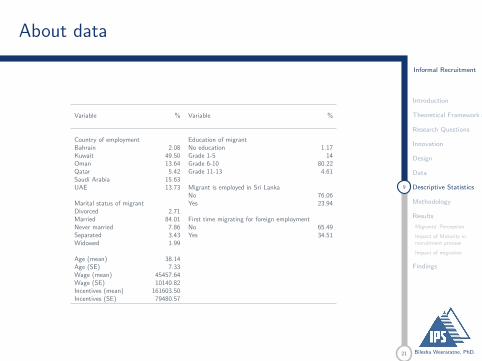
About data
Variable % Variable %
Country of employment Education of migrantBahrain 2.08 No education 1.17Kuwait 49.50 Grade 1-5 14Oman 13.64 Grade 6-10 80.22Qatar 5.42 Grade 11-13 4.61Saudi Arabia 15.63UAE 13.73 Migrant is employed in Sri Lanka
No 76.06Marital status of migrant Yes 23.94Divorced 2.71Married 84.01 First time migrating for foreign employmentNever married 7.86 No 65.49Separated 3.43 Yes 34.51Widowed 1.99
Age (mean) 38.14Age (SE) 7.33Wage (mean) 45457.64Wage (SE) 10140.82Incentives (mean) 161603.50Incentives (SE) 79480.57
21
Informal Recruitment
Introduction
Theoretical Framework
Research Questions
Innovation
Design
Data
10 Descriptive Statistics
Methodology
Results
Migrants’ Perception
Impact of Maturity inrecruitment process
Impact of migration
Findings
Bilesha Weeraratne, PhD.
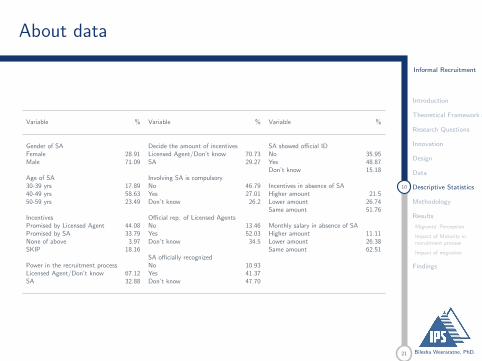
About data
Variable % Variable % Variable %
Gender of SA Decide the amount of incentives SA showed official IDFemale 28.91 Licensed Agent/Don’t know 70.73 No 35.95Male 71.09 SA 29.27 Yes 48.87
Don’t know 15.18Age of SA Involving SA is compulsory30-39 yrs 17.89 No 46.79 Incentives in absence of SA40-49 yrs 58.63 Yes 27.01 Higher amount 21.550-59 yrs 23.49 Don’t know 26.2 Lower amount 26.74
Same amount 51.76Incentives Official rep. of Licensed AgentsPromised by Licensed Agent 44.08 No 13.46 Monthly salary in absence of SAPromised by SA 33.79 Yes 52.03 Higher amount 11.11None of above 3.97 Don’t know 34.5 Lower amount 26.38SKIP 18.16 Same amount 62.51
SA officially recognizedPower in the recruitment process No 10.93Licensed Agent/Don’t know 67.12 Yes 41.37SA 32.88 Don’t know 47.70
21
Informal Recruitment
Introduction
Theoretical Framework
Research Questions
Innovation
Design
Data
Descriptive Statistics
11 Methodology
Results
Migrants’ Perception
Impact of Maturity inrecruitment process
Impact of migration
Findings
Bilesha Weeraratne, PhD.
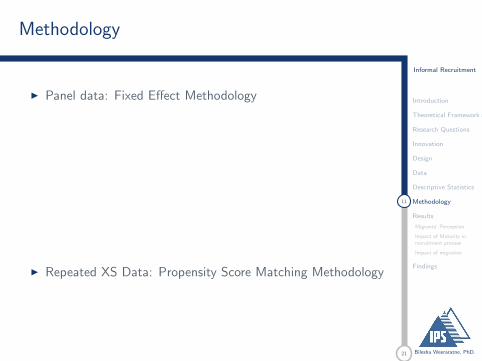
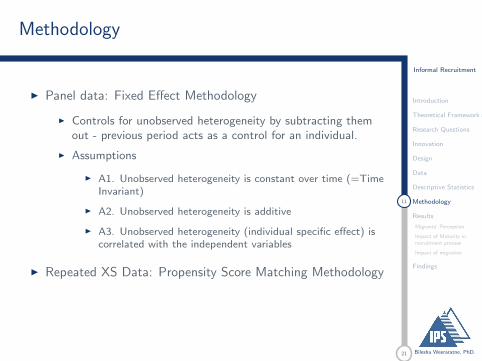
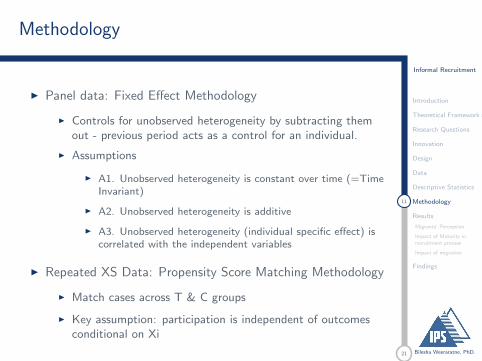
Methodology
I Panel data: Fixed Effect Methodology
I Controls for unobserved heterogeneity by subtracting themout - previous period acts as a control for an individual.
I Assumptions
I A1. Unobserved heterogeneity is constant over time (=TimeInvariant)
I A2. Unobserved heterogeneity is additive
I A3. Unobserved heterogeneity (individual specific effect) iscorrelated with the independent variables
I Repeated XS Data: Propensity Score Matching Methodology
I Match cases across T & C groups
I Key assumption: participation is independent of outcomesconditional on Xi
21
Informal Recruitment
Introduction
Theoretical Framework
Research Questions
Innovation
Design
Data
Descriptive Statistics
11 Methodology
Results
Migrants’ Perception
Impact of Maturity inrecruitment process
Impact of migration
Findings
Bilesha Weeraratne, PhD.
Methodology
I Panel data: Fixed Effect Methodology
I Controls for unobserved heterogeneity by subtracting themout - previous period acts as a control for an individual.
I Assumptions
I A1. Unobserved heterogeneity is constant over time (=TimeInvariant)
I A2. Unobserved heterogeneity is additive
I A3. Unobserved heterogeneity (individual specific effect) iscorrelated with the independent variables
I Repeated XS Data: Propensity Score Matching Methodology
I Match cases across T & C groups
I Key assumption: participation is independent of outcomesconditional on Xi
21
Informal Recruitment
Introduction
Theoretical Framework
Research Questions
Innovation
Design
Data
Descriptive Statistics
12 Methodology
Results
Migrants’ Perception
Impact of Maturity inrecruitment process
Impact of migration
Findings
Bilesha Weeraratne, PhD.
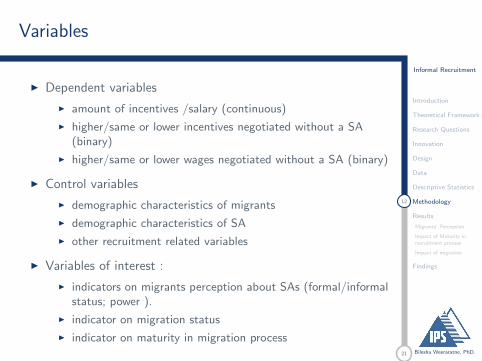
Variables
I Dependent variables
I amount of incentives /salary (continuous)
I higher/same or lower incentives negotiated without a SA(binary)
I higher/same or lower wages negotiated without a SA (binary)
I Control variables
I demographic characteristics of migrants
I demographic characteristics of SA
I other recruitment related variables
I Variables of interest :
I indicators on migrants perception about SAs (formal/informalstatus; power ).
I indicator on migration status
I indicator on maturity in migration process
21
Informal Recruitment
Introduction
Theoretical Framework
Research Questions
Innovation
Design
Data
Descriptive Statistics
Methodology
Results
13 Migrants’ Perception
Impact of Maturity inrecruitment process
Impact of migration
Findings
Bilesha Weeraratne, PhD.
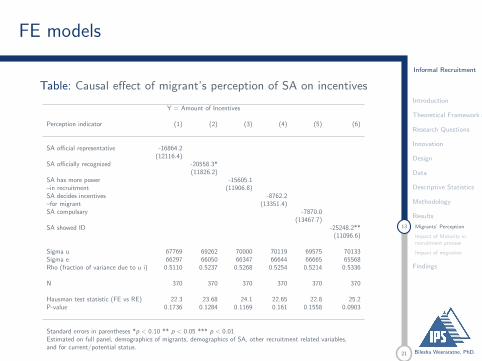
FE models
Table: Causal effect of migrant’s perception of SA on incentives
Y = Amount of Incentives
Perception indicator (1) (2) (3) (4) (5) (6)
SA official representative -16864.2(12116.4)
SA officially recognized -20558.3*(11826.2)
SA has more power -15605.1–in recruitment (11906.8)SA decides incentives -8762.2–for migrant (13351.4)SA compulsary -7870.0
(13467.7)SA showed ID -25248.2**
(11096.6)
Sigma u 67769 69262 70000 70119 69575 70133Sigma e 66297 66050 66347 66644 66665 65568Rho (fraction of variance due to u i) 0.5110 0.5237 0.5268 0.5254 0.5214 0.5336
N 370 370 370 370 370 370
Hausman test statistic (FE vs RE) 22.3 23.68 24.1 22.65 22.8 25.2P-value 0.1736 0.1284 0.1169 0.161 0.1558 0.0903
Standard errors in parentheses *p < 0.10 ** p < 0.05 *** p < 0.01Estimated on full panel, demographics of migrants, demographics of SA, other recruitment related variables,and for current/potential status.
21
Informal Recruitment
Introduction
Theoretical Framework
Research Questions
Innovation
Design
Data
Descriptive Statistics
Methodology
Results
14 Migrants’ Perception
Impact of Maturity inrecruitment process
Impact of migration
Findings
Bilesha Weeraratne, PhD.
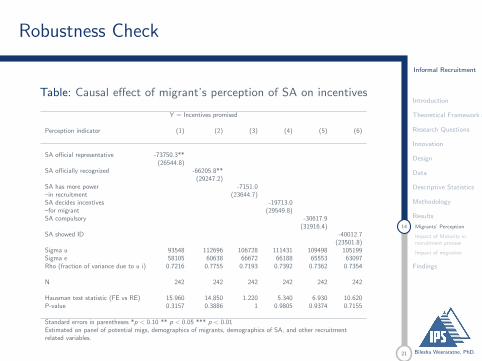
Robustness Check
Table: Causal effect of migrant’s perception of SA on incentives
Y = Incentives promised
Perception indicator (1) (2) (3) (4) (5) (6)
SA official representative -73750.3**(26544.8)
SA officially recognized -66205.8**(29247.2)
SA has more power -7151.0–in recruitment (23644.7)SA decides incentives -19713.0–for migrant (29549.8)SA compulsory -30617.9
(31916.4)SA showed ID -40012.7
(23501.8)Sigma u 93548 112696 106728 111431 109498 105199Sigma e 58105 60638 66672 66188 65553 63097Rho (fraction of variance due to u i) 0.7216 0.7755 0.7193 0.7392 0.7362 0.7354
N 242 242 242 242 242 242
Hausman test statistic (FE vs RE) 15.960 14.850 1.220 5.340 6.930 10.620P-value 0.3157 0.3886 1 0.9805 0.9374 0.7155
Standard errors in parentheses *p < 0.10 ** p < 0.05 *** p < 0.01Estimated on panel of potential migs, demographics of migrants, demographics of SA, and other recruitmentrelated variables.
21
Informal Recruitment
Introduction
Theoretical Framework
Research Questions
Innovation
Design
Data
Descriptive Statistics
Methodology
Results
15 Migrants’ Perception
Impact of Maturity inrecruitment process
Impact of migration
Findings
Bilesha Weeraratne, PhD.
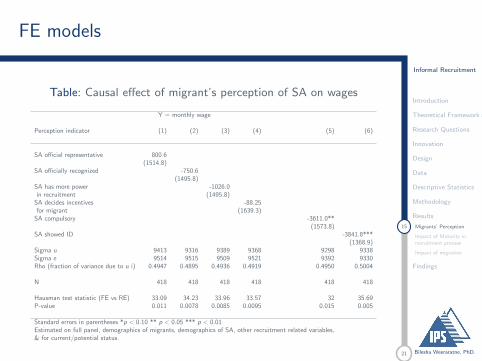
FE models
Table: Causal effect of migrant’s perception of SA on wages
Y = monthly wage
Perception indicator (1) (2) (3) (4) (5) (6)
SA official representative 800.6(1514.8)
SA officially recognized -750.6(1495.8)
SA has more power -1026.0in recruitment (1495.8)
SA decides incentives -88.25for migrant (1639.3)
SA compulsory -3611.0**(1573.8)
SA showed ID -3841.8***(1368.9)
Sigma u 9413 9316 9389 9368 9298 9338Sigma e 9514 9515 9509 9521 9392 9330Rho (fraction of variance due to u i) 0.4947 0.4895 0.4936 0.4919 0.4950 0.5004
N 418 418 418 418 418 418
Hausman test statistic (FE vs RE) 33.09 34.23 33.96 33.57 32 35.69P-value 0.011 0.0078 0.0085 0.0095 0.015 0.005
Standard errors in parentheses *p < 0.10 ** p < 0.05 *** p < 0.01Estimated on full panel, demographics of migrants, demographics of SA, other recruitment related variables,& for current/potential status.
21
Informal Recruitment
Introduction
Theoretical Framework
Research Questions
Innovation
Design
Data
Descriptive Statistics
Methodology
Results
16 Migrants’ Perception
Impact of Maturity inrecruitment process
Impact of migration
Findings
Bilesha Weeraratne, PhD.
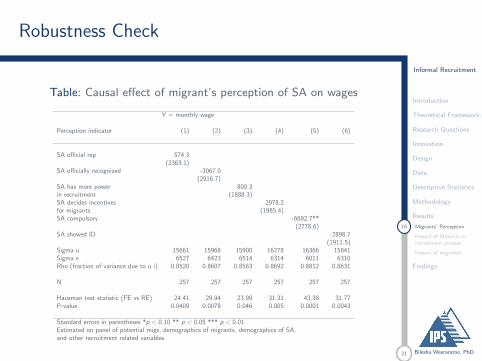
Robustness Check
Table: Causal effect of migrant’s perception of SA on wages
Y = monthly wage
Perception indicator (1) (2) (3) (4) (5) (6)
SA official rep 574.3(2363.1)
SA officially recognized -3067.0(2916.7)
SA has more power 800.3in recruitment (1888.3)SA decides incentives 2978.2for migrants (1985.4)SA compulsory -6692.7**
(2778.6)SA showed ID -2898.7
(1911.5)Sigma u 15661 15968 15900 16278 16366 15841Sigma e 6527 6423 6514 6314 6011 6310Rho (fraction of variance due to u i) 0.8520 0.8607 0.8563 0.8692 0.8812 0.8631
N 257 257 257 257 257 257
Hausman test statistic (FE vs RE) 24.41 29.94 23.99 31.31 43.38 31.77P-value 0.0409 0.0078 0.046 0.005 0.0001 0.0043
Standard errors in parentheses *p < 0.10 ** p < 0.05 *** p < 0.01Estimated on panel of potential migs, demographics of migrants, demographics of SA,and other recruitment related variables.
21
Informal Recruitment
Introduction
Theoretical Framework
Research Questions
Innovation
Design
Data
Descriptive Statistics
Methodology
Results
Migrants’ Perception
17 Impact of Maturity inrecruitment process
Impact of migration
Findings
Bilesha Weeraratne, PhD.
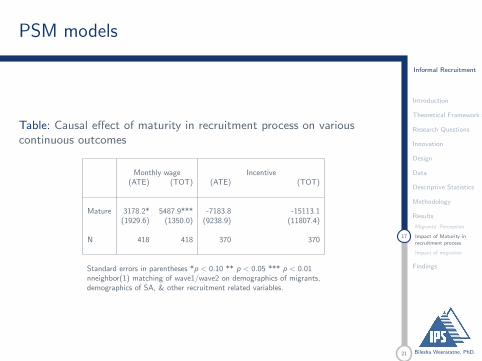
PSM models
Table: Causal effect of maturity in recruitment process on variouscontinuous outcomes
Monthly wage Incentive(ATE) (TOT) (ATE) (TOT)
Mature 3178.2* 5487.9*** -7183.8 -15113.1(1929.6) (1350.0) (9238.9) (11807.4)
N 418 418 370 370
Standard errors in parentheses *p < 0.10 ** p < 0.05 *** p < 0.01nneighbor(1) matching of wave1/wave2 on demographics of migrants,demographics of SA, & other recruitment related variables.
21
Informal Recruitment
Introduction
Theoretical Framework
Research Questions
Innovation
Design
Data
Descriptive Statistics
Methodology
Results
Migrants’ Perception
18 Impact of Maturity inrecruitment process
Impact of migration
Findings
Bilesha Weeraratne, PhD.
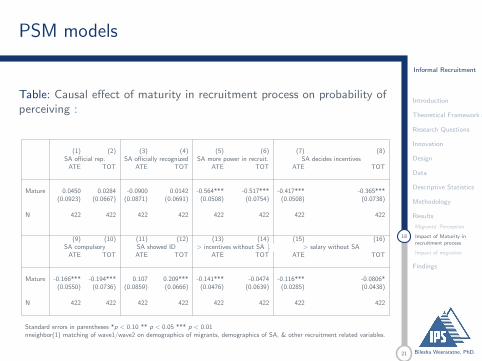
PSM models
Table: Causal effect of maturity in recruitment process on probability ofperceiving :
(1) (2) (3) (4) (5) (6) (7) (8)SA official rep. SA officially recognized SA more power in recruit. SA decides incentives
ATE TOT ATE TOT ATE TOT ATE TOT
Mature 0.0450 0.0284 -0.0900 0.0142 -0.564*** -0.517*** -0.417*** -0.365***(0.0923) (0.0667) (0.0871) (0.0691) (0.0508) (0.0754) (0.0508) (0.0738)
N 422 422 422 422 422 422 422 422
(9) (10) (11) (12) (13) (14) (15) (16)SA compulsory SA showed ID > incentives without SA . > salary without SA
ATE TOT ATE TOT ATE TOT ATE TOT
Mature -0.166*** -0.194*** 0.107 0.209*** -0.141*** -0.0474 -0.116*** -0.0806*(0.0550) (0.0736) (0.0859) (0.0666) (0.0476) (0.0639) (0.0285) (0.0438)
N 422 422 422 422 422 422 422 422
Standard errors in parentheses *p < 0.10 ** p < 0.05 *** p < 0.01nneighbor(1) matching of wave1/wave2 on demographics of migrants, demographics of SA, & other recruitment related variables.
21
Informal Recruitment
Introduction
Theoretical Framework
Research Questions
Innovation
Design
Data
Descriptive Statistics
Methodology
Results
Migrants’ Perception
Impact of Maturity inrecruitment process
19 Impact of migration
Findings
Bilesha Weeraratne, PhD.
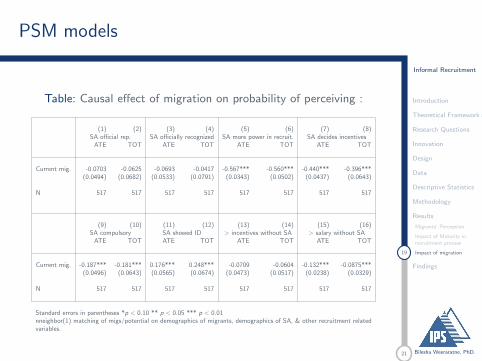
PSM models
Table: Causal effect of migration on probability of perceiving :
(1) (2) (3) (4) (5) (6) (7) (8)SA official rep. SA officially recognized SA more power in recruit. SA decides incentives
ATE TOT ATE TOT ATE TOT ATE TOT
Current mig. -0.0703 -0.0625 -0.0693 -0.0417 -0.567*** -0.560*** -0.440*** -0.396***(0.0494) (0.0682) (0.0533) (0.0791) (0.0343) (0.0502) (0.0437) (0.0643)
N 517 517 517 517 517 517 517 517
(9) (10) (11) (12) (13) (14) (15) (16)SA compulsory SA showed ID > incentives without SA > salary without SA
ATE TOT ATE TOT ATE TOT ATE TOT
Current mig. -0.187*** -0.181*** 0.176*** 0.248*** -0.0709 -0.0604 -0.132*** -0.0875***(0.0496) (0.0643) (0.0565) (0.0674) (0.0473) (0.0517) (0.0238) (0.0329)
N 517 517 517 517 517 517 517 517
Standard errors in parentheses *p < 0.10 ** p < 0.05 *** p < 0.01nneighbor(1) matching of migs/potential on demographics of migrants, demographics of SA, & other recruitment relatedvariables.
21
Informal Recruitment
Introduction
Theoretical Framework
Research Questions
Innovation
Design
Data
Descriptive Statistics
Methodology
Results
Migrants’ Perception
Impact of Maturity inrecruitment process
Impact of migration
20 Findings
Bilesha Weeraratne, PhD.
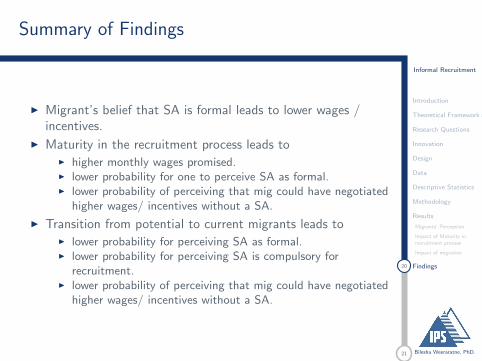
Summary of Findings
I Migrant’s belief that SA is formal leads to lower wages /incentives.
I Maturity in the recruitment process leads toI higher monthly wages promised.I lower probability for one to perceive SA as formal.I lower probability of perceiving that mig could have negotiated
higher wages/ incentives without a SA.
I Transition from potential to current migrants leads toI lower probability for perceiving SA as formal.I lower probability for perceiving SA is compulsory for
recruitment.I lower probability of perceiving that mig could have negotiated
higher wages/ incentives without a SA.
21
Informal Recruitment
Introduction
Theoretical Framework
Research Questions
Innovation
Design
Data
Descriptive Statistics
Methodology
Results
Migrants’ Perception
Impact of Maturity inrecruitment process
Impact of migration
21 Findings
Bilesha Weeraratne, PhD.
Policy Concerns
I Migrants take time in the recruitment process to distinguishformal vs informal recruitment intermediaries.
I Formalizing SA would lead to lower wages/incentives formigrants.
I Regulations for SA ought to spell out the role and capacity ofSAs in the recruitment process.
I Regulations for SA have to be widely disseminated topotential migrants.
I Better information on SA to potential migrants earlier on inthe recruitment process would lead to better migrationoutcomes.

Institute of Policy Studies of Sri Lanka100/20 Independence Avenue
Colombo 7, Sri LankaT: +94-112-143-100
www.ips.lk