Embed Size (px)
Citation preview
Molecular Ecology (2005)
14
, 1095–1108 doi: 10.1111/j.1365-294X.2005.02471.x
© 2005 Blackwell Publishing Ltd
Blackwell Publishing, Ltd.
Tracing an invasion: landbridges, refugia, and the phylogeography of the Neotropical rattlesnake (Serpentes: Viperidae:
Crotalus durissus
)
WOLFGANG WÜSTER,
*
JULIA E . FERGUSON,
*
J . ADRIAN QUIJADA-MASCAREÑAS,
*
CATHARINE E . POOK,
*
MARIA DA GRAÇA SALOMÃO
†
and ROGER S . THORPE
*
*
School of Biological Sciences, University of Wales, Bangor LL57 2UW, Wales, UK,
†
Laboratório de Herpetologia, Instituto Butantan, Avenida Vital Brazil 1500, 05503–900 São Paulo — SP, Brazil
Abstract
Pleistocene fragmentation of the Amazonian rainforest has been hypothesized to be amajor cause of Neotropical speciation and diversity. However, the role and even the realityof Pleistocene forest refugia have attracted much scepticism. In Amazonia, previous phylo-geographical studies have focused mostly on organisms found in the forests themselves,and generally found speciation events to have predated the Pleistocene. However, molecularstudies of open-formation taxa found both north and south of the Amazonian forests, prob-ably because of vicariance resulting from expansion of the rainforests, may provide novelinsights into the age of continuous forest cover across the Amazon basin. Here, we analysethree mitochondrial genes to infer the phylogeography of one such trans-Amazonian vicar-iant, the Neotropical rattlesnake (
Crotalus durissus
), which occupies primarily seasonalformations from Mexico to Argentina, but avoids the rainforests of Central and tropicalSouth America. The phylogeographical pattern is consistent with gradual dispersal alongthe Central American Isthmus, followed by more rapid dispersal into and across SouthAmerica after the uplift of the Isthmus of Panamá. Low sequence divergence between popu-lations from north and south of the Amazon rainforest is consistent with mid-Pleistocenedivergence, approximately 1.1 million years ago (Ma). This suggests that the Amazonianrainforests must have become fragmented or at least shrunk considerably during thatperiod, lending support to the Pleistocene refugia theory as an important cause of distribu-tion patterns, if not necessarily speciation, in Amazonian forest organisms. These resultshighlight the potential of nonforest species to contribute to an understanding of the historyof the Amazonian rainforests themselves.
Keywords
: Amazonia; biogeography;
Crotalus durissus
, Isthmus of Panamá, phylogeography,Pleistocene refugia
Received 27 October 2004; revision received 17 December 2004; accepted 17 December 2004
Introduction
The Neotropical region is one of the most biologicallydiverse parts on Earth. Three major biogeographicalevents have been highlighted as key factors in causingpresent-day patterns of distribution and diversity: theuplift of the Andes, the emergence of the Isthmus of Panamá,and Pleistocene climatic and vegetational fluctuations intropical South America.
The final uplift of the Andes in the late Tertiary (Gregory-Wodzicki 2000) created a formidable barrier between thePacific and Amazonian lowlands of South America, separ-ating the flora and fauna of the Pacific lowlands from thatof the eastern versant and the Amazonian lowlands on theeastern side.
The late-Tertiary uplift of the Isthmus of Panamá abovesea level led to the final closure of the Central AmericanSeaway approximately 3.5–3 million years ago (Ma) (Coates& Obando 1996). This connected the North and SouthAmerican landmasses, previously isolated through muchof the Cainozoic, and resulted in a large-scale dispersal of
Correspondence: Wolfgang Wüster, Fax: +44 1248 371644; E-mail:[email protected]
1096
W . W Ü S T E R
E T A L .
© 2005 Blackwell Publishing Ltd,
Molecular Ecology
, 14, 1095–1108
terrestrial faunal elements, a phenomenon referred to asthe great American biotic interchange (GABI) (Marshall
et al
. 1979; Stehli & Webb 1985; Webb & Rancy 1996). Thisphenomenon was particularly marked in mammals, wheremuch of the evidence suggests two phases of faunal inter-change, beginning approximately 2.5 Ma. In contrast, inreptiles, there is evidence that many taxa, including severalgroups of pit vipers, dispersed from North to South Amer-ica (or vice versa) throughout the late Cainozoic, from theOligocene onwards (Estes & Báez 1985; Zamudio & Greene1997; Wüster
et al
. 2002).Despite the intensity of discussion of the GABI, there
have been few detailed phylogeographical studies oforganisms likely to have participated in the interchange.No published phylogeographical studies of Neotropicalorganisms have shown the pattern that might be predictedfor such a colonization event: a paraphyletic and highlydivergent set of mitochondrial DNA (mtDNA) haplotypeclades in the continent of origin, and a monophyletic setof haplotypes (or several in case of multiple colonizationevents) in the colonized continent nested within them,with levels of sequence divergence consistent with latePliocene cladogenesis.
The third major event hypothesized to have affectedNeotropical diversity patterns is the series of global climaticfluctuations that occurred throughout the late Pliocene andPleistocene (Potts & Behrensmeyer 1992). However, boththeir nature and their importance in affecting Neotropicalbiodiversity remain hotly contested. The Pleistocene refu-gia hypothesis states that drier climatic phases caused afragmentation of the Amazonian rainforest into forestrefugia isolated by savannahs, leading to increased diversitydue to allopatric speciation among forest species (Haffer1969; Prance 1973). However, the nature, significance, andeven reality of Pleistocene rainforest fragmentation remainhighly controversial (Colinvaux
et al
. 2000, 2001; Haffer &Prance 2001; Hooghiemstra 2001). In particular, critics ofthe hypothesis state that, at least during the Last GlacialMaximum (LGM), palynological evidence provides littlesupport for widespread savannah vegetation in Amazonia(e.g. Colinvaux
et al
. 1996, 2001; Kastner & Goñi 2003),speciation in many widespread Neotropical species com-plexes predates the Pleistocene climatic fluctuations, oftenby a considerable margin (reviewed by Moritz
et al
. 2000),and the expected genetic consequences of postrefugialQuaternary range expansion, so widespread in temperatebiota (e.g. Hewitt 2004), have not been detected inNeotropical forest mammals, at least in the southwesternAmazon (Lessa
et al
. 2003).Most previous studies seeking to elucidate the biogeo-
graphical history of the Amazonian rainforests by meansof genetic methods understandably focused on speciesfound within these forests, and dates of speciation in them(Moritz
et al
. 2000), and generally ignored species occurring
outside the rainforests (Pennington
et al
. 2000). However,taxa occuring both north and south of Amazonia, but notinside, can potentially provide more definitive informationon rainforest fragmentation than the rainforest speciesthemselves (Pennington
et al
. 2004). Pre-Pleistocene speci-ation in rainforest taxa only indicates that Pleistocenefragmentation did not cause the speciation event, butcannot disprove its occurrence. However, vicariant non-rainforest taxa separated by the Amazonian forest musthave had a contiguous distribution at some point in thepast. The time of this vicariance represents the maximumage for the last genetic exchange across the Amazon: therainforest must have been fragmented at that time, andcontinuous forest cover cannot predate that time. Thus,evidence of recent continuous distributions in presentlyvicariant nonrainforest organisms would representunambiguous evidence of recent rainforest fragmenta-tion or contraction. The times of such vicariance events canbe inferred using molecular methods, a line of research thathas undergone considerable development in recent years(e.g. Sanderson 2002, 2003; Yang & Yoder 2003).
A promising organism for a phylogenetic study of theeffects of both the GABI and possible Pleistocene rainforestfragmentation in the Amazon Basin is the
Crotalus durissus
(Neotropical rattlesnake) complex. These snakes occur inseasonally dry formations from Mexico to northern Argen-tina, but are absent from the Central American andAmazonian rainforests, resulting in a highly disjunct dis-tribution (Campbell & Lamar 1989, 2004). Rattlesnakes area primarily Nearctic clade that probably originated innorth central Mexico (Place & Abramson 2004), the
C. durissus
complex being the only representative to extend south ofMexico. Post-isthmian dispersal by
C. durissus
from Centralto South America has been assumed by various authors(e.g. Estes & Báez 1985; Vanzolini & Heyer 1985), andcorroborated by a preliminary phylogeographical study(Wüster
et al
. 2002).The highly discontinuous distribution of
C. durissus
inSouth America, including open habitats both north andsouth of the Amazon rainforest as well as isolated openformations within it, but avoiding the forest itself, addsconsiderable interest to a phylogeographical study ofthe complex. Large rattlesnakes are unlikely candidates foraeolian dispersal, and oceanic dispersal around the coast ofnortheastern South America is equally unlikely, as the pre-vailing North Brazil current runs southeast to northwest,against the direction of dispersal. Consequently, the dis-continuous distribution of
C. durissus
is most likely dueto vicariance, the timing of which can be inferred usingmolecular methods. Here, we present an mtDNA-basedphylogeographical study of the
C. durissus
complex, withthe specific objective of elucidating the timing of thevicariance between populations from north and south ofthe Amazon rainforests.
P H Y L O G E O G R A P H Y O F T H E N E O T R O P I C A L R A T T L E S N A K E
1097
© 2005 Blackwell Publishing Ltd,
Molecular Ecology
, 14, 1095–1108
Materials and methods
Sampling, molecular methods
We obtained tissue (ventral scale clippings), blood samples,or shed skins from specimens covering most of the range ofthe
Crotalus durissus
complex, as well as of the related
C. molossus-basiliscus
group (Murphy
et al
. 2002): reportedhybridization between that group and
C. durissus
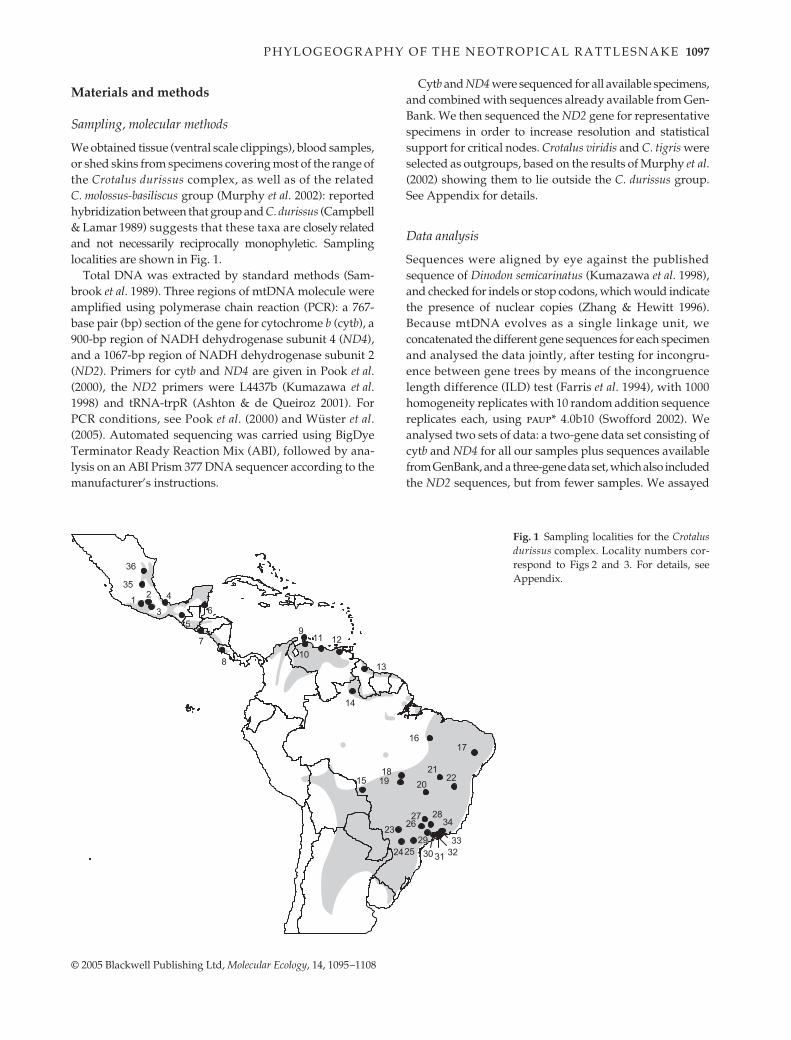
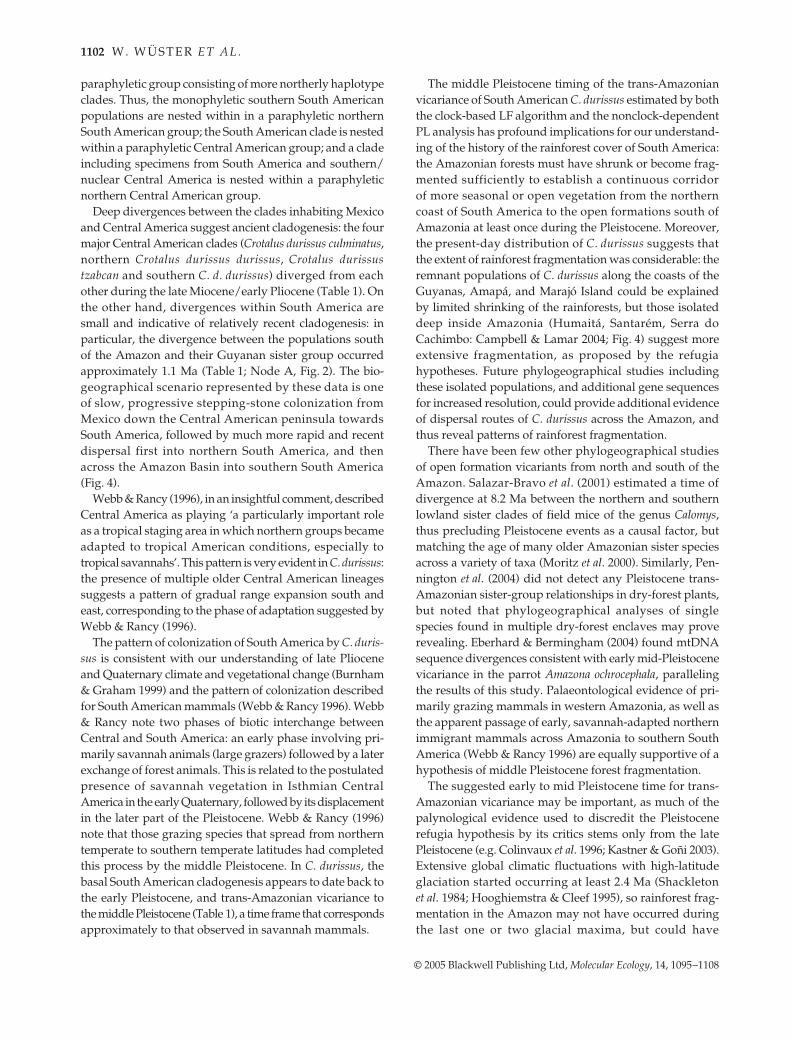
(Campbell& Lamar 1989) suggests that these taxa are closely relatedand not necessarily reciprocally monophyletic. Samplinglocalities are shown in Fig. 1.
Total DNA was extracted by standard methods (Sam-brook
et al
. 1989). Three regions of mtDNA molecule wereamplified using polymerase chain reaction (PCR): a 767-base pair (bp) section of the gene for cytochrome
b
(cyt
b
), a900-bp region of NADH dehydrogenase subunit 4 (
ND4
),and a 1067-bp region of NADH dehydrogenase subunit 2(
ND2
). Primers for cyt
b
and
ND4
are given in Pook
et al
.(2000), the
ND2
primers were L4437b (Kumazawa
et al
.1998) and tRNA-trpR (Ashton & de Queiroz 2001). ForPCR conditions, see Pook
et al
. (2000) and Wüster
et al
.(2005). Automated sequencing was carried using BigDyeTerminator Ready Reaction Mix (ABI), followed by ana-lysis on an ABI Prism 377 DNA sequencer according to themanufacturer’s instructions.
Cyt
b
and
ND4
were sequenced for all available specimens,and combined with sequences already available from Gen-Bank. We then sequenced the
ND2
gene for representativespecimens in order to increase resolution and statisticalsupport for critical nodes.
Crotalus viridis
and
C. tigris
wereselected as outgroups, based on the results of Murphy
et al
.(2002) showing them to lie outside the
C. durissus
group.See Appendix for details.
Data analysis
Sequences were aligned by eye against the publishedsequence of
Dinodon semicarinatus
(Kumazawa
et al
. 1998),and checked for indels or stop codons, which would indicatethe presence of nuclear copies (Zhang & Hewitt 1996).Because mtDNA evolves as a single linkage unit, weconcatenated the different gene sequences for each specimenand analysed the data jointly, after testing for incongru-ence between gene trees by means of the incongruencelength difference (ILD) test (Farris
et al
. 1994), with 1000homogeneity replicates with 10 random addition sequencereplicates each, using
paup
* 4.0b10 (Swofford 2002). Weanalysed two sets of data: a two-gene data set consisting ofcyt
b
and
ND4
for all our samples plus sequences availablefrom GenBank, and a three-gene data set, which also includedthe
ND2
sequences, but from fewer samples. We assayed
Fig. 1 Sampling localities for the Crotalusdurissus complex. Locality numbers cor-respond to Figs 2 and 3. For details, seeAppendix.
1098
W . W Ü S T E R
E T A L .
© 2005 Blackwell Publishing Ltd,
Molecular Ecology
, 14, 1095–1108
for the presence of a significant phylogenetic signal by meansof the g1 tree skewness statistic (Hillis & Huelsenbeck1992), calculated from 100 000 random trees generated by
paup
*.The phylogeny of the complex was inferred using
maximum parsimony (MP), maximum likelihood (ML), andBayesian approaches. MP and ML analyses were per-formed using
paup
*, and Bayesian analysis using
mrbayes
version 3.0 (Ronquist & Huelsenbeck 2003).MP analysis involved heuristic searching with tree
bisection-reconnection (TBR) branch swapping and 10 000random addition sequence replicates. Internal support fornodes was assessed using nonparametric bootstrap ana-lysis (Felsenstein 1985) under exclusion of uninformativecharacters, using 1000 bootstrap replicates with five ran-dom addition sequence replicates each and TBR (threegenes) or SPR (two genes) branch swapping. Branchsupport values (Bremer 1994) were calculated through theconverse constraint option of
paup
*.For ML analyses, the appropriate model of sequence
evolution was estimated using
modeltest
3.0 (Posada &Crandall 1998). We selected the model giving the highestlikelihood score, and fixed the parameters in a heuristicML search, using a neighbour-joining (NJ) starting treeand TBR branch swapping. We then re-estimated theparameters from the resulting ML tree, and ran anotherheuristic search using these new settings and 10 randomaddition sequence replicates. ML bootstrapping involved500 (three genes) or 100 (two genes) replicates, NJ startingtrees, and nearest neighbour-interchange (NNI) branchswapping.
For Bayesian analysis, we used the model of sequenceevolution estimated by
modeltest
, while allowingthe analysis to estimate the relevant parameter values.Searches were run using four chains, over 2 million (2-genedata) or 5 million (3-gene data) generations, samplingevery 1000th tree. Burn-in, the time taken for the para-meters to reach stationarity, was estimated by plotting treelog-likelihood score against generation number, and deter-mining the number of generations required to reach anasymptote. Trees sampled before completion of burn-inand a buffer period of nine times the burn-in period werediscarded. The searches were run five times with randomstarting trees and results compared.
Because sequence information was available for more
C.durissus
specimens and other taxa for cyt
b
and
ND4
thanfor
ND2
, we used the two-gene data for the dating ofbiogeographically relevant nodes on the tree. Dating thenodes of a tree requires calibration points. Since there areno well-dated nodes that could serve as calibration pointsin the
Crotalus
phylogeny, we re-estimated the model ofsequence evolution and re-ran the 2-gene ML analysisunder inclusion of additional taxa that furnished appropri-ate calibration points:
1
We included sequences from three South Americanpopulations of the genus
Porthidium
, which postdate theuplift of the Isthmus of Panamá (Wüster
et al
. 2002), andfixed their basal divergence at 3.5 Ma.
2
Based on palaeontological evidence (Szyndlar & Rage1990), we included sequences of two Asiatic cobras (
Najanaja
and
Naja kaouthia
) and two African cobras (
Najanigricollis
and
Naja nivea
), and constrained the diver-gence between the Asian species and their African sistergroup to a minimum age of 16 million years (Myr).
3
The divergence between the Elapidae and the Viperidaewas constrained to 95 Ma or later, based on the earliestcolubroid fossils from the Cenomanian (Rage
et al
.2003).
To assess the age of relevant nodes, we calculated esti-mates of time of divergence with confidence limits usingthe Langley–Fitch (LF) method (Langley & Fitch 1974), whichreconstructs divergence times under the assumption of amolecular clock, and the semiparametric, penalized likeli-hood (PL) method (Sanderson 2002), which makes noassumptions of clock-like sequence evolution. Both meth-ods used the truncated Newton (TN) algorithm, and wereimplemented in the program
r
8
s
(Sanderson 2003).
Results
Sequence analysis
For the two-gene analysis, we aligned 1332 bp (657 bp of
ND4
and 675 bp of cyt
b
) from 82 specimens (includingoutgroups), which yielded 59 unique haplotypes. Forthe three-gene analysis, we aligned an additional 671bp of
ND2
gene sequence, resulting in 39 haplotypes from41 specimens. Sample, haplotype and GenBank Accessionnos are in Appendix. The sequences contained no non-sense codons, indels or frameshifts. High transition:trans-version ratios and the expected excess of third codon positionsubstitutions confirmed their mitochondrial origin.
The two-gene data contained 459 variable and 365 parsimony-informative positions, the three-gene data contained 615variable and 417 parsimony-informative positions. The100 000 random trees generated from the two-gene andthree-gene data showed a highly skewed distribution (g1 =
−
0.4705 and g1 =
−
0.8579), indicating a significant phylo-genetic signal (
P <
0.01; Hillis & Huelsenbeck 1992). TheILD test provided no indication of incongruence betweenthe three genes (
P =
0.892), validating the joint analysis ofall three gene sequences.
Phylogenetic analysis and dating
The two-gene MP analysis yielded 601 equally mostparsimonious trees (EMPTs) of 1066 steps (c.i. = 0.4747,
P H Y L O G E O G R A P H Y O F T H E N E O T R O P I C A L R A T T L E S N A K E
1099
© 2005 Blackwell Publishing Ltd,
Molecular Ecology
, 14, 1095–1108
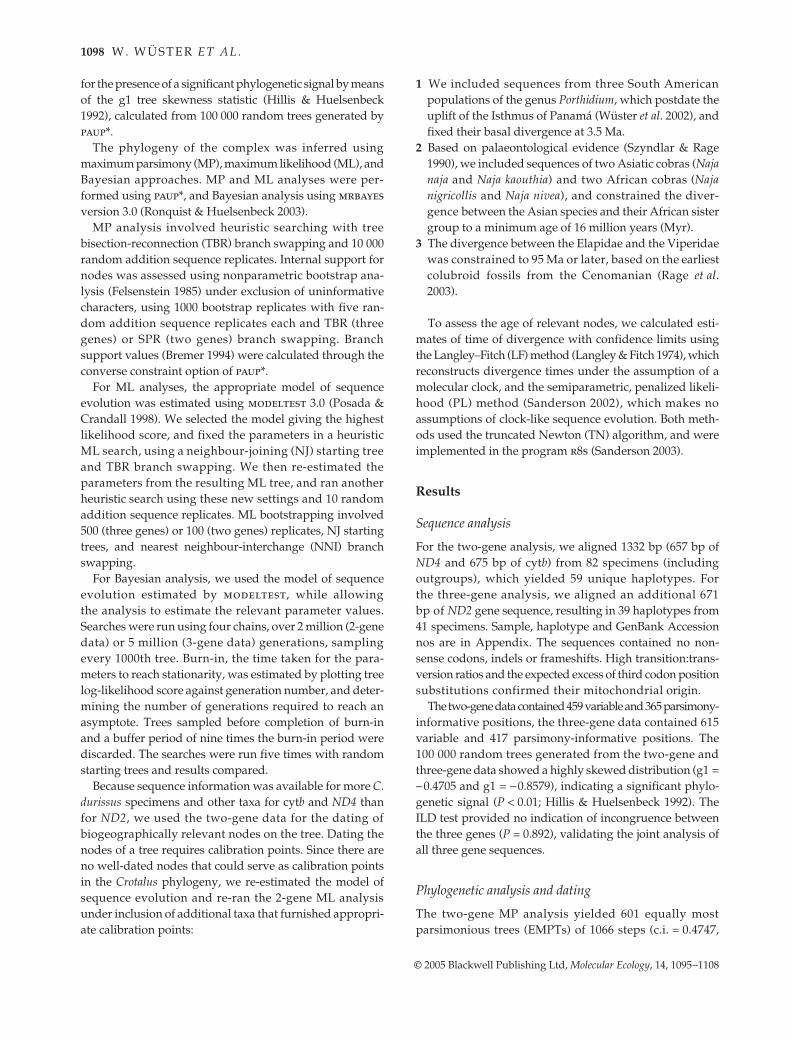
r.i. = 0.8329), and the three-gene analysis 64 EMPTsof 1201 steps (c.i. = 0.5167; r.i. = 0.7627). For ML analysis,the
modeltest
program selected the GTR + I +
Γ
modelas optimal for both data sets. The resulting trees are shownin Figs 2 and 3, and the distribution of clades is mapped inFig. 4. MP and ML analyses agreed on all robustly supportednodes, differences being restricted to minor rearrangements
within the major clades and lack of resolution in the
totonacus-basiliscus-molossus
group in the case of MP.Bayesian analyses completed burn-in after approximately
10 000 generations for both data sets, but we conservativelydiscarded the first 100 000 generations. Multiple randomstarting tree replicates yielded virtually identical likelihoodestimates and tree topologies.
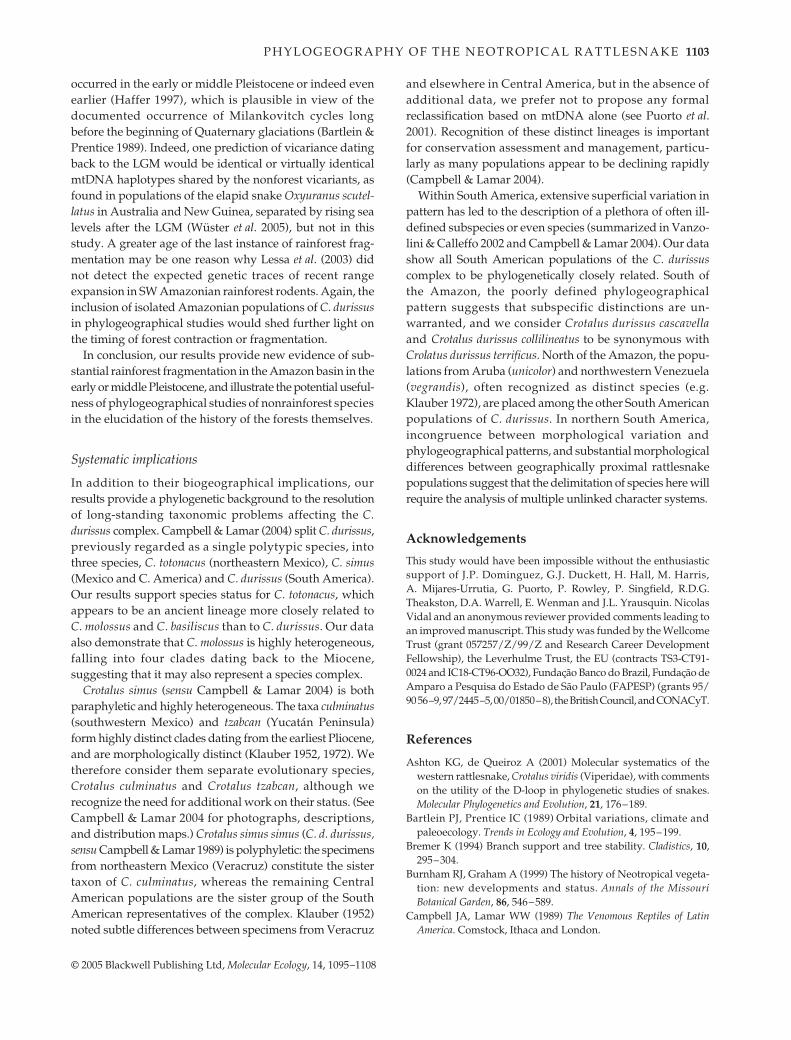
Fig. 2 Maximum-likelihood phylogram ofthe two-gene analysis (–ln L = 7091.51851).Tip labels are as follows: haplotype name(see Appendix), 3-letter subspecies codefor the Crotalus durissus complex, followingCampbell & Lamar (1989) (cas, cascavella;col, collilineatus; cul, culminatus; cum,cumanensis; dry, dryinas; dur, durissus;ter, terrificus; tza, tzabcan; uni, unicolor; veg,vegrandis), and, in brackets, locality code(numbers correspond to Fig. 1). Samplesfrom South America are underlined, boldtype indicates haplotypes from south ofthe Amazon, for details, see Appendix.Numbers along branches indicate Bremersupport/MP bootstrap support/MLbootstrap support/percentage Bayesianposterior probability. Dates of nodesare penalized likelihood estimates (seeTable 1). For clarity, support is only shownfor important nodes; ns, not supported, na,not applicable.
1100 W . W Ü S T E R E T A L .
© 2005 Blackwell Publishing Ltd, Molecular Ecology, 14, 1095–1108
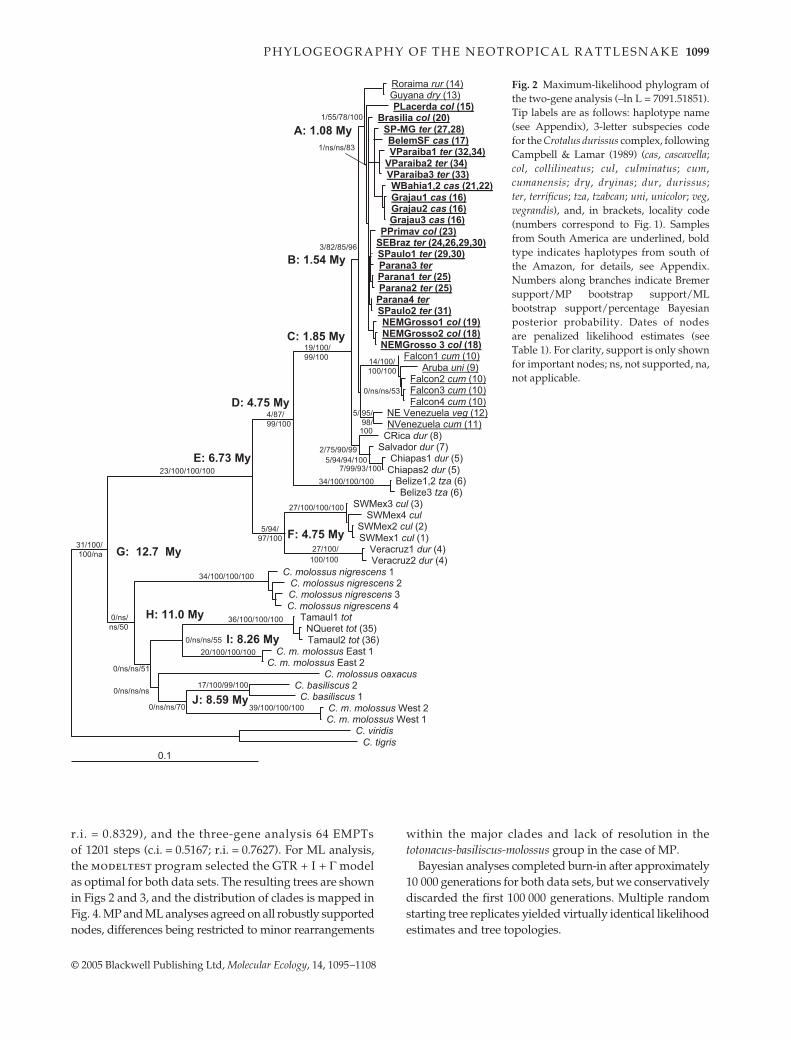
All trees agreed on the following biologically relevantaspects of the phylogeny of the complex:
1 The basic pattern consists of the sequential hierarchicalnesting of southern haplotype clades within paraphyleticnorthern groups across South and Central America(strongly supported).
2 Monophyly and low levels of sequence divergence withinSouth America, contrasted with paraphyly and high levelsof divergence in Central America (strongly supported).
3 Monophyly of the populations from south of the Amazon(weakly supported), nested within a paraphyletic north-ern South American assemblage (strongly supportedin ML and Bayesian analyses).
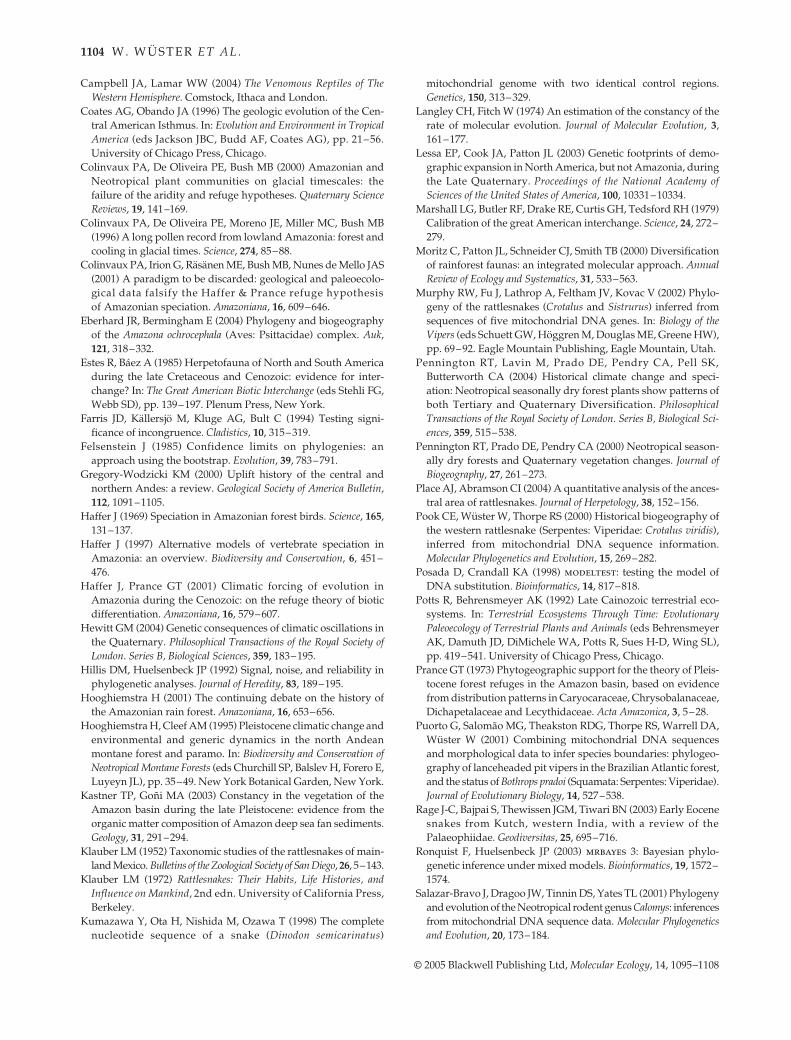
Fig. 3 Maximum-likelihood phylogram ofthe three-gene analysis. –ln L = 8616.50208.See Fig. 2 for explanations.
P H Y L O G E O G R A P H Y O F T H E N E O T R O P I C A L R A T T L E S N A K E 1101
© 2005 Blackwell Publishing Ltd, Molecular Ecology, 14, 1095–1108
4 Polyphyly of the Crotalus durissus complex, in that theCrotalus durissus totonacus haplotypes are nested amongsequences of Crotalus molossus and Crotalus basiliscus, notwith other C. durissus.
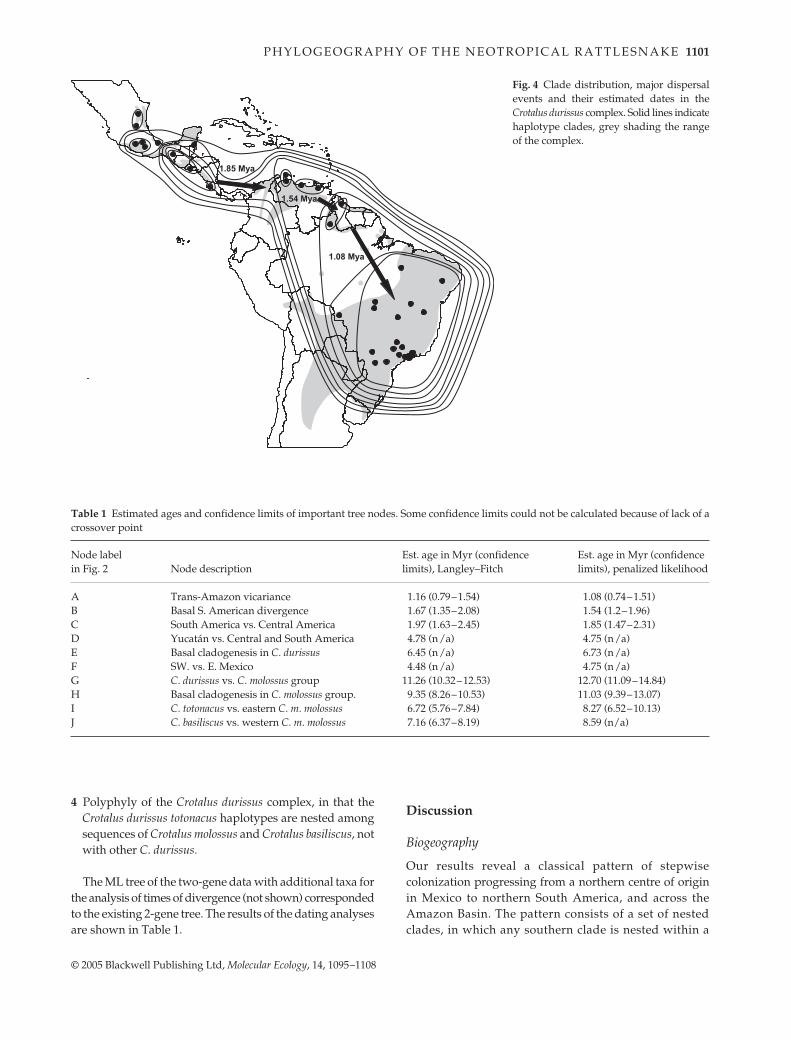
The ML tree of the two-gene data with additional taxa forthe analysis of times of divergence (not shown) correspondedto the existing 2-gene tree. The results of the dating analysesare shown in Table 1.
Discussion
Biogeography
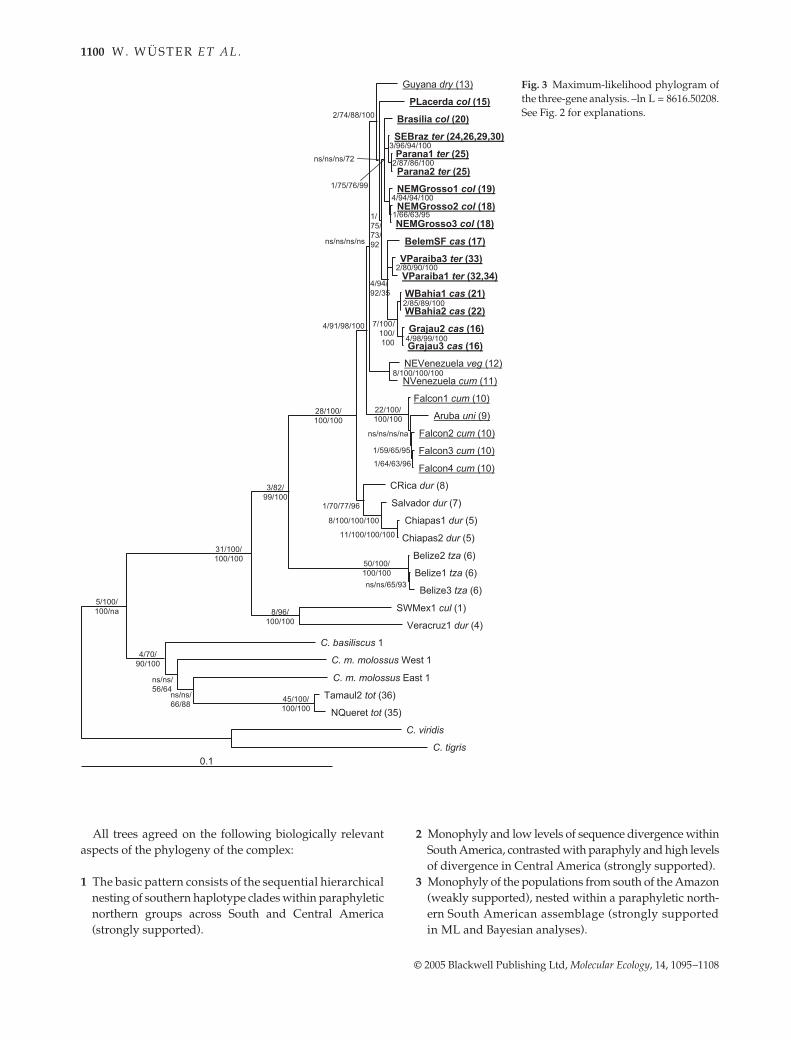
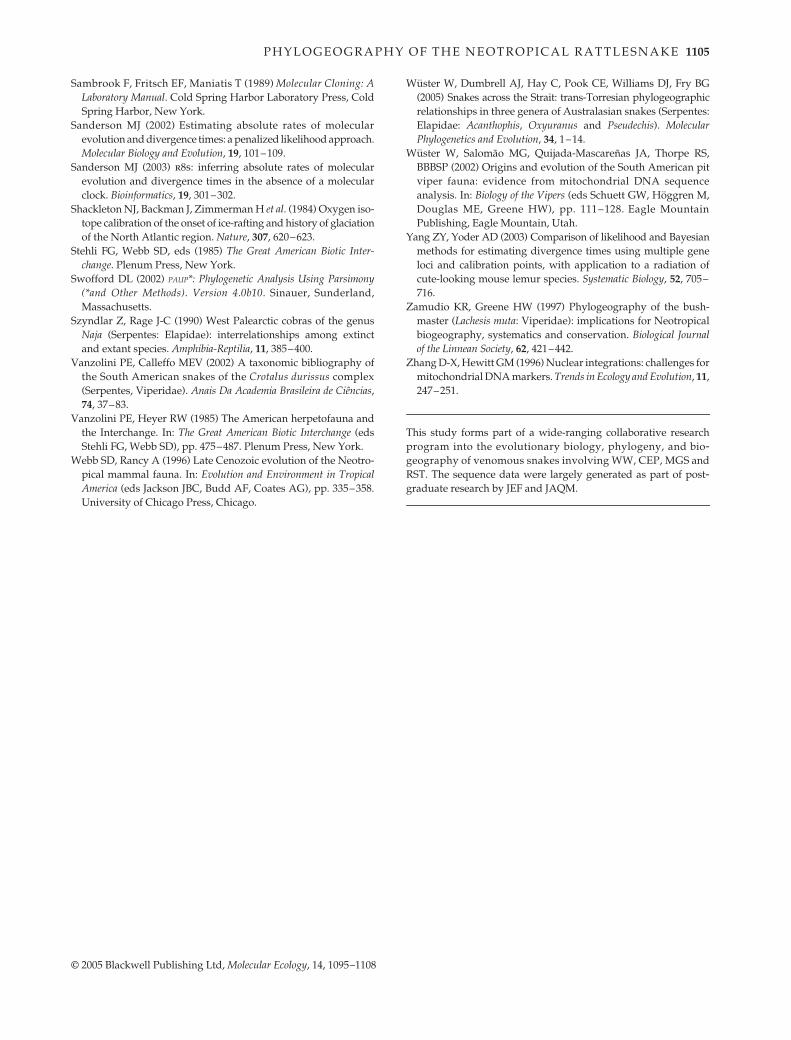
Our results reveal a classical pattern of stepwisecolonization progressing from a northern centre of originin Mexico to northern South America, and across theAmazon Basin. The pattern consists of a set of nestedclades, in which any southern clade is nested within a
Fig. 4 Clade distribution, major dispersalevents and their estimated dates in theCrotalus durissus complex. Solid lines indicatehaplotype clades, grey shading the rangeof the complex.
Table 1 Estimated ages and confidence limits of important tree nodes. Some confidence limits could not be calculated because of lack of acrossover point
Node label in Fig. 2 Node description
Est. age in Myr (confidence limits), Langley–Fitch
Est. age in Myr (confidence limits), penalized likelihood
A Trans-Amazon vicariance 1.16 (0.79–1.54) 1.08 (0.74–1.51)B Basal S. American divergence 1.67 (1.35–2.08) 1.54 (1.2–1.96)C South America vs. Central America 1.97 (1.63–2.45) 1.85 (1.47–2.31)D Yucatán vs. Central and South America 4.78 (n/a) 4.75 (n/a)E Basal cladogenesis in C. durissus 6.45 (n/a) 6.73 (n/a)F SW. vs. E. Mexico 4.48 (n/a) 4.75 (n/a)G C. durissus vs. C. molossus group 11.26 (10.32–12.53) 12.70 (11.09–14.84)H Basal cladogenesis in C. molossus group. 9.35 (8.26–10.53) 11.03 (9.39–13.07)I C. totonacus vs. eastern C. m. molossus 6.72 (5.76–7.84) 8.27 (6.52–10.13)J C. basiliscus vs. western C. m. molossus 7.16 (6.37–8.19) 8.59 (n/a)
1102 W . W Ü S T E R E T A L .
© 2005 Blackwell Publishing Ltd, Molecular Ecology, 14, 1095–1108
paraphyletic group consisting of more northerly haplotypeclades. Thus, the monophyletic southern South Americanpopulations are nested within in a paraphyletic northernSouth American group; the South American clade is nestedwithin a paraphyletic Central American group; and a cladeincluding specimens from South America and southern/nuclear Central America is nested within a paraphyleticnorthern Central American group.
Deep divergences between the clades inhabiting Mexicoand Central America suggest ancient cladogenesis: the fourmajor Central American clades (Crotalus durissus culminatus,northern Crotalus durissus durissus, Crotalus durissustzabcan and southern C. d. durissus) diverged from eachother during the late Miocene/early Pliocene (Table 1). Onthe other hand, divergences within South America aresmall and indicative of relatively recent cladogenesis: inparticular, the divergence between the populations southof the Amazon and their Guyanan sister group occurredapproximately 1.1 Ma (Table 1; Node A, Fig. 2). The bio-geographical scenario represented by these data is oneof slow, progressive stepping-stone colonization fromMexico down the Central American peninsula towardsSouth America, followed by much more rapid and recentdispersal first into northern South America, and thenacross the Amazon Basin into southern South America(Fig. 4).
Webb & Rancy (1996), in an insightful comment, describedCentral America as playing ‘a particularly important roleas a tropical staging area in which northern groups becameadapted to tropical American conditions, especially totropical savannahs’. This pattern is very evident in C. durissus:the presence of multiple older Central American lineagessuggests a pattern of gradual range expansion south andeast, corresponding to the phase of adaptation suggested byWebb & Rancy (1996).
The pattern of colonization of South America by C. duris-sus is consistent with our understanding of late Plioceneand Quaternary climate and vegetational change (Burnham& Graham 1999) and the pattern of colonization describedfor South American mammals (Webb & Rancy 1996). Webb& Rancy note two phases of biotic interchange betweenCentral and South America: an early phase involving pri-marily savannah animals (large grazers) followed by a laterexchange of forest animals. This is related to the postulatedpresence of savannah vegetation in Isthmian CentralAmerica in the early Quaternary, followed by its displacementin the later part of the Pleistocene. Webb & Rancy (1996)note that those grazing species that spread from northerntemperate to southern temperate latitudes had completedthis process by the middle Pleistocene. In C. durissus, thebasal South American cladogenesis appears to date back tothe early Pleistocene, and trans-Amazonian vicariance tothe middle Pleistocene (Table 1), a time frame that correspondsapproximately to that observed in savannah mammals.
The middle Pleistocene timing of the trans-Amazonianvicariance of South American C. durissus estimated by boththe clock-based LF algorithm and the nonclock-dependentPL analysis has profound implications for our understand-ing of the history of the rainforest cover of South America:the Amazonian forests must have shrunk or become frag-mented sufficiently to establish a continuous corridorof more seasonal or open vegetation from the northerncoast of South America to the open formations south ofAmazonia at least once during the Pleistocene. Moreover,the present-day distribution of C. durissus suggests thatthe extent of rainforest fragmentation was considerable: theremnant populations of C. durissus along the coasts of theGuyanas, Amapá, and Marajó Island could be explainedby limited shrinking of the rainforests, but those isolateddeep inside Amazonia (Humaitá, Santarém, Serra doCachimbo: Campbell & Lamar 2004; Fig. 4) suggest moreextensive fragmentation, as proposed by the refugiahypotheses. Future phylogeographical studies includingthese isolated populations, and additional gene sequencesfor increased resolution, could provide additional evidenceof dispersal routes of C. durissus across the Amazon, andthus reveal patterns of rainforest fragmentation.
There have been few other phylogeographical studiesof open formation vicariants from north and south of theAmazon. Salazar-Bravo et al. (2001) estimated a time ofdivergence at 8.2 Ma between the northern and southernlowland sister clades of field mice of the genus Calomys,thus precluding Pleistocene events as a causal factor, butmatching the age of many older Amazonian sister speciesacross a variety of taxa (Moritz et al. 2000). Similarly, Pen-nington et al. (2004) did not detect any Pleistocene trans-Amazonian sister-group relationships in dry-forest plants,but noted that phylogeographical analyses of singlespecies found in multiple dry-forest enclaves may proverevealing. Eberhard & Bermingham (2004) found mtDNAsequence divergences consistent with early mid-Pleistocenevicariance in the parrot Amazona ochrocephala, parallelingthe results of this study. Palaeontological evidence of pri-marily grazing mammals in western Amazonia, as well asthe apparent passage of early, savannah-adapted northernimmigrant mammals across Amazonia to southern SouthAmerica (Webb & Rancy 1996) are equally supportive of ahypothesis of middle Pleistocene forest fragmentation.
The suggested early to mid Pleistocene time for trans-Amazonian vicariance may be important, as much of thepalynological evidence used to discredit the Pleistocenerefugia hypothesis by its critics stems only from the latePleistocene (e.g. Colinvaux et al. 1996; Kastner & Goñi 2003).Extensive global climatic fluctuations with high-latitudeglaciation started occurring at least 2.4 Ma (Shackletonet al. 1984; Hooghiemstra & Cleef 1995), so rainforest frag-mentation in the Amazon may not have occurred duringthe last one or two glacial maxima, but could have
P H Y L O G E O G R A P H Y O F T H E N E O T R O P I C A L R A T T L E S N A K E 1103
© 2005 Blackwell Publishing Ltd, Molecular Ecology, 14, 1095–1108
occurred in the early or middle Pleistocene or indeed evenearlier (Haffer 1997), which is plausible in view of thedocumented occurrence of Milankovitch cycles longbefore the beginning of Quaternary glaciations (Bartlein &Prentice 1989). Indeed, one prediction of vicariance datingback to the LGM would be identical or virtually identicalmtDNA haplotypes shared by the nonforest vicariants, asfound in populations of the elapid snake Oxyuranus scutel-latus in Australia and New Guinea, separated by rising sealevels after the LGM (Wüster et al. 2005), but not in thisstudy. A greater age of the last instance of rainforest frag-mentation may be one reason why Lessa et al. (2003) didnot detect the expected genetic traces of recent rangeexpansion in SW Amazonian rainforest rodents. Again, theinclusion of isolated Amazonian populations of C. durissusin phylogeographical studies would shed further light onthe timing of forest contraction or fragmentation.
In conclusion, our results provide new evidence of sub-stantial rainforest fragmentation in the Amazon basin in theearly or middle Pleistocene, and illustrate the potential useful-ness of phylogeographical studies of nonrainforest speciesin the elucidation of the history of the forests themselves.
Systematic implications
In addition to their biogeographical implications, ourresults provide a phylogenetic background to the resolutionof long-standing taxonomic problems affecting the C.durissus complex. Campbell & Lamar (2004) split C. durissus,previously regarded as a single polytypic species, intothree species, C. totonacus (northeastern Mexico), C. simus(Mexico and C. America) and C. durissus (South America).Our results support species status for C. totonacus, whichappears to be an ancient lineage more closely related toC. molossus and C. basiliscus than to C. durissus. Our dataalso demonstrate that C. molossus is highly heterogeneous,falling into four clades dating back to the Miocene,suggesting that it may also represent a species complex.
Crotalus simus (sensu Campbell & Lamar 2004) is bothparaphyletic and highly heterogeneous. The taxa culminatus(southwestern Mexico) and tzabcan (Yucatán Peninsula)form highly distinct clades dating from the earliest Pliocene,and are morphologically distinct (Klauber 1952, 1972). Wetherefore consider them separate evolutionary species,Crotalus culminatus and Crotalus tzabcan, although werecognize the need for additional work on their status. (SeeCampbell & Lamar 2004 for photographs, descriptions,and distribution maps.) Crotalus simus simus (C. d. durissus,sensu Campbell & Lamar 1989) is polyphyletic: the specimensfrom northeastern Mexico (Veracruz) constitute the sistertaxon of C. culminatus, whereas the remaining CentralAmerican populations are the sister group of the SouthAmerican representatives of the complex. Klauber (1952)noted subtle differences between specimens from Veracruz
and elsewhere in Central America, but in the absence ofadditional data, we prefer not to propose any formalreclassification based on mtDNA alone (see Puorto et al.2001). Recognition of these distinct lineages is importantfor conservation assessment and management, particu-larly as many populations appear to be declining rapidly(Campbell & Lamar 2004).
Within South America, extensive superficial variation inpattern has led to the description of a plethora of often ill-defined subspecies or even species (summarized in Vanzo-lini & Calleffo 2002 and Campbell & Lamar 2004). Our datashow all South American populations of the C. durissuscomplex to be phylogenetically closely related. South ofthe Amazon, the poorly defined phylogeographicalpattern suggests that subspecific distinctions are un-warranted, and we consider Crotalus durissus cascavellaand Crotalus durissus collilineatus to be synonymous withCrolatus durissus terrificus. North of the Amazon, the popu-lations from Aruba (unicolor) and northwestern Venezuela(vegrandis), often recognized as distinct species (e.g.Klauber 1972), are placed among the other South Americanpopulations of C. durissus. In northern South America,incongruence between morphological variation andphylogeographical patterns, and substantial morphologicaldifferences between geographically proximal rattlesnakepopulations suggest that the delimitation of species here willrequire the analysis of multiple unlinked character systems.
Acknowledgements
This study would have been impossible without the enthusiasticsupport of J.P. Dominguez, G.J. Duckett, H. Hall, M. Harris,A. Mijares-Urrutia, G. Puorto, P. Rowley, P. Singfield, R.D.G.Theakston, D.A. Warrell, E. Wenman and J.L. Yrausquin. NicolasVidal and an anonymous reviewer provided comments leading toan improved manuscript. This study was funded by the WellcomeTrust (grant 057257/Z/99/Z and Research Career DevelopmentFellowship), the Leverhulme Trust, the EU (contracts TS3-CT91-0024 and IC18-CT96-OO32), Fundação Banco do Brazil, Fundação deAmparo a Pesquisa do Estado de São Paulo (FAPESP) (grants 95/90 56–9, 97/2445–5, 00/01850–8), the British Council, and CONACyT.
References
Ashton KG, de Queiroz A (2001) Molecular systematics of thewestern rattlesnake, Crotalus viridis (Viperidae), with commentson the utility of the D-loop in phylogenetic studies of snakes.Molecular Phylogenetics and Evolution, 21, 176–189.
Bartlein PJ, Prentice IC (1989) Orbital variations, climate andpaleoecology. Trends in Ecology and Evolution, 4, 195–199.
Bremer K (1994) Branch support and tree stability. Cladistics, 10,295–304.
Burnham RJ, Graham A (1999) The history of Neotropical vegeta-tion: new developments and status. Annals of the MissouriBotanical Garden, 86, 546–589.
Campbell JA, Lamar WW (1989) The Venomous Reptiles of LatinAmerica. Comstock, Ithaca and London.
1104 W . W Ü S T E R E T A L .
© 2005 Blackwell Publishing Ltd, Molecular Ecology, 14, 1095–1108
Campbell JA, Lamar WW (2004) The Venomous Reptiles of TheWestern Hemisphere. Comstock, Ithaca and London.
Coates AG, Obando JA (1996) The geologic evolution of the Cen-tral American Isthmus. In: Evolution and Environment in TropicalAmerica (eds Jackson JBC, Budd AF, Coates AG), pp. 21–56.University of Chicago Press, Chicago.
Colinvaux PA, De Oliveira PE, Bush MB (2000) Amazonian andNeotropical plant communities on glacial timescales: thefailure of the aridity and refuge hypotheses. Quaternary ScienceReviews, 19, 141–169.
Colinvaux PA, De Oliveira PE, Moreno JE, Miller MC, Bush MB(1996) A long pollen record from lowland Amazonia: forest andcooling in glacial times. Science, 274, 85–88.
Colinvaux PA, Irion G, Räsänen ME, Bush MB, Nunes de Mello JAS(2001) A paradigm to be discarded: geological and paleoecolo-gical data falsify the Haffer & Prance refuge hypothesisof Amazonian speciation. Amazoniana, 16, 609–646.
Eberhard JR, Bermingham E (2004) Phylogeny and biogeographyof the Amazona ochrocephala (Aves: Psittacidae) complex. Auk,121, 318–332.
Estes R, Báez A (1985) Herpetofauna of North and South Americaduring the late Cretaceous and Cenozoic: evidence for inter-change? In: The Great American Biotic Interchange (eds Stehli FG,Webb SD), pp. 139–197. Plenum Press, New York.
Farris JD, Källersjö M, Kluge AG, Bult C (1994) Testing signi-ficance of incongruence. Cladistics, 10, 315–319.
Felsenstein J (1985) Confidence limits on phylogenies: anapproach using the bootstrap. Evolution, 39, 783–791.
Gregory-Wodzicki KM (2000) Uplift history of the central andnorthern Andes: a review. Geological Society of America Bulletin,112, 1091–1105.
Haffer J (1969) Speciation in Amazonian forest birds. Science, 165,131–137.
Haffer J (1997) Alternative models of vertebrate speciation inAmazonia: an overview. Biodiversity and Conservation, 6, 451–476.
Haffer J, Prance GT (2001) Climatic forcing of evolution inAmazonia during the Cenozoic: on the refuge theory of bioticdifferentiation. Amazoniana, 16, 579–607.
Hewitt GM (2004) Genetic consequences of climatic oscillations inthe Quaternary. Philosophical Transactions of the Royal Society ofLondon. Series B, Biological Sciences, 359, 183–195.
Hillis DM, Huelsenbeck JP (1992) Signal, noise, and reliability inphylogenetic analyses. Journal of Heredity, 83, 189–195.
Hooghiemstra H (2001) The continuing debate on the history ofthe Amazonian rain forest. Amazoniana, 16, 653–656.
Hooghiemstra H, Cleef AM (1995) Pleistocene climatic change andenvironmental and generic dynamics in the north Andeanmontane forest and paramo. In: Biodiversity and Conservation ofNeotropical Montane Forests (eds Churchill SP, Balslev H, Forero E,Luyeyn JL), pp. 35–49. New York Botanical Garden, New York.
Kastner TP, Goñi MA (2003) Constancy in the vegetation of theAmazon basin during the late Pleistocene: evidence from theorganic matter composition of Amazon deep sea fan sediments.Geology, 31, 291–294.
Klauber LM (1952) Taxonomic studies of the rattlesnakes of main-land Mexico. Bulletins of the Zoological Society of San Diego, 26, 5–143.
Klauber LM (1972) Rattlesnakes: Their Habits, Life Histories, andInfluence on Mankind, 2nd edn. University of California Press,Berkeley.
Kumazawa Y, Ota H, Nishida M, Ozawa T (1998) The completenucleotide sequence of a snake (Dinodon semicarinatus)
mitochondrial genome with two identical control regions.Genetics, 150, 313–329.
Langley CH, Fitch W (1974) An estimation of the constancy of therate of molecular evolution. Journal of Molecular Evolution, 3,161–177.
Lessa EP, Cook JA, Patton JL (2003) Genetic footprints of demo-graphic expansion in North America, but not Amazonia, duringthe Late Quaternary. Proceedings of the National Academy ofSciences of the United States of America, 100, 10331–10334.
Marshall LG, Butler RF, Drake RE, Curtis GH, Tedsford RH (1979)Calibration of the great American interchange. Science, 24, 272–279.
Moritz C, Patton JL, Schneider CJ, Smith TB (2000) Diversificationof rainforest faunas: an integrated molecular approach. AnnualReview of Ecology and Systematics, 31, 533–563.
Murphy RW, Fu J, Lathrop A, Feltham JV, Kovac V (2002) Phylo-geny of the rattlesnakes (Crotalus and Sistrurus) inferred fromsequences of five mitochondrial DNA genes. In: Biology of theVipers (eds Schuett GW, Höggren M, Douglas ME, Greene HW),pp. 69–92. Eagle Mountain Publishing, Eagle Mountain, Utah.
Pennington RT, Lavin M, Prado DE, Pendry CA, Pell SK,Butterworth CA (2004) Historical climate change and speci-ation: Neotropical seasonally dry forest plants show patterns ofboth Tertiary and Quaternary Diversification. PhilosophicalTransactions of the Royal Society of London. Series B, Biological Sci-ences, 359, 515–538.
Pennington RT, Prado DE, Pendry CA (2000) Neotropical season-ally dry forests and Quaternary vegetation changes. Journal ofBiogeography, 27, 261–273.
Place AJ, Abramson CI (2004) A quantitative analysis of the ances-tral area of rattlesnakes. Journal of Herpetology, 38, 152–156.
Pook CE, Wüster W, Thorpe RS (2000) Historical biogeography ofthe western rattlesnake (Serpentes: Viperidae: Crotalus viridis),inferred from mitochondrial DNA sequence information.Molecular Phylogenetics and Evolution, 15, 269–282.
Posada D, Crandall KA (1998) modeltest: testing the model ofDNA substitution. Bioinformatics, 14, 817–818.
Potts R, Behrensmeyer AK (1992) Late Cainozoic terrestrial eco-systems. In: Terrestrial Ecosystems Through Time: EvolutionaryPaleoecology of Terrestrial Plants and Animals (eds BehrensmeyerAK, Damuth JD, DiMichele WA, Potts R, Sues H-D, Wing SL),pp. 419–541. University of Chicago Press, Chicago.
Prance GT (1973) Phytogeographic support for the theory of Pleis-tocene forest refuges in the Amazon basin, based on evidencefrom distribution patterns in Caryocaraceae, Chrysobalanaceae,Dichapetalaceae and Lecythidaceae. Acta Amazonica, 3, 5–28.
Puorto G, Salomão MG, Theakston RDG, Thorpe RS, Warrell DA,Wüster W (2001) Combining mitochondrial DNA sequencesand morphological data to infer species boundaries: phylogeo-graphy of lanceheaded pit vipers in the Brazilian Atlantic forest,and the status of Bothrops pradoi (Squamata: Serpentes: Viperidae).Journal of Evolutionary Biology, 14, 527–538.
Rage J-C, Bajpai S, Thewissen JGM, Tiwari BN (2003) Early Eocenesnakes from Kutch, western India, with a review of thePalaeophiidae. Geodiversitas, 25, 695–716.
Ronquist F, Huelsenbeck JP (2003) mrbayes 3: Bayesian phylo-genetic inference under mixed models. Bioinformatics, 19, 1572–1574.
Salazar-Bravo J, Dragoo JW, Tinnin DS, Yates TL (2001) Phylogenyand evolution of the Neotropical rodent genus Calomys: inferencesfrom mitochondrial DNA sequence data. Molecular Phylogeneticsand Evolution, 20, 173–184.
P H Y L O G E O G R A P H Y O F T H E N E O T R O P I C A L R A T T L E S N A K E 1105
© 2005 Blackwell Publishing Ltd, Molecular Ecology, 14, 1095–1108
Sambrook F, Fritsch EF, Maniatis T (1989) Molecular Cloning: ALaboratory Manual. Cold Spring Harbor Laboratory Press, ColdSpring Harbor, New York.
Sanderson MJ (2002) Estimating absolute rates of molecularevolution and divergence times: a penalized likelihood approach.Molecular Biology and Evolution, 19, 101–109.
Sanderson MJ (2003) r8s: inferring absolute rates of molecularevolution and divergence times in the absence of a molecularclock. Bioinformatics, 19, 301–302.
Shackleton NJ, Backman J, Zimmerman H et al. (1984) Oxygen iso-tope calibration of the onset of ice-rafting and history of glaciationof the North Atlantic region. Nature, 307, 620–623.
Stehli FG, Webb SD, eds (1985) The Great American Biotic Inter-change. Plenum Press, New York.
Swofford DL (2002) PAUP*: Phylogenetic Analysis Using Parsimony(*and Other Methods). Version 4.0b10. Sinauer, Sunderland,Massachusetts.
Szyndlar Z, Rage J-C (1990) West Palearctic cobras of the genusNaja (Serpentes: Elapidae): interrelationships among extinctand extant species. Amphibia-Reptilia, 11, 385–400.
Vanzolini PE, Calleffo MEV (2002) A taxonomic bibliography ofthe South American snakes of the Crotalus durissus complex(Serpentes, Viperidae). Anais Da Academia Brasileira de Ciências,74, 37–83.
Vanzolini PE, Heyer RW (1985) The American herpetofauna andthe Interchange. In: The Great American Biotic Interchange (edsStehli FG, Webb SD), pp. 475–487. Plenum Press, New York.
Webb SD, Rancy A (1996) Late Cenozoic evolution of the Neotro-pical mammal fauna. In: Evolution and Environment in TropicalAmerica (eds Jackson JBC, Budd AF, Coates AG), pp. 335–358.University of Chicago Press, Chicago.
Wüster W, Dumbrell AJ, Hay C, Pook CE, Williams DJ, Fry BG(2005) Snakes across the Strait: trans-Torresian phylogeographicrelationships in three genera of Australasian snakes (Serpentes:Elapidae: Acanthophis, Oxyuranus and Pseudechis). MolecularPhylogenetics and Evolution, 34, 1–14.
Wüster W, Salomão MG, Quijada-Mascareñas JA, Thorpe RS,BBBSP (2002) Origins and evolution of the South American pitviper fauna: evidence from mitochondrial DNA sequenceanalysis. In: Biology of the Vipers (eds Schuett GW, Höggren M,Douglas ME, Greene HW), pp. 111–128. Eagle MountainPublishing, Eagle Mountain, Utah.
Yang ZY, Yoder AD (2003) Comparison of likelihood and Bayesianmethods for estimating divergence times using multiple geneloci and calibration points, with application to a radiation ofcute-looking mouse lemur species. Systematic Biology, 52, 705–716.
Zamudio KR, Greene HW (1997) Phylogeography of the bush-master (Lachesis muta: Viperidae): implications for Neotropicalbiogeography, systematics and conservation. Biological Journalof the Linnean Society, 62, 421–442.
Zhang D-X, Hewitt GM (1996) Nuclear integrations: challenges formitochondrial DNA markers. Trends in Ecology and Evolution, 11,247–251.
This study forms part of a wide-ranging collaborative researchprogram into the evolutionary biology, phylogeny, and bio-geography of venomous snakes involving WW, CEP, MGS andRST. The sequence data were largely generated as part of post-graduate research by JEF and JAQM.
1106 W . W Ü S T E R E T A L .
© 2005 Blackwell Publishing Ltd, Molecular Ecology, 14, 1095–1108
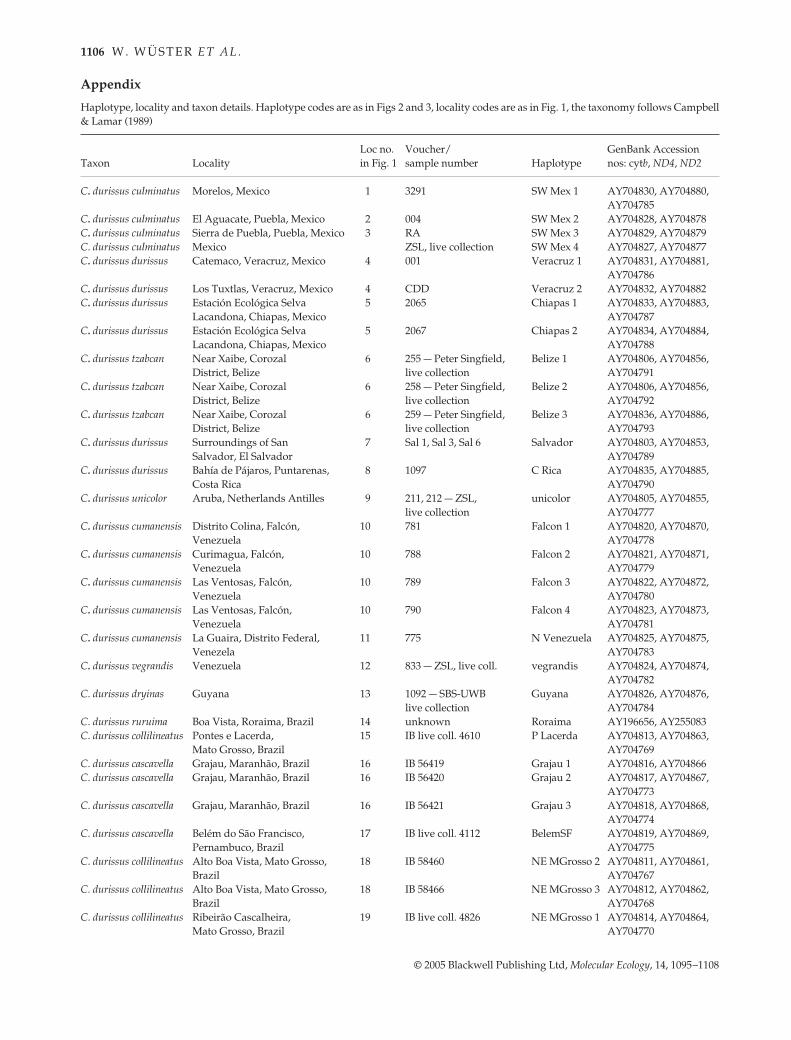
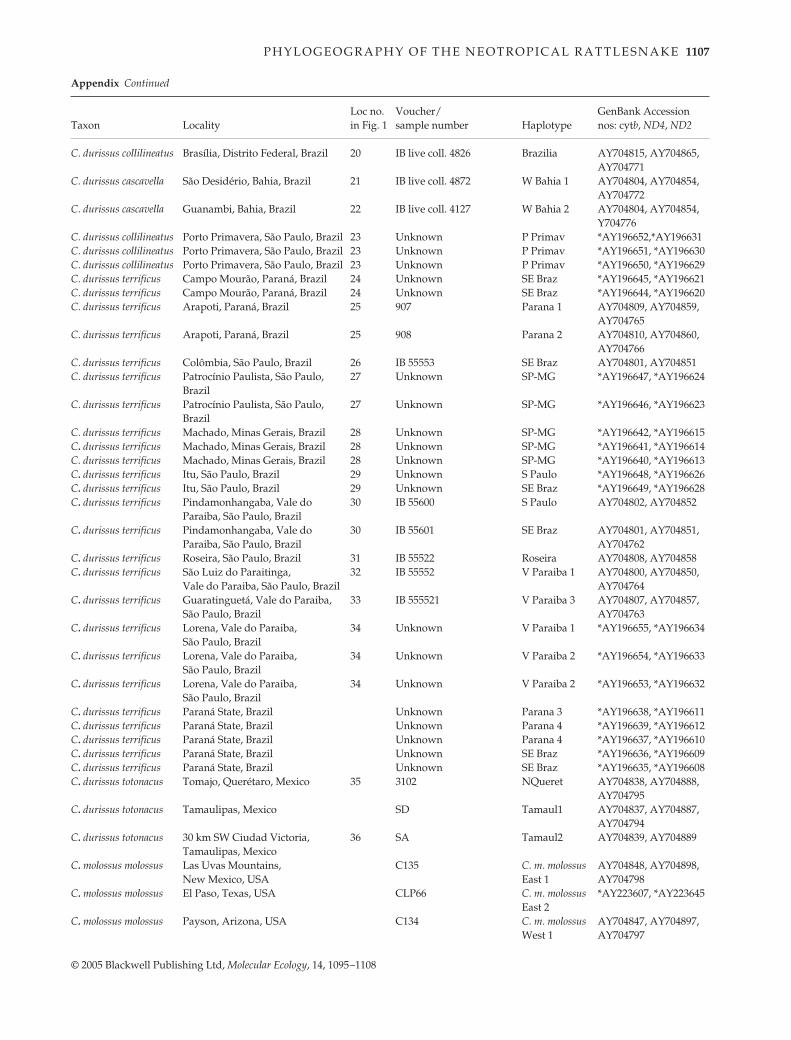
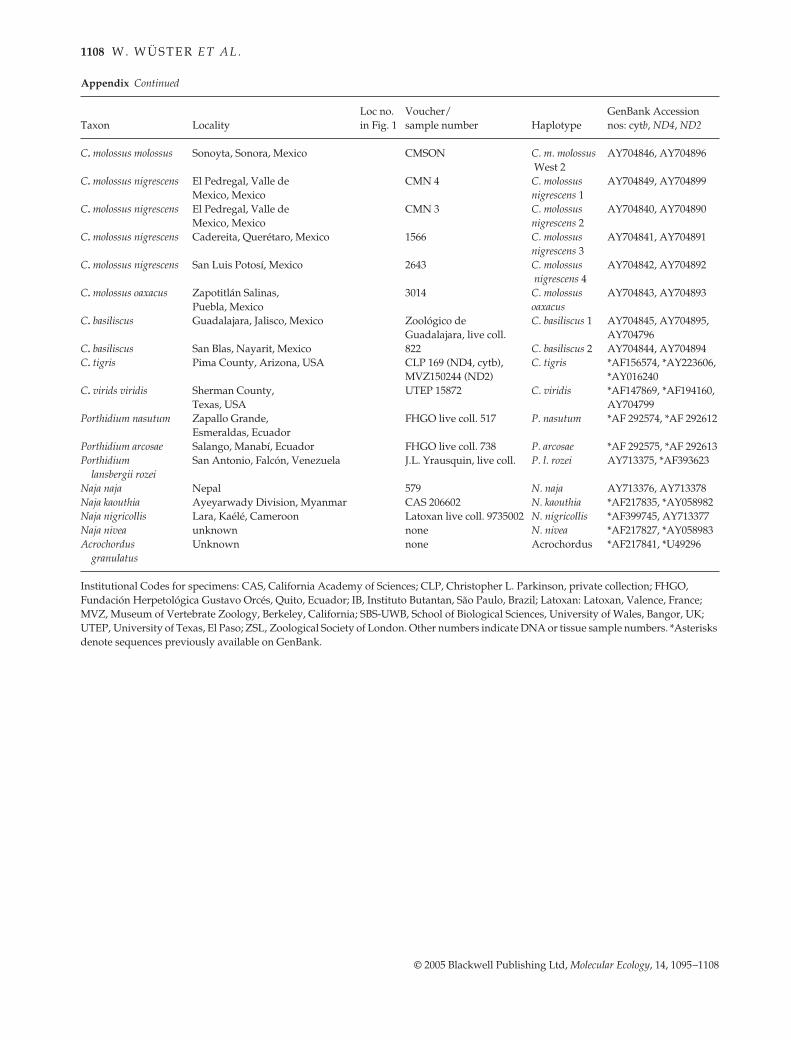
Appendix Haplotype, locality and taxon details. Haplotype codes are as in Figs 2 and 3, locality codes are as in Fig. 1, the taxonomy follows Campbell& Lamar (1989)
Taxon LocalityLoc no. in Fig. 1
Voucher/sample number Haplotype
GenBank Accession nos: cytb, ND4, ND2
C. durissus culminatus Morelos, Mexico 1 3291 SW Mex 1 AY704830, AY704880, AY704785
C. durissus culminatus El Aguacate, Puebla, Mexico 2 004 SW Mex 2 AY704828, AY704878C. durissus culminatus Sierra de Puebla, Puebla, Mexico 3 RA SW Mex 3 AY704829, AY704879C. durissus culminatus Mexico ZSL, live collection SW Mex 4 AY704827, AY704877C. durissus durissus Catemaco, Veracruz, Mexico 4 001 Veracruz 1 AY704831, AY704881,
AY704786C. durissus durissus Los Tuxtlas, Veracruz, Mexico 4 CDD Veracruz 2 AY704832, AY704882C. durissus durissus Estación Ecológica Selva
Lacandona, Chiapas, Mexico5 2065 Chiapas 1 AY704833, AY704883,
AY704787C. durissus durissus Estación Ecológica Selva
Lacandona, Chiapas, Mexico5 2067 Chiapas 2 AY704834, AY704884,
AY704788C. durissus tzabcan Near Xaibe, Corozal
District, Belize6 255 — Peter Singfield,
live collectionBelize 1 AY704806, AY704856,
AY704791C. durissus tzabcan Near Xaibe, Corozal
District, Belize6 258 — Peter Singfield,
live collectionBelize 2 AY704806, AY704856,
AY704792C. durissus tzabcan Near Xaibe, Corozal
District, Belize6 259 — Peter Singfield,
live collectionBelize 3 AY704836, AY704886,
AY704793C. durissus durissus Surroundings of San
Salvador, El Salvador7 Sal 1, Sal 3, Sal 6 Salvador AY704803, AY704853,
AY704789C. durissus durissus Bahía de Pájaros, Puntarenas,
Costa Rica8 1097 C Rica AY704835, AY704885,
AY704790C. durissus unicolor Aruba, Netherlands Antilles 9 211, 212 — ZSL,
live collectionunicolor AY704805, AY704855,
AY704777C. durissus cumanensis Distrito Colina, Falcón,
Venezuela10 781 Falcon 1 AY704820, AY704870,
AY704778C. durissus cumanensis Curimagua, Falcón,
Venezuela10 788 Falcon 2 AY704821, AY704871,
AY704779C. durissus cumanensis Las Ventosas, Falcón,
Venezuela10 789 Falcon 3 AY704822, AY704872,
AY704780C. durissus cumanensis Las Ventosas, Falcón,
Venezuela10 790 Falcon 4 AY704823, AY704873,
AY704781C. durissus cumanensis La Guaira, Distrito Federal,
Venezela11 775 N Venezuela AY704825, AY704875,
AY704783C. durissus vegrandis Venezuela 12 833 — ZSL, live coll. vegrandis AY704824, AY704874,
AY704782C. durissus dryinas Guyana 13 1092 — SBS-UWB
live collectionGuyana AY704826, AY704876,
AY704784C. durissus ruruima Boa Vista, Roraima, Brazil 14 unknown Roraima AY196656, AY255083C. durissus collilineatus Pontes e Lacerda,
Mato Grosso, Brazil15 IB live coll. 4610 P Lacerda AY704813, AY704863,
AY704769C. durissus cascavella Grajau, Maranhão, Brazil 16 IB 56419 Grajau 1 AY704816, AY704866C. durissus cascavella Grajau, Maranhão, Brazil 16 IB 56420 Grajau 2 AY704817, AY704867,
AY704773C. durissus cascavella Grajau, Maranhão, Brazil 16 IB 56421 Grajau 3 AY704818, AY704868,
AY704774C. durissus cascavella Belém do São Francisco,
Pernambuco, Brazil17 IB live coll. 4112 BelemSF AY704819, AY704869,
AY704775C. durissus collilineatus Alto Boa Vista, Mato Grosso,
Brazil18 IB 58460 NE MGrosso 2 AY704811, AY704861,
AY704767C. durissus collilineatus Alto Boa Vista, Mato Grosso,
Brazil18 IB 58466 NE MGrosso 3 AY704812, AY704862,
AY704768C. durissus collilineatus Ribeirão Cascalheira,
Mato Grosso, Brazil19 IB live coll. 4826 NE MGrosso 1 AY704814, AY704864,
AY704770
P H Y L O G E O G R A P H Y O F T H E N E O T R O P I C A L R A T T L E S N A K E 1107
© 2005 Blackwell Publishing Ltd, Molecular Ecology, 14, 1095–1108
C. durissus collilineatus Brasília, Distrito Federal, Brazil 20 IB live coll. 4826 Brazilia AY704815, AY704865, AY704771
C. durissus cascavella São Desidério, Bahia, Brazil 21 IB live coll. 4872 W Bahia 1 AY704804, AY704854, AY704772
C. durissus cascavella Guanambi, Bahia, Brazil 22 IB live coll. 4127 W Bahia 2 AY704804, AY704854, Y704776
C. durissus collilineatus Porto Primavera, São Paulo, Brazil 23 Unknown P Primav *AY196652,*AY196631C. durissus collilineatus Porto Primavera, São Paulo, Brazil 23 Unknown P Primav *AY196651, *AY196630C. durissus collilineatus Porto Primavera, São Paulo, Brazil 23 Unknown P Primav *AY196650, *AY196629C. durissus terrificus Campo Mourão, Paraná, Brazil 24 Unknown SE Braz *AY196645, *AY196621C. durissus terrificus Campo Mourão, Paraná, Brazil 24 Unknown SE Braz *AY196644, *AY196620C. durissus terrificus Arapoti, Paraná, Brazil 25 907 Parana 1 AY704809, AY704859,
AY704765C. durissus terrificus Arapoti, Paraná, Brazil 25 908 Parana 2 AY704810, AY704860,
AY704766C. durissus terrificus Colômbia, São Paulo, Brazil 26 IB 55553 SE Braz AY704801, AY704851C. durissus terrificus Patrocínio Paulista, São Paulo, 27 Unknown SP-MG *AY196647, *AY196624
BrazilC. durissus terrificus Patrocínio Paulista, São Paulo, 27 Unknown SP-MG *AY196646, *AY196623
BrazilC. durissus terrificus Machado, Minas Gerais, Brazil 28 Unknown SP-MG *AY196642, *AY196615C. durissus terrificus Machado, Minas Gerais, Brazil 28 Unknown SP-MG *AY196641, *AY196614C. durissus terrificus Machado, Minas Gerais, Brazil 28 Unknown SP-MG *AY196640, *AY196613C. durissus terrificus Itu, São Paulo, Brazil 29 Unknown S Paulo *AY196648, *AY196626C. durissus terrificus Itu, São Paulo, Brazil 29 Unknown SE Braz *AY196649, *AY196628C. durissus terrificus Pindamonhangaba, Vale do 30 IB 55600 S Paulo AY704802, AY704852
Paraiba, São Paulo, BrazilC. durissus terrificus Pindamonhangaba, Vale do
Paraiba, São Paulo, Brazil30 IB 55601 SE Braz AY704801, AY704851,
AY704762C. durissus terrificus Roseira, São Paulo, Brazil 31 IB 55522 Roseira AY704808, AY704858C. durissus terrificus São Luiz do Paraitinga,
Vale do Paraiba, São Paulo, Brazil32 IB 55552 V Paraiba 1 AY704800, AY704850,
AY704764C. durissus terrificus Guaratinguetá, Vale do Paraiba,
São Paulo, Brazil33 IB 555521 V Paraiba 3 AY704807, AY704857,
AY704763C. durissus terrificus Lorena, Vale do Paraiba, 34 Unknown V Paraiba 1 *AY196655, *AY196634
São Paulo, BrazilC. durissus terrificus Lorena, Vale do Paraiba, 34 Unknown V Paraiba 2 *AY196654, *AY196633
São Paulo, BrazilC. durissus terrificus Lorena, Vale do Paraiba, 34 Unknown V Paraiba 2 *AY196653, *AY196632
São Paulo, BrazilC. durissus terrificus Paraná State, Brazil Unknown Parana 3 *AY196638, *AY196611C. durissus terrificus Paraná State, Brazil Unknown Parana 4 *AY196639, *AY196612C. durissus terrificus Paraná State, Brazil Unknown Parana 4 *AY196637, *AY196610C. durissus terrificus Paraná State, Brazil Unknown SE Braz *AY196636, *AY196609C. durissus terrificus Paraná State, Brazil Unknown SE Braz *AY196635, *AY196608C. durissus totonacus Tomajo, Querétaro, Mexico 35 3102 NQueret AY704838, AY704888,
AY704795C. durissus totonacus Tamaulipas, Mexico SD Tamaul1 AY704837, AY704887,
AY704794C. durissus totonacus 30 km SW Ciudad Victoria, 36 SA Tamaul2 AY704839, AY704889
Tamaulipas, MexicoC. molossus molossus Las Uvas Mountains,
New Mexico, USAC135 C. m. molossus
East 1AY704848, AY704898, AY704798
C. molossus molossus El Paso, Texas, USA CLP66 C. m. molossus East 2
*AY223607, *AY223645
C. molossus molossus Payson, Arizona, USA C134 C. m. molossus West 1
AY704847, AY704897,AY704797
Taxon LocalityLoc no. in Fig. 1
Voucher/sample number Haplotype
GenBank Accession nos: cytb, ND4, ND2
Appendix Continued
1108 W . W Ü S T E R E T A L .
© 2005 Blackwell Publishing Ltd, Molecular Ecology, 14, 1095–1108
C. molossus molossus Sonoyta, Sonora, Mexico CMSON C. m. molossus West 2
AY704846, AY704896
C. molossus nigrescens El Pedregal, Valle de CMN 4 C. molossus AY704849, AY704899Mexico, Mexico nigrescens 1
C. molossus nigrescens El Pedregal, Valle de CMN 3 C. molossus AY704840, AY704890Mexico, Mexico nigrescens 2
C. molossus nigrescens Cadereita, Querétaro, Mexico 1566 C. molossus nigrescens 3
AY704841, AY704891
C. molossus nigrescens San Luis Potosí, Mexico 2643 C. molossus nigrescens 4
AY704842, AY704892
C. molossus oaxacus Zapotitlán Salinas, Puebla, Mexico
3014 C. molossus oaxacus
AY704843, AY704893
C. basiliscus Guadalajara, Jalisco, Mexico Zoológico de Guadalajara, live coll.
C. basiliscus 1 AY704845, AY704895,AY704796
C. basiliscus San Blas, Nayarit, Mexico 822 C. basiliscus 2 AY704844, AY704894C. tigris Pima County, Arizona, USA CLP 169 (ND4, cytb),
MVZ150244 (ND2)C. tigris *AF156574, *AY223606,
*AY016240C. virids viridis Sherman County,
Texas, USAUTEP 15872 C. viridis *AF147869, *AF194160,
AY704799Porthidium nasutum Zapallo Grande, FHGO live coll. 517 P. nasutum *AF 292574, *AF 292612
Esmeraldas, EcuadorPorthidium arcosae Salango, Manabí, Ecuador FHGO live coll. 738 P. arcosae *AF 292575, *AF 292613Porthidium San Antonio, Falcón, Venezuela J.L. Yrausquin, live coll. P. l. rozei AY713375, *AF393623
lansbergii rozeiNaja naja Nepal 579 N. naja AY713376, AY713378Naja kaouthia Ayeyarwady Division, Myanmar CAS 206602 N. kaouthia *AF217835, *AY058982Naja nigricollis Lara, Kaélé, Cameroon Latoxan live coll. 9735002 N. nigricollis *AF399745, AY713377Naja nivea unknown none N. nivea *AF217827, *AY058983Acrochordus
granulatusUnknown none Acrochordus *AF217841, *U49296
Institutional Codes for specimens: CAS, California Academy of Sciences; CLP, Christopher L. Parkinson, private collection; FHGO, Fundación Herpetológica Gustavo Orcés, Quito, Ecuador; IB, Instituto Butantan, São Paulo, Brazil; Latoxan: Latoxan, Valence, France; MVZ, Museum of Vertebrate Zoology, Berkeley, California; SBS-UWB, School of Biological Sciences, University of Wales, Bangor, UK; UTEP, University of Texas, El Paso; ZSL, Zoological Society of London. Other numbers indicate DNA or tissue sample numbers. *Asterisks denote sequences previously available on GenBank.
Taxon LocalityLoc no. in Fig. 1
Voucher/sample number Haplotype
GenBank Accession nos: cytb, ND4, ND2
Appendix Continued