Embed Size (px)
Citation preview

Proceedings World Geothermal Congress 2015
Melbourne, Australia, 19-25 April 2015
1
Tracer Testing at Los Humeros, Mexico, High-Enthalpy Geothermal Field
Eduardo R. IGLESIAS1, Magaly FLORES-ARMENTA
2, Rodolfo J. TORRES
1, Miguel RAMIREZ-MONTES
2,
Neftalí REYES-PICASO1, Irma CRUZ-GRAJALES
2
1 Instituto de Investigaciones Eléctricas, Reforma 113, 62490 Cuernavaca, Mor., México
2 Comisión Federal de Electricidad, Alejandro Volta 655, 58290, Morelia, Mich., México
Keywords: tracer testing, fractured reservoir, high-enthalpy field, Los Humeros, Mexico
ABSTRACT
We performed a tracer study in the high-enthalpy Los Humeros geothermal reservoir to assess the effects of produced-brine
injection in the central part of the field. The reservoir is emplaced in fractured volcanic formations. A high-temperature, liquid-
phase tracer, 2,6 naphtalene disulfonate, was used. Our results revealed that injection in well H-13 recharges the feeding zones of
the nine monitored producing wells. Our results also indicate there is negligible risk of thermal interference in the observed wells at
the injection rates of this study. The observed small aggregated tracer recovery suggests that most of the injected fluid, perhaps up
to about 99%, flows to the deep reservoir, recharging it and enhancing its economic life. In this field the tracer residence curves
present unusual patterns, as revealed in previous and the present study. We investigated the causes of these unusual patterns by
measuring, for each well, the electric conductivity of the samples. Then we found a linear correlation between the mean electric
conductivity of the samples with the average liquid fraction in the corresponding discharge. On this basis we concluded the main
cause of the observed unusual patterns is that each production well monitored probably has at least two feeding zones with differing
enthalpies.
1. INTRODUCTION
Los Humeros geothermal field sits atop of a volcanic caldera. It is a high-enthalpy geothermal resource emplaced in fractured
volcanic formations.
At the time of this study the Mexican Comisión Federal de Electricidad (CFE), owner and operator of the field, was injecting about
4.2 kg/s of separated brine, produced in different parts of the field, in well H-13. The destination of the injected fluids as well as
their likely capacity to produce unwanted thermal interference with producing wells is of considerable economic interest for CFE.
To investigate these questions teams of the Instituto de Investigaciones Eléctricas (IIE) and CFE jointly designed, implemented and
analyzed the results of the study described in this paper.
2. MATERIALS AND METHOD
Nine production wells in the area of interest (Fig. 1) were selected for this study. Their names, distances to the injector H-13 and
respective discharge quality are shown in Table 1.
Figure 1: Location of the wells

Iglesias et al.
2
Table 1: Well names, their distances to the injector and mean discharge quality
Figure 2 presents a vertical section between wells H-37D and H-12, showing the spatial relationships between the wells designated
by CFE for this study.
Figure 2: Spatial relationships between the wells
We chose 2,6 naphthalene disulphonate (nds) as our liquid-phase tracer considering its high-temperature thermal stability, low
detection limit, negligible risk to the environment, simple logistics, commercial availability and affordable price, (e.g., Rose et al.
2001, 2002). Its analysis is implemented using liquid chromatography (HPLC), by UV florescence. With this method the detection
limit is approximately 100 ppt.
Recovery curves were computed numerically integrating the product of the liquid flowrate times the concentration of the residence
curves over the observation period:
dsscsWtmj
t
jj.
0
(1)
where mj(t) is the tracer mass recovered from well j since the injection (t = 0) until time t; Wj (t) is the instantaneous mass flow of
well j, and cj(t) is the instantaneous tracer concentration. The total tracer mass recovered from all wells is thus
j
jRmm (2)
Iglesias et al.
3
We injected 300 kg of 2,6 nds dissolved in 1,500 l of injection brine, in well H-13. The injection operation lasted 18 minutes.
Sampling of the participating wells, including H-13 started 4 hours later. For convenience the wells were sampled with diminishing
frequency, a standard procedure in this kind of tracer test.
During a previous study in this field (Iglesias et al., 2007) the liquid-tracer residendence curves presented unusual patterns. We
suspected these anomalous patterns were related to the existence of multiple feeds, of different enthalpy, in the wells. To test this
hypothesis, in the present study we measured brine conductivity in each liquid sample.
3. RESULTS AND DISCUSSION
3.1 Hydraulic connectivity in the reservoir
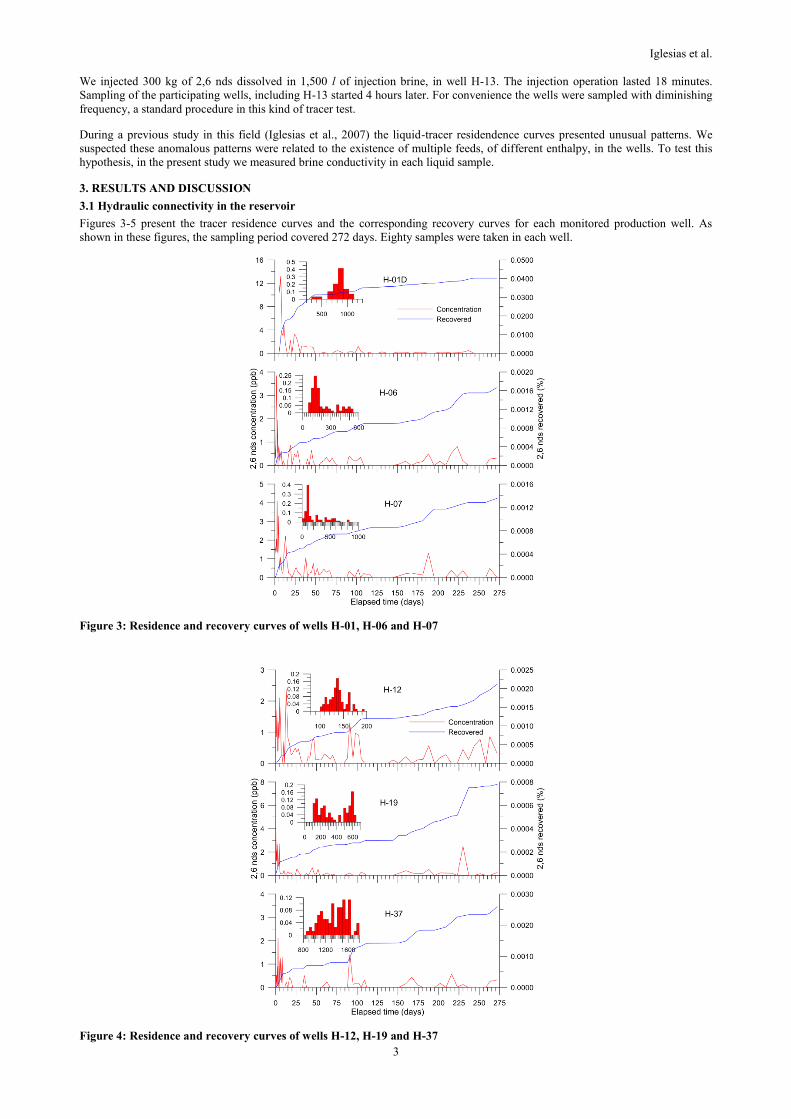
Figures 3-5 present the tracer residence curves and the corresponding recovery curves for each monitored production well. As
shown in these figures, the sampling period covered 272 days. Eighty samples were taken in each well.
Figure 3: Residence and recovery curves of wells H-01, H-06 and H-07
Figure 4: Residence and recovery curves of wells H-12, H-19 and H-37

Iglesias et al.
4
Figure 5: Residence and recovery curves of wells H-39, H-41 and H-42
The residence curves of the production wells were corrected for tracer recirculation, evidenced by its detection in the injector H-
13D (Fig. 6). The correction was achieved using the deconvolution algorithm developed by Shook and Forsmann (2005). To apply
this algorithm we approximated the tracer injection by an instantaneous pulse, considering that its 18 minutes duration was much
shorter than the observation period (272 days). For all the wells the recirculation correction resulted negligible during the
observation period.
As shown in Figs. 3-5, the tracer was detected in all nine monitored wells. This demonstrated that injection in well H-13 recharges
the nine wells monitored in this study.
The short arrival times of the tracer to the production wells suggests the existence of an areally extensive subhorizontal
permeability distribution within the studied area. This permeability distribution is not obviously associated with the known
distribution of faults in Los Humeros; it might be associated with contacts among geological formations.
3.2 Fraction of tracer recovered in the production wells
Note that, with the exception of well H-01D, the recovery curves in Figs, 2-4 were monotonously increasing during the sampling
period, indicating that the tracer was still arriving to the wells when sampling concluded. In well H-01D, the closest to the injector,
the recovery curve reached a final plateau and tracer arrival seems to be essentially completed.
As in this case, occasions in which sampling is terminated before arrival of the tracer is completed in the production wells, are
frequent. In those cases one may attempt to estimate the mass of tracer that would have been recovered in each well by
extrapolating the tendency of the late part of the corresponding residence curve (e.g., Shook and Forsmann, 2005). Unfortunately,
in the present case we were unable to use that method due to the unusual patterns presented by the residence curves: their
succession of peaks and valleys during the observation period precludes discerning the late tendencies in them. Therefore, the
recovery percentages computed for the observation period represent just a lower limit of the expected recovery for these wells.
Table 2 presents the percentage of tracer recovery for all wells during the sampling period. As shown, the total tracer recovery
during the study (0.0537%) is very small. Remember however that tracer was still arriving to all production wells, except H-01D,
when sampling was terminated. It´s worth mentioning however that the registered total tracer recovery is consistent with a previous
result (0.131%) registered in the northern part of this field (Iglesias et al, 2007), over a smaller area and a shorter observation period
(205 days). In that case the liquid-phase tracer completed its arrival in eight of the nine monitored wells.
In order to check for tracer recirculation we sampled the injection well simultaneously with the other wells. The corresponding
results are presented in Fig.5. The total recirculated tracer amounted to 0.0076 % of the injected tracer, which represents 14.15% of
the total recovered tracer in the production wells. Therefore significant tracer recycling occurred during the sampling period.
The observed total recovery of producing wells (Table 2) is small and comparable to a previous result (0.131%) obtained in the
Northern part of this field (Iglesias et. al., 2007) over a smaller area and a shorter period (205 days); in that case tracer recovery
reached completion in all the wells but one. In the current study most wells did not reach recovery completion; only H-01D did.
Thus, in principle one can hardly conclude anything about what would have been the total recovery if sampling had continued until
all wells reached recovery completion. However, in previous tracer studies on fractured geothermal fields, including this one
(Iglesias et al, 2007; 2010), we found that, in general, tracer recovery diminishes rapidly with distance to the injector well. In this

Iglesias et al.
5
case H-01D, the closest well to the injector, recovered about 75% of the recorded total. This and Fig. 6 suggests a similar pattern to
that found in previous studies prevails in this one.
Table 2: Tracer recoveries
Figure 6: Results for the injection well
Assuming that to be the case, it is reasonable to expect that, once completed in all the wells, total tracer recovery would be of the
same or similar order of magnitude as the recovery found for well H-01D. Furthermore, it seems very likely that part of the injected
tracer would be produced by wells not monitored in this study, as suggested by the detection of the tracer in wells H-19 and H-37
located respectively at 2,334 and 4,125 m from the injector well. Even so, the small magnitude of the recovery indicates that most
of the injected fluid is dispersed in the reservoir. A reasonable scenario for this to happen is that most of the injected brine, being
colder and denser than the reservoir fluid, flows downwards to depths greater than those corresponding to the feeding zones of the
wells, recharging the deep reservoir and enhancing its economic life.
Figure 6: Tracer recovery vs. distance to the injection well

Iglesias et al.
6
The small recovery percentages found in this study also suggest that thermal interference due to injection in well H-13 is unlikely
for the monitored wells at the injection flowrates of this study.
Our results reveal the existence of horizontal permeability over a wide area of the field (e.g., wells H-12 and H-37 are 6 km apart).
There is no perceptible correlation between this permeability distribution with the known distribution of faults in Los Humeros
(Fig. 2). We suggest this permeability distribution may be associated with contacts between different geologic formations in the
caldera.
3.3 Residence curve patterns and their cause
The residence curves of Figs. 2-4 present patterns that differ considerably from the usual ones in tracer studies. They present series
of peaks that appear to be of stochastic nature. As mentioned, we had noticed similar patterns in our previous results for this field
(Iglesias et al., 2007). In an effort to elucidate the causes of these patterns, we started by observing that during sampling the wells
discharges presented short-term variations, both in this and in the previous studies. It is well-known that high-enthalpy wells with
two or more feeding zones of different enthalpies tend to present this behavior (Grant et al., 1982). Thus, in order to investigate the
causes of the unusual patterns presented by the residence curves in this field we measured the electrical conductivity of all the
samples in the present study. Table 3 presents the main statistics of these measurements; the sample size is n = 80 for each well.
The measured conductivities presented important dispersions, much higher than those attributable to measuring errors.
Table 3: Statistics of electrical conductivity
Since the sample electrical conductivity is proportional to its ion density, one would expect higher electrical conductivities in
discharges with higher fractions of water. Comparing mean values of electrical measured electrical with the average fraction of
water in each well discharge we found a linear correlation (Fig. 7) with a correlation coefficient equal to 0.8460; the black lines
represent a 95% confidence interval. Since electrical conductivity reflects ion concentrations in the samples, we infer that
discharges with greater enthalpies present smaller electrical conductivities probably because of dilution by condensed steam. The
histograms in Figs. 3-5 and the corresponding values in Table 3 indicate that all the observed wells have at least two feed zones
with different enthalpies. Thus we infer that the probable cause of the observed variation of the electrical conductivity in the
discharges is the existence of multiple feed zones with different enthalpies in the wells.
The correlation in Fig. 7 reveals that the variability of the electrical conductivity in the samples indicates variations in the fraction
of water in the corresponding discharge. Therefore, the tracer concentration in the discharge is modulated by the instantaneous
fraction of water in the discharge. This modulation is superposed on that produced by the tracer arrival to the interface between the
fracture(s) feeding liquid to the well and its wall. And, if there is more than one fracture feeding liquid or steam to the well, the
resulting mixtures also modulate the tracer concentration in the liquid discharge. We conclude that this complex superposition of
modulations explains the unusual patterns observed in the residence curves of the liquid-phase tracer in Los Humeros. It will be
necessary to take this into account in the design of future tracer studies in this field.
4. SUMMARY AND CONCLUSIONS
We injected a liquid-phase tracer in well H-13D of Los Humeros geothermal field and monitored during 272 days its concentration
in the water discharges of nine wells designated by CFE.
The tracer was detected in all the monitored production wells, revealing injection in well H-13D recharges the nine observed
production wells.
The short arrival times of the tracer to the production wells suggests the existence of an areally extensive distribution of
subhorizontal, high-permeability area within the studied zone. This permeability distribution is not obviously associated with the
known distribution of faults in Los Humeros; it might be associated with contacts among geological formations.
With the possible exception of well H-01D, the tracer did not complete its arrival to the observed wells. This and the unusual
patterns presented by the residence curves caused uncertainty about the magnitude of the expected tracer recovery in each well and
on the total expected recovery. However, if the magnitude of the expected tracer recovery were similar or not much greater than
that observed in a previous study of a contiguous zone in this field, the recorded small total recovery would indicate that most of the
injected fluid is dispersed in the reservoir. A reasonable scenario for this to happen is that most of the injected brine, being colder
and denser than the reservoir fluid, flows downwards to depths greater than those corresponding to the feeding zones of the wells,
recharging the deep reservoir and enhancing its economic life.

Iglesias et al.
7
Figure 7: Mean electrical conductivity vs. mean water fraction in the discharge
The small recovery percentages found in this study also suggest that thermal interference due to injection in well H-13 is unlikely
for the monitored wells at the injection flowrates of this study.
We investigated the causes generating the unusual patterns of the residence curves in this field. To that end we measured the
electrical conductivity of each sample in every well. Comparing the mean values of electrical conductivity measured in each well
and that of the fraction of water in the discharge we found a highly significant linear correlation between these variables.
Considering the short–term variations observed in the wells discharges, the variations of the fraction of water in the discharges
revealed by the variations of the measured electrical conductivity in the samples, and the statistical distributions of the electrical
conductivity in each well, we concluded that the cause of the unusual patterns of the residence curves is the existence of at least two
feed zones with different enthalpies in the wells.
It will be necessary to take this into account in the design of future tracer studies in this field.
REFERENCES
Iglesias, E.R., Torres, R.J. and Reyes-Picasso, N., 2007, Estudio con trazadores en la zona Norte del campo geotérmico de Los
Humeros, Puebla – Primera etapa, Instituto de Investigaciones Eléctricas, Report IIE/11/13360/I-02/F, 105 pp.
Iglesias, E.R., Flores-Armenta, M., Torres, R.J., Ramírez-Montes, M., Reyes-Picasso, N., Reyes-Delgado., L., 2010, Simultaneous
liquid- and vapour-phase tracer study in the Tejamaniles área of the Los Azufres, Mexico, geothermal field. Proceedings
World Geothermal Congress 2010, 7 pp., paper No. 2227.
Rose, P.E., W.R. Benoit, and P.M. Kilbourne, 2001. The applicaction of polyaromatic sulfonates as tracers in geothermal
reservoirs. Geothermics, 30, pp. 617-640.
Rose, P.E., Rose, V. Capuno, A. Peh, P.M. Kilbourne, and C. Kasteler, 2002. The use of naphthalene sulfonates as tracers in high
temperature geothermal systems. Proceedings of the 23rd Annual PNOC-EDC Geothermal Conference, pp. 53-58.
Shook, G.M. and J.H. Foramann, 2005. Tracer interpretation using temporal moments on a spreadsheet. Report INL/EXT-05-00400
Revision 1, Idaho National Laboratory, Idaho, USA.