Embed Size (px)
Citation preview

Tracer Study Report Lockheed Martin Middle River Complex
2323 Eastern Boulevard, Middle River, Maryland
Prepared for:
Lockheed Martin Corporation
Prepared by:
Tetra Tech, Inc.
October 2014
Michael Martin, P.G. Regional Manager
Christopher Pike Project Manager
8072 TETRA TECH • LOCKHEED MARTIN MIDDLE RIVER COMPLEX • TRACER STUDY REPORT


TABLE OF CONTENTS
Section Page
ACRONYMS AND ABBREVIATIONS ............................................................................ v
1 BACKGROUND ................................................................................................ 1-1
2 GENERAL APPROACH AND METHODOLOGY .............................................. 2-1
2.1 LOGISTICS AND EQUIPMENT................................................................................... 2-2
2.2 BROMIDE SAMPLING PROCEDURE ........................................................................ 2-3
3 BLOCK G TRACER TESTING .......................................................................... 3-1
3.1 FIXED-BASE LABORATORY SAMPLING ................................................................ 3-1
3.2 GROUNDWATER TABLE MEASUREMENTS ........................................................... 3-1
3.3 INJECTION SOLUTION PREPARATION ................................................................... 3-2
3.4 INJECTION PROCEDURE ........................................................................................... 3-2
3.5 SUMMARY OF RESULTS – INJECTION EVENT #1 ................................................. 3-3
3.5.1 Process Parameters for Injection Event #1 .......................................................... 3-3
3.5.2 Injection Wells Parameters for Injection Event #1 .............................................. 3-5
3.5.3 Formation Hydraulic Response for Injection Event #1 ....................................... 3-6
3.5.4 Bromide Tracer Results for Injection Event #1 ................................................... 3-7
3.6 SUMMARY OF RESULTS – INJECTION EVENT #2 ................................................. 3-8
3.6.1 Process Parameters for Injection Event #2 .......................................................... 3-8
3.6.2 Injection Wells Parameters for Injection Event #2 ............................................ 3-10
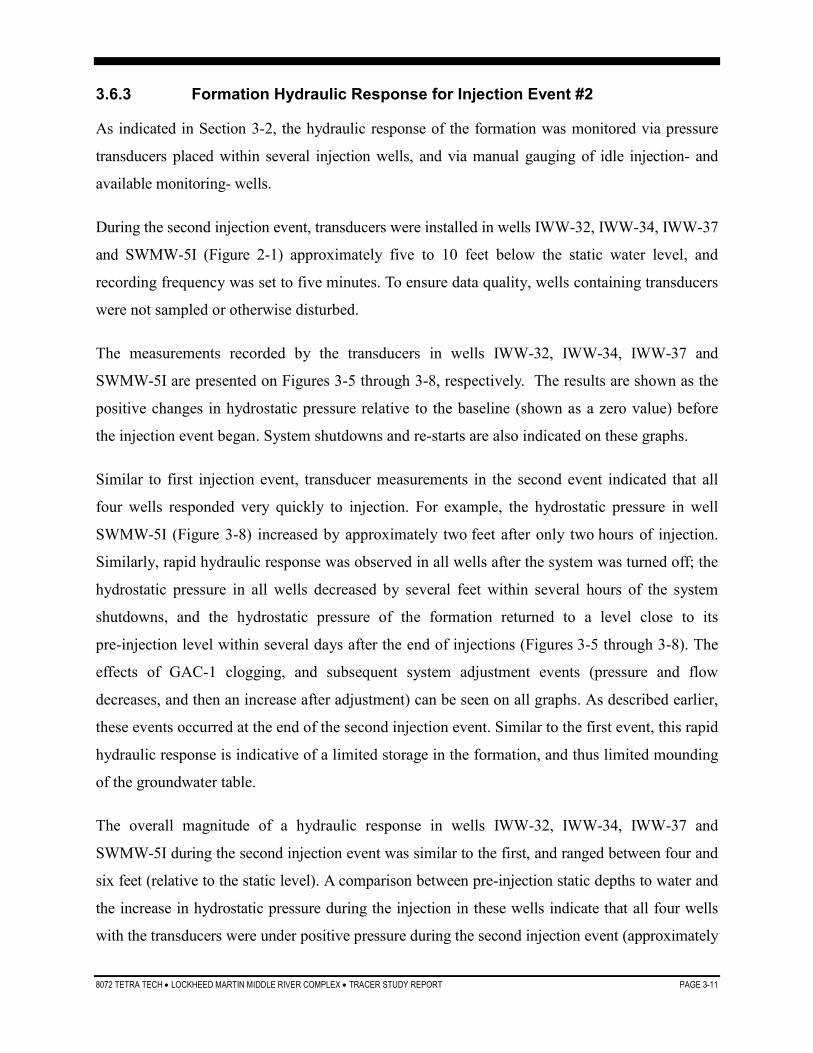
3.6.3 Formation Hydraulic Response for Injection Event #2 ..................................... 3-11
3.6.4 Bromide Tracer Results for Injection Event #2 ................................................. 3-12
8072 TETRA TECH • LOCKHEED MARTIN MIDDLE RIVER COMPLEX • TRACER STUDY REPORT PAGE i

TABLE OF CONTENTS (continued)
Section Page
4 BLOCK I TRACER TESTING ........................................................................... 4-1
4.1 FIXED-BASE LABORATORY SAMPLING ................................................................ 4-1
4.2 GROUNDWATER TABLE MEASUREMENTS ........................................................... 4-1
4.3 INJECTION SOLUTION PREPARATION ................................................................... 4-2
4.4 INJECTION PROCEDURE ........................................................................................... 4-2
4.5 INJECTION EVENT RESULTS SUMMARY ............................................................... 4-3
4.5.1 Process Parameters............................................................................................... 4-3
4.5.2 Injection Wells Parameters ................................................................................... 4-5
4.5.3 Formation Hydraulic Response............................................................................ 4-5
4.5.4 BromideTracer Results ........................................................................................ 4-6
5 SUMMARY AND CONCLUSIONS .................................................................... 5-1
6 REFERENCES .................................................................................................. 6-1
LIST OF TABLES Table 3-1 Block G Injection-Equipment Process Parameters — Injection Event #1
Table 3-2 Block G Injection-Well Parameters — Injection Event #1
Table 3-3 Gauging in Block G Wells — Injection Event #1
Table 3-4 Sampling Results for Block G Bromide Tracer Testing
Table 3-5 Block G Injection Equipment Process Parameters — Injection Event #2
Table 3-6 Block G Injection-Well Parameters — Injection Event #2
Table 3-7 Gauging in Block G Wells — Injection Event #2
Table 4-1 Block I Injection Equipment Process Parameters
Table 4-2 Block I Injection-Well Parameters
Table 4-3 Gauging in Block I Wells
Table 4-4 Sampling Results for Block I Bromide Tracer Testing
PAGE ii 8072 TETRA TECH • LOCKHEED MARTIN MIDDLE RIVER COMPLEX • TRACER STUDY REPORT

TABLE OF CONTENTS (CONTINUED)
LIST OF FIGURES Figure 2-1 Block G Bromide Sampling and Injection Locations
Figure 2-2 Block I Bromide Sampling and Injection Locations
Figure 3-1 LMC MRC Tracer Study in Block G: Monitoring Well SWMW-2I Hydraulic Response
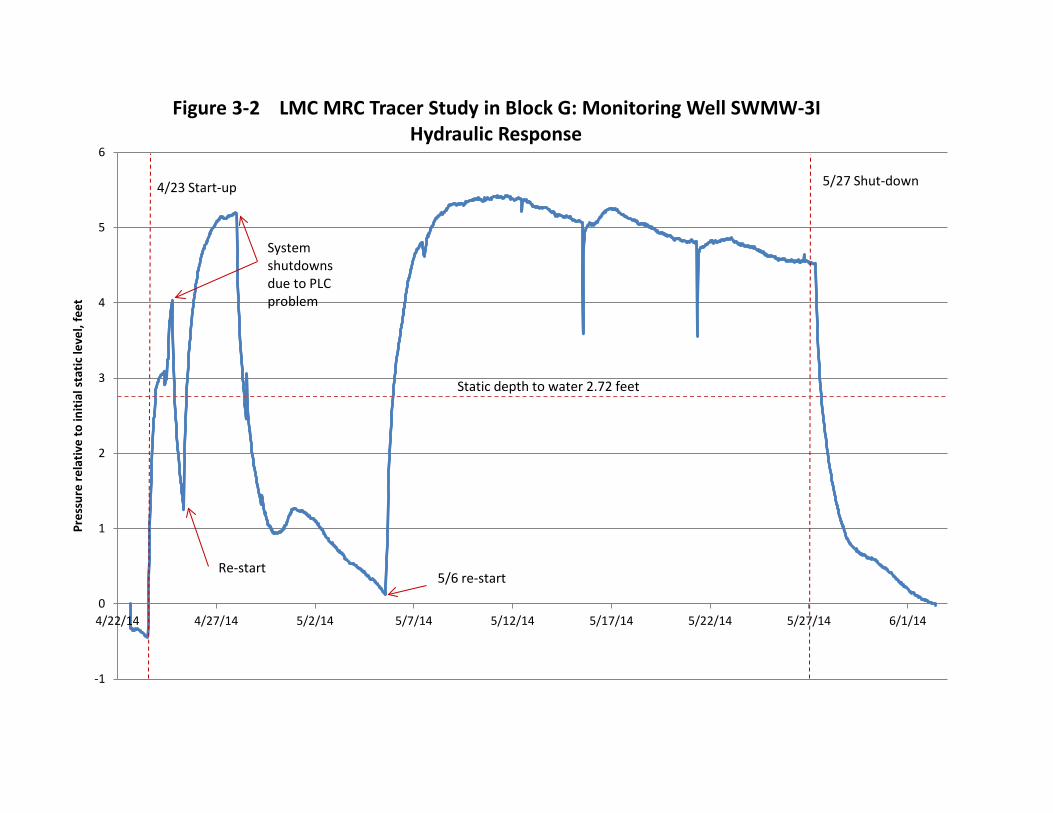
Figure 3-2 LMC MRC Tracer Study in Block G: Monitoring Well SWMW-3I Hydraulic Response
Figure 3-3 LMC MRC Tracer Study in Block G: Monitoring Well MW-14B Hydraulic Response
Figure 3-4 LMC MRC Tracer Study in Block G: Monitoring Well SWMW-5I Hydraulic Response (First Injection Event)
Figure 3-5 LMC MRC Tracer Study in Block G: Monitoring Well IWW-32 Hydraulic Response
Figure 3-6 LMC MRC Tracer Study in Block G: Monitoring Well IWW-34 Hydraulic Response
Figure 3-7 LMC MRC Tracer Study in Block G: Monitoring Well IWW-37 Hydraulic Response
Figure 3-8 LMC MRC Tracer Study in Block G: Monitoring Well SWMW-5I Hydraulic Response (Second Injection Event)
Figure 4-1 LMC MRC Tracer Study in Block I: Monitoring Well MPN-2I Hydraulic Response
Figure 4-2 LMC MRC Tracer Study in Block I: Monitoring Well IWN Hydraulic Response
Figure 4-3 LMC MRC Tracer Study in Block I: Monitoring Well MPN-25 Hydraulic Response
Figure 4-4 LMC MRC Tracer Study in Block I: Monitoring Well OW-1B Hydraulic Response
8072 TETRA TECH • LOCKHEED MARTIN MIDDLE RIVER COMPLEX • TRACER STUDY REPORT PAGE iii

This page intentionally left blank.
PAGE iv 8072 TETRA TECH • LOCKHEED MARTIN MIDDLE RIVER COMPLEX • TRACER STUDY REPORT

ACRONYMS AND ABBREVIATIONS
CB catch basin
DO dissolved oxygen
°F degrees Fahrenheit
gph gallon(s) per hour
gpm gallon(s) per minute
in. Hg inches of mercury
IW injection well
lbs pounds
Lockheed Martin Lockheed Martin Corporation
mg/L milligram(s) per liter
mL/min milliliters per minute
MP metering pump
MRC Middle River Complex
NMW new monitoring well
O&M operations and maintenance
ORP oxidation-reduction potential
PLC programmable logic controller
psig pound(s) per square inch gauge
SDS safety data sheet
TCE trichloroethene
Tetra Tech Tetra Tech, Inc.
USEPA United States Environmental Protection Agency
UST underground storage tank
8072 TETRA TECH • LOCKHEED MARTIN MIDDLE RIVER COMPLEX • TRACER STUDY REPORT PAGE v

This page intentionally left blank.
PAGE vi 8072 TETRA TECH • LOCKHEED MARTIN MIDDLE RIVER COMPLEX • TRACER STUDY REPORT

Section 1
Background
On behalf of Lockheed Martin Corporation (Lockheed Martin), Tetra Tech, Inc. (Tetra Tech) has
performed a tracer study at the Lockheed Martin Corporation Middle River Complex (MRC) at
2323 Eastern Boulevard in Middle River, Maryland. This tracer study was performed in
accordance with the Groundwater Remediation System Operations and Maintenance Manual
(O&M manual) for the Lockheed Martin Middle River Complex (Tetra Tech, 2014). Refer to the
appropriate sections of the operations and maintenance manual for background information,
remediation system process-equipment and controls descriptions, and for specific operation and
maintenance procedures.
The groundwater response action at the Middle River Complex implements enhanced anaerobic
bioremediation-processes in three areas of the Middle River Complex that have high
concentrations of trichloroethene (TCE) in groundwater: the southeastern trichloroethene area
(Block E), the southwestern trichloroethene area (Block G), and the northern trichloroethene area
(Block I). Amendments will be injected into the subsurface using rows of semi-permanent
injection wells connected (via underground conveyance piping) to injection equipment in each of
the three trichloroethene areas (Appendix C of the operations and maintenance manual,
Drawings C-2, C-3, C-4). Field tracer-testing was recommended before system startup because
injected fluid pathways are difficult to predict accurately for the low permeability, heterogeneous
geology of the Middle River Complex. The main objectives of tracer testing were to:
• evaluate preferential pathways for injected fluid
• determine optimal injection rates
• verify achievable design-injection volumes
• verify the performance and design of injection wells
• determine the effects injection has on the aquifer
8072 TETRA TECH • LOCKHEED MARTIN MIDDLE RIVER COMPLEX • TRACER STUDY REPORT PAGE 1-1

• determine if injected material is being transported from the injection areas via flow
through utilities or utility bedding, and if such transport is occurring, determine how to prevent it from occurring during the groundwater response action
• test and confirm the full functionality of the injection system, including the process equipment, controls, and communications
This report provides the results of the tracer testing in the following two areas:
• southwestern chlorinated volatile organic compounds area (Block G)
• northern chlorinated volatile organic compounds area (Block I)
Tracer testing was performed using treated pH-adjusted potable water with added
sodium-bromide tracer and the same processing equipment and controls as will be used in the
enhanced anaerobic bioremediation work. Testing also included process equipment startup,
communications testing, and de-bugging.
PAGE 1-2 8072 TETRA TECH • LOCKHEED MARTIN MIDDLE RIVER COMPLEX • TRACER STUDY REPORT

Section 2 General Approach and Methodology
Tracer testing in each area consisted of the following general components:
a) The injection equipment containers were placed in the Block G and Block I test areas as shown on Figures 2-1 and 2-2. (Tracer testing will be performed in Block E after contamination issues associated with the underground storage tanks (UST) encountered in Block E have been resolved.)
b) The underground injection lines, potable-water line, and power supply were connected to the equipment containers.
c) Baseline performance-monitoring sampling was performed, including bromide sampling.
d) Process equipment, controls, and communications were configured and tested.
e) Test injections were performed using water (with chlorine and dissolved oxygen removed), tracer, and pH buffer (sodium bicarbonate). Specific test configurations for each area are described in Sections 3 and 4 below. The following general procedure was used at each area:
• The system was configured to simultaneously inject fluid with tracer into several selected injection wells.
• Injection rates were set as indicated in Sections 3 and 4.
• Pressure heads in the injection interval were measured, and injection rates were adjusted as necessary.
• Utilities, outfalls, and channels were visually examined.
• Samples were collected to determine tracer concentrations in monitoring wells, utilities, and outfalls.
Tracer testing results will be used to determine operational injection rates and wellhead pressures
for the full-scale injection events.
8072 TETRA TECH • LOCKHEED MARTIN MIDDLE RIVER COMPLEX • TRACER STUDY REPORT PAGE 2-1

2.1 LOGISTICS AND EQUIPMENT
Tracer test equipment and logistics were selected to ensure safety during field procedures, and to
minimize risk while achieving the stated test objectives. The following steps summarize general
logistics and equipment used for tracer testing:
1) Injection-equipment modules designed to perform full-scale injection events were used for tracer injection. Two equipment modules were used for the tracer tests.
2) Tracer tests were performed simultaneously in Blocks G and I. The equipment modules were positioned as shown on Figures 2-1 and 2-2.
3) For each tracer test, the pH adjustment tank (T-2) in the equipment module was filled with 330 gallons of treated potable water; sodium bromide tracer was then placed in tank T-2. Sodium bromide is a nontoxic tracer commonly used for groundwater studies. Refer to Appendix E of the O&M manual (Tetra Tech, 2014) for the sodium-bromide safety data sheet (SDS).
4) Sodium bicarbonate buffer was also added to tank T-2. Sodium bicarbonate is a common nontoxic chemical often used as a gentle pH-buffering agent. Appendix E of the O&M manual (Tetra Tech, 2014) contains the SDS for sodium bicarbonate. The mixing pump in tank T-2 was activated for approximately 60–120 minutes to dissolve the added chemicals.
5) Operation of the injection system was started using the start-up procedures described in Section 3.1 of the O&M manual (Tetra Tech, 2014). In addition, injection system equipment was configured as described in Section 3.1.3 of the O&M manual (Tetra Tech, 2014). Injection-well configurations for each specific test area are described in Sections 3, 4, and 5 below.
6) Before starting the injection test at each location, data-logging liquid-level transducers were placed in selected wells to automatically record liquid levels. Following each test in each area, the data were downloaded and used to determine the effects the injections had on groundwater levels in the injection area. Two injection events were conducted in Block G, at two sets of seven to eight selected wells. One injection event was conducted in Block I, using all eight Block I injection wells.
7) During injection, site utilities and low laying areas with surface water in the injection areas (including outfalls) were visually inspected to note any change in flow or water characteristics. The active injection wellheads and all wells near the injection wells were also checked for leaks and daylighting of tracer fluid.
8) The presence of bromide tracer was determined by collecting analytical samples from monitoring wells at each injection location, and from various utility locations. Sampling locations specific to each test area are described in Sections 3 and 4 of this document.
PAGE 2-2 8072 TETRA TECH • LOCKHEED MARTIN MIDDLE RIVER COMPLEX • TRACER STUDY REPORT

9) Injection equipment operated automatically, with little involvement from the system
operator. However, field personnel monitored injections at least three times during the first week of operation in each area, and then weekly for the remaining study period.
2.2 BROMIDE SAMPLING PROCEDURE
The results of the bromide tracer analyses will be used to estimate the effects injection has on the
aquifer, and to determine if transport via site utilities is occurring. This information will be used
to finalize the full-scale injection events. Collecting representative groundwater samples is
therefore important for tracer analyses, so a standard low-flow sampling technique was used.
Monitoring wells were purged using a peristaltic pump and disposable polyethylene tubing
placed in the middle of the screen. The pumping rate ranged between 100–300 milliliters per
minute (mL/min). The purge rate depended on water stabilization and how fast the well
recharged without drawdown below the initial static water level.
During groundwater purging, water-level-drawdown measurements and groundwater parameters
(such as pH, temperature, specific conductance, dissolved oxygen [DO], and oxidation-reduction
potential [ORP]) were collected every five to 10 minutes or after each purge volume, whichever
was quicker, until purging was complete. These data were recorded in the appropriate site-
specific logbook, and on low-flow-purge data sheets. Water-quality parameters were measured
using an inline water-quality meter.
Purging was considered complete when the water quality parameters had stabilized, when the
well had been purged dry, when three saturated well casing volumes have been removed or when
purging had occurred for 90 minutes. Stabilization was achieved when three consecutive
readings, taken at five-minute intervals, were within the following parameters:
• ±0.1 standard units for pH
• ±3% for specific conductance and temperature
• ±10% for DO and ORP
• less than 10 nephalometric turbidity units for turbidity
—or—
• for a maximum of one 90 minutes
8072 TETRA TECH • LOCKHEED MARTIN MIDDLE RIVER COMPLEX • TRACER STUDY REPORT PAGE 2-3

Samples from utilities were collected by filling the sample bottle directly from the water flowing
in the utility; field parameters were not collected for those samples.
The samples were shipped to a fixed-based laboratory (Analytical Laboratory Services,
Middletown, Pennsylvania) to be analyzed for bromide using United States Environmental
Protection Agency (USEPA) Method 300.0 (“Anions, Ion Chromatography”). The method
detection-limit for bromide samples was 0.050 milligrams per liter (mg/L). Samples were
collected in 250 milliliter (mL)-unpreserved plastic bottles, and were shipped on ice. Samples
were analyzed within method-specific holding time of 28 days.
PAGE 2-4 8072 TETRA TECH • LOCKHEED MARTIN MIDDLE RIVER COMPLEX • TRACER STUDY REPORT

Prin
t to
PD
F w
ithou
t thi
s m
essa
ge b
y pu
rcha
sing
nov
aPD
F (
http
://w
ww
.nov
apdf
.com
/)

Prin
t to
PD
F w
ithou
t thi
s m
essa
ge b
y pu
rcha
sing
nov
aPD
F (
http
://w
ww
.nov
apdf
.com
/)

Section 3
Block G Tracer Testing
This section describes the layout field procedures and monitoring performed for the tracer test in
Block G.
3.1 FIXED-BASE LABORATORY SAMPLING
Groundwater samples were collected from existing monitoring wells (MW-12A, MW-12B,
SWMW-4S, SWMW-4I, and SWMW-1I) in Block G and analyzed for bromide. Samples were
also collected at two swale locations within Block G (Swale 1 and Swale 2), and at one
stormwater location (G-Outfall). Refer to Figure 2-1 for sampling locations.
Appendix B of the O&M manual (Tetra Tech, Inc. [Tetra Tech], 2014) contains specific
parameters and procedures for baseline sampling. Bromide samples were collected before tracer
injection began (baseline), several times during the tracer injection event, and after the tracer
injection was finished. Bromide sampling procedure and analytical laboratory requirements are
described in Section 2-2.
3.2 GROUNDWATER TABLE MEASUREMENTS
Groundwater levels were monitored weekly via manual gauging of monitoring wells and via
pressure transducers placed within several injection wells (Figures 3-1 through 3-8). Before the
transducers were installed, water levels in each well were measured using an electronic water-
level meter. Transducers collected data during the entire test. Transducers were installed in each
location approximately five to 10 feet below the static water level; recording frequency was set
to five minutes. To ensure data quality, wells containing transducers were not sampled or
otherwise disturbed. The transducers were removed after tracer testing was finished to allow the
groundwater table to recover to static conditions. Data from the transducers were downloaded
and assembled as graphs (Figures 3-1 through 3-8).
8072 TETRA TECH • LOCKHEED MARTIN MIDDLE RIVER COMPLEX • TRACER STUDY REPORT PAGE 3-1

Groundwater levels in existing monitoring and injection wells near the active injection location
were manually measured before tracer testing began. Groundwater levels within these wells were
also measured three times during the first week of each injection event, and weekly thereafter.
3.3 INJECTION SOLUTION PREPARATION
The following procedure was used to prepare the injection solution in tank T-2 during Block G
tracer testing:
1) Tank T-2 was filled with approximately 330 gallons of treated (dechlorinated and deoxygenated) potable water.
2) Fifty-five pounds (lbs) of sodium bromide were placed into tank T-2.
3) Five 15-lbs bags (75 lbs total) of sodium bicarbonate were added to tank T-2.
4) The mixing pump in tank T-2 was activated for 60–120 minutes to dissolve the chemicals. The tank was checked to verify that mixing was adequate and that no clumping occurred at the bottom of the tank.
5) The tracer-fluid metering-pump (MP-2) dosage was adjusted such that the entire tank volume was injected during the injection event. Pump MP-2 used the signal from electronic flow-meter FMT-1 to automatically maintain a constant tracer concentration in the injected stream, regardless of changes in the injection flow rate.
3.4 INJECTION PROCEDURE
Block G tracer testing consisted of two events:
• Injection event #1—injection into seven wells in the central area of Block G (May 6, 2014 through May 27, 2014).
• Injection event #2—injection into a second of seven wells in the southern area of Block G, closer to Cow Pen Creek (June 9, /2014 through July 10, 2014).
Equipment for the injection system was prepared and configured for operation as described in
Sections 3.1 and 3.1.3 of the O&M manual (Tetra Tech, 2014). Seven injection wells (IWW-4,
IWW-13, IWW-17, IWW-26, IWW-29, IWW-32, and IWW-37) in the central area of the site
were connected to the injection manifold for the first injection event. The injection system was
activated on May 6, 2014, and the injection rate for each connected well was set to
approximately 0.15 to 0.2 gallons per minute (gpm), for a total injection rate of approximately
PAGE 3-2 8072 TETRA TECH • LOCKHEED MARTIN MIDDLE RIVER COMPLEX • TRACER STUDY REPORT

1-1.5 gpm (seven wells connected). Metering pump MP-2 was activated to begin injection of
tracer solution from tank T-2 into the injection manifold. Settings for metering pump MP-2 are
described above in Section 3.3.
The entire full-scale design volume (6,400 gallons per well, or approximately 44,000 gallons
total) was injected during the first injection event. The average flow rate was 0.19 gpm per well,
over a 24-day duration. The injection event was finished on May 27, 2014. The entire volume of
tank T-2 (approximately 330 gallons) containing 55-lbs of sodium bromide tracer and 75-lbs of
sodium bicarbonate was injected by metering pump MP-2 into the treated water stream; the
average concentrations of tracer (sodium bromide) and buffer (sodium bicarbonate) were 150
mg/L and 205 mg/L, respectively. The site operator visited the site at least three times during the
first week of testing, then weekly thereafter.
Injection event #2 began on June 9, 2014. Injection wells IWW-30, IWW-31, IWW-33,
IWW-35, IWW-36, IWW-38, and IWW-39 were connected for this event. A similar (as
compared to first injection event) injection solution (sodium bromide and sodium bicarbonate)
was prepared in tank T-2. The system was re-activated, and the second injection event was
performed. The average flow rate during the second injection event was 0.14 gpm per well, over
a duration of 30 days. This injection event was finished on July 10, 2014.
3.5 SUMMARY OF RESULTS – INJECTION EVENT #1
This section summarizes the results of the first injection event. Injection-system process
parameters (injection rates, pressures), injection wells parameters, the formation hydraulic
response, and bromide tracer results follow.
3.5.1 Process Parameters for Injection Event #1
The Block G injection system operated intermittently between April 23-28, 2014, but was shut
down due to problems with programmable logic controller (PLC) software. The PLC software
problems were fixed, and the system resumed continuous operation on May 6, 2014 until the end
of event on May 27, 2014.
8072 TETRA TECH • LOCKHEED MARTIN MIDDLE RIVER COMPLEX • TRACER STUDY REPORT PAGE 3-3

System process parameters for the first injection event are summarized in Table 3-1. The
parameters discussed below are presented in the flow direction starting at the upstream
parameters.
The potable water pressure was stable during the entire injection event, and ranged from 73 to 76
pound(s) per square inch gauge (psig) [Table 3-1, first data column]. This pressure was in excess
of the required injection pressure, and was reduced using pressure regulator PR-1.
The outlet pressure for pressure regulator PR-1 (same as GAC-1 inlet pressure) was adjusted to
approximately 10 psig; it remained near this level throughout the injection event (Table 3-1,
second data column). The GAC-1 outlet pressure (same as filter PF-1 inlet pressure) varied
mostly from 5 to 6.5 psig, indicating that no clogging occurred across the carbon bed (Table 3-1,
third data column). Outlet pressure for filter PF-1 varied between 6.5 and 8 psig, indicating that
no clogging occurred across the filter (Table 3-1, fourth data column). The filter-outlet pressure
was slightly higher than the upstream outlet pressure at GAC-1, because the pressure gauge was
mounted lower than at the GAC-1 outlet.
The injection manifold pressure was consistently moderate (mostly between5 and 6 psig) during
the injection event [Table 3-1, fifth data column]). The injection pressure was maintained as
consistently as possible to ensure that no excessive pressure would be applied to the injection
wells.
The total injection rate (measured by electronic flow-meter FMT-1) during the first injection
event ranged between 1-1.5 gpm (Table 3-1, sixth data column) or approximately 0.19 gpm
(average) per injection well for the duration of the event. This injection rate is lower than what
was achieved during the injection test performed in February 2011. Higher injection rates can be
obtained by increasing the manifold injection pressure, and thus, injection pressure at the
well-head. However, to be conservative, the manifold injection pressure was kept below 6 psig as
much as possible to avoid preferential channeling and day-lighting of injection fluid.
The vacuum applied to hollow membrane contactor MC-1 ranged from 23 to 27 inches of
mercury (in. Hg). This vacuum is sufficient to remove the bulk of dissolved oxygen from an
aqueous stream (Table 3-1, seventh data column).
PAGE 3-4 8072 TETRA TECH • LOCKHEED MARTIN MIDDLE RIVER COMPLEX • TRACER STUDY REPORT

Based on the reading of the mechanical flow totalizer (Table 3-1, eighth data column), a total
volume of 44,765 gallons was injected during the first injection event (6,395 gallons average per
injection well). This is very close to the injection volume for the full-scale groundwater treatment
in Block G (6,400 gallons per injection well).
The electronic flow-meter FMT-1 indicated a slightly lower total injection volume of
41,865 gallons during the first injection event (Table 3-1, ninth data column). The volume of the
tracer solution tank (330 gallons, with 55 lbs sodium bromide and 75 lbs sodium bicarbonate)
was injected uniformly over the event (Table 3-1, tenth data column).
3.5.2 Injection Wells Parameters for Injection Event #1
The parameters for individual injection wells include the manifold branch injection pressure
(measured downstream of the flow regulating valve), the actual wellhead pressure, and the
injected volume, as measured by the flow totalizer at each injection well (Table 3-2).
The manifold branch injection pressures (measured on individual injection lines downstream of
the flow-reducing regulating valve) ranged from 0-3.5 psig, and the average value for all wells
was 1.8 psig. This parameter is important as it represents the actual line pressure applied to
individual injection wells. The injection pressures of the manifold branch were kept at these low
levels (0-3.5 psig with an average of 1.8 psig) to limit potential day-lighting and preferential
channeling.
Wellhead injection pressures (measured at gauges installed within injection wells manholes)
ranged from 1.5 to 6.5 psig, with an average value (all wells) of 3.9 psig. Wellhead injection
pressures were slightly higher (typically 2 psig) than the manifold-branch injection pressures, as
the wellheads were 4-5 feet lower as compared to the injection manifold; therefore, additional
corresponding hydrostatic pressure was added. The highest wellhead pressure (6.0 to 6.5 psig)
was measured in well IWW-37, which was in the low spot at the most downstream end of the
area.
The total injected volume varied among injection wells, and was dependent upon hydraulic
conductivity of the local formation. The wells in the most conductive areas (IWW-13 and
IWW-32) received approximately 1.5 times greater volume, as compared to the rest of the wells.
The median injected volume was 5,657 gallons, and the average injection volume per well was
8072 TETRA TECH • LOCKHEED MARTIN MIDDLE RIVER COMPLEX • TRACER STUDY REPORT PAGE 3-5

6,045 gallons based on totalizer FT-1 reading. The full-design injection-volume per well is 6,400
gallons. Well IWW-37 received the least flow; it operated intermittently due to a plumbing
problem which was fixed after the first injection event was finished.
3.5.3 Formation Hydraulic Response for Injection Event #1
As indicated in Section 3-2, the hydraulic response of the formation was monitored via pressure
transducers placed within several injection wells, and also via manual gauging of available
monitoring and idle injection wells. Transducers were installed in wells SWMW-2I, SWMW-3I,
MW-14B, SWMW-5I (Figure 2-1), approximately five to 10 feet below the static water level.
The recording frequency of the transducers was set to five minutes. To ensure data quality, wells
containing transducers were not sampled or otherwise disturbed.
Measurements recorded by the transducers in wells SWMW-2I, SWMW-3I, MW-14B,
SWMW-5I are on Figures 3-1 through 3-4, respectively. Results are shown as the positive
changes in hydrostatic pressure relative to the baseline (shown as zero value) before the injection
event began. System shutdown and re-start events are also indicated on these graphs.
Transducers measurement results indicate that all four wells responded very quickly to injection.
For example, the hydrostatic pressure in well SWMW-2I (Figure 3-1) increased by
approximately two feet after only four hours. Similarly, rapid hydraulic response was observed
in all wells after the system was turned off; the hydrostatic pressure in all wells decreased by
several feet within several hours of system shutdown. The hydrostatic pressure of the formation
returned close to pre-injection levels within several days after the injection event ended
(Figures 3-1 through 3-4). (System shutdown and restart events occurred several times at the
beginning of the first injection event, when the system had to be turned off and re-started because
of a problem with PLC software program.) This rapid hydraulic response indicates limited
storage in the formation, resulting in limited mounding of the groundwater table.
The overall magnitude of hydraulic response in wells SWMW-2I, SWMW-3I, MW-14B and
SWMW-5I was fairly consistent, and ranged between 4 and 6 feet above the static level. The
increase in hydrostatic pressure during the injection event indicates that all four wells with
transducers were under positive pressure during the tracer test (approximately 1-3 feet). However,
day-lighting or preferential channeling into low-laying areas was not observed. This is likely due to
PAGE 3-6 8072 TETRA TECH • LOCKHEED MARTIN MIDDLE RIVER COMPLEX • TRACER STUDY REPORT

the lower permeability of shallow soil, and higher horizontal conductivity of the formation (as
compared to a vertical direction in the formation).
Groundwater levels in several existing monitoring and injection wells near the 16 active injection
wells were also manually gauged before the event started and while the injection was performed.
Manual gauging results for area wells are summarized in Table 3-3. The baseline (pre-injection)
measurements in these wells indicate that the depth to the groundwater table becomes shallower in
the down-gradient direction (closer to Cow Pen Creek). For example, baseline depths to
groundwater in up-gradient injection wells (IWW-3, IWW-5, and IWW-12) were between 6 and
7 feet below ground surface. Static depths to water in the middle portion of Block G were generally
between 2 and 3 feet below ground surface, while static depths to water in the down-gradient
portion of Block G were generally between 1 and 2 feet below ground surface.
All 16 wells responded when the injection began. The magnitude and character of hydraulic
response were similar to that measured by the transducers. As the injection event progressed, most
wells were observed under positive hydraulic pressure (i.e., they overflowed when opened). These
wells are noted in Table 3-3 with the notation “pressure.” No day-lighting or preferential
channeling of the injected fluid was observed on the ground surface or in low-lying areas.
3.5.4 Bromide Tracer Results for Injection Event #1
During tracer testing, a sodium bromide tracer was injected into the formation and analytical
samples were collected from several monitoring wells (MW-12A, MW-12B, SWMW-1I,
SWMW-4S, and SWMW-4I) two surface water locations (Swale-1 and Swale-2), and from a
stormwater location (G-Outfall). Figure 2-1 shows sampling locations, while analytical sampling
results and pertinent injection parameters (e.g., injected tracer concentrations, quantities, and the
injected volumes) are presented on Table 3-4.
The arrival of the bromide tracer was clearly detected in well SWMW-1I, where its
concentration increased from 43 µg/L (May 15, 2014) to 2,700 µg/L (May 21, 2014), and further
increased to 9,700 µg/L (May 27, 2014) at the end of Injection Event #1. The distance from the
nearest injection location (IWW-13) to the point of detection (SWMW-1I) was 15 feet
(side-gradient). The arrival of bromide at another monitoring well in the injection area
(SWMW-4I) was detected much later (7,500 µg/L on June 10, 2014), because the distance from
8072 TETRA TECH • LOCKHEED MARTIN MIDDLE RIVER COMPLEX • TRACER STUDY REPORT PAGE 3-7

the nearest injection location (IWW-17) to that location was twice as far (30 feet cross-gradient).
Thus, the bromide tracer traveled a maximum distance of 30 feet from injection location, which
indicates that adequate distribution of the injected fluid was achieved.
Bromide results from the shallow surface-water location (Swale 1, approximately 20 feet from
the nearest active injection well [IWW-29]) show no increase over background levels. The
bromide levels in Swale-1 ranged from 120 to 140 µg/L, indicating that no injected fluid traveled
to nearby surface water in the low-lying areas. Likewise, the bromide level (20 µg/L) in the
sample collected on May 15, 2014 at the stormwater outfall location was also within typical
background levels for bromide, again indicating that injection fluid did not travel via the storm
drain utilities. A slightly elevated bromide level (390 µg/L) was detected at the beginning of
injection event #1 in SWMW-4I, probably due to residual bromide from the injection test
conducted in this area in November 2011.
3.6 SUMMARY OF RESULTS – INJECTION EVENT #2
This section summarizes the results of the second injection event conducted in Block G.
Injection-system process parameters (injection rates, pressures), injection wells parameters, the
formation hydraulic response, and bromide tracer results follow.
3.6.1 Process Parameters for Injection Event #2
The system process parameters for the second injection event are summarized in Table 3-5;
parameters discussed below are presented by the flow direction starting with upstream
parameters.
Potable water pressure was stable during the entire injection event, with a range of 70-76 psig
(Table 3-5, first data column). This pressure was in excess of the required injection pressure, and
was reduced using pressure regulator PR-1.
The outlet pressure at pressure regulator PR-1 (same as GAC-1 inlet pressure) was adjusted to
approximately 10 psig, and remained close to this level for the majority of the event (Table 3-5,
second data column). However, after almost two weeks of injection, signs of activated carbon
clogging in GAC-1 were observed, and the outlet pressure at pressure regulator PR-1 was
PAGE 3-8 8072 TETRA TECH • LOCKHEED MARTIN MIDDLE RIVER COMPLEX • TRACER STUDY REPORT

adjusted higher on July 1 and July 7, 2014 to compensate for decreasing pressure at the GAC-1
outlet.
Outlet pressure at GAC-1 (same as filter PF-1 inlet pressure) mostly varied from 4.5 psig at the
start of the event to 3.0 psig on July 1, 2014. The pressure differential across the GAC-1 unit
increased to 14 psig by the end of injection event, indicating that clogging occurred across the
carbon bed (Table 3-5, third data column). The potable water source was very turbid, and likely
contained suspended solids that caused GAC-1 clogging. Measures will be taken to address this
issue during full-scale groundwater treatment, and will include carbon bed backwash or
replacement, and possibly additional filtration at the GAC-1 inlet.
The outlet pressure at filter PF-1 varied from 5 to 7 psig during the injection event, indicating
that no clogging occurred across the filter (Table 3-5, fourth data column). The outlet pressure
was slightly higher than that of the (upstream) GAC-1 outlet, because the pressure gauge at filter
PF-1 was mounted lower than on the gauge at the GAC-1 outlet.
The injection manifold pressure mostly ranged between 2 and 5 psig during the injection event
#2 (Table 3-5, fifth data column).
The total injection rate (as measured by electronic flow-meter FMT-1) typically ranged between
0.5 and 1.1 gpm during this injection event (Table 3-5, sixth data column), with an average of
approximately 0.14 gpm per injection well. This injection rate is lower than what was achieved
during the first injection event due to GAC-1 clogging and correspondingly lower injection
pressure.
The vacuum applied to the hollow membrane contactor MC-1 ranged from 23.5 to 24.5 in. Hg,
and is sufficient to remove the bulk of dissolved oxygen from the aqueous stream (Table 3-5,
seventh data column).
Based on the readings from the mechanical flow totalizer (Table 3-5, eighth data column),
41,405 gallons of fluid was injected into seven wells during the second injection event, an
average of 5,915 gallons per injection well. This is slightly lower than the injection volume for
full-scale groundwater treatment in Block G (6,400 gallons per injection well), and is likely due
to an insufficient injection rate at well IWW-35 (see discussion in the following section).
8072 TETRA TECH • LOCKHEED MARTIN MIDDLE RIVER COMPLEX • TRACER STUDY REPORT PAGE 3-9

Without well IWW-35, the average injection volume per well is 6,643 gallons which is very
close to the design injection volume (6,400 gallons).
Electronic flow-meter FMT-1 indicated a slightly lower total injection volume (39,332 gallons)
for the second injection event (Table 3-5, ninth data column). The entire volume of tracer
solution (330 gallons, with 55 lbs sodium bromide and 75 lbs sodium bicarbonate) was injected
uniformly during the event (Table 3-5, tenth data column).
3.6.2 Injection Wells Parameters for Injection Event #2
The individual injection wells parameters for the second injection event in Block G are
summarized in Table 3-6.
Injection pressures for the manifold branch (as measured on individual injection lines
downstream of the flow-reducing regulating valve) ranged from negative to 2.0 psig, with the
average value for all wells being negative. The manifold branch injection pressures were
generally lower during Injection Event #2 due to GAC-1 clogging and therefore reduced
manifold pressure.
Wellhead injection pressures (measured at gauges installed within injection wells manholes)
ranged from 0 to 6.0 psig, with an average 3.7 psig. These values were slightly lower than those
observed in the first injection event #1. Wellhead injection pressures were slightly higher
(typically approximately 2 psig higher) than the injection pressures for the manifold branch. The
wellheads were 4-5 feet lower than the injection manifold; thus, corresponding hydrostatic
pressure was added.
The total injected volume (and therefore the injection rates per well) were more uniform during
the second injection event at Block G because more frequent adjustments were made to flow
regulating valves at the injection manifold. Well IWW-35 was an outlier (and therefore not used
to calculate flow uniformity, median, or average values), and had a lower injection flow rate as
compared to other wells. This was likely due to some construction deficiency such as a pinched
injection line. The wells with the highest injection rate (IWW-30 and IWW-38) received
approximately 19% greater volume compared to the well with the lowest injection rate
(IWW-31). Based on the reading at totalizer FT-1, the median injected volume was
5,856 gallons, and the average injection volume per well was 5,875 gallons.
PAGE 3-10 8072 TETRA TECH • LOCKHEED MARTIN MIDDLE RIVER COMPLEX • TRACER STUDY REPORT
3.6.3 Formation Hydraulic Response for Injection Event #2
As indicated in Section 3-2, the hydraulic response of the formation was monitored via pressure
transducers placed within several injection wells, and via manual gauging of idle injection- and
available monitoring- wells.
During the second injection event, transducers were installed in wells IWW-32, IWW-34, IWW-37
and SWMW-5I (Figure 2-1) approximately five to 10 feet below the static water level, and
recording frequency was set to five minutes. To ensure data quality, wells containing transducers
were not sampled or otherwise disturbed.
The measurements recorded by the transducers in wells IWW-32, IWW-34, IWW-37 and
SWMW-5I are presented on Figures 3-5 through 3-8, respectively. The results are shown as the
positive changes in hydrostatic pressure relative to the baseline (shown as a zero value) before
the injection event began. System shutdowns and re-starts are also indicated on these graphs.
Similar to first injection event, transducer measurements in the second event indicated that all
four wells responded very quickly to injection. For example, the hydrostatic pressure in well
SWMW-5I (Figure 3-8) increased by approximately two feet after only two hours of injection.
Similarly, rapid hydraulic response was observed in all wells after the system was turned off; the
hydrostatic pressure in all wells decreased by several feet within several hours of the system
shutdowns, and the hydrostatic pressure of the formation returned to a level close to its
pre-injection level within several days after the end of injections (Figures 3-5 through 3-8). The
effects of GAC-1 clogging, and subsequent system adjustment events (pressure and flow
decreases, and then an increase after adjustment) can be seen on all graphs. As described earlier,
these events occurred at the end of the second injection event. Similar to the first event, this rapid
hydraulic response is indicative of a limited storage in the formation, and thus limited mounding
of the groundwater table.
The overall magnitude of a hydraulic response in wells IWW-32, IWW-34, IWW-37 and
SWMW-5I during the second injection event was similar to the first, and ranged between four and
six feet (relative to the static level). A comparison between pre-injection static depths to water and
the increase in hydrostatic pressure during the injection in these wells indicate that all four wells
with the transducers were under positive pressure during the second injection event (approximately
8072 TETRA TECH • LOCKHEED MARTIN MIDDLE RIVER COMPLEX • TRACER STUDY REPORT PAGE 3-11

1-3 feet). However, similar to the first event, day-lighting or preferential channeling into the
low-laying areas such as the swale or low-laying spots in Block G was not observed. This is likely
due to lower permeability of the overlying shallow soil acting as a vertical hydraulic barrier. I may
also be due to a higher formation conductivity in the horizontal direction (as compared to a vertical
direction) in the formation.
Groundwater levels in several existing monitoring and injection wells near the active injection
locations (four wells) were also manually gauged before the second injection event was started,
and while the injection was performed. The most distant well (MW-12A) was 57 feet
down-gradient from the nearest active injection well (IWW-36). The rest of the monitoring
locations were approximately 25 feet from the nearest active injection well. The manual gauging
results are summarized in Table 3-7; baseline (pre-injection) measurements in these wells
indicate that depth to groundwater is shallow, ranging from 0.32 to 3.32 feet below ground
surface.
All four wells responded when the injection began. As the injection progressed, positive hydraulic
pressure was observed in the three wells closest to the active injection locations (i.e., they
overflowed when opened). These wells are shown in Table 3-7 with the notation “pressure”. A
hydraulic response of 3.32 feet was observed in well MW-12A, which was 57 feet down-gradient
from the nearest active injection well (IWW-36). This indicates that there is hydraulic connectivity
between this well and the injection wells array.
3.6.4 Bromide Tracer Results for Injection Event #2
Analytical samples for the second injection event were collected from the same locations as were
used for the first injection event (Figure 2-1). Sampling results and pertinent injection parameters
are on Table 3-4.
The possible arrival of low levels of bromide tracer was detected in down-gradient well
MW-12A, at a distance of 57 feet from the nearest active injection well (IWW-36). The bromide
concentration in MW-12A increased from 120 µg/L on June 17, 2014 to 280 µg/L on
July 24, 2014. However, this increase may not be enough to conclude that the bromide tracer
traveled this distance (57 feet) from the injection point. The second monitoring well (MW-12B)
was 95 feet from the nearest active injection well, and no increase in bromide concentration over
the background level was observed. PAGE 3-12 8072 TETRA TECH • LOCKHEED MARTIN MIDDLE RIVER COMPLEX • TRACER STUDY REPORT

Bromide levels above background were not detected in the shallow surface-water sample
collected at Swale 2; this location is approximately 20 feet from the nearest active injection well
(IWW-35). Bromide levels in Swale 2 ranged from 94 µg/L (June 17, 2014) to 190 µg/L
(July 24, 2014) when the injection event was finished. Bromide detected at the end of the second
injection event was slightly higher than the rest of the samples from Swale 2; thus, a minor
bromide tracer influence cannot be ruled out. However, this value (190 µg/L) is within
background bromide levels. Therefore, we conclude it is unlikely that injected fluid traveled to
the nearby surface water in the low spot in the swale. However, it cannot be ruled out that a trace
quantity of the injected fluid may have entered the swale.
Bromide concentrations slowly increased as the injection progressed to a maximum of 350 µg/L
on July 24, 2014. This trend could be attributed to the influence of the injected bromide tracer.
Note that this concentration of bromide is close to the typical background levels at the site.
However, we conservatively assume that a trace amount of the injection fluid entered stormwater
utilities and was subsequently detected at the outfall. The O&M manual contains several
recommendations for the full-scale injection event that will reduce the risk of migration of
injected fluid into the storm water utilities in Block G.
8072 TETRA TECH • LOCKHEED MARTIN MIDDLE RIVER COMPLEX • TRACER STUDY REPORT PAGE 3-13

Table 3-1
Block G Injection-Equipment Process Parameters - Injection Event #1
Lockheed Martin Middle River Complex, Middle River, Maryland
Date
Potable
Water Line
Pressure
(psig)
Pressure
Regulator
PR-1 outlet
Pressure
(psig)
GAC-1
Outlet
Pressure
(psig)
Filter PF-1
Outlet
Pressure
(psig)
Injection
Manifold
Pressure
(psig)
Total
Injection
Flow
(gpm)
Contactor
MC-1
Vacuum
(in.Hg)
Total
Injected
Volume by
FT-1
(gallons)
Total Injected
Volume by
FMT-1
(gallons)
Tracer
Solution
Tank (T-2)
Level
(inches)
Comments
4/23/2014 74 9.50 6.50 8.00 6.00 1.3 -23.5 845 579 43
4/24/2014 76 9.75 6.50 8.00 5.75 1.3 -23.4 2,783 2,500 40.5
4/25/2014 73 9.50 6.50 8.00 5.50 1.4 -23 3,412 3,124 39.5
4/28/2014 75 10.00 6.50 8.00 5.50 1.3 -24 8,185 7,821 33.25 System off due to PLC problems
5/6/2014 74 10.00 6.50 7.50 5.25 1.3 -27 10,563 10,179 30 System re-start
5/7/2014 74 10.00 6.00 7.50 5.50 1.4 -25.5 12,316 11,902 27
5/9/2014 75 10.00 8.00 7.00 5.50 1.4 -25 15,913 15,434 22
5/12/2014 75 10.00 6.00 7.00 5.00 1.1 -25 21,588 20,995 17.75
5/19/2014 76 10.00 5.00 6.50 10.75 1 -25 32,682 31,299 10 Injection manifold pressure inconsistent
5/27/2014 -- -- -- -- -- -- -25 44,765 41,865 0 Finish injection event #1
Note:-- : reading not recordedPLC - programmable logic controllerpsi - pounds per square inch gaugegpm - gallons per minutein. Hg - inches of mercury
Intermittent system operation due to
PLC problems
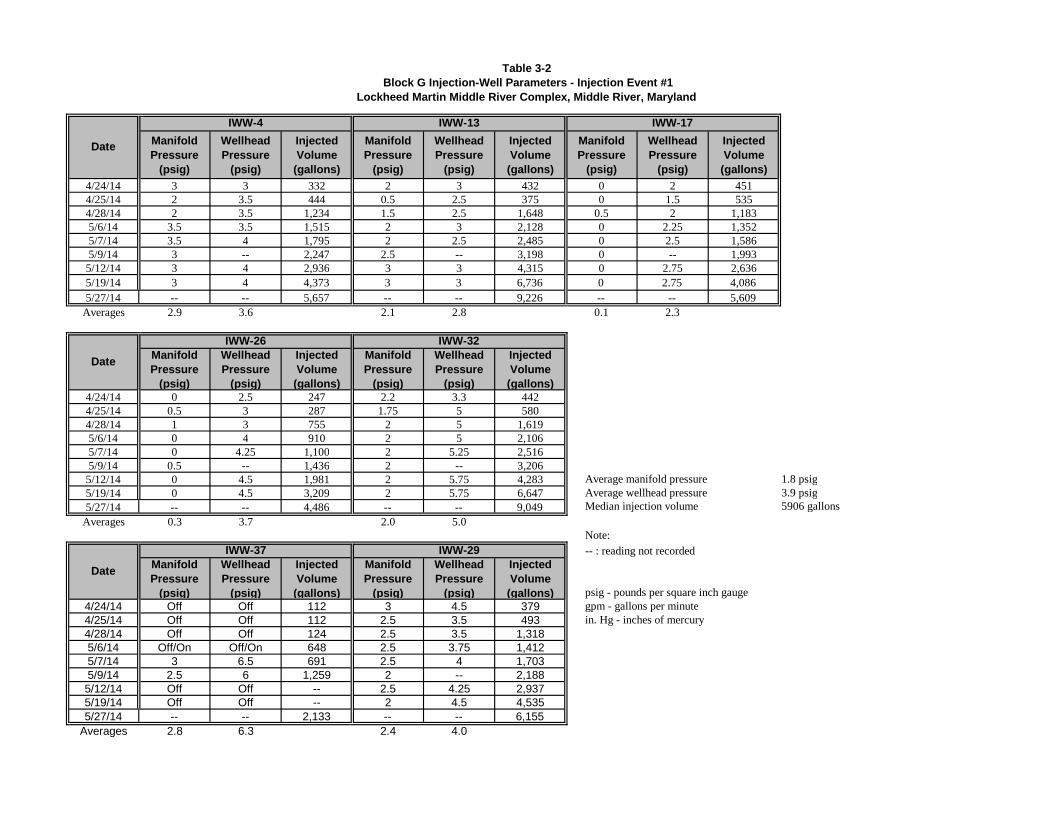
Table 3-2
Block G Injection-Well Parameters - Injection Event #1
Lockheed Martin Middle River Complex, Middle River, Maryland
Manifold
Pressure
(psig)
Wellhead
Pressure
(psig)
Injected
Volume
(gallons)
Manifold
Pressure
(psig)
Wellhead
Pressure
(psig)
Injected
Volume
(gallons)
Manifold
Pressure
(psig)
Wellhead
Pressure
(psig)
Injected
Volume
(gallons)
4/24/14 3 3 332 2 3 432 0 2 4514/25/14 2 3.5 444 0.5 2.5 375 0 1.5 5354/28/14 2 3.5 1,234 1.5 2.5 1,648 0.5 2 1,1835/6/14 3.5 3.5 1,515 2 3 2,128 0 2.25 1,3525/7/14 3.5 4 1,795 2 2.5 2,485 0 2.5 1,5865/9/14 3 -- 2,247 2.5 -- 3,198 0 -- 1,993
5/12/14 3 4 2,936 3 3 4,315 0 2.75 2,636
5/19/14 3 4 4,373 3 3 6,736 0 2.75 4,086
5/27/14 -- -- 5,657 -- -- 9,226 -- -- 5,609
Averages 2.9 3.6 2.1 2.8 0.1 2.3
Manifold
Pressure
(psig)
Wellhead
Pressure
(psig)
Injected
Volume
(gallons)
Manifold
Pressure
(psig)
Wellhead
Pressure
(psig)
Injected
Volume
(gallons)4/24/14 0 2.5 247 2.2 3.3 4424/25/14 0.5 3 287 1.75 5 5804/28/14 1 3 755 2 5 1,6195/6/14 0 4 910 2 5 2,1065/7/14 0 4.25 1,100 2 5.25 2,5165/9/14 0.5 -- 1,436 2 -- 3,206
5/12/14 0 4.5 1,981 2 5.75 4,283 Average manifold pressure 1.8 psig
5/19/14 0 4.5 3,209 2 5.75 6,647 Average wellhead pressure 3.9 psig
5/27/14 -- -- 4,486 -- -- 9,049 Median injection volume 5906 gallons
Averages 0.3 3.7 2.0 5.0Note:
-- : reading not recordedManifold
Pressure
(psig)
Wellhead
Pressure
(psig)
Injected
Volume
(gallons)
Manifold
Pressure
(psig)
Wellhead
Pressure
(psig)
Injected
Volume
(gallons) psig - pounds per square inch gauge
4/24/14 Off Off 112 3 4.5 379 gpm - gallons per minute
4/25/14 Off Off 112 2.5 3.5 493 in. Hg - inches of mercury
4/28/14 Off Off 124 2.5 3.5 1,3185/6/14 Off/On Off/On 648 2.5 3.75 1,4125/7/14 3 6.5 691 2.5 4 1,7035/9/14 2.5 6 1,259 2 -- 2,1885/12/14 Off Off -- 2.5 4.25 2,9375/19/14 Off Off -- 2 4.5 4,5355/27/14 -- -- 2,133 -- -- 6,155
Averages 2.8 6.3 2.4 4.0
IWW-29IWW-37
IWW-4
Date
IWW-13 IWW-17
Date
Date
IWW-26 IWW-32

Table 3-3
Gauging in Block G Wells - Injection Event #1
Lockheed Martin Middle River Complex, Middle River, Maryland
IWW-3 IWW-5 IWW-14 IWW-12 SWMW-2I IWW-18 IWW-16 SWMW-3I SWMW-4S SWMW-4I IWW-25 IWW-27 IWW-31 IWW-33 IWW-36 IWW-38
4/22/14 6.39 6.5 4.97 6.72 4.38 3.63 2.74 2.72 2.11 2.54 2.03 2.84 1.42 1.76 1.13 2.424/25/14 4.46 4.72 1.89 2.26 1.17 1.04 0.75 pressure 1.71 pressure 0.2 0.25 1.04 0.25 0.29 0.34/28/14 3.16 3.3 1.8 0.99 -- 0.35 0.4 pressure 0.58 pressure 0.25 0.25 0.1 0.4 0.3 pressure5/7/14 1.8 1.13 0.15 0.18 0.38 0.15 0.22 pressure 1.12 pressure pressure 0.12 pressure 0.12 0.22 pressure
5/12/14 1.91 0.56 pressure pressure pressure -- pressure pressure 1.62 pressure pressure pressure pressure pressure pressure pressure5/19/14 1.89 1.01 pressure pressure pressure -- pressure pressure pressure pressure pressure pressure pressure pressure pressure pressure
Note:-- : reading not recorded
pressure : Well head under pressure when monitoring took place
DateDepth to groundwater, feet from top of well casing

Table 3-4
Block G Bromide Tracer Sampling Results Summary
Lockheed Martin Middle River Complex, Middle River , Maryland
6/10/20142
ug/L6/17/2014
2
ug/L6/30/2014
2
ug/L7/24/2014
2
ug/L
Bromideug/L
pHBromide
ug/LpH
Bromideug/L
pHBromide
ug/LpH
MW-12A 170 5.68 88 5.75 120 200 280
MW-12B <81 5.34 22 6.01 44 60 49
Swale1 140 130 120 8.7
Swale2 120 94 110 190
G-OUTFALL <81 7.74 20 81 120 350
SWMW-4S 200 5.23
SWMW-4I 820 5.69 390 320 5.76 210 5.73 7500SWMW-1I <81 6.05 43 2700 6.75 9700 5.84 290
1Minimum MDL = 81 ug/L; Minimum RL = 500 ug/L
2Minimum MDL = 2.2 ug/L; Minimum RL = 2.5 ug/L
3System operated intermittently for 3 days in April of 2014, then shut down due to PLC problems. Continuous injection started in 5/5/2014.
1st injection event average injected bromide concentration: 147 mg/L
1st injection event total bromide tracer injected: 55 pounds
1st injection event total volume injected: 44765 gallons
1st injection event volume per well: 6395 gallons
1st injection event average injection rate per welll: 0.15 gallons per minute
1st injection event duration: 29 days
2nd injection event average injected bromide concentration: 161 mg/L
2nd injection event total bromide tracer injected: 55 pounds
2nd injection event total volume injected: 40860 gallons
2nd injection event volume per well: 5837 gallons
2nd injection event average injection rate per welll: 0.14 gallons per minute
2nd injection event duration: 30 days
Begin 1st injection
event on 5/5/20143.
Injecting into wells
IWW-4, IWW-13, IWW-
17, IWW-26, IWW-29,
IWW-32, IWW-37.
End
1st
inje
ctio
ne
ven
to
n6
/2/1
4.
Begin 2nd injection
event on 6/9/14.
Injecting into wells
IWW-30, IWW-31, IWW-
33, IWW-35, IWW-36,
IWW-38, IWW-39.
End
inje
ctio
nin
to2
nd
set
of
inje
ctio
n
we
llso
n7
/10
/14
.
5/15/20142
Baseline 2/10/20141
5/21/20142
SamplingLocation
5/27/20142ug/L

Table 3-5
Block G Injection-Equipment Process Parameters - Injection Event #2
Lockheed Martin Middle River Complex, Middle River, Maryland
Date
Potable
water line
pressure
(psig)
Pressure
regulator
(PR-1)
outlet
pressure
(psig)
GAC-1
outlet
pressure
(psig)
Filter (PF-
1) outlet
pressure
(psig)
Injection
manifold
pressure
(psig)
Total
injection
flow (gpm)
Contactor
(MC-1)
vacuum
(in.Hg)
Total
volume
injected by
FT-1
(gallons)
Total
volume
injected by
FMT-1
(gallons)
Tracer
solution tank
(T-2) level
(inches)
Comments
6/9/2014 76 10.00 4.50 5.50 4.00 1.00 -24 44,980 42,069 40.00
6/11/2014 76 10.00 3.75 5.00 10.50 1.10 -24.5 47,601 44,708 38.50
6/13/2014 76 10.00 3.50 5.00 2.50 0.90 -24.5 50,617 47,683 36.00
6/16/2014 75 11.50 4.00 5.50 10.50 1.00 -24.5 54,199 51,103 33.50
6/23/2014 75 11.50 4.00 5.00 3.00 0.90 -24 64,305 60,603 26.50
7/1/2014 72 14.50 4.00 5.50 3.50 1.10 -24 75,277 70,466 18.50
7/7/2014 70 19.50 5.50 7.00 4.50 1.40 -23.5 82,719 77,548 8.00
7/10/2014 -- -- -- -- -- -- -- 86,385 81,401 0.00
Note:-- : reading not recordedGAC - granular activated carbongpm - gallons per minutein. Hg - inches of mercurypsig - pounds per square inch gauge

Table 3-6
Block G Injection-Well Parameters - Injection Event #2
Lockheed Martin Middle River Complex, Middle River, Maryland
Manifold
pressure
(psig)
Wellhead
pressure
(psig)
Injected
volume
(gallons)
Manifold
pressure
(psig)
Wellhead
pressure
(psig)
Injected
volume
(gallons)
Manifold
pressure
(psig)
Wellhead
pressure
(psig)
Injected
volume
(gallons)6/11/14 0 3.5 458 2 4 365 1 5.5 3246/13/14 0 4.25 913 2 4 759 1 6 6416/16/14 0 4.25 1,432 2 4 1,210 1 6 9366/23/14 0 4.5 2,992 2 4 2,519 1 6 1,9647/1/14 0 4.5 4,568 1.5 4 3,830 1 6 3,2017/7/14 -3 2.5 5,666 0 4 4,794 0 6 4,929
7/10/14 -- -- 6,253 -- -- 5,216 -- -- 6,036Averages -0.5 3.9 1.6 4.0 0.8 5.9
6/9/14 -- -- 4,487 -- -- 9,0896/11/14 -2 1.75 214 -2 3.75 4636/13/14 0 2.5 437 0 4 1,0296/16/14 0 3 604 0 4 1,6996/23/14 0 3 1,263 -2 4 3,2777/1/14 0 3 1,664 -3 3.5 4,8347/7/14 -5 0 1,759 -7 1.5 5,533
7/10/14 -- -- 1,760 -- -- 5,856Averages -1.2 2.2 -2.3 3.5 Average manifold pressure -0.5 psig
Average wellhead pressure 3.7 psigMedian injection volume 5,856 gallons
Manifold
pressure
(psig)
Wellhead
pressure
(psig)
Injected
Volume
(gallons)
Manifold
pressure
(psig)
Wellhead
pressure
(psig)
Injected
volume
(gallons)6/9/14 -- -- 2,174 -- -- 6,174
6/11/14 -5 -- 490 0 4 4176/13/14 0 3 978 0 4 891 Note:
6/16/14 0 3 1,562 1 4 1,402 -- : reading not recorded
6/23/14 0 3 3,124 1.5 4 2,927 psi - pounds per square inch gauge
7/1/14 -2 3 4,668 0 4 4,407 gpm - gallons per minute
7/7/14 -6 0 5,285 0 4 5,642 in. Hg - inches of mercury
7/10/14 -- -- 5,691 -- -- 6,195 psig - pressure per square inch gagueAverages -2.2 2.4 0.4 4.0
IWW-33
Date IWW-35 IWW-36
IWW-38
Date
IWW-39
Date
IWW-30 IWW-31

Table 3-7
Gauging in Block G Wells - Injection Event #2
Lockheed Martin Middle River Complex, Middle River, Maryland
SWMW-2I SWMW-3I MW-12A MW-14B SWMW-5I IWW-24 IWW-27 IWW-32 IWW-34 IWW-35 IWW-37
6/2/2014 0.79 2.39 -- 1.08 2.05 -- -- -- -- -- --6/6/2014 -- -- 3.32 -- 2.98 1.02 0.37 pressure pressure 1.04 1.78
6/11/2014 -- -- 2.34 -- -- 0.84 0.35 -- -- pressure --6/13/2014 -- -- 1.12 -- -- pressure pressure -- -- pressure --6/16/2014 -- -- 0.46 -- -- pressure pressure -- -- pressure --6/23/2014 -- -- 0.32 -- -- pressure pressure -- -- pressure --7/1/2014 -- -- 2.62 -- -- pressure pressure -- -- pressure --7/7/2014 -- -- 1.96 -- -- pressure pressure -- -- pressure --
Note:-- : reading not recorded
pressure : Well head under pressure when monitoring took place
DateDepth to groundwater, feet from top of well casing

-1
0
1
2
3
4
5
6
7
4/22/14 4/27/14 5/2/14 5/7/14 5/12/14 5/17/14 5/22/14 5/27/14 6/1/14
Pres
sure
rela
tive
to in
itial
sta
tic le
vel,
feet
Figure 3‐1 LMC MRC Tracer Study in Block G: Monitoring Well SWMW-2I Hydraulic Response
System shutdowns due to PLC problem
Re-start
5/27 Shut-down 4/23 Start-up
5/6 re-start
Static depth to water 4.38 feet
-1
0
1
2
3
4
5
6
4/22/14 4/27/14 5/2/14 5/7/14 5/12/14 5/17/14 5/22/14 5/27/14 6/1/14
Pres
sure
rela
tive
to in
itial
sta
tic le
vel,
feet
Figure 3‐2 LMC MRC Tracer Study in Block G: Monitoring Well SWMW-3I Hydraulic Response
System shutdowns due to PLC problem
Re-start
5/27 Shut-down 4/23 Start-up
5/6 re-start
Static depth to water 2.72 feet

-1
0
1
2
3
4
5
6
7
4/22/14 4/27/14 5/2/14 5/7/14 5/12/14 5/17/14 5/22/14 5/27/14 6/1/14
Pres
sure
rela
tive
to in
itial
sta
tic le
vel,
feet
Figure 3‐3 LMC MRC Tracer Study in Block G: Monitoring Well MW-14B Hydraulic Response
System shutdowns due to PLC problem
Re-start
5/27 Shut-down 4/23 Start-up
5/6 re-start
Static depth to water 4.87 feet

-1
0
1
2
3
4
5
6
4/22/14 4/27/14 5/2/14 5/7/14 5/12/14 5/17/14 5/22/14 5/27/14 6/1/14
Pres
sure
rela
tive
to in
itial
sta
tic le
vel,
feet
Figure 3‐4 LMC MRC Tracer Study in Block G: Monitoring Well SWMW-5I Hydraulic Response (First Injection Event)
System shutdowns due to PLC problem
Re-start
5/27 Shut-down 4/23 Start-up
5/6 re-start
Nearby injection well shutdown
Static depth to water 3.65 feet

-1
0
1
2
3
4
5
6
6/5/14 6/10/14 6/15/14 6/20/14 6/25/14 6/30/14 7/5/14 7/10/14 7/15/14
Pres
sure
rela
tive
to in
itial
sta
tic le
vel,
feet
Figure 3‐5 LMC MRC Tracer Study in Block G: Monitoring Well IWW-32 Hydraulic Response
7/10 Shut-down
6/09 Start-up
System adjustment events
(pressure/flow increase)
Static depth to water 1.42 feet

-2
-1
0
1
2
3
4
5
6/5/14 6/10/14 6/15/14 6/20/14 6/25/14 6/30/14 7/5/14 7/10/14 7/15/14
Pres
sure
rela
tive
to in
itial
sta
tic le
vel,
feet
Figure 3‐6 LMC MRC Tracer Study in Block G: Monitoring Well IWW-34 Hydraulic Response
7/10 Shut-down
6/09 Start-up
System adjustment events (pressure/flow increase)
Static depth to water 1.76 feet

-1
0
1
2
3
4
5
6
7
6/5/14 6/10/14 6/15/14 6/20/14 6/25/14 6/30/14 7/5/14 7/10/14 7/15/14
Pres
sure
rela
tive
to in
itial
sta
tic le
vel,
feet
Figure 3‐7 LMC MRC Tracer Study in Block G: Monitoring Well IWW-37 Hydraulic Response
7/10 Shut-down
6/09 Start-up
System adjustment events (pressure/flow increase)
Static depth to water 1.78 feet

-1
0
1
2
3
4
5
6
7
6/5/14 6/10/14 6/15/14 6/20/14 6/25/14 6/30/14 7/5/14 7/10/14 7/15/14
Pres
sure
rela
tive
to in
itial
sta
tic le
vel,
feet
Figure 3‐8 LMC MRC Tracer Study in Block G: Monitoring Well SWMW-5I Hydraulic Response (Second Injection Event)
7/10 Shut-down
6/09 Start-up
System adjustment events (pressure/flow increase)
Static depth to water 3.65 feet

Section 4
Block I Tracer Testing
This section describes the layout, field procedures, and monitoring performed for the Block I
tracer test.
4.1 FIXED-BASE LABORATORY SAMPLING
Bromide groundwater samples were collected from five existing monitoring wells (MW-81B,
NMW-1I, NMW-2I, NMW-2S and NMW-3I) in Block I. Bromide samples were also collected
from two stormwater utilities locations (MH-10 and CB-10A) and from one surface water
location at Outfall-009 (Figure 2-2).
Appendix B of the operations and maintenance (O&M) manual (Tetra Tech, Inc. [Tetra Tech],
2014) contains specific parameters and procedures for baseline sampling. Samples were
collected from all locations above before tracer injection began to establish baseline bromide
levels. In addition, samples were collected several times during the injection event, and
two weeks after the injection was finished. Bromide sampling procedure and analytical
laboratory requirements are described in Section 2-2.
4.2 GROUNDWATER TABLE MEASUREMENTS
Groundwater levels were monitored periodically by manual gauging of monitoring wells and via
pressure transducers placed within several injection wells (Figure 2-2). Before the transducers
were installed, water levels in each well were measured using an electronic water-level meter.
Transducers collected data for the duration of the tracer test. Transducers were installed in each
location approximately five to 10 feet below the static water level; recording frequency was set
to five minutes. To ensure data quality, wells containing transducers were not sampled or
otherwise disturbed. Data from the transducers were downloaded and assembled as graphs for
analysis (Figures 4-1 through 4-4).
8072 TETRA TECH • LOCKHEED MARTIN MIDDLE RIVER COMPLEX • TRACER STUDY REPORT PAGE 4-1

Groundwater levels in existing monitoring and injection wells near the active injection location
were manually measured before tracer testing began. Groundwater levels within these wells were
also measured three times during the first week of the injection event and weekly thereafter.
4.3 INJECTION SOLUTION PREPARATION
The following procedure was used to prepare the injection solution in tank T-2 during Block I
tracer testing:
1) Tank T-2 was filled with approximately 330 gallons of treated (dechlorinated and deoxygenated) potable water.
2) Three 55- lb bags (165 lbs total) of sodium bromide were placed into tank T-2. Greater quantities of bromide tracer were used for Block I as compared to Block G because high baseline bromide concentrations were detected in two Block I wells; details follow in Section 4.6.4. These high bromide concentrations were likely caused by (residual) bromide tracer injected during the November 2011 injection test.
3) Five 15-lbs bags (75 lbs total) of sodium bicarbonate were added to tank T-2.
4) The mixing pump in tank T-2 as activated for 60–120 minutes to dissolve the chemicals.
5) The dosage of tracer fluid was injected via metering pump (MP-2) such that the entire tank volume was injected during the event. Electronic flow-meter FMT-1 signaled pump MP-2, and automatically maintained a constant tracer concentration in the injected stream, regardless of the changes in the injection flow rate.
4.4 INJECTION PROCEDURE
Block I tracer testing consisted of one event; tracer was injected into all eight injection wells in
Block I (May 6, 2014 through June 7, 2014).
The injection solution (450 mg/L sodium bromide and 200 mg/L sodium bicarbonate) in tank T-2
was prepared per procedures described above. Injection system equipment was prepared for
operation and configured as described in Sections 3.1 and 3.1.3 of the O&M manual (Tetra Tech,
2014). Eight injection wells (IWN-1 through IWN-8) were connected to the injection manifold.
The injection system was activated on May 6, 2014, and the injection rate for each connected
well was be set to approximately 0.13 gallons per minute (gpm), for a total injection rate of
approximately one gpm (with eight wells connected). Metering pump MP-2 was activated to
PAGE 4-2 8072 TETRA TECH • LOCKHEED MARTIN MIDDLE RIVER COMPLEX • TRACER STUDY REPORT

begin injection of bromide tracer/sodium bicarbonate solution from tank T-2 into the injection
manifold, using settings described in the O&M manual.
The total volume injected was slightly above the volume for the full-scale design Approximately
45,000 gallons of tracer fluid were injected (equivalent to approximately 5,600 gallons per
injection well); the injection volume for the full-scale design is 5,000 gallons per well (or
40,000 gallons total). The average flow rate during injection was 0.13 gpm per well. The
injection duration was 31 days (from May 6, 2014 through June 7, 2014). The site operator
visited the site at least three times during the first week of testing, then weekly thereafter.
4.5 INJECTION EVENT RESULTS SUMMARY
This section presents a summary of the results for the Block I injection event, including process
parameters for the injection system (injection rates, pressures), parameters for injection wells, the
hydraulic response of the underlying formation, and results of bromide tracer testing.
4.5.1 Process Parameters
System-process parameters for the entire injection event are summarized in Table 4-1. The
parameters discussed below are presented in the flow direction starting at the upstream
parameters.
The potable water pressure was stable during the entire injection event, and ranged from 64 to
66 pounds per square-inch gauge (psig) [Table 4-1, first data column]. Pressure was in excess of
the required injection pressure, and was reduced using the pressure regulator PR-1. Outlet
pressure for pressure regulator PR-1 (same as GAC-1 inlet pressure) was adjusted to
approximately 8 psig; it remained close to this level for the entire injection event (Table 4-1,
second data column). GAC-1 outlet pressure (same as filter PF-1 inlet pressure) was adjusted to
5 psig; it also remained relatively constant for most of the injection event. However,
approximately three weeks after injection began, clogging of activated carbon in GAC-1 was
indicated: the outlet pressure at GAC-1 began to decline, decreasing to 3 psig by the end of
injection. The pressure differential across the GAC-1 unit increased from 3 psig to 5 psig from
beginning to the end of injection, indicating clogging occurred across the carbon bed (Table 4-1,
third data column). Note that the potable water source was very turbid, and likely contained
suspended solids that caused GAC-1 clogging. Preventative measures that will be taken to
8072 TETRA TECH • LOCKHEED MARTIN MIDDLE RIVER COMPLEX • TRACER STUDY REPORT PAGE 4-3

address this issue, including carbon bed backwash or replacement, and possibly additional
filtration at the inlet to GAC-1.
The outlet pressure at filter PF-1 varied from 4 to 6 psig during the injection event. The pressure
differential across the filter did not increase, indicating that the clog was not at the filter
(Table 4-1, fourth data column). The outlet pressure at PF-1 was slightly higher than the pressure
upstream at the GAC-1 outlet because the pressure gauge on the filter outlet was mounted lower
than one on the outlet for GAC-1.
Pressure in the injection manifold ranged between 4 psig at the beginning of the injection event,
declining to 2.5 psig at the end of the event due to GAC-1 clogging (Table 4-1, fifth data
column).
The total injection rate (as measured by electronic flow-meter FMT-1) ranged between 0.9 and
1.2 gpm (Table 4-1, sixth data column) or an average of approximately 0.13 gpm per injection
well for the injection duration.
The vacuum applied to the hollow membrane contactor MC-1 ranged between 27.5 and
28.5 inches of mercury. This vacuum is sufficient to remove the bulk of dissolved oxygen from
an aqueous stream (Table 4-1, seventh data column).
Electronic flow-meter FMT-1 readings (Table 4-1, 8th data column) indicate that 44,897 gallons
of fluid were injected during the injection event (an average of 5,612 gallons per injection well).
This is slightly above the full-design injection volume for Block I (5,000 gallons per injection
well). The mechanical flow totalizer (FT-1) malfunctioned and the readings could not be
obtained. This instrument will be replaced before the full-scale injection event.
The entire tracer solution tank volume (330 gallons, 165 lbs of sodium bromide, 75 lbs of sodium
bicarbonate) was injected uniformly during the injection event at Block I (Table 4-1, 9th data
column).
The impact of sodium bicarbonate solution injection on the groundwater pH buffering in the
vicinity of the injection wells was generally inconclusive. Values of pH in several monitoring
wells slightly increased during the tracer test while other wells demonstrated no clear trend or
had pH values actually decreasing during the test (Tables 3-4 and 4-4). It is believed that the
PAGE 4-4 8072 TETRA TECH • LOCKHEED MARTIN MIDDLE RIVER COMPLEX • TRACER STUDY REPORT

amount of sodium bicarbonate injected during the tracer test was insufficient for groundwater pH
buffering. The design quantities of sodium bicarbonate to be injected during the full scale
injection event will be much greater that the amounts used during the tracer tests.
4.5.2 Injection Wells Parameters
Table 4-2 summarizes parameters for individual injection wells, including the injection pressure
at manifold-branch (measured downstream of the flow regulating valve), pressure of the actual
wellhead, and the injected volume (measured by the flow totalizer) at each injection well.
Injection-pressures at the manifold branch (measured on individual injection lines downstream of
the flow-reducing regulating valve) ranged from negative to 5 psig, with a negative average
value of -0.7 psig for the entire injection event.
Injection pressure at the wellhead (measured at gauges installed within injection wells manholes)
ranged from negative to 5.5 psig, with an average value of 2 psig for the entire injection event.
Wellhead injection pressures were slightly higher (typically 2 psig higher) than the pressures at
the manifold branch because the wellheads were 4-5 feet lower than the injection manifold;
therefore, corresponding hydrostatic pressure was added.
The total volume injected at each injection well varied, depending on the hydraulic conductivity
of the local formation. The well in the most conductive area (IWN-6) received a volume
approximately 1.7 times greater as compared to wells in the least conductive areas (IWN-5 and
IWN-8). The injection volume for the rest of the wells was fairly uniform, and close to the design
injection volume of 5000 gallons per well. The average injection volume per well was
4,994 gallons based on the totalizer readings for individual wells, and 5612 gallons based on the
main electronic totalizer reading.
4.5.3 Formation Hydraulic Response
During the Block I injection event, transducers were installed in wells MPN-2I, IWN, MPN-2S
and OW-1B (Figure 2-2), approximately five to 10 feet below the static water level; recording
frequency was set to five minutes. To ensure data quality, wells containing transducers were not
sampled or otherwise disturbed.
Transducer measurements in wells MPN-2I, IWN, MPN-2S and OW-1B are graphically depicted
on Figures 4-1 through 4-4, respectively. Results are shown as the positive changes in
8072 TETRA TECH • LOCKHEED MARTIN MIDDLE RIVER COMPLEX • TRACER STUDY REPORT PAGE 4-5

hydrostatic pressure relative to baseline (shown as zero value) before the injection event began
System shutdown and re-start events are also indicated on these graphs.
Transducers measurements indicate that all four wells responded to injection. For example, the
hydrostatic pressure in well IWN (Figure 4-2) increased by approximately two feet after
approximately six hours of injection. Well MPN-2S was screened in the shallow zone, and
responded to the injection more slowly (Figure 4-3). After the system was turned off, the
hydrostatic pressure in all wells returned close to pre-injection levels within several days
(Figures 4-1 through 4-4). System shutdown events of short duration (several hours) occurred
twice at the beginning of injection; these events are clearly seen on all graphs.
The hydraulic response in wells MPN-2I, IWN, MPN-2S and OW-1B ranged between four and
five feet relative to the static level. Pre-injection static depths to water in these wells, and an
increase in hydrostatic pressure during the injection, indicate that water levels in these wells were
approximately five feet below the ground surface; therefore, potential day-lighting was limited.
Groundwater levels in five nearby existing monitoring- and injection-wells were also manually
gauged before the injection started and while the injection was performed. These manual gauging
results are summarized in Table 4-3. The baseline (pre-injection) measurements in these wells
indicate that groundwater table was approximately 8-10 feet below the ground surface
All five wells responded when the injection began. Hydraulic response was similar to that
measured by the transducers: depth to water decreased by approximately four feet by the end of
injection. However, water levels in all five wells remained well under ground surface levels, thus
limiting potential day-lighting. Visual observations of the ground surface and the underground
structures (e.g., catch basins) did not indicate day-lighting or preferential channeling of injected
fluid.
4.5.4 Bromide Tracer Results
Analytical samples were collected from five monitoring wells (MW-81B, NMW-1I, NMW-2I,
NMW-2S and NMW-3I), from two stormwater utility locations (catch basins MH-10 and
CB-10A), and from one surface-water location (Outfall-009). Figure 2-2 shows the sampling
locations. Sampling results and pertinent injection parameters (e.g., injected tracer
concentrations, quantities, and volumes injected volumes) are summarized on Table 4-4.
PAGE 4-6 8072 TETRA TECH • LOCKHEED MARTIN MIDDLE RIVER COMPLEX • TRACER STUDY REPORT

Baseline bromide sampling indicated high bromide levels at one Block I location, in the shallow
and intermediate depths: NMW-2S and NMW-2I, respectively (both at 18,000 micrograms per
liter [µg/L]). The presence of bromide at these levels was likely due to residual bromide from
tracer injected during the November 2011 injection test. It was unclear if these wells would
provide valuable data, but the arrival of injected tracer was clearly observed, even over these
high background levels. In fact, the injected tracer was clearly detected in five wells sampled
within Block I, at concentrations up to several orders of magnitude higher than the background
levels (Table 4-4), indicating a good distribution of the injected fluid was achieved.
The bromide samples collected from the surface water location at Outfall-009 indicated
relatively high background bromide levels (1,300µg/L median value). These results are expected
as Outfall-009 samples were collected near the outfall directly from the surface water of Dark
Head Cove. Thus, these bromide levels are indicative of brackish seawater, and are expected to
be influenced by tidal fluctuations, winds, and other factors.
Analytical results from the stormwater utility location (MH-10 on Figure 2-2) indicated a clear
increase of the bromide tracer (from <81 µg/L at baseline to a maximum of 3,700 µg/L on
June 4, 2014). Tracer levels detected in MH-10 remained elevated in the two sampling events (on
June 20, 2014 and July 24, 2014) conducted after the injection was finished on June 7, 2014.
An elevated level of the bromide tracer was also detected at the second stormwater utility
location (CB-10A on Figure 2-2), ranging from less than 81 µg/L (baseline) to 4,700 µg/L
(maximum) on June 4, 2014. However, this was the only high level detection in CB-10A.
Bromide concentrations in the remaining samples were close to background levels.
The detection of bromide tracer in Block I stormwater utilities (MH-10 and CB-10A) is a direct
indication that injected fluid entered the storm water utilities (pipes and/or underground
structures such as catch basins or manholes. Note, however, that the highest bromide tracer
concentrations detected at these utility locations were significantly lower than the concentrations
detected in monitoring wells. For example, on June 4, 2014, the average bromide tracer
concentration in the five Block I monitoring wells used for the tracer test was 51,608 µg/L, while
compared to 4,200 µg/L was detected in the stormwater system (value is an average of the two
highest detections at MH-10 and CB-10A). This indicates that although injected fluid entered the
stormwater system, its inflow was relatively low.
8072 TETRA TECH • LOCKHEED MARTIN MIDDLE RIVER COMPLEX • TRACER STUDY REPORT PAGE 4-7

Based on the presence of tracer in the storm sewer system, the injection event for the full-scale
bioremediation will be modified to address this. These modifications will be reflected in the
updated O&M manual for the bio-remediation system.
PAGE 4-8 8072 TETRA TECH • LOCKHEED MARTIN MIDDLE RIVER COMPLEX • TRACER STUDY REPORT

Table 4-1
Block I Injection-Equipment Process Parameters
Lockheed Martin Middle River Complex, Middle River, Maryland
Date
Potable
Water Line
Pressure
(psig)
Pressure
Regulator PR-
1 outlet
Pressure
(psig)
GAC-1 Outlet
Pressure
(psig)
Filter PF-1
Outlet
Pressure
(psig)
Injection
Manifold
Pressure
(psig)
Total
Injection
Flow (gpm)
Contactor
MC-1
Vacuum
(in.Hg)
Total Injected
Volume by
FMT-1
(gallons)
Tracer
Solution Tank
(T-2) Level
(inches)
Comments
5/6/2014 64 8.00 5.00 6.00 4.00 0.90 -28.5 355.7 40 Injection event begins
5/7/2014 64 7.50 5.00 5.75 3.75 1.10 -28 2,085.0 37
5/9/2014 64 7.75 5.00 5.75 3.50 1.20 -28 3,382.0 35.5
5/12/2014 64 7.50 5.00 5.75 3.75 1.10 -28 8,233.0 29
5/16/2014 64 7.50 5.00 5.75 1.50 1.10 -27.5 14,232.0 20.5
5/19/2014 66 7.50 4.50 5.00 3.00 1.10 -28 19,141.0 40.5
5/27/2014 64 8.00 4.00 4.50 2.50 1.00 -28 31,165.0 23
6/2/2014 66 8.00 3.00 4.00 7.50 0.90 27.5 39,007.6 13
6/7/2014 _ _ _ _ _ _ _ 44,897.0 0 Injection event ends
Total injection volume per well (average) 5612 gallons -- : reading not recordedInjection event duration 31 days psig - pounds per square inch gaugeAverage injection rate per well 0.13 gpm gpm - gallons per minute
in. Hg - inches of mercury

Table 4-2
Block I Injection-Well Parameters
Lockheed Martin Middle River Complex, Middle River, Maryland
Manifold
Pressure
(psig)
Wellhead
Pressure
(psig)
Injected
Volume
(gallons)
Manifold
Pressure
(psig)
Wellhead
Pressure
(psig)
Injected
Volume
(gallons)
Manifold
Pressure
(psig)
Wellhead
Pressure
(psig)
Injected
Volume
(gallons)5/6/2014 4.5 1.25 163 2.5 0 86 0 0 995/7/2014 -2 0 286 -2 0 223 off off 3055/9/2014 -3 0 517 0 0.5 405 -- -- 305
5/12/2014 0 0 1302 0 0 1027 -- -- --5/16/2014 0 0.5 2299 1 3 1803 -- -- --5/19/2014 0 0.5 3105 0 0.5 2418 -3 1.5 3485/27/2014 0 1 4743 0 0 3605 -4 1.75 23506/2/2014 -4 0 5160 1 0 4789 -3 2.25 4885Averages -0.6 0.4 0.3 0.5 -2.5 1.4
Manifold
Pressure
(psig)
Wellhead
Pressure
(psig)
Injected
Volume
(gallons)
Manifold
Pressure
(psig)
Wellhead
Pressure
(psig)
Injected
Volume
(gallons)
Manifold
Pressure
(psig)
Wellhead
Pressure
(psig)
Injected
Volume
(gallons)5/6/2014 3.5 1 84 5 2.5 73 0 0 865/7/2014 -2 1.75 364 2.5 5 168 -6 -- 4415/9/2014 -4 1.5 614 1 4.5 327 -7 0 758
5/12/2014 0 1 1433 2 4 843 0 0 18675/16/2014 0 1.25 2435 2 4 1473 0 0 32855/19/2014 0 1.5 3258 2 4 1950 -4 0 44525/27/2014 0 1 4945 2 3.75 2803 -5 0 69156/2/2014 -6 0 5073 2.5 4.5 3994 -9 0 6928Averages -1.1 1.1 2.4 4.0 -3.9 0.0
Manifold
Pressure
(psig)
Wellhead
Pressure
(psig)
Injected
Volume
(gallons)
Manifold
Pressure
(psig)
Wellhead
Pressure
(psig)
Injected
Volume
(gallons)5/6/2014 1.25 4 71 2.5 3.25 92 Average manifold pressure -0.7 psig5/7/2014 0 -- 321 0 3.25 133 Average wellhead pressure 2.0 psig5/9/2014 0 4.5 559 -2 3 249 Median total injection volume 4,979 gallons
5/12/2014 0 5.5 1342 0 3 691 Average total injection volume 4994 gallons5/16/2014 0 -- 3242 0 -- 12525/19/2014 0 5.5 3153 0 3.5 1686 Note:5/27/2014 0 5.25 4842 0 3.5 2479 -- : reading not recorded6/2/2014 -6 4 5128 1 5 3991 psi - pounds per square inch gaugeAverages -0.6 4.8 0.2 3.5 gpm - gallons per minute
in. Hg - inches of mercurypsig - pound(s) per square inch gauge
IWN-8
Date
Date
IWN-1 IWN-2 IWN-3
Date
IWN-4 IWN-5 IWN-6
IWN-7

Table 4-3
Gauging in Block I Wells
Lockheed Martin Middle River Complex, Middle River, Maryland
NMW-1I NMW-2I NMW-2S NMW-3I MW-81B
4/23/20141 9.66 9.74 9.65 8.02 9.48
5/7/14 6.67 7.61 7.38 6.46 5.685/9/14 6.92 6.99 7.23 5.98 5.46
5/12/14 6.3 6.51 6.4 5.24 4.935/16/14 5.81 5.82 5.23 -- 3.945/19/14 5.24 5.92 6.08 3.62 4.095/27/14 5.02 5.42 5.56 3.61 3.45
6/2/14 5.35 5.12 5.84 3.38 3.92
Note:-- : reading not recorded
1Static conditions before injection
DateDepth to Groundwater, feet from top of well casing

Table 4-4
Block I Brominde Tracer Results Sammary
Lockheed Martin Middle River Complex, Middle River, Maryland
7/24/20142
ug/L
Bromide
ug/LpH
Bromide
ug/LpH
Bromide
ug/LpH
Bromide
ug/LpH
Bromide
ug/LpH
MW-81B 360 8.51 250 6.81 290 6.01 6800 5.83 10000 6.27
NMW-2I 18000 5.47 35000 5.5 72000 5.5 68000 36000
NMW-3I 570 6.21 7500 5.81 77000 5.24 120000 5.38 50000 6.02
NMW-1I 330 5.15 230 5.14 220 5.42 240 4.58 19000
NMW-2S 18000 6.24 27000 5.47 61000 5.58 63000 5.74 28000
OUTFALL-9 280 8.05 1400 1500 1300 1000
MH-10 <81 9.7 110 3700 2100 3200
CB-10A <81 200 220 4700 430 51
1Minimum MDL = 81 ug/L; Minimum RL = 500 ug/L2Minimum MDL = 2.2 ug/L; Minimum RL = 2.5 ug/L
Injection event average injected bromide concentration: 434 mg/L
Injection event total bromide tracer injected: 165 pounds
Injection event total volume injected: 45488 gallons
Injection event volume per well: 5686 gallons
Injection event average injection rate per welll: 0.13 gallons per minute
Injection event duration: 31 days
Begin
injection
event on
5/6/2014.
Injecting into
wells IWN-1
through
IWN-8
End
inje
ctio
nev
ent
on
6/7
/14
.Baseline 2/10/20141 5/16/20142 5/27/20142 6/04/20142 6/20/20142
Sampling
Location

0
1
2
3
4
5
6
7
8
9
10
11
5/5/14 5/10/14 5/15/14 5/20/14 5/25/14 5/30/14 6/4/14 6/9/14 6/14/14 6/19/14
Pres
sure
rela
tive
to in
itial
sta
tic le
vel,
feet
Figure 4‐1 LMC MRC Tracer Study in Block I: Monitoring Well MPN-2I Hydraulic Response
System shutdown events
System re-start events
6/7 Shut-down
Static depth to water 10.71 feet

0
1
2
3
4
5
6
7
8
9
10
5/5/14 5/10/14 5/15/14 5/20/14 5/25/14 5/30/14 6/4/14 6/9/14 6/14/14 6/19/14
Pres
sure
rela
tive
to in
itial
sta
tic le
vel,
feet
Figure 4‐2 LMC MRC Tracer Study in Block I: Monitoring Well IWN Hydraulic Response
System shutdown events
System re-start events
6/7 Shut-down
5/6 Start-up
Static depth to water 9.95 feet

0
1
2
3
4
5
6
7
8
9
10
5/5/14 5/10/14 5/15/14 5/20/14 5/25/14 5/30/14 6/4/14 6/9/14 6/14/14 6/19/14
Pres
sure
rela
tive
to in
itial
sta
tic le
vel,
feet
Figure 4‐3 LMC MRC Tracer Study in Block I: Monitoring Well MPN-2S Hydraulic Response
System shutdown events
System re-start events
6/7 Shut-down
5/6 Start-up
Static depth to water 9.98 feet

0
1
2
3
4
5
6
7
8
9
5/5/14 5/10/14 5/15/14 5/20/14 5/25/14 5/30/14 6/4/14 6/9/14 6/14/14 6/19/14
Pres
sure
rela
tive
to in
itial
sta
tic le
vel,
feet
Figure 4‐4 LMC MRC Tracer Study in Block I: Monitoring Well OW-1B Hydraulic Response
System shutdown events
System re-start events
6/7 Shut-down 5/6 Start-up
Static depth to water 8.89 feet

Section 5
Summary and Conclusions
A summary of the tracer study results and conclusions follow:
1. The system design was fully validated and the injection process equipment and controls were tested under actual operating conditions similar to future full-scale operation requirements.
2. A full design injection volume was injected into each set of injection wells. Some individual injection wells received higher or lower volume, but most wells received the approximate full-design injection volume of bromide-tracer and sodium bicarbonate buffered water.
3. No day-lighting was observed during the tracer study.
4. The injected fluid entered storm drain utilities in Block I. Specific recommendations to address this issue for the full-scale Block I injection event are in the updated operations and maintenance (O&M) manual.
5. Tracer tests indicated that injection fluid may have entered the storm drain utilities in Block G. Specific recommendations to address this potential issue for the full-scale Block G injection event are in the updated operations and maintenance manual
6. The injection rates for individual wells were lower than the values achieved during the November 2011 injection test, which could increase the overall duration of the future full-scale bio-remediation injection event. Modifications to avoid an increased duration are made in the updated operations and maintenance manual, and consist of altering the number of wells used for simultaneously injecting amendment.
7. Bromide tracer was clearly detected in multiple monitoring wells in Blocks G and I. Therefore, we conclude that an adequate injected-fluid distribution was achieved, and that adequate distribution of amendments can be achieved using the design injection volumes.
8. Strong hydraulic response to injection was detected in all monitoring locations at distances up to 57 feet from the point of injection. Thus, we conclude that the existing hydraulic conditions are favorable for achieving adequate distribution of amendments using the design injection volumes.
8072 TETRA TECH • LOCKHEED MARTIN MIDDLE RIVER COMPLEX • TRACER STUDY REPORT PAGE 5-1

9. Untreated potable water used for injection in Blocks G and I was very turbid and
contained suspended solids. At the end of injection in both areas, suspended solids began to clog the granular carbon vessels. Measures to address this issue include replacing the activated carbon bed and additional filtration (as detailed in the updated operations and maintenance manual).
PAGE 5-2 8072 TETRA TECH • LOCKHEED MARTIN MIDDLE RIVER COMPLEX • TRACER STUDY REPORT

Section 6
References
1. Tetra Tech, Inc. (Tetra Tech), 2012. Injection Pilot-Test Report. March.
2. Tetra Tech Inc. (Tetra Tech), 2014. Draft Operation and Maintenance Plan for Groundwater Remediation System at Lockheed Martin Middle River Complex, 2323 Eastern Boulevard, Middle River, Maryland. January.
8072 TETRA TECH • LOCKHEED MARTIN MIDDLE RIVER COMPLEX • TRACER STUDY REPORT PAGE 6-1

This page intentionally left blank.
PAGE 6-2 8072 TETRA TECH • LOCKHEED MARTIN MIDDLE RIVER COMPLEX • TRACER STUDY REPORT