Embed Size (px)
Citation preview
Traceability and Discrimination among DifferentlyFarmed Fish: A Case Study on Australian Murray
Cod
GIOVANNI M. TURCHINI,*,† GERRY P. QUINN,† PAUL L. JONES,†
GIORGIO PALMERI,† AND GEOFF GOOLEY‡
School of Life and Environmental Sciences, Deakin University, P.O. Box 423, Warrnambool,Victoria, 3280, Australia, and Fisheries Victoria, Department of Primary Industries, 4 Archer Drive,
Mornington, Victoria 3931, Australia
The development of traceability methods to distinguish between farmed and wild-caught fish andseafood is becoming increasingly important. However, very little is known about how to distinguishfish originating from different farms. The present study addresses this issue by attempting todiscriminate among intensively farmed freshwater Murray cod originating from different farms (indoorrecirculating, outdoor floating cage, and flow through systems) in different geographical areas, usinga combination of morphological, chemical, and isotopic analyses. The results show that stable isotopesare the most informative variables. In particular, δ13C and/or δ15N clearly linked fish to a specificcommercial diet, while δ18O linked fish to a specific water source. Thus, the combination of theseisotopes can distinguish among fish originating from different farms. On the contrary, fatty acid andtissue proximate compositions and morphological parameters, which are useful in distinguishingbetween farmed and wild fish, are less informative in discriminating among fish originating from differentfarms.
KEYWORDS: Aquaculture; chemiometric; discriminant function analysis; fatty acids; Maccullochella peelii
peelii; stable isotopes; product tracing
INTRODUCTION
Recently, the trade of fish and seafood products has beenincreasingly influenced by food quality and safety norms (1).Thus, several directives have been introduced and will beprogressively enhanced, aiming to establish safety standards andtraceability/product tracing procedures into the fisheries andaquaculture market chains (2). Commonly, the different nationaland international norms developed, or under development, arebased on the guidelines and principles provided by the CodexAlimentarius Commission compiled by the Food and AgricultureOrganization of the United Nations (FAO) and the World HealthOrganization (WHO) (1). Traceability/product tracing have beendefined by the Codex Alimentarius Commission as “the abilityto follow the movement of a food through specified stage(s) ofproduction, processing and distribution” (2), and traceabilitysystems and associated regulations specifically developed forfish and seafood products have been, or will be soon, imple-mented worldwide (1).
Given the growing importance of aquaculture in SoutheastAsian and Indian-Pacific nations, the traceability of fish and
seafood products and associated regulations are becomingincreasingly important in Australia (3). In Australia and NewZealand, the statutory agency “Food Standards Australia NewZealand” has developed standard codes and is increasinglyconcerned with traceability and labeling issues of fish andseafood products. As a consequence of these codes, a varietyof labeling schemes are being put in place for fish productswith the broad aim of promoting product safety, distinction ofquality, and resource sustainability (1, 2).
The future and economically sustainable development of theaquaculture sector will be progressively more market driven and,consequently, reliant on its capacity to meet consumers’expectations. A number of studies have recently pointed outincreasing consumer concerns about safety and health issues (1, 4),with consumers also being aware of environmentally detrimentalpractices (5). Hence, environmental, organic, and ethical issuesare growing in significance as factors affecting consumers’ foodchoices (6, 7). Consequently, consumers expect to be able toeasily access reliable information, through a labeling scheme,as to which aquaculture techniques and which types of feed orraw materials have been used in the feed formulation (2).
In light of the above issues, there has been much recentactivity in developing analytical tools to distinguish betweenfarmed and wild-caught fish (8-11). In contrast, only limitedinformation is available for differentiating cultured fish farmed
* To whom correspondence should be addressed. Tel: +61 3 55633312. Fax: +61 3 55633462. E mail: [email protected].
† Deakin University.‡ Department of Primary Industries.
274 J. Agric. Food Chem. 2009, 57, 274–281
10.1021/jf801962h CCC: $40.75 2009 American Chemical SocietyPublished on Web 12/11/2008
from different systems or different regions (12). However, it isaccepted that the quality of farmed fish, which can vary greatlybetween farms, is mainly influenced by the quality of farmingenvironment, the quality of the feed, the feed management, andthe culture methods implemented (13, 14). Thus, there is agrowing need to develop analytical methods for discriminatingamong farmed fish cultured in different systems and/or indifferent geographical locations.
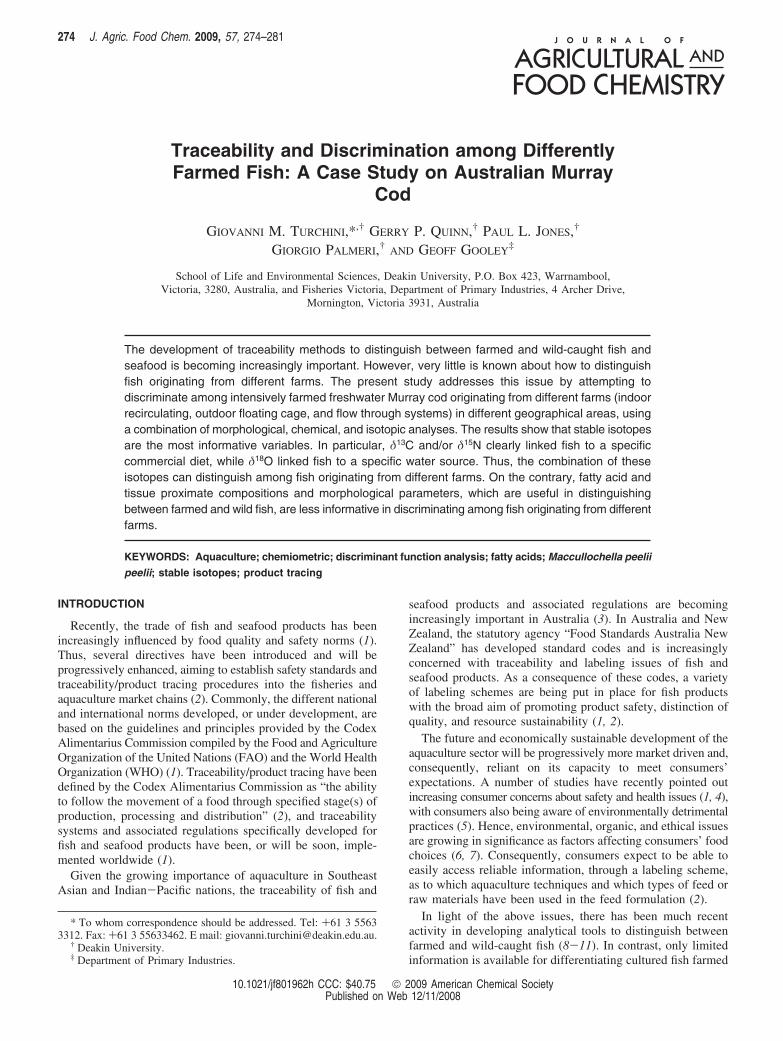
The aim of the present study was to develop analyticalmethods to detect the origin of intensively cultured freshwaterMurray cod (Maccullochella peelii peelii) in Australia, tryingto distinguish between fish farmed in different locations, underdifferent farming conditions, and fed with different commercialfeeds. The rationale for choosing Murray cod is that it supportsa new and emerging national aquaculture industry with exportmarket potential, it is farmed from southeastern South Australia(SA), through Victoria (VIC) and New South Wales (NSW),to southeastern Queensland (QLD), and Murray cod are com-monly reared in a variety of different culture systems; the latterincluding highly intensive recirculating systems, flow-throughearthen raceway or pond systems, and more recently also infloating cages, raceways, and tanks in irrigation storage reser-
voirs as a component of integrated agri-aquaculture productionsystems (15, 16).
MATERIALS AND METHODS
Fish Sampling and Farms Description. Twelve commercial sizeMurray cod (∼750 g) were collected during March, 2007, from fourdifferent farms specialized in Murray cod production (DU, DeakinUniversity Murray cod farm; GL, Glenview Murray cod farm; RU,Rutherglen Murray cod farm; and DPI, Department of Primary Industryfarm; Table 1 and Figure 1). They were culled using an ice slurry,bled, immediately shipped on ice to the Deakin University laboratories,and then stored at -20 °C until required. In the four farms, Murraycod were fed for the last part (>3 months) of the production cyclewith different commercial extruded diets (Table 1).
Morphological Parameters. The morphological parameters mea-sured included total length (TL), total weight (TW), somatic weight(SW; gutted carcass weight), total viscera weight (VW; including liver,gut, and perivisceral fat), and fillet weight (FW; with skin on). Allweights were in grams, and lengths were in centimeters. Also estimatedwere the following morphologic parameters: Fulton’s condition factorK ) TW × TL-3 × 100; dress-out percentage (%) ) SW × TW-1 ×100; and fillet yield (%) ) FW × TW-1 × 100.
Chemical Analyses. Proximate compositions of commercial diets
Table 1. General Farms Characteristics, Water Quality, and Details of the Commercial Diets Used in Four Different Murray Cod Farms
farms
DU GL RU DPI
location Warrnambool (VIC) Glenview (QLD) Rutherglen (VIC) Red Cliffs (VIC)farm type indoor indoor indoor outdoorlatitude 38.38 °S 26.46 °S 36.06 °S 34.18 °Selevation (m) 21 426 169 54farming system recirculating
aquaculture systemrecirculating
aquaculture systemflow trough system open-water cage farm
in irrigation reservoirstocking density (kg/m3) 50-150 70-130 10-20 15-30water source bore water mix of bore and
earthen pond waterbore water surface irrigation
(Murray river)water exchange (%/day) 15 10 300-500temperature (°C) 20-25 25-31 16-22 8.6-28.5oxygen (mg/L) 7-15 8-12 6-8 3.5-16.5ammonia (mg/L) 0.1-1.5 0.1-0.5 <1.0 0.0-2.73nitrate (mg/L) 40-120 <30 <40 0.0-11.6diet producer Skretting Ridley Ridley Skrettingdiet name Nova ME 45/20 Marine Sink Aqua Native Classic SSpellet size (mm) 11 10 6 11
Figure 1. Schematic map of Australia with the location of the four Murray cod farms.
Traceability and Discrimination among Farmed Fish J. Agric. Food Chem., Vol. 57, No. 1, 2009 275
and fish fillets were determined according to standard methodspreviously described (17, 18). Briefly, moisture was determined bydrying samples in an oven at 80 °C to constant weight. The proteincontent was determined using an automated Kjeltech 2300 (FossTecator, Hoganas, Sweden). Lipid was determined by chloroform:methanol (2:1) extraction. The ash content was determined by incinerat-ing samples in a muffle furnace (Wit, C & L Tetlow, Blackburn,Australia) at 550 °C for 18 h. Three subsamples of each commercialdiet and the whole left fillet of each fish, denuded from the skin andfinely minced and mixed, were used for the proximate analysis. Allanalyses were performed in triplicate.
Fatty acid analysis was performed on three subsamples of thecommercial diets and on the individual right fillets, denuded from theskin and finely minced and mixed, from each farm. All analyses werecarried out in triplicate as previously described (17, 18). Briefly, afterlipid extraction, fatty acids were esterified into methyl esters using theacid-catalyzed methylation method, and fatty acid methyl esters wereisolated and identified by gas chromatography. The resulting peak areaswere corrected by theoretical relative FID (flame ionization detector)response factors and quantified relative to the internal standard. Fattyacids accounting for less than 10 mg per gram of lipid were omitted,and the final fatty acid composition was reported as a percentage (%w/w) of total fatty acids.
Stable Isotopes Analysis. Bulk isotope ratios 13C/12C and 15N/14Nwere determined in diets and fish fillets, and 18O/16O was determinedin diets, fish fillets, and culture water by stable isotope ratio massspectrometry (IRMS). The isotopic composition of a sample wasreported accordingly to the standard δ notation. Subsamples of thecommercial diets and fish fillets were freeze-dried and pulverized, whilewater samples were filtered (0.45 µm). The stable isotoped analysiswas implemented at the Flinders Advanced Analytical Laboratory(Flinders University, Adelaide, SA) following standard procedures usinga GV IsoPrime, stable isotope mass spectrometer (GV Instruments,Manchester, United Kingdom), and a EuroVector elemental analyzer(Milan, Italy). Standards certified by the International Atomic EnergyAgency (IAEA, Vienna, Austria) were used, and the δ18O on solidsamples (diets and fillets) was performed as previously described byStuart-Williams et al. (19).
Statistical and Chemiometric Analysis. Where appropriate, dataare reported as means ( standard errors of means (SEM). Afternormality and homogeneity of variances were confirmed, one-wayanalysis of variance (ANOVA) was used to test for differences betweenmeans of the four farms for each variable. Differences were consideredstatistically significant at P < 0.05. Student-Newman-Keuls posthoctests were used to separate groups after a significant ANOVA.Discriminant function analysis (DFA) was used to determine whichvariables were most effective at identifying the source of fish (i.e.,among the four farms). As is typical of such data, the number ofvariables far exceeded the number of individual replicate fish, so DFAwas not possible on the whole data set (20). The ratio of variables toreplicate fish was reduced by (i) doing separate analyses for isotopes,morphological and proximate composition variables, and fatty acidvariables and (ii) only including those variables that showed significantdifferences between the four farms in the one-way ANOVAs, tomaximize the discriminatory ability of the analyses. As the main aimof the DFA was to identify those variables most important indistinguishing which farm the fish came from, it was assumed that thosevariables that were not significantly different between farms would notbe good discriminators. All statistical analyses were performed usingSPSS (SPSS Inc. Chicago, Illinois) v.14.0 for Windows.
RESULTS
Three out of the four commercial diets had similar proximatecompositions with protein contents varying from 457 to 470mg g-1 and lipid contents varying from 182 to 193 mg g-1
(Table 2). The RU diet was notably different because it wascharacterized by a very high protein content (532 mg g-1) andvery low lipid content (110 mg g-1). DU and DPI diets hadvery similar fatty acid compositions with the three major classes
of fatty acids, saturated fatty acids (SFA), monounsaturated fattyacids (MUFA), and polyunsaturated fatty acids (PUFA), andthe principal individual fatty acids, oleic acid (OA; 18:1n-9),linoleic acid (LA; 18:2n-6), R-linolenic acid (ALA; 18:3n-3),arachidonic acid (AA; 20:4n-6), eicosapentaenoic acid (EPA;20:5n-3), and docosahexaenoic acid (DHA; 22:6n-3), notshowing noteworthy differences (Table 2). The GL diet wascharacterized by a relatively low content of OA and LA(typically derived from vegetable oils) and relatively highcontent of n-4 PUFA (namely, 16:2n-4, 16:3n-4, and 18:3n-4),EPA, and in general n-3 highly unsaturated fatty acids (HUFA;typically derived from marine fish oils). In contrast, the RUdiet had a very high content of OA, LA, and MUFA andrelatively low content of palmitic acid (PA; 16:0), EPA, andn-3 HUFA (Table 2).
No major variations in the stable isotope ratios of δ13C, δ15Nand δ18O of the four diets were recorded (Table 3). However,DU and DPI diets (both produced by the same feed manufac-turer) recorded δ13C ratios of -22.9 and -22.1‰, respectively,while GL and RU diets (both produced by the other feed mill)recorded higher values of δ13C ratios of -20.6 and -20.4‰,respectively. DU and DPI diets were characterized and foundto have similar δ15N ratios (7.3 and 7.7‰, respectively), whileGL and RU diets differed from each other and recorded valuesof δ15N ratios of 8.8 and 9.7‰, respectively. δ18O ratios werealmost constant across the four diets, varying from 23.5 to24.2‰, while noteworthy differences were recorded in the water
Table 2. Proximate (mg g-1) and Fatty Acid (% w/w) Composition of theCommercial Diets Used in Four Different Murray Cod Farms
farmsa
DU GL RU DPI
proximate composition (mg g-1)moisture 94.1 81.0 71.6 95.6protein 470.0 464.9 532.4 457.9lipid 182.2 193.9 110.7 191.0ash 88.4 115.0 106.5 74.9NFEb 165.3 145.2 178.9 180.7
fatty acid composition (% w/w)14:0 3.9 7.3 3.8 3.716:0 21.7 21.1 14.6 20.618:0 5.3 5.9 5.0 5.216:1n-7 7.1 9.3 4.8 5.718:1n-9 26.6 15.4 33.3 27.718:1n-7 3.4 3.5 4.0 3.320:1c 0.9 0.9 1.0 3.522:1d 0.6 0.8 0.3 2.316:2n-4 0.5 1.2 0.6 0.216:3n-4 0.7 1.5 0.6 0.418:2n-6 10.3 4.5 12.9 10.720:4n-6 0.7 1.0 0.6 0.618:3n-3 1.2 0.9 4.2 1.218:4n-3 1.3 1.7 0.9 1.020:5n-3 7.2 12.6 5.1 4.922:5n-3 0.9 1.8 1.1 0.922:6n-3 5.9 7.7 5.1 5.9SFA 31.4 34.8 24.0 30.1MUFA 38.6 29.9 43.5 42.6PUFA 30.0 35.2 32.5 27.4n-3 PUFA 16.8 25.4 16.9 14.5n-4 PUFA 1.4 3.1 1.4 0.8n-6 PUFA 11.8 6.7 14.2 12.1HUFA 15.6 24.6 12.8 13.3n-3 HUFA 14.4 22.8 11.7 12.3n-6 HUFA 1.3 1.8 1.0 1.0
a See Table 1 for farm descriptions. b NFE, nitrogen free extract calculated bydifference. c Represents the sum of 20:1 isomers. d Represents the sum of 22:1isomers.
276 J. Agric. Food Chem., Vol. 57, No. 1, 2009 Turchini et al.
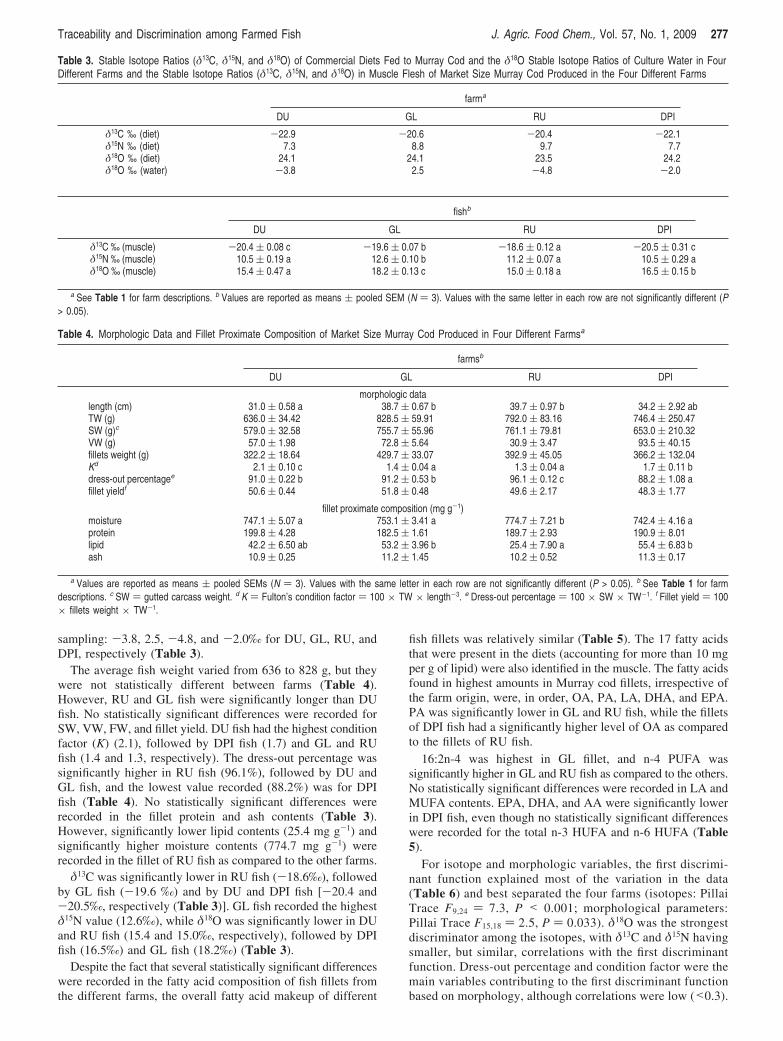
sampling: -3.8, 2.5, -4.8, and -2.0‰ for DU, GL, RU, andDPI, respectively (Table 3).
The average fish weight varied from 636 to 828 g, but theywere not statistically different between farms (Table 4).However, RU and GL fish were significantly longer than DUfish. No statistically significant differences were recorded forSW, VW, FW, and fillet yield. DU fish had the highest conditionfactor (K) (2.1), followed by DPI fish (1.7) and GL and RUfish (1.4 and 1.3, respectively). The dress-out percentage wassignificantly higher in RU fish (96.1%), followed by DU andGL fish, and the lowest value recorded (88.2%) was for DPIfish (Table 4). No statistically significant differences wererecorded in the fillet protein and ash contents (Table 3).However, significantly lower lipid contents (25.4 mg g-1) andsignificantly higher moisture contents (774.7 mg g-1) wererecorded in the fillet of RU fish as compared to the other farms.
δ13C was significantly lower in RU fish (-18.6‰), followedby GL fish (-19.6 ‰) and by DU and DPI fish [-20.4 and-20.5‰, respectively (Table 3)]. GL fish recorded the highestδ15N value (12.6‰), while δ18O was significantly lower in DUand RU fish (15.4 and 15.0‰, respectively), followed by DPIfish (16.5‰) and GL fish (18.2‰) (Table 3).
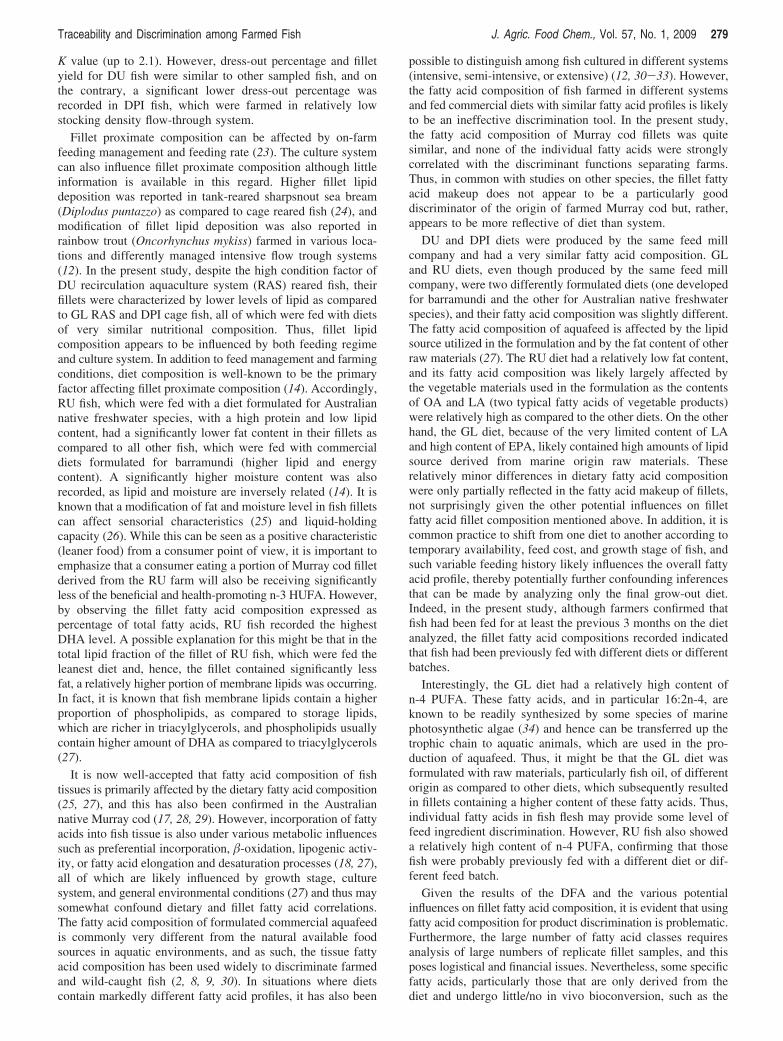
Despite the fact that several statistically significant differenceswere recorded in the fatty acid composition of fish fillets fromthe different farms, the overall fatty acid makeup of different
fish fillets was relatively similar (Table 5). The 17 fatty acidsthat were present in the diets (accounting for more than 10 mgper g of lipid) were also identified in the muscle. The fatty acidsfound in highest amounts in Murray cod fillets, irrespective ofthe farm origin, were, in order, OA, PA, LA, DHA, and EPA.PA was significantly lower in GL and RU fish, while the filletsof DPI fish had a significantly higher level of OA as comparedto the fillets of RU fish.
16:2n-4 was highest in GL fillet, and n-4 PUFA wassignificantly higher in GL and RU fish as compared to the others.No statistically significant differences were recorded in LA andMUFA contents. EPA, DHA, and AA were significantly lowerin DPI fish, even though no statistically significant differenceswere recorded for the total n-3 HUFA and n-6 HUFA (Table5).
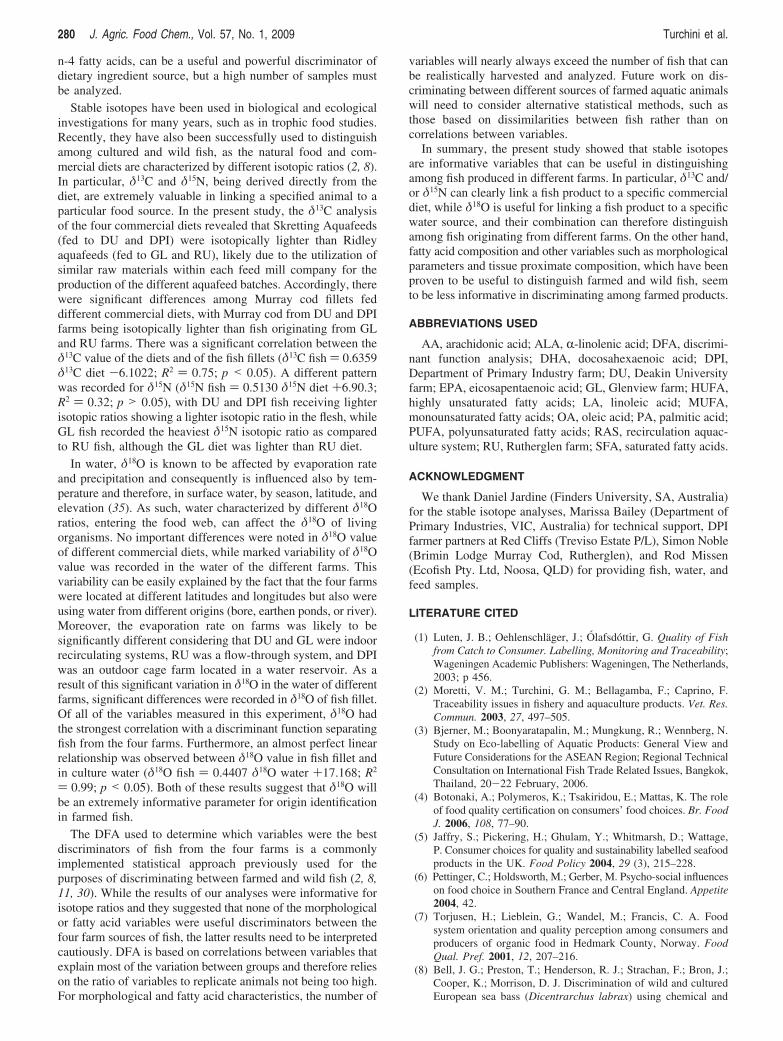
For isotope and morphologic variables, the first discrimi-nant function explained most of the variation in the data(Table 6) and best separated the four farms (isotopes: PillaiTrace F9,24 ) 7.3, P < 0.001; morphological parameters:Pillai Trace F15,18 ) 2.5, P ) 0.033). δ18O was the strongestdiscriminator among the isotopes, with δ13C and δ15N havingsmaller, but similar, correlations with the first discriminantfunction. Dress-out percentage and condition factor were themain variables contributing to the first discriminant functionbased on morphology, although correlations were low (<0.3).
Table 3. Stable Isotope Ratios (δ13C, δ15N, and δ18O) of Commercial Diets Fed to Murray Cod and the δ18O Stable Isotope Ratios of Culture Water in FourDifferent Farms and the Stable Isotope Ratios (δ13C, δ15N, and δ18O) in Muscle Flesh of Market Size Murray Cod Produced in the Four Different Farms
farma
DU GL RU DPI
δ13C ‰ (diet) -22.9 -20.6 -20.4 -22.1δ15N ‰ (diet) 7.3 8.8 9.7 7.7δ18O ‰ (diet) 24.1 24.1 23.5 24.2δ18O ‰ (water) -3.8 2.5 -4.8 -2.0
fishb
DU GL RU DPI
δ13C ‰ (muscle) -20.4 ( 0.08 c -19.6 ( 0.07 b -18.6 ( 0.12 a -20.5 ( 0.31 cδ15N ‰ (muscle) 10.5 ( 0.19 a 12.6 ( 0.10 b 11.2 ( 0.07 a 10.5 ( 0.29 aδ18O ‰ (muscle) 15.4 ( 0.47 a 18.2 ( 0.13 c 15.0 ( 0.18 a 16.5 ( 0.15 b
a See Table 1 for farm descriptions. b Values are reported as means ( pooled SEM (N ) 3). Values with the same letter in each row are not significantly different (P> 0.05).
Table 4. Morphologic Data and Fillet Proximate Composition of Market Size Murray Cod Produced in Four Different Farmsa
farmsb
DU GL RU DPI
morphologic datalength (cm) 31.0 ( 0.58 a 38.7 ( 0.67 b 39.7 ( 0.97 b 34.2 ( 2.92 abTW (g) 636.0 ( 34.42 828.5 ( 59.91 792.0 ( 83.16 746.4 ( 250.47SW (g)c 579.0 ( 32.58 755.7 ( 55.96 761.1 ( 79.81 653.0 ( 210.32VW (g) 57.0 ( 1.98 72.8 ( 5.64 30.9 ( 3.47 93.5 ( 40.15fillets weight (g) 322.2 ( 18.64 429.7 ( 33.07 392.9 ( 45.05 366.2 ( 132.04Kd 2.1 ( 0.10 c 1.4 ( 0.04 a 1.3 ( 0.04 a 1.7 ( 0.11 bdress-out percentagee 91.0 ( 0.22 b 91.2 ( 0.53 b 96.1 ( 0.12 c 88.2 ( 1.08 afillet yieldf 50.6 ( 0.44 51.8 ( 0.48 49.6 ( 2.17 48.3 ( 1.77
fillet proximate composition (mg g-1)moisture 747.1 ( 5.07 a 753.1 ( 3.41 a 774.7 ( 7.21 b 742.4 ( 4.16 aprotein 199.8 ( 4.28 182.5 ( 1.61 189.7 ( 2.93 190.9 ( 8.01lipid 42.2 ( 6.50 ab 53.2 ( 3.96 b 25.4 ( 7.90 a 55.4 ( 6.83 bash 10.9 ( 0.25 11.2 ( 1.45 10.2 ( 0.52 11.3 ( 0.17
a Values are reported as means ( pooled SEMs (N ) 3). Values with the same letter in each row are not significantly different (P > 0.05). b See Table 1 for farmdescriptions. c SW ) gutted carcass weight. d K ) Fulton’s condition factor ) 100 × TW × length-3. e Dress-out percentage ) 100 × SW × TW-1. f Fillet yield ) 100× fillets weight × TW-1.
Traceability and Discrimination among Farmed Fish J. Agric. Food Chem., Vol. 57, No. 1, 2009 277
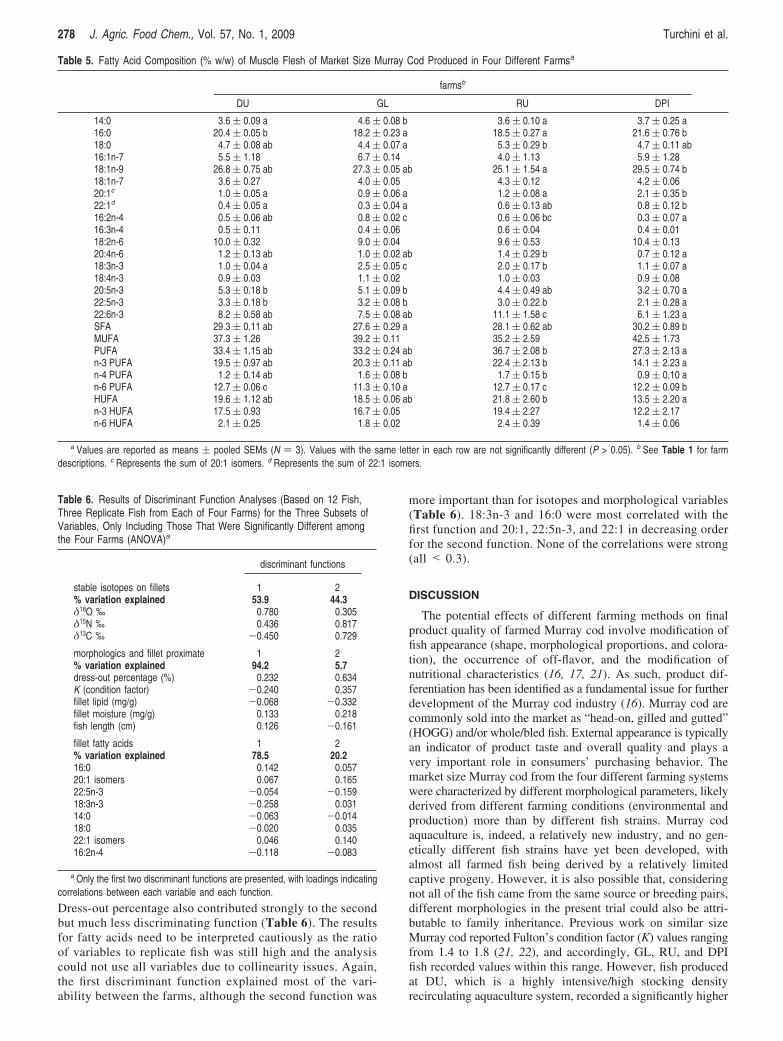
Dress-out percentage also contributed strongly to the secondbut much less discriminating function (Table 6). The resultsfor fatty acids need to be interpreted cautiously as the ratioof variables to replicate fish was still high and the analysiscould not use all variables due to collinearity issues. Again,the first discriminant function explained most of the vari-ability between the farms, although the second function was
more important than for isotopes and morphological variables(Table 6). 18:3n-3 and 16:0 were most correlated with thefirst function and 20:1, 22:5n-3, and 22:1 in decreasing orderfor the second function. None of the correlations were strong(all < 0.3).
DISCUSSION
The potential effects of different farming methods on finalproduct quality of farmed Murray cod involve modification offish appearance (shape, morphological proportions, and colora-tion), the occurrence of off-flavor, and the modification ofnutritional characteristics (16, 17, 21). As such, product dif-ferentiation has been identified as a fundamental issue for furtherdevelopment of the Murray cod industry (16). Murray cod arecommonly sold into the market as “head-on, gilled and gutted”(HOGG) and/or whole/bled fish. External appearance is typicallyan indicator of product taste and overall quality and plays avery important role in consumers’ purchasing behavior. Themarket size Murray cod from the four different farming systemswere characterized by different morphological parameters, likelyderived from different farming conditions (environmental andproduction) more than by different fish strains. Murray codaquaculture is, indeed, a relatively new industry, and no gen-etically different fish strains have yet been developed, withalmost all farmed fish being derived by a relatively limitedcaptive progeny. However, it is also possible that, consideringnot all of the fish came from the same source or breeding pairs,different morphologies in the present trial could also be attri-butable to family inheritance. Previous work on similar sizeMurray cod reported Fulton’s condition factor (K) values rangingfrom 1.4 to 1.8 (21, 22), and accordingly, GL, RU, and DPIfish recorded values within this range. However, fish producedat DU, which is a highly intensive/high stocking densityrecirculating aquaculture system, recorded a significantly higher
Table 5. Fatty Acid Composition (% w/w) of Muscle Flesh of Market Size Murray Cod Produced in Four Different Farmsa
farmsb
DU GL RU DPI
14:0 3.6 ( 0.09 a 4.6 ( 0.08 b 3.6 ( 0.10 a 3.7 ( 0.25 a16:0 20.4 ( 0.05 b 18.2 ( 0.23 a 18.5 ( 0.27 a 21.6 ( 0.76 b18:0 4.7 ( 0.08 ab 4.4 ( 0.07 a 5.3 ( 0.29 b 4.7 ( 0.11 ab16:1n-7 5.5 ( 1.18 6.7 ( 0.14 4.0 ( 1.13 5.9 ( 1.2818:1n-9 26.8 ( 0.75 ab 27.3 ( 0.05 ab 25.1 ( 1.54 a 29.5 ( 0.74 b18:1n-7 3.6 ( 0.27 4.0 ( 0.05 4.3 ( 0.12 4.2 ( 0.0620:1c 1.0 ( 0.05 a 0.9 ( 0.06 a 1.2 ( 0.08 a 2.1 ( 0.35 b22:1d 0.4 ( 0.05 a 0.3 ( 0.04 a 0.6 ( 0.13 ab 0.8 ( 0.12 b16:2n-4 0.5 ( 0.06 ab 0.8 ( 0.02 c 0.6 ( 0.06 bc 0.3 ( 0.07 a16:3n-4 0.5 ( 0.11 0.4 ( 0.06 0.6 ( 0.04 0.4 ( 0.0118:2n-6 10.0 ( 0.32 9.0 ( 0.04 9.6 ( 0.53 10.4 ( 0.1320:4n-6 1.2 ( 0.13 ab 1.0 ( 0.02 ab 1.4 ( 0.29 b 0.7 ( 0.12 a18:3n-3 1.0 ( 0.04 a 2.5 ( 0.05 c 2.0 ( 0.17 b 1.1 ( 0.07 a18:4n-3 0.9 ( 0.03 1.1 ( 0.02 1.0 ( 0.03 0.9 ( 0.0820:5n-3 5.3 ( 0.18 b 5.1 ( 0.09 b 4.4 ( 0.49 ab 3.2 ( 0.70 a22:5n-3 3.3 ( 0.18 b 3.2 ( 0.08 b 3.0 ( 0.22 b 2.1 ( 0.28 a22:6n-3 8.2 ( 0.58 ab 7.5 ( 0.08 ab 11.1 ( 1.58 c 6.1 ( 1.23 aSFA 29.3 ( 0.11 ab 27.6 ( 0.29 a 28.1 ( 0.62 ab 30.2 ( 0.89 bMUFA 37.3 ( 1.26 39.2 ( 0.11 35.2 ( 2.59 42.5 ( 1.73PUFA 33.4 ( 1.15 ab 33.2 ( 0.24 ab 36.7 ( 2.08 b 27.3 ( 2.13 an-3 PUFA 19.5 ( 0.97 ab 20.3 ( 0.11 ab 22.4 ( 2.13 b 14.1 ( 2.23 an-4 PUFA 1.2 ( 0.14 ab 1.6 ( 0.08 b 1.7 ( 0.15 b 0.9 ( 0.10 an-6 PUFA 12.7 ( 0.06 c 11.3 ( 0.10 a 12.7 ( 0.17 c 12.2 ( 0.09 bHUFA 19.6 ( 1.12 ab 18.5 ( 0.06 ab 21.8 ( 2.60 b 13.5 ( 2.20 an-3 HUFA 17.5 ( 0.93 16.7 ( 0.05 19.4 ( 2.27 12.2 ( 2.17n-6 HUFA 2.1 ( 0.25 1.8 ( 0.02 2.4 ( 0.39 1.4 ( 0.06
a Values are reported as means ( pooled SEMs (N ) 3). Values with the same letter in each row are not significantly different (P > 0.05). b See Table 1 for farmdescriptions. c Represents the sum of 20:1 isomers. d Represents the sum of 22:1 isomers.
Table 6. Results of Discriminant Function Analyses (Based on 12 Fish,Three Replicate Fish from Each of Four Farms) for the Three Subsets ofVariables, Only Including Those That Were Significantly Different amongthe Four Farms (ANOVA)a
discriminant functions
stable isotopes on fillets 1 2% variation explained 53.9 44.3δ18O ‰ 0.780 0.305δ15N ‰ 0.436 0.817δ13C ‰ -0.450 0.729
morphologics and fillet proximate 1 2% variation explained 94.2 5.7dress-out percentage (%) 0.232 0.634K (condition factor) -0.240 0.357fillet lipid (mg/g) -0.068 -0.332fillet moisture (mg/g) 0.133 0.218fish length (cm) 0.126 -0.161
fillet fatty acids 1 2% variation explained 78.5 20.216:0 0.142 0.05720:1 isomers 0.067 0.16522:5n-3 -0.054 -0.15918:3n-3 -0.258 0.03114:0 -0.063 -0.01418:0 -0.020 0.03522:1 isomers 0.046 0.14016:2n-4 -0.118 -0.083
a Only the first two discriminant functions are presented, with loadings indicatingcorrelations between each variable and each function.
278 J. Agric. Food Chem., Vol. 57, No. 1, 2009 Turchini et al.
K value (up to 2.1). However, dress-out percentage and filletyield for DU fish were similar to other sampled fish, and onthe contrary, a significant lower dress-out percentage wasrecorded in DPI fish, which were farmed in relatively lowstocking density flow-through system.
Fillet proximate composition can be affected by on-farmfeeding management and feeding rate (23). The culture systemcan also influence fillet proximate composition although littleinformation is available in this regard. Higher fillet lipiddeposition was reported in tank-reared sharpsnout sea bream(Diplodus puntazzo) as compared to cage reared fish (24), andmodification of fillet lipid deposition was also reported inrainbow trout (Oncorhynchus mykiss) farmed in various loca-tions and differently managed intensive flow trough systems(12). In the present study, despite the high condition factor ofDU recirculation aquaculture system (RAS) reared fish, theirfillets were characterized by lower levels of lipid as comparedto GL RAS and DPI cage fish, all of which were fed with dietsof very similar nutritional composition. Thus, fillet lipidcomposition appears to be influenced by both feeding regimeand culture system. In addition to feed management and farmingconditions, diet composition is well-known to be the primaryfactor affecting fillet proximate composition (14). Accordingly,RU fish, which were fed with a diet formulated for Australiannative freshwater species, with a high protein and low lipidcontent, had a significantly lower fat content in their fillets ascompared to all other fish, which were fed with commercialdiets formulated for barramundi (higher lipid and energycontent). A significantly higher moisture content was alsorecorded, as lipid and moisture are inversely related (14). It isknown that a modification of fat and moisture level in fish filletscan affect sensorial characteristics (25) and liquid-holdingcapacity (26). While this can be seen as a positive characteristic(leaner food) from a consumer point of view, it is important toemphasize that a consumer eating a portion of Murray cod filletderived from the RU farm will also be receiving significantlyless of the beneficial and health-promoting n-3 HUFA. However,by observing the fillet fatty acid composition expressed aspercentage of total fatty acids, RU fish recorded the highestDHA level. A possible explanation for this might be that in thetotal lipid fraction of the fillet of RU fish, which were fed theleanest diet and, hence, the fillet contained significantly lessfat, a relatively higher portion of membrane lipids was occurring.In fact, it is known that fish membrane lipids contain a higherproportion of phospholipids, as compared to storage lipids,which are richer in triacylglycerols, and phospholipids usuallycontain higher amount of DHA as compared to triacylglycerols(27).
It is now well-accepted that fatty acid composition of fishtissues is primarily affected by the dietary fatty acid composition(25, 27), and this has also been confirmed in the Australiannative Murray cod (17, 28, 29). However, incorporation of fattyacids into fish tissue is also under various metabolic influencessuch as preferential incorporation, �-oxidation, lipogenic activ-ity, or fatty acid elongation and desaturation processes (18, 27),all of which are likely influenced by growth stage, culturesystem, and general environmental conditions (27) and thus maysomewhat confound dietary and fillet fatty acid correlations.The fatty acid composition of formulated commercial aquafeedis commonly very different from the natural available foodsources in aquatic environments, and as such, the tissue fattyacid composition has been used widely to discriminate farmedand wild-caught fish (2, 8, 9, 30). In situations where dietscontain markedly different fatty acid profiles, it has also been
possible to distinguish among fish cultured in different systems(intensive, semi-intensive, or extensive) (12, 30-33). However,the fatty acid composition of fish farmed in different systemsand fed commercial diets with similar fatty acid profiles is likelyto be an ineffective discrimination tool. In the present study,the fatty acid composition of Murray cod fillets was quitesimilar, and none of the individual fatty acids were stronglycorrelated with the discriminant functions separating farms.Thus, in common with studies on other species, the fillet fattyacid makeup does not appear to be a particularly gooddiscriminator of the origin of farmed Murray cod but, rather,appears to be more reflective of diet than system.
DU and DPI diets were produced by the same feed millcompany and had a very similar fatty acid composition. GLand RU diets, even though produced by the same feed millcompany, were two differently formulated diets (one developedfor barramundi and the other for Australian native freshwaterspecies), and their fatty acid composition was slightly different.The fatty acid composition of aquafeed is affected by the lipidsource utilized in the formulation and by the fat content of otherraw materials (27). The RU diet had a relatively low fat content,and its fatty acid composition was likely largely affected bythe vegetable materials used in the formulation as the contentsof OA and LA (two typical fatty acids of vegetable products)were relatively high as compared to the other diets. On the otherhand, the GL diet, because of the very limited content of LAand high content of EPA, likely contained high amounts of lipidsource derived from marine origin raw materials. Theserelatively minor differences in dietary fatty acid compositionwere only partially reflected in the fatty acid makeup of fillets,not surprisingly given the other potential influences on filletfatty acid fillet composition mentioned above. In addition, it iscommon practice to shift from one diet to another according totemporary availability, feed cost, and growth stage of fish, andsuch variable feeding history likely influences the overall fattyacid profile, thereby potentially further confounding inferencesthat can be made by analyzing only the final grow-out diet.Indeed, in the present study, although farmers confirmed thatfish had been fed for at least the previous 3 months on the dietanalyzed, the fillet fatty acid compositions recorded indicatedthat fish had been previously fed with different diets or differentbatches.
Interestingly, the GL diet had a relatively high content ofn-4 PUFA. These fatty acids, and in particular 16:2n-4, areknown to be readily synthesized by some species of marinephotosynthetic algae (34) and hence can be transferred up thetrophic chain to aquatic animals, which are used in the pro-duction of aquafeed. Thus, it might be that the GL diet wasformulated with raw materials, particularly fish oil, of differentorigin as compared to other diets, which subsequently resultedin fillets containing a higher content of these fatty acids. Thus,individual fatty acids in fish flesh may provide some level offeed ingredient discrimination. However, RU fish also showeda relatively high content of n-4 PUFA, confirming that thosefish were probably previously fed with a different diet or dif-ferent feed batch.
Given the results of the DFA and the various potentialinfluences on fillet fatty acid composition, it is evident that usingfatty acid composition for product discrimination is problematic.Furthermore, the large number of fatty acid classes requiresanalysis of large numbers of replicate fillet samples, and thisposes logistical and financial issues. Nevertheless, some specificfatty acids, particularly those that are only derived from thediet and undergo little/no in vivo bioconversion, such as the
Traceability and Discrimination among Farmed Fish J. Agric. Food Chem., Vol. 57, No. 1, 2009 279
n-4 fatty acids, can be a useful and powerful discriminator ofdietary ingredient source, but a high number of samples mustbe analyzed.
Stable isotopes have been used in biological and ecologicalinvestigations for many years, such as in trophic food studies.Recently, they have also been successfully used to distinguishamong cultured and wild fish, as the natural food and com-mercial diets are characterized by different isotopic ratios (2, 8).In particular, δ13C and δ15N, being derived directly from thediet, are extremely valuable in linking a specified animal to aparticular food source. In the present study, the δ13C analysisof the four commercial diets revealed that Skretting Aquafeeds(fed to DU and DPI) were isotopically lighter than Ridleyaquafeeds (fed to GL and RU), likely due to the utilization ofsimilar raw materials within each feed mill company for theproduction of the different aquafeed batches. Accordingly, therewere significant differences among Murray cod fillets feddifferent commercial diets, with Murray cod from DU and DPIfarms being isotopically lighter than fish originating from GLand RU farms. There was a significant correlation between theδ13C value of the diets and of the fish fillets (δ13C fish ) 0.6359δ13C diet -6.1022; R2 ) 0.75; p < 0.05). A different patternwas recorded for δ15N (δ15N fish ) 0.5130 δ15N diet +6.90.3;R2 ) 0.32; p > 0.05), with DU and DPI fish receiving lighterisotopic ratios showing a lighter isotopic ratio in the flesh, whileGL fish recorded the heaviest δ15N isotopic ratio as comparedto RU fish, although the GL diet was lighter than RU diet.
In water, δ18O is known to be affected by evaporation rateand precipitation and consequently is influenced also by tem-perature and therefore, in surface water, by season, latitude, andelevation (35). As such, water characterized by different δ18Oratios, entering the food web, can affect the δ18O of livingorganisms. No important differences were noted in δ18O valueof different commercial diets, while marked variability of δ18Ovalue was recorded in the water of the different farms. Thisvariability can be easily explained by the fact that the four farmswere located at different latitudes and longitudes but also wereusing water from different origins (bore, earthen ponds, or river).Moreover, the evaporation rate on farms was likely to besignificantly different considering that DU and GL were indoorrecirculating systems, RU was a flow-through system, and DPIwas an outdoor cage farm located in a water reservoir. As aresult of this significant variation in δ18O in the water of differentfarms, significant differences were recorded in δ18O of fish fillet.Of all of the variables measured in this experiment, δ18O hadthe strongest correlation with a discriminant function separatingfish from the four farms. Furthermore, an almost perfect linearrelationship was observed between δ18O value in fish fillet andin culture water (δ18O fish ) 0.4407 δ18O water +17.168; R2
) 0.99; p < 0.05). Both of these results suggest that δ18O willbe an extremely informative parameter for origin identificationin farmed fish.
The DFA used to determine which variables were the bestdiscriminators of fish from the four farms is a commonlyimplemented statistical approach previously used for thepurposes of discriminating between farmed and wild fish (2, 8,11, 30). While the results of our analyses were informative forisotope ratios and they suggested that none of the morphologicalor fatty acid variables were useful discriminators between thefour farm sources of fish, the latter results need to be interpretedcautiously. DFA is based on correlations between variables thatexplain most of the variation between groups and therefore relieson the ratio of variables to replicate animals not being too high.For morphological and fatty acid characteristics, the number of
variables will nearly always exceed the number of fish that canbe realistically harvested and analyzed. Future work on dis-criminating between different sources of farmed aquatic animalswill need to consider alternative statistical methods, such asthose based on dissimilarities between fish rather than oncorrelations between variables.
In summary, the present study showed that stable isotopesare informative variables that can be useful in distinguishingamong fish produced in different farms. In particular, δ13C and/or δ15N can clearly link a fish product to a specific commercialdiet, while δ18O is useful for linking a fish product to a specificwater source, and their combination can therefore distinguishamong fish originating from different farms. On the other hand,fatty acid composition and other variables such as morphologicalparameters and tissue proximate composition, which have beenproven to be useful to distinguish farmed and wild fish, seemto be less informative in discriminating among farmed products.
ABBREVIATIONS USED
AA, arachidonic acid; ALA, R-linolenic acid; DFA, discrimi-nant function analysis; DHA, docosahexaenoic acid; DPI,Department of Primary Industry farm; DU, Deakin Universityfarm; EPA, eicosapentaenoic acid; GL, Glenview farm; HUFA,highly unsaturated fatty acids; LA, linoleic acid; MUFA,monounsaturated fatty acids; OA, oleic acid; PA, palmitic acid;PUFA, polyunsaturated fatty acids; RAS, recirculation aquac-ulture system; RU, Rutherglen farm; SFA, saturated fatty acids.
ACKNOWLEDGMENT
We thank Daniel Jardine (Finders University, SA, Australia)for the stable isotope analyses, Marissa Bailey (Department ofPrimary Industries, VIC, Australia) for technical support, DPIfarmer partners at Red Cliffs (Treviso Estate P/L), Simon Noble(Brimin Lodge Murray Cod, Rutherglen), and Rod Missen(Ecofish Pty. Ltd, Noosa, QLD) for providing fish, water, andfeed samples.
LITERATURE CITED
(1) Luten, J. B.; Oehlenschlager, J.; Olafsdottir, G. Quality of Fishfrom Catch to Consumer. Labelling, Monitoring and Traceability;Wageningen Academic Publishers: Wageningen, The Netherlands,2003; p 456.
(2) Moretti, V. M.; Turchini, G. M.; Bellagamba, F.; Caprino, F.Traceability issues in fishery and aquaculture products. Vet. Res.Commun. 2003, 27, 497–505.
(3) Bjerner, M.; Boonyaratapalin, M.; Mungkung, R.; Wennberg, N.Study on Eco-labelling of Aquatic Products: General View andFuture Considerations for the ASEAN Region; Regional TechnicalConsultation on International Fish Trade Related Issues, Bangkok,Thailand, 20-22 February, 2006.
(4) Botonaki, A.; Polymeros, K.; Tsakiridou, E.; Mattas, K. The roleof food quality certification on consumers’ food choices. Br. FoodJ. 2006, 108, 77–90.
(5) Jaffry, S.; Pickering, H.; Ghulam, Y.; Whitmarsh, D.; Wattage,P. Consumer choices for quality and sustainability labelled seafoodproducts in the UK. Food Policy 2004, 29 (3), 215–228.
(6) Pettinger, C.; Holdsworth, M.; Gerber, M. Psycho-social influenceson food choice in Southern France and Central England. Appetite2004, 42.
(7) Torjusen, H.; Lieblein, G.; Wandel, M.; Francis, C. A. Foodsystem orientation and quality perception among consumers andproducers of organic food in Hedmark County, Norway. FoodQual. Pref. 2001, 12, 207–216.
(8) Bell, J. G.; Preston, T.; Henderson, R. J.; Strachan, F.; Bron, J.;Cooper, K.; Morrison, D. J. Discrimination of wild and culturedEuropean sea bass (Dicentrarchus labrax) using chemical and
280 J. Agric. Food Chem., Vol. 57, No. 1, 2009 Turchini et al.
isotopic analyses. J. Agric. Food Chem. 2007, 55, 5934–5941.(9) Rezzi, S.; Giani, I.; Heberger, K.; Axelson, D. E.; Moretti, V. M.;
Reniero, F.; Guillou, C. Classification of gilthead sea bream(Sparus aurata) from 1H NMR lipid profiling combined withprincipal component and linear discriminant analysis. J. Agric.Food Chem. 2007, 55, 9963–9968.
(10) Masoum, S.; Malabat, C.; Jalali-Heravi, M.; Guillou, C.; Rezzi,S.; Rutledge, D. N. Application of support vector machines to1H NMR data of fish oils: methodology for the confirmation ofwild and farmed salmon and their origins. Anal. Bioanal. Chem.2007, 387, 1499–1510.
(11) Busetto, M. L.; Moretti, V. M.; Moreno-Rojas, J. M.; Caprino,F.; Giani, I.; Malandra, R.; Bellagamba, F.; Guillou, C. Authen-tication of farmed and wild turbot (Psetta maxima) by fatty acidand isotopic analyses combined with chemometrics. J. Agric. FoodChem. 2008, 56, 2742–2750.
(12) Turchini, G. M.; Giani, I.; Caprino, F.; Moretti, V. M.; Valfre, F.Discrimination of origin of farmed trout by means of biometricalparameters, fillet composition and flavor volatile compounds. Ital.J. Anim. Sci. 2004, 3, 123–140.
(13) Sargent, J. R.; Bell, J. G.; McGhee, F.; McEvoy, J.; Webster,J. L. The nutritional value of fish. In Farmed Fish Quality; Kestin,S. C., Warriss, P. D., Eds.; Fishing News Books, Blackwll ScienceLtd.: Oxford, United Kingdom, 2001; pp 3-12.
(14) Shearer, K. D. The effect of diet composition and feeding regime onthe proximate composition of farmed fishes. In Farmed Fish Quality;Kestin, S. C., Warriss, P. D., Eds.; Fishing News Books, BlackwllScience Ltd.: Oxford, United Kingdom, 2001; pp 31-41.
(15) Ingram, B. A.; De Silva, S. S.; Gooley, G. J. The AustralianMurray codsA new candidate for intensive production systems.World Aquacult. 2005, 36, 37–44.
(16) Abery, N.; Bailey, M.; Gooley, G. Market DeVelopment andEValuation for Open-Water Farmed Murray Cod; FisheriesVictoria: Queenscliff, VIC, Australia, 2007.
(17) Turchini, G. M.; Francis, D. S.; De Silva, S. S. Modification oftissue fatty acid composition in Murray cod (Maccullochella peeliipeelii, Mitchell) resulting from a shift from vegetable oil diets toa fish oil diet. Aquacult. Res. 2006, 37, 570–585.
(18) Turchini, G. M.; Francis, D. S.; De Silva, S. S. Fatty acidmetabolism in the freshwater fish Murray cod (Maccullochellapeelii peelii) deduced by the whole-body fatty acid balancemethod. Comp. Biochem. Physiol., Part B: Biochem. Mol. Biol.2006, 144, 110–118.
(19) Stuart-Williams, H.; Wong, S. C.; Farquahar, G. D.; Keitel, C.;Clayton, S. An innovative molybdenum column liner for oxygenand hydrogen stable isotope analysis by pyrolysis. Rapid Commun.Mass Spectrom. 2008, 22, 1–10.
(20) Quinn, G. P.; Keough, M. K. Experimental Design and DataAnalysis for Biologists; Cambridge University Press: Cambridge,United Kingdom, 2002; p 520.
(21) Palmeri, G.; Turchini, G. M.; Caprino, F.; Keast, R.; Moretti,V. M.; De Silva, S. S. Biometric, nutritional and sensory changesin intensively farmed Murray cod (Maccullochella peelii peelii,Mitchell) following different purging times. Food Chem. 2008,107, 1605–1615.
(22) Palmeri, G.; Turchini, G. M.; De Silva, S. S. Lipid characterisationand distribution in the fillet of the farmed Australian native fish,Murray cod (Maccullochella peelii peelii). Food Chem. 2007, 102,796–807.
(23) Einen, O.; Mørkøre, T.; Rørå, A. M. B.; Thomassen, M. S. Feedration prior to slaughtersA potential tool for managing productquality of Atlantic salmon (Salmo salar). Aquaculture 1999, 178,149–169.
(24) Orban, E.; Di Lena, G.; Ricelli, A.; Paoletti, F.; Casini, I.;Gambelli, L.; Caproni, R. Quality characteristics of sharpsnoutsea bream (Diplodus puntazzo) from different intensive rearingsystems. Food Chem. 2000, 70, 27–32.
(25) Turchini, G. M.; Metasti, T.; Frøyland, L.; Orban, E.; Caprino,F.; Moretti, V. M.; Valfre, F. Effects of alternative dietary lipidsources on performance, tissue chemical composition, mitochon-drial fatty acid oxidation capabilities and sensory characteristicsin brown trout (Salmo trutta L.). Aquaculture 2003, 225, 251–267.
(26) Mørkøre, T.; Vallet, J. L.; Cardinal, M.; Gomez-Guillen, M. C.;Montero, P.; Torrissen, O. J.; Nortvedt, R.; Sigurgisladottir, S.;Thomassen, M. S. Fat content and fillet shape of Atlantic salmon:relevance for processing yield and quality of raw and smokedproducts. J. Food Sci. 2001, 66, 1348–1354.
(27) Sargent, J. R.; Tocher, D. R.; Bell, J. G. The lipids. In FishNutrition, 3rd ed.; Halver, J. E., Hardy, R. W., Eds.; AcademicPress, Elsevier: San Diego, CA, 2002; pp 181-257.
(28) Francis, D. S.; Turchini, G. M.; Jones, P. L.; De Silva, S. S. Dietarylipid source modulates in vivo fatty acid metabolism in thefreshwater fish, Murray cod (Maccullochella peelii peelii). J.Agric. Food Chem. 2007, 55, 1582–1591.
(29) Turchini, G. M.; Gunasekera, R. M.; De Silva, S. S. Effect ofcrude oil extracts from trout offal as a replacement for fish oil inthe diets of the Australian native fish Murray cod Maccullochellapeelii peelii. Aquacult. Res. 2003, 34, 697–708.
(30) Orban, E.; Nevigato, T.; Di Lena, G.; Casini, I.; Marzetti, A.Differentiation in the lipid quality of wild and farmed seabass(Dicentrarchus labrax) and gilthead sea bream (Sparus aurata).J. Food Sci. 2003, 68, 128–132.
(31) Orban, E.; Di Lena, G.; Nevigato, T.; Casini, I.; Santorini, G.;Marzetti, A.; Caproni, R. Quality characteristics of sea bassintensively reared and from lagoon as affected by growthconditions and the aquatic environment. J. Food Sci. 2002, 67,542–546.
(32) Orban, E.; Sinesio, F.; Paoletti, F.; Casini, N. S.; Caproni, R.;Moneta, E. Nutritional and organoleptic characteristics of aquac-ultured Sea bream (Sparus aurata): influence of different culturingtechniques on fish quality. RiV. Sci. Aliment. 1996, 25, 27–36.
(33) Turchini, G. M.; Mentasti, T.; Crocco, C.; Sala, T.; Puzzi, C.;Moretti, V. M.; Valfre, F. Effects of the extensive culture systemas finishing production strategy on biometric and chemicalparameters in rainbow trout. Aquacult. Res. 2004, 35, 378–384.
(34) Pond, D. W.; Dixon, D. R.; Bell, M. V.; Fallick, A. E.; Sargent,J. R. Occurrence of 16:2(n-4) and 18:2(n-4) fatty acids in the lipidsof the hydrothermal vent shrimps Rimicaris exoculata andAlVinocaris markensis: nutritional and trophic implications. Mar.Ecol.: Prog. Ser. 1997, 156, 167–174.
(35) Bowen, G. J.; Wassenaar, L. I.; Hobson, K. A. Global applicationof stable hydrogen and oxygen isotopes to wildlife forensics.Oecologia 2005, 143, 337–348.
Received for review June 27, 2008. Revised manuscript receivedSeptember 29, 2008. Accepted November 13, 2008. This research wassupported under the Australian Research Council’s Discovery Projectsfunding scheme (project DP0772271). The views expressed herein arethose of the authors and are not necessarily those of the AustralianResearch Council.
JF801962H
Traceability and Discrimination among Farmed Fish J. Agric. Food Chem., Vol. 57, No. 1, 2009 281


![Traceability for Sustainable Trade - UNECE · Traceability for Sustainable Trade] ECE/TRADE/429 2 . 1.2 The Purpose of the Traceability Framework . Current traceability systems are](https://img.pdfslide.us/doc/110x75/5e8a3f92a86eb50a5f7cd6db/traceability-for-sustainable-trade-unece-traceability-for-sustainable-trade-ecetrade429.jpg)
![A Survey on Usage Scenarios for Requirements Traceability ... · traceability support that suits practical needs [21]. With traceability practice, we mean the way in which traceability](https://img.pdfslide.us/doc/110x75/5ecd70c9403ddd79964b64ed/a-survey-on-usage-scenarios-for-requirements-traceability-traceability-support.jpg)