Embed Size (px)
Citation preview
Trace Gas Measurements in IndiaTrace Gas Measurements in India
S. LalPhysical Research Laboratory,
Ahmedabad, India
Indo-US WorkshopChennai
July 12-16, 2006
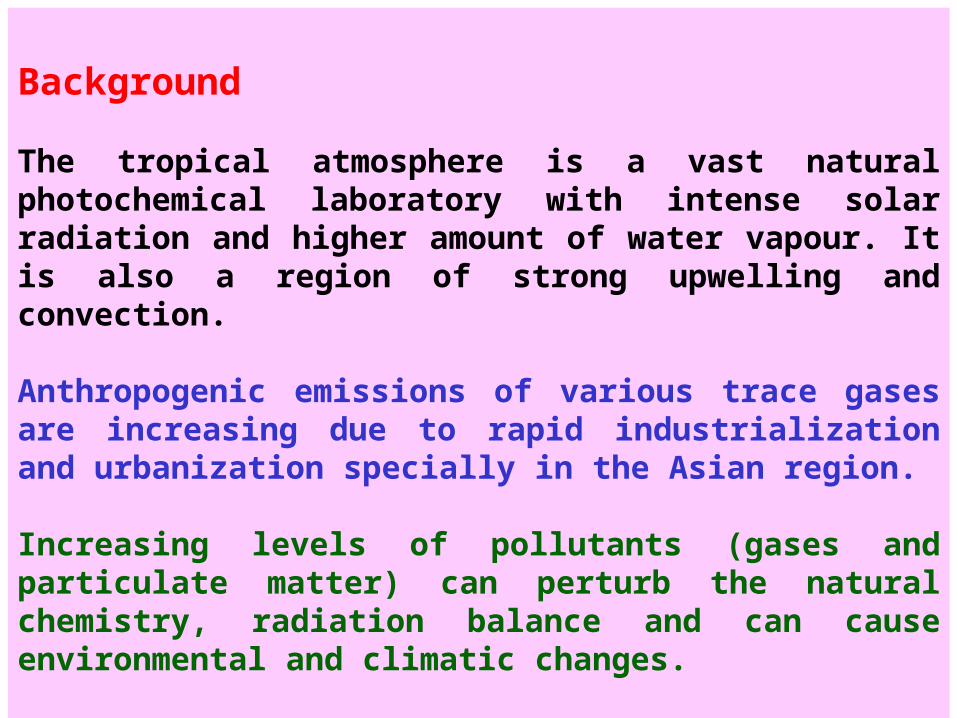
Background
The tropical atmosphere is a vast natural photochemical laboratory with intense solar radiation and higher amount of water vapour. It is also a region of strong upwelling and convection.
Anthropogenic emissions of various trace gases are increasing due to rapid industrialization and urbanization specially in the Asian region.
Increasing levels of pollutants (gases and particulate matter) can perturb the natural chemistry, radiation balance and can cause environmental and climatic changes.

IPCC 2001

Anthropogenic Emissions of Pollutants
Emissions of air pollutants in Gg (Tg for CO2 only) during 2000
Country SO2 NOx CO2 CO CH4 NMHCs
China 20,385 11,347 3,817 115,749 38,356 17,432
Japan 801 2,198 1,203 6,806 1,143 1,920
Indonesia 884 1,317 587 23,105 6,443 6,903
India 5,536 4,591 1,886 63,340 32,851 10,844
Asia Total 34,316 26,768 9,868 278,564 106,821 52,150
America 16,498 25,038 5,840 94,033 61,450 17,907
Europe 33,337 15,603 4,642 85,424 34,195 20,750
Adapted from Streets et al., 2003 (JGR) for Asia while data for America (USA) are taken
from recent EPA report.
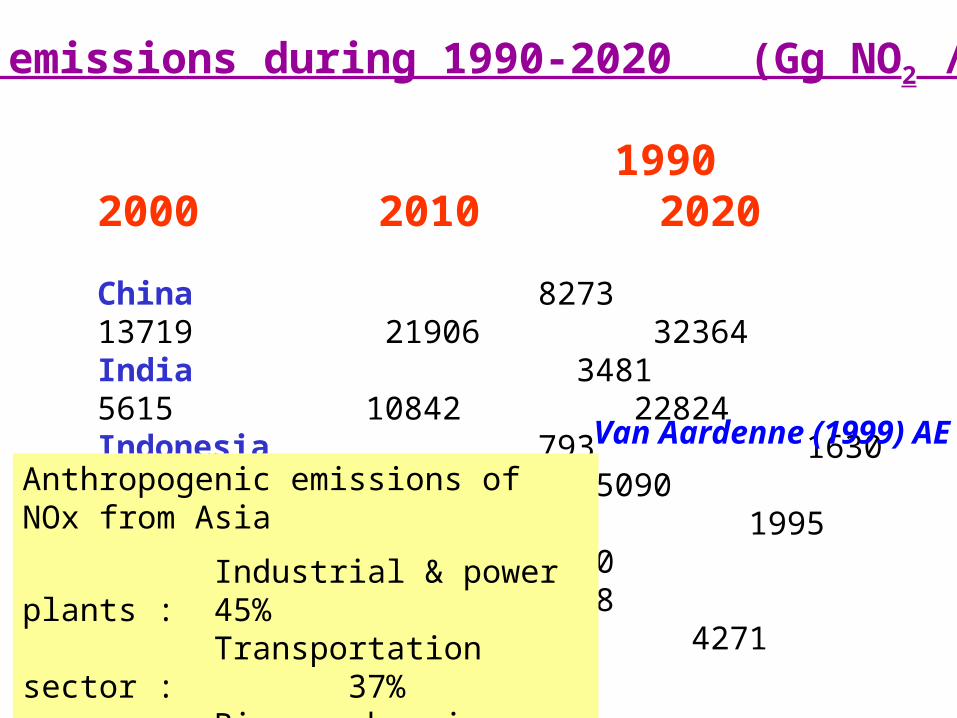
1990 2000 2010 2020
China 8273 13719 21906 32364India 3481 5615 10842 22824Indonesia 793 1630 2914 5090South Korea 977 1995 3131 4590Japan 2468 3168 3758 4271
NOx emissions during 1990-2020 (Gg NO2 /yr)
Van Aardenne (1999) AE
Anthropogenic emissions of NOx from Asia
Industrial & power plants : 45% Transportation sector : 37% Biomass burning : 18%
Streets et al. 2003, JGR
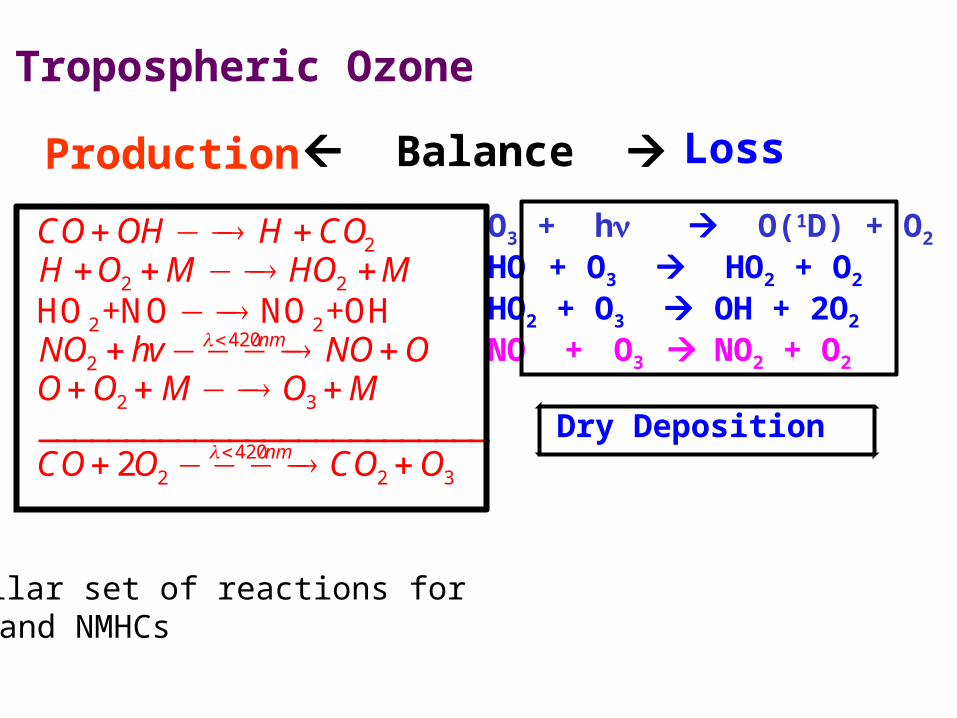
Tropospheric Ozone
Production Loss Balance
O3 + h O(1D) + O2
HO + O3 HO2 + O2
HO2 + O3 OH + 2O2
NO + O3 NO2 + O2
2
2 2
2 2420
2
2 3
4202 2 3
HO +NO NO +OH
__________________________2
nm
nm
CO OH H COH O M HO M
NO hv NO OO O M O M
CO O CO O
Dry Deposition
Similar set of reactions for CH4 and NMHCs
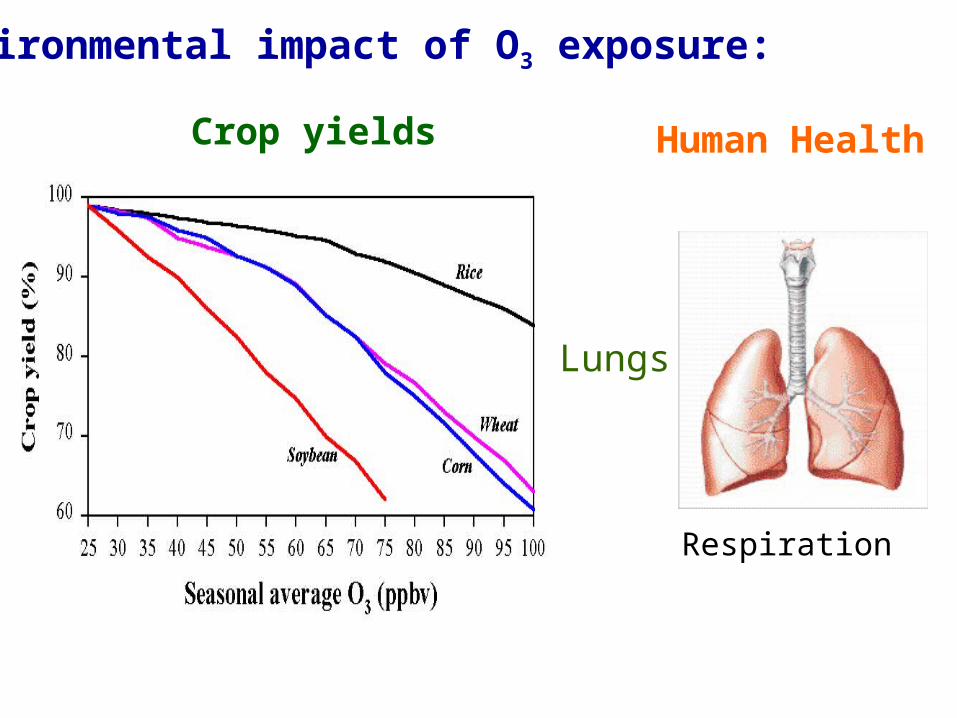
Environmental impact of O3 exposure:
Crop yields Human Health
Lungs
Respiration

Ozone is the only source of OH radicals which are known as ‘detergent’ in the troposphere.
O3 + h -> O(1D) + O2
O(1D) + H2O -> 2OH
Chemistry
Radiation forcing
Forster and Shine, 1997
Role in Chemistry and Climate
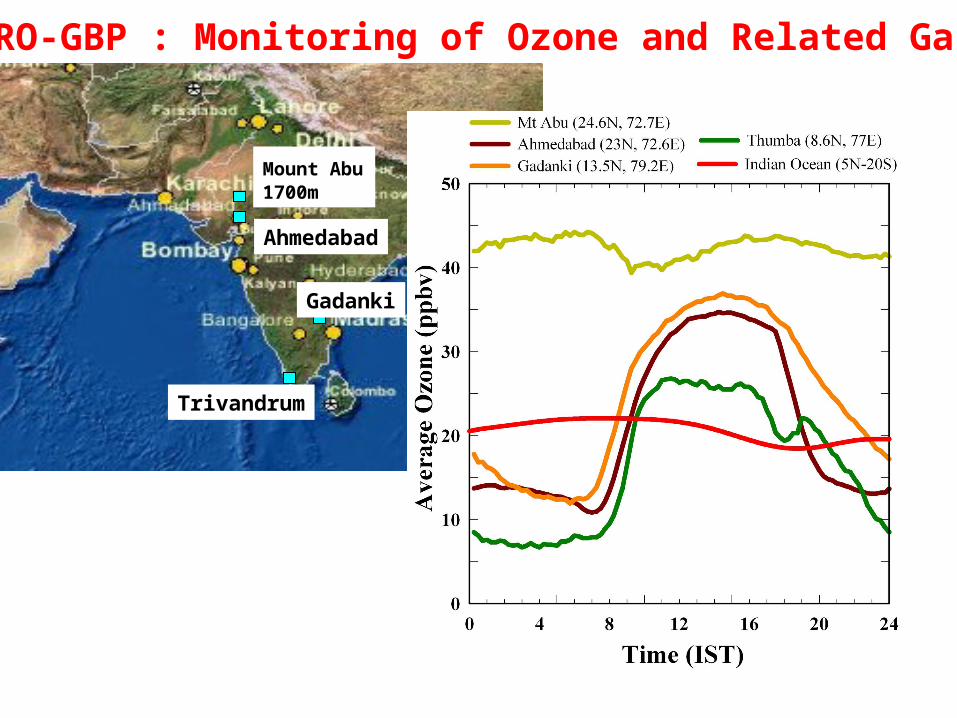
Mount Abu 1700m
Gadanki Port Blair
Trivandrum
Ahmedabad
ISRO-GBP : Monitoring of Ozone and Related Gases

•An increase in surface level ozone concentration from 1954-55 to 1991-93 at 0.5%/year is found over Ahmedabad.
• Efficiency of O3 production more at rural sites than at urban sites. Lower net
surface ozone production (0.15 O3 /CO) over the Indian region as compared to
in US or Europe (0.35 O3 /CO).
Comparison with a 3D Model
Model of Atmospheric Transport and Chemistry (MATCH)
Naja and Lal, GRL 1996Lal and Lawrence, GRL 2001
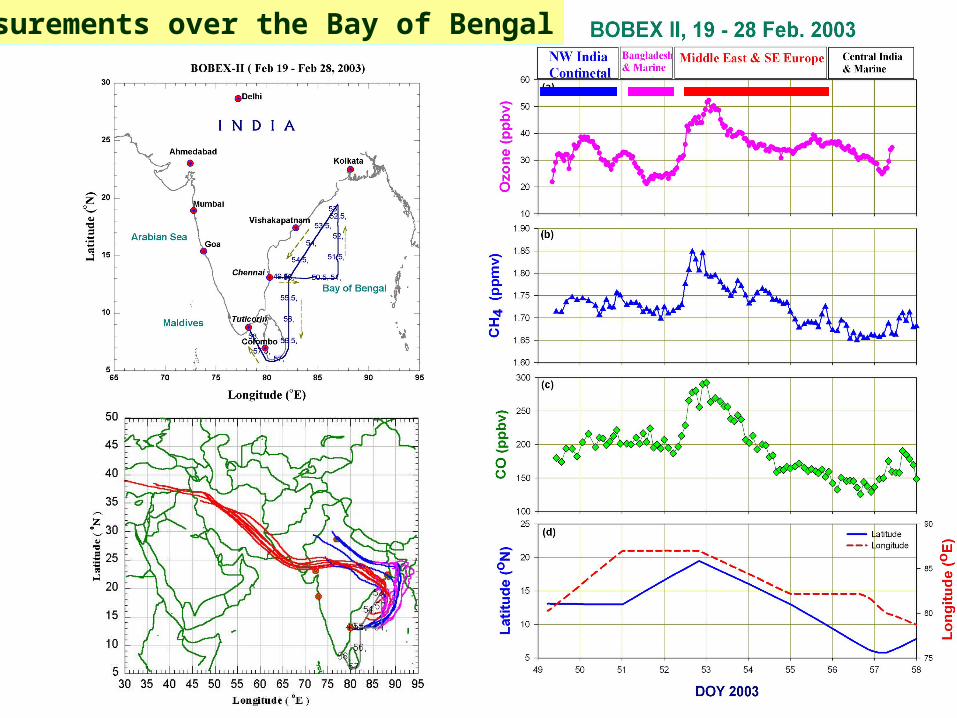
Measurements over the Bay of Bengal

Percentage compositions of C2-C4 NMHCs
At Ahmedabad, local emissions of various NMHCs play very important role while at Mt. Abu transport from the source regions is a key parameter in their distributions.
Among all the NMHCs measured, propane dominates at Ahmedabad while it is ethane at Mt. Abu.
Sahu and Lal, AE, 2006

NPL & CRRIPRLIITMNRSA AUIISc & AntpUSPL
RoutesFor Feb. 2004
Shadnagar/Hyderabad
Distance Travelled ~ 15000 kmNumber of Stations ~ 150Number of Participants ~ 50
ISRO GBP Land Campaign I - Feb. 2004
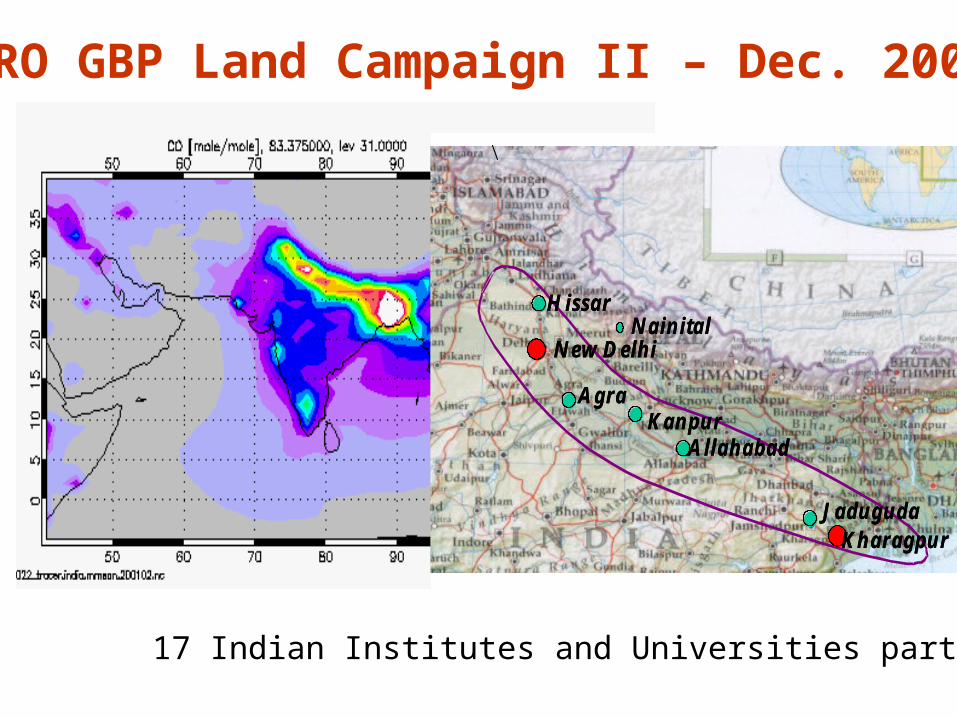
ISRO GBP Land Campaign II – Dec. 2004 Land Campaign II - Dec. 2004
H issar
N ew D elh iN ain ita l
A graK anpur
A llahabad
JadugudaK haragpur
Land Campaign II - Dec. 2004
H issar
N ew D elh iN ain ita l
A graK anpur
A llahabad
JadugudaK haragpur
H issar
N ew D elh iN ain ita l
A graK anpur
A llahabad
JadugudaK haragpur
17 Indian Institutes and Universities participated
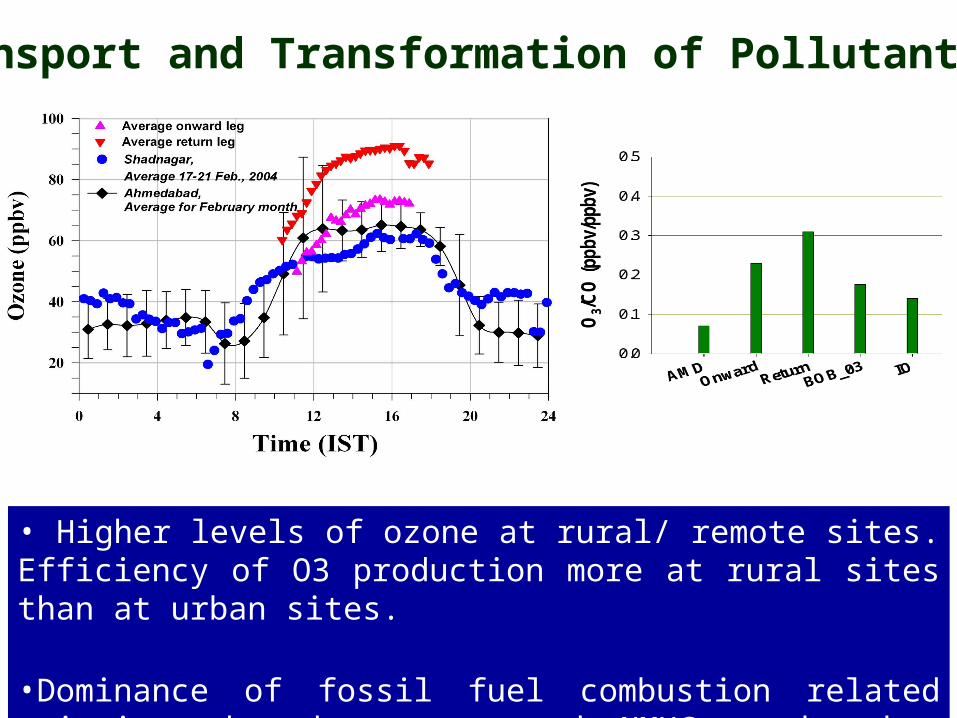
Transport and Transformation of Pollutants
• Higher levels of ozone at rural/ remote sites. Efficiency of O3 production more at rural sites than at urban sites.
•Dominance of fossil fuel combustion related emissions based on measured NMHCs and other gases.
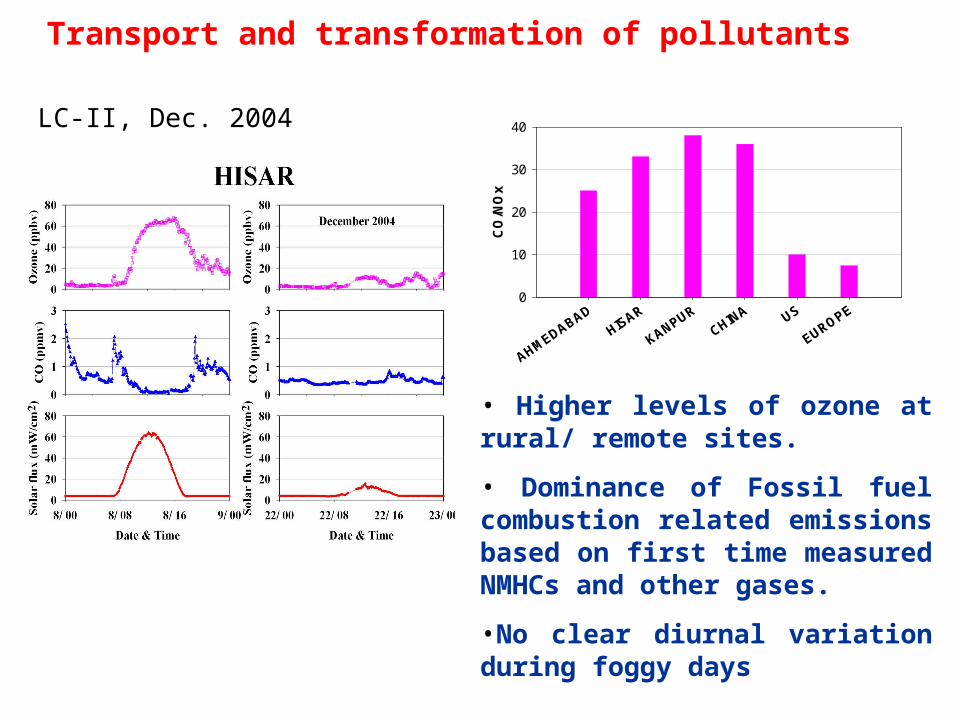
• Higher levels of ozone at rural/ remote sites.
• Dominance of Fossil fuel combustion related emissions based on first time measured NMHCs and other gases.
•No clear diurnal variation during foggy days
LC-II, Dec. 2004
AHMEDABADHISAR
KANPURCHIN
A US
EUROPE
CO
/NO
x
0
10
20
30
40
Transport and transformation of pollutants

Increasing anthropogenic emissions : Impact on chemistry and climate
GOME satellite

Akimoto (2003), Science
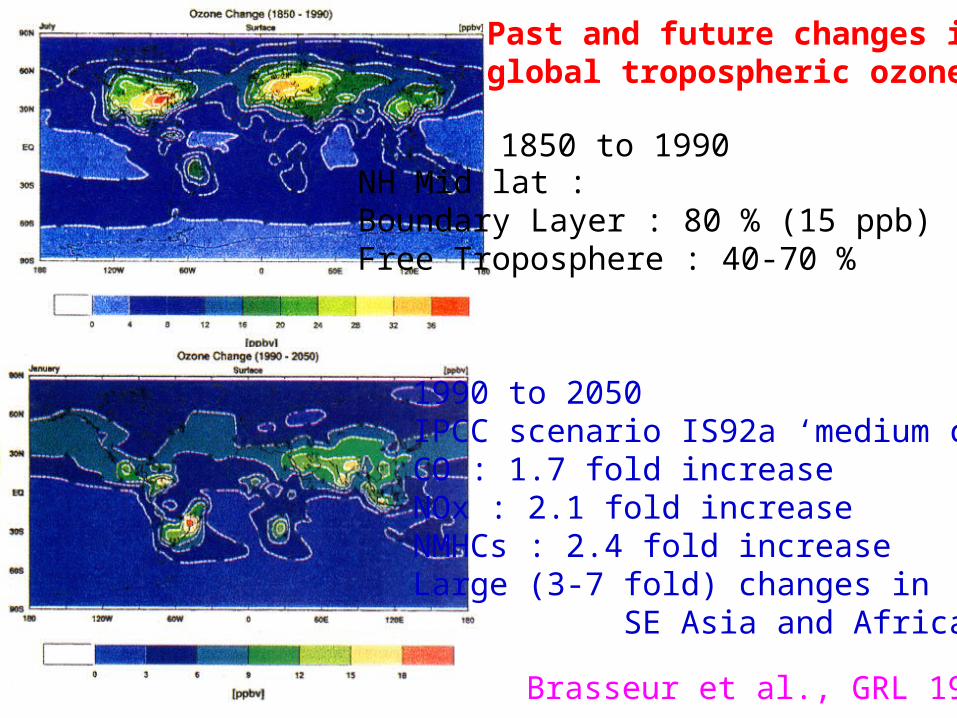
Brasseur et al., GRL 1998
Past and future changes in global tropospheric ozone
NH Mid lat : Boundary Layer : 80 % (15 ppb) Free Troposphere : 40-70 % (20-40 ppb)
1850 to 1990
1990 to 2050IPCC scenario IS92a ‘medium case’CO : 1.7 fold increaseNOx : 2.1 fold increaseNMHCs : 2.4 fold increaseLarge (3-7 fold) changes in SE Asia and Africa
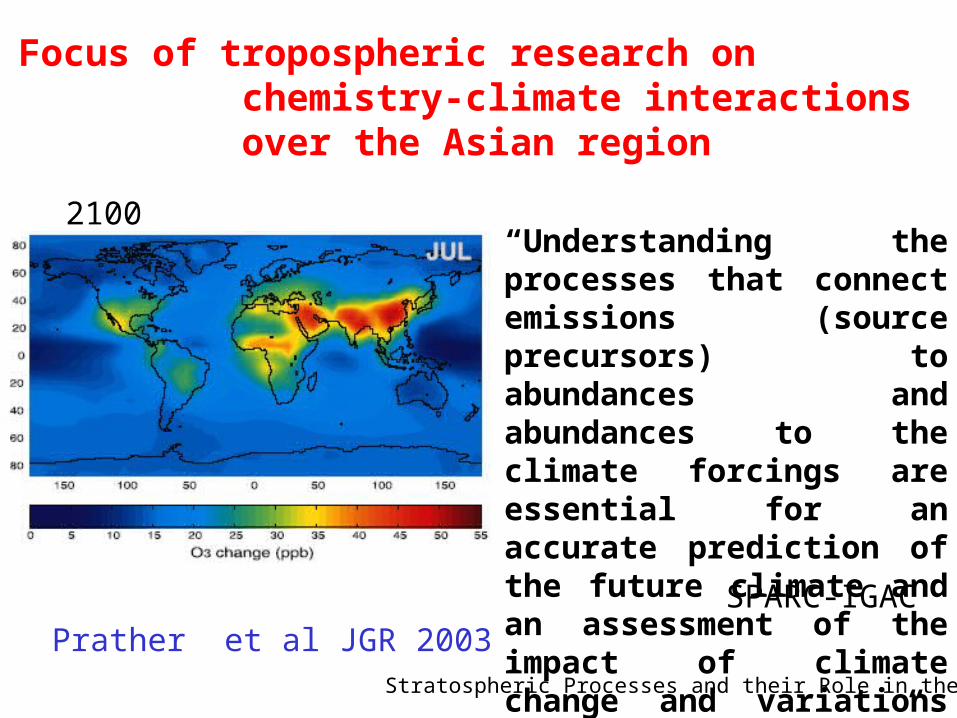
Focus of tropospheric research on chemistry-climate interactions over the Asian region
Prather et al JGR 2003
“Understanding the processes that connect emissions (source precursors) to abundances and abundances to the climate forcings are essential for an accurate prediction of the future climate and an assessment of the impact of climate change and variations on the earth system.”
SPARC-IGAC
Stratospheric Processes and their Role in the Climate
2100

Future Plans
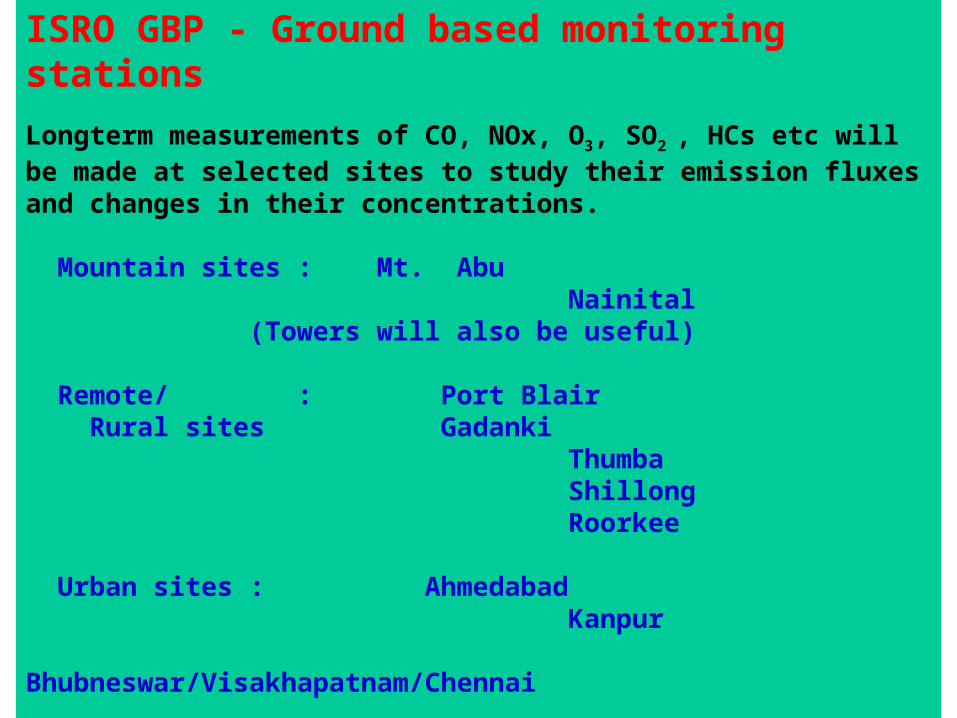
ISRO GBP - Ground based monitoring stations
Longterm measurements of CO, NOx, O3, SO2 , HCs etc will be made at selected sites to study their emission fluxes and changes in their concentrations.
Mountain sites : Mt. Abu Nainital (Towers will also be useful)
Remote/ : Port Blair Rural sites Gadanki Thumba Shillong Roorkee
Urban sites : Ahmedabad Kanpur Bhubneswar/Visakhapatnam/Chennai
Detailed measurements of trace gases will be made along with meteorological parameters (temperature, humidity, winds, solar and IR radiation etc.). Also these measurements will be supported by chemical-transport 3D models.

Satellite based measurements of key pollutants (like CO, O3, aerosol) are needed to study future changes in this region.
• Low inclination satellite• Limb and nadir viewing • High resolution spectrometer 2 - 16 m.
Trace gases measurements from space

Summary
In view of the increasing levels of trace gases due to anthropogenic activities, there is a need to know their emissions and their impacts on environment and future climate.
We plan to study levels and changes occurring due to natural as well as anthropogenic processes in different regions of India using ground based, aircraft and satellite based measurements.
These observation will be supported by 3D model simulations.

Thanks


![Hazra, Kanai Lal - History of Theravada Buddhism in South-East India. [OCR]](https://img.pdfslide.us/doc/110x75/54fbcd934a795937538b4910/hazra-kanai-lal-history-of-theravada-buddhism-in-south-east-india-ocr.jpg)