Embed Size (px)
Citation preview

T A B L E I I . P r e c i s i o n d a t a o f t h e a u t o m a t e d m e t h o d .
Analyzed cation concentration (gg/liter) Relative Catio n MMean S D S D
1 2 3 4 5 6 7 (%)
Se 0.2 0.2 0.2 0.2 0.2 0.2 0.2 0.20 0.0O0 0.O0 1.0 1.0 1.0 1.0 1.0 1.0 1.0 1.00 0.00O O.00 4.0 4.0 4.0 4.0 4.0 4.0 4.0 4.00 0.000 0.00
13 14 12 11 12 13 13 12.57 0.976 7.76 20 22 22 22 24 22 22 22.00 1.155 5.25 43 46 45 44 45 47 46 45.14 1.345 2.98 56 58 58 56 59 55 56 56.86 1. 464 2.57
As 0.4 0.4 0.4 0.4 0.4 0.4 0,4 0.40 0,000 0.00 6,0 6.2 6.2 6.4 7,0 6.2 6.0 6.29 0,344 5.47
14 13 14 12 14 14 14 13.57 0.787 5.80 26 26 28 24 26 28 26 26.29 1.380 5.25 37 36 34 36 37 36 34 35.71 1.254 3.51 43 42 40 42 44 42 32 42.29 1.254 2.96 48 48 50 50 52 50 50 49.71 1.380 2,78
for each sample were per formed over a 35-min tim(, period. S t a n d a r d dev ia t ions and a r i thmet ic means calcu- la ted f rom the presen ted da t a show a m a x i m u m va lue for selenium of ± 1 . 4 6 4 (mean 56.86 ug/ l iWr) and for arsenic ± 1 . 3 8 0 (mean 49.71 ug / l i t e r ) .
Tab le I I I presents the results acqui red f rom exper iments conduc ted to de te rmine the accuracy of the a u t o m a t e d
technique. Surface wa te r specimens of known selenium
and arsenic concent ra t ions (analyzed by the manua l
method) were " s p i k e d " wi th known al iquots of s t andard
solut ions prepared f rom SeO2 and As~O3. The table shows:
the original cat ion concen t ra t ion in the specimen, the
concen t ra t ion of the cat ion added, the to ta l cat ion concen-
t ra t ion, the ana ly t ica l da t a acqui red from the a u t o m a t e d
analysis of the spiked specimens, and the ca lcula ted per-
cent recovery for each specimen. The accuracy results show
a percent recovery range of 96 to 108 % for se lenium and
93 to 107 % for arsenic analysis.
TABLE I l I . R e c o v e r y of c a t i o n s a d d e d to s u r f a c e w a t e r s p e c i m e n s o f k n o w n c a t i o n c o n c e n t r a t i o n .
Prior Cone. Total Cone. Percent Cation analysis conc. found • recovery
(~g/liter)b (~g/liter) (~g/liter) (~g/liter) (%)
Se 0.4 10.0 10.4 10.6 102 3.0 10.0 13.0 14 108 5.0 20.0 25.0 25 100 7.0 10.0 17.0 17 100 8.0 20.0 28.0 27 96
13 20.0 33.0 34 103 16 20.0 36.0 36 100 18 20.0 38.0 39 103 22 10.0 32.0 33 103
As 0.6 10.0 10.6 10.6 100 4.0 10.0 14.0 13 93 4.0 20.0 24.0 25 104 6.0 20.0 26.0 25 96 9.0 20.0 29.0 28 96
10 20.0 30.0 32 107 13 20.0 33.0 33 100 18 10.0 28.0 28 100 24 10.0 34.0 33 97
Values represent the average of four analyses. b Analysis by manual method.
ACKNOWLEDGMENT
The authors would like to thank R. E. Isaacs for his support.
1. J. Y. Hwang, P. A. Ullucci, C. J. Mokeler, and S. B. Smith, Am. Lab. 5(3), 43 (1973).
2. R. C. Chu, G. P. Barron, and P. A. W. Baumgarner, Anal. Chem. 44, 1476 (1972).
3. P. D. Goulden and P. Brooksbank, Anal. Chem. 46, 1431 (1974). 4. K. Kan, Anal. Lctt. 6, 603 (1973). 5. P. W. West and T. V. Ramakrishna, Anal. Chem. 40, 966 (1968). 6. American Public Health Association, American Waterworks Associa-
tion, Water Pollution Control Federation, Standard Methods for the Examination of Water and Wastewater, M. J. Tarns, A. E. Greenberg, R. D. Hoak, and M. C. Rand, Eds. (American Public Health Associ- ation, Washington, D.C., 1971), 13th ed., Part 104A, p. 62.
Trace Element Determinations in a Low-Alloy Steel Reference Material by Isotope Dilution, Spark Source Mass Spectrometry*
P A U L J . P A U L S E N , R O B E R T A L V A R E Z , a n d C H A R L E S W. M U E L L E R
Inslilule for Malerials Research, National Bureau of Standards, Washington, D.C. 2 0 ~
Standard
A s t a b l e i s o t o p e d i l u t i o n p r o c e d u r e u s i n g t h e s p a r k s o u r c e m a s s s p e c t r o g r a p h w a s d e v e l o p e d for t h e s i m u l t a n e o u s d e -
Received 16 May 1975; revision received 10 September 1975. * Certain commercial materials and equipment are identified in
this paper in order to adequately specify the experimental pro- cedure. In no case does such identification imply recommenda- tion or endorsement by the National Bureau of Standards, nor does it imply that the material or equipment identified is neces- sarily the best available for the purpose.
t e r m i n a t i o n o f c e r i u m , c o p p e r , n e o d y m i u m , s e l e n i u m , s i l - ver , t e l l u r i u m , a n d z i r c o n i u m in a l o w - a l l o y s t e e l m a t e r i a l . E x c e p t for c o p p e r , t h e e l e m e n t s w e r e p r e s e n t at t r a c e c o n - c e n t r a t i o n s t h a t are d i f f i cu l t to d e t e r m i n e by m o s t a n a l y t i - ca l m e t h o d s . In t h e p r o c e d u r e , k n o w n a m o u n t s o f t h e i s o - t o p i c a l l y e n r i c h e d e l e m e n t s w e r e a d d e d to 1O0-mg s a m p l e s ,
w h i c h w e r e d i s s o l v e d in p e r c h l o r i c a n d h y d r o f l u o r i c a c i d s . Af t er e v a p o r a t i o n o f t h e s o l u t i o n s a | m o s t to d r y n e s s , d i s - s o l u t i o n of t h e r e s i d u e s , a n d a d d i t i o n o f h y d r o f l u o r i c ac id
42 VoJume 30, Number 1, 1976 APPLIED SPECTROSCOPY

to c o m p l e x t h e i ron , t h e r e s u l t i n g s o l u t i o n s were e l e c t r o - l y z e d i n p o l y t e t r a f l u o r o e t h y l e n e c e l l s . T h e e l e c t r o d e p o s i t o n h i g h p u r i t y , go ld c a t h o d e wires w a s s p a r k e d i n t h e m a s s s p e c t r o g r a p h a n d t h e i s o t o p e r a t i o s o f t h e i s o t o p i c a l l y e q u i l i b r a t e d e l e m e n t s w e r e m e a s u r e d . T h e c o n c e n t r a t i o n s , r a n g i n g f r o m 0.041~o for c o p p e r to 3.1 ~g/g (ppm) for n e o - d y m i n m , w e r e c a l c u l a t e d f r o m t h e g e n e r a l i s o t o p e d i l u t i o n e q u a t i o n . T h e l o w - a l l o y s t e e l is a v a i l a b l e f r o m N BS as S t a n d a r d R e f e r e n c e M a t e r i a l 1261. Index Headings: A n a l y s i s , for t r a c e e l e m e n t s ; M a s s spec- troscopy, s p a r k s o u r c e ; M e t h o d s , a n a l y t i c a l .
INTRODUCTION
A set of low-alloy steel Standard Reference Materials (SRMs) was issued by the National Bureau of Standards in 1957 primarily for use in optical emission and x-ray spectrometric methods of analysis. At that time, several trace elements present in this set were not certified either because they were at extremely low concentrations or be- cause they were generally regarded as having an innocuous effect on the physical properties of steel. Consequently, the anticipated benefits of providing certified values for these elements would not have justified the cost of de- veloping analytical methods having the requisite relia- bility.
Since this set of SRMs was issued, new applications of ferrous products, mainly for the nuclear and aerospace industries, have necessitated more stringent specification limits and quality control determinations of additional trace elements. Coinciding with an increased interest in the effects of trace elements on the properties of ferrous materials has been the increased use of spark source mass spectrometry as a powerful tool for estimating the con- centration of nearly every element in a sample down to a few nanograms per gram (parts per billion). However for reliable quantitative determinations, SRMs were needed having certified values for the trace elements of interest and having concentrations of the major constituents, simi- lar to those of the samples being analyzed.
A new set of iron and low-alloy steel SRMs was made in the late 1960's to replace the earlier set. The SRMs were fabricated in the form of rods, 3.2 mm in diameter by 51 mm long, for spark source mass spectrometry and micro- chemical techniques as well as in the form of 32-ram diam- eter discs for x-ray and optical emission spectrometry. This replacement set was intended to provide concentra- tion ranges for approximately 40 elements.
Certification of the trace elements in these materials required sensitive and reliable methods. Moreover, for the efficient characterization of these materials with respect to trace elements, analytical methods that would yield results for a number of elements simultaneously were de- sirable. Isotope dilution procedures using the spark source mass spectrograph (ID-SSMS) has been found to meet these requirements. ~-8
The object of this investigation was to develop an ID- SSMS method for determining a number of analytically difficult trace elements such as selenium, tellurium, and neodymium in a low-alloy steel material SRM. In a previ- ous application of an ID-SSMS method to a ferrous ma- terial, copper, molybdenum, nickel, and silver had been
determined in an ingot iron, SRM 1165. 3 Although the low-alloy steel material was a more complex matrix than the ingot iron, a relatively simple ID-SSMS procedure was developed which enabled a number of chemically diverse elements to be determined simultaneously.
I. EXPERIMENTAL
A. Reagents and Special Solutions. Dei0nized water was prepared by passing distilled water from the labora- tory distribution system through a mixed-bed, resin col- umn. Commercially produced, high purity, perchlorie and hydrofluoric acids were used for sample dissolution; similar high purity sulfuric, nitric, and hydrochloric acids were used for preparing solutions of the enriched isotope ma- terials (spikes) and natural elements. The purity of the perchloric, nitric, and hydrochloric acids had been evalu- ated previously by an ID-SSMS procedure developed by the authors.* Materials, isotopically enriched with respect to 14GNd, 142Ce, 125Te, t°9Ag, 9tZr, s2Se, and 6~Cu, were ob- tained from the Oak Ridge National Laboratory. The isotopic abundance, which was the highest available at the time of purchase, was at least 89 atomic percent. Each spike solution was prepared to contain 1 mg/ml of the element by weighing the spike material to ±0.02 rag, dis- solving it in the appropriate acid, and diluting the solution to volume in a 10-ml volumetric flask. A standard solution of each natural element under investigation was prepared by weighing 100 mg of the high purity metal to ±0.05 mg, dissolving it in the appropriate acid, and diluting the solution to volume in a 100-ml volumetric flask. For cerium and neodymium, the equivalent weight of oxide WaS used .
B. Evaporator for the Sample Solution. The evap- orator is similar in function and design to the borosilicate glass unit previously described 1,~ except that the principal components are constructed of polytetrafluoroethylene (TFE) and translucent fluorinated copolymer (TFE- FEP). The 14.5-cm diameter TFE base is 13 mm thick and has four cylindrical cavities into which 30-ml TFE- FEP beakers fit snugly. The 10-ram deep cavities are 90 ° apart with centers on a 3.5-cm diameter radius. A 12.5-cm diameter by 9.0-cm high cover of TFE-FEP fits tightly into a cylindrical groove in the base. Near the top of the cover are two 8-ram diameter TFE tubes, which are press-fit into holes approximately 180 ° apart. Filtered air enters the apparatus through one of the tubes to remove the acid vapors and prevent entry of particulate con- taminants.
C. Electrolysis Cell. The TFE electrolysis cell consists of two parts: a cylindrical body and a base. The cell body has a 33-mm height, a 17-ram inside diameter, and a 3-ram wall thickness. The base makes a liquid-tight fit into the cell body and has four holes, 90 ° apart, on a 12-mm diam- eter circle. The holes are drilled undersize for inserting 0.9-mm diameter high purity gold wire electrodes. The gold wire had been examined by direct sparking in the mass spectrograph for the presence of impurities that could affect the measurements. None were found. The overall purity was determined to be comparable to that of the high purity gold, SRM 685. 6 The ends of the four wires are dipped in aqua regia, rinsed in water, and ad-
APPLIED SPECTROSCOPY 43

justed to project approximately 2 mm into the cavity of the assembled cell. Two opposite wires serve as the cathode; the other two as the anode. During electrodeposi- tion, the solutions in the cells are stirred with TFE stirrers at approximately 200 rpm. The cells are housed in a plastic enclosure under a slight positive pressure of nitrogen to minimize airborne contamination.
D. Mass Spectrograph. A double-focusing, Mattauch- Herzog design, spark source instrument (Consolidated Electrodynamics model 21-110) that had been modified to give 22 exposures per plate is operated at an ion accelera- tor voltage of 24 kV. The ion-source sample chamber is evacuated with a high-speed, high-conductance ion pump having added titanium sublimation. A pressure of 7 X 10 -5 Pa (5 X 10 -7 Torr) can be obtained in approximately 20 min after loading a sample into the chamber. Less than 60 min is required to attain a pressure in the range of 10 -6 Pa (10 -s Torr). The pressure is measured using an ion gauge mounted directly in the ion source chamber. The chamber containing a sample from the isotope dilution procedure is evacuated to a pressure of less than 1 X 10 -5 Pa (1 X 10 -7 Torr) before sparking. The high conductance and speed of the pumping system maintains pressures in the 10 -5 Pa (10 -7 Torr) range during sparking even when relatively large amounts of gas are being released.
E. Mierophotometer-Analog Computer, A micro- photometer having a precision screw (Jarrell Ash model 23-500) and equipped with an analog computer to measure peak areas 7 is used. A function generator, which is the basic component of the analog computer, provides an output proportional to relative intensities when the input is a voltage proportional to percent absorption. An in- tegrator follows the function generator to give signals pro- portional to peak intensity areas as the line is scanned.
F. Procedure. A preliminary analysis of the steel sam- ple was performed during the initial development of the isotope dilution procedure. The elemental concentrations determined were used to calculate the amount of spike isotope necessary to obtain an optimum altered isotopic ratio, which for the elements of interest except silver is 1. An altered isotopic ratio of approximately unity is desira- ble because it will minimize the effects of any errors in the calibration curve for the photographic plate and will usually yield the maximum number of measurable isotopic ratios. Silver, which has a natural isotopic ratio of ap- proximately one, was spiked to yield an altered isotopic ratio of 2.
In the final procedure, a 100-mg sample was weighed to 10.1 mg and transferred to a 30-ml TFE-FEP beaker. The beaker was covered with a TFE lid. Aliquots of spike solutions having compatible ions were combined and di- luted in volumetric flasks. Immediately after preparing these solutions, 2 ml of 6 M HCI04 and 0.5 ml of 26 M HF were added to the sample. While the sample was dis- solving, known volumes of the spike solutions were added using calibrated plastic pipets. At the same time, aliquots of the spike solutions were mixed with solutions containing known amounts of the natural elements for future verifi- cation of the spike concentrations.
The beaker was then heated to completely dissolve the sample, transferred to the evaporator, and heated further
until HC104 fumes were observed. After adding 0.5 ml of 26 M HF, the contents of the beaker were heated al- most to dryness. The residue was dissolved and the iron was complexed by adding 2 ml of H20 and 0.5 ml of 26 M HF, and heating the beaker. The solution was then elec- trolyzed for 4 h at a constant current of 6 mA while being stirred at 200 rpm. The solution was withdrawn and the electrodes were rinsed in water.
The electrodeposit on the ends of the gold wire elec- trodes was sparked in the mass spectrograph and a graded series of exposures was made from 3 X 10 -13 to 1 X 10 -s C. The ion-sensitive photographic plates (Ilford Q-2) were processed using the bleach and internal image de- veloper MK-7 described by Cavard. s They were placed in the dichromate bleach for 4 min, rinsed in water for ~ min, developed for 7 min, fixed for 1 min, and washed for 15 min. For all elements except zirconium, intensity areas of both measured isotopes of an element were determined on each suitable exposure using the microphotometer-analog computer. Maximum peak intensities, corrected for back- ground, were measured for zirconium. The isotopic masses measured for each element are: Ag 107, 109; Ce 140, 142; Cu 63, 65; Nd 144, 145; Se 80, 82; Te 126, 125; and Zr 90, 91. The second mass listed for each element is the spike isotope; the first mass is usually the isotope of high- est abundance in the naturally occurring element.
In general, the ratios of the singly charged ions were measured, but ratios of the multiply charged ions were also measured when appropriate to obtain additional data or to avoid interferences existing at the singly charged lines.
The individual elemental concentrations were calculated from the measured altered isotopic ratios (R) using Eq. (1).
C = WK(A ,~ - B,pR) (1) M ( B R - A)
where C is the concentration in micrograms per gram, W is the weight of isotopically enriched material (spike) added in micrograms, M is the weight of sample in grams, A and B are the natural abundances of the analyte iso- topes a and b, Asp and Bop are the abundances of isotopes a and b in the spike, R is the measured altered ratio of isotope a to isotope b, and K is the ratio of the natural atomic weight to the atomic weight of the spike.
The spike concentrations in the solutions that had been added to the samples were verified by preconcentrating the isotopically equilibrated elements from the solution that had been reserved for this purpose, determining the isotopic ratios, and calculating W in Eq. (1). Two precon- centration procedures were used: electrolysis using the experimental procedure described for the sample, and evaporation of separate aliquots of the solution onto high purity gold wires after which the wires were ignited at 450°C for 30 min. The evaporation procedure enabled us to obtain data for elements that had not been electrode- posited satisfactorily.
The method blank was determined by performing all of the steps in the procedure using the same quantities of acids but smaller quantities of the spikes.
44 Volume 30, Number 1, 1976
II. D I S C U S S I O N A N D R E S U L T S
The graded series of exposures used in the analysis was selected to obtain the optimum sensitivity for elements at concentration levels down to 1 gg/g (ppm). Among other considerations, the selection of isotope lines and charge states was based on the required sensitivity and potential interferences. Some of the specific considerations for the determined elements are listed below.
1. Copper. Because of the high copper concentration, 0.041%, in the sample, the exposures produced Cu + lines, most of which were too dark to be measured reliably. Therefore, the Cu 2+ and Cu 4+ isotopic ratios were also measured to obtain an adequate number of ratios. For these charge states, both 63Cu and 65Cu isotopes occurred at fractional mass/charge positions, and therefore were free of interferences from -4-1 ions occupying unit mass positions in these m/e regions.
2. Selenium. Copper-containing samples normally yield lines at mass positions 79 and 81 corresponding to [CuO] +, and less intense lines at 80 and 82 corresponding to [CuOH] +. If [CuOH] + lines exist, they can interfere with the determination of the isotopic ratio, 82Se/S°Se, when the singly charged ions are used. This potential interference was indicated by faint lines of [CuO] + being present at mass positions 79 and 81. Because molecular species, such as [CuOH] + will not form stable multiply charged ions, the -4-3 charge states of the selenium isotopes were meas- ured to obtain the isotopic ratio. Consequently, these measurements, at fractional m/e positions, were also free of interferences by any molecular species. Concentrations calculated from the Se + and Se a+ isotopic ratios were in agreement, indicating that [CuOH] + did not in fact sig- nificantly interfere with the Se + measurements.
3. Zirconium. Each of the zirconium isotope lines had a faint line on the high mass side, which was at tr ibuted to hydrocarbons and could not be resolved when measuring the customary intensity areas. Because the contribution of the hydrocarbon line to the center of each Zr isotope line was essentially zero, the maximum peak intensity, corrected for background, was measured for each isotope line. Measurements of maximum peak intensity are not as sensitive as those of intensity area. However, the elec- trodeposited Zr yielded a signal of sufficient intensity for satisfactory precision with either mode of measurement.
4. Silver. Both the +1 and + 2 ions were measured for
TABLE I. S e l e n i u m concentrat ion in sample 1, NBS-SRM 1261, low-al loy steel ca lculated from repl icate exposures.
Exposure s2Se intensity s°Se intensity Concentration in % No. area area by wt
6 713 825 0.003598 7 603 710 0.003682 8 387 470 0.003838 9 336 377 0.003455
10 378 479 0.004064 11 367 440 0.003772 12 333 402 0.003822
Average Relative standard deviation 95% confidence limits of the mean
0.00375 5.2% 0.00018
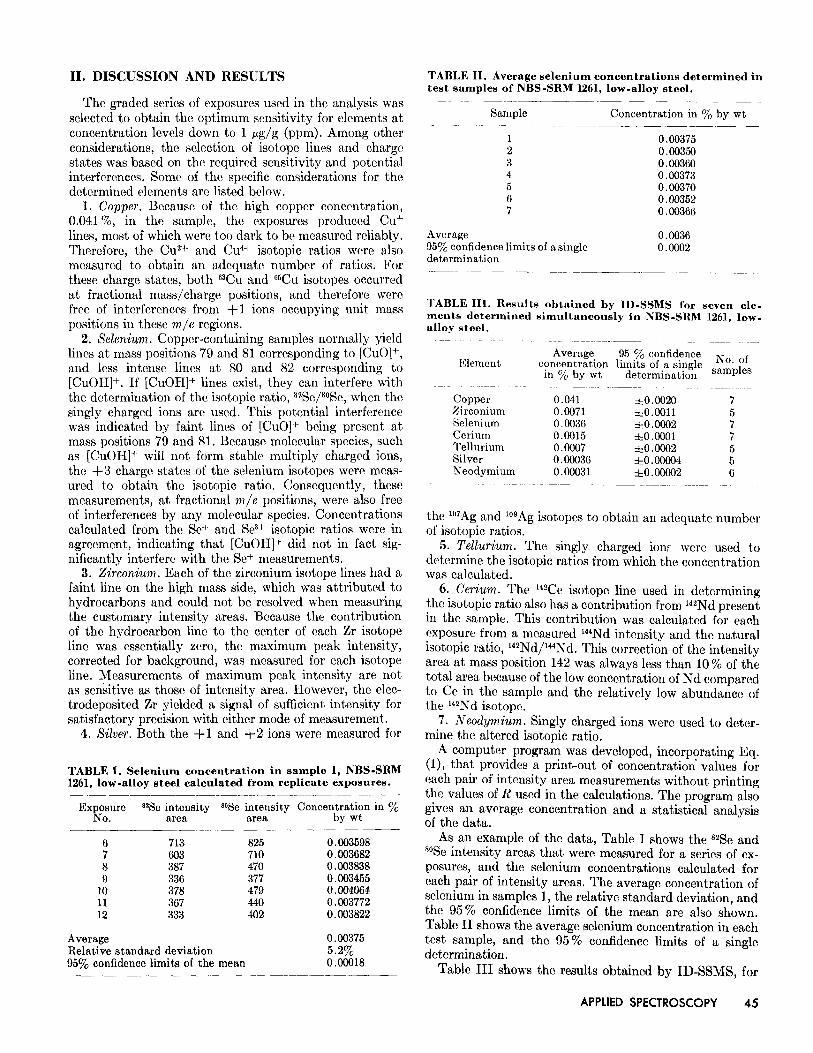
TABLE II. Average s e l e n i u m concentrat ions de termined in test samples o f NBS-SRM 1261, l ow.a l loy steel .
Sample Concentration in % by wt
1 0.00375 2 0.0O35O 3 0.00360 4 0.00373 5 0.00370 6 0. O0352 7 0.00366
Average 0.0036 95% confidence limits of a single 0.0002 determination
TABLE l I l . Resul ts obta ined by ID-SSMS for seven ele- m e n t s de termined s i m u l t a n e o u s l y in NBS-SRM 1261, low- al loy steel .
Average 95 % confidence Element concentration limits of a single No. of
in % by wt determination samples
Copper 0.041 ~0.0020 7 Zirconium 0.0071 ~0.0011 5 Selenium 0.0036 ::t: 0.0002 7 Cerium 0.0015 =t=O .0O01 7 Tellurium 0.0007 ::t=0.0002 5 Silver 0.00036 ::t=0.00004 5 Neodymium 0.00031 ::t=0.00002 6
the 1°TAg and 1°gAg isotopes to obtain an adequate number of isotopic ratios.
5. Tellurium. The singly charged ionr were used to determine the isotopic ratios from which the concentration was calculated.
6. Cerium. The 142Ce isotope line used in determining the isotopic ratio also has a contribution from 142Nd present in the sample. This contribution was calculated for each exposure from a measured raNd intensity and the natural isotopic ratio, ~42Nd/144Nd. This correction of the intensity area at mass position 142 was always less than 10 % of the total area because of the low concentration of Nd compared to Ce in the sample and the relatively low abundance of the l~2Nd isotope.
7. Neodymium. Singly charged ions were used to deter- mine the altered isotopic ratio.
A computer program was developed, incorporating Eq. (1), that provides a print-out of concentration' values for each pair of intensity area measurements without printing the values of R used in the calculations. The program also gives an average concentration and a statistical analysis of the data.
As an example of the data, Table I shows the 82Se and 8°Se intensity areas that were measured for a series of ex- posures, and the selenium concentrations calculated for each pair of intensity areas. The average concentration of selenium in samples 1, the relative standard deviation, and the 95 % confidence limits of the mean are also shown. Table II shows the average selenium concentration in each test sample, and the 95% confidence limits of a single determination.
Table I I I shows the results obtained by ID-SSMS, for
APPLIED SPECTROSCOPY 45

TABLE IV. Compar i s ion of resu l t s by ID-SSMS w i t h o t h e r m e t h o d s o f a n a l y s i s for NBS-SRM 1261, low-al loy s t ee l .
Average con- Element centration Analytical method
in % by wt
Copper 0.041 ID-SSMS 0.043 Neutron activation 0.042 Isotope dilution, thermal ion-
source mass spectrometry 0.041 Spectrophotometry
Zirconium 0.0071 ID-SSMS 0.009 Gravimetry 0.008 Spectrophotometry
Selenium 0.0036 ID-SSMS 0.003 Neutron activation
Cerium 0.0015 ID-SSMS 0.001 Spectrophotometry 0.0014 Isotope dilution, thermal ion-
source mass spectrometry Tellurium 0.0007 ID-SSMS
0.0005 Polarography Silver 0.00036 ID-SSMS
0.00040 Atomic absorption Neodymium 0.00031 ID-SSMS
0.00028 Isotope dilution, thermal ion- source mass spectrometry
seven e lements in N B S - S R M 1261, low-al loy steel. The tab le lists the average concen t ra t ions of the e lements in pe rcen tage b y weight , the 95 % confidence l imi ts of a single de t e rmina t ion , and the n u m b e r of samples for which re- sul ts were ob ta ined . The exper imen ta l condi t ions used for the first two samples d id no t p r econcen t r a t e all of the e lements sa t i s fac tor i ly , b u t the final condi t ions descr ibed under " P r o c e d u r e " y ie lded all of the ana ly t e s for simul- t aneous d e t e r m i n a t i o n of the seven elements .
Tab le IV shows a compar i son of the resul ts ob ta ined b y
I D - S S M S wi th o ther me thods of analysis . Cons ider ing the difficulties in de te rmin ing most of these t race elements , the ag reemen t of resul ts is considered sa t i s fac tory . M o s t o ther me thods are specific for a single e lement and of ten involve compl i ca t ed chemical separa t ions and manipu la t ions .
I I I . C O N C L U S I O N S
The m a j o r sources of error in t race e lement de te rmina - t ions are usua l ly losses of the e lements and adven t i t i ous con tamina t ion , the b lank . The use of i sotope d i lu t ion in the p rocedure t h a t was deve loped minimizes errors due to t race e lement losses. The t race e lements are b rough t to equ i l ib r ium wi th the spikes a t an ear ly s tage of the pro- cedure, af ter which the concen t ra t ions ob t a ined are inde- penden t of losses. A l though the b l ank is no t considered a p rob lem in the de t e rmina t i on of these elements , smal l quan t i t i e s of reagents and few hand l ing opera t ions ensure t h a t the b l ank does no t con t r ibu te s igni f icant ly to the me thod error.
1. R. Alvarez, P. J. Paulsen, and D. E. Kelleher, Anal. Chem. 41, 955 (1969).
2. P. J. Paulsen, R. Alvarez, and D. E. Kelleher, Spectrochim. Acta 24B, 535 (1969).
3. P. J. Paulsen, R. Alvarez, and C. W. Mueller, Anal. Chem. 42, 673 (1970).
4. R. Alvarez, P. J. Paulsen, and C. W. Mueller, NBS Technical Note 542, 70, (1970).
5. R. E. Thiers, in Trace Analysis, John H. Yoe and H. J. Koch, Eds., (Wiley, New York, 1957), Chap. 24, p. 637.
6. Catalog of Standard Reference Materials, NBS Special Publ. 260, April 1973, Office of Standard Reference Materials, National Bureau of Standards, Washington, D.C. (available from U.S. Superintendent of Documents, U.S. Government Printing Office, Washington, D.C. 20402).
7. P. J. Paulsen and P. E. Branch, NBS Technical Note 401, (1966). 8. A. Cavard, in Advance in Mass Spectrometry, E. Kendrick, Ed., (The
Institute of Petroleum, London, 1968), pp. 419-429.
A1KL L Auger Profile Artifact at the Oxide-Metal Interface
J . S. S O L O M O N
University of Dayton Research Institute, 300 College Park Avenue, Dayton, Ohio 45469
The c h e m i c a l c o m b i n a t i o n effects on t h e A1KLL Auger N'(E) p e a k f rom t h e ox ide vs t h e m e t a l re su l t s in an a r t i f a c t in t h e profi le c o n t o u r reg ion r e p r e s e n t a t i v e o f t h e o x i d e - m e t a l i n t e r f a c e . T h e c a u s e o f t h e a r t i f a c t is r e la t ed to t h e n a t u r e of der iva t ive record ing of Auger s pec tra a n d t h e i n f l u e n c e of p e a k s h a p e c h a n g e s b e c a u s e of a chang ing chemica l en- v i ronment . The a r t i f a c t r e s u l t s in t h e m i s l e a d i n g i n t e r p r e - t a t i o n of a dep le t ion of A1 at t h e i n t e r f a c e . To avoid th i s p r o b l e m t h e N'(E) s p e c t r u m is i n t e g r a t e d and N(E) p e a k h e i g h t s are u s e d to c o n s t r u c t t h e profile.
Received 17 May 1975; revision received 4 September 1975.
I N T R O D U C T I O N
The conven t iona l de tec t ion t echn ique employed in Auger e lec t ron spec t roscopy (AES) is the phase-sens i t ive me thod which resul ts in the recording of the first der iva- t ive, N ' ( E ) , of the Auger energy d i s t r ibu t ion , N ( E ) . 1,2 Wi th in the las t few years app l i ca t ion of A E S has been ex tended to a va r i e t y of diversif ied fields. Coupl ing A E S wi th ion b e a m spu t te r ing , for example , has become an ex t r eme ly popu la r t echn ique to ob ta in e lementa l i n -dep th profile maps of near surface regions. Cons t ruc t i ng an in- d e p t h profile m a p is a r e la t ive ly easy t a sk using Auger
46 Volume 30, Number 1, 1976 APPLIED SPECTROSCOPY