Embed Size (px)
Citation preview

CERT Comité d'évaluation des ressources transfrontalières
TRAC Transboundary Resources Assessment Committee
Ce document est disponible sur l’Internet à : This document is available on the Internet at : http://www.mar.dfo-mpo.gc.ca/science/TRAC/trac.html
Document de réferénce 2014/xx Reference Document 2014/xx
Ne pas citer sans autorisation des auteurs
Not to be cited without permission of the authors
Update of Allocation Shares for Canada and the USA of the Transboundary Resources of Atlantic Cod, Haddock, and Yellowtail Flounder on Georges
Bank through Fishing Year 2015
W.E. Gross1, L. O’Brien2, H.H. Stone1, and L. Van Eeckhaute1
1Fisheries and Oceans Canada 531 Brandy Cove Road
St. Andrews, New Brunswick E5B 3L9 Canada
2NOAA/NMFS Northeast Fisheries Science Center
166 Water Street Woods Hole, Massachusetts 02543-1097
USA


i
ABSTRACT
The development of consistent management by Canada and the USA for the transboundary resources of Atlantic Cod, Haddock, and Yellowtail Flounder on Georges Bank led to a sharing allocation agreement. For Atlantic Cod and Haddock, the agreement is limited to the eastern Georges Bank management unit (Department of Fisheries and Oceans (DFO) Statistical Unit Areas 5Zj and 5Zm; United States of America (USA) Statistical Areas 551, 552, 561, and 562). The management unit for Yellowtail Flounder encompasses the entire Georges Bank east of the Great South Channel (DFO Statistical Unit Areas 5Zh, 5Zj, 5Zm, and 5Zn; USA Statistical Areas 522, 525, 551, 552, 561, and 562). Two principles are incorporated in the sharing formulae to account for both historical utilization, based on reported landings during 1967 through 1994, and temporal changes in resource distributions, determined from National Marine Fisheries Service (NMFS) and DFO survey results that are updated annually. From 2010 onward, utilization will account for 10% and distribution for 90% of the allocation. This report uses the 2013 DFO and NMFS survey results to update the calculation for the 2015 fishing year allocations. The resource distributions in 2013 were: 83% Canada, 17% USA for Atlantic Cod; 52% Canada, 48% USA for Haddock; and 33% Canada, 67% USA for Yellowtail Flounder. The 2015 fishing year allocations (calendar year for Canada; May 1, 2015, to April 30, 2016, for the USA), updated with the 2013 resource distributions, resulted in shares for Atlantic Cod of 81% Canada, 19% USA, for Haddock of 52% Canada, 48% USA, and for Yellowtail Flounder of 30% Canada, 70% USA.
RÉSUMÉ

1
Introduction
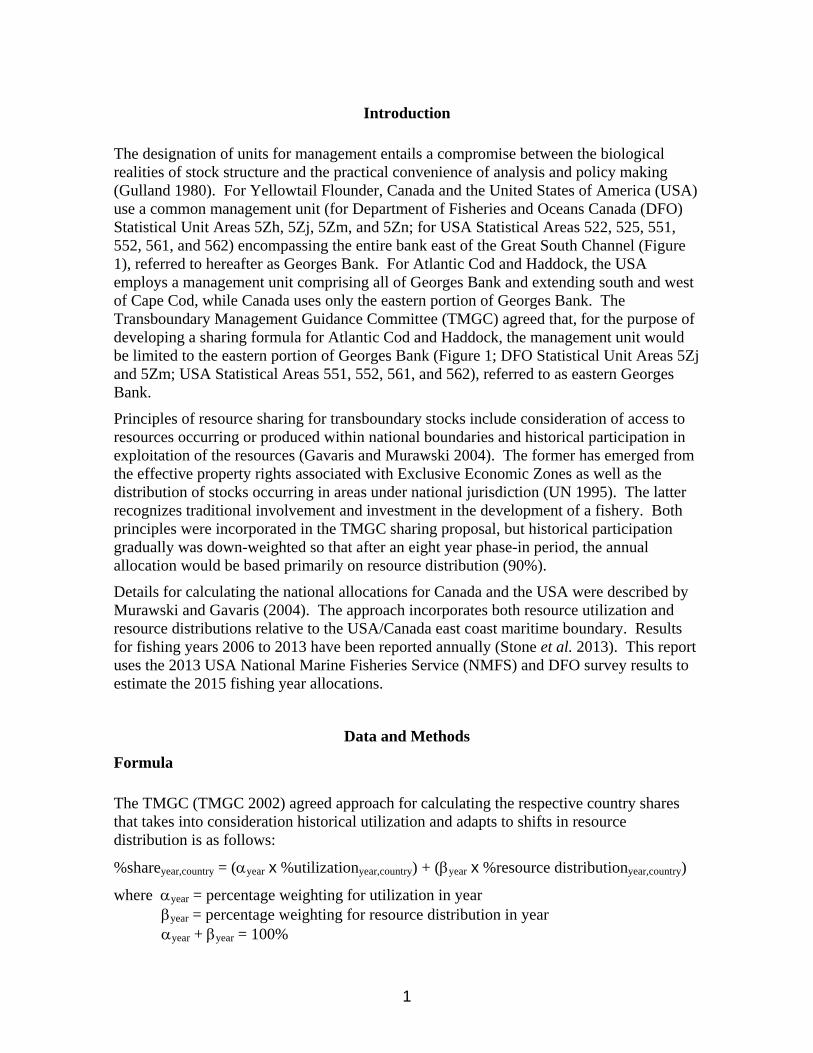
The designation of units for management entails a compromise between the biological realities of stock structure and the practical convenience of analysis and policy making (Gulland 1980). For Yellowtail Flounder, Canada and the United States of America (USA) use a common management unit (for Department of Fisheries and Oceans Canada (DFO) Statistical Unit Areas 5Zh, 5Zj, 5Zm, and 5Zn; for USA Statistical Areas 522, 525, 551, 552, 561, and 562) encompassing the entire bank east of the Great South Channel (Figure 1), referred to hereafter as Georges Bank. For Atlantic Cod and Haddock, the USA employs a management unit comprising all of Georges Bank and extending south and west of Cape Cod, while Canada uses only the eastern portion of Georges Bank. The Transboundary Management Guidance Committee (TMGC) agreed that, for the purpose of developing a sharing formula for Atlantic Cod and Haddock, the management unit would be limited to the eastern portion of Georges Bank (Figure 1; DFO Statistical Unit Areas 5Zj and 5Zm; USA Statistical Areas 551, 552, 561, and 562), referred to as eastern Georges Bank.
Principles of resource sharing for transboundary stocks include consideration of access to resources occurring or produced within national boundaries and historical participation in exploitation of the resources (Gavaris and Murawski 2004). The former has emerged from the effective property rights associated with Exclusive Economic Zones as well as the distribution of stocks occurring in areas under national jurisdiction (UN 1995). The latter recognizes traditional involvement and investment in the development of a fishery. Both principles were incorporated in the TMGC sharing proposal, but historical participation gradually was down-weighted so that after an eight year phase-in period, the annual allocation would be based primarily on resource distribution (90%).
Details for calculating the national allocations for Canada and the USA were described by Murawski and Gavaris (2004). The approach incorporates both resource utilization and resource distributions relative to the USA/Canada east coast maritime boundary. Results for fishing years 2006 to 2013 have been reported annually (Stone et al. 2013). This report uses the 2013 USA National Marine Fisheries Service (NMFS) and DFO survey results to estimate the 2015 fishing year allocations.
Data and Methods
Formula
The TMGC (TMGC 2002) agreed approach for calculating the respective country shares that takes into consideration historical utilization and adapts to shifts in resource distribution is as follows:
%shareyear,country = (year x %utilizationyear,country) + (year x %resource distributionyear,country)
where year = percentage weighting for utilization in year year = percentage weighting for resource distribution in year year + year = 100%
2
The initial sharing formula was based on the weighting of resource distribution from surveys by 60% and country utilization by 40%. Thereafter, the percentage weighting was changed in 5% annual increments until the weightings reached 90% resource distribution from surveys and 10% country utilization from landings. This agreement was implemented in 2003, with the end of the transition to a 90/10 weighting in the 2010 fishing year according to the following schedule:
Year 2003 2004 2005 2006 2007 2008 2009 2010 Weighting 60/40 60/40 65/35 70/30 75/25 80/20 85/15 90/10
Resource Utilization
Historical participation in exploitation of these resources was assessed for the three species using landings records (Table 1). The TMGC agreed to use the percentage of the total landings from 1967 to1994, inclusive, by country, as the measure of country utilization.
Resource Distribution
Resource distribution patterns were determined from three research vessel bottom trawl survey time series conducted by the NMFS and DFO. Surveys of Georges Bank have been conducted by NMFS each fall (October) since 1963 and each spring (April) since 1968, and by DFO since 1986 (February).
Before 2009, two vessels (the former National Oceanic and Atmospheric Administration (NOAA) ships Albatross IV and Delaware II) were used to conduct NMFS surveys and a trawl door change occurred in 1985. Vessel and door conversion factors, derived from comparative fishing experiments (Forrester et al. 1997), were applied to the survey results to make the series consistent. Additionally, two different trawl nets were used on the NMFS spring surveys, a modified Yankee 41 from 1973 to 1981 and a Yankee 36 in all other years, but no conversion factors are available.
Starting in 2009, NMFS surveys were conducted by the NOAA ship Henry B. Bigelow, using a different net (3-bridle, 4 seam) and revised protocols. Given that the allocation is based on proportions of biomass distribution within a survey, the use of biomass-based conversion coefficients is not necessary, i.e. proportions would not change if survey indices were calibrated by a constant. As the conversion coefficients are length based, differences in fishing power between the vessels could potentially affect biomass estimates if there were large disparities in length composition on each side of the Hague Line. However, when length frequencies from the two jurisdictions were compared for the 2009 surveys, the differences were minor and application of a length-weight relationship to the length frequencies produced negligible differences in biomass.
The Canadian Coast Guard Ship (CCGS) Alfred Needler is the standard vessel used for the DFO Georges Bank survey, but, due to unavailability of the Alfred Needler, the CCGS Wilfred Templeman, a sister ship to the Alfred Needler, has been used in several years;

3
1993, 2004, 2007, and 2008. No conversion factors are available for the Wilfred Templeman. However, this vessel is considered to be similar in fishing strength to the Alfred Needler.
Swept area biomass, considered a relative index of abundance, was computed for each stratum and apportioned to USA and Canadian sectors in each year (see Figure 2 for strata and “strata sections” on each side of the international boundary, and Table 2 for their areas). DFO survey sampling strata were revised in 1987 to incorporate the international boundary. Thus, only results since 1987 have been used for this survey. Since the survey designs are based on randomization within strata, the data were post-stratified to USA and Canadian zones within the existing survey strata. Strata used for Atlantic Cod and Haddock also were divided by the management unit boundary.
Estimates of biomass indices were calculated for entire strata and for strata sections unless no observations occurred within a stratum (Tables 3 to 11). On the few occasions where no observations were available in a stratum section, density and distribution patterns from adjacent areas and years were used as substitute values. The magnitude of these derived values was generally small and did not influence results unduly. When such values are combined over surveys, they have only a minor effect on the annual aggregate biomass index estimates within the transboundary management units. The swept area biomasses for each groundfish species were summed individually to derive the biomass index on the USA and Canadian side for each management unit. Age and size specific distribution patterns were ignored while developing the biomass indices.
The biomass index estimate derived from each survey represents a synoptic snapshot of resource distribution at a specific time during a year. Combining the results of multiple surveys requires an understanding of seasonal movement patterns and how much of the biological year each survey represents. For Atlantic Cod, the DFO and the NMFS spring surveys in each year were averaged to characterize the distribution during the winter-spring period. This result was averaged with the NMFS fall distribution percentage, thereby giving equal weight to the winter-spring and summer-fall periods. Prior to initiation of the DFO survey in 1987, the NMFS spring survey was used alone to characterize the winter-spring period. For Haddock and Yellowtail Flounder, the results from all three surveys in each year were averaged to represent the annual distribution pattern. Prior to 1987, only the NMFS spring and fall surveys were averaged.
A robust locally weighted regression algorithm (Cleveland 1979), referred to as LOESS, was adopted for removing both unpredictable fluctuations and sampling variation from the survey observations. A 30% smoothing parameter was chosen as it reflected current trends, was responsive to changes, and provided the most appropriate results for contemporary resource sharing. The recommended default (Cleveland 1979) of two robustness iterations also was adopted. Resource distributions are updated annually by incorporating data from the latest surveys and dropping data from the earliest survey used in the previous year (2013 and 1980, respectively, in this case) so that a 33-year window is maintained. After the surveys were combined, the LOESS smoother was applied to the 1981 to 2013 survey data. The fixed resource utilization (10% weighting) and the 2013 resource distributions (90% weighting) were applied to the agreed sharing formula to determine national allocation shares of each of the three transboundary groundfish species for the fishing year two years beyond the latest survey data (2015).
4
Results
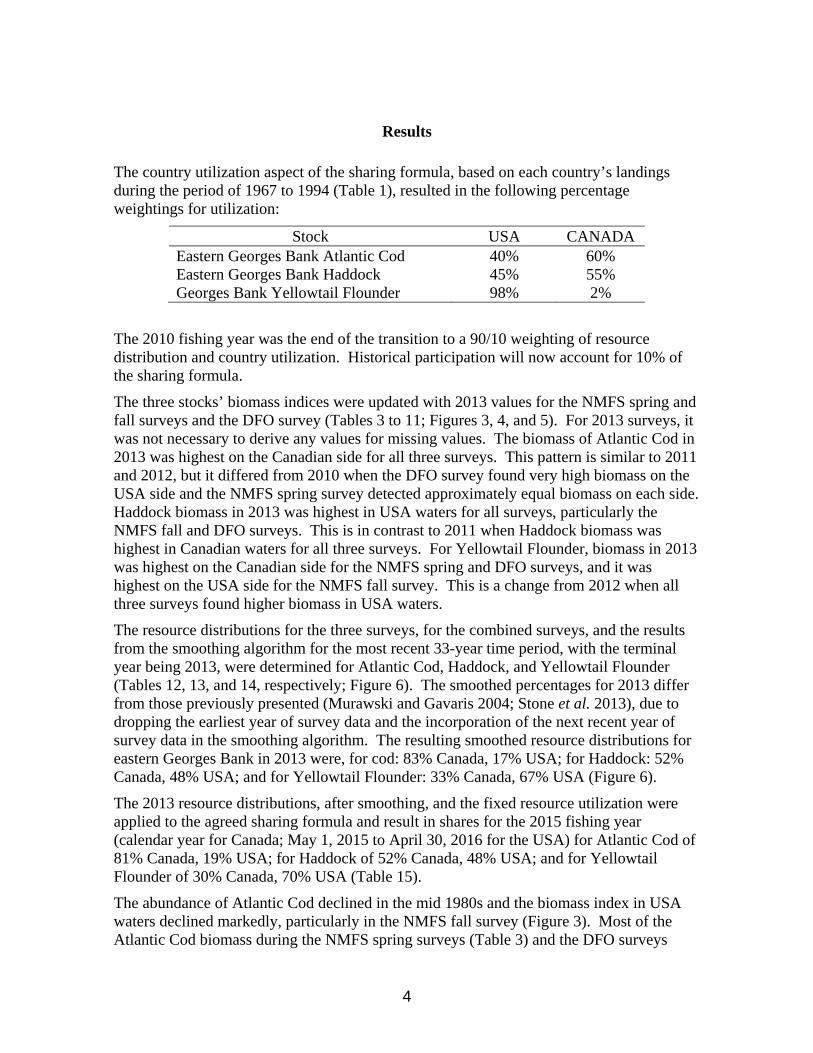
The country utilization aspect of the sharing formula, based on each country’s landings during the period of 1967 to 1994 (Table 1), resulted in the following percentage weightings for utilization:
Stock USA CANADA Eastern Georges Bank Atlantic Cod 40% 60% Eastern Georges Bank Haddock 45% 55% Georges Bank Yellowtail Flounder 98% 2%
The 2010 fishing year was the end of the transition to a 90/10 weighting of resource distribution and country utilization. Historical participation will now account for 10% of the sharing formula.
The three stocks’ biomass indices were updated with 2013 values for the NMFS spring and fall surveys and the DFO survey (Tables 3 to 11; Figures 3, 4, and 5). For 2013 surveys, it was not necessary to derive any values for missing values. The biomass of Atlantic Cod in 2013 was highest on the Canadian side for all three surveys. This pattern is similar to 2011 and 2012, but it differed from 2010 when the DFO survey found very high biomass on the USA side and the NMFS spring survey detected approximately equal biomass on each side. Haddock biomass in 2013 was highest in USA waters for all surveys, particularly the NMFS fall and DFO surveys. This is in contrast to 2011 when Haddock biomass was highest in Canadian waters for all three surveys. For Yellowtail Flounder, biomass in 2013 was highest on the Canadian side for the NMFS spring and DFO surveys, and it was highest on the USA side for the NMFS fall survey. This is a change from 2012 when all three surveys found higher biomass in USA waters.
The resource distributions for the three surveys, for the combined surveys, and the results from the smoothing algorithm for the most recent 33-year time period, with the terminal year being 2013, were determined for Atlantic Cod, Haddock, and Yellowtail Flounder (Tables 12, 13, and 14, respectively; Figure 6). The smoothed percentages for 2013 differ from those previously presented (Murawski and Gavaris 2004; Stone et al. 2013), due to dropping the earliest year of survey data and the incorporation of the next recent year of survey data in the smoothing algorithm. The resulting smoothed resource distributions for eastern Georges Bank in 2013 were, for cod: 83% Canada, 17% USA; for Haddock: 52% Canada, 48% USA; and for Yellowtail Flounder: 33% Canada, 67% USA (Figure 6).
The 2013 resource distributions, after smoothing, and the fixed resource utilization were applied to the agreed sharing formula and result in shares for the 2015 fishing year (calendar year for Canada; May 1, 2015 to April 30, 2016 for the USA) for Atlantic Cod of 81% Canada, 19% USA; for Haddock of 52% Canada, 48% USA; and for Yellowtail Flounder of 30% Canada, 70% USA (Table 15).
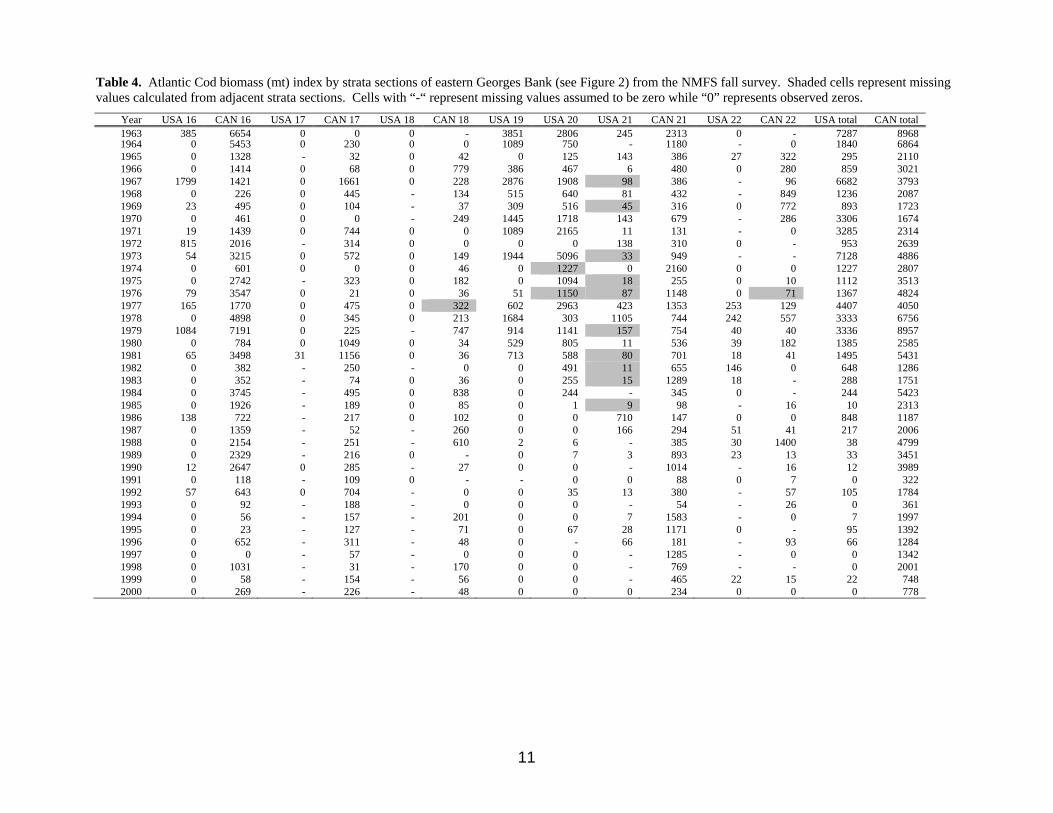
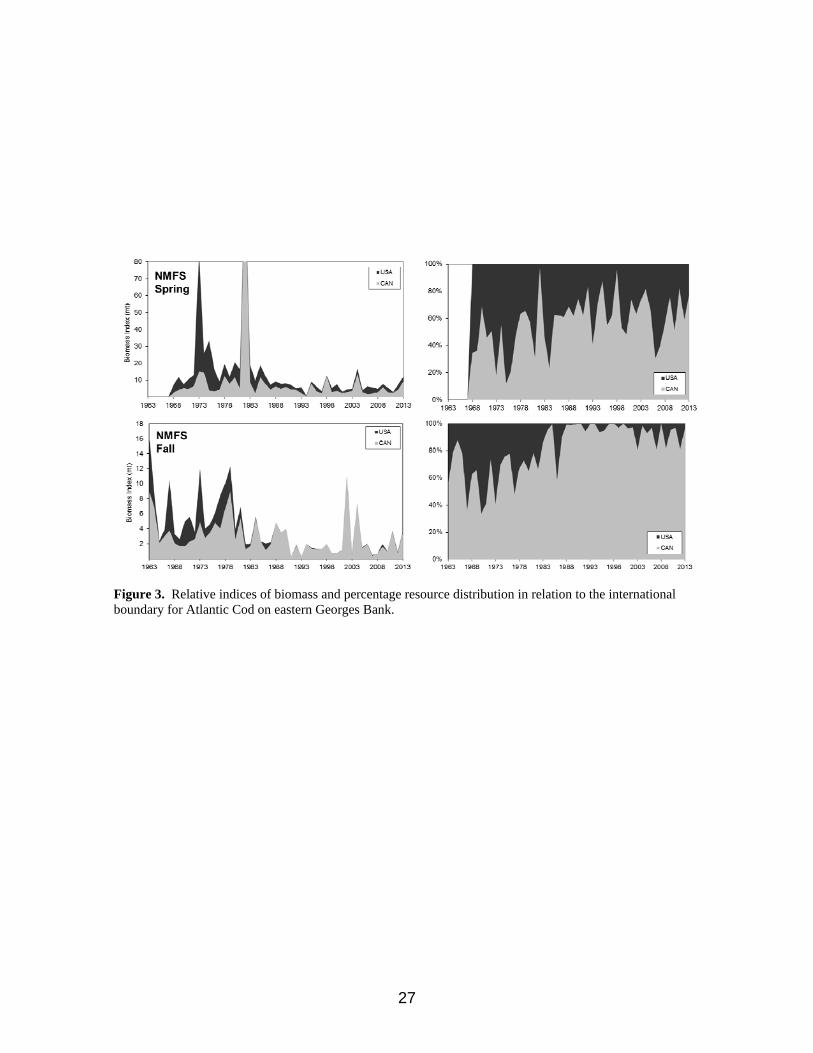
The abundance of Atlantic Cod declined in the mid 1980s and the biomass index in USA waters declined markedly, particularly in the NMFS fall survey (Figure 3). Most of the Atlantic Cod biomass during the NMFS spring surveys (Table 3) and the DFO surveys

5
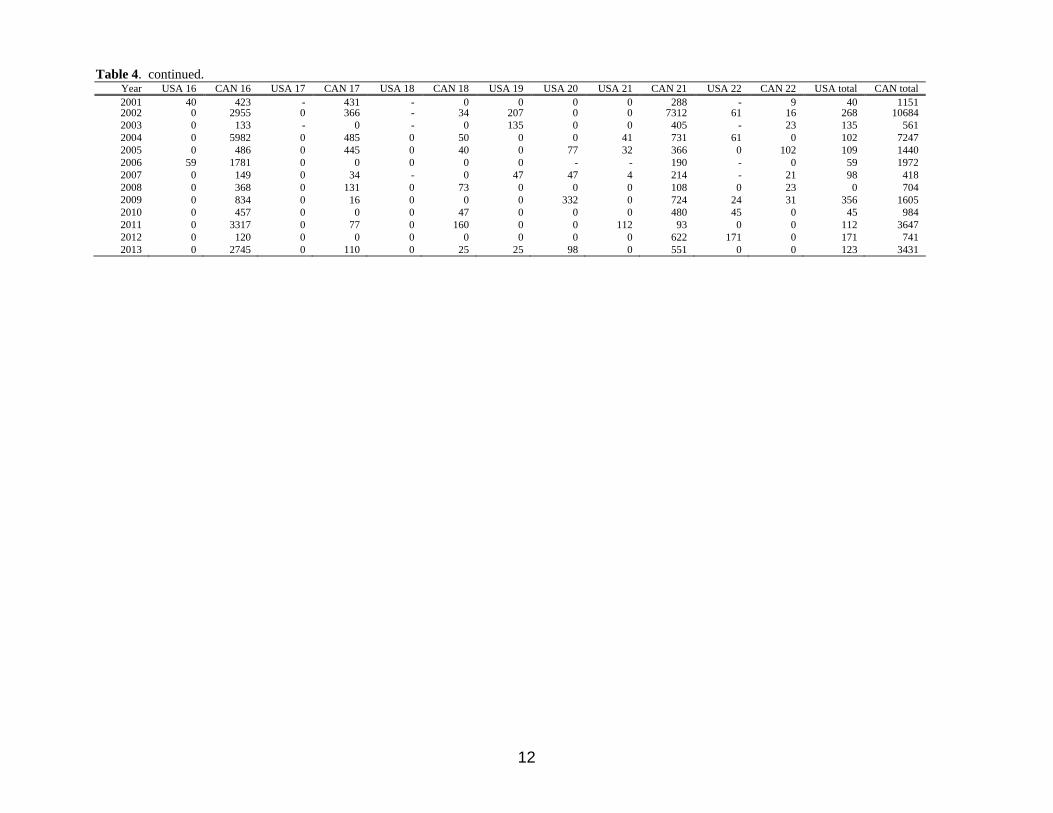
(Table 5) was located on the top of Georges Bank in shallower depths (in DFO survey stratum 5Z2 and NMFS survey strata 16, 19, and 20, although, 19 and 20 were more important in the 1970s and early 1980s and have now declined in importance). The deeper slope strata have always been more important for Atlantic Cod in the NMFS fall survey than in the spring surveys (Table 4), but, after the late 1980s, these strata (particularly the deeper water on the Canadian side of NMFS survey strata 21 and 17, with high variability for stratum 17) became even more important as biomass shifted away from the top of the Bank (shift is also evident for the 2013 DFO survey where much of the cod biomass is in stratum 5Z1). Exceptions occurred in the 2011 and 2013 NMFS fall surveys when most of the cod occurred in Canadian waters on top of the bank (stratum 16). The percentage of Atlantic Cod in Canadian waters during the NMFS spring and DFO surveys generally has been lower than the percentage during the NMFS fall surveys although there have been a few exceptions in recent years. This difference has become more pronounced since the mid 1980s (Table 12, Figure 3).
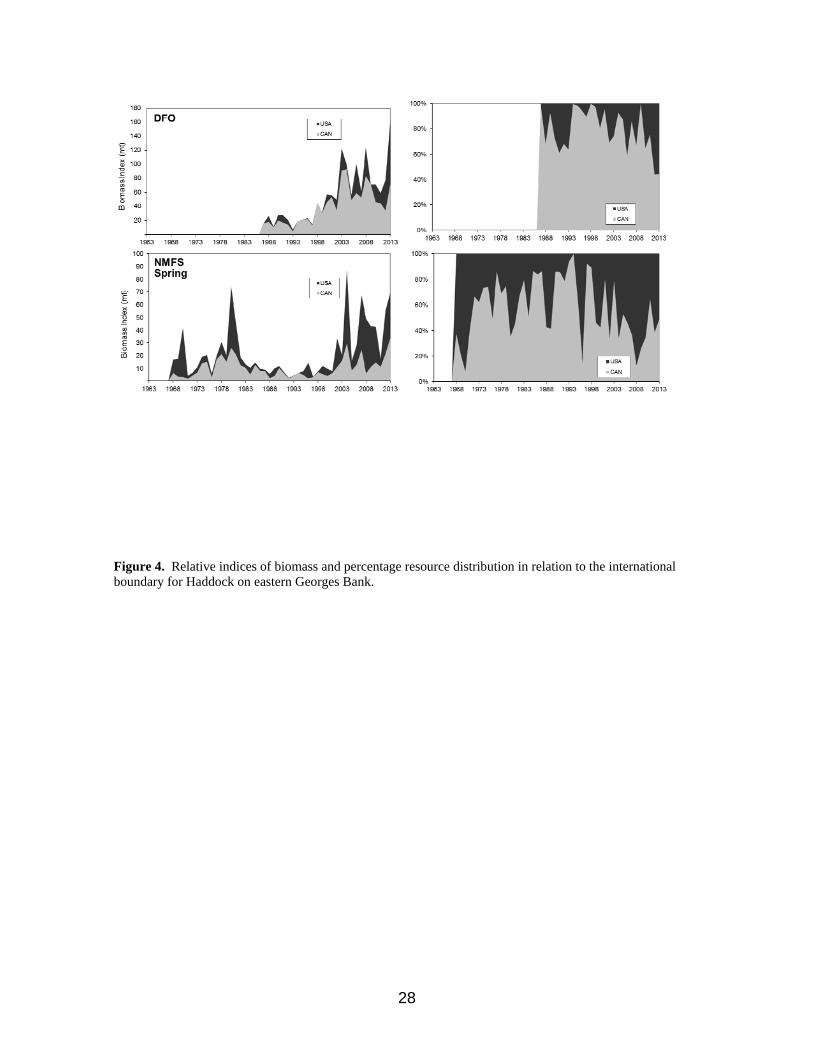
Haddock abundance is near historic highs. It peaked during the early 1960s and again in the late 1970s, increased during the late 1990s, and rose to very high levels in the 2000s (Figure 4). The biomass index in USA waters was exceptionally high during the 1960s, and, coincident with the increase in Haddock abundance in recent years, the percentage in USA waters in the NMFS surveys, especially in the spring, has increased. As with Atlantic Cod, Haddock biomass is concentrated on top of the Bank during both the NMFS spring and DFO surveys (Tables 6 and 8). However, in the 2013 there were also significant increases in biomass in the deeper strata, 19 and 5Z1 and 5Z3 for the NMFS spring and DFO surveys, respectively. Since the 1970s, Haddock biomass in the fall NMFS surveys has been concentrated in the deeper slope strata in Canadian waters. Stratum 19, entirely in USA waters, was important only in the early part of the fall series (Table 7). However, in 2013 it contained approximately 17% of the biomass estimate. The percentage of Haddock on each side of the Canada/USA boundary from the DFO survey is generally somewhat intermediate between the NMFS fall and NMFS spring survey results but reached 100% in Canadian waters in 2009 (Table 13, Figure 4). For the first time, the percentage of Haddock was higher in USA waters for the NMFS fall survey (70%, Table 13).
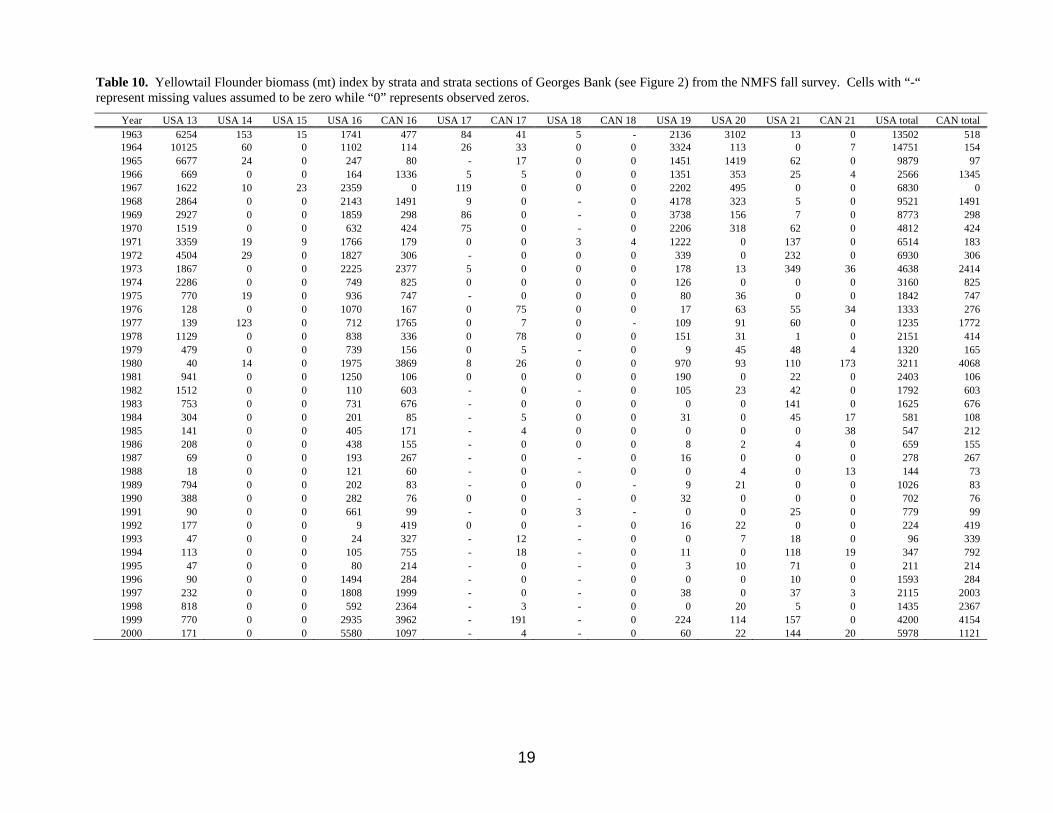
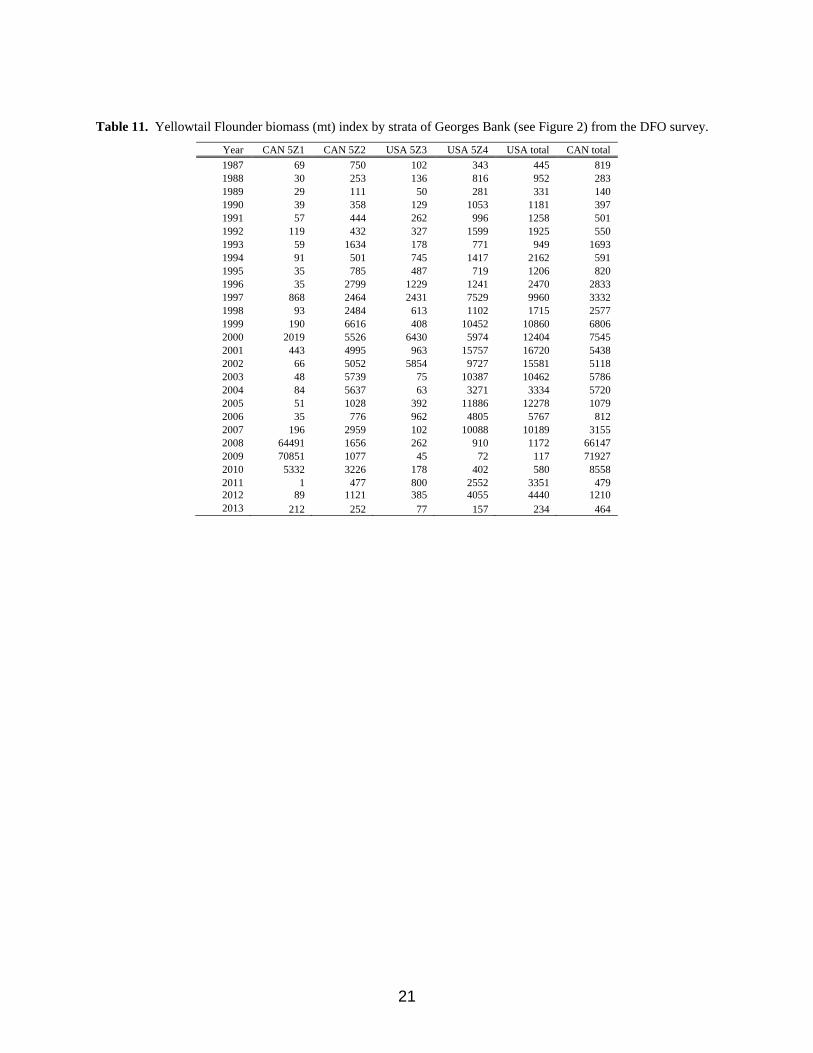
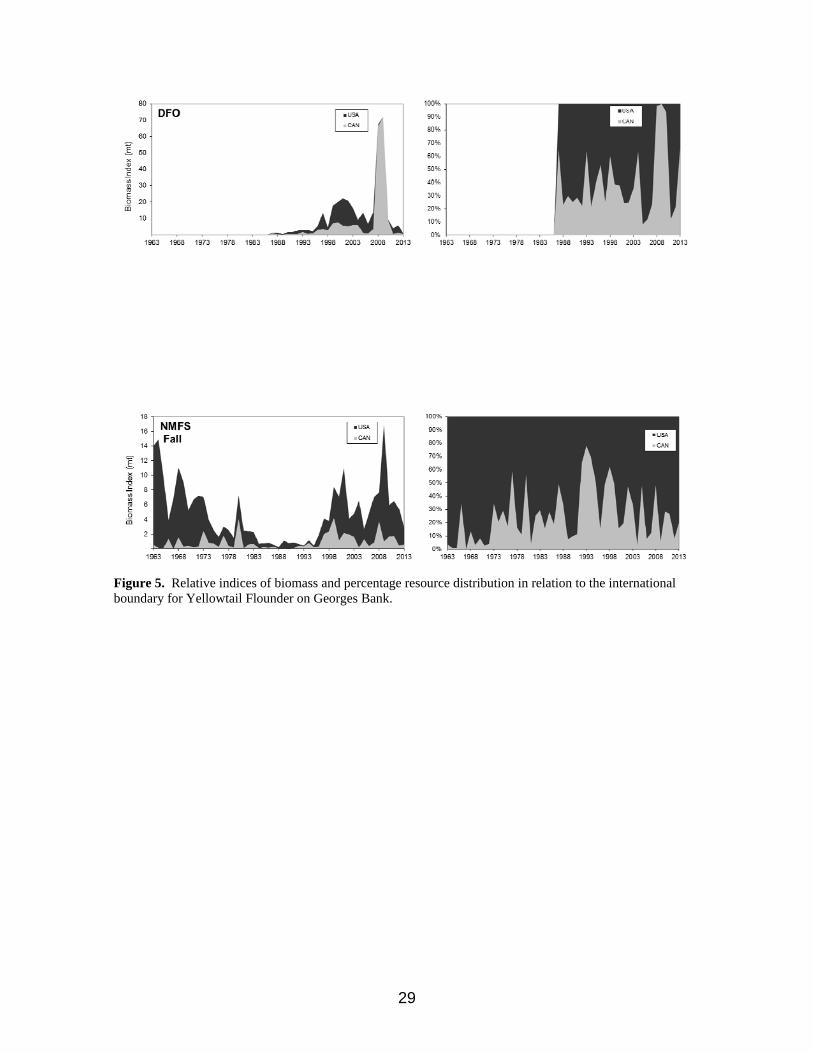
Yellowtail Flounder survey abundance is approaching historic lows. It was high in the 1960s, declined and remained low during the 1970s and 1980s, increased during the 1990s, declined again, and then increased to 1960’s levels in 2009 (Figure 5). The biomass index in USA waters was highest during the 1960s. In all three survey series (Tables 9 to 11), Yellowtail Flounder biomass has been highest on the southern flank of the Bank at the shallower depths in NMFS survey strata 13 and 16 and in DFO survey strata 5Z2 and 5Z4. NMFS survey stratum 19, a shallow depth stratum near the middle of the bank, was important during the 1960s only. A change in distribution occurred in 2008 and 2009, during the DFO survey, due to large catches in Canadian waters and the substantial decrease in catches on the USA side in those years. While the large yellowtail catches in 2008 and 2009 had an appreciable influence on the overall abundance index for the stock (Table 11, Figure 5), their impact on the estimated biomass distribution was less (Van Eeckhaute and O’Brien 2010). Averaging the 2008 and 2009 DFO surveys with the NMFS spring and fall surveys and subjecting the result to the smoothing algorithm produced no change in the Yellowtail Flounder allocation, whether the large tows were included or not. Such fluctuations have been observed in the past and the averaging/smoothing algorithm

6
appears to handle them adequately (Figure 6). In 2011 and 2012, the distribution of yellowtail from the DFO survey shifted from Canadian (strata 5Z1/5Z2) to USA waters (strata 5Z4), whereas in 2013 more biomass was detected in Canadian strata (Table 11).
The percentage of biomass of eastern Georges Bank cod in Canadian waters, as indicated by the combined smoothed results, progressively increased from about 60% in the late 1970s to approximately 80% in the late 1980s, fluctuated between 83% and 85% until 2003, declined to 77% in 2006, and then increased again to 87% in 2011 (Table 12, Figure 6). In 2013 the percentage in Canadian waters was 83%. The percentage of biomass of eastern Georges Bank Haddock in Canadian waters fluctuated around 80% from the late 1970s and 1980s to almost 90% in the mid 1990s, and, with the large increase in biomass, has subsequently declined to 53% in 2013 (Table 13, Figure 6). The percentage of Georges Bank Yellowtail Flounder biomass in Canadian waters was at a low of 18% in 1979, gradually increased through the 1980s and most of the 1990s to about 50%, declined to 35% in 2005/2006, and then increased to 63% in 2011 (Table 14, Figure 6). In 2012, the percentage of Yellowtail Flounder biomass in Canadian waters dropped sharply to 20%, and in 2013 it was 32%.
Discussion
Consistent fisheries management advice utilizing the allocation sharing arrangement was provided for the first time in the 2003 TMGC Guidance Document (TMGC 2003) for application to the 2004 fishing year quotas and subsequently in the 2004 to 2013 TMGC Guidance Documents for application to the 2005 to 2014 fishing year quotas, respectively (TMGC 2013). However, in 2009, due to the inability of TMGC to come to an agreement on the Yellowtail Flounder quota, the Yellowtail Flounder allocation sharing arrangement for 2010 was not adhered to. The enactment of the International Fisheries Agreement Clarification Act by the USA in January 2011, which allows the USA more flexibility in negotiating quotas in TMCG, should facilitate adherence to the sharing arrangement. It is recognized that the analyses are based on calendar year data but that the fishing year for USA fisheries starts May 1 and ends April 30. The fishing year for Canadian fisheries starts January 1 and ends December 31.
References
Cleveland, W.S. 1979. Robust locally weighted regression and smoothing scatterplots.
Journal of American Statistical Association 74:829-836. Forrester, J.R.S., C.J. Byrne, M.J. Fogarty, M.P. Sissenwine, and E.W. Bowman. 1997.
Background papers on USA vessel, trawl, and door conversion studies. SAW/SARC 24 Working Paper Gen 6. Northeast Fisheries Science Center, Woods Hole, MA.

7
Gavaris, S., and S.A. Murawski. 2004. The role and determination of residence proportions for fisheries resources across political boundaries: the Georges Bank example. pp. 261- 278. In: Payne, A.I.L., C.M. O’Brien, and S.I. Rogers [eds.]. Management of shared fish stocks. Blackwell. Oxford, UK.
Gulland, J.A. 1980. Some problems of the management of shared stocks. FAO Fish.
Tech. Pap. 206. Murawski, S.A., and S. Gavaris. 2004. Computation of allocation shares for Canada and
the USA of the transboundary resources of Atlantic Cod, Haddock and Yellowtail Flounder on Georges Bank. TRAC Ref. Doc. 2004/05: 25 p.
Stone, H.H., L. O’Brien, and L. Van Eeckhaute. 2013. Update of allocation shares for
Canada and the USA of the transboundary resources of Atlantic Cod, Haddock and Yellowtail Flounder on Georges Bank through fishing year 2014. TRAC Ref. Doc. 2013/xx: 26 p.
TMGC. 2002. Development of a sharing allocation proposal for transboundary resources
of cod, Haddock and Yellowtail Flounder on Georges Bank. DFO Maritimes Region, Fisheries Management Regional Report 2002/01: 59 p.
TMGC. 2003. Transboundary Management Guidance Document. Guidance Doc.
2003/01: 7 p. TMGC. 2013. Transboundary Management Guidance Document. Guidance Doc.
2013/01: 13 p. UN. 1995. United Nations conference on straddling fish stocks and highly migratory fish
stocks. Agreement for the implementation of the provisions of the United Nations Convention on the Law of the Sea of 10 December 1982 relating to the conservation and management of straddling fish stocks and highly migratory fish stocks. U.N. Doc. A/Conf./164/37.
Van Eeckhaute, L., and L. O’Brien. 2010. Update of allocation shares for Canada and the
USA of the transboundary resources of Atlantic Cod, Haddock and Yellowtail Flounder on Georges Bank through fishing year 2011. TRAC Ref. Doc. 2010/09: 25 p.

8
Table 1. Annual landings (mt) of Atlantic Cod, Haddock, and Yellowtail Flounder from the transboundary management units on Georges Bank.
Atlantic Cod Haddock Yellowtail Flounder Year Canada USA Total Canada USA Total Canada USA Total
1967 8188 3115 11303 12999 11999 24998 133 8407 8540 1968 9055 3244 12299 9195 7646 16841 122 12799 12921 1969 5876 3676 9552 3941 6621 10562 327 15944 16271 1970 2580 3211 5791 1970 3154 5124 70 15505 15575 1971 2950 4389 7339 1610 3533 5143 102 11878 11980 1972 2535 2708 5243 609 1551 2160 8 14157 14165 1973 3222 3064 6286 1565 1396 2961 12 15899 15911 1974 1370 3792 5162 462 955 1417 5 14607 14612 1975 1833 3108 4941 1353 1705 3058 8 13205 13213 1976 2320 2037 4357 1362 974 2336 11 11336 11347 1977 6156 4256 10412 2871 2428 5299 38 9444 9482 1978 8777 5502 14279 9968 4724 14692 56 4519 4575 1979 5979 6408 12387 5080 5212 10292 17 5475 5492 1980 8065 6418 14483 10017 5615 15632 81 6481 6562 1981 8498 8092 16590 5658 9075 14733 12 6182 6194 1982 17825 8565 26390 4872 6280 11152 18 10634 10652 1983 12131 8573 20704 3208 4453 7661 43 11350 11393 1984 5761 10551 16312 1463 5120 6583 4 5764 5768 1985 10442 6641 17083 3484 1684 5168 3 2477 2480 1986 8411 5697 14108 3415 2201 5616 27 3041 3068 1987 11844 4793 16637 4703 1418 6121 56 2743 2799 1988 12740 7645 20385 5941 1694 7635 47 1866 1913 1989 7895 6182 14077 3060 785 3845 32 1134 1166 1990 14364 6414 20778 3340 1188 4528 13 2751 2764 1991 13459 6353 19812 5423 931 6354 25 1784 1809 1992 11673 5080 16753 4090 1629 5719 15 2859 2874 1993 8524 4027 12551 3725 424 4149 675 2089 2764 1994 5278 1229 6507 2412 32 2444 2139 1589 3728 1995 1099 638 1737 2062 22 2084 470 410 880 1996 1921 757 2678 3666 35 3701 472 777 1249 1997 2919 551 3470 2749 47 2796 809 969 1778 1998 1893 828 2721 3362 311 3673 1175 1836 3011 1999 1818 1151 2969 3679 355 4034 1992 2066 4058 2000 1572 662 2234 5402 188 5590 2860 3678 6538
Total 1967-94
217751 144770 362521 117796 94427 212223 4099 215919 220018
Percentage 1967-94
60% 40% - 56% 45% - 2% 98% -

9
Table 2. Strata (or strata section) areas (in square nautical miles) used in the calculation of biomass indices. The designation ‘eGB’ denotes the eastern Georges Bank management unit used for cod and Haddock. The designation ‘~eGB’ denotes the portion of the stratum not in the eastern Georges Bank management unit.
DFO/NMFS
Strata Canada USA(eGB) USA(~eGB)
DFO 5Z1 795 0 0 5Z2 1252 0 0 5Z3 0 1504 791 5Z4 0 1350 1729
NMFS 13 0 0 2374 14 0 0 656 15 0 0 230 16 1553 1427 0 17 284 76 0 18 127 45 0 19 0 1059 1395 20 0 335 886 21 210 78 136 22 125 106 223

10
Table 3. Atlantic Cod biomass (mt) index by strata sections of eastern Georges Bank (see Figure 2) from the NMFS spring survey. Shaded cells represent missing values calculated from adjacent strata sections. Cells with “-“ represent missing values assumed to be zero while “0” represents observed zeros.
Year USA 16 CAN 16 USA 17 CAN 17 USA 18 CAN 18 USA 19 USA 20 USA 21 CAN 21 USA 22 CAN 22 USA total CAN total
1968 1543 2053 - 313 - 16 2762 0 335 70 0 - 4640 2451 1969 1876 4015 0 264 0 0 2413 2882 452 0 - 0 7623 4278 1970 948 4877 0 375 0 28 520 809 164 0 - 0 2441 5280 1971 3071 4267 0 258 0 0 2376 383 0 365 - 0 5830 4890 1972 1322 5875 0 69 0 0 3749 1378 68 669 - 32 6518 6645 1973 16082 13420 - 136 0 195 6119 47331 275 1004 405 279 70212 15035 1974 8700 13169 0 230 - 32 2681 260 92 872 0 68 11733 14370 1975 2515 3220 0 370 - 12 6365 20482 20 287 - 119 29382 4008 1976 2017 2302 - 567 - 5 4949 5985 81 527 0 - 13032 3402 1977 694 2118 0 218 0 0 2073 1872 227 2055 100 0 4966 4391 1978 3959 6849 25 627 0 9 2584 407 - 2262 155 2627 7129 12375 1979 2044 5988 0 405 - 94 436 751 711 1357 206 42 4148 7885 1980 6542 10355 83 460 - 123 995 981 152 655 112 212 8865 11805 1981 4839 1927 103 894 - - 2235 3654 489 821 72 1495 11391 5137 1982 476 123809 27 146 222 286 460 2591 - 483 196 993 3972 125717 1983 549 7246 246 784 0 93 0 8737 619 588 106 253 10258 8963 1984 1532 1527 78 239 0 0 793 4797 0 250 301 223 7500 2240 1985 1142 9618 29 57 0 159 2886 3032 - 1239 - 675 7088 11747 1986 1504 5622 103 45 0 13 2824 298 23 1712 - 425 4751 7817 1987 1430 3370 0 497 0 23 549 804 74 305 - 250 2856 4444 1988 1236 4560 0 334 - 42 1403 243 60 1229 0 269 2942 6432 1989 583 4630 0 33 - 9 1875 550 0 250 - 0 3008 4923 1990 1128 4693 0 519 - 146 475 449 57 108 - 603 2110 6068 1991 559 3512 - 178 - 157 1920 154 115 617 - 36 2748 4499 1992 0 2116 - 293 - 9 491 316 55 639 - 1240 862 4296 1993 749 695 - 1322 - 0 2229 472 - 134 - 229 3451 2380 1994 143 0 0 21 0 - 96 43 36 658 - 73 318 752 1995 350 7548 - 63 0 - 302 503 - 265 - 150 1154 8026 1996 1161 1545 - 221 - 0 1211 74 358 1653 0 0 2803 3419 1997 756 1561 11 107 0 28 471 0 116 176 - 343 1355 2214 1998 235 6238 0 187 - 72 0 - 110 5408 186 263 531 12168 1999 1053 2482 0 13 - 0 337 667 0 338 495 25 2552 2858 2000 1458 3281 0 11 0 - 967 1513 27 302 - 96 3965 3691 2001 191 1795 - 59 - 0 275 166 207 155 - 340 839 2349 2002 1341 2243 0 23 - 46 318 - 0 477 0 64 1659 2851 2003 478 3194 25 50 - 0 387 61 242 318 149 131 1342 3694 2004 309 2252 - 12 - 119 252 2462 119 11393 - 0 3142 13776 2005 1235 1599 0 266 0 - 0 64 - 697 121 151 1420 2713 2006 3162 511 0 457 - 0 524 277 509 1011 - 0 4472 1979 2007 2287 1759 15 128 0 0 398 237 452 260 - 82 3388 2229 2008 1488 1669 0 18 0 0 368 300 6 788 0 345 2162 2820 2009 1024 2673 7 0 0 100 535 47 256 3045 37 0 1906 5817 2010 541 1070 0 410 0 125 667 461 941 1010 94 198 2704 2813 2011 474 1573 0 133 0 74 56 0 0 460 0 196 530 2436 2012 1075 3504 6 182 0 0 646 1412 0 695 0 146 3139 4528 2013 701 1211 0 0 0 77 740 1312 0 7808 61 239 2814 9335
11
Table 4. Atlantic Cod biomass (mt) index by strata sections of eastern Georges Bank (see Figure 2) from the NMFS fall survey. Shaded cells represent missing values calculated from adjacent strata sections. Cells with “-“ represent missing values assumed to be zero while “0” represents observed zeros.
Year USA 16 CAN 16 USA 17 CAN 17 USA 18 CAN 18 USA 19 USA 20 USA 21 CAN 21 USA 22 CAN 22 USA total CAN total1963 385 6654 0 0 0 - 3851 2806 245 2313 0 - 7287 89681964 0 5453 0 230 0 0 1089 750 - 1180 - 0 1840 6864 1965 0 1328 - 32 0 42 0 125 143 386 27 322 295 2110 1966 0 1414 0 68 0 779 386 467 6 480 0 280 859 3021 1967 1799 1421 0 1661 0 228 2876 1908 98 386 - 96 6682 3793 1968 0 226 0 445 - 134 515 640 81 432 - 849 1236 2087 1969 23 495 0 104 - 37 309 516 45 316 0 772 893 1723 1970 0 461 0 0 - 249 1445 1718 143 679 - 286 3306 1674 1971 19 1439 0 744 0 0 1089 2165 11 131 - 0 3285 2314 1972 815 2016 - 314 0 0 0 0 138 310 0 - 953 2639 1973 54 3215 0 572 0 149 1944 5096 33 949 - - 7128 4886 1974 0 601 0 0 0 46 0 1227 0 2160 0 0 1227 2807 1975 0 2742 - 323 0 182 0 1094 18 255 0 10 1112 3513 1976 79 3547 0 21 0 36 51 1150 87 1148 0 71 1367 4824 1977 165 1770 0 475 0 322 602 2963 423 1353 253 129 4407 4050 1978 0 4898 0 345 0 213 1684 303 1105 744 242 557 3333 6756 1979 1084 7191 0 225 - 747 914 1141 157 754 40 40 3336 8957 1980 0 784 0 1049 0 34 529 805 11 536 39 182 1385 2585 1981 65 3498 31 1156 0 36 713 588 80 701 18 41 1495 5431 1982 0 382 - 250 - 0 0 491 11 655 146 0 648 1286 1983 0 352 - 74 0 36 0 255 15 1289 18 - 288 1751 1984 0 3745 - 495 0 838 0 244 - 345 0 - 244 5423 1985 0 1926 - 189 0 85 0 1 9 98 - 16 10 2313 1986 138 722 - 217 0 102 0 0 710 147 0 0 848 1187 1987 0 1359 - 52 - 260 0 0 166 294 51 41 217 2006 1988 0 2154 - 251 - 610 2 6 - 385 30 1400 38 4799 1989 0 2329 - 216 0 - 0 7 3 893 23 13 33 3451 1990 12 2647 0 285 - 27 0 0 - 1014 - 16 12 3989 1991 0 118 - 109 0 - - 0 0 88 0 7 0 322 1992 57 643 0 704 - 0 0 35 13 380 - 57 105 1784 1993 0 92 - 188 - 0 0 0 - 54 - 26 0 361 1994 0 56 - 157 - 201 0 0 7 1583 - 0 7 1997 1995 0 23 - 127 - 71 0 67 28 1171 0 - 95 1392 1996 0 652 - 311 - 48 0 - 66 181 - 93 66 1284 1997 0 0 - 57 - 0 0 0 - 1285 - 0 0 1342 1998 0 1031 - 31 - 170 0 0 - 769 - - 0 2001 1999 0 58 - 154 - 56 0 0 - 465 22 15 22 748 2000 0 269 - 226 - 48 0 0 0 234 0 0 0 778
12
Table 4. continued. Year USA 16 CAN 16 USA 17 CAN 17 USA 18 CAN 18 USA 19 USA 20 USA 21 CAN 21 USA 22 CAN 22 USA total CAN total2001 40 423 - 431 - 0 0 0 0 288 - 9 40 11512002 0 2955 0 366 - 34 207 0 0 7312 61 16 268 10684 2003 0 133 - 0 - 0 135 0 0 405 - 23 135 561 2004 0 5982 0 485 0 50 0 0 41 731 61 0 102 7247 2005 0 486 0 445 0 40 0 77 32 366 0 102 109 1440 2006 59 1781 0 0 0 0 0 - - 190 - 0 59 1972 2007 0 149 0 34 - 0 47 47 4 214 - 21 98 418 2008 0 368 0 131 0 73 0 0 0 108 0 23 0 704 2009 0 834 0 16 0 0 0 332 0 724 24 31 356 1605 2010 0 457 0 0 0 47 0 0 0 480 45 0 45 984 2011 0 3317 0 77 0 160 0 0 112 93 0 0 112 3647 2012 0 120 0 0 0 0 0 0 0 622 171 0 171 741 2013 0 2745 0 110 0 25 25 98 0 551 0 0 123 3431

13
Table 5. Atlantic Cod biomass (mt) index by strata and strata sections of eastern Georges Bank (see Figure 2) from the DFO survey.
Year CAN 5Z1 CAN 5Z2 USA 5Z3 USA 5Z4 USA total CAN total
1987 1555 5826 1345 98 1443 7381 1988 1894 12927 3856 775 4631 14821 1989 2040 8664 2766 1076 3842 10704 1990 1708 48900 4622 1435 6057 50608 1991 2204 17398 3820 1646 5467 19601 1992 2087 7602 4005 887 4892 9689 1993 719 9427 3875 2524 6399 10146 1994 817 11821 455 47 502 12638 1995 919 3277 3368 553 3921 4197 1996 1090 22489 3927 4667 8594 23579 1997 377 7336 2095 1196 3290 7714 1998 332 4091 551 32 583 4423 1999 211 6880 1206 880 2086 7092 2000 228 21947 9281 842 10123 22174 2001 1499 15563 257 718 975 17062 2002 2298 17043 309 683 992 19341 2003 720 3571 1130 797 1927 4291 2004 685 4248 699 29 728 4933 2005 1597 7306 192 17105 17298 8903 2006 127 8469 2652 1299 3951 8595 2007 836 8930 911 552 1462 9766 2008 5880 6603 327 848 1175 12483 2009 2195 20917 01 54 54 23113 2010 218 8694 16963 477 17440 8913 2011 3702 4031 543 161 704 7733 2012 444 1311 504 203 708 1755 2013 7079 1538 1819 677 2496 8617
1No cod were caught in 7 tows in this stratum section.

14
Table 6. Haddock biomass (mt) index by strata sections of eastern Georges Bank (see Figure 2) from the NMFS spring survey. Shaded cells represent missing values calculated from adjacent strata sections. Cells with “-“ represent missing values assumed to be zero while “0” represents observed zeros.
Year USA 16 CAN 16 USA 17 CAN 17 USA 18 CAN 18 USA 19 USA 20 USA 21 CAN 21 USA 22 CAN 22 USA total CAN total
1968 4767 5197 - 856 - 84 4637 1012 - 29 226 203 10642 6367 1969 11660 2342 0 1141 0 0 1914 71 0 44 152 137 13797 3664 1970 36753 2583 0 448 0 0 1381 120 201 73 18 159 38474 3263 1971 1102 469 0 194 3 0 1215 0 240 38 - 1097 2561 1798 1972 1017 3843 0 20 0 0 856 0 278 393 - 0 2151 4256 1973 2320 5270 - 113 0 0 1546 207 42 86 0 1284 4116 6752 1974 718 13765 0 77 - 6 4334 0 - 194 0 - 5052 14042 1975 4047 7002 0 59 - 0 1203 0 24 8076 - 34 5273 15171 1976 1955 1802 - 229 - 0 1003 - 2 856 0 - 2961 2887 1977 323 3283 0 43 0 0 1165 1242 41 13720 0 0 2771 17046 1978 6884 11740 6 56 0 24 2520 0 121 9148 - 151 9531 21119 1979 3715 12218 10 84 - 0 1049 0 103 987 260 2005 5137 15294 1980 21009 6764 13 263 - 67 26933 - 0 18795 82 96 48036 25985 1981 12286 15870 2 44 - - 9096 3890 - 4215 370 944 25642 21073 1982 3830 8719 131 348 0 11 1200 859 - 2342 91 1029 6112 12450 1983 1487 5525 21 668 0 0 0 708 61 3999 464 368 2741 10559 1984 3539 4784 8 168 0 0 1497 - 2 154 120 170 5166 5276 1985 1793 8819 14 99 0 18 167 0 - 3696 - 54 1974 12686 1986 1210 6880 0 21 0 0 367 0 0 1297 - 0 1578 8197 1987 245 7607 0 101 0 17 0 1005 - 63 - 69 1250 7856 1988 3085 2097 0 13 - 0 169 0 0 310 0 0 3255 2419 1989 5778 2961 28 146 - 79 123 0 0 751 - 256 5929 4193 1990 1612 8848 0 64 - - 0 0 33 1305 - 21 1645 10238 1991 1012 6001 - 37 - 0 0 0 0 28 - 0 1012 6067 1992 442 1530 - 80 - 0 93 0 - 376 - 0 536 1986 1993 266 3234 - 439 - 0 0 0 - 387 - 154 266 4214 1994 2 801 11 1 0 - 0 - 6 5644 - 0 19 6446 1995 2297 578 42 60 0 - 778 0 2 3356 - 888 3119 4881 1996 3720 1021 23 32 - 0 8581 0 8 972 31 0 12362 2026 1997 218 1884 10 28 0 11 0 0 45 1239 - 74 273 3237 1998 574 6600 3 84 - 5 0 - 282 227 0 108 859 7024 1999 6267 3485 0 1598 - 0 0 74 42 366 37 38 6420 5487 2000 4238 3712 0 220 0 - 198 668 522 151 - 55 5626 4138 2001 297 1537 - 446 - 0 71 0 1215 4339 - 15 1583 6337 2002 13973 9781 0 332 - 15 8094 - 0 897 93 78 22161 11103 2003 2149 14472 2 77 - 0 699 291 1123 1438 19 46 4282 16034 2004 25198 27752 - 978 - 75 3503 28736 715 669 - 3 58152 29477 2005 1575 3031 680 948 0 - 4991 144 - 3945 132 484 7522 8408 2006 11166 8302 5 323 - 97 758 3059 143 4140 - 40 15131 12901 2007 9617 23430 7 64 0 90 19906 12979 295 795 - 124 42804 24502 2008 40456 5465 2 135 0 164 87 1869 484 151 0 204 42898 6120 2009 22760 4635 88 245 0 37 1061 1502 6546 6224 0 19 31957 11159 2010 11191 11361 92 85 0 147 12458 2895 1364 2968 36 109 28037 14670 2011 5332 6871 17 859 0 157 515 0 364 2642 0 740 6228 11270 2012 28213 15155 15 2039 1 315 3285 2483 0 3635 0 101 33996 21245 2013 24543 14231 0 557 0 294 5952 5047 0 18415 123 326 35664 33823

15
Table 7. Haddock biomass (mt) index by strata sections of eastern Georges Bank (see Figure 2) from the NMFS fall survey. Shaded cells represent missing values calculated from adjacent strata sections. Cells with “-“ represent missing values assumed to be zero while “0” represents observed zeros.
Year USA 16 CAN 16 USA 17 CAN 17 USA 18 CAN 18 USA 19 USA 20 USA 21 CAN 21 USA 22 CAN 22 USA total CAN total 1963 12153 8911 0 1892 0 2127 27496 1401 541 2689 240 194 41832 158141964 26324 5986 227 851 0 957 25601 9150 1531 2158 442 34 63275 9986 1965 6109 8981 - 773 0 687 16273 2064 112 2492 498 1114 25056 14047 1966 2640 8170 26 142 0 287 11825 1985 6 308 618 210 17100 9115 1967 1372 1700 0 448 22 304 2377 425 1884 193 - 360 6080 3005 1968 0 8032 0 129 - 377 0 71 21 0 - 651 92 9188 1969 599 0 0 146 - 0 1107 1927 - 86 0 102 3633 333 1970 27 743 8 555 - 542 9156 0 32 1035 - 274 9223 3149 1971 244 361 0 356 0 57 2463 0 112 29 - 470 2819 1272 1972 151 1143 - 685 0 43 0 0 0 0 72 204 223 2076 1973 83 9296 0 811 0 26 0 0 - 36 - - 83 10169 1974 0 586 0 99 0 35 0 - 0 560 341 0 341 1279 1975 560 747 - 1322 0 226 0 425 - 0 37 540 1022 2835 1976 0 44340 0 375 0 307 0 - - 9637 152 724 152 55381 1977 4 2886 0 623 0 510 88 0 482 24478 253 3131 827 31628 1978 133 1848 0 6727 0 1074 475 9 0 872 120 490 737 11010 1979 2561 2193 5 143 - 871 0 2 - 730 575 3233 3143 7171 1980 5 1228 0 4167 0 394 647 44 228 363 51 850 974 7002 1981 647 4886 213 2349 0 348 5 20 266 570 316 552 1467 8705 1982 162 1919 - 2889 - 1423 0 0 26 60 128 14 316 6305 1983 95 334 - 1061 0 506 0 0 - 197 262 333 357 2431 1984 0 308 - 1603 0 455 0 0 - 71 152 194 152 2632 1985 497 590 - 739 0 395 0 0 7 453 - 18 504 2195 1986 0 2368 - 1383 0 465 0 0 16 2079 0 26 16 6321 1987 7 8 - 320 - 140 8 7 0 205 0 239 22 911 1988 50 1134 - 366 - 1588 0 0 - 1724 0 413 50 5224 1989 4 528 - 987 2 1114 0 8 6 1331 46 296 66 4257 1990 51 29 0 1396 - 401 0 0 - 885 - 132 51 2842 1991 20 92 - 561 0 0 - 0 8 0 0 178 28 831 1992 171 292 0 585 - 173 0 8 0 6 - 21 179 1077 1993 0 443 - 217 - 0 0 0 - 4103 - 83 0 4846 1994 0 0 - 284 - 347 0 0 0 1162 - 0 0 1793 1995 4 5214 - 843 - 1373 0 0 0 6575 0 - 4 14005 1996 10 2057 - 1138 - 639 0 - 1 179 - 0 10 4012 1997 0 4 - 133 - 0 2 5 8 6012 - 0 15 6149 1998 7 3409 - 285 - 471 0 37 7 2241 - - 51 6406 1999 0 151 - 113 - 2021 0 0 - 13900 0 0 0 16184 2000 100 1646 - 365 - 1351 0 0 0 9432 0 0 100 12795

16
Table 7. continued. Year USA 16 CAN 16 USA 17 CAN 17 USA 18 CAN 18 USA 19 USA 20 USA 21 CAN 21 USA 22 CAN 22 USA total CAN total2001 1013 1471 - 2264 - 395 0 0 0 21540 - 491 1013 261612002 314 21420 8 591 - 201 0 144 0 19620 206 223 671 42054 2003 2736 3312 - 331 - 95 342 219 123 6453 - 0 3420 10191 2004 3275 24845 746 1115 0 693 0 5 1766 8248 223 1181 6014 36083 2005 5647 13381 2 1071 0 98 3 120 585 5617 2650 11761 9009 31927 2006 2088 20548 0 837 0 571 0 - - 4502 - 7275 2088 33732 2007 203 2560 6 788 - 39 0 0 11208 2860 - 15315 11417 21561 2008 89 2578 2 4246 0 775 0 0 0 8005 0 7470 91 23074 2009 11958 14743 0 2070 0 0 12254 304 240 3999 188 36 24944 20848 2010 2936 14967 50 1554 1 1087 0 0 2677 2604 697 707 6361 20919 2011 9122 29552 1606 2549 1 2355 166 0 1178 1096 0 443 12073 35995 2012 564 21464 0 798 0 0 0 0 784 29443 736 7528 2083 59233 2013 61804 27768 676 1060 89 894 22938 6321 0 3769 0 7276 91829 40766

17
Table 8. Haddock biomass (mt) index by strata and strata sections of eastern Georges Bank (see Figure 2) from the DFO survey.
Year CAN 5Z1 CAN 5Z2 USA 5Z3 USA 5Z4 USA total CAN total
1987 2661 12956 375 99 475 15617 1988 1350 16559 8305 96 8401 17909 1989 982 9377 641 198 839 10359 1990 3943 15963 3424 4155 7579 19907 1991 3084 13597 7383 3260 10643 16680 1992 3544 10403 5953 576 6530 13946 1993 2064 2367 110 2411 2521 4432 1994 8871 9968 19 90 108 18839 1995 2244 18041 336 0 336 20285 1996 4947 16985 440 839 1279 21933 1997 1853 11022 1298 179 1476 12875 1998 15844 29323 89 11 99 45167 1999 14775 15221 506 319 825 29996 2000 4682 41522 11048 158 11206 46205 2001 9471 43754 2022 513 2535 53225 2002 5695 28569 3391 11863 15254 34264 2003 1583 89462 4334 27407 31741 91045 2004 21198 71574 5479 1796 7274 92772 2005 9638 39589 1931 5209 7140 49226 2006 5445 53525 35052 6285 41337 58970 2007 9705 43079 3811 5009 8820 52784 2008 35446 47657 34798 6063 40861 83102 2009 29750 41728 01 82 82 71478 2010 1137 44993 5148 19991 25139 46130 2011 12095 32436 4114 10518 14632 44530 2012 4365 29550 25010 18497 43508 33915 2013 21809 50425 60218 31062 91281 72235
1No Haddock were caught in 7 tows in this stratum section.

18
Table 9. Yellowtail Flounder biomass (mt) index by strata and strata sections of Georges Bank (see Figure 2) from the NMFS spring survey. Cells with “-“ represent missing values assumed to be zero while “0” represents observed zeros.
Year USA 13 USA 14 USA 15 USA 16 CAN 16 USA 17 CAN 17 USA 18 CAN 18 USA 19 USA 20 USA 21 CAN 21 USA total CAN total
1968 326 0 0 1228 413 - 0 - 0 1052 99 0 0 2705 413 1969 2239 0 0 1524 633 22 0 0 0 7425 107 100 0 11416 633 1970 2975 0 0 773 156 29 0 0 0 1359 653 17 0 5806 156 1971 2114 29 0 1146 183 0 0 0 0 1284 0 49 0 4622 183 1972 2056 10 0 1505 1307 0 0 0 0 1979 214 0 0 5764 1307 1973 1204 6 0 862 611 - 5 0 0 367 83 5 317 2528 932 1974 782 0 0 623 522 0 0 - 0 870 214 0 0 2488 522 1975 258 17 0 344 781 0 0 - 0 349 89 0 - 1057 781 1976 835 0 0 375 674 - 6 - 0 430 107 2 0 1748 680 1977 152 7 0 124 666 0 0 0 0 30 20 0 37 332 703 1978 224 7 0 119 180 0 3 0 0 159 90 7 0 607 182 1979 312 0 0 193 422 5 9 - 0 315 20 5 0 849 432 1980 933 0 0 387 2300 0 131 - 2 389 81 2 4 1793 2437 1981 211 9 0 1035 137 0 25 - - 185 19 0 73 1459 235 1982 1202 0 3 175 563 0 10 0 4 694 0 10 0 2084 578 1983 355 13 0 431 799 0 73 0 3 1023 161 16 - 1999 875 1984 135 0 0 342 747 - 0 0 0 265 201 16 0 960 747 1985 127 0 0 200 473 0 0 0 3 131 55 0 0 512 475 1986 190 0 0 68 584 0 0 0 0 71 0 9 20 338 604 1987 66 0 0 114 102 0 0 0 0 71 0 2 0 253 102 1988 193 0 0 183 146 0 0 - 0 46 6 40 0 467 146 1989 179 0 0 115 322 0 0 - 0 65 2 2 3 363 324 1990 545 0 0 30 117 0 7 - - 37 0 0 0 612 124 1991 233 0 0 139 286 - 0 - 0 7 0 0 0 380 286 1992 295 0 0 178 1200 - 9 - 0 169 45 0 25 688 1233 1993 84 0 0 83 349 - 8 - 0 49 0 0 6 217 363 1994 103 0 0 127 383 0 0 0 - 70 0 55 37 356 419 1995 298 0 0 439 1854 - 0 0 - 41 12 4 44 794 1898 1996 103 0 0 1020 1724 - 9 - 0 229 120 13 23 1485 1756 1997 95 0 0 432 3631 0 0 3 0 35 59 2 0 626 3631 1998 704 0 0 910 676 0 0 - 0 38 65 19 302 1737 978 1999 768 0 0 2571 6830 0 0 - 0 5 67 36 3 3448 6833 2000 681 0 0 2003 4927 0 6 0 - 180 33 61 0 2956 4933 2001 61 0 0 2486 2389 - 8 - 0 101 20 240 17 2908 2413 2002 66 0 0 3656 3876 0 0 - 0 663 8 4 3150 4397 7026 2003 173 0 0 895 6384 0 28 - 0 21 0 14 - 1103 6412 2004 261 0 - 535 1219 - 0 - 0 74 16 0 62 886 1281 2005 216 0 0 2094 1025 0 0 0 - 44 0 0 33 2354 1058 2006 93 5 0 1258 1051 0 0 - 0 87 58 2 2 1504 1053 2007 372 382 3 733 3271 0 6 0 0 38 81 89 0 1699 3277 2008 234 0 0 968 1241 44 969 0 0 92 22 28 29 1388 2238 2009 1338 0 0 4298 5566 61 116 0 0 380 24 69 104 6171 5786 2010 573 974 0 4059 6352 0 6 1 0 2491 80 3 39 8182 6397 2011 3238 110 0 1821 251 7 0 0 0 368 89 6 0 5640 251 2012 1637 0 0 4763 817 0 7 0 1 1098 424 14 111 7937 936 2013 129 0 0 752 1219 6 28 0 0 0 64 6 175 957 1421
19
Table 10. Yellowtail Flounder biomass (mt) index by strata and strata sections of Georges Bank (see Figure 2) from the NMFS fall survey. Cells with “-“ represent missing values assumed to be zero while “0” represents observed zeros.
Year USA 13 USA 14 USA 15 USA 16 CAN 16 USA 17 CAN 17 USA 18 CAN 18 USA 19 USA 20 USA 21 CAN 21 USA total CAN total 1963 6254 153 15 1741 477 84 41 5 - 2136 3102 13 0 13502 5181964 10125 60 0 1102 114 26 33 0 0 3324 113 0 7 14751 154 1965 6677 24 0 247 80 - 17 0 0 1451 1419 62 0 9879 97 1966 669 0 0 164 1336 5 5 0 0 1351 353 25 4 2566 1345 1967 1622 10 23 2359 0 119 0 0 0 2202 495 0 0 6830 0 1968 2864 0 0 2143 1491 9 0 - 0 4178 323 5 0 9521 1491 1969 2927 0 0 1859 298 86 0 - 0 3738 156 7 0 8773 298 1970 1519 0 0 632 424 75 0 - 0 2206 318 62 0 4812 424 1971 3359 19 9 1766 179 0 0 3 4 1222 0 137 0 6514 183 1972 4504 29 0 1827 306 - 0 0 0 339 0 232 0 6930 306 1973 1867 0 0 2225 2377 5 0 0 0 178 13 349 36 4638 2414 1974 2286 0 0 749 825 0 0 0 0 126 0 0 0 3160 825 1975 770 19 0 936 747 - 0 0 0 80 36 0 0 1842 747 1976 128 0 0 1070 167 0 75 0 0 17 63 55 34 1333 276 1977 139 123 0 712 1765 0 7 0 - 109 91 60 0 1235 1772 1978 1129 0 0 838 336 0 78 0 0 151 31 1 0 2151 414 1979 479 0 0 739 156 0 5 - 0 9 45 48 4 1320 165 1980 40 14 0 1975 3869 8 26 0 0 970 93 110 173 3211 4068 1981 941 0 0 1250 106 0 0 0 0 190 0 22 0 2403 106 1982 1512 0 0 110 603 - 0 - 0 105 23 42 0 1792 603 1983 753 0 0 731 676 - 0 0 0 0 0 141 0 1625 676 1984 304 0 0 201 85 - 5 0 0 31 0 45 17 581 108 1985 141 0 0 405 171 - 4 0 0 0 0 0 38 547 212 1986 208 0 0 438 155 - 0 0 0 8 2 4 0 659 155 1987 69 0 0 193 267 - 0 - 0 16 0 0 0 278 267 1988 18 0 0 121 60 - 0 - 0 0 4 0 13 144 73 1989 794 0 0 202 83 - 0 0 - 9 21 0 0 1026 83 1990 388 0 0 282 76 0 0 - 0 32 0 0 0 702 76 1991 90 0 0 661 99 - 0 3 - 0 0 25 0 779 99 1992 177 0 0 9 419 0 0 - 0 16 22 0 0 224 419 1993 47 0 0 24 327 - 12 - 0 0 7 18 0 96 339 1994 113 0 0 105 755 - 18 - 0 11 0 118 19 347 792 1995 47 0 0 80 214 - 0 - 0 3 10 71 0 211 214 1996 90 0 0 1494 284 - 0 - 0 0 0 10 0 1593 284 1997 232 0 0 1808 1999 - 0 - 0 38 0 37 3 2115 2003 1998 818 0 0 592 2364 - 3 - 0 0 20 5 0 1435 2367 1999 770 0 0 2935 3962 - 191 - 0 224 114 157 0 4200 4154 2000 171 0 0 5580 1097 - 4 - 0 60 22 144 20 5978 1121

20
Table 10. continued. Year USA 13 USA 14 USA 15 USA 16 CAN 16 USA 17 CAN 17 USA 18 CAN 18 USA 19 USA 20 USA 21 CAN 21 USA total CAN total2001 641 0 0 7877 2139 - 13 - 0 177 47 111 0 8853 21532002 161 0 0 1784 1861 0 7 - 0 5 10 214 75 2174 1943 2003 92 0 0 2825 1613 - 0 - 0 158 0 43 3 3119 1616 2004 161 0 0 5915 78 0 0 0 0 172 12 67 121 6327 198 2005 145 0 0 1133 1260 0 7 0 0 41 29 56 9 1404 1276 2006 1475 0 2909 294 0 45 1 0 25 3 16 37 4429 376 2007 274 0 0 5739 753 3 0 0 0 52 6 114 115 6188 868 2008 852 0 0 3090 3654 0 0 0 0 0 0 31 58 3973 3712 2009 4209 0 0 10518 785 0 45 0 0 1180 0 31 136 15937 966 2010 1497 4 0 2371 1579 18 74 4 0 61 151 161 39 4266 1691 2011 2139 0 3 2511 880 14 0 0 0 63 0 20 841 4749 1720 2012 49 0 0 4888 389 0 0 0 0 29 0 13 49 4979 438 2013 164 0 0 1255 542 0 0 0 0 260 0 617 28 2296 570
21
Table 11. Yellowtail Flounder biomass (mt) index by strata of Georges Bank (see Figure 2) from the DFO survey.
Year CAN 5Z1 CAN 5Z2 USA 5Z3 USA 5Z4 USA total CAN total
1987 69 750 102 343 445 819 1988 30 253 136 816 952 283 1989 29 111 50 281 331 140 1990 39 358 129 1053 1181 397 1991 57 444 262 996 1258 501 1992 119 432 327 1599 1925 550 1993 59 1634 178 771 949 1693 1994 91 501 745 1417 2162 591 1995 35 785 487 719 1206 820 1996 35 2799 1229 1241 2470 2833 1997 868 2464 2431 7529 9960 3332 1998 93 2484 613 1102 1715 2577 1999 190 6616 408 10452 10860 6806 2000 2019 5526 6430 5974 12404 7545 2001 443 4995 963 15757 16720 5438 2002 66 5052 5854 9727 15581 5118 2003 48 5739 75 10387 10462 5786 2004 84 5637 63 3271 3334 5720 2005 51 1028 392 11886 12278 1079 2006 35 776 962 4805 5767 812 2007 196 2959 102 10088 10189 3155 2008 64491 1656 262 910 1172 66147 2009 70851 1077 45 72 117 71927 2010 5332 3226 178 402 580 8558 2011 1 477 800 2552 3351 479 2012 89 1121 385 4055 4440 1210 2013 212 252 77 157 234 464

22
Table 12. Resource distribution for eastern Georges Bank Atlantic Cod on the Canadian and USA sides of the international boundary for the NMFS and DFO surveys, the distribution resulting from combining the surveys, and the smoothed resource distribution. The combined distribution was obtained by averaging the NMFS spring and DFO surveys to represent winter-spring and subsequently averaging with NMFS fall which represented summer-fall. Open box highlights current year results.
NMFS fall NMFS spring DFO Combined surveys Smoothed
Year %CAN %USA %CAN %USA %CAN %USA %CAN %USA %CAN %USA
1979 73 27 66 34 - - 69 31 64 36
1980 65 35 57 43 - - 61 39 65 35
1981 78 22 31 69 - - 55 45 65 35
1982 67 33 97 3 - - 82 18 66 34
1983 86 14 47 53 - - 66 34 67 33
1984 96 4 23 77 - - 59 41 69 31
1985 100 0 62 38 - - 81 19 71 29
1986 58 42 62 38 - - 60 40 74 26
1987 90 10 61 39 84 16 81 19 78 22
1988 99 1 69 31 76 24 86 14 82 18
1989 99 1 62 38 74 26 83 17 85 15
1990 100 0 74 26 89 11 91 9 85 15
1991 100 0 62 38 78 22 85 15 85 15
1992 94 6 83 17 66 34 85 15 85 15
1993 100 0 41 59 61 39 76 24 84 16
1994 100 0 70 30 96 4 91 9 83 17
1995 94 6 87 13 52 48 82 18 83 17
1996 95 5 55 45 73 27 80 20 84 16
1997 100 0 62 38 70 30 83 17 84 16
1998 100 0 96 4 88 12 96 4 84 16
1999 97 3 53 47 77 23 81 19 85 15
2000 100 0 48 52 69 31 79 21 85 15
2001 97 3 74 26 95 5 90 10 84 16
2002 98 2 63 37 95 5 88 12 84 16
2003 81 19 73 27 69 31 76 24 83 17
2004 99 1 81 19 87 13 91 9 80 20
2005 93 7 66 34 34 66 71 29 78 22
2006 97 3 31 69 69 31 73 27 77 23
2007 81 19 40 60 87 13 72 28 78 22
2008 100 0 57 43 91 9 87 13 79 21
2009 82 18 75 25 100 0 85 15 80 20
2010 96 4 51 49 34 66 69 31 81 19
2011 97 3 82 18 92 8 92 8 82 18
2012 81 19 59 41 71 29 73 27 82 18
2013 97 3 77 23 78 22 87 13 83 17

23
Table 13. Resource distribution for eastern Georges Bank Haddock on the Canadian and USA sides of the international boundary for the NMFS and DFO surveys, the distribution resulting from combining the surveys, and the smoothed resource distribution. The combined distribution was obtained by averaging over all surveys. Open box highlights current year results.
NMFS fall NMFS spring DFO Combined surveys Smoothed
Year %CAN %USA %CAN %USA %CAN %USA %CAN %USA %CAN %USA
1979 70 30 75 25 - - 72 28 66 34
1980 88 12 35 65 - - 61 39 69 31
1981 86 14 45 55 - - 65 35 72 28
1982 95 5 67 33 - - 81 19 74 26
1983 87 13 79 21 - - 83 17 78 22
1984 95 5 51 49 - - 73 27 82 18
1985 81 19 87 13 - - 84 16 84 16
1986 100 0 84 16 - - 92 8 84 16
1987 98 2 86 14 97 3 94 6 84 16
1988 99 1 43 57 68 32 70 30 83 17
1989 98 2 41 59 93 7 77 23 81 19
1990 98 2 86 14 72 28 86 14 80 20
1991 97 3 86 14 61 39 81 19 82 18
1992 86 14 79 21 68 32 78 22 84 16
1993 100 0 94 6 64 36 86 14 86 14
1994 100 0 100 0 99 1 100 0 86 14
1995 100 0 61 39 98 2 86 14 88 12
1996 100 0 14 86 94 6 69 31 89 11
1997 100 0 92 8 90 10 94 6 87 13
1998 99 1 89 11 100 0 96 4 86 14
1999 100 0 46 54 97 3 81 19 85 15
2000 99 1 42 58 80 20 74 26 81 19
2001 96 4 80 20 95 5 91 9 78 22
2002 98 2 33 67 69 31 67 33 76 24
2003 75 25 79 21 74 26 76 24 74 26
2004 86 14 34 66 93 7 71 29 72 28
2005 78 22 53 47 87 13 73 27 69 31
2006 94 6 46 54 59 41 66 34 67 33
2007 65 35 36 64 86 14 62 38 64 36
2008 100 0 12 88 67 33 60 40 61 39
2009 46 54 26 74 100 0 57 43 61 39
2010 77 23 34 66 65 35 59 41 59 41
2011 75 25 64 36 75 25 72 28 57 43
2012 97 3 38 62 44 56 60 40 55 45
2013 31 69 49 51 44 56 41 59 52 48

24
Table 14. Resource distribution for Georges Bank Yellowtail Flounder on the Canadian and USA sides of the international boundary for the NMFS and DFO surveys, the distribution resulting from combining the surveys, and the smoothed resource distribution. The combined distribution was obtained by averaging over all surveys. Open box highlights current year results.
NMFS fall NMFS spring DFO Combined surveys Smoothed
Year %CAN %USA %CAN %USA %CAN %USA %CAN %USA %CAN %USA
1979 11 89 34 66 - - 22 78 18 82
1980 56 44 58 42 - - 57 43 20 80
1981 4 96 14 86 - - 9 91 23 77
1982 25 75 22 78 - - 23 77 25 75
1983 29 71 30 70 - - 30 70 27 73
1984 16 84 44 56 - - 30 70 32 68
1985 28 72 48 52 - - 38 62 36 64
1986 19 81 64 36 - - 42 58 37 63
1987 49 51 29 71 65 35 48 52 35 65
1988 34 66 24 76 23 77 27 73 32 68
1989 7 93 47 53 30 70 28 72 30 70
1990 10 90 17 83 25 75 17 83 31 69
1991 11 89 43 57 28 72 28 72 36 64
1992 65 35 64 36 22 78 51 49 42 58
1993 78 22 63 37 64 36 68 32 47 53
1994 70 30 54 46 21 79 48 52 50 50
1995 50 50 71 29 40 60 54 46 51 49
1996 15 85 54 46 53 47 41 59 50 50
1997 49 51 85 15 25 75 53 47 50 50
1998 62 38 36 64 60 40 53 47 48 52
1999 50 50 66 34 39 61 52 48 46 54
2000 16 84 63 37 38 62 39 61 44 56
2001 20 80 45 55 25 75 30 70 43 57
2002 47 53 62 38 25 75 44 56 42 58
2003 34 66 85 15 36 64 52 48 40 60
2004 3 97 59 41 63 37 42 58 38 62
2005 48 52 31 69 8 92 29 71 35 65
2006 8 92 41 59 12 88 20 80 35 65
2007 12 88 66 34 24 76 34 66 38 62
2008 48 52 62 38 98 2 69 31 42 58
2009 6 94 48 52 100 0 51 49 44 56
2010 28 72 44 56 94 6 55 45 41 59
2011 27 73 4 96 13 87 14 86 39 61
2012 8 92 11 89 21 79 13 87 37 63
2013 20 80 60 40 67 33 49 51 33 67

25
Table 15. Resource (a) utilization and (b) distribution of eastern Georges Bank Atlantic Cod and Haddock, and Georges Bank Yellowtail Flounder (Ytl) and the weightings used in the Canada/USA allocation sharing formula. Allocation shares are updated annually based on resource distribution. The weighting of resource utilization to resource distribution changed from an initial ratio of 40:60 to 10:90 by 2010.
a) Resource Utilization
Country Cod Haddock Ytl USA 40% 45% 98%
CANADA 60% 55% 2% b) Resource Distribution Weighting Allocation Shares
Country Survey Year Cod Haddock Ytl
Fishing Year Utilization Distribution Cod Haddock Ytl
USA 2000 18% 20% 54% 2002 40% 60% 27% 30% 72% CANADA 82% 80% 46% 73% 70% 28%
USA 2001 14% 16% 64% 2003 40% 60% 24% 28% 78% CANADA 86% 84% 36% 76% 72% 22%
USA 2002 12% 26% 62% 2004 40% 60% 23% 34% 76% CANADA 88% 74% 38% 77% 66% 24%
USA 2003 18% 27% 56% 2005 35% 65% 26% 33% 71% CANADA 82% 73% 44% 74% 67% 29%
USA 2004 14% 29% 56% 2006 30% 70% 22% 34% 69% CANADA 86% 71% 44% 78% 66% 31%
USA 2005 21% 29% 63% 2007 25% 75% 26% 33% 72% CANADA 79% 71% 37% 74% 67% 28%
USA 2006 26% 32% 73% 2008 20% 80% 29% 35% 78% CANADA 74% 68% 27% 71% 65% 22%
USA 2007 29% 36% 73% 2009 15% 85% 31% 37% 77% CANADA 71% 64% 27% 69% 63% 23%
USA 2008 23% 40% 60% 2010 10% 90% 25% 40.5% 64% CANADA 77% 60% 40% 75% 59.5% 36%
USA 2009 17% 43% 50% 2011 10% 90% 19% 43% 55% CANADA 83% 57% 50% 81% 57% 45%
USA 2010 22% 43% 44% 2012 10% 90% 24% 43% 49% CANADA 78% 57% 56% 76% 57% 51%
USA 2011 13% 37% 37% 2013 10% 90% 16% 38% 43% CANADA 87% 63% 63% 84% 62% 57%
USA 2012 20% 38% 80% 2014 10% 90% 22% 39% 82% CANADA 80% 62% 20% 78% 61% 18%
USA 2013 17% 48% 67% 2015 10% 90% 19% 48% 70% CANADA 83% 52% 33% 81% 52% 30%
26
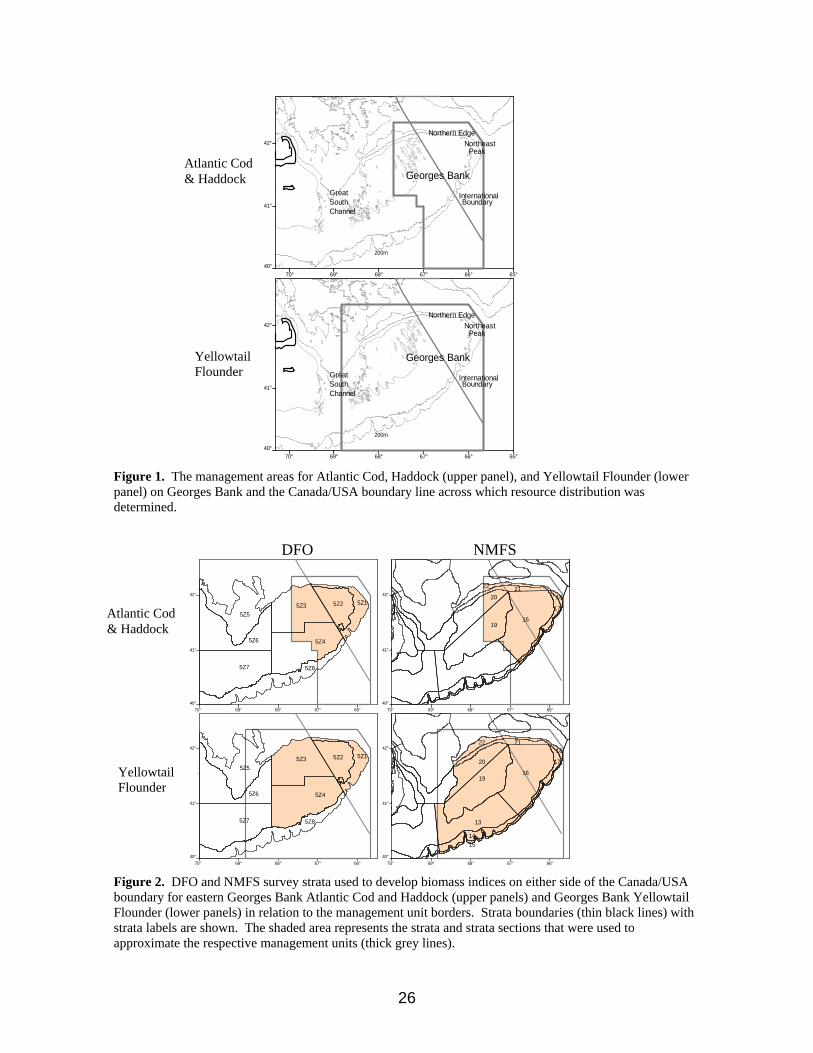
Figure 1. The management areas for Atlantic Cod, Haddock (upper panel), and Yellowtail Flounder (lower panel) on Georges Bank and the Canada/USA boundary line across which resource distribution was determined.
Figure 2. DFO and NMFS survey strata used to develop biomass indices on either side of the Canada/USA boundary for eastern Georges Bank Atlantic Cod and Haddock (upper panels) and Georges Bank Yellowtail Flounder (lower panels) in relation to the management unit borders. Strata boundaries (thin black lines) with strata labels are shown. The shaded area represents the strata and strata sections that were used to approximate the respective management units (thick grey lines).
70° 69° 68° 67° 66° 65°
40°
41°
42°
Georges Bank
Northern Edge
NortheastPeak
InternationalBoundary
GreatSouthChannel
200m
70° 69° 68° 67° 66° 65°
40°
41°
42°
Georges Bank
Northern Edge
NortheastPeak
InternationalBoundary
GreatSouthChannel
200m
cod & haddock
yellowtail flounder
DFO NMFS
70° 69° 68° 67° 66°
40°
41°
42°
5Z15Z25Z3
5Z4
5Z5
5Z6
5Z7 5Z8
70° 69° 68° 67° 66°
40°
41°
42°
16
17
18
19
202122
70° 69° 68° 67° 66°
40°
41°
42°
5Z15Z25Z3
5Z4
5Z5
5Z6
5Z7 5Z8
70° 69° 68° 67° 66°
40°
41°
42°
13
14
15
16
17
18
19
20
2122
cod & haddock
yellowtail flounder
Atlantic Cod & Haddock
Yellowtail Flounder
Atlantic Cod & Haddock
Yellowtail Flounder
27
Figure 3. Relative indices of biomass and percentage resource distribution in relation to the international boundary for Atlantic Cod on eastern Georges Bank.
28
Figure 4. Relative indices of biomass and percentage resource distribution in relation to the international boundary for Haddock on eastern Georges Bank.
29
Figure 5. Relative indices of biomass and percentage resource distribution in relation to the international boundary for Yellowtail Flounder on Georges Bank.

30
Figure 6. Observed annual percentage (white line) and smoothed trends of proportion of a) eastern Georges Bank Atlantic Cod, b) eastern Georges Bank Haddock, and c) Georges Bank Yellowtail Flounder on the Canadian side of the international boundary.
a)
b)
c)