Embed Size (px)
Citation preview
ESCUELA TÉCNICA SUPERIOR DE INGENIEROS
INDUSTRIALES Y DE TELECOMUNICACIÓN
UNIVERSIDAD DE CANTABRIA
Trabajo Fin de Grado
MASS TRANSFER THROUGH GAS SEPARATION MEMBRANES. EXPERIMENTAL
STUDY OF CO2/N2 SEPARATION (Transferencia de materia a través
de membranas de separación de gases. Estudio de la separación de CO2/N2)
Para acceder al Título de
Graduado en Ingeniería Química
Autor: Guillermo García Rubio
Escuela Técnica Superior de Ingenieros Industriales y de Telecomunicación
TÍTULO MASS TRANSFER THROUGH GAS SEPARATION MEMBRANES.
EXPERIMENTAL STUDY OF CO2/N2 SEPARATION AUTOR Guillermo García Rubio DIRECTOR/CODIRECTOR Clara Casado Coterillo / Ana Fernández Barquín TITULACIÓN Grado en Ingeniería Química FECHA 15/07/2015
KEYWORDS Post-combustion, carbon capture, polymeric membranes, CO2/N2 separation SCOPE
Due to the increased CO2 emissions to the atmosphere, carbon capture and
storage (CCS) is becoming an increasingly promising method as a greenhouse
mitigation option, where fossil fuel power plants have a critical role. The conventional
technology, absorption-based capture, is energy-intensive, and produces wastes due to
the solvent degradation, whereas membrane technology is expected to consume less
energy and do not produce waste streams. However, the economic feasibility is limited
by the transport properties and the stability of the membrane. Many works have been
reported in the last years regarding the development of flue gas separation, and hybrid
processes including a membrane unit or multi stage membrane processes have also been
reported. However, not many works have dealt with the performance of CO2/N2
mixtures in multi – stage separation processes experimentally.
The first objective of this work was the building up and setting up of the
separation plants at laboratory scale enabling to work with one or two membrane
modules in series. The CO2/N2 separation performance of a commercial membrane
based on a non-porous poly (dimethyl siloxane) top layer on a macroporous support
(PDMS, Pervap 4060, Sulzer), has then been studied, under the influence of different
variables such as feed concentration, temperature and number of membrane modules in
series.
RESULTS
The parameters describing the membrane performance are the permeability and
the %CO2 concentration in the permeate. The permeability increases with temperature
from 1,515 to 3,100 barrer, and %CO2 in permeate increases with temperature and feed
Escuela Técnica Superior de Ingenieros Industriales y de Telecomunicación
concentration. A semi-empirical equation has been developed to predict CO2
permeation as a function of temperature and feed concentration within 10 % error. The
CO2 concentration in the feed of 12.5 % has been selected to study experimentally the
performance of 2-membrane-in-series and the CO2 recovery is enhanced up to 76 % at
60 ºC, compared with the 1-membrane system.
CONCLUSIONS
The main conclusions are that the temperature slightly favors the CO2 recovery,
since higher concentration of carbon dioxide in the permeate are achieved at increasing
temperature; the permeability also increased with rising temperature. The experiments
performed with the two membrane-in-series set up built in this work show that the
carbon dioxide concentration in the permeate is between 44% and 76% higher than the
values obtained with the single membrane system at 30 ºC and 60 ºC, respectively.
REFERENCES Fernández-Barquín, A., Casado-Coterillo, C., Palomino, M., Valencia, S., Irabien, A.
2015. LTA/Poly(1-trimethylsilyl-1-propyne) Mixed-Matrix Membranes for High-
Temperature CO2/N2 Separation. Chemical Engineering Technology, 38(4), pp. 658-
666.
Hägg, M., 2009. Membranes in gas separation, in: Handbook of Membrane
Separations: Membranes in Gas Separation (Eds. A.K. Pabby, S. S. H. Rizvi, A. M.
Sastre), 2nd edn., pp. 65-103, CRC Press Taylor & Francis: NW: USA.
Merkel, T. C.; Lin, H.; Wei, X.; Baker, R., 2010. Power plant post-combustion carbon
dioxide capture: an opportunity for membranes. Journal of Membrane Science, 359, pp.
126-139.
Stolten, D. and Scherer, V. 2011. Efficient Carbon Capture for Coal Power Plants.
619pp. Wiley-VCH: Weinheim, Germany.
Escuela Técnica Superior de Ingenieros Industriales y de Telecomunicación
TÍTULO
TRANSFERENCIA DE MATERIA A TRAVÉS DE MEMBRANAS DE SEPARACIÓN DE GASES. ESTUDIO DE LA SEPARACIÓN DE CO2/N2
AUTOR Guillermo García Rubio DIRECTOR/CODIRECTOR Clara Casado Coterillo / Ana Fernández Barquín TITULACIÓN Grado en Ingeniería Química FECHA 15/07/2015
PALABRAS CLAVE Post-combustión, captura de CO2, membranas poliméricas, separación de CO2/N2
PLANTEAMIENTO DEL PROBLEMA
Debido al actual incremento de las emisiones de CO2 a la atmósfera, la captura y
el almacenamiento del mismo está convirtiéndose en una alternativa para mitigar el
efecto invernadero debido entre otras cosas a las plantas de quema de combustibles
fósiles para producir energía. Las tecnologías convencionales, como la captura por
absorción, requieren demasiada energía y generan corrientes residuales debido a la
degradación de los disolventes. En cambio se espera que con la tecnología de
membranas se consuma menos energía, no se generen corrientes residuales y se facilite
el escalado. Sin embargo, su viabilidad económica se ve limitada por factores como: las
propiedades de transporte de la membrana y su estabilidad. En los últimos años se han
publicado muchos trabajos relacionados con el desarrollo de la separación de los gases
de combustión, tanto en procesos híbridos que incluyan membranas, o procesos de
separación con membranas en varias etapas. Sin embargo, no hay muchos trabajos
reportados que traten la separación de CO2/N2 en varias etapas de forma experimental.
El primer objetivo de este trabajo ha sido la construcción y puesta en marcha de
una planta de separación a escala de laboratorio que permite trabajar con uno o dos
módulos de membrana en serie. Se ha estudiado el comportamiento en separación de
CO2/N2 de una membrana comercial compuesta de una capa densa de poli(dimetil
siloxano) sobre un soporte poroso (PDMS, Pervap 4060, Sulzer), bajo la influencia de
variables como la composición de alimentación, temperatura y número de módulos en
serie.
RESULTADOS
Los factores que describen el funcionamiento de una membrana en separación son
la permeabilidad y la concentración de CO2 en el permeado. La permeabilidad se
Escuela Técnica Superior de Ingenieros Industriales y de Telecomunicación
incrementa conforme aumenta la temperatura desde 1515 a 3100 barrer, y el %CO2 en
el permeado se incrementa con la temperatura y con un aumento en la concentración de
la alimentación. Se obtuvo una ecuación semi-empírica para poder predecir la
permeabilidad de CO2 con un error por debajo del 10 %. Se seleccionó el experimento
en el que la alimentación contenía un 12,5% CO2 con el fin de estudiar la eficacia del
sistema con dos membranas en serie. Se obtuvo un incremento del 76% a 60 ºC con
respecto al sistema con una única membrana.
CONCLUSIONES
Las principales conclusiones son que la temperatura favorece la captura del CO2
puesto que se han obtenido mayores concentraciones de CO2 en el permeado al
incrementar la temperatura. Con la permeabilidad se observó el mismo comportamiento
con la temperatura. Los experimentos llevados a cabo con el sistema de dos membranas
en serie mostraron un incremento en el % CO2 en el permeado de entre un 44 y un 76 %
(a 30 y 60 ºC, respectivamente).
BIBLIOGRAFÍA Fernández-Barquín, A., Casado-Coterillo, C., Palomino, M., Valencia, S., Irabien, A.
2015. LTA/Poly(1-trimethylsilyl-1-propyne) Mixed-Matrix Membranes for High-
Temperature CO2/N2 Separation. Chemical Engineering Technology, 38(4), pp. 658-
666.
Hägg, M., 2009. Membranes in gas separation, in: Handbook of Membrane
Separations: Membranes in Gas Separation (Eds. A.K. Pabby, S. S. H. Rizvi, A. M.
Sastre), 2nd edn., pp. 65-103, CRC Press Taylor & Francis: NW: USA.
Merkel, T. C.; Lin, H.; Wei, X.; Baker, R., 2010. Power plant post-combustion carbon
dioxide capture: an opportunity for membranes. Journal of Membrane Science, 359, pp.
126-139.
Stolten, D. and Scherer, V. 2011. Efficient Carbon Capture for Coal Power Plants.
619pp. Wiley-VCH: Weinheim, Germany.
Mass Transfer Through Gas Separation Membranes. Experimental study of CO2/N2 Separation
– 2 –
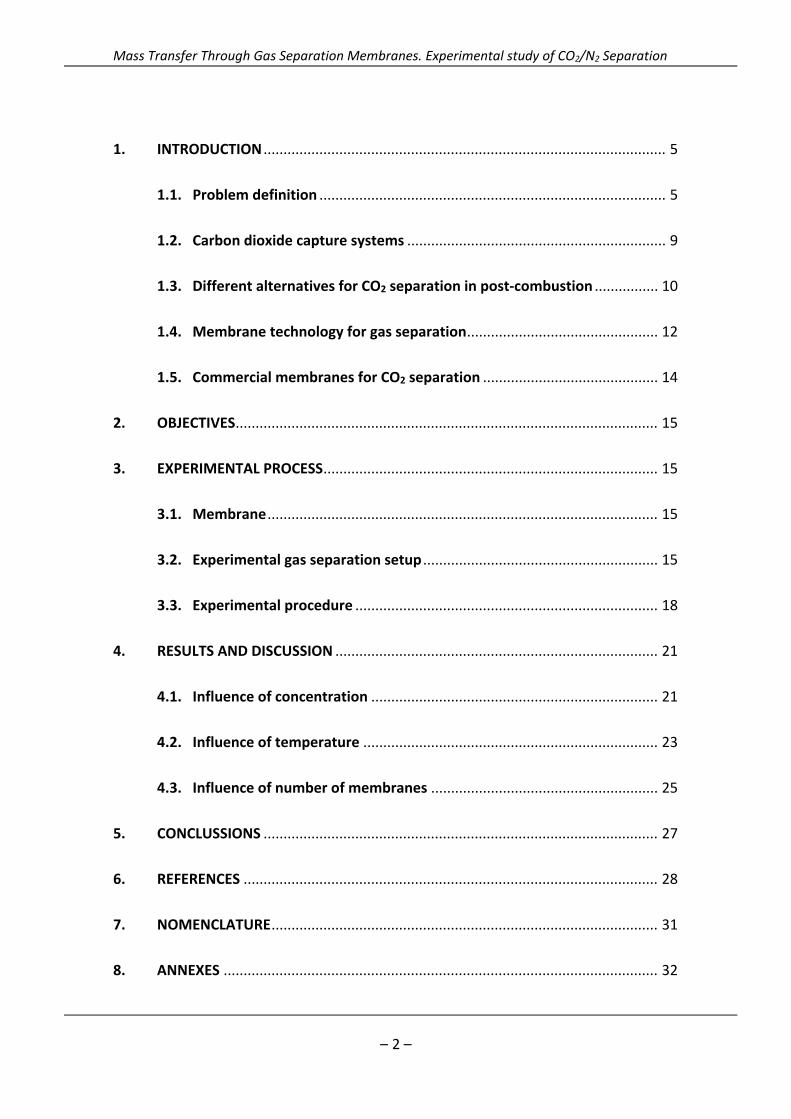
1. INTRODUCTION ..................................................................................................... 5
1.1. Problem definition ....................................................................................... 5
1.2. Carbon dioxide capture systems ................................................................. 9
1.3. Different alternatives for CO2 separation in post‐combustion ................ 10
1.4. Membrane technology for gas separation ................................................ 12
1.5. Commercial membranes for CO2 separation ............................................ 14
2. OBJECTIVES .......................................................................................................... 15
3. EXPERIMENTAL PROCESS .................................................................................... 15
3.1. Membrane .................................................................................................. 15
3.2. Experimental gas separation setup ........................................................... 15
3.3. Experimental procedure ............................................................................ 18
4. RESULTS AND DISCUSSION ................................................................................. 21
4.1. Influence of concentration ........................................................................ 21
4.2. Influence of temperature .......................................................................... 23
4.3. Influence of number of membranes ......................................................... 25
5. CONCLUSSIONS ................................................................................................... 27
6. REFERENCES ........................................................................................................ 28
7. NOMENCLATURE ................................................................................................. 31
8. ANNEXES ............................................................................................................. 32
Mass Transfer Through Gas Separation Membranes. Experimental study of CO2/N2 Separation
– 3 –
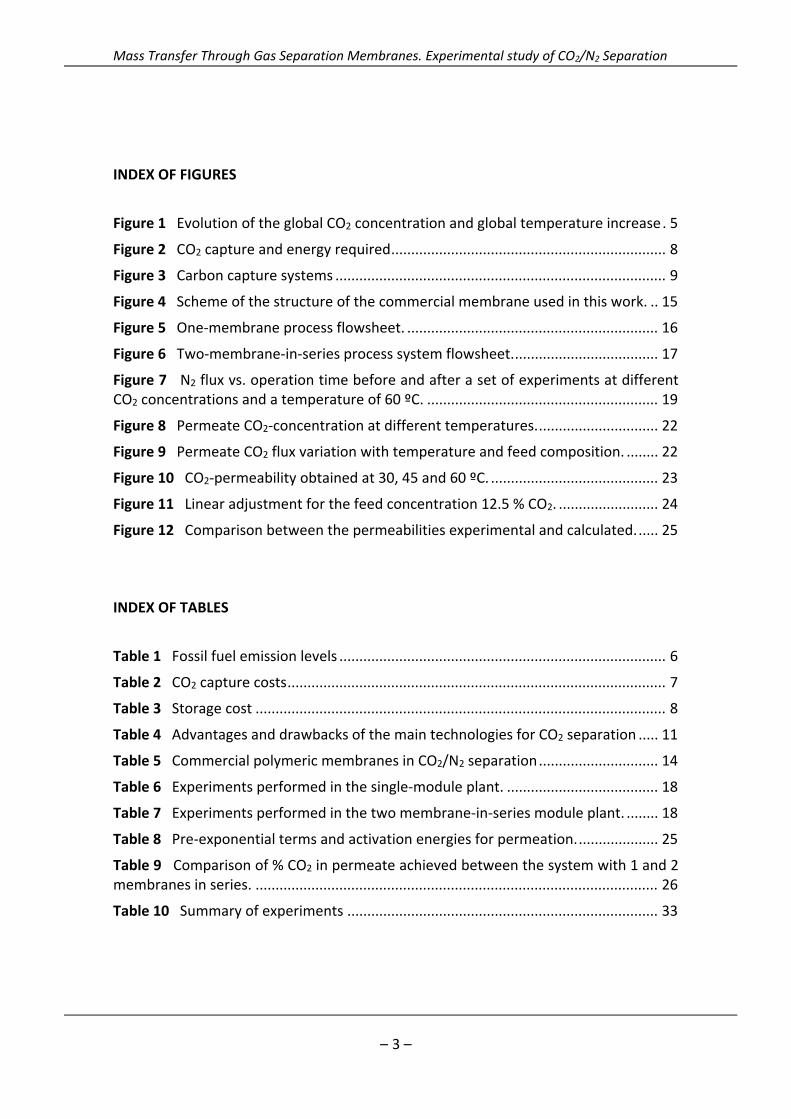
INDEX OF FIGURES
Figure 1 Evolution of the global CO2 concentration and global temperature increase . 5
Figure 2 CO2 capture and energy required ..................................................................... 8
Figure 3 Carbon capture systems ................................................................................... 9
Figure 4 Scheme of the structure of the commercial membrane used in this work. .. 15
Figure 5 One‐membrane process flowsheet. ............................................................... 16
Figure 6 Two‐membrane‐in‐series process system flowsheet. .................................... 17
Figure 7 N2 flux vs. operation time before and after a set of experiments at different CO2 concentrations and a temperature of 60 ºC. .......................................................... 19
Figure 8 Permeate CO2‐concentration at different temperatures. .............................. 22
Figure 9 Permeate CO2 flux variation with temperature and feed composition. ........ 22
Figure 10 CO2‐permeability obtained at 30, 45 and 60 ºC. .......................................... 23
Figure 11 Linear adjustment for the feed concentration 12.5 % CO2. ......................... 24
Figure 12 Comparison between the permeabilities experimental and calculated. ..... 25
INDEX OF TABLES
Table 1 Fossil fuel emission levels .................................................................................. 6
Table 2 CO2 capture costs ............................................................................................... 7
Table 3 Storage cost ....................................................................................................... 8
Table 4 Advantages and drawbacks of the main technologies for CO2 separation ..... 11
Table 5 Commercial polymeric membranes in CO2/N2 separation .............................. 14
Table 6 Experiments performed in the single‐module plant. ...................................... 18
Table 7 Experiments performed in the two membrane‐in‐series module plant. ........ 18
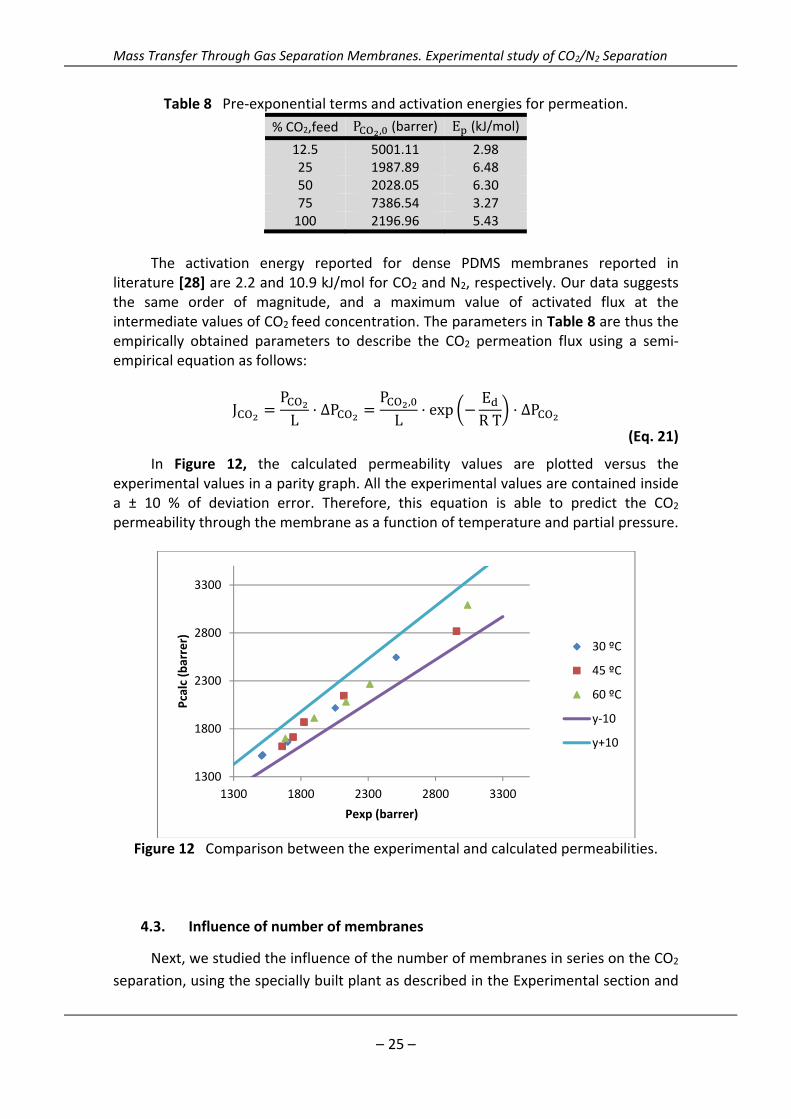
Table 8 Pre‐exponential terms and activation energies for permeation. .................... 25
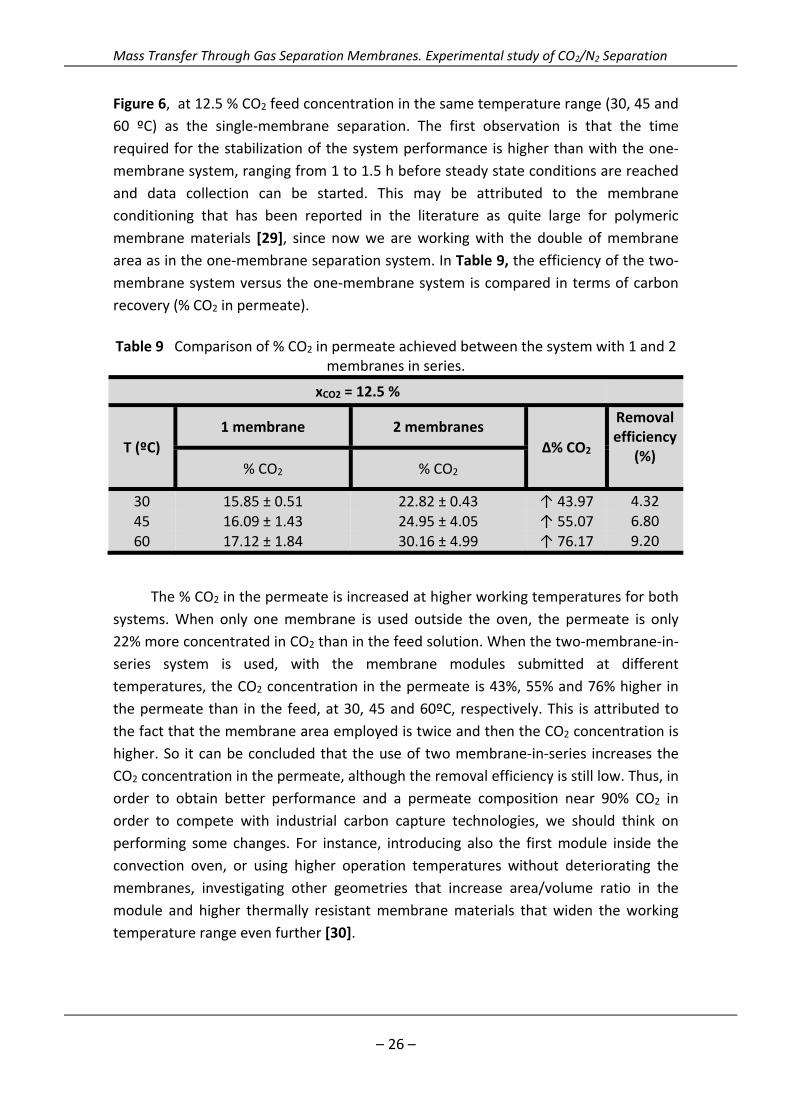
Table 9 Comparison of % CO2 in permeate achieved between the system with 1 and 2 membranes in series. ..................................................................................................... 26
Table 10 Summary of experiments .............................................................................. 33
Mass Transfer Through Gas Separation Membranes. Experimental study of CO2/N2 Separation
– 4 –
ABSTRACT
Due to the increased CO2 emissions to the atmosphere, carbon capture and
storage (CCS) is becoming an increasingly promising method as a greenhouse
mitigation option, where fossil fuel power plants have a critical role. The conventional
technology, absorption‐based capture, is energy‐intensive, and produces wastes due
to the solvent degradation, whereas membrane technology is expected to consume
less energy and do not produce waste streams. However, the economic feasibility is
limited by the transport properties of the membrane, the resistance, and the
membrane material. Many works have been reported in the last years regarding the
development of novel, more robust, membrane materials with potential application in
flue gas separation, and hybrid processes including a membrane unit have also been
reported. However, not many works have dealt with the performance of CO2/N2
mixtures experimentally. This work is focused on the study of the CO2/N2 separation
performance of a commercial membrane based on a non‐porous poly (dimethyl
siloxane) top layer on a macroporous support (PDMS, Pervap 4060, Sulzer), under the
influence of different variables such as feed concentration, temperature and number
of membrane modules in series. The permeability increases slightly with temperature
from 1,515 to 3,100 barrer, and %CO2 in permeate also increases with temperature
and feed concentration. A semi‐empirical equation has been developed to predict CO2
permeability as a function of temperature and feed concentration within 10 % error.
The CO2 concentration in the feed of 12.5 % has been selected to study experimentally
the performance of 2‐membrane‐in‐series and the CO2 recovery is enhanced up to 76
% at 60 ºC, compared with the 1‐membrane system.
Mass Transfer Through Gas Separation Membranes. Experimental study of CO2/N2 Separation
– 5 –
1. INTRODUCTION
1.1. Problem definition
Today the climate that provides the basis of our modern civilization and lifestyle
is relatively stable and benign. The economic growth in our society since the middle of
the past century has been directly related to an increased energy consumption. The
intense use of fossil energy represents the “vertebral column” or backbone of our
modern civilization and the global economy creating the anthropogenic contribution to
climate change. Arrhenius was the first scientist to recognize the role of CO2 in the
atmosphere [1, 2]. This leads to global warming and climate change, which have
several effects on humans and ecosystems such as the polar ice melting, the increase
in the sea level, extreme weather events or changes in migration cycles of some animal
species. The main contributor to the increased level of GHGs is CO2, which is mainly
released from the combustion of fossil fuels or hydrocarbon fuels where γ is the molar
ratio of air required in excess of stoichiometric oxygen required (Eq. 1) [3] and
although it can also be naturally released, this happens because almost all the energy
produced from carbon‐containing fuels is generated by directly burning fuels in air [1].
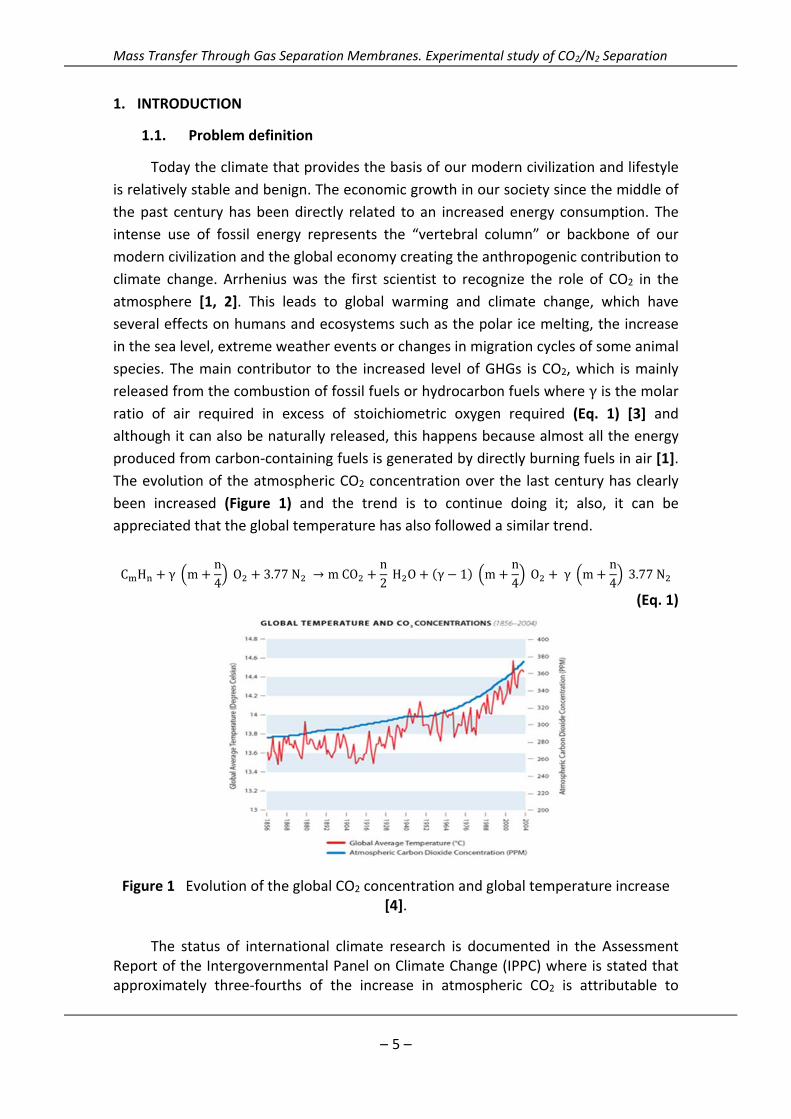
The evolution of the atmospheric CO2 concentration over the last century has clearly
been increased (Figure 1) and the trend is to continue doing it; also, it can be
appreciated that the global temperature has also followed a similar trend.
C H γ mn4O 3.77N → mCO
n2H O γ 1 m
n4O γ m
n43.77N
(Eq. 1)
Figure 1 Evolution of the global CO2 concentration and global temperature increase [4].
The status of international climate research is documented in the Assessment Report of the Intergovernmental Panel on Climate Change (IPPC) where is stated that approximately three‐fourths of the increase in atmospheric CO2 is attributable to
Mass Transfer Through Gas Separation Membranes. Experimental study of CO2/N2 Separation
– 6 –
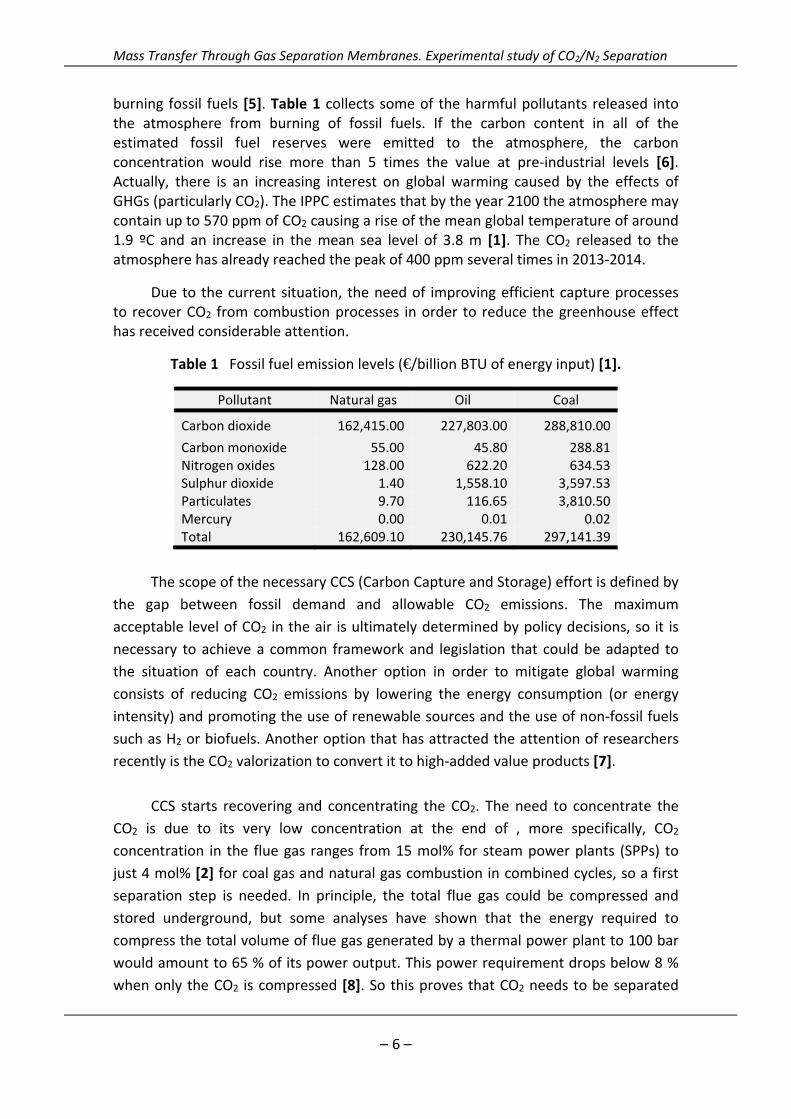
burning fossil fuels [5]. Table 1 collects some of the harmful pollutants released into the atmosphere from burning of fossil fuels. If the carbon content in all of the estimated fossil fuel reserves were emitted to the atmosphere, the carbon concentration would rise more than 5 times the value at pre‐industrial levels [6]. Actually, there is an increasing interest on global warming caused by the effects of GHGs (particularly CO2). The IPPC estimates that by the year 2100 the atmosphere may contain up to 570 ppm of CO2 causing a rise of the mean global temperature of around 1.9 ºC and an increase in the mean sea level of 3.8 m [1]. The CO2 released to the atmosphere has already reached the peak of 400 ppm several times in 2013‐2014.
Due to the current situation, the need of improving efficient capture processes to recover CO2 from combustion processes in order to reduce the greenhouse effect has received considerable attention.
Table 1 Fossil fuel emission levels (€/billion BTU of energy input) [1].
Pollutant Natural gas Oil Coal
Carbon dioxide 162,415.00 227,803.00 288,810.00
Carbon monoxide 55.00 45.80 288.81 Nitrogen oxides 128.00 622.20 634.53 Sulphur dioxide 1.40 1,558.10 3,597.53 Particulates 9.70 116.65 3,810.50 Mercury 0.00 0.01 0.02 Total 162,609.10 230,145.76 297,141.39
The scope of the necessary CCS (Carbon Capture and Storage) effort is defined by
the gap between fossil demand and allowable CO2 emissions. The maximum
acceptable level of CO2 in the air is ultimately determined by policy decisions, so it is
necessary to achieve a common framework and legislation that could be adapted to
the situation of each country. Another option in order to mitigate global warming
consists of reducing CO2 emissions by lowering the energy consumption (or energy
intensity) and promoting the use of renewable sources and the use of non‐fossil fuels
such as H2 or biofuels. Another option that has attracted the attention of researchers
recently is the CO2 valorization to convert it to high‐added value products [7].
CCS starts recovering and concentrating the CO2. The need to concentrate the
CO2 is due to its very low concentration at the end of , more specifically, CO2
concentration in the flue gas ranges from 15 mol% for steam power plants (SPPs) to
just 4 mol% [2] for coal gas and natural gas combustion in combined cycles, so a first
separation step is needed. In principle, the total flue gas could be compressed and
stored underground, but some analyses have shown that the energy required to
compress the total volume of flue gas generated by a thermal power plant to 100 bar
would amount to 65 % of its power output. This power requirement drops below 8 %
when only the CO2 is compressed [8]. So this proves that CO2 needs to be separated
Mass Transfer Through Gas Separation Membranes. Experimental study of CO2/N2 Separation
– 7 –
and then captured. Subsequently, CO2 has to be transported to a location where it can
be stored for at least hundreds of years or used. From a process engineering
viewpoint, the total CCS process can be divided into six stages [2]:
1. Potential power plant modifications (further flue gas cleaning, CO shift,
recirculation)
2. Potential subsequent CO2 cleaning (mainly denitrification and desulphurization)
3. Gas/gas separation (CO2/N2; O2/N2 ‐ CO2/H2O; CO2/H2)
4. CO2 compression (1 bar to 100 bar, liquefaction)
5. Further compression (e.g. 500 km of a pipeline with a pressure drop from 200
bar to 100 bar)
6. Potential further compression (up to 1,000 bar storage at significant depth)
Effective and efficient gas separation (3.) requires modifications of existing
power plants (1.). In the case of intolerably high impurity values in the separated CO2,
a subsequent CO2 cleaning step (2.) is necessary. The compression, in principle, may be
carried out in three steps: at the exit of power plant (4.), at locations along the pipeline
(5.) to overcome the pressure losses, and at the storage site (6.). It is important to
emphasize that the capture (separation and compression steps) of CO2 contributes 75
% to the overall CCS cost.
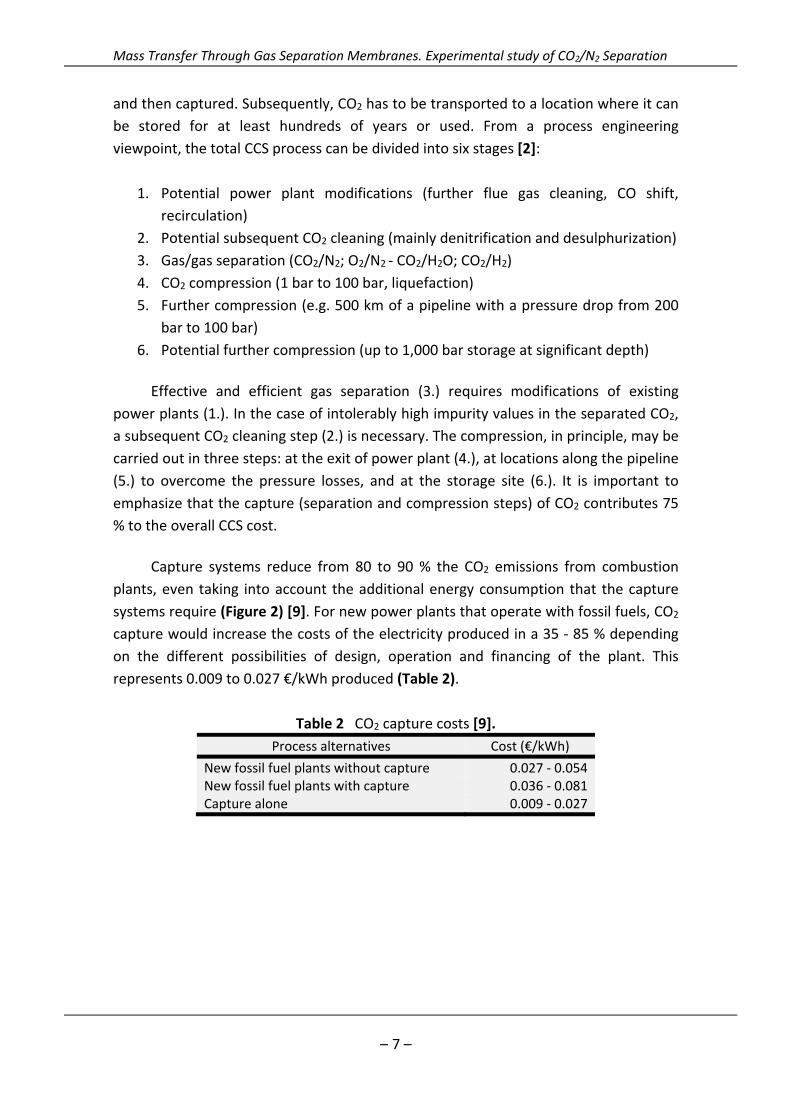
Capture systems reduce from 80 to 90 % the CO2 emissions from combustion
plants, even taking into account the additional energy consumption that the capture
systems require (Figure 2) [9]. For new power plants that operate with fossil fuels, CO2
capture would increase the costs of the electricity produced in a 35 ‐ 85 % depending
on the different possibilities of design, operation and financing of the plant. This
represents 0.009 to 0.027 €/kWh produced (Table 2).
Table 2 CO2 capture costs [9].
Process alternatives Cost (€/kWh)
New fossil fuel plants without capture 0.027 ‐ 0.054 New fossil fuel plants with capture 0.036 ‐ 0.081 Capture alone 0.009 ‐ 0.027
Mass Transfer Through Gas Separation Membranes. Experimental study of CO2/N2 Separation
– 8 –
Figure 2 CO2 capture and energy required [9].
The next step is the concentrated CO2 transport, except when the emission
source is located directly over the storage site. There are several ways of performing
this transport, but usually, concentrated CO2 streams can be transported safely
through high‐pressure pipelines.
So, once the CO2 is captured, compressed and transported to a final storage
location, it can be injected into a suitable storage (not necessarily underground, in fact,
oceans are not considered as underground storage) in order to confine it. Some
examples of different options are geological structures, saline aquifers, ocean
confinement or cavities created by dissolving salt.
Table 3 reflects the costs of the different storage possibilities:
Table 3 Storage cost [9].
Storage Cost (€/t CO2 injected)
Geological Storage (0.45 – 7.20) +
Control (0.09 ‐ 0.27) Saline formations
Depleted oil and gas reserves Ocean storage Transport by pipes + energy (5.40 – 27.86)
Today, there are several opportunities for the captured CO2: use as a secondary
product for producing some chemicals through the application of organic chemistry,
biofuels, or injecting the pure streams of CO2 captured into the underground for
enhanced oil recovery (EOR) or enhanced gas recovery (EGR), or production of urea,
for production of fertilizers and other products. Other uses include: horticulture,
refrigeration, food packaging, welding, beverages and extinguishing devices. But the
actual industrial use of the captured CO2 per year represents a very small amount
Mass Transfer Through Gas Separation Membranes. Experimental study of CO2/N2 Separation
– 9 –
(over 120 Mt/year) in comparison with global emissions from human activities (30,000
Mt/year) [9].
1.2. Carbon dioxide capture systems
As mentioned above, carbon capture is the most widely accepted method to
combat climate change. The main objective is to separate the CO2 produced up to
obtain a CO2 concentrated stream. Once this stream is obtained, we can proceed with
the compression step in order to transport the CO2 at the final storage point. From a
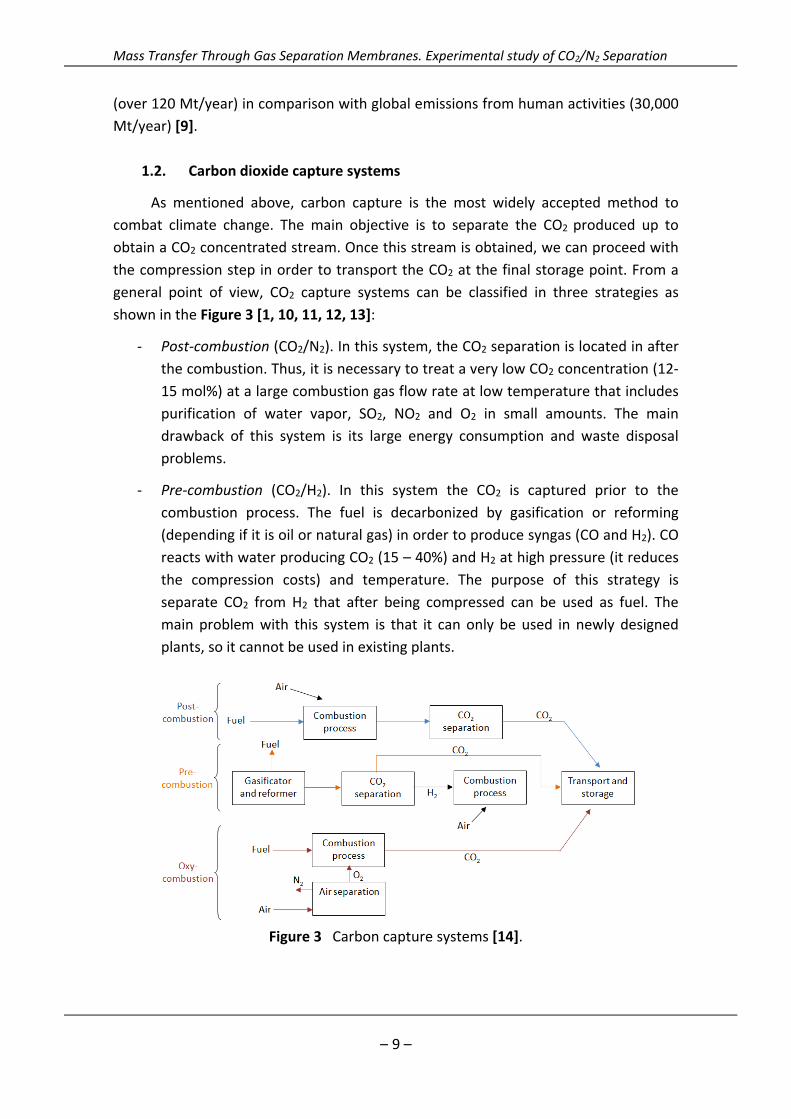
general point of view, CO2 capture systems can be classified in three strategies as
shown in the Figure 3 [1, 10, 11, 12, 13]:
‐ Post‐combustion (CO2/N2). In this system, the CO2 separation is located in after
the combustion. Thus, it is necessary to treat a very low CO2 concentration (12‐
15 mol%) at a large combustion gas flow rate at low temperature that includes
purification of water vapor, SO2, NO2 and O2 in small amounts. The main
drawback of this system is its large energy consumption and waste disposal
problems.
‐ Pre‐combustion (CO2/H2). In this system the CO2 is captured prior to the
combustion process. The fuel is decarbonized by gasification or reforming
(depending if it is oil or natural gas) in order to produce syngas (CO and H2). CO
reacts with water producing CO2 (15 – 40%) and H2 at high pressure (it reduces
the compression costs) and temperature. The purpose of this strategy is
separate CO2 from H2 that after being compressed can be used as fuel. The
main problem with this system is that it can only be used in newly designed
plants, so it cannot be used in existing plants.
Figure 3 Carbon capture systems [14].
Mass Transfer Through Gas Separation Membranes. Experimental study of CO2/N2 Separation
– 10 –
‐ Oxycombustion (O2/N2). This system acts directly over the combustion process
using O2 (higher than 95%) as oxidizer (by eliminating the N2 of the air) in order
to obtain mostly CO2 (over 75%) and H2O that can easily be separated by vapor
condensation. One of their problems is that needs an air separation unit at high
temperature which increases drastically the cost.
1.3. Different alternatives for CO2 separation in post‐combustion
There are many alternatives for performing the CO2 capture in post‐combustion
systems. The main alternatives are chemical solvent absorption, physical adsorption
and membrane separation. The first one is the chemical absorption by MEA
(monoethanolamine) scrubbing [15]. The flue gas pass through the CO2‐lean MEA
solution with high affinity for the acid gases (in the scrubber column) and is absorbed
by means of a chemical reaction. After this, it enters in the desorber where the CO2 is
released by warming up the MEA solution to 100 – 130 ºC.
The other main technology is the adsorption which basically uses solid materials
capable of adsorbing CO2 at high temperatures generally, and then, recovers it by
process of change in temperature or pressure (TSA and PSA processes, respectively).
The main adsorbents are: activated carbon, mesoporous materials, zeolites and
alumina. This technology is preferred for the pure‐CO2 stream obtained instead of for
the CO2 separation.
The gas separated is then cooled down to condense the water vapor. MEA
scrubbing is an exothermic process which is carried out at about 40 ‐ 50 ºC [16]. Low
temperature and high pressures favor the absorption process [17]. With this process a
CO2‐purity of about 80 to 96 % can be attained. The major drawback of this method is
the energy required for the absorbent regeneration (about 4 MJ/kg of CO2), and the
waste disposal problems, so the actual goal is to find chemical solvents that requires
less regeneration energy and are environmentally friendly [18].
Another main alternative that is arising, as potential competing technology are
CO2 separation membrane processes [19]. In comparison with chemical absorption,
CO2 membranes have the following advantages:
Modules can be used as add‐on equipment in power plants due to their
flexibility of modularity.
No regeneration energy is required.
No waste streams.
Wide range of materials that could allow working at higher temperature
avoiding the cooling costs.
Mass Transfer Through Gas Separation Membranes. Experimental study of CO2/N2 Separation
– 11 –
The main drawbacks are
Membranes can be plugged by impurities in the gas stream.
This technology has been proved in pilot plant scale.
The current commercial membranes are based on organic polymers that can be
damaged when operating at high temperatures.
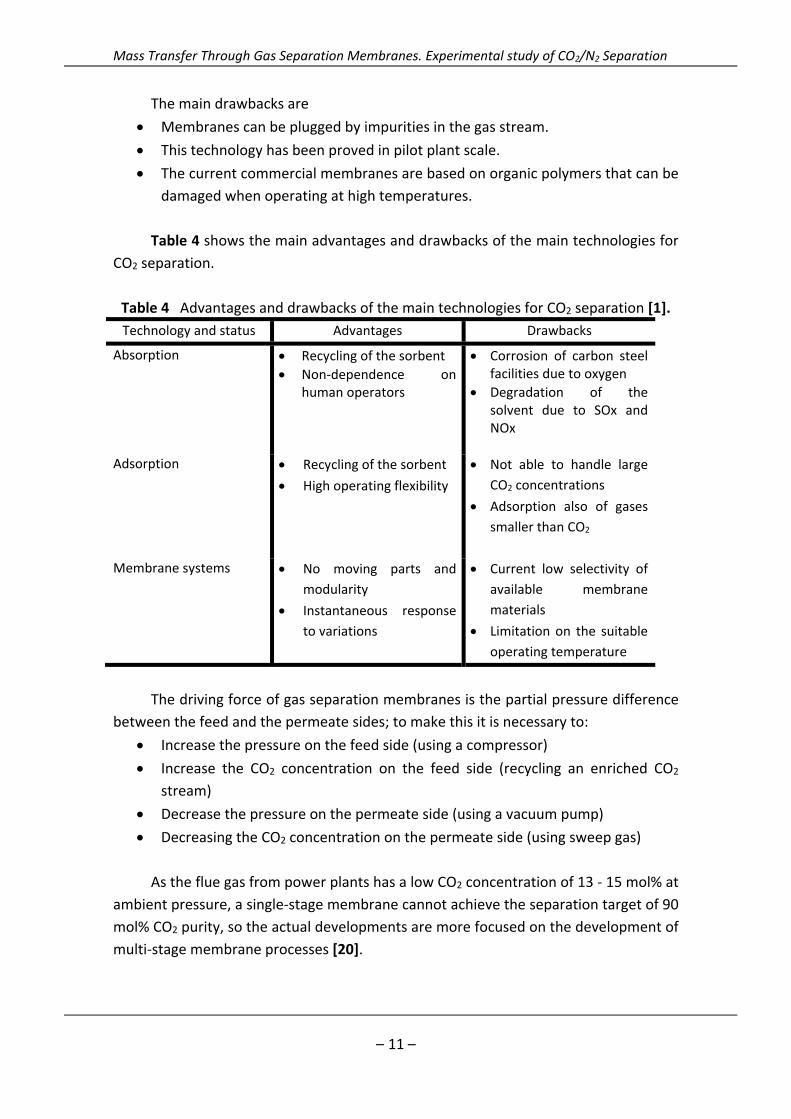
Table 4 shows the main advantages and drawbacks of the main technologies for
CO2 separation.
Table 4 Advantages and drawbacks of the main technologies for CO2 separation [1].
Technology and status Advantages Drawbacks
Absorption
Recycling of the sorbent
Non‐dependence on human operators
Corrosion of carbon steel facilities due to oxygen
Degradation of the solvent due to SOx and NOx
Adsorption
Recycling of the sorbent
High operating flexibility
Not able to handle large
CO2 concentrations
Adsorption also of gases
smaller than CO2
Membrane systems
No moving parts and
modularity
Instantaneous response
to variations
Current low selectivity of
available membrane
materials
Limitation on the suitable
operating temperature
The driving force of gas separation membranes is the partial pressure difference
between the feed and the permeate sides; to make this it is necessary to:
Increase the pressure on the feed side (using a compressor)
Increase the CO2 concentration on the feed side (recycling an enriched CO2
stream)
Decrease the pressure on the permeate side (using a vacuum pump)
Decreasing the CO2 concentration on the permeate side (using sweep gas)
As the flue gas from power plants has a low CO2 concentration of 13 ‐ 15 mol% at
ambient pressure, a single‐stage membrane cannot achieve the separation target of 90
mol% CO2 purity, so the actual developments are more focused on the development of
multi‐stage membrane processes [20].
Mass Transfer Through Gas Separation Membranes. Experimental study of CO2/N2 Separation
– 12 –
1.4. Membrane technology for gas separation
The application of membranes for gas separation is a fairly young technology
compared to the use of membranes for liquid separation. The first CO2 selective
membranes were composite membranes where a very thin nonporous layer with high
gas permeation rate (usually polysulfone or cellulose acetate) was placed on a support
structure for mechanical strength. This technology involves the separation of individual
gas component on the basis of the difference in their rates of permeation through a
thin membrane barrier. As a general rule, the driving force of membrane gas
separation is the difference in partial pressures between the feed and permeate sides.
It is, however, more correct to say that the driving force is the difference in chemical
potential thereby including the effect of temperature [21].
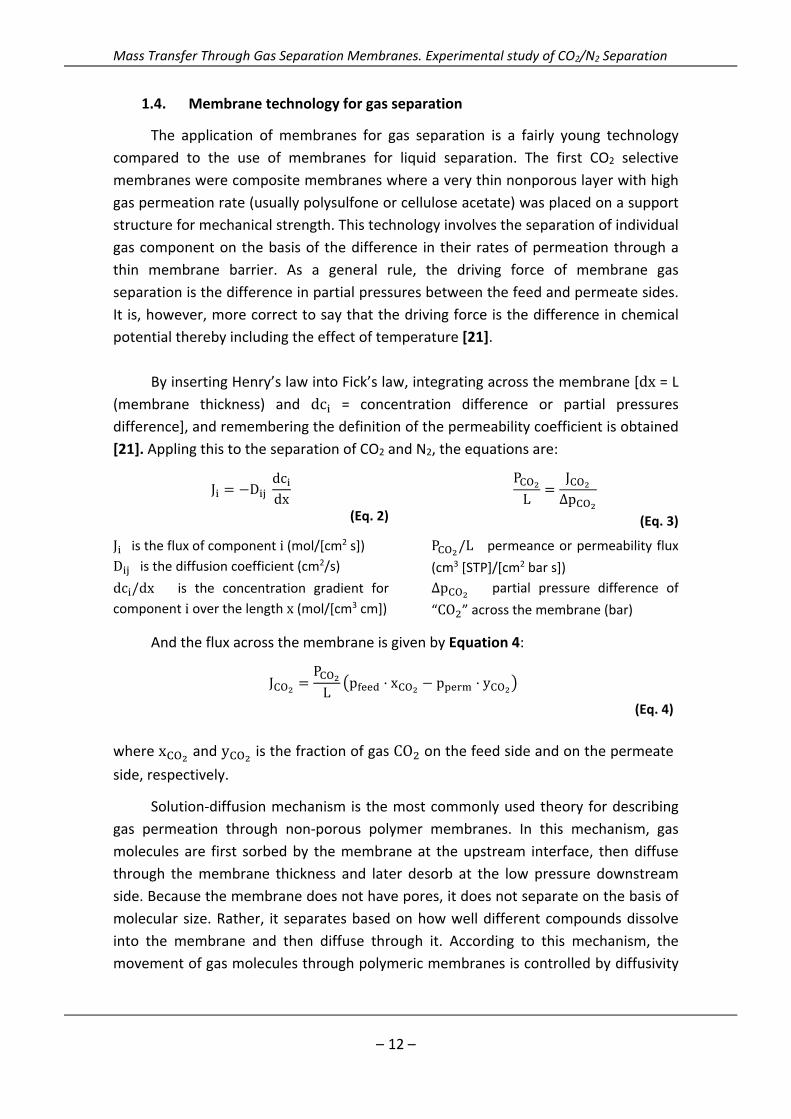
By inserting Henry’s law into Fick’s law, integrating across the membrane [dx = L (membrane thickness) and dc = concentration difference or partial pressures difference], and remembering the definition of the permeability coefficient is obtained
[21]. Appling this to the separation of CO2 and N2, the equations are:
J D dcdx
(Eq. 2)
P
L
J
∆p
(Eq. 3)
J is the flux of component i (mol/[cm2 s])
D is the diffusion coefficient (cm2/s)
dc /dx is the concentration gradient for component i over the length x (mol/[cm3 cm])
P /L permeance or permeability flux
(cm3 [STP]/[cm2 bar s])
∆p partial pressure difference of
“CO ” across the membrane (bar)
And the flux across the membrane is given by Equation 4:
JP
Lp x p y
(Eq. 4)
where x and y is the fraction of gas CO on the feed side and on the permeate
side, respectively.
Solution‐diffusion mechanism is the most commonly used theory for describing
gas permeation through non‐porous polymer membranes. In this mechanism, gas
molecules are first sorbed by the membrane at the upstream interface, then diffuse
through the membrane thickness and later desorb at the low pressure downstream
side. Because the membrane does not have pores, it does not separate on the basis of
molecular size. Rather, it separates based on how well different compounds dissolve
into the membrane and then diffuse through it. According to this mechanism, the
movement of gas molecules through polymeric membranes is controlled by diffusivity
Mass Transfer Through Gas Separation Membranes. Experimental study of CO2/N2 Separation
– 13 –
coefficient (D) and solubility coefficient (S). Diffusivity coefficient is a kinetic parameter
that measures the mobility of individual molecules through the polymer chains. The
solubility is a thermodynamic factor that provides information on the sorption uptake
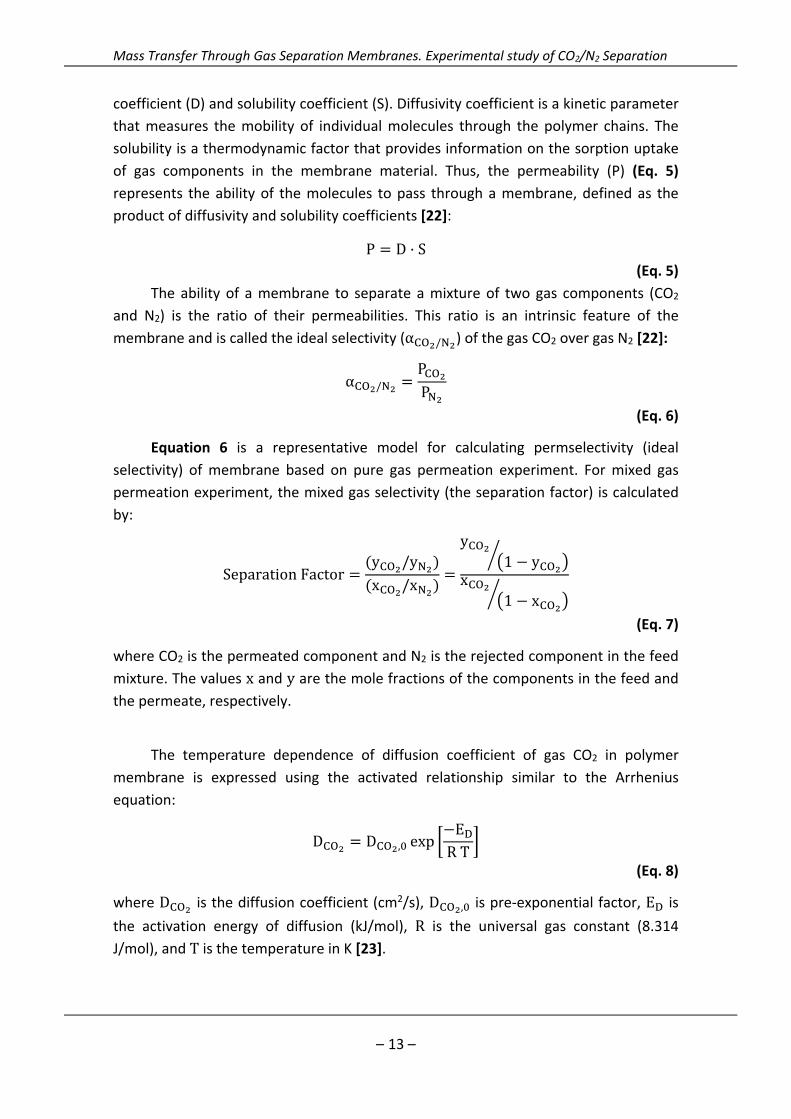
of gas components in the membrane material. Thus, the permeability (P) (Eq. 5)
represents the ability of the molecules to pass through a membrane, defined as the
product of diffusivity and solubility coefficients [22]:
P D S (Eq. 5)
The ability of a membrane to separate a mixture of two gas components (CO2
and N2) is the ratio of their permeabilities. This ratio is an intrinsic feature of the
membrane and is called the ideal selectivity (α / ) of the gas CO2 over gas N2 [22]:
α /PP
(Eq. 6)
Equation 6 is a representative model for calculating permselectivity (ideal
selectivity) of membrane based on pure gas permeation experiment. For mixed gas
permeation experiment, the mixed gas selectivity (the separation factor) is calculated
by:
SeparationFactory /yx /x
y1 y
x1 x
(Eq. 7)
where CO2 is the permeated component and N2 is the rejected component in the feed
mixture. The values x and y are the mole fractions of the components in the feed and
the permeate, respectively.
The temperature dependence of diffusion coefficient of gas CO2 in polymer
membrane is expressed using the activated relationship similar to the Arrhenius
equation:
D D , expERT
(Eq. 8)
where D is the diffusion coefficient (cm2/s), D , is pre‐exponential factor, E is
the activation energy of diffusion (kJ/mol), R is the universal gas constant (8.314 J/mol), and T is the temperature in K [23].
Mass Transfer Through Gas Separation Membranes. Experimental study of CO2/N2 Separation
– 14 –
Similarly, the solubility (S ) can be expressed as a function of temperature
using the van’t Hoff relationship:
S S , exp∆HRT
(Eq. 9)
S , is the pre‐exponential factor, ∆H is the enthalpy of solution of the gas. By
substituting Eq. 8 and Eq. 9 into Eq. 5, a temperature dependent model for
permeability of a penetrant CO2 can be written as:
P P , expERT
(Eq. 10)
and
E E ∆H
(Eq. 11)
where P , is the pre‐exponential factor and E is the activation energy of
permeation.
1.5. Commercial membranes for CO2 separation
In order to membranes be competitive with current carbon capture technologies
such as amine absorption, they should have high CO2 permeability and selectivity,
thermal and chemically stable, resistance to aging, plasticization and aging resistance
at high pressure, cost effective and easy to fabricate and handle [11].
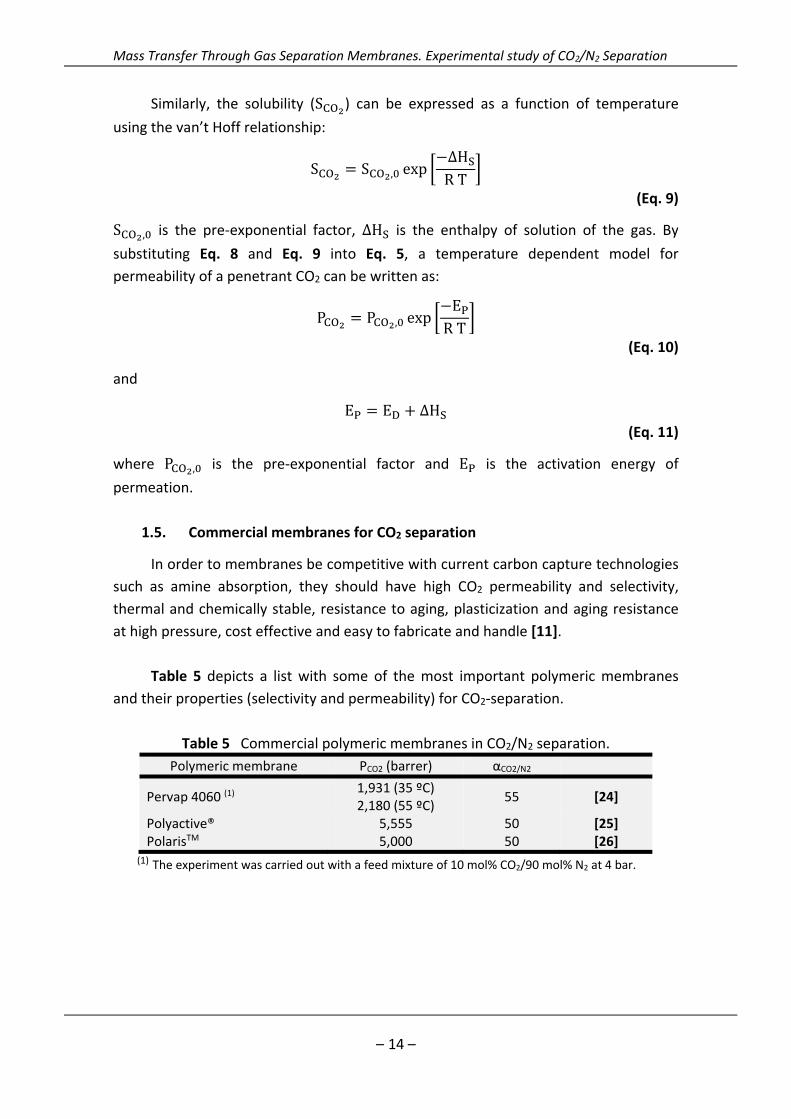
Table 5 depicts a list with some of the most important polymeric membranes
and their properties (selectivity and permeability) for CO2‐separation.
Table 5 Commercial polymeric membranes in CO2/N2 separation.
Polymeric membrane PCO2 (barrer) αCO2/N2
Pervap 4060 (1) 1,931 (35 ºC) 2,180 (55 ºC)
55 [24]
Polyactive® 5,555 50 [25] PolarisTM 5,000 50 [26]
(1) The experiment was carried out with a feed mixture of 10 mol% CO2/90 mol% N2 at 4 bar.
Mass Transfer Through Gas Separation Membranes. Experimental study of CO2/N2 Separation
– 15 –
2. OBJECTIVES
The objectives of this work are summarized as follows:
‐ Study of the CO2 transport mechanism through a PDMS commercial membrane.
Characterization of this membrane taking into account the influence of
temperature, feed concentration. Development of a semi‐empirical equation
describing the CO2 flux.
‐ Comparison of the CO2/N2 separation performance of one and two stage
membrane modules in series.
3. EXPERIMENTAL PROCESS
3.1. Membrane
The selected membrane is a hydrophobic non‐porous membrane PERVAPTM 4060
model manufactured by Sulzer Chemtech (Neunkirchen, Germany). This membrane
has been used for the removal of VOCs and aroma from aqueous solutions [27], and
the low hydrophobicity has proved to enhance the CO2 affinity of the selective layer
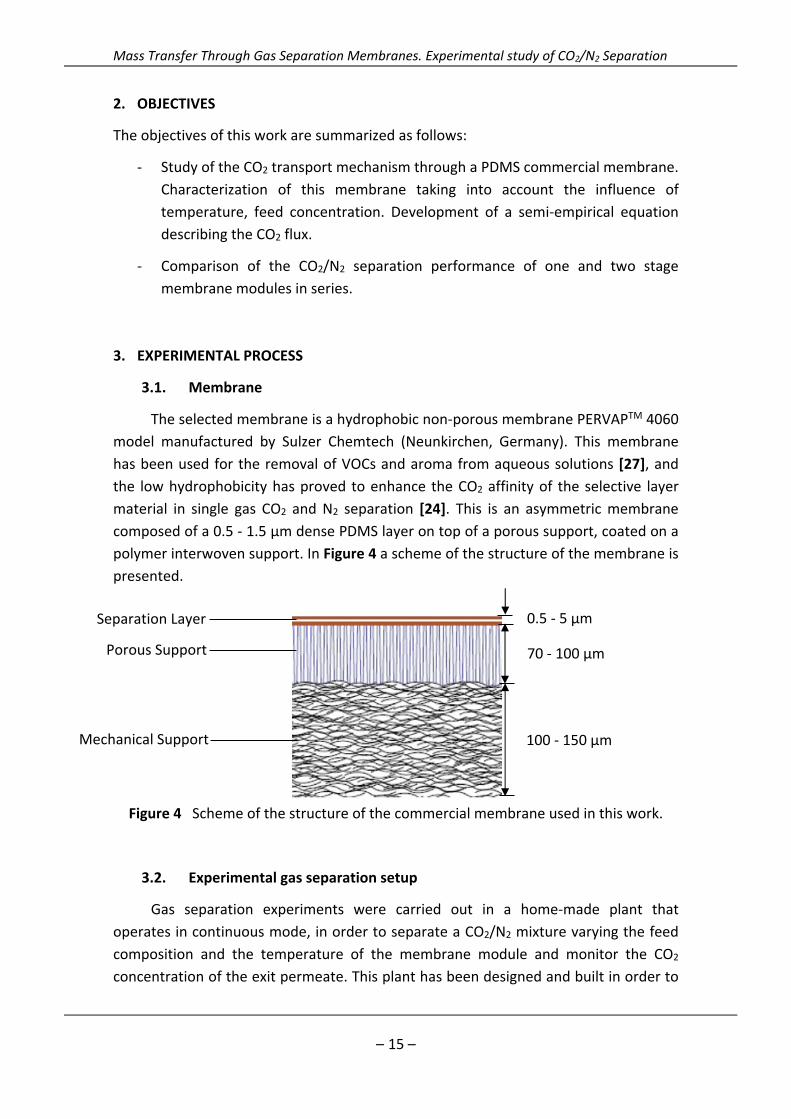
material in single gas CO2 and N2 separation [24]. This is an asymmetric membrane
composed of a 0.5 ‐ 1.5 μm dense PDMS layer on top of a porous support, coated on a
polymer interwoven support. In Figure 4 a scheme of the structure of the membrane is
presented.
Figure 4 Scheme of the structure of the commercial membrane used in this work.
3.2. Experimental gas separation setup
Gas separation experiments were carried out in a home‐made plant that
operates in continuous mode, in order to separate a CO2/N2 mixture varying the feed
composition and the temperature of the membrane module and monitor the CO2
concentration of the exit permeate. This plant has been designed and built in order to
Separation Layer
Porous Support
Mechanical Support
0.5 ‐ 5 μm
70 ‐ 100 μm
100 ‐ 150 μm
Mass Transfer Through Gas Separation Membranes. Experimental study of CO2/N2 Separation
– 16 –
work with either one or two membrane modules in series so that process conditions
and membranes can be varied differently in the two stages.
A single membrane module
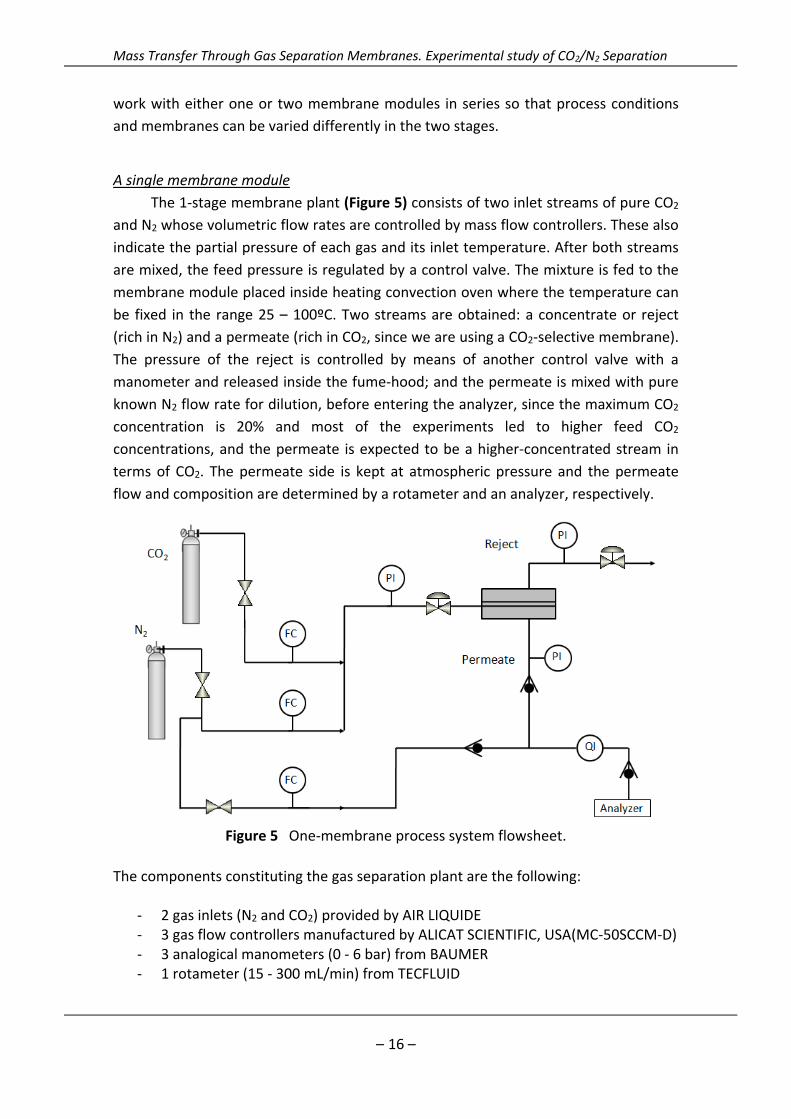
The 1‐stage membrane plant (Figure 5) consists of two inlet streams of pure CO2
and N2 whose volumetric flow rates are controlled by mass flow controllers. These also
indicate the partial pressure of each gas and its inlet temperature. After both streams
are mixed, the feed pressure is regulated by a control valve. The mixture is fed to the
membrane module placed inside heating convection oven where the temperature can
be fixed in the range 25 – 100ºC. Two streams are obtained: a concentrate or reject
(rich in N2) and a permeate (rich in CO2, since we are using a CO2‐selective membrane).
The pressure of the reject is controlled by means of another control valve with a
manometer and released inside the fume‐hood; and the permeate is mixed with pure
known N2 flow rate for dilution, before entering the analyzer, since the maximum CO2
concentration is 20% and most of the experiments led to higher feed CO2
concentrations, and the permeate is expected to be a higher‐concentrated stream in
terms of CO2. The permeate side is kept at atmospheric pressure and the permeate
flow and composition are determined by a rotameter and an analyzer, respectively.
Figure 5 One‐membrane process system flowsheet.
The components constituting the gas separation plant are the following:
‐ 2 gas inlets (N2 and CO2) provided by AIR LIQUIDE ‐ 3 gas flow controllers manufactured by ALICAT SCIENTIFIC, USA(MC‐50SCCM‐D) ‐ 3 analogical manometers (0 ‐ 6 bar) from BAUMER ‐ 1 rotameter (15 ‐ 300 mL/min) from TECFLUID
Mass Transfer Through Gas Separation Membranes. Experimental study of CO2/N2 Separation
– 17 –
‐ Several “code” and “T” connections from LLEGRIS ‐ PVDF tube of 8 mm of external diameter and 6 mm of internal diameter ‐ Stainless steel tubes of 1/8” diameter (inside the heater) ‐ 2 non‐return valves from LLEGRIS ‐ 4 O/C valves from EMTECHNIK ‐ 2 control valves from HAM‐LET ‐ 1 convection oven from MEMMERT (Memmert UNE 200) ‐ 1 CO2 gas analyzer from GEOTECH (G100)
Two membrane‐in‐series module
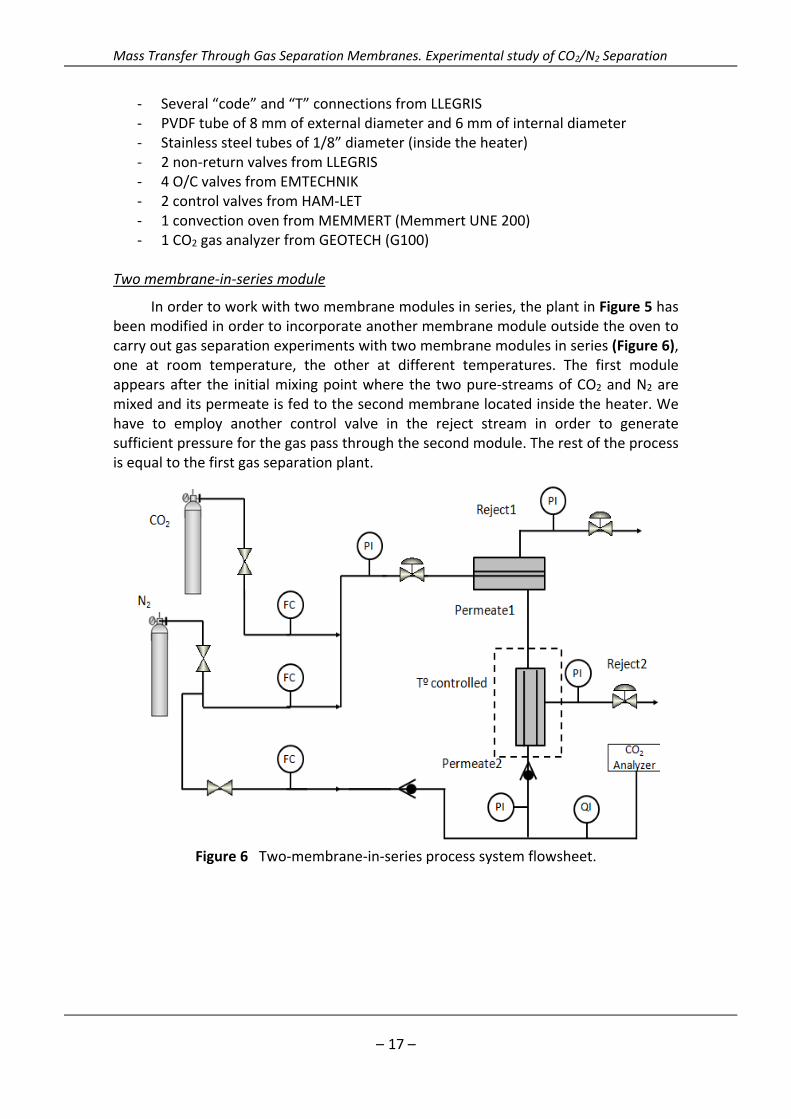
In order to work with two membrane modules in series, the plant in Figure 5 has been modified in order to incorporate another membrane module outside the oven to carry out gas separation experiments with two membrane modules in series (Figure 6), one at room temperature, the other at different temperatures. The first module appears after the initial mixing point where the two pure‐streams of CO2 and N2 are mixed and its permeate is fed to the second membrane located inside the heater. We have to employ another control valve in the reject stream in order to generate sufficient pressure for the gas pass through the second module. The rest of the process is equal to the first gas separation plant.
Figure 6 Two‐membrane‐in‐series process system flowsheet.
Mass Transfer Through Gas Separation Membranes. Experimental study of CO2/N2 Separation
– 18 –
3.3. Experimental procedure
In order to conduct gas separation experiments, we have to cut the membrane
and to measure its diameter (for obtaining the effective membrane area). Its thickness
is measured using a digital micrometer with a precision up to 0.001 mm (Mitutoyo
digimatic micrometer, IP 65). The membrane is introduced in the stainless steel
module and this is placed inside the heater. The membrane module consists of two
stainless steel pieces, pneumatically pressed each other on a Viton ring that seals the
membrane, with a cavity where the membrane was placed on a 316L SS macroporous
disk support of 20 μm nominal pore size (Mott Corp., USA). The effective permeation
area is 0.0016 m2 for each module.
In order to perform a typical experiment the following steps have to be followed:
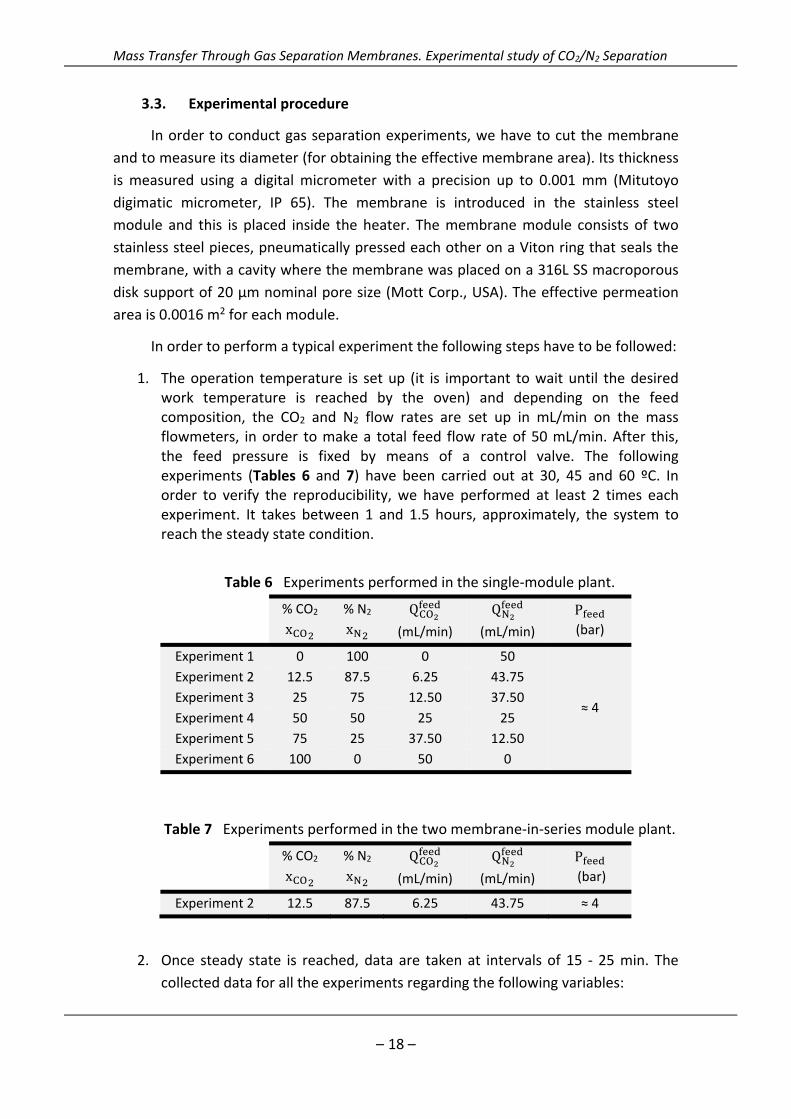
1. The operation temperature is set up (it is important to wait until the desired work temperature is reached by the oven) and depending on the feed composition, the CO2 and N2 flow rates are set up in mL/min on the mass flowmeters, in order to make a total feed flow rate of 50 mL/min. After this, the feed pressure is fixed by means of a control valve. The following experiments (Tables 6 and 7) have been carried out at 30, 45 and 60 ºC. In order to verify the reproducibility, we have performed at least 2 times each experiment. It takes between 1 and 1.5 hours, approximately, the system to reach the steady state condition.
Table 6 Experiments performed in the single‐module plant.
% CO2
x
% N2
x
Q
(mL/min)
Q
(mL/min)
P (bar)
Experiment 1 0 100 0 50
≈ 4
Experiment 2 12.5 87.5 6.25 43.75
Experiment 3 25 75 12.50 37.50
Experiment 4 50 50 25 25
Experiment 5 75 25 37.50 12.50
Experiment 6 100 0 50 0
Table 7 Experiments performed in the two membrane‐in‐series module plant.
% CO2
x
% N2
x
Q
(mL/min)
Q
(mL/min)
P (bar)
Experiment 2 12.5 87.5 6.25 43.75 ≈ 4
2. Once steady state is reached, data are taken at intervals of 15 ‐ 25 min. The
collected data for all the experiments regarding the following variables:
Mass Transfer Through Gas Separation Membranes. Experimental study of CO2/N2 Separation
– 19 –
Time (min)
T(ºC)
Q
(mL/min)
P
(psia)
Q
(psia)
P
(psia)
P
(bar)
Q
(mL/min)
P
(bar)
P
(bar)
% CO2 from
the analyzer
Q
(mL/min)
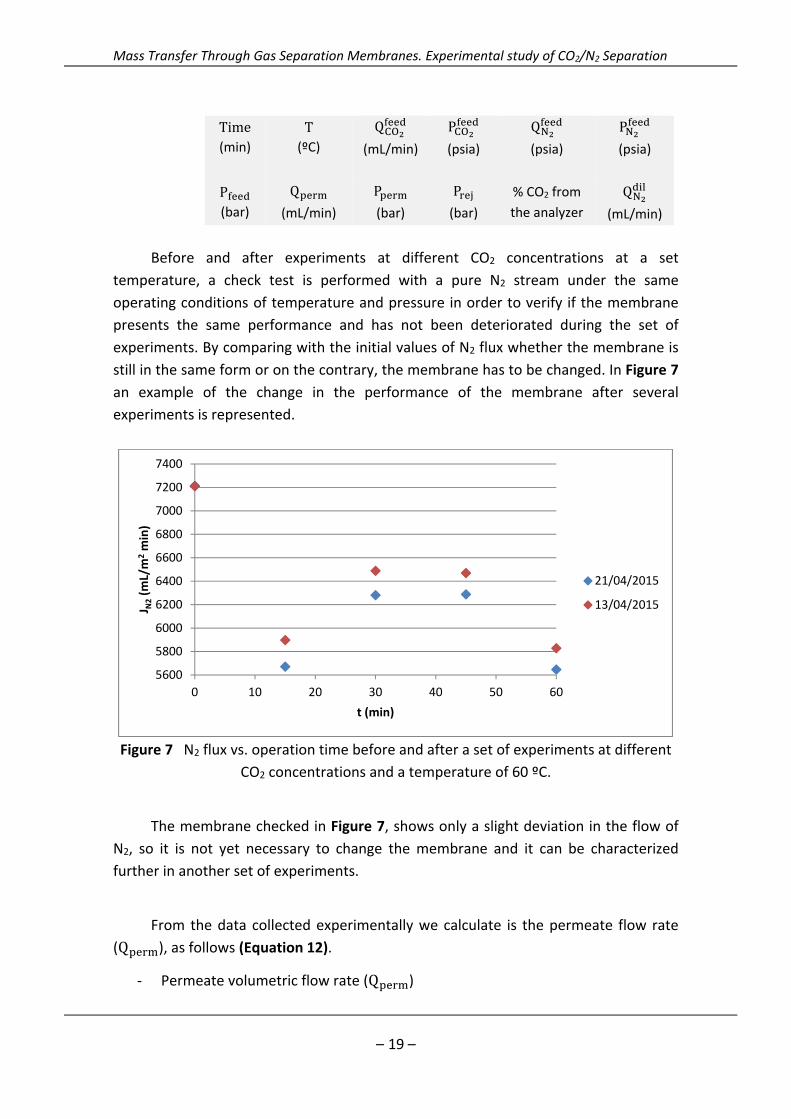
Before and after experiments at different CO2 concentrations at a set
temperature, a check test is performed with a pure N2 stream under the same
operating conditions of temperature and pressure in order to verify if the membrane
presents the same performance and has not been deteriorated during the set of
experiments. By comparing with the initial values of N2 flux whether the membrane is
still in the same form or on the contrary, the membrane has to be changed. In Figure 7
an example of the change in the performance of the membrane after several
experiments is represented.
Figure 7 N2 flux vs. operation time before and after a set of experiments at different
CO2 concentrations and a temperature of 60 ºC.
The membrane checked in Figure 7, shows only a slight deviation in the flow of
N2, so it is not yet necessary to change the membrane and it can be characterized
further in another set of experiments.
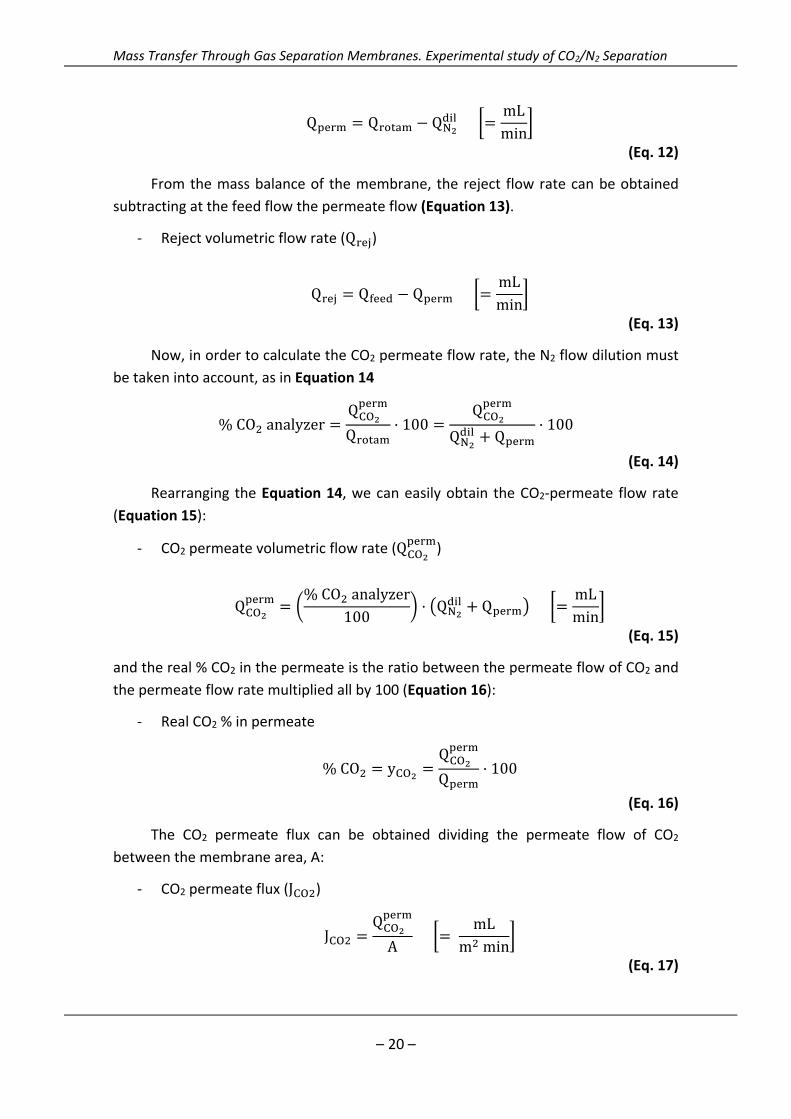
From the data collected experimentally we calculate is the permeate flow rate
(Q ), as follows (Equation 12).
‐ Permeate volumetric flow rate (Q )
5600
5800
6000
6200
6400
6600
6800
7000
7200
7400
0 10 20 30 40 50 60
J N2(m
L/m
2min)
t (min)
21/04/2015
13/04/2015
Mass Transfer Through Gas Separation Membranes. Experimental study of CO2/N2 Separation
– 20 –
Q Q Q mLmin
(Eq. 12)
From the mass balance of the membrane, the reject flow rate can be obtained
subtracting at the feed flow the permeate flow (Equation 13).
‐ Reject volumetric flow rate (Q )
Q Q Q mLmin
(Eq. 13)
Now, in order to calculate the CO2 permeate flow rate, the N2 flow dilution must
be taken into account, as in Equation 14
%CO analyzerQ
Q100
Q
Q Q100
(Eq. 14)
Rearranging the Equation 14, we can easily obtain the CO2‐permeate flow rate
(Equation 15):
‐ CO2 permeate volumetric flow rate (Q )
Q%CO analyzer
100Q Q
mLmin
(Eq. 15)
and the real % CO2 in the permeate is the ratio between the permeate flow of CO2 and
the permeate flow rate multiplied all by 100 (Equation 16):
‐ Real CO2 % in permeate
%CO yQ
Q100
(Eq. 16)
The CO2 permeate flux can be obtained dividing the permeate flow of CO2
between the membrane area, A:
‐ CO2 permeate flux (J )
JQ
A
mLm min
(Eq. 17)
Mass Transfer Through Gas Separation Membranes. Experimental study of CO2/N2 Separation
– 21 –
In order to obtain the CO2 permeability, we need to calculate the CO2 partial
pressure difference (in bar) as the difference between the partial CO2‐pressure in the
feed side and the partial CO2‐pressure in the permeate side as appeared in Equation 4.
The separation factor of the membrane can be calculated as follows shown in
Equation 7.
And the CO2‐permeability through the membrane is calculated by following the
Equation 3.
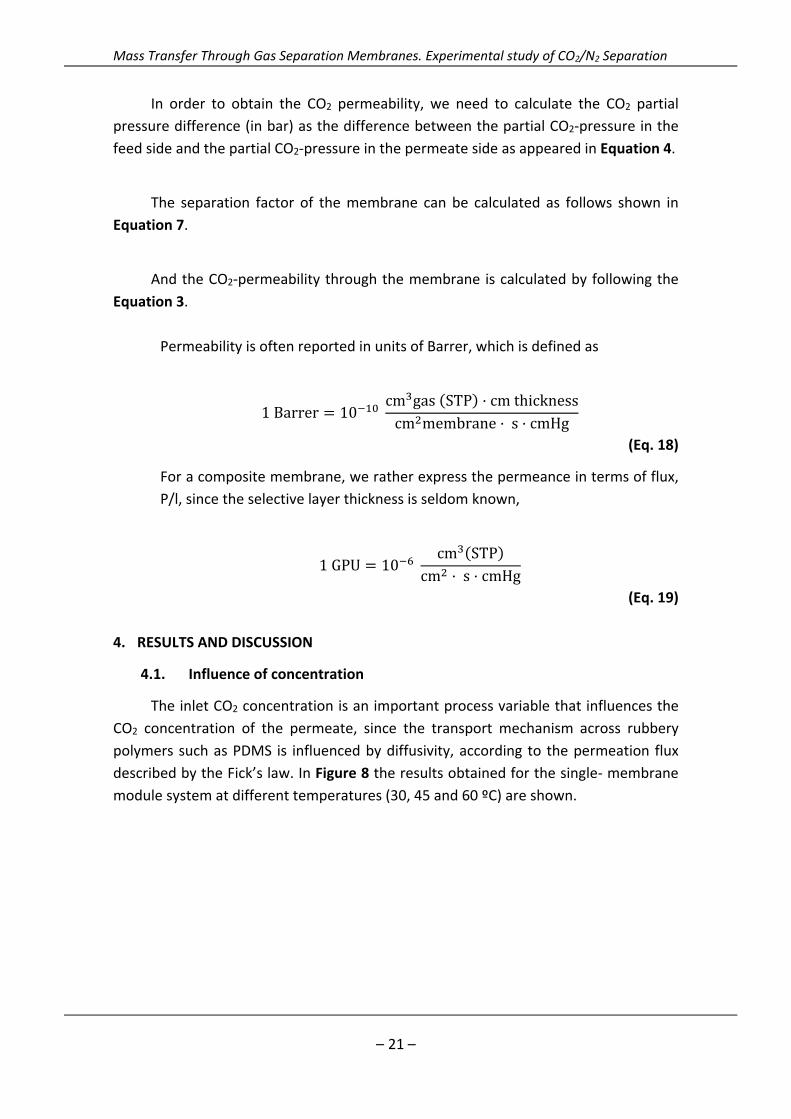
Permeability is often reported in units of Barrer, which is defined as
1Barrer 10 cm gas STP cmthicknesscm membrane s cmHg
(Eq. 18)
For a composite membrane, we rather express the permeance in terms of flux,
P/l, since the selective layer thickness is seldom known,
1GPU 10 cm STP
cm s cmHg
(Eq. 19)
4. RESULTS AND DISCUSSION
4.1. Influence of concentration
The inlet CO2 concentration is an important process variable that influences the
CO2 concentration of the permeate, since the transport mechanism across rubbery
polymers such as PDMS is influenced by diffusivity, according to the permeation flux
described by the Fick’s law. In Figure 8 the results obtained for the single‐ membrane
module system at different temperatures (30, 45 and 60 ºC) are shown.
Mass Transfer Through Gas Separation Membranes. Experimental study of CO2/N2 Separation
– 22 –
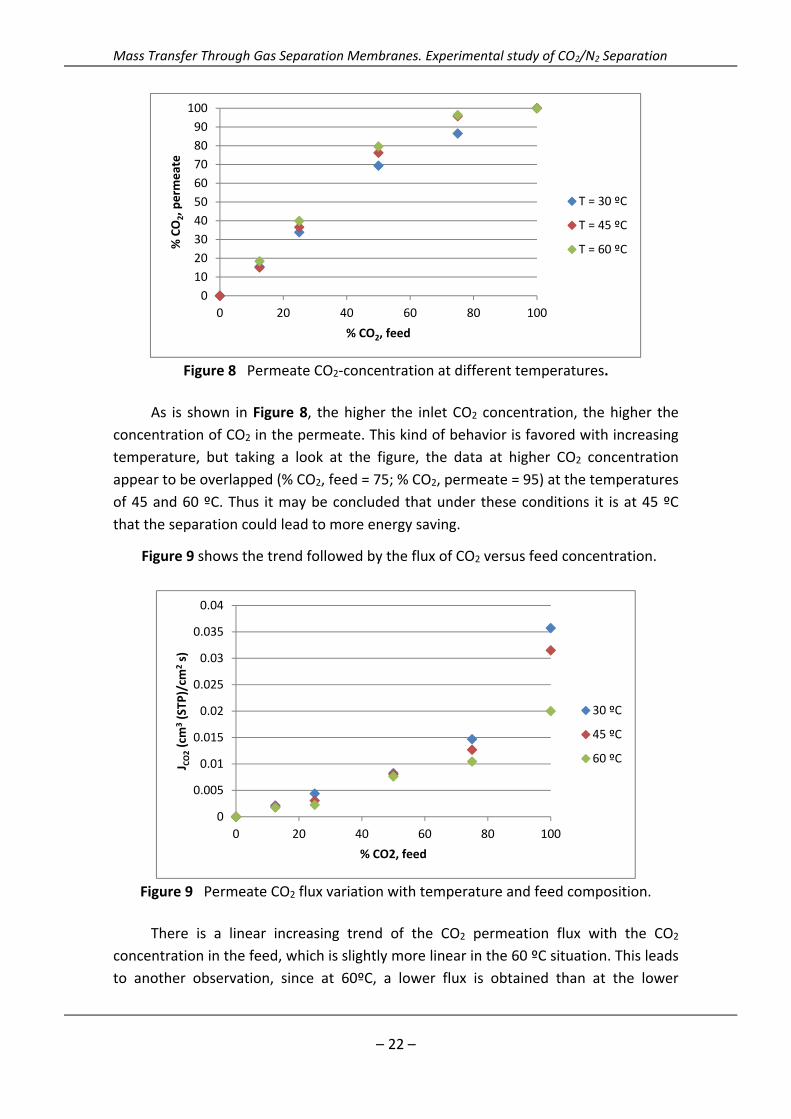
Figure 8 Permeate CO2‐concentration at different temperatures.
As is shown in Figure 8, the higher the inlet CO2 concentration, the higher the
concentration of CO2 in the permeate. This kind of behavior is favored with increasing
temperature, but taking a look at the figure, the data at higher CO2 concentration
appear to be overlapped (% CO2, feed = 75; % CO2, permeate = 95) at the temperatures
of 45 and 60 ºC. Thus it may be concluded that under these conditions it is at 45 ºC
that the separation could lead to more energy saving.
Figure 9 shows the trend followed by the flux of CO2 versus feed concentration.
Figure 9 Permeate CO2 flux variation with temperature and feed composition.
There is a linear increasing trend of the CO2 permeation flux with the CO2
concentration in the feed, which is slightly more linear in the 60 ºC situation. This leads
to another observation, since at 60ºC, a lower flux is obtained than at the lower
0
10
20
30
40
50
60
70
80
90
100
0 20 40 60 80 100
% CO
2, p
erm
eate
% CO2, feed
T = 30 ºC
T = 45 ºC
T = 60 ºC
0
0.005
0.01
0.015
0.02
0.025
0.03
0.035
0.04
0 20 40 60 80 100
J CO2(cm
3(STP
)/cm
2s)
% CO2, feed
30 ºC
45 ºC
60 ºC
Mass Transfer Through Gas Separation Membranes. Experimental study of CO2/N2 Separation
– 23 –
temperatures, which does not have physical significance and therefore can be
attributed to some experimental error or to the rapid deterioration of the PDMS
membrane at higher temperatures. In all the cases, we can take as conclusion that the
temperature does not affect significantly the separation process.
4.2. Influence of temperature
In order to determine the influence of the temperature on the CO2 separation
process we have observed the variation of the CO2‐permeability expressed in barrer
and the % CO2 obtained in the permeate for each temperature (30, 45 and 60 ºC).
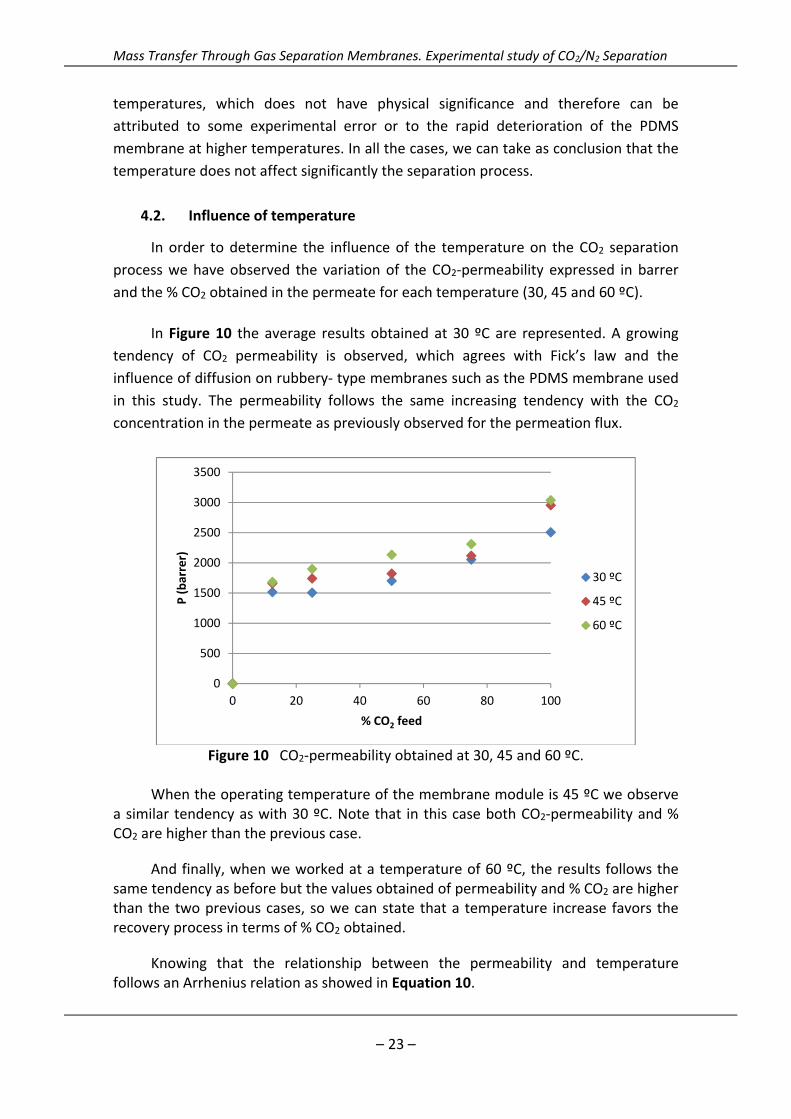
In Figure 10 the average results obtained at 30 ºC are represented. A growing
tendency of CO2 permeability is observed, which agrees with Fick’s law and the
influence of diffusion on rubbery‐ type membranes such as the PDMS membrane used
in this study. The permeability follows the same increasing tendency with the CO2
concentration in the permeate as previously observed for the permeation flux.
Figure 10 CO2‐permeability obtained at 30, 45 and 60 ºC.
When the operating temperature of the membrane module is 45 ºC we observe
a similar tendency as with 30 ºC. Note that in this case both CO2‐permeability and % CO2 are higher than the previous case.
And finally, when we worked at a temperature of 60 ºC, the results follows the same tendency as before but the values obtained of permeability and % CO2 are higher than the two previous cases, so we can state that a temperature increase favors the recovery process in terms of % CO2 obtained.
Knowing that the relationship between the permeability and temperature follows an Arrhenius relation as showed in Equation 10.
0
500
1000
1500
2000
2500
3000
3500
0 20 40 60 80 100
P (barrer)
% CO2 feed
30 ºC
45 ºC
60 ºC
Mass Transfer Through Gas Separation Membranes. Experimental study of CO2/N2 Separation
– 24 –
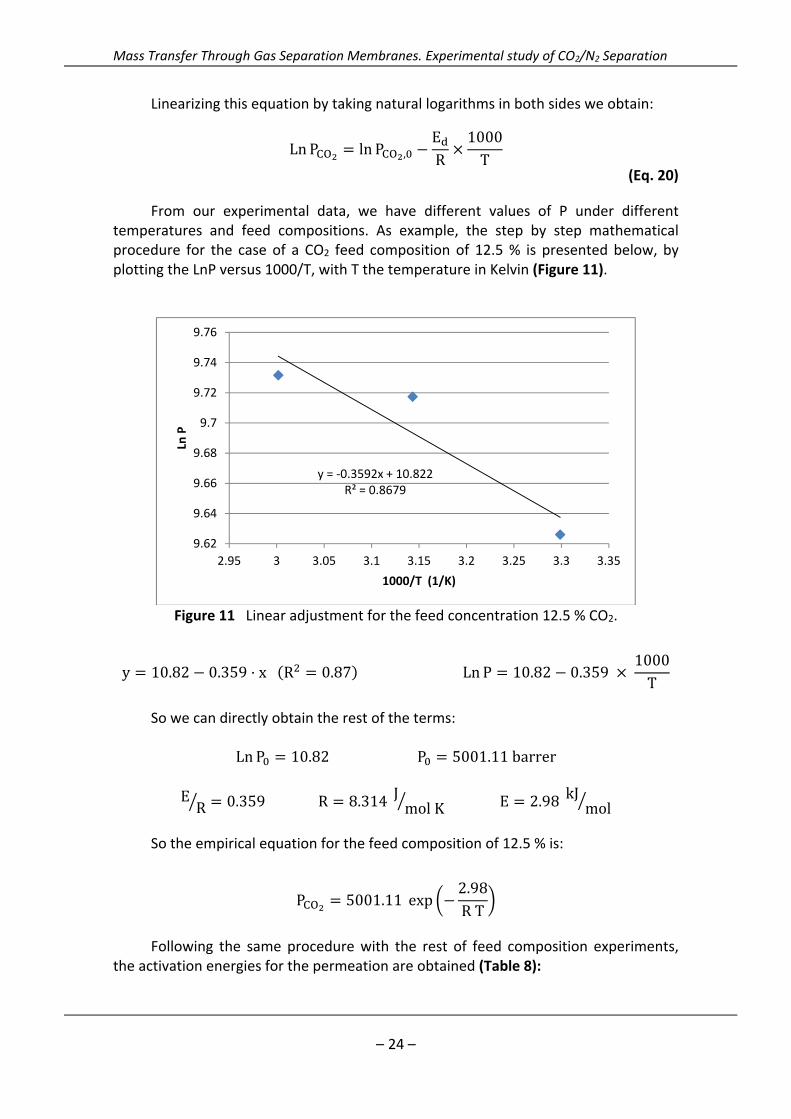
Linearizing this equation by taking natural logarithms in both sides we obtain:
LnP ln P ,ER
1000T
(Eq. 20)
From our experimental data, we have different values of P under different temperatures and feed compositions. As example, the step by step mathematical procedure for the case of a CO2 feed composition of 12.5 % is presented below, by plotting the LnP versus 1000/T, with T the temperature in Kelvin (Figure 11).
Figure 11 Linear adjustment for the feed concentration 12.5 % CO2.
y 10.82 0.359 x R 0.87 Ln P 10.82 0.359 1000T
So we can directly obtain the rest of the terms:
LnP 10.82P 5001.11barrer
ER 0.359R 8.314 J molK E 2.98 kJ mol
So the empirical equation for the feed composition of 12.5 % is:
P 5001.11 exp2.98RT
Following the same procedure with the rest of feed composition experiments,
the activation energies for the permeation are obtained (Table 8):
y = ‐0.3592x + 10.822R² = 0.8679
9.62
9.64
9.66
9.68
9.7
9.72
9.74
9.76
2.95 3 3.05 3.1 3.15 3.2 3.25 3.3 3.35
Ln P
1000/T (1/K)
Mass Transfer Through Gas Separation Membranes. Experimental study of CO2/N2 Separation
– 25 –
Table 8 Pre‐exponential terms and activation energies for permeation.
% CO2,feed P , (barrer) E (kJ/mol)
12.5 5001.11 2.98 25 1987.89 6.48 50 2028.05 6.30 75 7386.54 3.27 100 2196.96 5.43
The activation energy reported for dense PDMS membranes reported in
literature [28] are 2.2 and 10.9 kJ/mol for CO2 and N2, respectively. Our data suggests the same order of magnitude, and a maximum value of activated flux at the intermediate values of CO2 feed concentration. The parameters in Table 8 are thus the empirically obtained parameters to describe the CO2 permeation flux using a semi‐empirical equation as follows:
JPL
∆PP ,
Lexp
ERT
∆P
(Eq. 21)
In Figure 12, the calculated permeability values are plotted versus the experimental values in a parity graph. All the experimental values are contained inside a ± 10 % of deviation error. Therefore, this equation is able to predict the CO2 permeability through the membrane as a function of temperature and partial pressure.
Figure 12 Comparison between the experimental and calculated permeabilities.
4.3. Influence of number of membranes
Next, we studied the influence of the number of membranes in series on the CO2
separation, using the specially built plant as described in the Experimental section and
1300
1800
2300
2800
3300
1300 1800 2300 2800 3300
Pcalc (barrer)
Pexp (barrer)
30 ºC
45 ºC
60 ºC
y‐10
y+10
Mass Transfer Through Gas Separation Membranes. Experimental study of CO2/N2 Separation
– 26 –
Figure 6, at 12.5 % CO2 feed concentration in the same temperature range (30, 45 and
60 ºC) as the single‐membrane separation. The first observation is that the time
required for the stabilization of the system performance is higher than with the one‐
membrane system, ranging from 1 to 1.5 h before steady state conditions are reached
and data collection can be started. This may be attributed to the membrane
conditioning that has been reported in the literature as quite large for polymeric
membrane materials [29], since now we are working with the double of membrane
area as in the one‐membrane separation system. In Table 9, the efficiency of the two‐
membrane system versus the one‐membrane system is compared in terms of carbon
recovery (% CO2 in permeate).
Table 9 Comparison of % CO2 in permeate achieved between the system with 1 and 2 membranes in series.
xCO2 = 12.5 %
T (ºC)
1 membrane 2 membranes
∆% CO2
Removal efficiency
(%) % CO2 % CO2
30 15.85 ± 0.51 22.82 ± 0.43 ↑ 43.97 4.32
45 16.09 ± 1.43 24.95 ± 4.05 ↑ 55.07 6.80
60 17.12 ± 1.84 30.16 ± 4.99 ↑ 76.17 9.20
The % CO2 in the permeate is increased at higher working temperatures for both
systems. When only one membrane is used outside the oven, the permeate is only
22% more concentrated in CO2 than in the feed solution. When the two‐membrane‐in‐
series system is used, with the membrane modules submitted at different
temperatures, the CO2 concentration in the permeate is 43%, 55% and 76% higher in
the permeate than in the feed, at 30, 45 and 60ºC, respectively. This is attributed to
the fact that the membrane area employed is twice and then the CO2 concentration is
higher. So it can be concluded that the use of two membrane‐in‐series increases the
CO2 concentration in the permeate, although the removal efficiency is still low. Thus, in
order to obtain better performance and a permeate composition near 90% CO2 in
order to compete with industrial carbon capture technologies, we should think on
performing some changes. For instance, introducing also the first module inside the
convection oven, or using higher operation temperatures without deteriorating the
membranes, investigating other geometries that increase area/volume ratio in the
module and higher thermally resistant membrane materials that widen the working
temperature range even further [30].
Mass Transfer Through Gas Separation Membranes. Experimental study of CO2/N2 Separation
– 27 –
5. CONCLUSIONS
The capture of CO2 in post‐combustion processes using membrane technology
could have importance in the future if the technological and economical feasibility are
assessed. In this work, it has been studied the separation of a carbon dioxide/nitrogen
mixtures at different feed compositions and temperatures. The main conclusions are
that the temperature slightly favors the CO2 recovery, since higher concentration of
carbon dioxide in the permeate are achieved at increasing temperature; the
permeability also increased with rising temperature. The experiments performed with
the two membrane‐in‐series set up built in this work show that the carbon dioxide
concentration in the permeate is between 44% and 76% higher than the values
obtained with the single membrane system at 30 ºC and 60 ºC, respectively.
Mass Transfer Through Gas Separation Membranes. Experimental study of CO2/N2 Separation
– 28 –
6. REFERENCES
[1] Olajire, A. 2010. CO2 capture and separation technologies for end‐of‐pipe applications ‐ A review. Energy, 35, pp. 2610‐2628.
[2] Stolten, D. and Scherer, V. 2011. Efficient Carbon Capture for Coal Power Plants. 619pp. Wiley‐VCH: Weinheim, Germany.
[3] Wang, S. and Han, X. 2012. Application of Polymeric Membrane in CO2 Capture from Post Combustion. Advances in Chemical Engineering and Science, 2(3), pp. 336‐341.
[4] LiveSmart BC – Why the Climate is Changing. http://www.livesmartbc.ca/learn/change.html (accessed on 10/07/2015)
[5] Climate Change 2007, Synthesis Report, IPCC, 2007. http://www.ipcc.ch/pdf/assessment‐report/ar4/syr/ar4_syr_full_report.pdf (accessed on 08/07/2015)
[6] Natural Gas 1998, Issues and Trends. Energy Information Administration (EIA), April 1998. http://www.eia.doe.gov/oil_gas/natural_gas/analysis_publications/ natural_gas_1998_issues_and_trends/it98.html (accessed on 09/07/2015)
[7] Álvarez Guerra, M., Albo, J., Álvarez Guerra, E., Irabien, A. 2015.Ionic liquids in the electrochemical valorisation of CO2. Energy and Environmental Science, DOI: 10.1039/c5ee01486g.
[8] European Workshop. CO2: From Waste to Value, Report from the Workshop, Brussels, 2011. https://ec.europa.eu/research/industrial_technologies/pdf/co2‐workshop‐30032011_en.pdf (accessed on 10/07/2015)
[9] Herzog, H. Economics. In Workshop on Carbon Sequestration Science, May 2001. http://www.netl.doe.gov/publications/proceedings/01/carbon_seq_wksp/herzog_eco.pdf (accesses on 10/07/2015)
[10] IPCC Carbon Dioxide Capture and Storage: Technical Summary, 2005. http://arch.rivm.nl/env/int/ipcc/pages_media/SRCCS‐final/SRCCS_TechnicalSummary.pdf (accessed on 10/06/2015)
[11] Favre, E. 2007. Carbon dioxide recovery from post‐combustion processes: Can gas permeation membranes compete with absorption?. Journal of Membrane Science, 294, pp. 50‐59,
Mass Transfer Through Gas Separation Membranes. Experimental study of CO2/N2 Separation
– 29 –
[12] Brunetti, A., Scura, F., Barbieri, G., Drioli, E. 2010. Membrane technologies for
CO2 separation. Journal of Membrane Science, 359, pp. 115‐125,
[13] Santos, E. Carbon dioxide separation by means of supported ionic liquid membranes. PhD thesis, University of Cantabria, Santander, 2014, No. pages.
[14] Ramasubramanian, K., Zhao, Y., Ho, Winston. W.S. 2013. CO2 capture and H2 purification: prospects for CO2‐selective membrane processes. AIChE Journal, 59 (4), pp. 1033‐1045.
[15] PUCRS | CEPAC. What is Carbon Sequestration?. http://www.pucrs.br/cepac/index.php?p=sequestro_carbono (accessed on 10/07/2015)
[16] Zhao, L.; Riensche, E.; Blum, L.; Stolten, D. 2011. How gas separation membrane competes with chemical absorption in post‐combustion capture. Energy Procedia, , 4, pp. 629‐636.
[17] Kohl, A. and Nielsen, R. 1997. Miscellaneous gas purification techniques, in:
Gas Purification, Chapter 16, pp. 1296‐1373, 5th edn., Gulf Publishing:Houston,
TX.
[18] Feron, P.H.M. 2009. The potential for improvement of the energy performance
of pulverized coal fired power stations with post‐combustion capture of carbon dioxide. Energy Procedia, 1, pp. 1067‐1074.
[19] Favre, E., 2011. Membrane processes and postcombustion carbon dioxide capture: challenges and prospects. Chemical Engineering Journal, , 171, pp. 782‐793.
[20] Zhao, L., Riensche, E., Menzer, R., Blum, L., and Stolten, D. 2008. A parametric study of CO2/N2 gas separation membrane processes for post‐combustion capture. Journal of Membrane Science, 325, pp. 284‐294.
[21] Hägg, M., 2009. Membranes in gas separation, in: Handbook of Membrane Separations: Membranes in Gas Separation (Eds. A.K. Pabby, S. S. H. Rizvi, A. M. Sastre), 2nd edn., pp. 65‐103, CRC Press Taylor & Francis: NW: USA.
[22] Adewole, J.K., Ahmad, A.L., Ismail, S., Leo, C.P. 2013. Current challenges in membrane separation of CO2 from natural gas: A review. International Journal of Greenhouse Gas Control, 17, pp. 46‐62
[23] Santos, E.; Rodríguez‐Fernández, E.; Casado‐Coterillo, C.; Irabien, A. 2015. Hybrid ionic liquid‐chitosan membranes for CO2 separation: Mechanical and
Mass Transfer Through Gas Separation Membranes. Experimental study of CO2/N2 Separation
– 30 –
thermal behavior. International Journal of Chemical Reactor Engineering, DOI 10.1515/ijcre‐2014‐0109.
[24] Scholes, C. A.; Stevens, G. W.; Kentish, S. E. 2010. The effect of hydrogen sulfide, carbon monoxide and water on the performance of a PDMS membrane in carbon dioxide/nitrogen separation. Journal of Membrane Science, 350 (1–2), pp. 189‐199.
[25] Zhao, L.; Riensche, E.; Blum, L.; Stolten, D., 2011. How gas separation membrane competes with chemical absorption in post‐combustion capture. Energy Procedia, 4, pp. 629‐636.
[26] Merkel, T. C.; Lin, H.; Wei, X.; Baker, R., 2010. Power plant post‐combustion carbon dioxide capture: an opportunity for membranes. Journal of Membrane Science, 359, pp. 126‐139.
[27] Chemtech, Sulzer. "Membrane Technology." http://www.sulzer.com/es/‐/media/Documents/ProductsAndServices/Separation_Technology/Membrane_Technology/Brochures/Membrane_Technology.pdf (accessed on 22/06/2015).
[28] Merkel, T. C.; Gupta, R. P.; Turk, B. S.; Freeman, B. D. 2001. Mixed‐gas permeation of syngas components in poly(dimethylsiloxane) and poly(1‐trimethylsilyl‐1‐propyne) at elevated temperatures. Journal of Membrane Science, 191, pp. 85‐94.
[29] González‐González, B.; Ortiz‐Uribe, I. 2001. Mathematical modeling of the pervaporative separation of methanol‐methylterbutyl ether mixtures. Industrial Engineering & Chemistry Research, 40, pp. 1720‐1731.
[30] Fernández‐Barquín, A., Casado‐Coterillo, C., Palomino, M., Valencia, S., Irabien, A. 2015. LTA/Poly(1‐trimethylsilyl‐1‐propyne) Mixed‐Matrix Membranes for High‐Temperature CO2/N2 Separation. Chemical Engineering Technology, 38(4), pp. 658‐666.
Mass Transfer Through Gas Separation Membranes. Experimental study of CO2/N2 Separation
– 31 –
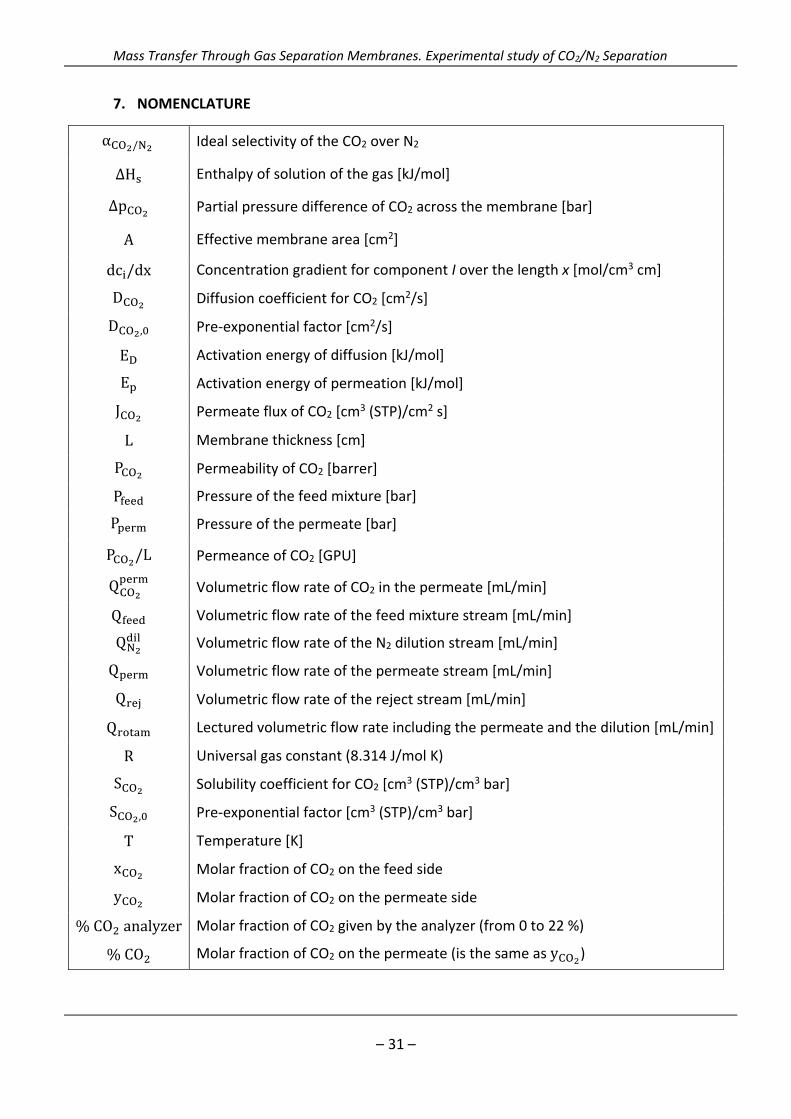
7. NOMENCLATURE
α / Ideal selectivity of the CO2 over N2
∆H Enthalpy of solution of the gas [kJ/mol]
∆p Partial pressure difference of CO2 across the membrane [bar]
A Effective membrane area [cm2]
dc /dx Concentration gradient for component I over the length x [mol/cm3 cm]
D Diffusion coefficient for CO2 [cm2/s]
D , Pre‐exponential factor [cm2/s]
E Activation energy of diffusion [kJ/mol]
E Activation energy of permeation [kJ/mol]
J Permeate flux of CO2 [cm3 (STP)/cm2 s]
L Membrane thickness [cm]
P Permeability of CO2 [barrer]
P Pressure of the feed mixture [bar]
P Pressure of the permeate [bar]
P /L Permeance of CO2 [GPU]
Q Volumetric flow rate of CO2 in the permeate [mL/min]
Q Volumetric flow rate of the feed mixture stream [mL/min]
Q Volumetric flow rate of the N2 dilution stream [mL/min]
Q Volumetric flow rate of the permeate stream [mL/min]
Q Volumetric flow rate of the reject stream [mL/min]
Q Lectured volumetric flow rate including the permeate and the dilution [mL/min]
R Universal gas constant (8.314 J/mol K)
S Solubility coefficient for CO2 [cm3 (STP)/cm3 bar]
S , Pre‐exponential factor [cm3 (STP)/cm3 bar]
T Temperature [K]
x Molar fraction of CO2 on the feed side
y Molar fraction of CO2 on the permeate side
%CO analyzer Molar fraction of CO2 given by the analyzer (from 0 to 22 %)
%CO Molar fraction of CO2 on the permeate (is the same as y )

Mass Transfer Through Gas Separation Membranes. Experimental study of CO2/N2 Separation
– 32 –
8. ANNEXES
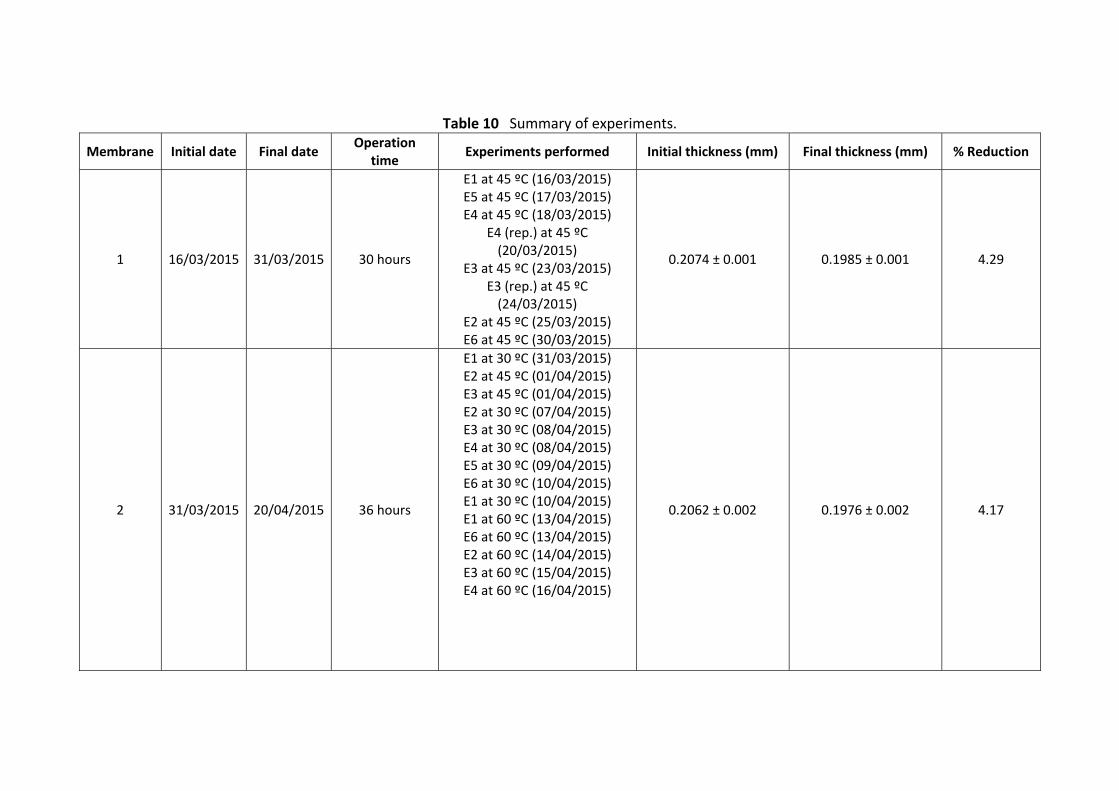
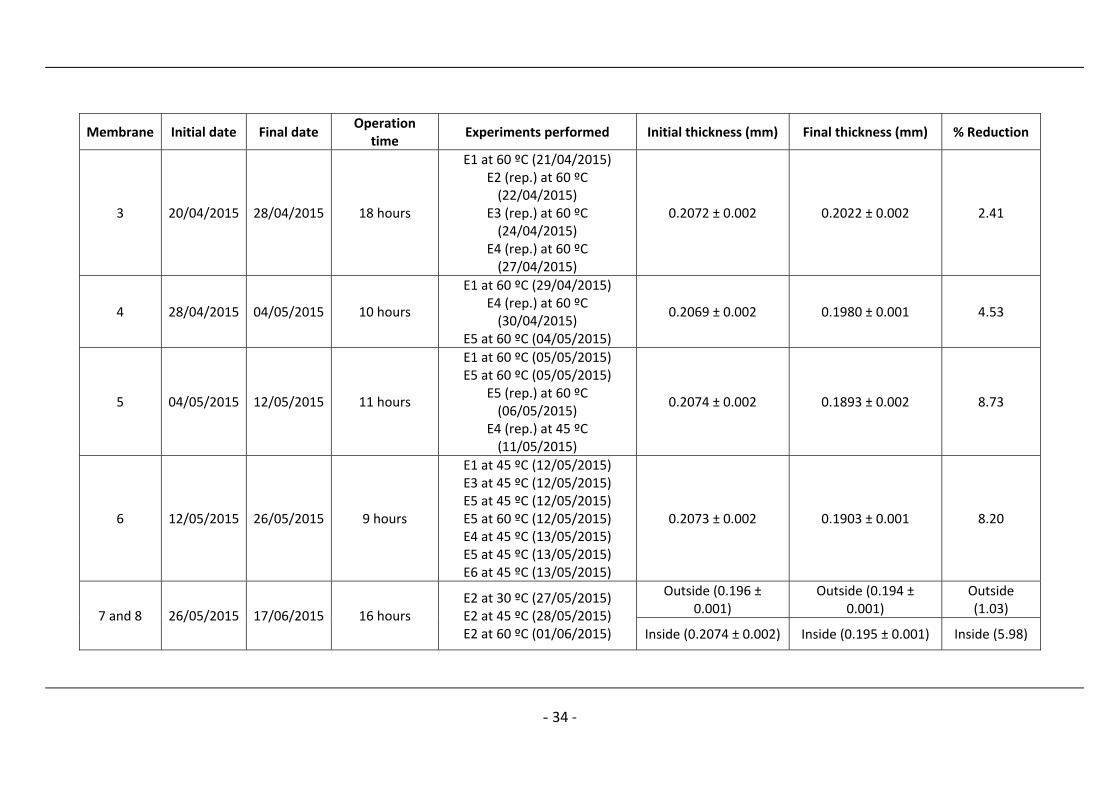
Table 10 Summary of experiments.
Membrane Initial date Final date Operation
time Experiments performed Initial thickness (mm) Final thickness (mm) % Reduction
1 16/03/2015 31/03/2015 30 hours
E1 at 45 ºC (16/03/2015) E5 at 45 ºC (17/03/2015) E4 at 45 ºC (18/03/2015)
E4 (rep.) at 45 ºC (20/03/2015)
E3 at 45 ºC (23/03/2015) E3 (rep.) at 45 ºC (24/03/2015)
E2 at 45 ºC (25/03/2015) E6 at 45 ºC (30/03/2015)
0.2074 ± 0.001 0.1985 ± 0.001 4.29
2 31/03/2015 20/04/2015 36 hours
E1 at 30 ºC (31/03/2015) E2 at 45 ºC (01/04/2015) E3 at 45 ºC (01/04/2015) E2 at 30 ºC (07/04/2015) E3 at 30 ºC (08/04/2015) E4 at 30 ºC (08/04/2015) E5 at 30 ºC (09/04/2015) E6 at 30 ºC (10/04/2015) E1 at 30 ºC (10/04/2015) E1 at 60 ºC (13/04/2015) E6 at 60 ºC (13/04/2015) E2 at 60 ºC (14/04/2015) E3 at 60 ºC (15/04/2015) E4 at 60 ºC (16/04/2015)
0.2062 ± 0.002 0.1976 ± 0.002 4.17
- 34 ‐
Membrane Initial date Final date Operation
time Experiments performed Initial thickness (mm) Final thickness (mm) % Reduction
3 20/04/2015 28/04/2015 18 hours
E1 at 60 ºC (21/04/2015) E2 (rep.) at 60 ºC (22/04/2015)
E3 (rep.) at 60 ºC (24/04/2015)
E4 (rep.) at 60 ºC (27/04/2015)
0.2072 ± 0.002 0.2022 ± 0.002 2.41
4 28/04/2015 04/05/2015 10 hours
E1 at 60 ºC (29/04/2015) E4 (rep.) at 60 ºC (30/04/2015)
E5 at 60 ºC (04/05/2015)
0.2069 ± 0.002 0.1980 ± 0.001 4.53
5 04/05/2015 12/05/2015 11 hours
E1 at 60 ºC (05/05/2015) E5 at 60 ºC (05/05/2015)
E5 (rep.) at 60 ºC (06/05/2015)
E4 (rep.) at 45 ºC (11/05/2015)
0.2074 ± 0.002 0.1893 ± 0.002 8.73
6 12/05/2015 26/05/2015 9 hours
E1 at 45 ºC (12/05/2015) E3 at 45 ºC (12/05/2015) E5 at 45 ºC (12/05/2015) E5 at 60 ºC (12/05/2015) E4 at 45 ºC (13/05/2015) E5 at 45 ºC (13/05/2015) E6 at 45 ºC (13/05/2015)
0.2073 ± 0.002 0.1903 ± 0.001 8.20
7 and 8 26/05/2015 17/06/2015 16 hours E2 at 30 ºC (27/05/2015) E2 at 45 ºC (28/05/2015) E2 at 60 ºC (01/06/2015)
Outside (0.196 ± 0.001)
Outside (0.194 ± 0.001)
Outside (1.03)
Inside (0.2074 ± 0.002) Inside (0.195 ± 0.001) Inside (5.98)
- 35 ‐
Membrane Initial date Final date Operation
time Experiments performed Initial thickness (mm) Final thickness (mm) % Reduction
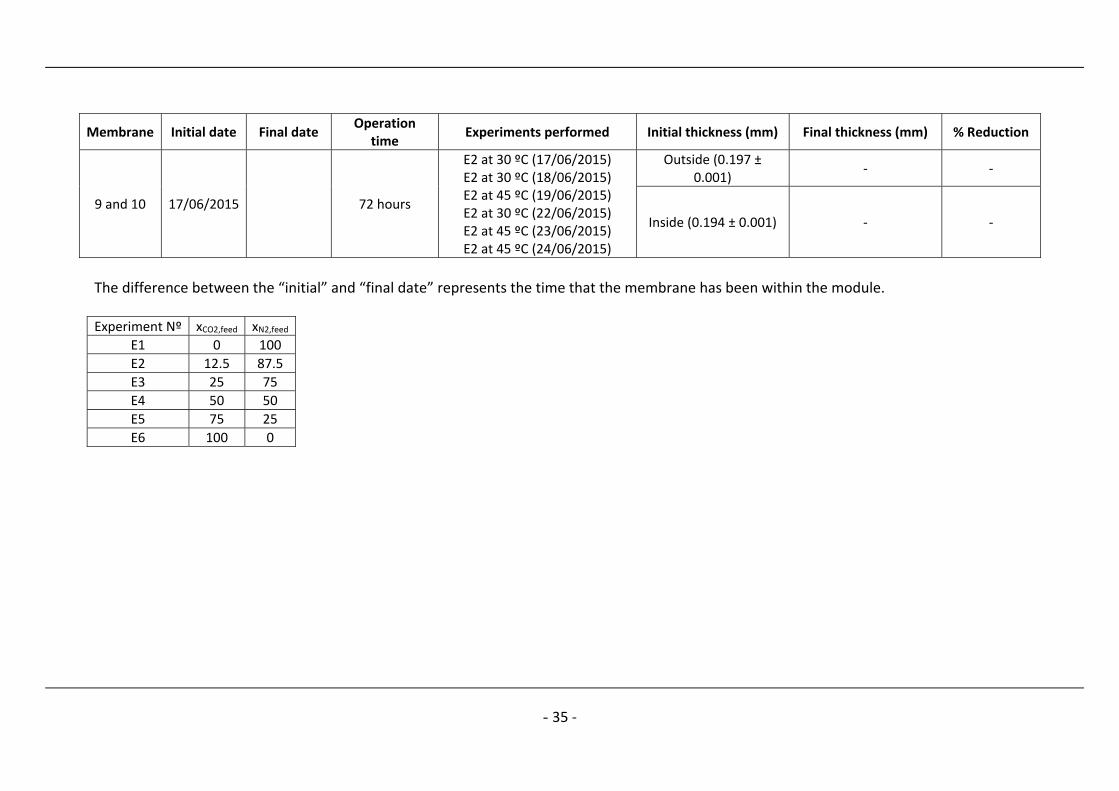
9 and 10 17/06/2015 72 hours
E2 at 30 ºC (17/06/2015) E2 at 30 ºC (18/06/2015) E2 at 45 ºC (19/06/2015) E2 at 30 ºC (22/06/2015) E2 at 45 ºC (23/06/2015) E2 at 45 ºC (24/06/2015)
Outside (0.197 ± 0.001)
‐ ‐
Inside (0.194 ± 0.001) ‐ ‐
The difference between the “initial” and “final date” represents the time that the membrane has been within the module. Experiment Nº xCO2,feed xN2,feed
E1 0 100
E2 12.5 87.5
E3 25 75
E4 50 50
E5 75 25
E6 100 0