Embed Size (px)
Citation preview

2016

Corporate ProfileTootsie Roll Industries, Inc. has been engaged in themanufacture and sale of confectionery products for120 years. Our products are primarily sold under thefamiliar brand names: Tootsie Roll, Tootsie Roll Pops,Caramel Apple Pops, Child’s Play, Charms, Blow Pop,
Blue Razz, Cella’s chocolate covered cherries, Dots,Crows, Junior Mints, Junior Caramels, CharlestonChew, Sugar Daddy, Sugar Babies, Andes, Fluffy Stuffcotton candy, Dubble Bubble, Razzles, Cry Baby andNik-L-Nip.
We believe that the differences among companies areattributable to the caliber of their people, and thereforewe strive to attract and retain superior people for eachjob.
We believe that an open family atmosphere at workcombined with professional management fosterscooperation and enables each individual to maximizehis or her contribution to the Company and realize thecorresponding rewards.
We do not jeopardize long-term growth for immediate,short-term results.
We maintain a conservative financial posture in thedeployment and management of our assets.
We run a trim operation and continually strive toeliminate waste, minimize cost and implementperformance improvements.
We invest in the latest and most productive equipmentto deliver the best quality product to our customers atthe lowest cost.
We seek to outsource functions where appropriate andto vertically integrate operations where it is financiallyadvantageous to do so.
We view our well known brands as prized assets to beaggressively advertised and promoted to each newgeneration of consumers.
We conduct business with the highest ethicalstandards and integrity which are codified in theCompany’s “Code of Business Conduct and Ethics.”
Corporate Principles
Financial Highlights December 31, 2016 2015 (in thousands except per share data)
Net Product Sales . . . . . . . . . . . . . . . . . . . . . . . . . . . . . . . . . . . . . . . . . . . . . . $517,373 $536,692Net Earnings Attributable to Tootsie Roll Industries, Inc. . . . . . . . . . . . . . . . . . 67,510 66,089Working Capital . . . . . . . . . . . . . . . . . . . . . . . . . . . . . . . . . . . . . . . . . . . . . . . . 235,739 221,744Net Property, Plant and Equipment . . . . . . . . . . . . . . . . . . . . . . . . . . . . . . . . . 180,905 184,586Shareholders’ Equity . . . . . . . . . . . . . . . . . . . . . . . . . . . . . . . . . . . . . . . . . . . . 711,364 698,183Average Shares Outstanding* . . . . . . . . . . . . . . . . . . . . . . . . . . . . . . . . . . . . . 62,239 63,256Per Share Items*Net Earnings Attributable to Tootsie Roll Industries, Inc. . . . . . . . . . . . . . . . . . $1.08 $1.04Cash Dividends Paid . . . . . . . . . . . . . . . . . . . . . . . . . . . . . . . . . . . . . . . . . . . . 0.36 0.35
*Adjusted for stock dividends.
Merrill Corp - Tootsie Roll Annual Report ED | 105914 | 28-Feb-17 08:17 | 17-6862-1.ba | Sequence: 1CHKSUM Content: 31960 Layout: 63945 Graphics: 29616 CLEAN
JOB: 17-6862-1 CYCLE#;BL#: 6; 0 TRIM: 8.5" x 11" COMPOSITECOLORS: Black, Cyan, Magenta, Yellow, ~note-color 2 GRAPHICS: Tootsie_roll_candy_logo.eps V1.5

2016 marked the 120th anniversary of our flagship confection, the Tootsie Roll. It was in 1896 that Leo Hirschfield, an Austrian immigrant, cooked up the first batch of Tootsie Rolls on his stove in New York City. As the chocolaty concoction cooled, he and his daughter cut off pieces and rolled them by hand. Then they wrapped the rolls in waxed paper to keep them sanitary, an uncommon practice at the time. “What should I call my new creation?” he must have wondered before the thought occurred to name it after his daughter who he affectionately nicknamed “Tootsie.” His new chewy, chocolaty candy rolls caught on with the kids in his neighborhood and thus was born an American icon.
From those humble beginnings so many years ago, Tootsie Roll has steadily grown and expanded into the enterprise that we know today. In 2016 sales were $517 million, net earnings were $68 million and earnings per share were $1.08. Though we now produce Tootsie Rolls by the millions on specialized, high speed equipment in a large, automated manufacturing
facility, one thing has remained constant: the bond between our consumers and the wholesome confections they have trusted from us for generations. Most of our iconic brands trace their roots back seventy or more years. Our goal is to maintain this important connection with consumers even as we continue to deploy new manufacturing technologies or move into evolving packaging formats that appeal to emerging market segments.
Our largest selling period has long been the Halloween season. In fact, third quarter sales are nearly double those of any other quarter of the year. We again posted strong results in Halloween 2016 in all major trade classes including grocery, mass merchandisers, warehouse clubs, dollar stores and drug chains. Especially popular for Halloween are our large bags of Child’s Play and other mixed assortments of our famous brands. Such assortments are offered in a variety of pack sizes and merchandising presentations to meet customer-specific needs. These include pallet packs, off-shelf displays, display-ready cases and other forms of merchandising.
Ellen R. Gordon, Chairman and Chief Executive Officer
25FEB201611233621
To Our Shareholders
Ellen R. Gordon, Chairman and Chief Executive Officer
Net product sales in 2015 were $537 million Although our overall comparative ingredient costscompared to $540 million in 2014. The Company in 2015 were somewhat more favorable comparedhad another strong Halloween selling season, and to the prior year, certain key ingredient costs weremany of our core brands achieved sales gains higher in 2015, and we expect overall ingredientover the prior year. Sales were, however, adversely costs to be higher in 2016. Still, we are pleased toaffected by translation of sales made in foreign report that we are making progress on restoringcurrencies, principally Mexico and Canada, due to our margins to their historical levels while wethe relative strength of the U.S. dollar. continue to strive to implement measures to
improve every aspect of our operations.Net earnings in 2015 were $66 million compared to$63 million in 2014, an increase of 4%. Earnings Other highlights of 2015 include:per share were $1.08 in 2015 compared to $1.02 in
• Cash dividends were paid for the seventy-the prior year, an increase of $0.06 per share or
third consecutive year.6%. Earnings per share increased at a higher ratethan earnings due to stock repurchases that • The quarterly cash dividend rate wasresulted in fewer shares outstanding in 2015. increased from 8 cents to 9 cents.
2015 net earnings benefited from lower • Our fifty-first consecutive 3% stockdistribution expenses including the effects of dividend was distributed.declining fuel costs and improved operating
• 1,047,335 shares of the Company’sefficiencies, improving manufacturing plant
common stock were purchased in the openefficiencies driven by capital investments, more
market for an aggregate price offavorable ingredient costs, and ongoing cost
$33 million.containment programs. Net earnings in 2015 werealso favorably impacted by a lower effective • Capital expenditures were $16 million.income tax rate.
14
conservative financial posture and so we havethe resources necessary to make the importantinvestments described above. We ended 2016with $276 million in cash and investments (net ofinterest bearing debt and investments that hedgedeferred compensation liabilities) and,accordingly, continue to be in a position torespond to future opportunities that inevitably willarise.
Our financial resources also enable us tocontinue to invest in our brands, pay dividendsand repurchase common stock. During 2016 wepaid quarterly cash dividends totaling 36 centsper share and distributed a 3% stock dividend.This was the seventy-fourth consecutive year thatthe Company paid cash dividends and the fifty-second consecutive year that a stock dividendwas distributed.
The Company has historically grown in threeways: by increasing distribution of existingproducts, by introducing new items, including lineextensions, and by acquisition. While many of ourbrands were developed internally, certain of themincluding DOTS, BLOW POPS, JUNIOR MINTS,ANDES, DUBBLE BUBBLE and others have cometo us through acquisition. We continue to seekcomplimentary business acquisitions that will addto our stable of brands.
Several promising new products were brought tomarket in 2016. Cella’s Dips are a deliciouscombination of whole dried cherries covered inrich dark chocolate. Made with the same careand expertise as our other quality Cella’sconfections, this item capitalizes on thepopularity of dried fruit in candy. New CaramelMarshmallow Sugar Babies were a delicious lineextension to the Sugar Baby brand.
All of our products, including these new items,are promoted in social media venues such asTwitter, Facebook, and Instagram and otheroutlets. We maintain a high level of engagementwith our followers in these media through
numerous postings, game experiences, prizecontests and pop-up ads. Mr. Owl and the long-standing “How many licks does it take to get tothe Tootsie Roll center of a Tootsie Pop” messageare prominently featured in our social mediaprogram and in our television advertisingcampaigns. This renowned advertisement has,itself, become part of Americana, withappearances ranging from crossword puzzles toquiz shows to scientific studies replete withcomplicated lick-estimating algorithms. Inaddition, each year many consumers contact usto share their personal findings. With noconsensus having been reached in the answer tothis time-tested conundrum, we can onlyconclude one thing: “the world may never know!”
The appeal of our iconic brands is evidenced bytheir inclusion in popular television food shows.During 2016 the Cooking Channel’s Unwrapped2.0 profiled the production process for BLOWPOPS, CARAMEL APPLE POPS, SUGAR DADDYand JUNIOR MINTS. In past years similarprograms featuring our brands have appeared onother special interest cable channels. We believedocumentaries of this kind provide recurringexposure for our brands in a fashion thatcaptures the interest of a wide viewing audience.
In closing, we wish to express our appreciation toour many loyal employees, consumers, suppliers,sales brokers, distributors and customersthroughout the world for their support in 2016. Wealso thank our fellow shareholders for theirsupport throughout the years. We remaincommitted to profitable growth and the pursuit ofexcellence in our operations as we preserve andstrengthen the bond between our consumers andthe wholesome confections they have trustedfrom us since 1896.
Ellen R. GordonChairman of the Board andChief Executive Officer
Merrill Corp - Tootsie Roll Annual Report ED | 105914 | 28-Feb-17 08:17 | 17-6862-1.bc | Sequence: 4CHKSUM Content: 42686 Layout: 33250 Graphics: 10063 CLEAN
JOB: 17-6862-1 CYCLE#;BL#: 6; 0 TRIM: 8.5" x 11" COMPOSITECOLORS: Black, ~note-color 2 GRAPHICS: ellen_r_gordon_sig.eps V1.5
common stock. During 2016 we paid quarterly cash dividends totaling 36 cents per share and distributed a 3% stock dividend. This was the seventy-fourth consecutive year that the Company paid cash dividends and the fifty-second consecutive year that stock dividend was distributed.
The Company has historically grown in three ways: by increasing distribution of existing products, by introducing new items, including line extensions, and by acquisition. While many of our brands were developed internally, certain of them including DOTS, BLOW POPS, JUNIOR MINTS, ANDES, DUBBLE BUBBLE and others have come to us through acquisition. We continue to seek complimentary business acquisitions that will add to our stable of brands.
Several promising new products were brought to market in 2016. Cella’s Dips are a delicious combination of whole dried cherries covered in rich dark chocolate. Made with the same care and expertise as our other quality Cella’s confections, this item capitalizes on the popularity of dried fruit in candy. New Caramel Marshmallow Sugar Babies were a delicious line extension to the Sugar Baby brand.
All of our products, including these new items, are promoted in social media venues such as Twitter, Facebook, and Instagram and other outlets. We maintain a high level of engagement with our followers in these media through numerous postings, game experiences, prize contests and pop-up ads. Mr. Owl and the long-standing “How many licks does it take to get to the Tootsie Roll center of a Tootsie Pop”message are prominently featured in our socialmedia program and in our television advertising
campaigns. This renowned advertisement has, itself, become part of Americana, with appearances ranging from crossword puzzles to quiz shows to scientific studies replete with complicated lick-estimating algorithms. In addition, each year many consumers contact us to share their personal findings. With no consensus having been reached in the answer to this time-tested conundrum, we can only conclude one thing: “the world may never know!”
The appeal of our iconic brands is evidenced by their inclusion in popular television food shows. During 2016 the Cooking Channel’s Unwrapped 2.0 profiled the production process for BLOW POPS, CARAMEL APPLE POPS, SUGAR DADDY and JUNIOR MINTS. In past years similar programs featuring our brands have appeared on other special interest cable channels. We believe documentaries of this kind provide recurring exposure for our brands in a fashion that captures the interest of a wide viewing audience. In closing, we wish to express our appreciation to our many loyal employees, consumers, suppliers, sales brokers, distributors and customers throughout the world for their support in 2016. We also thank our fellow shareholders for their support throughout the years. We remain committed to profitable growth and the pursuit of excellence in our operations as we preserve and strengthen the bond between our consumers and the wholesome confections they have trusted from us since 1896.

and distribution facilities that reduce cost, support changing distribution patterns or growing product lines, improve quality and enable us to staywell ahead of evolving food safetystandards and regulations. Many capital projects are made possibleby continuing advancements inautomation technology that wecan adapt and incorporate into our plants. The increasingflexibility and affordabilityof robotics is an example ofthis type of technologicaladvancement.
We have as well made significant investments in the area of information systems. Several years ago the Company implemented a comprehensive, company-wide enterprise resource planning (ERP) system. It was a complex and costly endeavorbut our ERP system has paved the way fora variety of advancements ranging from demand planning in our plants to voice picking technology in ourdistribution centers to sophisticated analytical tools for our managers. We continue to streamline processes and to mine other benefits from our investment in the ERP system. We are committed to deploying state of the art information technology in the Company on an ongoing basis.
Fortunately, we have always maintained a conservative financial posture and so we have the resources necessary to make the important investments described above. We ended 2016 with $276 million in cash and investments (net of interest bearing debt and investments that hedge deferred compensation liabilities) and, accordingly, continue to be in a position to respond to future opportunities that inevitably will arise.
Our financial resources also enable us to continue to invest in our brands pay dividends and repurchase
Within the wide range of branded confectionery offerings we produce for Halloween and throughout the year, we have items suitable for virtually every major consumer group and retail venue. In addition, carefully targeted, channel-specific sales promotions are directed to both the trade and to consumers in order to drive our sales. These help to move our products into distribution and subsequently to move them off the retail shelf. The product assortments that we offer to the trade generate traffic, volume and good gross margins while they present our loyal consumers with the brands they love in both traditional and contemporary formats at attractive, value-oriented, prices.
Outside of the United States our largest markets are Canada and Mexico. The brand portfolio in Canada includes the same brands that we offer domestically. In Mexico, we sell products under several of our domestic brand names as well as under the brand name Tutsi which is locally well-known. The primary selling season for Tutsi products is Christmas and our most popular item is a mixed assortment of Tutsi candies which is presented in a boot-shaped package. This item was revamped in 2016 with promising results. We also export many of our
brands to a variety of countries in Europe, the Middle East and the Far East.
In order to maintain the value pricing of our products, we must constantly strive to improve upon our position as a low cost producer. This requires vigilant focus on every aspect of the Company to trim waste and to improve operations. We are proactive in the areas of energy conservation, water conservation, material reduction and recycling. In addition to generating important cost savings, these initiatives are consistent with the goals of our corporate sustainability program.
Efficiencies are also realized through capital investments in our production

2016 marked the 120th anniversary of our flagship confection, the Tootsie Roll. It was in 1896 that Leo Hirschfield, an Austrian immigrant, cooked up the first batch of Tootsie Rolls on his stove in New York City. As the chocolaty concoction cooled, he and his daughter cut off pieces and rolled them by hand. Then they wrapped the rolls in waxed paper to keep them sanitary, an uncommon practice at the time. “What should I call my new creation?” he must have wondered before the thought occurred to name it after his daughter who he affectionately nicknamed “Tootsie.” His new chewy, chocolaty candy rolls caught on with the kids in his neighborhood and thus was born an American icon.
From those humble beginnings so many years ago, Tootsie Roll has steadily grown and expanded into the enterprise that we know today. In 2016 sales were $517 million, net earnings were $68 million and earnings per share were $1.08. Though we now produce Tootsie Rolls by the millions on specialized, high speed equipment in a large, automated manufacturing
facility, one thing has remained constant: the bond between our consumers and the wholesome confections they have trusted from us for generations. Most of our iconic brands trace their roots back seventy or more years. Our goal is to maintain this important connection with consumers even as we continue to deploy new manufacturing technologies or move into evolving packaging formats that appeal to emerging market segments.
Our largest selling period has long been the Halloween season. In fact, third quarter sales are nearly double those of any other quarter of the year. We again posted strong results in Halloween 2016 in all major trade classes including grocery, mass merchandisers, warehouse clubs, dollar stores and drug chains. Especially popular for Halloween are our large bags of Child’s Play and other mixed assortments of our famous brands. Such assortments are offered in a variety of pack sizes and merchandising presentations to meet customer-specific needs. These include pallet packs, off-shelf displays, display-ready cases and other forms of merchandising.
Ellen R. Gordon, Chairman and Chief Executive Officer
25FEB201611233621
To Our Shareholders
Ellen R. Gordon, Chairman and Chief Executive Officer
Net product sales in 2015 were $537 million Although our overall comparative ingredient costscompared to $540 million in 2014. The Company in 2015 were somewhat more favorable comparedhad another strong Halloween selling season, and to the prior year, certain key ingredient costs weremany of our core brands achieved sales gains higher in 2015, and we expect overall ingredientover the prior year. Sales were, however, adversely costs to be higher in 2016. Still, we are pleased toaffected by translation of sales made in foreign report that we are making progress on restoringcurrencies, principally Mexico and Canada, due to our margins to their historical levels while wethe relative strength of the U.S. dollar. continue to strive to implement measures to
improve every aspect of our operations.Net earnings in 2015 were $66 million compared to$63 million in 2014, an increase of 4%. Earnings Other highlights of 2015 include:per share were $1.08 in 2015 compared to $1.02 in
• Cash dividends were paid for the seventy-the prior year, an increase of $0.06 per share or
third consecutive year.6%. Earnings per share increased at a higher ratethan earnings due to stock repurchases that • The quarterly cash dividend rate wasresulted in fewer shares outstanding in 2015. increased from 8 cents to 9 cents.
2015 net earnings benefited from lower • Our fifty-first consecutive 3% stockdistribution expenses including the effects of dividend was distributed.declining fuel costs and improved operating
• 1,047,335 shares of the Company’sefficiencies, improving manufacturing plant
common stock were purchased in the openefficiencies driven by capital investments, more
market for an aggregate price offavorable ingredient costs, and ongoing cost
$33 million.containment programs. Net earnings in 2015 werealso favorably impacted by a lower effective • Capital expenditures were $16 million.income tax rate.
14
conservative financial posture and so we havethe resources necessary to make the importantinvestments described above. We ended 2016with $276 million in cash and investments (net ofinterest bearing debt and investments that hedgedeferred compensation liabilities) and,accordingly, continue to be in a position torespond to future opportunities that inevitably willarise.
Our financial resources also enable us tocontinue to invest in our brands, pay dividendsand repurchase common stock. During 2016 wepaid quarterly cash dividends totaling 36 centsper share and distributed a 3% stock dividend.This was the seventy-fourth consecutive year thatthe Company paid cash dividends and the fifty-second consecutive year that a stock dividendwas distributed.
The Company has historically grown in threeways: by increasing distribution of existingproducts, by introducing new items, including lineextensions, and by acquisition. While many of ourbrands were developed internally, certain of themincluding DOTS, BLOW POPS, JUNIOR MINTS,ANDES, DUBBLE BUBBLE and others have cometo us through acquisition. We continue to seekcomplimentary business acquisitions that will addto our stable of brands.
Several promising new products were brought tomarket in 2016. Cella’s Dips are a deliciouscombination of whole dried cherries covered inrich dark chocolate. Made with the same careand expertise as our other quality Cella’sconfections, this item capitalizes on thepopularity of dried fruit in candy. New CaramelMarshmallow Sugar Babies were a delicious lineextension to the Sugar Baby brand.
All of our products, including these new items,are promoted in social media venues such asTwitter, Facebook, and Instagram and otheroutlets. We maintain a high level of engagementwith our followers in these media through
numerous postings, game experiences, prizecontests and pop-up ads. Mr. Owl and the long-standing “How many licks does it take to get tothe Tootsie Roll center of a Tootsie Pop” messageare prominently featured in our social mediaprogram and in our television advertisingcampaigns. This renowned advertisement has,itself, become part of Americana, withappearances ranging from crossword puzzles toquiz shows to scientific studies replete withcomplicated lick-estimating algorithms. Inaddition, each year many consumers contact usto share their personal findings. With noconsensus having been reached in the answer tothis time-tested conundrum, we can onlyconclude one thing: “the world may never know!”
The appeal of our iconic brands is evidenced bytheir inclusion in popular television food shows.During 2016 the Cooking Channel’s Unwrapped2.0 profiled the production process for BLOWPOPS, CARAMEL APPLE POPS, SUGAR DADDYand JUNIOR MINTS. In past years similarprograms featuring our brands have appeared onother special interest cable channels. We believedocumentaries of this kind provide recurringexposure for our brands in a fashion thatcaptures the interest of a wide viewing audience.
In closing, we wish to express our appreciation toour many loyal employees, consumers, suppliers,sales brokers, distributors and customersthroughout the world for their support in 2016. Wealso thank our fellow shareholders for theirsupport throughout the years. We remaincommitted to profitable growth and the pursuit ofexcellence in our operations as we preserve andstrengthen the bond between our consumers andthe wholesome confections they have trustedfrom us since 1896.
Ellen R. GordonChairman of the Board andChief Executive Officer
Merrill Corp - Tootsie Roll Annual Report ED | 105914 | 28-Feb-17 08:17 | 17-6862-1.bc | Sequence: 4CHKSUM Content: 42686 Layout: 33250 Graphics: 10063 CLEAN
JOB: 17-6862-1 CYCLE#;BL#: 6; 0 TRIM: 8.5" x 11" COMPOSITECOLORS: Black, ~note-color 2 GRAPHICS: ellen_r_gordon_sig.eps V1.5
common stock. During 2016 we paid quarterly cash dividends totaling 36 cents per share and distributed a 3% stock dividend. This was the seventy-fourth consecutive year that the Company paid cash dividends and the fifty-second consecutive year that stock dividend was distributed.
The Company has historically grown in three ways: by increasing distribution of existing products, by introducing new items, including line extensions, and by acquisition. While many of our brands were developed internally, certain of them including DOTS, BLOW POPS, JUNIOR MINTS, ANDES, DUBBLE BUBBLE and others have come to us through acquisition. We continue to seek complimentary business acquisitions that will add to our stable of brands.
Several promising new products were brought to market in 2016. Cella’s Dips are a delicious combination of whole dried cherries covered in rich dark chocolate. Made with the same care and expertise as our other quality Cella’s confections, this item capitalizes on the popularity of dried fruit in candy. New Caramel Marshmallow Sugar Babies were a delicious line extension to the Sugar Baby brand.
All of our products, including these new items, are promoted in social media venues such as Twitter, Facebook, and Instagram and other outlets. We maintain a high level of engagement with our followers in these media through numerous postings, game experiences, prize contests and pop-up ads. Mr. Owl and the long-standing “How many licks does it take to get to the Tootsie Roll center of a Tootsie Pop”message are prominently featured in our socialmedia program and in our television advertising
campaigns. This renowned advertisement has, itself, become part of Americana, with appearances ranging from crossword puzzles to quiz shows to scientific studies replete with complicated lick-estimating algorithms. In addition, each year many consumers contact us to share their personal findings. With no consensus having been reached in the answer to this time-tested conundrum, we can only conclude one thing: “the world may never know!”
The appeal of our iconic brands is evidenced by their inclusion in popular television food shows. During 2016 the Cooking Channel’s Unwrapped 2.0 profiled the production process for BLOW POPS, CARAMEL APPLE POPS, SUGAR DADDY and JUNIOR MINTS. In past years similar programs featuring our brands have appeared on other special interest cable channels. We believe documentaries of this kind provide recurring exposure for our brands in a fashion that captures the interest of a wide viewing audience. In closing, we wish to express our appreciation to our many loyal employees, consumers, suppliers, sales brokers, distributors and customers throughout the world for their support in 2016. We also thank our fellow shareholders for their support throughout the years. We remain committed to profitable growth and the pursuit of excellence in our operations as we preserve and strengthen the bond between our consumers and the wholesome confections they have trusted from us since 1896.

UNITED STATES SECURITIES AND EXCHANGE COMMISSION
Washington, D.C. 20549
FORM 10-K
(Mark One)
ANNUAL REPORT PURSUANT TO SECTION 13 OR 15(d) OF THE SECURITIES EXCHANGE ACT OF 1934
For the fiscal year ended December 31, 2016
OR
TRANSITION REPORT PURSUANT TO SECTION 13 OR 15(d) OF THE SECURITIES EXCHANGE ACT OF 1934
For the transition period from to
Commission file number 1-1361
TOOTSIE ROLL INDUSTRIES, INC. (Exact name of Registrant as specified in its charter)
Virginia 22-1318955 (State or other jurisdiction of (IRS Employer Identification No.) incorporation or organization)
7401 South Cicero Avenue, Chicago, Illinois 60629 (Address of principal executive offices) (Zip Code)
Registrant’s Telephone Number: (773) 838-3400
Securities registered pursuant to Section 12(b) of the Act:
Title of each class Name of each exchange
on which registered
Common Stock — Par Value $.69-4/9 Per Share New York Stock Exchange
Securities registered pursuant to Section 12(g) of the Act:
Class B Common Stock — Par Value $.69-4/9 Per Share
Indicate by check mark if the registrant is a well-known seasoned issuer, as defined in Rule 405 of the Securities Act. Yes No
Indicate by check mark if the registrant is not required to file reports pursuant to Section 13 or Section 15(d) of the Act. Yes No
Indicate by check mark whether the registrant: (1) has filed all reports required to be filed by Section 13 or 15(d) of the Securities Exchange Act of 1934 during the preceding 12 months (or for such shorter period that the registrant was required to file such reports), and (2) has been subject to such filing requirements for the past 90 days. Yes No
Indicate by check mark whether the registrant has submitted electronically and posted on its corporate Web site, if any, every Interactive Data File required to be submitted and posted pursuant to Rule 405 of Regulation S-T (§ 232.405 of this chapter) during the preceding 12 months (or for such shorter period that the registrant was required to submit and post such files). Yes No
Indicate by check mark if disclosure of delinquent filers pursuant to Item 405 of Regulation S-K is not contained herein, and will not be contained, to the best of registrant’s knowledge, in definitive proxy or information statements incorporated by reference in Part III of this Form 10-K or any amendment to this Form 10-K.
Indicate by check mark whether the registrant is a large accelerated filer, an accelerated filer or a non-accelerated filer. See definition of “large accelerated filer,” “accelerated filer and “smaller reporting company” in Rule 12b-2 of the Exchange Act.
Large Accelerated Filer Accelerated Filer
Non-accelerated Filer Smaller Reporting Company
Indicate by check mark whether the registrant is a shell company (as defined in Rule 12b-2 of the Exchange Act). Yes No
As of February 14, 2017, there were outstanding 37,713,126 shares of Common Stock par value $.69-4/9 per share, and 24,209,336 shares of Class B Common Stock par value $.69-4/9 per share.
As of June 30, 2016, the aggregate market value of the Common Stock (based upon the closing price of the stock on the New York Stock Exchange on such date) held by non-affiliates was approximately $691,022,000. Class B Common Stock is not traded on any exchange, is restricted as to transfer or other disposition, but is convertible into Common Stock on a share-for-share basis. Upon such conversion, the resulting shares of Common Stock are freely transferable and publicly traded. Assuming all 24,209,336 shares of outstanding Class B Common Stock were converted into Common Stock, the aggregate market value of Common Stock held by non-affiliates on June 30, 2016 (based upon the closing price of the stock on the New York Stock Exchange on such date) would have been approximately $852,052,000. Determination of stock ownership by non-affiliates was made solely for the purpose of this requirement, and the Registrant is not bound by these determinations for any other purpose.
DOCUMENTS INCORPORATED BY REFERENCE
Portions of the Company’s Definitive Proxy Statement for the Company’s Annual Meeting of Shareholders (the “2017 Proxy Statement”) scheduled to be held on May 1, 2017 are incorporated by reference in Part III of this report.

2
TABLE OF CONTENTS
ITEM 1. Business 3 ITEM 1A. Risk Factors 5 ITEM 1B. Unresolved Staff Comments 8 ITEM 2. Properties 8 ITEM 3. Legal Proceedings 9 ITEM 4. Mine Safety Disclosures 9 ITEM 5. Market for Registrant’s Common Equity, Related Stockholder Matters and Issuer Purchases of Equity
Securities 10 ITEM 6. Selected Financial Data 12 ITEM 7. Management’s Discussion and Analysis of Financial Condition and Results of Operations 13 ITEM 7A. Quantitative and Qualitative Disclosures About Market Risk 24 ITEM 8. Financial Statements and Supplementary Data 24 ITEM 9. Changes in and Disagreements with Accountants on Accounting and Financial Disclosure 47 ITEM 9A. Controls and Procedures 47 ITEM 9B. Other Information 47 ITEM 10. Directors, Executive Officers and Corporate Governance 48 ITEM 11. Executive Compensation 48 ITEM 12. Security Ownership of Certain Beneficial Owners and Management and Related Stockholder Matters 48 ITEM 13. Certain Relationships and Related Transactions, and Director Independence 49 ITEM 14. Principal Accounting Fees and Services 49 ITEM 15. Exhibits, Financial Statement Schedules 49 ITEM 16. Summary Form 10-K 49

3
Forward-Looking Information
From time to time, in the Company’s statements and written reports, including this report, the Company discusses its expectations regarding future performance by making certain “forward-looking statements” within the meaning of the Private Securities Litigation Reform Act of 1995. Forward-looking statements can be identified by the use of words such as “anticipate,” “believe,” “expect,” “intend,” “estimate,” “project,” and other words of similar meaning in connection with a discussion of future operating or financial performance and are subject to certain factors, risks, trends and uncertainties that could cause actual results and achievements to differ materially from those expressed in the forward-looking statements. These forward-looking statements are based on currently available competitive, financial and economic data and management’s views and assumptions regarding future events. Such forward-looking statements are inherently uncertain, and actual results may differ materially from those expressed or implied herein. Consequently, the Company wishes to caution readers not to place undue reliance on any forward-looking statements. Factors, among others, which could cause the Company’s future results to differ materially from the forward-looking statements, expectations and assumptions expressed or implied herein include general factors, such as economic conditions, political developments, currency exchange rates, interest and inflation rates, accounting standards, taxes, and laws and regulations affecting the Company in markets where it competes and those factors described in Item 1A “Risk Factors” and elsewhere in this Form 10-K and in other Company filings with the Securities and Exchange Commission. The Company does not undertake to update any of these forward-looking statements.
PART I ITEM 1. Business.
Tootsie Roll Industries, Inc. and its consolidated subsidiaries (the “Company”) have been engaged in the manufacture and sale of confectionery products for over 100 years. This is the only industry segment in which the Company operates and is its only line of business. The majority of the Company’s products are sold under the registered trademarks TOOTSIE ROLL, TOOTSIE POPS, CHILD’S PLAY, CARAMEL APPLE POPS, CHARMS, BLOW-POP, CHARMS MINI POPS, CELLA’S, DOTS, JUNIOR MINTS, CHARLESTON CHEW, SUGAR DADDY, SUGAR BABIES, ANDES, FLUFFY STUFF, DUBBLE BUBBLE, RAZZLES, CRY BABY, NIK-L-NIP, and TUTSI POP (Mexico).
The Company’s products are marketed in a variety of packages designed to be suitable for display and
sale in different types of retail outlets. They are sold through approximately 30 candy and grocery brokers and by the Company itself to approximately 4,000 customers throughout the United States. These customers include wholesale distributors of candy and groceries, supermarkets, variety stores, dollar stores, chain grocers, drug chains, discount chains, cooperative grocery associations, mass merchandisers, warehouse and membership club stores, vending machine operators, the U.S. military and fund-raising charitable organizations.
The Company’s principal markets are in the United States, Canada and Mexico. The majority of
production from the Company’s Canadian plants is sold in the United States. The majority of production from the Company’s Mexican plant is sold in Mexico.
The domestic confectionery business is highly competitive. The Company competes primarily with other
manufacturers of confectionery products sold to the above mentioned customers. Although accurate statistics are not available, the Company believes it is among the ten largest domestic manufacturers in this field. In the markets in which the Company competes, the main forms of competition comprise brand recognition, as well as competition for retail shelf space and a fair price for the Company’s products at various retail price points.
The Company did not have a material backlog of firm orders at the end of the calendar years 2016 or
2015. The Company experienced higher costs for ingredients in 2016 compared to 2015. The Company had
increased price realization on its unit selling prices in 2016, and has made progress toward restoring margins to their historical levels before the increases in commodity and other input costs in past years.

4
The Company has historically hedged certain of its future sugar and corn syrup needs with derivatives at such times that it believes that the forward markets are favorable. The Company’s decision to hedge its major ingredient requirements is dependent on the Company’s evaluation of forward commodity markets and their comparison to vendor quotations, if available, and/or historical costs. The Company has historically hedged some of these major ingredients with derivatives, primarily commodity futures and option contracts, before the commencement of the next calendar year to better ascertain the need for product pricing changes or product weight decline (indirect price change) adjustments to its product sales portfolio and better manage ingredient costs. The Company will generally purchase forward derivative contracts (i.e., “long” position) in selected future months that correspond to the Company’s estimated procurement and usage needs of the respective commodity in the respective forward periods.
From time to time, the Company also changes the size of certain of its products in response to significant
changes in ingredient and other input costs. The Company does not hold any material patents, licenses, franchises or concessions. The Company’s
major trademarks are registered in the United States and in many other countries. Continued trademark protection is of material importance to the Company’s business as a whole.
Although the Company does research and develops new products and product line extensions for existing
brands, it also improves the quality of existing products, improves and modernizes production processes, and develops and implements new technologies to enhance the quality and reduce the costs of products. The Company does not expend material amounts of money on research or development activities.
The manufacture and sale of consumer food products is highly regulated. In the United States, the
Company’s activities are subject to regulation by various government agencies, including the Food and Drug Administration, the Department of Agriculture, the Federal Trade Commission, the Department of Commerce and the Environmental Protection Agency, as well as various state and local agencies. Similar agencies also regulate the businesses outside of the United States. The Company maintains quality assurance and other programs to help ensure that all products the Company manufactures and distributes are safe and of high quality and comply with all applicable laws and regulations.
The Company’s compliance with federal, state and local regulations which have been enacted or adopted
regulating the discharge of materials into the environment, or otherwise relating to the protection of the environment, has not had a material effect on the capital expenditures, earnings or competitive position of the Company nor does the Company anticipate any such material effects from presently enacted or adopted regulations.
The Company employs approximately 2,000 persons. The Company has found that its sales normally maintain a consistent level throughout the year except
for a substantial increase in the third quarter which reflects pre-Halloween and back-to-school sales. In anticipation of this high sales period, the Company generally begins building inventories in the second quarter of each year. The Company historically offers extended credit terms for sales made under seasonal sales programs, including Halloween. Each year, after accounts receivables related to third quarter sales have been collected, the Company invests such funds in various marketable securities.
Sales revenues from Wal-Mart Stores, Inc. aggregated approximately 23.3%, 23.7%, and 23.7% of net
product sales during the years ended December 31, 2016, 2015 and 2014, respectively. Some of the aforementioned sales to Wal-Mart are sold to McLane Company, a large national grocery wholesaler, which services and delivers certain of the Company products to Wal-Mart and other retailers in the U.S.A. Net product sales revenues from McLane, which includes these Wal-Mart sales as well as sales and deliveries to other Company customers, were 16.3% in 2016 and 16.7% in 2015 and 15.3% in 2014. Although no customer other than McLane Company, Inc. and Wal-Mart Stores, Inc. accounted for more than 10% of net product sales, the loss of one or more significant customers could have a material adverse effect on the Company’s business.
For a summary of sales and long-lived assets of the Company by geographic area see Note 9 of the
“Notes to Consolidated Financial Statements” which is incorporated herein by reference.
5
Information regarding the Company’s Form 10-K, Form 10-Q, current reports on Form 8-K, and any
amendments to these reports, will be made available, free of charge, upon written request to Tootsie Roll Industries, Inc., 7401 South Cicero Avenue, Chicago, Illinois 60629, Attention: Barry Bowen, Treasurer and Assistant Secretary. The Company does not make all such reports available on its website at www.tootsie.com because it believes that they are readily available from the Securities Exchange Commission at www.sec.gov, and because the Company provides them free of charge upon request. Interested parties, including shareholders, may communicate to the Board of Directors or any individual director in writing, by regular mail, addressed to the Board of Directors or an individual director, in care of Tootsie Roll Industries, Inc., 7401 South Cicero Avenue, Chicago, Illinois 60629, Attention: Ellen R. Gordon, Chairman and Chief Executive Officer. If an interested party wishes to communicate directly with the Company’s non-employee directors, it should be noted on the cover of the communication. ITEM 1A. Risk Factors.
Significant factors that could impact the Company’s financial condition or results of operations include, without limitation, the following:
• Risk of changes in the price and availability of raw materials - The principal ingredients used by the Company are subject to price volatility. Although the Company engages in commodity hedging transactions and annual supply agreements as well as leveraging the high volume of its annual purchases, the Company may experience price increases in these ingredients that it may not be able to offset, which could have an adverse impact on the Company’s results of operations and financial condition. In addition, although the Company has historically been able to procure sufficient supplies of its ingredients, market conditions could change such that adequate supplies might not be available or only become available at substantially higher costs. Adverse weather patterns, including the effects of climate change, could also significantly affect the cost and availability of these ingredients.
• Risk of changes in product performance and competition - The Company competes with other well-established
manufacturers of confectionery products. A failure of new or existing products to be favorably received, a failure to retain preferred shelf space at retail or a failure to sufficiently counter aggressive promotional and price competition could have an adverse impact on the Company’s results of operations and financial condition.
• Risk of discounting and other competitive actions - Discounting and pricing pressure by the Company’s retail
customers and other competitive actions could make it more difficult for the Company to maintain its operating margins. Actions taken by major customers and competitors may make shelf space less available for confectionary products or some of the Company’s products.
• Risk of pricing actions – Inherent risks in the marketplace, including uncertainties about trade and consumer acceptance of pricing actions or product weight changes, could make it more difficult for the Company to maintain its sales and operating margins.
• Risk related to seasonality - The Company’s sales are highest during the Halloween season. Adverse circumstances surrounding Halloween, such as widespread weather events at that time of year or general changes in consumer interest in Halloween, could significantly affect the Company’s sales.
• Risk of dependence on large customers - The Company’s largest customer, Wal-Mart Stores, Inc., accounted for
approximately 23.3% of net product sales in 2016, and other large national chains are also material to the Company’s sales. The loss of Wal-Mart Stores, Inc. or one or more other large customers, or a material decrease in purchases by one or more large customers, could result in decreased sales and adversely impact the Company’s results of operations and financial condition.
• Risk of changes in consumer preferences and tastes - Failure to adequately anticipate and react to changing
demographics, consumer trends, consumer health concerns and product preferences, including product ingredients, could have an adverse impact on the Company’s results of operations and financial condition.

6
• Risk of economic conditions on consumer purchases - The Company’s sales are impacted by consumer spending levels and impulse purchases which are affected by general macroeconomic conditions, consumer confidence, employment levels, disposable income, availability of consumer credit and interest rates on that credit, consumer debt levels, energy costs and other factors. Volatility in food and energy costs, rising unemployment and/or underemployment, declines in personal spending, and recessionary economic conditions could adversely impact the Company’s revenues, profitability and financial condition.
• Risks related to environmental matters - The Company’s operations are not particularly impactful on the
environment, but, increased government environmental regulation or legislation could adversely impact the Company’s profitability.
• Risks relating to participation in the multi-employer pension plan for certain Company union employees - As
outlined in the Notes to the Consolidated Financial Statements and discussed in the Management’s Discussion & Analysis , the Company participates in a multi-employer pension plan (Plan) which is currently in “critical and declining status”, as defined by applicable law. A designation of “critical and declining status” implies that the Plan is expected to become insolvent in the next 20 years. Under terms of a rehabilitation plan, the Company is to be assessed 5% annual compounded surcharges on its contributions to the Plan until such time as the Plan emerges from critical status. Should the Company withdraw from the Plan, it would be subject to a significant withdrawal liability which is discussed in Note 7 of the Company’s Notes to Consolidated Financial Statements and Management’s Discussion & Analysis. The Company is currently unable to determine the ultimate outcome of this matter and therefore, is unable to determine the effects on its consolidated financial statements, but, the ultimate outcome could be material to its consolidated results of operations in one or more future periods.
• Risk of new governmental laws and regulations - Governmental laws and regulations, including those that affect
food advertising and marketing to children, use of certain ingredients in products, new labeling requirements, income and other taxes and tariffs, including the effects of possible changes to international trade agreements and income taxes such as a proposed “border tax” that could affect products manufactured in Canada and sold in the U.S.A. and imported raw materials, new taxes targeted toward confectionery products and the environment, both in and outside the U.S.A., are subject to change over time, which could adversely impact the Company’s results of operations and ability to compete in domestic or foreign marketplaces.
• Risk of labor stoppages - To the extent the Company experiences any significant labor stoppages, such disputes
or strikes could negatively affect shipments from suppliers or shipments of finished product. • Risk of impairment of goodwill or indefinite-lived intangible assets - In accordance with authoritative guidance,
goodwill and indefinite-lived intangible assets are not amortized but are subject to an impairment evaluation annually or more frequently upon the occurrence of a triggering event. Other long-lived assets are likewise tested for impairment upon the occurrence of a triggering event. Such evaluations are based on assumptions and variables including sales growth, profit margins and discount rates. Adverse changes in any of these variables could affect the carrying value of these intangible assets and the Company’s reported profitability.
• Risk of the cost of energy increasing - Higher energy costs would likely result in higher distribution, freight and
other operating costs. The Company may not be able to offset these cost increases or pass such cost increases onto customers in the form of price increases, which could have an adverse impact on the Company’s results of operations and financial condition.
• Risk of a product recall - Issues related to the quality and safety of the Company’s products could result in a
voluntary or involuntary large-scale product recall. Costs associated with a product recall and related litigation or fines, and marketing costs relating to the re-launch of such products or brands, could negatively affect operating results. In addition, negative publicity associated with this type of event, including a product recall relating to product contamination or product tampering, whether valid or not, could negatively impact future demand for the Company’s products.

7
• Risk of operational interruptions relating to computer software or hardware failures - The Company is reliant on computer systems to operate its business. Software failure or corruption, including cyber-based attacks or network security breaches, or catastrophic hardware failures or other disasters could disrupt communications, supply chain planning and activities relating to sales demand forecasts, materials procurement, production and inventory planning, customer shipments, and financial and accounting, all of which could negatively impact sales and profits.
• Risk of releasing sensitive information – Although the Company does not maintain a large amount of sensitive data, a system breach, whether inadvertent or perpetrated by hackers, could result in identity theft which could expose the Company to financial costs and adversely affect profitability.
• Risk of production interruptions - The majority of the Company’s products are manufactured in a single
production facility on specialized equipment. In the event of a disaster, such as a fire or earthquake, at a specific plant location, it would be difficult to transfer production to other facilities or a new location in a timely manner, which could result in loss of market share for the affected products. In addition, from time to time, the Company upgrades or replaces this specialized equipment. In many cases these are integrated and complex installations. A failure or delay in implementing such an installation could impact the availability of one or more of the Company’s products which would have an adverse impact on sales and profits.
• Risk related to international operations - To the extent there is political or social unrest, civil war, terrorism or
significant economic instability in the countries in which the Company operates, the results of the Company’s business in such countries could be adversely impacted. Currency exchange rate fluctuations between the U.S. dollar and foreign currencies could also have an adverse impact on the Company’s results of operations and financial condition. The Company’s principal markets are the U.S.A., Canada, and Mexico.
• Risk related to investments in marketable securities - The Company invests its surplus cash in a diversified
portfolio of highly rated marketable securities, including corporate and tax exempt municipal bonds, with maturities of generally up to three years, and variable rate demand notes with weekly resets of interest rates and “puts’ to redeem the investment each week.. Nonetheless, such investments could become impaired in the event of certain adverse economic and/or geopolitical events which, if severe, would adversely affect the Company’s financial condition.
• Disruption to the Company’s supply chain could impair the Company’s ability to produce or deliver its finished
products, resulting in a negative impact on operating results - Disruption to the manufacturing operations or supply chain, some of which are discussed above, could result from, but are not limited to natural disasters, pandemic outbreak of disease, weather, fire or explosion, terrorism or other acts of violence, unavailability of ingredients or packaging materials, labor strikes or other labor activities, operational and/or financial instability of key suppliers, and other vendors or service providers. Although precautions are taken to mitigate the impact of possible disruptions, if the Company is unable, or if it is not financially feasible to effectively mitigate the likelihood or potential impact of such disruptive events, the Company’s results of operations and financial condition could be negatively impacted.
• Risk related to acquisitions – From time to time, the Company has purchased other confectionery companies or
brands. These acquisitions generally come at a high multiple of earnings and are justified based on various assumptions related to sales growth, and operating margins. Were the Company to make another acquisition and be unable to achieve the assumed sales and operating margins, it could have an adverse impact on future sales and profits. In addition it could become necessary to record an impairment which would have a further adverse impact on reported profits.
• Risk of further losses in Spain – The Company has restructured its Spanish subsidiaries and is exploring a variety of programs to increase sales and profitability. However, the outcome of these efforts thus far have not been successful and additional losses are likely to be reported from these business units.

8
• Risk of “slack fill” litigation - The Company, as well as other confectionary and food companies, have experienced an increasing number of plaintiff claims that certain products are sold in boxes that are not completely full, and therefore such “slack filled” products are misleading, and even deceptive, to the consumer. Although the Company believes that these claims are without merit, the Company could be exposed to significant legal fees to defend its position, and in the event that it is not successful, could be subject to fines and costs of settlement.
• The Company is a controlled company due to the common stock holdings of the Gordon family - The Gordon family’s share ownership represents a majority of the combined voting power of all classes of the Company’s common stock as of December 31, 2016. As a result, the Gordon family has the power to elect the Company’s directors and approve actions requiring the approval of the shareholders of the Company.
The factors identified above are believed to be significant factors, but not necessarily all of the significant factors, that could impact the Company’s business. Unpredictable or unknown factors could also have material effects on the Company. Additional significant factors that may affect the Company’s operations, performance and business results include the risks and uncertainties listed from time to time in filings with the Securities and Exchange Commission and the risk factors or uncertainties listed herein or listed in any document incorporated by reference herein. ITEM 1B. Unresolved Staff Comments.
None. ITEM 2. Properties.
The Company owns its principal manufacturing, warehousing and distribution and offices facilities which are located in Chicago, Illinois in a building consisting of approximately 2,354,000 square feet. In addition, the Company leases manufacturing and warehousing facilities at a second location in Chicago which comprises 137,000 square feet. The lease is renewable by the Company every five years through June, 2041; the Company expects to renew this lease prior to termination. The Company also periodically leases additional warehousing space at this second location as needed on a month-to-month basis.
The Company’s other principal manufacturing, warehousing and distribution facilities, all of which are owned, are:
Location Square Feet (a)
Covington, Tennessee 685,000 Cambridge, Massachusetts 142,000 Delavan, Wisconsin 162,000 Concord, Ontario, Canada 280,500 (b) Hazelton, Pennsylvania 240,000 (c) Mexico City, Mexico 90,000 Barcelona, Spain 93,000 (d)
(a) Square footage is approximate and includes production, warehousing and office space. (b) Two facilities; a third owned facility, comprising 225,000 square feet of warehousing space, and which is excluded from the reported totals above, is leased to a third party. (c) Warehousing only. (d) Excludes 9,500 square feet of unused office space in a separate facility.
The Company owns substantially all of the production machinery and equipment located in its plants.
The Company also holds four commercial real estate properties for investment which were acquired with the proceeds from a sale of surplus real estate in 2005.

9
ITEM 3. Legal Proceedings.
There are no material pending legal proceedings known to the Company to which the Company or any of its subsidiaries is a party or of which any of their property is the subject, and no penalties have been imposed by the Internal Revenue Service on the Company. ADDITIONAL ITEM. Executive Officers of the Registrant.
See the information on Executive Officers set forth in the table in Part III, Item 10. ITEM 4. Mine Safety Disclosures.
None

10
PART II
ITEM 5. Market for Registrant’s Common Equity, Related Stockholder Matters and Issuer Purchases of Equity Securities.
The Company’s common stock is traded on the New York Stock Exchange. The Company’s Class B
common stock is subject to restrictions on transferability. The Class B common stock is convertible at the option of the holder into shares of common stock on a share-for-share basis. As of February 27, 2017, there were approximately 2,800 and 1,000 registered holders of record of common and Class B common stock, respectively. In addition, the Company estimates that as of February 27, 2017 there were 12,500 and 4,300 beneficial holders of common and Class B common stock, respectively.
The following table sets forth information about the shares of its common stock the Company purchased
on the open market during the fiscal quarter ended December 31, 2016:
Issuer Purchases of Equity Securities
Total Number of
Maximum Number (or
Total Average Shares Purchased Approximate Dollar Value) Number Price as Part of Publicly of Shares that May Yet of Shares Paid per Announced Plans be Purchased Under the Period Purchased Share or Programs Plans or Programs
Oct 1 to Oct 31 75,411 $ 35.48 Not Applicable Not Applicable Nov 1 to Nov 30 3,500 34.85 Not Applicable Not Applicable Dec 1 to Dec 31 — — Not Applicable Not Applicable Total 78,911 $ 35.45
While the Company does not have a formal or publicly announced Company common stock purchase program, the Company repurchases its common shares on the open market from time to time as authorized by the Board of Directors. Quarterly Stock Prices and Dividends
The high and low quarterly prices for the Company’s common stock, as reported on the New York Stock Exchange and quarterly dividends in 2016 and 2015 were:
2016 2015 4th 3rd 2nd 1st 4th 3rd 2nd 1st Quarter Quarter Quarter Quarter Quarter Quarter Quarter Quarter
High $ 41.55 $ 38.44 $ 39.54 $ 34.98 $ 32.85 $ 32.88 $ 34.34 $ 34.79 Low 34.35 36.48 34.08 30.41 30.85 30.37 30.34 29.24 Dividends per share 0.09 0.09 0.09 0.09 0.09 0.09 0.09 0.08
NOTE: In addition to the above cash dividends, a 3% stock dividend was issued on April 8, 2016 and
April 10, 2015. Performance Graph
The following performance graph compares the cumulative total shareholder return on the Company’s common stock for a five-year period (December 31, 2011 to December 31, 2016) with the cumulative total return of Standard & Poor’s 500 Stock Index (“S&P 500”) and the Dow Jones Industry Food Index (“Peer Group,” which includes

11
the Company), assuming (i) $100 invested on December 31 of the first year of the chart in each of the Company’s common stock, S&P 500 and the Dow Jones Industry Food Index and (ii) the reinvestment of cash and stock dividends.

12
ITEM 6. Selected Financial Data. Five Year Summary of Earnings and Financial Highlights
(Thousands of dollars except per share, percentage and ratio figures)
Sales and Earnings Data Net product sales $ 517,373 $ 536,692 $ 539,895 $ 539,627 $ 545,985 Product gross margin 197,083 196,602 198,962 188,667 180,412 Interest expense 105 76 99 92 137 Provision for income taxes 30,593 26,451 28,434 23,634 22,160 Net earnings attributable to Tootsie Roll
Industries, Inc. 67,510 66,089 63,298 60,849 52,004 % of net product sales 13.0 % 12.3 % 11.7 % 11.3 % 9.5 % % of shareholders’ equity 9.5 % 9.5 % 9.2 % 8.9 % 8.0 %
Per Common Share Data (1)(2) Net earnings attributable to Tootsie Roll
Industries, Inc. $ 1.08 $ 1.04 $ 0.99 $ 0.94 $ 0.79 Cash dividends declared 0.36 0.35 0.32 0.32 0.82 Stock dividends 3 % 3 % 3 % 3 % 3 %
Additional Financial Data (1) Working capital $ 235,739 $ 221,744 $ 200,162 $ 179,990 $ 136,476 Net cash provided by operating activities 98,550 91,073 88,769 109,823 101,418 Net cash provided by (used in) investing
activities (51,884) (8,523) (30,459) (47,963) (40,435) Net cash used in financing activities (51,387) (53,912) (44,664) (37,425) (76,234) Property, plant & equipment additions 16,090 15,534 10,704 15,752 8,886 Net property, plant & equipment 180,905 184,586 190,081 196,916 201,290 Total assets 920,101 908,983 910,386 888,409 846,737 Long-term debt 7,500 7,500 7,500 7,500 7,500 Total Tootsie Roll Industries, Inc.
shareholders’ equity 711,364 698,183 690,809 680,305 649,815 Average shares outstanding 62,239 63,256 64,173 65,010 65,859
(1) Per common share data and average shares outstanding adjusted for annual 3% stock dividends. (2) The fourth quarter 2012 includes a $0.50 special dividend.

13
ITEM 7. Management’s Discussion and Analysis of Financial Condition and Results of Operations. (in thousands except per share, percentage and ratio figures)
The following discussion should be read in conjunction with the other sections of this report, including the consolidated financial statements and related notes contained in Item 8 of this Form 10-K. FINANCIAL REVIEW
This financial review discusses the Company’s financial condition, results of operations, liquidity and capital resources, significant accounting policies and estimates, new accounting pronouncements, market risks and other matters. It should be read in conjunction with the Consolidated Financial Statements and related Notes that follow this discussion. FINANCIAL CONDITION The Company’s overall financial position remains very strong as a result of its higher net earnings and strong cash flows provided by operating activities. Cash flows from 2016 operating activities totaled $98,550 and were used to pay cash dividends of $22,266, purchase and retire $29,093 of its outstanding shares, make capital expenditures of $16,090, and add to the Company’s marketable securities investments. The Company’s net working capital was $235,739 at December 31, 2016 compared to $221,744 at December 31, 2015 which generally reflects higher aggregate cash, cash equivalents and short-term investments. As of December 31, 2016, the Company’s total cash, cash equivalents and investments, including all long-term investments in marketable securities, was $351,323 compared to $321,230 at December 31, 2015, an increase of $30,093. The aforementioned includes $67,995 and $60,584 in trading securities as of December 31, 2016 and 2015, respectively. The Company invests in trading securities to provide an economic hedge for its deferred compensation liabilities, as further discussed herein and in Note 7 of the Company’s Notes to Consolidated Financial Statements. Shareholders’ equity increased from $698,183 at December 31, 2015 to $711,364 as of December 31, 2016, principally reflecting 2016 net earnings of $67,510, less cash dividends of $22,266, share repurchases of $29,093, and an increase in accumulated other comprehensive loss, primarily foreign translation, of $2,882 during 2016. The Company has a relatively straight-forward financial structure and has historically maintained a conservative financial position. Except for an immaterial amount of operating leases, the Company has no special financing arrangements or “off-balance sheet” special purpose entities. Cash flows from operations plus maturities of short-term investments are expected to be adequate to meet the Company’s overall financing needs, including capital expenditures, in 2017. Periodically, the Company considers possible acquisitions, and if the Company were to pursue and complete such an acquisition, that could result in bank borrowings or other financing. RESULTS OF OPERATIONS 2016 vs. 2015 Twelve months 2016 consolidated net sales were $517,373 compared to $536,692 in twelve months 2015, a decrease of $19,319 or 3.6%. Twelve months 2016 consolidated sales were adversely affected by currency translation of $3,473 due to a stronger U.S. dollar in 2016 compared to 2015, principally relating to Mexico and Canada. The timing of sales between fourth quarter 2016 and first quarter 2017 also had some adverse effect on twelve months 2016 sales when compared to the twelve months in the prior year. The Company had higher sales price realization in 2016 compared to 2015 in order to recover increased costs for ingredients and certain other inputs. Fourth quarter 2016 net sales were $124,279 compared to $139,881 in fourth quarter 2015, a decrease of $15,602 or 11.2%. Fourth quarter 2016 net sales were adversely affected by the timing of certain customer sales at both the beginning and end of the quarter when compared to the prior year fourth quarter in 2015. Unfavorable foreign exchange also contributed to lower sales in fourth quarter 2016 compared to the

14
prior year corresponding period. The Company’s sales results in the United States continue to reflect the challenges of many of the Company’s retail customers including their profit margin pressures and other competitive factors. Product cost of goods sold were $320,290 in 2016 compared to $340,090 in 2015, a decrease of $19,800 or 5.8%. Product cost of goods sold includes $1,137 and $497 in certain deferred compensation expenses in 2016 and 2015, respectively. These deferred compensation expenses principally result from changes in the market value of investments and investment income from trading securities relating to compensation deferred in previous years and are not reflective of current operating results. Adjusting for the aforementioned, product cost of goods sold decreased from $339,593 in 2015 to $319,153 in 2016, a decrease of $20,440 or 6.0%. As a percent of net product sales, these adjusted costs decreased from 63.3% in 2015 to 61.7% in 2016, a favorable decrease of 1.6% as a percent of net product sales. Higher price realization on sales, continuing improvements in manufacturing plant efficiencies driven by capital investments, and ongoing cost containment programs contributed to this improvement in lower costs of goods sold and the resulting improvement in gross profit margins in twelve months 2016 compared to 2015. Higher costs for ingredients and additional manufacturing costs relating to changes in product labeling requirements adversely affected gross profit margins in 2016. These higher manufacturing costs in 2016 include the effects of lower production volumes runs for many products in order to reduce and minimize finished goods inventory levels and additional costs to meet new product labeling requirements. This inventory reduction was in response to uncertainties surrounding changes in state and national labeling regulations and requirements during 2016. The Company is continuing its focus on cost reductions and savings, including savings resulting from capital investments, in order to achieve manufacturing efficiencies and productivity improvements. The Company has made progress on restoring margins to their historical levels before the increases in commodity and other input costs in past years. Selling, marketing and administrative expenses were $107,377 in 2016 compared to $108,051 in 2015, a decrease of $674 or 0.6%. Selling, marketing and administrative expenses include $3,138 and $953 in certain deferred compensation expenses in 2016 and 2015, respectively. These deferred compensation expenses principally result from changes in the market value of investments and investment income from trading securities relating to compensation deferred in previous years and are not reflective of current operating results. Adjusting for the aforementioned, these expenses decreased from $107,098 in 2015 to $104,239 in 2016, a decrease of $2,859 or 2.7%. As a percent of net product sales, these adjusted expenses increased slightly from 20.0% of net product sales in 2015 to 20.1% of net product sales in 2016, a 0.1% unfavorable increase as a percentage of sales. Selling, marketing and administrative expenses include $40,629 and $42,619 of freight, delivery and warehousing expenses in 2016 and 2015, respectively, were 7.9% of net product sales in both 2016 and 2015. Internal expense reduction initiatives mitigated some of the higher costs of freight, delivery and warehousing in 2016 compared to 2015. The company has foreign operating businesses in Mexico, Canada and Spain, and exports products to many foreign markets. The strength of the U.S. dollar and related devaluations of most these related foreign currencies, primarily Mexico and Canada, have adversely affected these foreign and export operations in 2016 compared to 2015. The operating income of these foreign and export operations decreased by $3,269 in 2016 compared to 2015. The Company currently has a 93% ownership of two Spanish companies (93% and 83% ownership at December 31, 2016 and 2015, respectively) which had operating losses for each of the years 2008 through 2016. Company management has restructured the Spanish operations and made other changes to its business plan but these companies continue to have operating losses. Management believes that the business, competitive and economic challenges in Spain are likely to continue, and therefore, additional cash financing of these Spanish companies will be required in 2017. The Company believes that the carrying values of its goodwill and trademarks have indefinite lives as they are expected to generate cash flows indefinitely. In accordance with current accounting guidance, these indefinite-lived intangible assets are assessed at least annually for impairment as of December 31 or whenever events or circumstances indicate that the carrying values may not be recoverable from future cash flows. No impairments were recorded in 2016, 2015 or 2014. The fair values of trademarks are assessed each year using the present value of estimated future cash flows and estimated royalties. Based on the Company’s estimate at December 31, 2016, the individual fair values of the indefinite lived intangible assets exceed the net book value by more than 10%. For certain trademarks, holding all other assumptions constant at the test date, a 100 basis point increase in the discount rate or a 100 basis point decrease in the royalty rate would reduce the fair value of certain trademarks by approximately 15% and 10%, respectively. Individually, a 100 basis

15
point increase in the discount rate or a 100 basis point decrease in the royalty rate would not result in a potential impairment as of December 31, 2016. Earnings from operations were $92,414 in 2016 compared to $91,082 in 2015, an increase of $1,332. Earnings from operations include $4,275 and $1,450 in certain deferred compensation expense in 2016 and 2015, respectively, which are discussed above. Adjusting for these deferred compensation expenses, earnings from operations increased from $92,532 in 2015 to $96,689 in 2016, an increase of $4,157 or 4.5%. Although ingredient costs and results from foreign operations adversely affected adjusted 2016 earnings from operations, higher price realization on sales and the cost and expense reductions, as discussed above, allowed the Company to achieve these higher adjusted operating earnings in 2016 despite the decline in 2016 net sales compared to 2015. Management believes the comparisons presented in the preceding paragraphs, after adjusting for changes in deferred compensation, are more reflective of the underlying operations of the Company. Other income, net was $5,498 in 2016 compared to $1,496 in 2015, an increase of $4,002. Other income, net principally reflects $4,275 and $1,450 of aggregate net gains and investment income on trading securities in 2016 and 2015, respectively. These trading securities provide an economic hedge of the Company’s deferred compensation liabilities; and the related net gains and investment income were offset by a like amount of expense in aggregate product cost of goods sold and selling, marketing, and administrative expenses in the respective years as discussed above. Other income, net includes investment income on available for sale securities, including variable rate demand notes, of $2,130 and $1,421 in 2016 and 2015, respectively. Other income, net also includes foreign exchange losses of $955 and $1,427 in 2016 and 2015, respectively. The consolidated effective tax rate was 31.2% and 28.6% in 2016 and 2015, respectively. The lower effective tax rate for 2015 principally reflects benefits from favorable prior year income tax settlements, including a $1,066 release of an uncertain income tax liability resulting from a decision by a foreign court in second quarter 2015. A reconciliation of the differences between the U.S. statutory rate and these effective tax rates is provided in Note 4 of the Company’s Notes to Consolidated Financial Statements. At December 31, 2016 and 2015, the Company’s deferred tax assets include $6,346 and $8,122 of income tax benefits relating to its Canadian subsidiary tax loss carry-forwards which the Company expects to realize before their expiration dates (2028 through 2031). The Company utilized $1,776 and $2,758 of these tax carry-forward benefits in 2016 and 2015, respectively. The Company has concluded that it is more-likely-than-not that it would realize these deferred tax assets relating to its Canadian tax loss carry-forwards because it is expected that sufficient levels of taxable income will be generated during the carry-forward periods. The Company has provided a full valuation allowance on its Spanish subsidiaries’ tax loss carry-forward benefits of $2,106 and $1,834 as of December 31, 2016 and 2015, respectively, because the Company has concluded that it is not more-likely-than-not that these losses will be utilized before their expiration dates. The Spanish subsidiaries have a history of net operating losses and it is not known when and if they will generate taxable income in the future. The Company has not provided for U.S. federal or foreign withholding taxes on approximately $22,081 and $20,174 of foreign subsidiaries’ undistributed earnings as of December 31, 2016 and December 31, 2015, respectively, because such earnings are considered to be permanently reinvested. The Company estimates that the federal income tax liability on such undistributed earnings would approximate 30% of these amounts. Net earnings attributable to Tootsie Roll Industries, Inc. were $67,510 in 2016 compared to $66,089 in 2015, and earnings per share were $1.08 and $1.04 in 2016 and 2015, respectively, an increase of $0.04 per share or 3.8%. As discussed above, net earnings principally benefited from higher price realization on domestic sales and cost and expense reductions, although higher ingredient costs, lower foreign operating income, and the adverse effects of lower sales mitigated some of these benefits. In addition, a lower effective income tax rate in prior year 2015 adversely affects the comparison to 2016 net earnings. Earnings per share in 2016 benefited from the reduction in average shares outstanding resulting from purchases of the Company’s common stock in the open market by the Company. Average shares outstanding decreased from 63,256 in 2015 to 62,239 in 2016. Fourth quarter 2016 net earnings were $17,841 compared to $19,705 in fourth quarter 2015, and net earnings per share were $.29 and $.31 in fourth quarter 2016 and 2015, respectively, a decrease of $.02 or 6%. The above discussed factors also impacted fourth quarter 2016, however, the above discussed net benefits were not enough to overcome the adverse impact of the sales decline in fourth quarter 2016. Net earnings in the prior year fourth quarter 2015 also benefited from a lower effective income tax rate, including the effects of favorable income tax settlements, which adversely affects the comparison to the fourth quarter 2016 corresponding period.

16
Beginning in 2012, the Company received periodic notices from the Bakery, Confectionery, Tobacco Workers and Grain Millers International Union Pension Plan (Plan), a multi-employer defined benefit pension plan for certain Company union employees, that the Plan’s actuary certified the Plan to be in “critical status”, the “Red Zone”, as defined by the Pension Protection Act (PPA) and the Pension Benefit Guaranty Corporation (PBGC); and that a plan of rehabilitation was adopted by the trustees of the Plan in fourth quarter 2012. During 2015, the Company received notices that the Plan’s status was changed to “critical and declining status”, as defined by the PPA and PBGC, for the plan year beginning January 1, 2015, and that the Plan was projected to have an accumulated funding deficiency for the 2017 through 2024 plan years. A designation of “critical and declining status” implies that the Plan is expected to become insolvent in the next 20 years. In April 2016, the Company received new notices that the Plan’s trustees adopted an updated Rehabilitation Plan effective January 1, 2016, and that the Plan remains in “critical and declining status” and is projected to become insolvent in 14 years. These new notices also advise that the Plan trustees are considering the reduction or elimination of certain retirement benefits and may seek assistance from the PBGC. Plans in “critical and declining status” may elect to suspend (temporarily or permanently) some benefits payable to all categories of participants, including retired participants, except retirees that are disabled or over the age of 80. Suspensions must be equally distributed and cannot drop below 110% of what would otherwise be guaranteed by the PBGC. Based on these updated notices, the Plan’s funded percentage (plan investment assets as a percentage of plan liabilities), as defined, were 62.8%, 65.1% and 66.4% as of the most recent valuation dates available, January 1, 2015, 2014, and 2013, respectively (these valuation dates are as of the beginning of each Plan year). These funded percentages are based on actuarial values, as defined, and do not reflect the actual market value of Plan investments as of these dates. If the market value of investments had been used as of January 1, 2015 the funded percentage would be 59.8% (not 62.8%). The Plan’s market value of it investments declined by 9.3% in 2015 and its unfunded vested benefits increased by 6.8%. As of the January 1, 2015 valuation date (most recent valuation available), only 20% of Plan participants were current active employees, 51% were retired or separated from service and receiving benefits, and 29% were retired or separated from service and entitled to future benefits. The number of current active employee Plan participants as of January 1, 2015 fell 3% from the previous year and 6% over the past two years. When compared to the Plan valuation date of January 1, 2011 (four years earlier), current active employees participants have declined 30%, whereas participants who were retired or separated from service and receiving benefits increased 6% and participants who were retired or separated from service and entitled to future benefits increased 9%. The bankruptcy of a major participating employer in the Plan contributed to the above discussed Plan results.
The Company has been advised that its withdrawal liability would have been $72,700, $61,000 and $56,400 if it had withdrawn from the Plan during 2016, 2015 and 2014, respectively. The increase from 2015 to 2016 principally reflects poor investment returns of the plan in 2015, a decrease in the PBGC interest rates, and a higher share of the Plan’s unfunded vested benefits allocated to the Company. Based on the above, including the Plan’s projected insolvency in 14 years, management believes that the Company’s withdrawal liability will likely increase further in future years. Based on the Company’s actuarial study and certain provisions in ERISA and the law relating to withdrawal liability payments, management believes that the Company’s liability would likely be limited to twenty annual payments of $2,914 which have a present value in the range of $34,200 to $44,700. The aforementioned is based on a range of valuation interest rates which management understands is provided under the statute. Should the Company actually withdraw from the Plan at a future date, a withdrawal liability, which could be higher than the above discussed amounts, could be payable to the Plan.
The Company’s existing labor contract with the local union commits the Company’s participation in this Plan through third quarter 2017. The amended rehabilitation plan, which continues, requires that employer contributions include 5% compounded annual surcharge increases each year for an unspecified period of time beginning January 2013 (in addition to the 5% interim surcharge initiated in June 2012) as well as certain plan benefit reductions. The Company’s pension expense for this Plan for 2016 and 2015 was $2,541 and $2,574, respectively. The aforementioned expense includes surcharges of $542 and $447 in 2016 and 2015, respectively, as required under the plan of rehabilitation as amended.
The Company is currently unable to determine the ultimate outcome of the above discussed multi-employer union pension matter and therefore is unable to determine the effects on its consolidated financial statements, but the ultimate outcome or the effects of any modifications to the current rehabilitation plan could be material to its consolidated results of

17
operations or cash flows in one or more future periods. See also Note 7 in the Company’s Consolidated Financial Statements on Form 10-K for the year ended December 31, 2016. 2015 vs. 2014 Although twelve months 2015 consolidated sales were $536,692 compared to $539,895 in 2014, a decrease of $3,203 or 0.6%, twelve months 2015 domestic sales were 1.0% ahead of twelve months 2014 domestic sales. Twelve months 2015 consolidated sales were adversely affected by currency translation of $8,191 due to a stronger U.S. dollar in 2015 compared to 2014, principally relating to Mexico and Canada. While the Company finished 2015 with a 3.0% increase in fourth quarter domestic (U.S.A.) sales, the Company’s consolidated sales in fourth quarter 2015, which includes foreign operations and exports, were $139,881, an increase of 1.4% compared to fourth quarter 2014. Fourth quarter 2015 foreign sales were also adversely impacted by foreign exchange due to the strength of the U.S. dollar. Product cost of goods sold were $340,090 in 2015 compared to $340,933 in 2014, a decrease of $843 or 0.2%. Product cost of goods sold includes $497 and $1,140 in certain deferred compensation expenses in 2015 and 2014, respectively. These deferred compensation expenses principally result from changes in the market value of investments and investment income from trading securities relating to compensation deferred in previous years and are not reflective of current operating results. Adjusting for the aforementioned, these costs decreased from $339,793 in 2014 to $339,593 in 2015, a decrease of $200 or 0.1%. As a percent of net product sales, these adjusted costs increased from 62.9% in 2014 to 63.3% in 2015, an unfavorable increase of 0.4% as a percent of net product sales. Although the Company’s overall comparative ingredient costs were somewhat more favorable in 2015, certain key ingredient costs were higher in 2015 compared to 2014, and the Company expects higher overall ingredient costs in 2016. The Company’s product gross margins also benefited from manufacturing plant efficiencies driven by capital investments and cost containment programs, but were adversely affected by higher manufacturing plant overhead costs. Selling, marketing and administrative expenses were $108,051 in 2015 compared to $117,722 in 2014, a decrease of $9,671 or 8.2%. Selling, marketing and administrative expenses include $953 and $3,761 in certain deferred compensation expenses in 2015 and 2014, respectively. These deferred compensation expenses principally result from changes in the market value of investments and investment income from trading securities relating to compensation deferred in previous years and are not reflective of current operating results. Adjusting for the aforementioned, these expenses decreased from $113,961 in 2014 to $107,098 in 2015, a decrease of $6,863 or 6.0%. As a percent of net product sales, these adjusted expenses decreased from 21.1% of net product sales in 2014 to 20.0% of net product sales in 2015, a 1.1% favorable decrease as a percentage of sales. Selling, marketing and administrative expenses include $42,619 and $46,525 of freight, delivery and warehousing expenses in 2015 and 2014, respectively, which decreased from 8.6% of net product sales in 2014 to 7.9% of net product sales in 2015. This expense reduction reflects lower distribution and delivery expenses including the effects of declining energy and fuel costs and internal initiatives to reduce expense. Earnings from operations were $91,082 in 2015 compared to $83,923 in 2014, an increase of $7,159. Earnings from operations include $1,450 and $4,901 in certain deferred compensation expense in 2015 and 2014, respectively, which are discussed above. Adjusting for these deferred compensation expenses, earnings from operations increased from $88,824 in 2014 to $92,532 in 2015, an increase of $3,708 or 4.2%. This increase in 2015 earnings from operations principally reflects the benefits of higher domestic (U.S.A.) sales and the cost and expense reductions discussed above. Management believes the comparisons presented in the preceding paragraphs, after adjusting for changes in deferred compensation, are more reflective of the underlying operations of the Company. Other income, net was $1,496 in 2015 compared to $7,371 in 2014, a decrease of $5,875. Other income, net principally reflects $1,450 and $4,901 of aggregate net gains and investment income on trading securities in 2015 and 2014, respectively. Other income, net includes investment income on available for sale securities of $1,421 and $1,582 in 2015 and 2014, respectively; and foreign exchange losses of $1,427 and $861 in 2015 and 2014, respectively. In addition, prior year first quarter and 2014 other income, net includes a pre-tax gain of approximately $1,800 ($529 after-tax loss) resulting from the step acquisition of the two Spanish companies as discussed below.

18
The consolidated effective tax rate was 28.6% and 31.1% in 2015 and 2014, respectively. The lower effective tax rate for 2015 principally reflects a $1,066 release of an uncertain income tax liability, and resulting income tax benefit, due to a decision by a foreign court issued in second quarter 2015, and the reversal of deferred tax assets of $2,350 (and increase in income tax expense) in first quarter 2014 relating to the step acquisition of the Spanish companies. The Company utilized $2,758 and $1,632 of Canadian tax loss carry-forward benefits in 2015 and 2014, respectively. Net earnings attributable to Tootsie Roll Industries, Inc. were $66,089 in 2015 compared to $63,298 in 2014, and earnings per share were $1.04 and $0.99 in 2015 and 2014, respectively, an increase of $0.05 or 5.1%. Net earnings principally benefited from higher domestic sales, cost and expense reductions, and a lower effective income tax rate which are discussed above. Earnings per share in 2015 benefited from the reduction in average shares outstanding resulting from purchases of the Company’s common stock in the open market by the Company. Average shares outstanding decreased from 64,173 in 2014 to 63,256 in 2015. During first quarter 2014, the Company gained operating control of its two 50% owned Spanish companies (93% and 83% owned at December 31, 2016 and 2015, respectively) when Company employee representatives assumed all positions on their boards of directors. This was considered a step acquisition, whereby the Company remeasured the previously held investment to fair value in first quarter 2014. As a result, the Company’s first quarter 2014 net earnings include a net loss of $529, including an additional income tax provision of $2,350 relating to deferred income taxes. During 2014 and 2015, the Company further increased its control and ownership to 83% by purchasing and subscribing to additional common shares of its Spanish subsidiaries. These Spanish companies had operating losses for each of the years 2008 through 2015 (and in 2016). LIQUIDITY AND CAPITAL RESOURCES Cash flows from operating activities were $98,550, $91,073 and $88,769 in 2016, 2015 and 2014, respectively. The $7,977 increase in cash flows from operating activities from 2015 to 2016 primarily reflects decreases in accounts receivable and inventories, net of a decrease in income taxes payable. Cash flows from 2015 operating activities benefited from decreases in inventories and prepaid expenses and other assets but were adversely affected by increases in accounts receivable and changes in deferred compensation and other liabilities which principally relate to the payment of certain deferred compensation during 2015. The Company manages and controls a VEBA trust, to fund the estimated future costs of certain employee health, welfare and other benefits. No contributions were made to this trust during 2016 and 2015. The Company is using these funds to pay the actual cost of such benefits through third quarter 2017. At December 31, 2016 and 2015, the VEBA trust held $3,027 and $6,727, respectively, of aggregate cash and cash equivalents. This asset value is included in prepaid expenses and long-term other assets in the Company’s Consolidated Statement of Financial Position. These assets are categorized as Level 1 within the fair value hierarchy. Cash flows from investing activities reflect capital expenditures of $16,090, $15,534, and $10,704 in 2016, 2015 and 2014, respectively. The changes in amounts each year principally reflects the timing of expenditures relating to plant manufacturing projects. Company management has recently committed approximately $15,000 to a manufacturing plant rehabilitation upgrade and expansion of one of its manufacturing plants in the U.S.A. Management’s projected cash outlays for this project are approximately $5,000 in 2017, $9,000 in 2018, and $1,000 in 2019 and 2020. Other than the aforementioned project, management believes that 2017 capital expenditures will be in line with its historical annual capital spending. All capital expenditures are to be funded from the Company’s cash flow from operations and internal sources including available for sale securities. Other than the bank loans and the related restricted cash of the Company’s Spanish subsidiaries, which are discussed in Note 1 of the Company’s Notes to Consolidated Financial Statements, the Company had no bank borrowings or repayments in 2014, 2015, or 2016, and had no outstanding bank borrowings as of December 31, 2015 or 2016. Nonetheless, the Company would consider bank borrowing or other financing in the event that a business acquisition is completed.

19
Financing activities include Company common stock purchases and retirements of $29,093, $33,004, and $25,020 in 2016, 2015 and 2014, respectively. Cash dividends of $22,266, $20,775, and $19,241 were paid in 2016, 2015 and 2014, respectively. SIGNIFICANT ACCOUNTING POLICIES AND ESTIMATES Preparation of the Company’s financial statements involves judgments and estimates due to uncertainties affecting the application of accounting policies, and the likelihood that different amounts would be reported under different conditions or using different assumptions. The Company bases its estimates on historical experience and other assumptions, as discussed herein, that it believes are reasonable. If actual amounts are ultimately different from previous estimates, the revisions are included in the Company’s results of operations for the period in which the actual amounts become known. The Company’s significant accounting policies are discussed in Note 1 of the Company’s Notes to Consolidated Financial Statements. Following is a summary and discussion of the more significant accounting policies and estimates which management believes to have a significant impact on the Company’s operating results, financial position, cash flows and footnote disclosure. Revenue recognition Revenue, net of applicable provisions for discounts, returns, allowances and certain advertising and promotional costs, is recognized when products are delivered to customers based on an accepted customer purchase order. These include quantity, sales price and other relevant terms of sale, and collectability is reasonably assured. The accounting for promotional costs is discussed under “Customer incentive programs, advertising and marketing” below. Accounts receivable are unsecured. Provisions for bad debts are recorded as selling, marketing and administrative expenses. Write-offs of bad debts did not exceed 0.1% of net product sales in each of 2016, 2015 and 2014, and accordingly, have not been significant to the Company’s financial position or results of operations. Shipping and handling costs are included in selling, marketing and administrative expenses. Intangible assets The Company’s intangible assets consist primarily of goodwill and acquired trademarks. In accordance with accounting guidance, goodwill and other indefinite-lived assets, trademarks, are not amortized, but are instead subjected to annual testing for impairment unless certain triggering events or circumstances are noted. The Company performs its annual impairment testing as of December 31. All trademarks have been assessed by management to have indefinite lives because they are expected to generate cash flows indefinitely. The Company tests trademarks (non-amortizable intangible assets) for impairment by comparing the fair value of each trademark with its carrying value. The Company determines the fair value of trademarks using discounted cash flows and estimates of royalty rates. If the carrying value exceeds fair value, the trademark is considered impaired and is reduced to fair value. The Company may utilize third-party professional valuation firms to assist in the determination of valuation of certain trademarks. Impairments have not generally historically been material to the Company’s historical operating results. With respect to impairment testing of goodwill, the first step compares the reporting unit’s estimated fair value with its carrying value. The Company estimates a reporting unit’s fair value using projected discounted cash flows. If the carrying value of a reporting unit’s net assets exceeds its fair value, the second step is applied to measure the difference between the carrying value and implied fair value of goodwill. If the carrying value of goodwill exceeds its implied fair value, the goodwill is considered impaired and reduced to its implied fair value.

20
The cash flow projections discussed above requires the Company to make assumptions and estimates regarding the Company’s future plans, including sales projections and profit margins, market based discount rates, competitive factors, and economic conditions; and the Company’s actual results and conditions may differ over time. A change in the assumptions relating to the impairment analysis of goodwill and trademarks, including but not limited to a reduction in projected cash flows, the use of a different discount rate to discount future cash flows or a different royalty rate applied to the Company’s trademarks, could cause impairment in the future. Customer incentive programs, advertising and marketing Advertising and marketing costs are recorded in the period to which such costs relate. The Company does not defer the recognition of any amounts on its consolidated balance sheet with respect to such costs. Customer incentives and other promotional costs, including consumer coupon (price reduction) incentives, are recorded at the time of the Company’s sale based upon incentive program terms and historical utilization statistics, which are generally consistent from year to year. The liabilities associated with these programs are reviewed quarterly and adjusted if utilization rates differ from management’s original estimates. Such adjustments have not historically been material to the Company’s operating results. Split dollar officer life insurance The Company provides split dollar life insurance benefits to certain executive officers and records an asset principally equal to the cumulative premiums paid. The Company will fully recover these premiums in future years under the terms of the plan. The Company retains a collateral assignment of the cash surrender values and policy death benefits payable to insure recovery of these premiums. Valuation of long-lived assets Long-lived assets, primarily property, plant and equipment, are reviewed for impairment as events or changes in business circumstances occur indicating that the carrying value of the asset may not be recoverable. The estimated cash flows produced by assets or asset groups, are compared to the asset carrying value to determine whether impairment exists. Such estimates involve considerable management judgment and are based upon assumptions about expected future operating performance. As a result, actual cash flows could differ from management’s estimates due to changes in business conditions, operating performance, and economic and competitive conditions. Such impairments have not historically been material to the Company’s operating results. Income taxes Deferred income taxes are recognized for future tax effects of temporary differences between financial and income tax reporting using tax rates in effect for the years in which the differences are expected to reverse. The Company records valuation allowances in situations where the realization of deferred tax assets, including those relating to net operating tax losses, is not more-likely-than-not; and the Company adjusts and releases such valuation allowances when realization becomes more-likely-than-not as defined by accounting guidance. The Company periodically reviews assumptions and estimates of the Company’s probable tax obligations and effects on its liability for uncertain tax positions, using informed judgment which may include the use of third-party consultants, advisors and legal counsel, as well as historical experience. Valuation of investments Investments primarily comprise corporate and municipal (tax-free) bonds, including variable rate demand notes (generally long term bonds where interest rates are reset weekly, and provide a weekly “put” which allows the holder to also sell each week with no loss in principal), which are reviewed for impairment at each reporting period by comparing the carrying value or amortized cost to the fair market value. In the event that an investment security’s fair value is below carrying value or amortized cost, the Company will record an other-than-temporary impairment or a temporary impairment based on accounting guidance. The Company’s investment policy, which guides investment decisions, is focused on high quality investments which mitigates the risk of impairment. The Company may utilize third-party professional valuation firms as necessary to assist in the determination of the value of investments that utilize Level 3 inputs (as defined by guidance) should any of its investments be downgraded to such level.

21
Other matters In the opinion of management, other than contracts for foreign currency forwards and raw materials, including currency and commodity hedges and outstanding purchase orders for packaging, ingredients, supplies, and operational services, all entered into in the ordinary course of business, the Company does not have any significant contractual obligations or future commitments. The Company’s outstanding contractual commitments as of December 31, 2016, all of which are generally normal and recurring in nature, are summarized in the chart which follows below.
RECENT ACCOUNTING PRONOUNCEMENTS
See Note 1 of the Company’s Notes to Consolidated Financial Statements. MARKET RISKS The Company is exposed to market risks related to commodity prices, interest rates, investments in marketable securities, equity price and foreign exchange. The Company’s ability to forecast the direction and scope of changes to its major input costs is impacted by significant potential volatility in crude oil and energy, sugar, corn, edible oils, cocoa and cocoa powder, and dairy products markets. The prices of these commodities are influenced by changes in global demand, changes in weather and crop yields, including the possible effects of climate change, changes in import tariffs and governments’ farm policies, including mandates for ethanol and bio-fuels, environmental matters, fluctuations in the U.S. dollar relative to dollar-denominated commodities in world markets, and in some cases, geo-political risks. The Company believes that its competitors face the same or similar challenges. In order to address the impact of changes in input and other costs, the Company periodically reviews each item in its product portfolio to ascertain if price realization adjustments or other actions should be taken. These reviews include an evaluation of the risk factors relating to market place acceptance of such changes and their potential effect on future sales volumes. In addition, the estimated cost of packaging modifications associated with weight changes is evaluated. The Company also maintains ongoing cost reduction and productivity improvement programs under which cost savings initiatives are encouraged and progress monitored. The Company is not able to accurately predict the outcome of these cost savings initiatives and their effects on its future results. Changes in U.S.A. tax policy, including a “border tax” and possible new tariffs on foreign imports which are under discussion, could have an adverse impact on such products made in Canada and sold in the U.S.A. as well as certain other ingredients and materials which are imported. Commodity future and foreign currency forward contracts Commodity price risks relate to ingredients, primarily sugar, cocoa and cocoa powder, chocolate, corn syrup, dextrose, edible oils, milk, whey and gum base ingredients. The Company believes its competitors face similar risks, and the industry has historically adjusted prices, and/or product weights, to compensate for adverse fluctuations in commodity costs. The Company, as well as competitors in the confectionery industry, has historically taken actions, including higher price realization to mitigate rising input costs for ingredients, packaging, labor and fringe benefits, energy, and freight and delivery. Although management seeks to substantially recover cost increases over the long-term, there is risk that higher price realization cannot be fully passed on to customers and, to the extent they are passed on, they could adversely affect customer and consumer acceptance and resulting sales volume. The Company utilizes commodity futures contracts, as well as annual supply agreements, to hedge and plan for anticipated purchases of certain ingredients, including sugar, in order to mitigate commodity cost fluctuation. The Company also may purchase forward foreign exchange contracts to hedge its costs of manufacturing certain products in Canada for sale and distribution in the United States (U.S.A.), and periodically does so for purchases of equipment or raw materials from

22
foreign suppliers. Such commodity futures and currency forward contracts are cash flow hedges and are effective as hedges as defined by accounting guidance. The unrealized gains and losses on such contracts are deferred as a component of accumulated other comprehensive loss (or gain) and are recognized as a component of product cost of goods sold when the related inventory is sold. The potential change in fair value of commodity and foreign currency derivative instruments held by the Company at December 31, 2016, assuming a 10% change in the underlying contract price, was $1,317. The analysis only includes commodity and foreign currency derivative instruments and, therefore, does not consider the offsetting effect of changes in the price of the underlying commodity or foreign currency. This amount is not significant compared with the net earnings and shareholders’ equity of the Company. Interest rates Interest rate risks primarily relate to the Company’s investments in marketable securities with maturities dates of generally up to three years. The majority of the Company’s investments, which are classified as available for sale, have historically been held until their maturity, which limits the Company’s exposure to interest rate fluctuations. The Company also invests in variable rate demand notes which have interest rates which are reset weekly and can be “put back” and sold each week through a remarketing agent, generally a large financial broker, which also substantially eliminates the Company’s exposure to interest rate fluctuations on the principal invested. The accompanying chart summarizes the maturities of the Company’s investments in debt securities at December 31, 2016.
Less than 1 year $ 67,513 1 – 2 years 42,748 2 – 3 years 53,841 Over 3 years 81 Total $ 164,183 The Company’s outstanding debt at December 31, 2016 and 2015 was $7,500 in an industrial revenue bond in which interest rates reset each week based on the current market rate. Therefore, the Company does not believe that it has significant interest rate risk with respect to its interest bearing debt. Investment in marketable securities As stated above, the Company invests primarily in marketable securities including variable rate demand notes (VRDNs). The VRDNs have weekly “puts” which are collateralized by bank letters of credit or other assets, and interest rates are reset weekly. Except for VRDN’s the Company’s marketable securities are held to maturity with maturities generally not exceeding three years. The Company utilizes professional money managers and maintains investment policy guidelines which emphasize high quality and liquidity in order to minimize the potential loss exposures that could result in the event of a default or other adverse event. The Company continues to monitor these investments and markets, as well as its investment policies, however, the financial markets could experience unanticipated or unprecedented events as it did in 2008 and 2009, and future outcomes may be less predictable than in the past. Equity price Equity price risk relates to the Company’s investments in mutual funds which are principally used to fund and hedge the Company’s deferred compensation liabilities. These investments in mutual funds are classified as trading securities. Any change in the fair value of these trading securities is completely offset by a corresponding change in the respective hedged deferred compensation liability, and therefore the Company does not believe that it has significant equity price risk with respect to these investments. .

23
Foreign currency Foreign currency risk principally relates to the Company’s foreign operations in Canada, Mexico and Spain, as well as periodic purchase commitments of machinery and equipment from foreign sources. Certain of the Company’s Canadian manufacturing costs, including local payroll and plant operations, and a portion of its packaging and ingredients are sourced in Canadian dollars. The Company may purchase Canadian forward contracts to receive Canadian dollars at a specified date in the future and uses its Canadian dollar collections on Canadian sales as a partial hedge of its overall Canadian manufacturing obligations sourced in Canadian dollars. The Company also periodically purchases and holds Canadian dollars to facilitate the risk management of these currency changes. From time to time, the Company may use foreign exchange forward contracts and derivative instruments to mitigate its exposure to foreign exchange risks, as well as those related to firm commitments to purchase equipment from foreign vendors. See Note 10 of the Company’s Notes to Consolidated Financial Statements for outstanding foreign exchange forward contracts as of December 31, 2016. Open Contractual Commitments as of December 31, 2016:
Less than 1 to 3 3 to 5 More than Payable in Total 1 Year Years Years 5 Years
Commodity hedges $ 10,811 $ 6,657 $ 4,154 $ — $ — Foreign currency hedges 2,357 2,357 — — — Purchase obligations 5,667 5,667 — — — Interest bearing debt 7,500 — — — 7,500 Operating leases 2,623 773 1,035 720 95 Total $ 28,958 $ 15,454 $ 5,189 $ 720 $ 7,595 Note: Commodity hedges and foreign currency hedges reflect the amounts at which the Company will settle the related contracts. The above amounts exclude deferred income tax liabilities of $46,579, liabilities for uncertain tax positions of $5,185, postretirement health care benefits of $12,128 and deferred compensation of $74,363 because the timing of payments relating to these items cannot be reasonably determined.

24
ITEM 7A. Quantitative and Qualitative Disclosures About Market Risk.
The information required by this item is included under the caption “Market Risk” in Item 7 above. See also Note 1 of the Notes to Consolidated Financial Statements.
ITEM 8. Financial Statements and Supplementary Data. Management’s Report on Internal Control Over Financial Reporting The management of Tootsie Roll Industries, Inc. is responsible for establishing and maintaining adequate internal control over financial reporting, as such term is defined in the Securities Exchange Act of 1934 (SEC) Rule 13a-15(f). Company management conducted an evaluation of the effectiveness of the Company’s internal control over financial reporting as of December 31, 2016 as required by SEC Rule 13a-15(c). In making this assessment, the Company used the criteria established in Internal Control—Integrated Framework (2013) issued by the Committee of Sponsoring Organizations of the Treadway Commission (the COSO criteria). Based on the Company’s evaluation under the COSO criteria, Company management concluded that its internal control over financial reporting was effective as of December 31, 2016. The effectiveness of the Company’s internal control over financial reporting as of December 31, 2016 has been audited by PricewaterhouseCoopers LLP, an independent registered public accounting firm, as stated in their report which is included herein.

25
Report of Independent Registered Public Accounting Firm To the Board of Directors and Shareholders of Tootsie Roll Industries, Inc.: In our opinion, the consolidated financial statements listed in the index appearing under Item 15(a)(1) present fairly, in all material respects, the financial position of Tootsie Roll Industries, Inc. and its subsidiaries at December 31, 2016 and December 31, 2015, and the results of their operations and their cash flows for each of the three years in the period ended December 31, 2016 in conformity with accounting principles generally accepted in the United States of America. In addition, in our opinion, the financial statement schedule listed in the index appearing under Item 15(a)(2) presents fairly, in all material respects, the information set forth therein when read in conjunction with the related consolidated financial statements. Also in our opinion, the Company maintained, in all material respects, effective internal control over financial reporting as of December 31, 2016, based on criteria established in Internal Control - Integrated Framework (2013) issued by the Committee of Sponsoring Organizations of the Treadway Commission (COSO). The Company's management is responsible for these financial statements and financial statement schedule, for maintaining effective internal control over financial reporting and for its assessment of the effectiveness of internal control over financial reporting, included in Management’s Report on Internal Control over Financial Reporting. Our responsibility is to express opinions on these financial statements, on the financial statement schedule, and on the Company's internal control over financial reporting based on our integrated audits. We conducted our audits in accordance with the standards of the Public Company Accounting Oversight Board (United States). Those standards require that we plan and perform the audits to obtain reasonable assurance about whether the financial statements are free of material misstatement and whether effective internal control over financial reporting was maintained in all material respects. Our audits of the financial statements included examining, on a test basis, evidence supporting the amounts and disclosures in the financial statements, assessing the accounting principles used and significant estimates made by management, and evaluating the overall financial statement presentation. Our audit of internal control over financial reporting included obtaining an understanding of internal control over financial reporting, assessing the risk that a material weakness exists, and testing and evaluating the design and operating effectiveness of internal control based on the assessed risk. Our audits also included performing such other procedures as we considered necessary in the circumstances. We believe that our audits provide a reasonable basis for our opinions. A company’s internal control over financial reporting is a process designed to provide reasonable assurance regarding the reliability of financial reporting and the preparation of financial statements for external purposes in accordance with generally accepted accounting principles. A company’s internal control over financial reporting includes those policies and procedures that (i) pertain to the maintenance of records that, in reasonable detail, accurately and fairly reflect the transactions and dispositions of the assets of the company; (ii) provide reasonable assurance that transactions are recorded as necessary to permit preparation of financial statements in accordance with generally accepted accounting principles, and that receipts and expenditures of the company are being made only in accordance with authorizations of management and directors of the company; and (iii) provide reasonable assurance regarding prevention or timely detection of unauthorized acquisition, use, or disposition of the company’s assets that could have a material effect on the financial statements. Because of its inherent limitations, internal control over financial reporting may not prevent or detect misstatements. Also, projections of any evaluation of effectiveness to future periods are subject to the risk that controls may become inadequate because of changes in conditions, or that the degree of compliance with the policies or procedures may deteriorate. /s/PricewaterhouseCoopers LLP Chicago, Illinois February 27, 2017

26
CONSOLIDATED STATEMENTS OF Earnings and Retained Earnings
TOOTSIE ROLL INDUSTRIES, INC. AND SUBSIDIARIES (in thousands except per share data)
For the year ended December 31, 2016 2015 2014 Net product sales $ 517,373 $ 536,692 $ 539,895 Rental and royalty revenue 3,727 3,420 3,630 Total revenue 521,100 540,112 543,525 Product cost of goods sold 320,290 340,090 340,933 Rental and royalty cost 1,019 889 947 Total costs 321,309 340,979 341,880 Product gross margin 197,083 196,602 198,962 Rental and royalty gross margin 2,708 2,531 2,683 Total gross margin 199,791 199,133 201,645 Selling, marketing and administrative expenses 107,377 108,051 117,722 Earnings from operations 92,414 91,082 83,923 Other income, net 5,498 1,496 7,371 Earnings before income taxes 97,912 92,578 91,294 Provision for income taxes 30,593 26,451 28,434 Net earnings 67,319 66,127 62,860 Less: Net earnings (loss) attributable to noncontrolling interests (191) 38 (438)Net earnings attributable to Tootsie Roll Industries, Inc. $ 67,510 $ 66,089 $ 63,298 Net earnings attributable to Tootsie Roll Industries, Inc. per share $ 1.08 $ 1.04 $ 0.99 Average number of shares outstanding 62,239 63,256 64,173 Retained earnings at beginning of period $ 52,349 $ 64,927 $ 73,109
Net earnings attributable to Tootsie Roll Industries, Inc. 67,510 66,089 63,298 Cash dividends (22,209) (21,308) (19,199)Stock dividends (53,817) (57,359) (52,281)
Retained earnings at end of period $ 43,833 $ 52,349 $ 64,927 (The accompanying notes are an integral part of these statements.)

27
CONSOLIDATED STATEMENTS OF Comprehensive Earnings
TOOTSIE ROLL INDUSTRIES, INC. AND SUBSIDIARIES (in thousands except per share data)
For the year ended December 31, 2016 2015 2014 Net earnings $ 67,319 $ 66,127 $ 62,860 Other comprehensive income (loss), before tax: Foreign currency translation adjustments (3,816) (4,145) (4,453) Pension and postretirement reclassification adjustment: Unrealized gains (losses) for the period on postretirement and pension benefits (688) 1,446 (2,746)
Less: reclassification adjustment for (gains) losses to net earnings (1,642) (1,451) (1,804) Unrealized gains (losses) on postretirement and pension benefits (2,330) (5) (4,550)
Investments:
Unrealized gains (losses) for the period on investments (151) (428) (606) Less: reclassification adjustment for (gains) losses to net earnings 5 — — Unrealized gains (losses) on investments (146) (428) (606)
Derivatives:
Unrealized gains (losses) for the period on derivatives 2,832 (3,814) (3,137) Less: reclassification adjustment for (gains) losses to net earnings 1,150 4,133 1,295 Unrealized gains (losses) on derivatives 3,982 319 (1,842)
Total other comprehensive income (loss), before tax (2,310) (4,259) (11,451) Income tax benefit (expense) related to items of other comprehensive income (572) (7) 2,991
Total comprehensive earnings 64,437 61,861 54,400 Comprehensive earnings (loss) attributable to noncontrolling interests (191) 38 (438)
Total comprehensive earnings attributable to Tootsie Roll Industries, Inc. $ 64,628 $ 61,823 $ 54,838 (The accompanying notes are an integral part of these statements.)

28
CONSOLIDATED STATEMENTS OF Financial Position TOOTSIE ROLL INDUSTRIES, INC. AND SUBSIDIARIES (in thousands) Assets
December 31, 2016 2015
CURRENT ASSETS: Cash and cash equivalents $ 119,145 $ 126,145 Restricted cash 382 395 Investments 67,513 42,155 Accounts receivable trade, less allowances of $1,884 and $2,225 42,964 51,010 Other receivables 3,299 2,772 Inventories:
Finished goods and work-in-process 34,631 35,032 Raw materials and supplies 22,900 27,231
Prepaid expenses 7,146 5,935 Deferred income taxes 1,320 3,131
Total current assets 299,300 293,806 PROPERTY, PLANT AND EQUIPMENT, at cost:
Land 22,081 22,188 Buildings 116,398 114,562 Machinery and equipment 369,802 357,627 Construction in progress 3,546 5,158
511,827 499,535 Less—Accumulated depreciation 330,922 314,949
Net property, plant and equipment 180,905 184,586 OTHER ASSETS:
Goodwill 73,237 73,237 Trademarks 175,024 175,024 Investments 164,665 152,930 Split dollar officer life insurance 26,042 26,042 Prepaid expenses and other 602 3,050 Deferred income taxes 326 308
Total other assets 439,896 430,591 Total assets $ 920,101 $ 908,983
(The accompanying notes are an integral part of these statements.)

29
(in thousands except per share data) Liabilities and Shareholders’ Equity
December 31, 2016 2015
CURRENT LIABILITIES: Accounts payable $ 10,320 $ 11,322 Bank loans 336 231 Dividends payable 5,573 5,486 Accrued liabilities 46,300 50,117 Postretirement health care benefits 513 448 Income taxes payable — 4,436 Deferred income taxes 519 22
Total current liabilities 63,561 72,062 NONCURRENT LIABILITIES:
Deferred income taxes 46,060 47,594 Bank loans 230 383 Postretirement health care benefits 11,615 10,952 Industrial development bonds 7,500 7,500 Liability for uncertain tax positions 5,185 5,101 Deferred compensation and other liabilities 74,412 66,843
Total noncurrent liabilities 145,002 138,373 TOOTSIE ROLL INDUSTRIES, INC. SHAREHOLDERS’ EQUITY:
Common stock, $.69-4/9 par value— 120,000 shares authorized— 37,701 and 37,382, respectively, issued 26,181 25,960 Class B common stock, $.69-4/9 par value— 40,000 shares authorized— 24,221 and 23,542, respectively, issued 16,820 16,348 Capital in excess of par value 646,768 622,882 Retained earnings 43,833 52,349 Accumulated other comprehensive loss (20,246) (17,364) Treasury stock (at cost)— 83 shares and 80 shares, respectively (1,992) (1,992)
Total Tootsie Roll Industries, Inc. shareholders’ equity 711,364 698,183 Noncontrolling interests 174 365 Total equity 711,538 698,548
Total liabilities and shareholders’ equity $ 920,101 $ 908,983
(The accompanying notes are an integral part of these statements.)

30
CONSOLIDATED STATEMENTS OF Cash Flows TOOTSIE ROLL INDUSTRIES, INC. AND SUBSIDIARIES (in thousands)
For the year ended December 31, 2016 2015 2014
CASH FLOWS FROM OPERATING ACTIVITIES: Net earnings $ 67,319 $ 66,127 $ 62,860 Adjustments to reconcile net earnings to net cash provided by operating activities:
Depreciation 19,627 20,388 20,758 Deferred income taxes 199 255 (946) Net loss on step acquisition — — 529 Amortization of marketable security premiums 2,830 3,105 3,261 Changes in operating assets and liabilities:
Accounts receivable 6,869 (8,929) (2,007) Other receivables 473 1,119 1,289 Inventories 4,183 7,530 (7,329) Prepaid expenses and other assets 2,999 11,593 9,524 Accounts payable and accrued liabilities (2,061) 3,839 (1,268) Income taxes payable (5,797) (115) (78) Postretirement health care benefits (1,216) (903) (1,289) Deferred compensation and other liabilities 3,125 (12,936) 3,465
Net cash provided by operating activities 98,550 91,073 88,769 CASH FLOWS FROM INVESTING ACTIVITIES:
Net cash acquired in step acquisition — — 161 Change in restricted cash — 1,149 224 Capital expenditures (16,090) (15,534) (10,704) Purchases of trading securities (4,569) (4,095) (4,294) Sales of trading securities 1,433 16,644 727 Purchase of available for sale securities (81,835) (61,951) (54,882) Sale and maturity of available for sale securities 49,177 55,264 38,309 Net cash used in investing activities (51,884) (8,523) (30,459)
CASH FLOWS FROM FINANCING ACTIVITIES: Shares purchased and retired (29,093) (33,004) (25,020) Dividends paid in cash (22,266) (20,775) (19,241) Proceeds from bank loans 2,760 — — Repayment of bank loans (2,788) (133) (403) Net cash used in financing activities (51,387) (53,912) (44,664) Effect of exchange rate changes on cash (2,279) (2,601) (1,821)
Increase (decrease) in cash and cash equivalents (7,000) 26,037 11,825 Cash and cash equivalents at beginning of year 126,145 100,108 88,283 Cash and cash equivalents at end of year $ 119,145 $ 126,145 $ 100,108 Supplemental cash flow information:
Income taxes paid $ 36,365 $ 24,940 $ 26,599 Interest paid $ 34 $ 17 $ 34 Stock dividend issued $ 61,671 $ 57,220 $ 52,165
(The accompanying notes are an integral part of these statements.)

31
Notes to Consolidated Financial Statements ($ in thousands except per share data) TOOTSIE ROLL INDUSTRIES, INC. AND SUBSIDIARIES NOTE 1—SIGNIFICANT ACCOUNTING POLICIES: Basis of consolidation:
The consolidated financial statements include the accounts of Tootsie Roll Industries, Inc. and its wholly-owned and majority-owned subsidiaries (the Company), which are primarily engaged in the manufacture and sales of candy products. Non-controlling interests relating to majority-owned subsidiaries are reflected in the consolidated financial statements and all significant intercompany transactions have been eliminated. Certain amounts previously reported have been reclassified to conform to the current year presentation.
The preparation of financial statements in conformity with generally accepted accounting principles in the United States of America requires management to make estimates and assumptions that affect the reported amounts of assets and liabilities and disclosure of contingent assets and liabilities at the date of the financial statements and the reported amounts of revenues and expenses during the reporting period. Actual results could differ from those estimates. Revenue recognition:
Products are sold to customers based on accepted purchase orders which include quantity, sales price and other relevant terms of sale. Revenue, net of applicable provisions for discounts, returns, allowances and certain advertising and promotional costs, including consumer coupons (price reduction), is recognized when products are delivered to customers and collectability is reasonably assured. Shipping and handling costs of $40,629, $42,619, and $46,525 in 2016, 2015 and 2014, respectively, are included in selling, marketing and administrative expenses. Accounts receivable are unsecured. Cash and cash equivalents:
The Company considers temporary cash investments with an original maturity of three months or less to be cash equivalents. Investments:
Investments consist of various marketable securities with maturities of generally up to three years, and variable rate demand notes with interest rates that are generally reset weekly and the security can be “put” back and sold weekly. The Company classifies debt and equity securities as either available for sale or trading. Available for sale securities are not actively traded by the Company and are carried at fair value. The Company follows current fair value measurement guidance and unrealized gains and losses on these securities are excluded from earnings and are reported as a separate component of shareholders’ equity, net of applicable taxes, until realized or other-than-temporarily impaired. Trading securities related to deferred compensation arrangements are carried at fair value with gains or losses included in other income, net. The Company invests in trading securities to economically hedge changes in its deferred compensation liabilities.
The Company regularly reviews its investments to determine whether a decline in fair value below the cost basis is other-than-temporary. If the decline in fair value is judged to be other-than-temporary, the cost basis of the security is written down to fair value and the amount of the write-down is included in other income, net. Further information regarding the fair value of the Company’s investments is included in Note 10 of the Company’s Notes to Consolidated Financial Statements. Derivative instruments and hedging activities:
Authoritative guidance requires qualitative disclosures about objectives and strategies for using derivatives, quantitative disclosures about fair value amounts of derivative instruments and related gains and losses, and disclosures about credit-risk-related contingent features in derivative agreements.

32
From time to time, the Company enters into commodity futures, commodity options contracts and foreign currency
forward contracts. Commodity futures and options are intended and are effective as hedges of market price risks associated with the anticipated purchase of certain raw materials (primarily sugar). Foreign currency forward contracts are intended and are effective as hedges of the Company’s exposure to the variability of cash flows, primarily related to the foreign exchange rate changes of products manufactured in Canada and sold in the United States, and periodic equipment purchases from foreign suppliers denominated in a foreign currency. The Company does not engage in trading or other speculative use of derivative instruments. Further information regarding derivative instruments and hedging activities is included in Note 11 of the Company’s Notes to Consolidated Financial Statements. Inventories:
Inventories are stated at cost, not to exceed market. The cost of substantially all of the Company’s inventories ($53,278 and $58,413 at December 31, 2016 and 2015, respectively) has been determined by the last-in, first-out (LIFO) method. The excess of current cost over LIFO cost of inventories approximates $17,574 and $16,864 at December 31, 2016 and 2015, respectively. The cost of certain foreign inventories ($4,253 and $3,850 at December 31, 2016 and 2015, respectively) has been determined by the first-in, first-out (FIFO) method. Rebates, discounts and other cash consideration received from vendors related to inventory purchases is reflected as a reduction in the cost of the related inventory item, and is, therefore, reflected in cost of sales when the related inventory item is sold. Property, plant and equipment:
Depreciation is computed for financial reporting purposes by use of the straight-line method based on useful lives of 20 to 35 years for buildings and 5 to 20 years for machinery and equipment. Depreciation expense was $19,627, $20,388 and $20,758 in 2016, 2015 and 2014, respectively. Carrying value of long-lived assets:
The Company reviews long-lived assets to determine if there are events or circumstances indicating that the amount of the asset reflected in the Company’s balance sheet may not be recoverable. When such indicators are present, the Company compares the carrying value of the long-lived asset, or asset group, to the future undiscounted cash flows of the underlying assets to determine if impairment exists. If applicable, an impairment charge would be recorded to write down the carrying value to its fair value. The determination of fair value involves the use of estimates of future cash flows that involve considerable management judgment and are based upon assumptions about expected future operating performance. The actual cash flows could differ from management’s estimates due to changes in business conditions, operating performance, and economic conditions. No impairment charges of long-lived assets were recorded by the Company during 2016, 2015 and 2014. Postretirement health care benefits:
The Company provides certain postretirement health care benefits to a group of “grandfathered” corporate office and management employees. The cost of these postretirement benefits is accrued during the employees’ working careers. See Note 7 of the Company’s Notes to Consolidated Financial Statements for additional information. The Company also provides split dollar life benefits to certain executive officers. The Company records an asset equal to the cumulative insurance premiums paid that will be recovered upon the death of covered employees or earlier under the terms of the plan. No premiums were paid in 2016, 2015 and 2014. Certain split dollar agreements were terminated during 2015 and 2014 which resulted in the full repayment to the Company of all of the cumulative premiums previously paid on these policies. No split dollar agreements were terminated during 2016. During 2015 and 2014, the Company received $7,591 and $6,496, respectively, of such repayments which were recorded as a reduction in the carrying value of Split Dollar Officer Life Insurance.

33
Goodwill and indefinite-lived intangible assets:
In accordance with authoritative guidance, goodwill and intangible assets with indefinite lives are not amortized, but rather tested for impairment at least annually unless certain interim triggering events or circumstances require more frequent testing. All trademarks have been assessed by management to have indefinite lives because they are expected to generate cash flows indefinitely. Management believes that all assumptions used for the impairment tests are consistent with those utilized by market participants performing similar valuations. The Company has completed its annual impairment testing of its goodwill and trademarks at December 31 of each of the years presented. No impairments of intangibles, including trademarks and goodwill, were recorded in 2016, 2015 or 2014.
With respect to impairment testing of goodwill, the first step compares the reporting unit’s estimated fair value with its carrying value. Projected discounted cash flows are used to determine the fair value of the reporting unit. If the carrying value of a reporting unit’s net assets exceeds its fair value, the second step is applied to measure the difference between the carrying value and implied fair value of goodwill. If the carrying value of goodwill exceeds its implied fair value, the goodwill is considered impaired and reduced to its implied fair value. Non-amortizable intangible assets, trademarks, are tested for impairment by comparing the fair value of each trademark with its carrying value. The fair value of trademarks is determined using discounted cash flows and estimates of royalty rates. If the carrying value exceeds fair value, the trademark is considered impaired and is reduced to fair value. Income taxes:
Deferred income taxes are recorded and recognized for future tax effects of temporary differences between financial and income tax reporting. The Company records valuation allowances in situations where the realization of deferred tax assets is not more-likely-than-not. Federal income taxes are provided on the portion of income of foreign subsidiaries that is expected to be remitted to the U.S. and become taxable, but not on the portion that is considered to be permanently reinvested in the foreign subsidiary. Further information regarding income taxes is included in Note 4 of the Company’s Notes to Consolidated Financial Statements. Foreign currency translation:
The U.S. dollar is used as the functional currency where a substantial portion of the subsidiary’s business is indexed to the U.S. dollar or where its manufactured products are principally sold in the U.S. All other foreign subsidiaries use the local currency as their functional currency. Where the U.S. dollar is used as the functional currency, foreign currency remeasurements are recorded as a charge or credit to other income, net in the statement of earnings. Where the foreign local currency is used as the functional currency, translation adjustments are recorded as a separate component of accumulated other comprehensive income (loss). Step acquisition
During first quarter 2014, the Company gained operating control of its two 50% owned Spanish companies when Company employee representatives assumed all positions on their boards of directors. This was considered a step acquisition, whereby the Company remeasured the previously held investment to fair value in first quarter 2014. As a result, the Company’s first quarter 2014 net earnings include a net loss of $529, including an additional income tax provision of $2,350 relating to deferred income taxes. During 2014 through 2016, the Company further increased its control and ownership to 93% by subscribing to additional common shares of these Spanish subsidiaries. The accompanying consolidated financial statements for the year ended December 31, 2016 and 2015 include these Spanish companies and related minority interests. These Spanish subsidiaries are not material to the Company’s consolidated financial statements. Restricted cash:
Restricted cash comprises certain cash deposits of the Company’s majority-owned Spanish subsidiaries with international banks that are pledged as collateral for letters of credit and bank borrowings.

34
VEBA trust:
The Company maintains a VEBA trust managed and controlled by the Company, to fund the estimated future costs of certain employee health, welfare and other benefits. The Company made no contributions to the VEBA trusts in 2016 and 2015, and is using the VEBA funds to pay the actual cost of such benefits through 2017. At December 31, 2016 and 2015, the VEBA trust held $3,027 and $6,727, respectively, of aggregate cash and cash equivalents. This asset value is included in prepaid expenses and long-term other assets in the Company’s Consolidated Statement of Financial Position. These assets are categorized as Level 1 within the fair value hierarchy. Bank loans:
Long term bank loans comprise borrowings by the Company’s majority-owned Spanish subsidiaries which are held by international banks. The average weighted interest rate in 2016 was 2.1% and maturity dates range from 1 to 2 years. Short term bank loans also relate to the Company’s majority-owned Spanish subsidiaries. Comprehensive earnings:
Comprehensive earnings include net earnings, foreign currency translation adjustments and unrealized gains/losses on commodity and/or foreign currency hedging contracts, available for sale securities and certain postretirement benefit obligations. Earnings per share:
A dual presentation of basic and diluted earnings per share is not required due to the lack of potentially dilutive securities under the Company’s simple capital structure. Therefore, all earnings per share amounts represent basic earnings per share.
The Class B common stock has essentially the same rights as common stock, except that each share of Class B common stock has ten votes per share (compared to one vote per share of common stock), is not traded on any exchange, is restricted as to transfer and is convertible on a share-for-share basis, at any time and at no cost to the holders, into shares of common stock which are traded on the New York Stock Exchange. Use of estimates:
The preparation of consolidated financial statements in conformity with accounting principles generally accepted in the U.S. requires management to make estimates and assumptions that affect the amounts reported. Estimates are used when accounting for sales discounts, allowances and incentives, product liabilities, assets recorded at fair value, income taxes, depreciation, amortization, employee benefits, contingencies and intangible asset and liability valuations. Actual results may or may not differ from those estimates. Recent accounting pronouncements:
In May 2014, the Financial Accounting Standards Board ("FASB") issued Accounting Standards Update ("ASU")
2014-09 that introduces a new five-step revenue recognition model in which an entity should recognize revenue to depict the transfer of promised goods or services to customers in an amount that reflects the consideration to which the entity expects to be entitled in exchange for those goods or services. This ASU also requires disclosures sufficient to enable users to understand the nature, amount, timing, and uncertainty of revenue and cash flows arising from contracts with customers, including qualitative and quantitative disclosures about contracts with customers, significant judgments and changes in judgments, and assets recognized from the costs to obtain or fulfill a contract. This standard is effective for fiscal years beginning after December 15, 2017, including interim periods within that reporting period. The Company is currently evaluating the new guidance to determine the impact it may have on the consolidated financial statements.

35
In November 2015, the FASB issued ASU 2015-17 which requires that deferred tax liabilities and assets be classified as noncurrent in a classified statement of financial position. The current requirement that deferred tax liabilities and assets of a tax-paying component of an entity be offset and presented as a single amount is not affected by the amendments in the standard. This standard is effective for fiscal years, and interim periods within those years, beginning after December 15, 2016. Early adoption is permitted and the standard may be applied either retrospectively or on a prospective basis to all deferred tax assets and liabilities. The Company is currently evaluating the new guidance to determine the impact it may have on the consolidated financial statements.
In January 2016, the FASB issued ASU 2016-01 which modifies certain aspects of the recognition, measurement,
presentation, and disclosure of financial instruments. This standard is effective for fiscal years, and interim periods within those years, beginning after December 15, 2017, and early adoption is permitted. The Company is currently evaluating the new guidance to determine the impact it may have on the consolidated financial statements.
In February 2016, the FASB issued ASU 2016-02 which amends existing guidance to require lessees to recognize
assets and liabilities on the balance sheet for the rights and obligations created by long-term leases and to disclose additional quantitative and qualitative information about leasing arrangements. This ASU also provides clarifications surrounding the presentation of the effects of leases in the income statement and statement of cash flows. This guidance will be effective for the Company on January 1, 2019. The Company is currently evaluating this new guidance to determine the impact it will have on its consolidated financial statements.
In April 2016, the FASB issued ASU 2016-10, which contains amendments to the new revenue recognition standard
on identifying performance obligations and accounting for licenses of intellectual property. The amendments related to identifying performance obligations clarify when a promised good or service is separately identifiable and allows entities to disregard items that are immaterial in the context of a contract. The licensing implementation amendments clarify how an entity should evaluate the nature of its promise in granting a license of intellectual property, which will determine whether revenue is recognized over time or at a point in time. This new standard has the same effective date and transition requirements as ASU 2014-09. The Company is currently evaluating this new guidance to determine the impact it will have on its consolidated financial statements.
In August 2016, the FASB issued ASU 2016-15, the amendments in this update address eight specific cash flow issues
with the objective of reducing the existing diversity in practice. The effective date of the amendments to the standard is for fiscal years beginning after December 15, 2017, including interim periods within those fiscal years. The Company is currently evaluating this new guidance to determine the impact it will have on its consolidated financial statements.
In January 2017, the FASB issued ASU 2017-04, Intangibles – Goodwill and Other (Topic 350). ASU 2017-04
simplifies the subsequent measurement of goodwill by removing the second step of the two-step impairment test. The amendment requires an entity to perform its annual, or interim goodwill impairment test by comparing the fair value of a reporting unit with its carrying amount. An impairment charge should be recognized for the amount by which the carrying amount exceeds the reporting unit's fair value; however, the loss recognized should not exceed the total amount of goodwill allocated to that reporting unit. An entity still has the option to perform the qualitative assessment for a reporting unit to determine if the quantitative impairment test is necessary. The amendment should be applied on a prospective basis. ASU 2017-04 is effective for fiscal years beginning after December 15, 2019, including interim periods within those fiscal years. Early adoption is permitted for interim or annual goodwill impairment tests performed on testing dates after January 1, 2017. The Company is currently evaluating this new guidance to determine the impact it will have on its consolidated financial statements.
Recently adopted pronouncement: In August 2014, the FASB issued ASU 2014-15, Presentation of Financial Statements - Going Concern (Subtopic
205-40): Disclosure of Uncertainties about an Entity’s Ability to Continue as a Going Concern, which requires management to assess an entity’s ability to continue as a going concern, and to provide related footnote disclosures in certain circumstances, such as the existence of substantial doubt. We are required to evaluate going concern uncertainties at each annual and interim reporting period, considering the entity’s ability to continue as a going concern within one year

36
after the issuance date. This guidance was effective on December 31, 2016. The adoption of this ASU had no impact on the Company’s Consolidated Financial Statements.
NOTE 2—ACCRUED LIABILITIES:
Accrued liabilities are comprised of the following:
December 31, 2016 2015 Compensation $ 9,840 $ 9,383 Other employee benefits 7,012 7,440 Taxes, other than income 3,004 2,716 Advertising and promotions 21,421 22,453 Other 5,023 8,125 $ 46,300 $ 50,117
NOTE 3—INDUSTRIAL DEVELOPMENT BONDS:
Industrial development bonds are due in 2027. The average floating interest rate, which is reset weekly, was 0.5% and 0.1% in 2016 and 2015, respectively. See Note 10 of the Company’s Notes to Consolidated Financial Statements for fair value disclosures. NOTE 4—INCOME TAXES:
The domestic and foreign components of pretax income are as follows:
2016 2015 2014 Domestic $ 87,016 $ 82,276 $ 81,255 Foreign 10,896 10,302 10,039 $ 97,912 $ 92,578 $ 91,294
The provision for income taxes is comprised of the following:
2016 2015 2014 Current:
Federal $ 28,484 $ 26,259 $ 25,173 Foreign 86 (596) 549 State 1,954 785 1,538
30,524 26,448 27,260 Deferred:
Federal (2,547) (1,189) (172) Foreign 3,323 2,106 2,032 State (707) (914) (686)
69 3 1,174 $ 30,593 $ 26,451 $ 28,434

37
Significant components of the Company’s net deferred tax liability at year end were as follows:
December 31, 2016 2015
Deferred tax assets: Accrued customer promotions $ 3,194 $ 3,907 Deferred compensation 26,509 23,842 Postretirement benefits 4,732 4,543 Other accrued expenses 6,543 8,324 Foreign subsidiary tax loss carry forward 8,452 9,956 Tax credit carry forward 2,514 2,319
51,944 52,891 Valuation allowance (2,317) (2,077) Total deferred tax assets $ 49,627 $ 50,814
Deferred tax liabilities: Depreciation $ 28,049 $ 29,062 Deductible goodwill and trademarks 45,733 44,255 Accrued export company commissions 6,044 5,897 Employee benefit plans 928 2,403 Inventory reserves 3,529 3,793 Prepaid insurance 1,015 1,065 Deferred foreign exchange gain 436 — Unrealized capital gain 733 362 Deferred gain on sale of real estate 8,093 8,154 Total deferred tax liabilities $ 94,560 $ 94,991 Net deferred tax liability $ 44,933 $ 44,177
At December 31, 2016, the Company has benefits related to state tax credit carry-forwards expiring by year as follows:
$313 in 2018, $1,080 in 2019 and $853 in 2020. The Company expects that these state credit carry-forwards will be utilized before their expiration. At December 31,2016 the Company also had $268 in foreign tax credit carry-forwards which are not material to its financial statements.
At December 31, 2016, the tax benefits of the Company’s Canadian subsidiary tax loss carry-forwards expiring by year are as follows: $2,181 in 2028, $3,546 in 2029 and $619 in 2031. The Company expects that these carry-forwards will be realized before their expiration.
At December 31, 2016, the amounts of the Company’s Spanish subsidiary loss carry-forwards expiring by year are as follows: $264 in 2026, $56 in 2027, $168 in 2028, $96 in 2029, $290 in 2030, $387 in 2031, $291 in 2032, $117 in 2033 and $437 in 2034. A full valuation allowance has been provided for these Spanish loss carry-forwards as the Company expects that the losses will not be utilized before their expiration.

38
The effective income tax rate differs from the statutory rate as follows:
2016 2015 2014 U.S. statutory rate 35.0 % 35.0 % 35.0 % State income taxes, net 1.0 1.1 1.0 Exempt municipal bond interest (0.1) (0.1) (0.5) Foreign tax rates (0.4) (1.3) (1.5) Qualified domestic production activities deduction (2.7) (2.6) (2.8) Tax credits receivable (0.5) (1.2) (0.6) Adjustment of deferred tax balances (0.5) 0.2 1.9 Reserve for uncertain tax benefits — (2.1) — Other, net (0.6) (0.4) (1.4) Effective income tax rate 31.2 % 28.6 % 31.1 %
The Company has not provided for U.S. federal or foreign withholding taxes on $22,081 and $20,174 of foreign subsidiary undistributed earnings as of December 31, 2016 and December 31, 2015, respectively, because such earnings are considered to be permanently reinvested. The Company estimates that the federal income tax liability on such remittances would approximate 30%. This foreign subsidiary holds $12,354 and $15,265 of cash and short term investments as of December 31, 2016 and 2015, respectively.
At December 31, 2016 and 2015, the Company had unrecognized tax benefits of $4,746 and $4,680, respectively. Included in this balance is $2,761 and $2,737, respectively, of unrecognized tax benefits that, if recognized, would favorably affect the annual effective income tax rate. As of December 31, 2016 and 2015, $439 and $421, respectively, of interest and penalties were included in the liability for uncertain tax positions.
A reconciliation of the beginning and ending balances of the total amounts of unrecognized tax benefits is as follows:
2016 2015 2014
Unrecognized tax benefits at January 1 $ 4,680 $ 6,993 $ 6,010 Increases in tax positions for the current year 803 812 1,827 Increases in tax positions for new uncertain tax position — — 609 Reductions in tax positions for lapse of statute of limitations (718) (865) (1,050) Reductions in tax positions relating to settlements with taxing authorities (27) (772) (403) Increases (decreases) in prior period unrecognized tax benefits 8 (1,488) — Unrecognized tax benefits at December 31 $ 4,746 $ 4,680 $ 6,993
The Company recognizes interest and penalties related to unrecognized tax benefits in the provision for income taxes on the Consolidated Statements of Earnings and Retained Earnings.
The Company is subject to taxation in the U.S. and various state and foreign jurisdictions. The Company remains subject to examination by U.S. federal and state and foreign tax authorities for the years 2013 through 2015. With few exceptions, the Company is no longer subject to examinations by tax authorities for the years 2012 and prior.
The Company’s Canadian subsidiary is currently subject to examination by the Canada Revenue Agency for tax years 2005 and 2007. In addition, the Company is currently subject to various state tax examinations. Although the Company is unable to determine the ultimate outcome of the ongoing examinations, the Company believes that its liability for uncertain tax positions relating to these jurisdictions for such years is adequate.
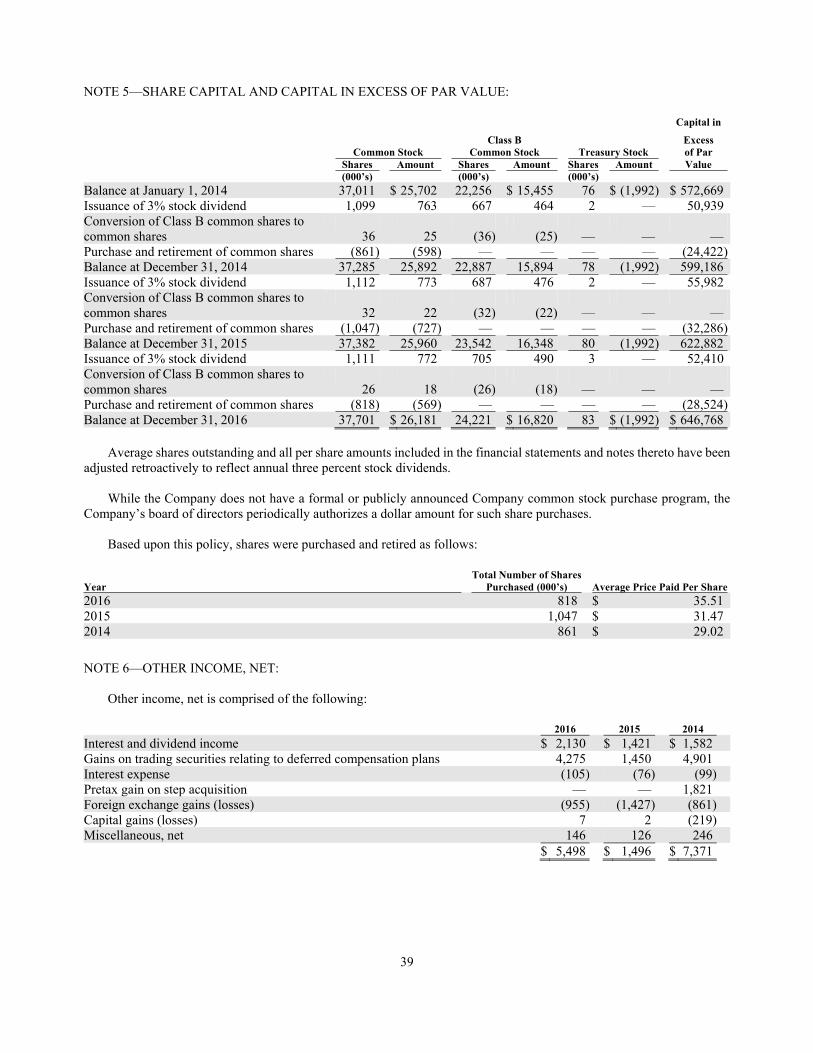
39
NOTE 5—SHARE CAPITAL AND CAPITAL IN EXCESS OF PAR VALUE:
Capital in
Class B Excess Common Stock Common Stock Treasury Stock of Par Shares Amount Shares Amount Shares Amount Value (000’s) (000’s) (000’s) Balance at January 1, 2014 37,011 $ 25,702 22,256 $ 15,455 76 $ (1,992) $ 572,669 Issuance of 3% stock dividend 1,099 763 667 464 2 — 50,939 Conversion of Class B common shares to common shares 36 25 (36) (25) — — — Purchase and retirement of common shares (861) (598) — — — — (24,422) Balance at December 31, 2014 37,285 25,892 22,887 15,894 78 (1,992) 599,186 Issuance of 3% stock dividend 1,112 773 687 476 2 — 55,982 Conversion of Class B common shares to common shares 32 22 (32) (22) — — — Purchase and retirement of common shares (1,047) (727) — — — — (32,286) Balance at December 31, 2015 37,382 25,960 23,542 16,348 80 (1,992) 622,882 Issuance of 3% stock dividend 1,111 772 705 490 3 — 52,410 Conversion of Class B common shares to common shares 26 18 (26) (18) — — — Purchase and retirement of common shares (818) (569) — — — — (28,524) Balance at December 31, 2016 37,701 $ 26,181 24,221 $ 16,820 83 $ (1,992) $ 646,768
Average shares outstanding and all per share amounts included in the financial statements and notes thereto have been adjusted retroactively to reflect annual three percent stock dividends.
While the Company does not have a formal or publicly announced Company common stock purchase program, the Company’s board of directors periodically authorizes a dollar amount for such share purchases.
Based upon this policy, shares were purchased and retired as follows:
Total Number of Shares Year Purchased (000’s) Average Price Paid Per Share 2016 818 $ 35.51 2015 1,047 $ 31.47 2014 861 $ 29.02
NOTE 6—OTHER INCOME, NET:
Other income, net is comprised of the following:
2016 2015 2014
Interest and dividend income $ 2,130 $ 1,421 $ 1,582 Gains on trading securities relating to deferred compensation plans 4,275 1,450 4,901 Interest expense (105) (76) (99) Pretax gain on step acquisition — — 1,821 Foreign exchange gains (losses) (955) (1,427) (861) Capital gains (losses) 7 2 (219) Miscellaneous, net 146 126 246 $ 5,498 $ 1,496 $ 7,371

40
NOTE 7—EMPLOYEE BENEFIT PLANS: Pension plans:
The Company sponsors defined contribution pension plans covering certain non-union employees with over one year of credited service. The Company’s policy is to fund pension costs accrued based on compensation levels. Total pension expense for 2016, 2015 and 2014 approximated $3,126, $3,100 and $3,134, respectively. The Company also maintains certain profit sharing and retirement savings-investment plans. Company contributions in 2016, 2015 and 2014 to these plans were $2,493, $2,533 and $2,374 respectively.
The Company also contributes to a multi-employer defined benefit pension plan for certain of its union employees under a collective bargaining agreement which is as follows:
Plan name: Bakery and Confectionery Union and Industry International Pension Fund
Employer Identification Number and plan number: 52-6118572, plan number 001
Funded Status as of the most recent year available: 62.77% funded as of January 1, 2015
The Company’s contributions to such plan: $2,515, $2,574 and $2,588 in 2016, 2015 and 2014, respectively
Plan status: Critical and declining as of December 31, 2015
Beginning in 2012, the Company received periodic notices from the Bakery, Confectionery, Tobacco Workers and Grain Millers International Union Pension Plan (Plan), a multi-employer defined benefit pension plan for certain Company union employees, that the Plan’s actuary certified the Plan to be in “critical status”, the “Red Zone”, as defined by the Pension Protection Act (PPA) and the Pension Benefit Guaranty Corporation (PBGC); and that a plan of rehabilitation was adopted by the trustees of the Plan in fourth quarter 2012. During second quarter 2015, the Company received new notices that the Plan is now in “critical and declining status”, as defined by the PPA and PBGC, for the plan year beginning January 1, 2015, and that the Plan is projected to have an accumulated funding deficiency for the 2017 through 2024 plan years. A designation of “critical and declining status” implies that the Plan is expected to become insolvent in the next 20 years.
The Company has been advised that its withdrawal liability would have been $72,700, $61,000 and $56,400 if it had
withdrawn from the Plan during 2016, 2015 and 2014, respectively. The increase from 2015 to 2016 principally reflects poor investment returns of the plan in 2015, a decrease in the PBGC interest rates, and a higher share of the Plan’s unfunded vested benefits allocated to the Company. Should the Company actually withdraw from the Plan at a future date, a withdrawal liability, which could be higher than the above discussed amounts, could be payable to the Plan.
The Company’s existing labor contract with the local union commits the Company’s participation in this Plan through
third quarter 2017. The amended rehabilitation plan, which continues, requires that employer contributions include 5% compounded annual surcharge increases each year for an unspecified period of time beginning January 2013 (in addition to the 5% interim surcharge initiated in June 2012) as well as certain plan benefit reductions. The Company’s pension expense for this Plan for 2016 and 2015 was $2,541 and $2,574, respectively. The aforementioned expense includes surcharges of $542 and $447 in 2016 and 2015, respectively, as required under the plan of rehabilitation as amended.
The Company is currently unable to determine the ultimate outcome of the above discussed matter and therefore is
unable to determine the effects on its consolidated financial statements, but the ultimate outcome or the effects of any modifications to the current rehabilitation plan could be material to its consolidated results of operations or cash flows in one or more future periods. Deferred compensation:
The Company sponsors three deferred compensation plans for selected executives and other employees: (i) the Excess Benefit Plan, which restores retirement benefits lost due to IRS limitations on contributions to tax-qualified plans, (ii) the

41
Supplemental Plan, which allows eligible employees to defer the receipt of eligible compensation until designated future dates and (iii) the Career Achievement Plan, which provides a deferred annual incentive award to selected executives. Participants in these plans earn a return on amounts due them based on several investment options, which mirror returns on underlying investments (primarily mutual funds). The Company economically hedges its obligations under the plans by investing in the actual underlying investments. These investments are classified as trading securities and are carried at fair value. At December 31, 2016 and 2015, these investments totaled $67,995 and $60,584, respectively. All gains and losses and related investment income from these investments, which are recorded in other income, net, are equally offset by corresponding increases and decreases in the Company’s deferred compensation liabilities. Postretirement health care benefit plans:
The Company maintains a post-retirement health benefits plan for a group of “grandfathered” corporate employees. The plan as amended in 2013, generally limited future annual cost increases in health benefits to 3%, restricted this benefit to current employees and retirees with long-term service with the Company, and eliminated all post-retirement benefits for future employees effective April 1, 2014. Post-retirement benefits liabilities (as amended) were $12,128 and $11,400 at December 31, 2016 and 2015, respectively.
Amounts recognized in accumulated other comprehensive loss (pre-tax) at December 31, 2016 are as follows:
Prior service credit $ (6,746)Net actuarial gain (1,846)Net amount recognized in accumulated other comprehensive loss $ (8,592)
The estimated actuarial gain and prior service credit to be amortized from accumulated other comprehensive loss into net periodic benefit income during 2017 are $236 and $1,226, respectively.
The changes in the accumulated postretirement benefit obligation at December 31, 2016 and 2015 consist of the following:
December 31, 2016 2015
Benefit obligation, beginning of year $ 11,400 $ 12,311 Service cost 331 441 Interest cost 462 465 Actuarial (gain)/loss 235 (1,580) Benefits paid (300) (237) Benefit obligation, end of year $ 12,128 $ 11,400
Net periodic postretirement benefit cost (income) included the following components:
2016 2015 2014 Service cost—benefits attributed to service during the period $ 331 $ 441 $ 342 Interest cost on the accumulated postretirement benefit obligation 462 465 423 Net amortization (1,642) (1,451) (1,804) Net periodic postretirement benefit cost (income) $ (849) $ (545) $ (1,039)
The Company estimates future benefit payments will be $513, $470, $516, $549 and $590 in 2017 through 2021, respectively, and a total of $3,422 in 2022 through 2026.

42
NOTE 8—COMMITMENTS:
Rental expense aggregated $703, $728 and $749 in 2016, 2015 and 2014, respectively.
Future operating lease commitments are not significant. NOTE 9—SEGMENT AND GEOGRAPHIC INFORMATION:
The Company operates as a single reportable segment encompassing the manufacture and sale of confectionery products. Its principal manufacturing operations are located in the United States and Canada, and its principal market is the United States. The Company also manufactures confectionery products in Mexico primarily for sale in Mexico, and exports products to Canada and other countries worldwide.
The following geographic data includes net product sales summarized on the basis of the customer location and long-lived assets based on their physical location:
2016 2015 2014
Net product sales: United States $ 475,055 $ 492,450 $ 488,795 Canada, Mexico and Other 42,318 44,242 51,100
$ 517,373 $ 536,692 $ 539,895 Long-lived assets:
United States $ 147,296 $ 149,144 $ 153,444 Canada 29,806 31,408 32,114 Mexico and Other 3,803 4,034 4,523
$ 180,905 $ 184,586 $ 190,081
Sales revenues from Wal-Mart Stores, Inc. aggregated approximately 23.3%, 23.7%, and 23.7% of net product sales during the years ended December 31, 2016, 2015 and 2014, respectively. Some of the aforementioned sales to Wal-Mart are sold to McLane Company, a large national grocery wholesaler, which services and delivers certain of the Company products to Wal-Mart and other retailers in the U.S.A. Net product sales revenues from McLane, which includes these Wal-Mart sales as well as sales and deliveries to other Company customers, were 16.3% in 2016 and 16.7% in 2015 and 15.3% in 2014. NOTE 10—FAIR VALUE MEASUREMENTS:
Current accounting guidance defines fair value as the price that would be received in the sale of an asset or paid to transfer a liability in an orderly transaction between market participants at the measurement date. Guidance requires disclosure of the extent to which fair value is used to measure financial assets and liabilities, the inputs utilized in calculating valuation measurements, and the effect of the measurement of significant unobservable inputs on earnings, or changes in net assets, as of the measurement date. Guidance establishes a three-level valuation hierarchy based upon the transparency of inputs utilized in the measurement and valuation of financial assets or liabilities as of the measurement date. Level 1 inputs include quoted prices for identical instruments and are the most observable. Level 2 inputs include quoted prices for similar assets and observable inputs such as interest rates, foreign currency exchange rates, commodity rates and yield curves. Level 3 inputs are not observable in the market and include management’s own judgments about the assumptions market participants would use in pricing the asset or liability. The use of observable and unobservable inputs is reflected in the hierarchy assessment disclosed in the table below.
As of December 31, 2016 and 2015, the Company held certain financial assets that are required to be measured at fair value on a recurring basis. These include derivative hedging instruments related to the foreign currency forward contracts and purchase of certain raw materials, investments in trading securities and available for sale securities. The Company’s available for sale and trading securities principally consist of municipal bonds and variable rate demand notes.

43
The following tables present information about the Company’s financial assets and liabilities measured at fair value as of December 31, 2016 and 2015, and indicate the fair value hierarchy and the valuation techniques utilized by the Company to determine such fair value:
Estimated Fair Value December 31, 2016 Total Input Levels Used Fair Value Level 1 Level 2 Level 3 Cash and equivalents $ 119,145 $ 119,145 $ — $ — Available for sale securities 164,183 2,419 161,764 — Foreign currency forward contracts (119) — (119) — Commodity futures contracts, net 1,746 1,746 — — Trading securities 67,995 67,995 — — Total assets measured at fair value $ 352,950 $ 191,305 $ 161,645 $ —
Estimated Fair Value December 31, 2015 Total Input Levels Used Fair Value Level 1 Level 2 Level 3 Cash and equivalents $ 126,145 $ 126,145 $ — $ — Available for sale securities 134,501 2,430 132,071 — Foreign currency forward contracts (2,626) — (2,626) — Commodity futures contracts, net 271 271 — — Trading securities 60,584 60,584 — — Total assets measured at fair value $ 318,875 $ 189,430 $ 129,445 $ —
Available for sale securities which utilize Level 2 inputs consist primarily of municipal and corporate bonds, which are valued based on quoted market prices or alternative pricing sources with reasonable levels of price transparency.
A summary of the aggregate fair value, gross unrealized gains, gross unrealized losses, realized losses and amortized cost basis of the Company’s investment portfolio by major security type is as follows:
December 31, 2016 Amortized Fair Unrealized Realized Available for Sale: Cost Value Gains Losses Losses
Municipal bonds $ 16,046 $ 15,206 $ — $ (840) $ — Variable rate demand notes 19,700 19,700 — — — Corporate bonds 122,568 122,298 — (270) — Government securities 2,411 2,426 — 15 — Certificates of deposit 4,553 4,553 — — — Mutual funds — — — — — $ 165,278 $ 164,183 $ — $ (1,095) $ —
December 31, 2015 Amortized Fair Unrealized Realized Available for Sale: Cost Value Gains Losses Losses Municipal bonds $ 34,021 $ 33,977 $ — $ (44) $ — Corporate bonds 95,286 94,403 — (883) — Government securities 2,430 2,430 — — — Certificates of deposit 3,692 3,676 — (16) — Mutual funds 20 15 — (5) — $ 135,449 $ 134,501 $ — $ (948) $ —
The fair value of the Company’s industrial revenue development bonds at December 31, 2016 and 2015 were valued using Level 2 inputs which approximates the carrying value of $7,500 for both periods. Interest rates on these bonds reset weekly based on current market conditions.

44
NOTE 11—DERIVATIVE INSTRUMENTS AND HEDGING ACTIVITIES:
From time to time, the Company uses derivative instruments, including foreign currency forward contracts, commodity futures contracts and commodity option contracts, to manage its exposures to foreign exchange and commodity prices. Commodity futures contracts and most commodity option contracts are intended and effective as hedges of market price risks associated with the anticipated purchase of certain raw materials (primarily sugar). Foreign currency forward contracts are intended and effective as hedges of the Company’s exposure to the variability of cash flows, primarily related to the foreign exchange rate changes of products manufactured in Canada and sold in the United States, and periodic equipment purchases from foreign suppliers denominated in a foreign currency. The Company does not engage in trading or other speculative use of derivative instruments.
The Company recognizes all derivative instruments as either assets or liabilities at fair value in the Consolidated Statements of Financial Position. Derivative assets are recorded in other receivables and derivative liabilities are recorded in accrued liabilities. The Company uses either hedge accounting or mark-to-market accounting for its derivative instruments. Derivatives that qualify for hedge accounting are designated as cash flow hedges by formally documenting the hedge relationships, including identification of the hedging instruments, the hedged items and other critical terms, as well as the Company’s risk management objectives and strategies for undertaking the hedge transaction.
Changes in the fair value of the Company’s cash flow hedges are recorded in accumulated other comprehensive loss, net of tax, and are reclassified to earnings in the periods in which earnings are affected by the hedged item. Substantially all amounts reported in accumulated other comprehensive loss for commodity derivatives are expected to be reclassified to cost of goods sold. Approximately 70% of this accumulated comprehensive net gain is expected to be reclassified to net earnings in 2017 and the balance in 2018. Substantially all amounts reported in accumulated other comprehensive loss for foreign currency derivatives are expected to be reclassified to other income, net in 2017.
The following table summarizes the Company’s outstanding derivative contracts and their effects on its Consolidated Statements of Financial Position at December 31, 2016 and 2015:
December 31, 2016 Notional Amounts Assets Liabilities
Derivatives designated as hedging instruments: Foreign currency forward contracts $ 2,357 $ — $ (119) Commodity futures contracts 10,811 1,932 (186) Total derivatives $ 1,932 $ (305)
December 31, 2015 Notional Amounts Assets Liabilities
Derivatives designated as hedging instruments: Foreign currency forward contracts $ 15,668 $ — $ (2,626) Commodity futures contracts 13,202 484 (213)
Total derivatives $ 484 $ (2,839)

45
The effects of derivative instruments on the Company’s Consolidated Statement of Earnings, Comprehensive Earnings and Retained Earnings for years ended December 31, 2016 and 2015 are as follows:
For Year Ended December 31, 2016 Gain (Loss) Gain (Loss) on Amount Excluded Gain (Loss) Reclassified from from Effectiveness Recognized Accumulated OCI Testing Recognized in OCI into Earnings in Earnings Foreign currency forward contracts $ 511 $ (1,997) $ — Commodity futures contracts 2,321 847 — Total $ 2,832 $ (1,150) $ —
For Year Ended December 31, 2015 Gain (Loss) Gain (Loss) on Amount Excluded Gain (Loss) Reclassified from from Effectiveness Recognized Accumulated OCI Testing Recognized in OCI into Earnings in Earnings Foreign currency forward contracts $ (3,199) $ (2,510) $ — Commodity futures contracts (615) (1,623) — Total $ (3,814) $ (4,133) $ —
NOTE 12—ACCUMULATED OTHER COMPREHENSIVE LOSS:
The following table sets forth information with respect to accumulated other comprehensive earnings (loss):
Accumulated Foreign Foreign Postretirement Other Currency Currency Commodity and Pension Comprehensive Translation Investments Derivatives Derivatives Benefits Earnings (Loss)
Balance at December 31, 2014 $ (17,499) $ (332) $ (1,236) $ (470) $ 6,439 $ (13,098)Other comprehensive earnings (loss) before reclassifications (4,145) (273) (2,041) (392) 874 (5,977)Reclassifications from accumulated other comprehensive loss — — 1,602 1,035 (926) 1,711 Other comprehensive earnings (loss) net of tax (4,145) (273) (439) 643 (52) (4,266)Balance at December 31, 2015 $ (21,644) $ (605) $ (1,675) $ 173 $ 6,387 $ (17,364)Other comprehensive earnings (loss) before reclassifications (3,816) (95) 325 1,481 (466) (2,571)Reclassifications from accumulated other comprehensive loss — 3 1,274 (540) (1,048) (311)Other comprehensive earnings (loss) net of tax (3,816) (92) 1,599 941 (1,514) (2,882)
Balance at December 31, 2016 $ (25,460) $ (697) $ (76) $ 1,114 $ 4,873 $ (20,246)

46
The amounts reclassified from accumulated other comprehensive income (loss) consisted of the following:
Details about Accumulated Other Year to Date Ended Comprehensive Income Components December 31, 2016 December 31, 2015 Location of (Gain) Loss Recognized in Earnings Investments $ 5 $ - Other income, net Foreign currency derivatives 1,997 2,510 Other income, net Commodity derivatives (847) 1,623 Product cost of goods sold Postretirement and pension benefits (838) (740) Selling, marketing and administrative expenses Postretirement and pension benefits (804) (711) Product cost of goods sold Total before tax (487) 2,682 Tax expense (benefit) 176 (971) Net of tax $ (311) $ 1,711
NOTE 13—GOODWILL AND INTANGIBLE ASSETS:
All of the Company’s intangible indefinite-lived assets are trademarks.
The changes in the carrying amount of trademarks for 2016 and 2015 were as follows:
2016 2015 Original cost $ 193,767 $ 193,767 Accumulated impairment losses as of January 1 (18,743) (18,743)Balance at January 1 $ 175,024 $ 175,024 Current year impairment losses — — Balance at December 31 $ 175,024 $ 175,024 Accumulated impairment losses as of December 31 $ (18,743) $ (18,743)
The fair value of indefinite-lived intangible assets was primarily assessed using the present value of estimated future cash flows and relief-from-royalty method.
The Company has no accumulated impairment losses of goodwill.
NOTE 14—QUARTERLY FINANCIAL DATA (UNAUDITED):
(Thousands of dollars except per share data) First Second Third Fourth Year
2016 Net product sales $ 103,362 $ 104,259 $ 185,473 $ 124,279 $ 517,373 Product gross margin 37,538 39,250 70,725 49,570 197,083 Net earnings attributable to Tootsie Roll Industries, Inc. 9,896 11,136 28,637 17,841 67,510 Net earnings attributable to Tootsie Roll Industries, Inc. per share 0.16 0.18 0.46 0.29 1.08 2015 Net product sales $ 105,477 $ 107,528 $ 183,806 $ 139,881 $ 536,692 Product gross margin 38,332 38,795 66,760 52,715 196,602 Net earnings attributable to Tootsie Roll Industries, Inc. 9,154 11,059 26,171 19,705 66,089 Net earnings attributable to Tootsie Roll Industries, Inc. per share 0.14 0.17 0.41 0.31 1.04
Net earnings per share is based upon average outstanding shares as adjusted for 3% stock dividends issued during the second quarter of each year as discussed above. The sum of the quarterly per share amounts may not equal annual amounts due to rounding.

47
ITEM 9. Changes in and Disagreements with Accountants on Accounting and Financial Disclosure.
None.
ITEM 9A. Controls And Procedures. Disclosure Controls and Procedures
The Company’s Chief Executive Officer and Chief Financial Officer have concluded, based on their evaluation as of the end of the period covered by this report, that the Company’s disclosure controls and procedures (as defined in Rule 13a-15(e) of the Securities Exchange Act of 1934, as amended (the “Exchange Act”) ) are effective to ensure that information required to be disclosed in the reports that the Company files or submits under the Exchange Act is (i) recorded, processed, summarized and reported within the time periods specified in the Securities and Exchange Commission’s rules and forms, and (ii) is accumulated and communicated to the Company’s management, including its Chief Executive Officer and Chief Financial Officer, as appropriate to allow timely decisions regarding required disclosure. Internal Control over Financial Reporting
(a) See “Management’s Report on Internal Control Over Financial Reporting,” included in Item 8 “Financial Statements and Supplementary Data,” which is incorporated herein by reference.
(b) See “Report of Independent Registered Public Accounting Firm” included in Item 8 “Financial Statements
and Supplementary Data” for the attestation report of the Company’s independent registered public accounting firm, which is incorporated herein by reference.
(c) There were no changes in the Company’s internal control over financial reporting during the quarter ended
December 31, 2016 that have materially affected, or are reasonably likely to materially affect, the Company’s internal control over financial reporting.
ITEM 9B. Other Information.
None

48
PART III
ITEM 10. Directors, Executive Officers and Corporate Governance.
See the information with respect to the Directors of the Company which is set forth in the section entitled “Election of Directors” of the 2017 Proxy Statement, which section of the 2017 Proxy Statement is incorporated herein by reference. See the information in the section entitled “Section 16(a) Beneficial Ownership Reporting Compliance” of the Company’s 2017 Proxy Statement, which section is incorporated herein by reference.
The following table sets forth the information with respect to the executive officers of the Company:
Name Position (1) Age
Ellen R. Gordon* Chairman of the Board and Chief Executive Officer 85 G. Howard Ember Jr. Vice President/Finance 64 John W. Newlin Jr. Vice President/Manufacturing 79 Thomas E. Corr Vice President/Marketing and Sales 68 John P. Majors Vice President/Distribution 55 Barry P. Bowen Treasurer 61
* A member of the Board of Directors of the Company. (1) All of the above named officers have served in the positions set forth in the table as their principal occupations for
more than the past five years except for Mrs. Gordon who was appointed to her current position on January 20, 2015. Mrs. Gordon also serves as Vice President of HDI Investment Corp., a family investment company.
Code of Ethics
The Company has a Code of Business Conduct and Ethics, which applies to all of the Company’s directors and employees, and which meets the Securities Exchange Commission criteria for a “code of ethics.” The Code of Business Conduct and Ethics is available on the Company’s website, located at www.tootsie.com, and the information in such is available in print to any shareholder who requests a copy. ITEM 11. Executive Compensation.
See the information set forth in the sections entitled “Executive Compensation” and “Director Compensation” of the Company’s 2017 Proxy Statement, which are incorporated herein by reference.
ITEM 12. Security Ownership of Certain Beneficial Owners and Management and Related Stockholder Matters.
For information with respect to the beneficial ownership of the Company’s common stock and Class B common stock by the beneficial owners of more than 5% of said shares and by the management of the Company, see the sections entitled “Ownership of Common Stock and Class B Common Stock by Certain Beneficial Owners” and “Ownership of Common Stock and Class B Common Stock by Management” of the 2017 Proxy Statement. These sections of the 2017 Proxy Statement are incorporated herein by reference. The Company does not have any compensation plans under which equity securities of the Company are authorized for issuance.

49
ITEM 13. Certain Relationships and Related Transactions, and Director Independence.
See the section entitled “Related Person Transactions” of the 2017 Proxy Statement, which is incorporated herein by reference.
The Company’s board of directors has determined that its non-management directors, Mr. Seibert and Ms. Wardynski and Ms. Lewis-Brent, are independent under the New York Stock Exchange listing standards because they have no direct or indirect relationship with the Company other than through their service on the Board of Directors.
ITEM 14. Principal Accounting Fees and Services.
See the section entitled “Independent Auditor Fees and Services” of the 2017 Proxy Statement, which is incorporated herein by reference.
ITEM 15. Exhibits, Financial Statement Schedules.
(a) Financial Statements.
(1) The following financial statements are included in Item 8:
Report of Independent Registered Public Accounting Firm
Consolidated Statements of Earnings and Retained Earnings for each of the three years ended December 31, 2016, 2015 and 2014
Consolidated Statements of Comprehensive Earnings for each of the three years endedDecember 31, 2016, 2015 and 2014
Consolidated Statements of Financial Position at December 31, 2016 and 2015
Consolidated Statements of Cash Flows for each of the three years ended in the periodDecember 31, 2016, 2015 and 2014
Notes to Consolidated Financial Statements
(2) Financial Statement Schedules
The financial statement schedule included in this Form 10-K is Schedule II - Valuation and Qualifying Accounts and Reserves for the Years Ended December 31, 2016, 2015 and 2014 (see Schedule II immediately following the signature page of this Form 10-K).
(3) Exhibits required by Item 601 of Regulation S-K:
See Index to Exhibits which appears following Financial Schedule II.
ITEM 16. Form 10-K Summary.
None.

50
SIGNATURES
Pursuant to the requirements of Section 13 or 15 (d) of the Securities Exchange Act of 1934, Tootsie Roll Industries, Inc., has duly caused this report to be signed on its behalf by the undersigned, thereunto duly authorized.
TOOTSIE ROLL INDUSTRIES, INC.
By: Ellen R. Gordon Ellen R. Gordon, Chairman of the Board of Directors
and Chief Executive Officer
Date: February 27, 2017
Pursuant to the requirements of the Securities Exchange Act of 1934, this report has been signed below by the following persons on behalf of the registrant and in the capacities and on the dates indicated.
Ellen R. Gordon Chairman of the Board of Directors and Chief Executive Officer February 27, 2017 Ellen R. Gordon (principal executive officer) Paula M. Wardynski Director February 27, 2017 Paula M. Wardynski Lana Jane Lewis-Brent Director February 27, 2017 Lana Jane Lewis-Brent Barre A. Seibert Director February 27, 2017 Barre A. Seibert G. Howard Ember, Jr. Vice President, Finance February 27, 2017 G. Howard Ember, Jr. (principal financial officer and principal accounting officer)

51
SCHEDULE II – VALUATION AND QUALIFYING ACCOUNTS (in thousands)
DECEMBER 31, 2016, 2015 AND 2014
Additions (reductions) Balance at charged Balance at beginning (credited) to End of Description of year expense Deductions(1) Year
2016:
Reserve for bad debts $ 1,410 $ (166) $ 19 $ 1,225 Reserve for cash discounts 815 9,247 9,403 659 Deferred tax asset valuation 2,077 240 — 2,317
$ 4,302 $ 9,321 $ 9,422 $ 4,201 2015:
Reserve for bad debts $ 1,300 $ 267 $ 157 $ 1,410 Reserve for cash discounts 668 9,678 9,531 815 Deferred tax asset valuation 2,478 (401) — 2,077
$ 4,446 $ 9,544 $ 9,688 $ 4,302 2014:
Reserve for bad debts $ 1,398 $ 29 $ 127 $ 1,300 Reserve for cash discounts 644 9,667 9,643 668 Deferred tax asset valuation 957 1,521 — 2,478
$ 2,999 $ 11,217 $ 9,770 $ 4,446
(1) Deductions against reserve for bad debts consist of accounts receivable written off net of recoveries and exchange rate
movements. Deductions against reserve for cash discounts consist of allowances to customers.

52
INDEX TO EXHIBITS
3.1
Restated Articles of Incorporation. Incorporated by reference to Exhibit 3.1 of the Company’s Quarterly Report on Form 10-Q for the quarterly period ended June 30, 1997.
3.2
Amendment to Restated Articles of Incorporation. Incorporated by reference to Exhibit 3.2 of the Company’s Annual Report on Form 10-K for the year ended December 31, 1999.
3.3
Amended and Restated By-Laws. Incorporated by reference to Exhibit 3.2 of the Company’s Annual Report onForm 10-K for the year ended December 31, 1996.
4.1
Specimen Class B Common Stock Certificate. Incorporated by reference to Exhibit 1.1 of the Company’s Registration Statement on Form 8-A dated February 29, 1988.
10.1*
Excess Benefit Plan. Incorporated by reference to Exhibit 10.8.1 of the Company’s Annual Report on Form 10-K for the year ended December 31, 1990.
10.2*
Amended and Restated Career Achievement Plan of the Company. Incorporated by reference to Exhibit 10.8.2 of the Company’s Annual Report on Form 10-K for the year ended December 31, 1998.
10.3*
Amendment to the Amended and Restated Career Achievement Plan of the Company. Incorporated by referenceto Exhibit 10.8.3 of the Company’s Annual Report on Form 10-K for the year ended December 31, 1999.
10.4*
Restatement of Split Dollar Agreement (Special Trust) between the Company and the trustee of the Gordon Family 1993 Special Trust dated January 31, 1997. Incorporated by reference to Exhibit 10.12 of the Company’s Annual Report on Form 10-K for the year ended December 31, 1996.
10.5*
Form of Change In Control Agreement dated August, 1997 between the Company and certain executive officers.Incorporated by reference to Exhibit 10.25 of the Company’s Annual Report on Form 10-K for the year ended December 31, 1997.
10.6*
Amendment to Split Dollar Agreement (Special Trust) dated April 2, 1998 between the Company and the trusteeof the Gordon Family 1993 Special Trust, together with related Collateral Assignments. Incorporated by referenceto Exhibit 10.27 of the Company’s Annual Report on Form 10-K for the year ended December 31, 1998
10.7*
Form of amendment to Change in Control Agreement between the Company and certain executive officers.Incorporated by reference to Exhibit 10.28 of the Company’s Annual Report on Form 10-K for the year ended December 31, 2008.
10.8*
Post 2004 Supplemental Savings Plan of the Company. Incorporated by reference to Exhibit 10.29 of the Company’s Annual Report on Form 10-K for the year ended December 31, 2008.
10.9*
Post 2004 Excess Benefit Plan of the Company. Incorporated by reference to Exhibit 10.30 of the Company’s Annual Report on Form 10-K for the year ended December 31, 2008.
10.10*
Amended and Restated Career Achievement Plan of the Company. Incorporated by reference to Exhibit 10.31 of the Company’s Annual Report on Form 10-K for the year ended December 31, 2008.
10.11*
Exhibit 10.1- Tootsie Roll Industries, Inc. Management Incentive Plan. Incorporated by reference to AppendixA to the Company’s definitive Proxy Statement filed with the Commission on March 24, 2006.
10.12*
Amendment 2015-1, to the Tootsie Roll Industries, Inc. Post 2004 Excess Benefit Plan. Incorporated by reference to Exhibit 10.12 of the Company’s Annual Report on Form 10-K for the year ended December 31, 2015.

53
10.13*
Amendment 2015-1, to the Tootsie Roll Industries, Inc. Career Achievement Plan. Incorporated by reference to Exhibit 10.13 of the Company’s Annual Report on Form 10-K for the year ended December 31, 2015.
21 List of Subsidiaries of the Company. 31.1 Certification of the Chief Executive Officer pursuant to Section 302 of the Sarbanes-Oxley Act of 2002. 31.2 Certification of the Chief Financial Officer pursuant to Section 302 of the Sarbanes-Oxley Act of 2002. 32
Certification pursuant to 18 U.S.C. Section 1350, as adopted pursuant to Section 906 of the Sarbanes-Oxley Act of 2002.
101
The following financial statements and notes from Tootsie Roll Industries, Inc.’s Form 10-K for the year ended December 31, 2016, filed with the Securities and Exchange Commission on February 27, 2017, formatted in XBRL (eXtensible Business Reporting Language): (i) the Consolidated Statements of Earnings and RetainedEarnings; (ii) Consolidated Statements of Comprehensive Earnings; (iii) Consolidated Statements of FinancialPosition; (iv) the Consolidated Statements of Cash Flows; and (v) the Notes to Consolidated FinancialStatements.
*Management compensation plan or arrangement.

EXHIBIT 21
LIST OF SUBSIDIARIES OF THE COMPANY
NAME JURISDICTION OF INCORPORATION
Andes Candies, LP Illinois Andes Manufacturing LLC Illinois Andes Services LLC Illinois C. C. L. P., Inc. Delaware C. G. P., Inc. Delaware Cambridge Brands, Inc. Delaware Cambridge Brands Manufacturing, Inc. Delaware Cambridge Brands Services, Inc. Delaware Candy Realty, Inc. New Jersey Cella’s Confections, Inc. Virginia Charms Company Delaware Charms LLC Illinois Concord (GP) Inc. Ontario Concord Canada Holdings ULC Nova Scotia Concord Confections Holdings USA, Inc. Delaware Concord Partners LP Ontario Concord Wax, Inc. Delaware Dr. Torrents, S. A. Spain Fleer Española,S.A. Spain General Magnetics, Inc. New Jersey Henry Eisen Advertising Agency, Inc. New Jersey Impel Movie Line, Inc. Delaware JT Company, Inc. Delaware Rizzle Inversiones 2014, S.L. Spain Sweets Company of New York, Inc. New York Tootsie Roll Industries, LLC Illinois Tootsie Roll of Canada, ULC Alberta Tootsie Roll Central Europe, Ltd. Delaware The Tootsie Roll Company, Inc. Illinois Tootsie Roll Management, Inc. Illinois Tootsie Roll Mfg., LLC Illinois Tootsie Rolls - Latin America, Inc. Delaware Tootsie Roll Worldwide, Ltd. Illinois The Sweets Mix Company, Inc. Illinois TRI de Latinoamerica S.A. de C.V. Mexico TRI Captive Insurance Company, Inc. Nevada TRI Finance, Inc. Delaware TRI International, Inc. Illinois TRI-Mass, Inc. Massachusetts TRI Sales Co. Delaware Tutsi S. A. de C. V. Mexico World Trade & Marketing Ltd. British West Indies

Exhibit 31.1
CERTIFICATIONS
I, Ellen R. Gordon, Chairman and Chief Executive Officer of Tootsie Roll Industries, Inc., certify that:
1. I have reviewed this annual report on Form 10-K of Tootsie Roll Industries, Inc.;
2. Based on my knowledge, this report does not contain any untrue statement of a material fact or omit to state a material fact necessary to make the statements made, in light of the circumstances under which such statements were made, not misleading with respect to the period covered by this report;
3. Based on my knowledge, the financial statements, and other financial information included in this report, fairly
present in all material respects the financial condition, results of operations and cash flows of the registrant as of, and for, the periods presented in this report;
4. The registrant’s other certifying officer(s) and I are responsible for establishing and maintaining disclosure controls and procedures (as defined in Exchange Act Rules 13a-15(e) and 15d-15(e)) and internal control over financial reporting (as defined in Exchange Act Rules 13a-15(f) and 15d-15(f)) for the registrant and have:
(a) Designed such disclosure controls and procedures, or caused such disclosure controls and procedures to be designed under our supervision, to ensure that material information relating to the registrant, including its consolidated subsidiaries, is made known to us by others within those entities, particularly during the period in which this report is being prepared;
(b) Designed such internal control over financial reporting, or caused such internal control over financial reporting to be designed under our supervision, to provide reasonable assurance regarding the reliability of financial reporting and the preparation of financial statements for external purposes in accordance with generally accepted accounting principles;
(c) Evaluated the effectiveness of the registrant’s disclosure controls and procedures and presented in this report our conclusions about the effectiveness of the disclosure controls and procedures, as of the end of the period covered by this report based on such evaluation; and
(d) Disclosed in this report any change in the registrant’s internal control over financial reporting that occurred during the registrant’s most recent fiscal quarter (the registrant’s fourth fiscal quarter in the case of an annual report) that has materially affected, or is reasonably likely to materially affect, the registrant’s internal control over financial reporting; and
5. The registrant’s other certifying officer(s) and I have disclosed, based on our most recent evaluation of internal control over financial reporting, to the registrant’s auditors and the audit committee of the registrant’s board of directors (or persons performing the equivalent functions):
(a) All significant deficiencies and material weaknesses in the design or operation of internal control over financial reporting which are reasonably likely to adversely affect the registrant’s ability to record, process, summarize and report financial information; and
(b) Any fraud, whether or not material, that involves management or other employees who have a significant role in the registrant’s internal control over financial reporting.
Date: February 27, 2017 By: /s/ Ellen R. Gordon Ellen R. Gordon Chairman and Chief Executive Officer

Exhibit 31.2
CERTIFICATIONS
I, G. Howard Ember, Jr., Vice President/Finance and Chief Financial Officer of Tootsie Roll Industries, Inc., certify that: 1. I have reviewed this annual report on Form 10-K of Tootsie Roll Industries, Inc.; 2. Based on my knowledge, this report does not contain any untrue statement of a material fact or omit to state a
material fact necessary to make the statements made, in light of the circumstances under which such statements were made, not misleading with respect to the period covered by this report;
3. Based on my knowledge, the financial statements, and other financial information included in this report, fairly
present in all material respects the financial condition, results of operations and cash flows of the registrant as of, and for, the periods presented in this report;
4. The registrant’s other certifying officer(s) and I are responsible for establishing and maintaining disclosure
controls and procedures (as defined in Exchange Act Rules 13a-15(e) and 15d-15(e)) and internal control over financial reporting (as defined in Exchange Act Rules 13a-15(f) and 15d-15(f)) for the registrant and have:
(a) Designed such disclosure controls and procedures, or caused such disclosure controls and procedures to be
designed under our supervision, to ensure that material information relating to the registrant, including its consolidated subsidiaries, is made known to us by others within those entities, particularly during the period in which this report is being prepared;
(b) Designed such internal control over financial reporting, or caused such internal control over financial
reporting to be designed under our supervision, to provide reasonable assurance regarding the reliability of financial reporting and the preparation of financial statements for external purposes in accordance with generally accepted accounting principles;
(c) Evaluated the effectiveness of the registrant’s disclosure controls and procedures and presented in this
report our conclusions about the effectiveness of the disclosure controls and procedures, as of the end of the period covered by this report based on such evaluation; and
(d) Disclosed in this report any change in the registrant’s internal control over financial reporting that occurred
during the registrant’s most recent fiscal quarter (the registrant’s fourth fiscal quarter in the case of an annual report) that has materially affected, or is reasonably likely to materially affect, the registrant’s internal control over financial reporting; and
5. The registrant’s other certifying officer(s) and I have disclosed, based on our most recent evaluation of internal
control over financial reporting, to the registrant’s auditors and the audit committee of the registrant’s board of directors (or persons performing the equivalent functions):
(a) All significant deficiencies and material weaknesses in the design or operation of internal control over
financial reporting which are reasonably likely to adversely affect the registrant’s ability to record, process, summarize and report financial information; and
(b) Any fraud, whether or not material, that involves management or other employees who have a significant
role in the registrant’s internal control over financial reporting.
7
Date: February 27, 2017 By: /s/ G. Howard Ember, Jr. G. Howard Ember, Jr. Vice President/Finance and Chief Financial Officer

Exhibit 32
Certificate Pursuant to 18 U.S.C. Section 1350, as Adopted Pursuant to Section 906 of the Sarbanes-Oxley Act of 2002
Each of the undersigned officers of Tootsie Roll Industries, Inc. certifies that (i) the Annual Report on Form 10-K of Tootsie Roll Industries, Inc. for the year ended December 31, 2016 (the Form 10-K) fully complies with the requirements of Section 13(a) or 15(d) of the Securities Exchange Act of 1934, as amended and (ii) the information contained in the Form 10-K fairly presents, in all material respects, the financial condition and results of operations of Tootsie Roll Industries, Inc.
Dated: February 27, 2017 /s/ Ellen R. Gordon Ellen R. Gordon Chairman and Chief Executive Officer Dated: February 27, 2017 /s/ G. Howard Ember, Jr. G. Howard Ember, Jr. Vice President/Finance and Chief Financial Officer

IntentionallyLeft Blank

Board of Directors
(1)Audit Committee (2)Compensation Committee
Officers
Offices, Plants
Other Information
Ellen R. Gordon Chairman of the Board and Chief Executive Officer
Lana Jane Lewis-Brent(1)(2) President, Paul BrentDesigner, Inc., an artpublishing, design andlicensing company
Barre A. Seibert(1)(2) Retired First Vice President,Washington Mutual Bank
Paula M. Wardynski(1)(2) Senior Vice President—Finance, Twenty-FirstCentury Fox
Ellen R. Gordon Chairman of the Board and Chief Executive Officer
G. Howard Ember, Jr. Vice President, Finance &Chief Financial Officer
John W. Newlin, Jr. Vice President, Manufacturing
Thomas E. Corr Vice President,Marketing & Sales
John P. Majors Vice President, PhysicalDistribution
Barry P. Bowen Treasurer & AssistantSecretary
Richard F. Berezewski Controller
Executive Offices 7401 S. Cicero Ave.Chicago, Illinois 60629www.tootsie.com
Plants/Warehouses IllinoisTennesseeMassachusettsPennsylvaniaWisconsinOntario, CanadaMexico City, MexicoBarcelona, Spain
Foreign Sales Offices Mexico City, MexicoOntario, CanadaBarcelona, Spain
Stock Exchange New York Stock Exchange, Inc.(Since 1922)
Stock Identification Ticker Symbol: TRCUSIP No. 890516 10-7
Stock Transfer Agent andStock Registrar
American Stock Transferand Trust CompanyOperations Center6201 15th AvenueBrooklyn, NY 112191-800-710-0932www.amstock.com
Independent RegisteredPublic Accounting Firm
PricewaterhouseCoopers LLPOne North WackerChicago, IL 60606
General Counsel Aronberg Goldgehn Davis &Garmisa330 North Wabash AvenueChicago, IL 60611
Annual Meeting May 1, 2017Mutual Building, Room 1200909 East Main StreetRichmond, VA 23219
Printed on recycled paper.
Merrill Corp - Tootsie Roll Annual Report ED | 105914 | 28-Feb-17 08:17 | 17-6862-1.za | Sequence: 1CHKSUM Content: 64315 Layout: 5986 Graphics: 51959 CLEAN
JOB: 17-6862-1 CYCLE#;BL#: 6; 0 TRIM: 8.5" x 11" COMPOSITECOLORS: Black, Cyan, Magenta, Yellow, ~note-color 2 GRAPHICS: recycled_logo.eps, tootsie_com_4c_photo.eps, tr_listed_nyse_k_logo.eps V1.5


![ZYBO - Digilent Documentation [Reference.Digilentinc] Z7 B.2 out of 14 2017 MIPI, General I/O 10K R60 10K R62 10K R64 10K R67 GND VCC3V3 SW3 SW2 SW1 SW0 10K R57 10K R71 10K R72 GND](https://img.pdfslide.us/doc/110x75/5abecaa37f8b9a3a428d6851/zybo-digilent-documentation-z7-b2-out-of-14-2017-mipi-general-io-10k-r60.jpg)