Embed Size (px)
Citation preview

1979
National Cancer Institute
CARCINOGENESIS Technical Report Series NO. 123
BIOASSAY OF
2,7-DICHLORODIBENZO-p-DIOXIN (DCDD)
FOR POSSIBLE CARCINOGENICITY
CAS No. 33857-26-0
NCI-CG-TR-123
U.S. DEPARTMENT OF HEALTH, EDUCATION, AND WELFARE Public Health Service National Institutes of Health


BIOASSAY OF 2,7-DICHLORODIBENZO-p-DIOXIN (DCDD)
FOR POSSIBLE CARCINOGENICITY
Carcinogenesis Testing Program Division of Cancer Cause and Prevention
National Cancer Institute National Institutes of Health Bethesda, Maryland 20014
U.S. DEPARTMENT OF HEALTH, EDUCATION, AND WELFARE Public Health Service
National Institutes of Health
DHEW Publication No. (NIH) 79-1378


BIOASSAY OF 2,7-DICHLORODIBENZO-p-DIOXIN (DCDD)
FOR POSSIBLE CARCINOGENICITY
Carcinogenesis Testing Program Division of Cancer Cause and Prevention
National Cancer Institute National Institutes of Health
FOREWORD; This report presents the results of the bioassay of 2,7-dichlorodibenzo-p-dioxin (DCDD) conducted for the Carcinogenesis Testing Program, Division of Cancer Cause and Prevention, National Cancer Institute (NCI), National Institutes of Health, Bethesda, Maryland. This is one of a series of experiments designed to determine whether selected chemicals have the capacity to produce cancer in animals. A negative result, in which the test animals do not have a greater incidence of cancer than control animals, does not necessarily mean that the test chemical is not a carcinogen, inasmuch as the experiments are conducted under a limited set of circumstances. A positive result demonstrates that the test chemical is carcinogenic for animals under the conditions of the test and indicates that exposure to the chemical is a potential risk to man. The actual determination of the risk to man from chemicals found to be carcinogenic in animals requires a wider analysis.
CONTRIBUTORS; This bioassay of 2,7-dichlorodibenzo-p-dioxin (DCDD) wasconducted by the Illinois Institute of Technology Research Institute (lITRl) (1), Chicago, Illinois, initially under direct contract to NCI (2) and currently under a subcontract to Tracer Jitco., Inc. (3), Rockville, Maryland, prime contractor for the NCI Carcinogenesis Testing Program.
The project director was Mr. A. Shefner (1). Dr. M. E. King (1) was the principal investigator for this study, and Dr. P. Holmes (1) assembled the data. Doses of the test chemical were selected by Dr. King, Mr. Shefner, and Dr. R. R. Bates (2,3). Mr. T. Kruckeberg (1) and Mr. K. Kaltenborn (1) were in charge of animal care. Histopathologic examinations were performed by Dr. A. R. Roesler (1). Tumor diagnoses were reviewed by Dr. R. L. Schueler (4), who also prepared the interpretive pathology summary included in this report.
ill

Animal pathology tables and survival tables were compiled at EG&G Mason Research Institute (5). The statistical analyses were performed by Dr. J. R. Joiner (4) and Ms. P. L. Yong (4), using methods selected for the bioassay program by Dr. J. J. Gart (6). Chemicals used in this bioassay were synthesized and analyzed under the direction of Dr. A. Gray (1), with the assistance of Mr. S. Cepa (1) and Mr. V. DePinto (1). Further analyses were conducted under the direction of Dr. E. Murrill (7). The results of the analytical work were reviewed by Dr. S. S. Olin (4).
This report was prepared at Tracer Jitco under the direction of Dr. L. A. Campbell, Director of the Bioassay Program; Dr. S. S. Olin, Deputy Director for Science; Dr. J. F. Robens, toxicologist; Dr. R. L. Schueler, pathologist; Dr. G. L. Miller, Ms. L. A. Waitz, and Mr. W. D. Reichardt, bioscience writers; and Dr. E. W. Gunberg, technical editor, assisted by Ms. Y. E. Presley and Ms. P. J. Graboske.
The following scientists at NCI were responsible for evaluating the bioassay experiment, interpreting the results, and reporting the findings: Dr. Kenneth C. Chu, Dr. Cipriano Cueto, Jr., Dr. J. Fielding Douglas, Dr. Richard A. Griesemer, Dr. Thomas E. Hamm, Dr. William V. Hartwell, Dr. Morton H. Levitt, Dr. Harry A. Milman, Dr. Thomas W. Orme, Dr. A. R. Patel, Dr. Sherman F. Stinson, Dr. Jerrold M. Ward, and Dr. Carrie E. Whitmire.
(1) IIT Research Institute, 10 West 35th Street, Chicago, Illinois.
(2) Carcinogenesis Testing Program, Division of Cancer Cause and Prevention, National Cancer Institute, National Institutes of Health, Bethesda, Maryland.
(3) Now with the National Institutes of Environment Health Sciences, P.O. Box 12233, Research Triangle Park, North Carolina.
(4) Tracer Jitco, Inc., 1776 East Jefferson Street, Rockville, Maryland.
(5) EG&G Mason Research Institute, 1530 East Jefferson Street, Rockville, Maryland.
iv

(6) Mathematical Statistics and Applied Mathematics Section, Biometry Branch, Field Studies and Statistics, Division of Cancer Cause and Prevention, National Cancer Institute, National Institutes of Health, Bethesda, Maryland.
(7) Midwest Research Institute, 425 Volker Boulevard, Kansas City, Missouri.


SUMMARY
A bioassay of 2,7-dichlorodibenzo-p-dioxin (DCDD) for possible carcinogenicity was conducted by administering the test chemical in feed to Osborne-Mendel rats and B6C3F1 mice.
Groups of 35 rats of each sex were administered DCDD at one of two doses, either 5,000 or 10,000 ppm, for 110 weeks. Groups of 50 mice of each sex were administered these same doses for 90 weeks. Controls consisted of 35 untreated rats of each sex and 50 untreated mice of each sex. All surviving male rats were killed at 110 to 112 weeks, all surviving female rats at 110 to 117 weeks, all surviving male mice at 92 to 101 weeks, and all surviving female mice at 91 to 98 weeks.
Mean body weights of most of the dosed groups of rats and mice were lower than those of corresponding controls both when placed on study and for much of the study period; however, survival of any group was not significantly affected by administration of the test chemical. Sufficient numbers of dosed and control rats and mice of each sex were at risk for the development of late-appearing tumors.
No tumors were induced in male or female rats or female mice at incidences that were significantly higher in the dosed groups than in the corresponding control groups. Both low- and high-dose rats had toxic hepatic lesions characterized by centrilobular fatty metamorphosis and/or necrosis.
In the male mice, hepatocellular adenomas or carcinomas occurred at incidences that were dose related (P = 0.008), and, in direct comparisons, were higher in the low-dose group (P = 0.008) and the high-dose group (P = 0.010) than in the control group (controls 8/49, low-dose 20/50, high-dose 17/42). However, the historical incidence of this lesion in control male B6C3F1 mice at this laboratory does not permit a clear association of the lesion with the administration of the test compound. There were also significant increases in the incidence of combinations of leukemias and lymphomas and of hemangiosarcomas and hemangiomas in the low-dose male mice, but these findings were not supported by the high-dose animals.
vii

It is concluded that under the conditions of this bioassay, DCDD was not carcinogenic for Osborne-Mendel rats of either sex or for female B6C3F1 mice. The marginal increased incidences of combinations of leukemias and lymphomas, of hemangiosar comas and hemangiomas, and of hepatocellular carcinomas and adenomas in male B3C3F1 mice are, however, considered as suggestive of a carcinogenic effect of 2,7-dichlorodibenzo-p-dioxin in these animals.
viii

TABLE OF CONTENTS
Page
I. Introduction 1
II. Materials and Methods 3
A. Chemical 3 B. Dietary Preparation 3 C. Animals 4 D. Animal Maintenance 5 E. Chronic Studies 6 F. Clinical and Pathologic Examinations 9 G. Data Recording and Statistical Analyses 10
III. Results -Rats 17
A. Body Weights and Clinical Signs (Rats) 17 B. Survival (Rats) 17 C. Pathology (Rats) 21 D. Statistical Analyses of Results (Rats) 21
IV. Results - Mice 23
A. Body Weights and Clinical Signs (Mice) 23 B. Survival (Mice) 23 C. Pathology (Mice) 27 D. Statistical Analyses of Results (Mice) 28
V. Discussion 31
VI. Bibliography 35
APPENDIXES
Appendix A Summary of the Incidence of Neoplasms in Rats Administered DCDD in the Diet 37
Table Al Summary of the Incidence of Neoplasms in Male Rats Administered DCDD in the Die£ 39
Table A2 Summary of the Incidence of Neoplasms in Female Rats Administered DCDD in the Diet 43
ix

Appendix B Summary of the Incidence of Neoplasms in Mice Administered DCDD in the Diet 47
Table Bl Summary of the Incidence of Neoplasms in Male Mice Administered DCDD in the Diet 49
Table B2 Summary of the Incidence of Neoplasms in Female Mice Administered DCDD in the Diet 52
Appendix C Summary of the Incidence of Nonneoplastic Lesions in Rats Administered DCDD in the Diet 55
Table Cl Summary of the Incidence of Nonneoplastic Lesions in Male Rats Administered DCDD in the Diet 57
Table C2 Summary of the Incidence of Nonneoplastic Lesions in Female Rats Administered DCDD in the Diet 63
Appendix D Summary of the Incidence of Nonneoplastic Lesions in Mice Administered DCDD in the Diet 69
Table Dl Summary of the Incidence of Nonneoplastic Lesions in Male Mice Administered DCDD in the Diet 71
Table D2 Summary of the Incidence of Nonneoplastic Lesions in Female Mice Administered DCDD in the Diet 74
Appendix E Analyses of the Incidence of Primary Tumors in Rats Administered DCDD in the Diet 79
Table El Analyses of the Incidence of Primary Tumors in Male Rats Administered DCDD in the Diet 81
Table E2 Analyses of the Incidence of Primary Tumors in Female Rats Administered DCDD in the Diet 87
Appendix F Analyses of the Incidence of Primary Tumors in Mice Administered DCDD in the Diet 93
Table Fl Analyses of the Incidence of Primary Tumors in Male Mice Administered DCDD in the Diet 95
Table F2 Analyses of the Incidence of Primary Tumors in Female Mice Administered DCDD in the Diet « 101
TABLES
Table 1 DCDD Chronic Feeding Studies in Rats 7
Table 2 DCDD Chronic Feeding Studies in Mice 8
FIGURES
Figure 1 Growth Curves for Rats Administered DCDD in the Diet 18
Figure 2 Survival Curves for Rats Administered DCDD in the Diet 19
Figure 3 Growth Curves for Mice Administered DCDD in the Diet 24
Figure 4 Survival Curves for Mice Administered DCDD in the Diet 26
xi

TTX

I. INTRODUCTION
2,7-Dichlorodibenzo-p-dioxin (CAS
33857-26-0; NCI C03667), refer
red to in this report as DCDD, is
a chlorinated dibenzodioxin.
Chlorinated dibenzodioxins have
been found as by-products in the 27 — Dichlorodibenzo-p-dioxin
manufacture of pentachlorophenol
and in the herbicide 2,4,5-tri
chlorophenoxyacetic acid (2,4,5-T) and its esters. Pentachloro
phenol is a microbicidal agent that is used as a wood preservative,
for slime control in herbicide formulations, and in the manufacture
of paper pulp; 2,4,5-T has been used as a herbicide on national
forests, rangelands, pastures, in the agricultural industry, and
as a component of Agent Orange, a wartime defoliant (Stecher,
1968; EPA, 1971; Crossland and Shea, 1973).
As a result of these applications, certain dibenzodioxins have
been dispersed in the environment where they are slowly degraded.
Laboratory experiments to test photodegradation indicate that
2,3,7,8-tetrachlorodibenzodioxin is degraded to 2,3,7-trichloro
dibenzodioxin and DCDD; photodegradation occurs in organic

solvents, but not in aqueous suspensions or on wet or dry soil
(Crosby et al., 1971; Kearney et al., 1972).
In acute oral toxicity studies, doses of 1 to 2 g DCDD/kg did not
kill female rats (international Agency for Research on Cancer,
1977). Except for this information and that in a preliminary
report of the present bioassay (King et al., 1973), no other data
are available on the toxicity of DCDD. Studies on the acute and
subacute toxicities of the 2,3,7,8-tetrachloro-, hexachloro-, and
octachlorodibenzo-p-dioxin analogs of DCDD have shown that the
2,3,7,8-tetrachloro analog (TCDD) is the most toxic, having an
acute LD of 0.022 mg/kg in Sherman rats (Schwetz et al.,
1973). The principal target organs of TCDD in rats, guinea pigs,
and mice are the liver and thymus (international Agency for
Research on Cancer 1977), and evidence has been presented for the
induction of carcinomas of the ear duct, kidney, and liver by TCDD
administered in the diet to Sprague-Dawley rats (Van Miller and
Allen, 1977).
DCDD was selected for the Carcinogenesis Testing Program as one of
a series of chlorinated dibenzo-p-dioxins because some of these
compounds, due to their dispersion and persistence in the
environment, may have entered the food chain, causing long-term
human exposure.

II. MATERIALS AND METHODS
A. Chemical
The batch of DCDD used for this bioassay was synthesized by the
Chemistry Division of IITRI. It was prepared by heating sodium
2,4-dichlorophenoxide with copper catalyst in bis(2-ethoxy
ethyl)ether at 180°C (Aniline, 1973).
The identity of the chemical was confirmed by mass spectrometry
and by comparison of gas chromatographic retention time with that
of an authentic sample obtained from Dr. David Firestone of the
Food and Drug Administration. Three impurities with peak areas 3
to 6% of the major peak were detected, all with longer retention
times. One of the impurities was identified by mass spectrome-ry
as a trichlorodibenzodioxin. No tetrachlorodibenzodioxin was
detected by mass spectrometry.
B. Dietary Preparation
Test diets were prepared by incorporating a known quantity of
DCDD into a 2-week supply of powdered Wayne® Sterilizable Lab
Blox animal feed (Allied Mills, Inc., Chicago, 111.). Diets were
mixed in a Patterson-Kelly twin-shell blender for approximately 1
hour, and were stored in sealed plastic containers at room
temperature for no more than 2 weeks.
Analyses were performed in two individual batches of test diet
several months after preparation. Ninety percent of the expected
concentration was found at the 10,000 ppm level and 110% of the
expected concentration at 5,000 ppm.
C. Animals
Osborne-Mendel rats and B6C3F1 mice of each sex, obtained through
a contract with the Division of Cancer Treatment, NCI, were used
in the chronic study. All animals were obtained from Charles
River Breeding Laboratories, Inc., Wilmington, Massachusetts.
Rats and mice were received at the laboratory at approximately 4
weeks of age. They were placed in quarantine for 1 week. Those
animals with no visible signs of disease were earmarked and
assigned to dosed or control groups.

D. Animal Maintenance
The rats and mice were housed in rooms maintained at 22 to
23°C; the relative humidity ranged from 40 to 50%. Fluorescent
lighting was provided for 12 hours each day. Air in the animal
rooms was changed 15 to 20 times per hour and exchanged through
fiberglass filters (Air Filter Equipment Corp., Chicago, 111.).
Control and dosed rats and mice were housed in groups of 4 and
10, respectively, in suspended polypropylene cages (Maryland
Plastics, Federalsburg, Maryland), which were covered with a wire
mesh screen and a polyester filter (Research Equipment Co., Inc.,
Bryan, Tex.). The bedding used in the cages was Absorb-dri
hardwood chips (Lab Products, Inc., Garfield, N. J.). Tap water
was made available ad libitum in glass water bottles with sipper
tubes and was replenished twice per week. The control animals
were fed Wayne Lab Blox animal meal (Allied Mills, Inc.), and
the dosed animals received the same diets, to which was added the
test chemical. The diets were made available ad libitum and were
replenished as necessary, but at least once per week.
The cages, cage lids, and water bottles were sanitized weekly at
82°C; the feed hoppers, every 2 weeks at the same temperature.
The detergent used was liquid Spearhead (Economics Laboratory,

Inc., St. Paul, Minn.). The dishwasher used was a flight-type
conveyor belt washer (G. S. Blakeslee & Co., Chicago, 111.). The
bedding was replaced each week. The racks were washed once per
month in a Metalwash Rack Washer (Metalwash Machinery Corp.,
Elizabeth, N. J.)
The racks were rotated in the test rooms once per month. The
rats and the mice were housed in separate rooms. The untreated
controls were housed in the same room with the dosed animals*
The animals fed DCDD were in the same room with the animals
administered the following test compounds:
Drinking Water Studies
(CAS 123-91-1) 1,4-dioxane
Feed Studies
(CAS 3268-87-9) 1,2,3,4,6,7,8,9-octachlorodibenzodioxin (CAS 262-12-4) dibenzo-p-dioxin (UDD)
E. Chronic Studies
The test groups, doses administered, and durations of the chronic
studies are shown in tables 1 and 2. Dosed and control male rats
originally placed on study died, due to a failure of the
air-conditioning system. The male groups in this report were
placed on study 1 year later than the female rats and male and

Table 1. DCDD Chronic Feeding Studies in Rats
Sex and Test Group
Male
Control (b)
Low-Dose
High-Dose
Female
Control (b)
Low-Dose
High-Dose
Initial No. of Animals (a)
35
35
35
35
35
35
DCDD in Diet (ppm)
0
5,000
10,000
0
5,000
10,000
Time on Study Dosed Observed (weeks) (weeks)
110
110 1-2
110 1
116-117
110
110
(a) Rats were 5 weeks of age when placed on study.
(b) Male controls were started 4 weeks earlier than the dosed male groups; female controls were started 17 weeks earlier than the dosed female groups.

Table 2. DCDD Chronic Feeding Studies in Mice
Sex and Test Group
Male
Control (b)
Low-Dose
High-Dose
Female
Control (b)
Low-Dose
High-Dose
Initial DCDD No. of in Diet Animals (a) (ppm)
50 0
50 5,000
50 10,000
50 0
50 5,000
50 10,000
Time on Study Dosed Observed (weeks) (weeks)
90 2-3
90 10-11
90 9
90 1-2
90 2-3
90 8
(a) Mice were 5 weeks of age when placed on study.
(b) Controls were placed on study 16 weeks before the dosed groups.

female mice. The doses were set at 5,000 and 10,000 ppm for both
species, based on the maximum dose levels permitted by NCI
protocols for administration of materials presumed to be
nontoxic. A subchronic study was not conducted. In an acute
oral LD study, DCDD in doses of 1 to 2 g/kg did not kill
female rats (IARC, 1977).
F. Clinical and Pathologic Examinations
All animals were observed twice daily. Body weights were
measured monthly. Moribund animals and animals that survived to
the end of the bioassay were killed using sodium pentobarbital
and necropsied.
The tissues taken at necropsy included: skin, lymph node
(mandibular and mesenteric), salivary gland, mammary gland, bone
marrow, thymus, larynx, trachea, lungs and bronchi, heart,
thyroid, parathyroids, esophagus, stomach, duodenum, colon,
liver, gall bladder (mice), pancreas, spleen, kidney, adrenal,
gonads, nasal cavity, brain, pituitary, spinal cord, skeletal
muscle, sciatic nerve, and tissue masses. The tissues were
preserved in 10% buffered formalin, embedded in paraffin,
sectioned, and stained with hematoxylin and eosin. All tissues

were examined microscopically by the pathologist, except for some
tissues that were lost during necropsy or histologic processing.
Necropsies were also performed on all animals found dead, unless
precluded in whole or in part by autolysis or cannibalization.
Thus, the number of animals from which particular organs or
tissues were examined microscopically varies and does not
necessarily represent the number of animals that were placed on
study in each group.
G. Data Recording and Statistical Analyses
Pertinent data on this experiment have been recorded in an
automatic data processing system, the Carcinogenesis Bioassay
Data System (Linhart et al., 1974). The data elements include
descriptive information on the chemicals, animals, experimental
design, clinical observations, survival, body weight, and
individual pathologic results, as recommended by the International
Union Against Cancer (Berenblum, 1969). Data tables were
generated for verification of data transcription and for
statistical review.
These data were analyzed using the appropriate statistical
10

techniques described in this section. Those analyses of the
experimental results that bear on the possibility of
carcinogenicity are discussed in the statistical narrative
sections.
Probabilities of survival were estimated by the product-limit
procedure of Kaplan and Meier (1958) and are presented in this
report in the form of graphs. Animals were statistically
censored as of the time that they died of other than natural
causes or were found to be missing; animals dying from natural
causes were not statistically censored. Statistical analyses for
a possible dose-related effect on survival used the method of Cox
(1972) for testing two groups for equality and Tarone's (1975)
extensions of Cox's methods for testing for a dose-related
trend. One-tailed P values have been reported for all tests
except the departure from linearity test, which is only reported
when its two-tailed P value is less than 0.05.
The incidence of neoplastic or nonneoplastic lesions has been
given as the ratio of the number of animals bearing such lesions
at a specific anatomic site (numerator) to the number of animals
in which that site is examined (denominator). In most instances,
the denominators included only those animals for which that site
was examined histologically. However, when macroscopic
11

examination was required to detect lesions prior to histologic
sampling (e.g., skin or mammary tumors), or when lesions could
have appeared at multiple sites (e.g., lymphomas), the
denominators consist of the numbers of animals necropsied.
The purpose of the statistical analyses of tumor incidence is to
determine whether animals receiving the test chemical developed a
significantly higher proportion of tumors than did the control
animals. As a part of these analyses, the one-tailed Fisher
exact test (Cox, 1970) was used to compare the tumor incidence of
a control group with that of a group of dosed animals at each
dose level. When results for a number of dosed groups (k) are
compared simultaneously with those for a control group, a
correction to ensure an overall significance level of 0.05 may be
made. The Bonferroni inequality (Miller, 1966) requires that the
P value for any comparison be less than or equal to 0.05/k. In
cases where this correction was used, it is discussed in the
narrative section. It is not, however, presented in the tables,
where the Fisher exact P values are shown.
The Cochran-Armitage test for linear trend in proportions, with
continuity correction (Armitage, 1971), was also used. Under the
assumption of a linear trend, this test determines if the slope
of the dose-response curve is different from zero at the
12

one-tailed 0.05 level of significance. Unless otherwise noted,
the direction of the significant trend is a positive dose
relationship. This method also provides a two-tailed test of
departure from linear trend.
A time-adjusted analysis was applied when numerous early deaths
resulted from causes that were not associated with the formation
of tumors. In this analysis, deaths that occurred before the
first tumor was observed were excluded by basing the statistical
tests on animals that survived at least 52 weeks, unless a tumor
was found at the anatomic site of interest before week 52. When
such an early tumor was found, comparisons were based exclusively
on animals that survived at least as long as the animal in which
the first tumor was found. Once this reduced set of data was
obtained, the standard procedures for analyses of the incidence
of tumors (Fisher exact tests, Cochran-Armitage tests, etc.) were
followed.
When appropriate, life-table methods were used to analyze the
incidence of tumors. Curves of the proportions surviving without
an observed tumor were computed as in Saffiotti et al. (1972).
The week during which an animal died naturally or was sacrificed
was entered as the time point of tumor observation. Cox's
methods of comparing these curves were used for two groups;
13

Tarone's extension to testing for linear trend was used for three
groups. The statistical tests for the incidence of tumors which
used life-table methods were one-tailed and, unless otherwise
noted, in the direction of a positive dose relationship.
Significant departures from linearity (P less than 0.05,
two-tailed test) were also noted.
The approximate 95 percent confidence interval for the relative
risk of each dosed group compared with its control was calculated
from the exact interval on the odds ratio (Gart, 1971). The
relative risk is defined as P../P where p is the true
binomial probability of the incidence of a specific type of tumor
in a dosed group of animals and p is the true probability of
the spontaneous incidence of the same type of tumor in a control
group. The hypothesis of equality between the true proportion of
a specific tumor in a dosed group and the proportion in a control
group corresponds to a relative risk of unity. Values in excess
of unity represent the condition of a larger proportion in the
dosed group than in the control.
The lower and upper limits of the confidence interval of the
relative risk have been included in the tables of statistical
analyses. The interpretation of the limits is that in
approximately 95% of a large number of identical experiments, the
14

true ratio of the risk in a dosed group of animals to that in a
control group would be within the interval calculated from the
experiment. When the lower limit of the confidence interval is
greater than one, it can be inferred that a statistically
significant result (P less than 0.025 one-tailed test when the
control incidence is not zero, P less than 0.050 when the control
incidence is zero) has occurred. When the lower limit is less
than unity, but the upper limit is greater than unity, the lower
limit indicates the absence of a significant result while the
upper limit indicates that there is a theoretical possibility of
the induction of tumors by the test chemical, which could not be
detected under the conditions of this test.
15

16

III. RESULTS - RATS
A. Body Weights and Clinical Signs (Rats)
Among male rats the mean body weights of both dosed groups were
lower than those of the corresponding controls at the time the
animals were placed on study and throughout the test period.
After week 50, mean body weights of dosed groups of female rats
were also lower than those of controls and were dose related
(figure 1). Fluctuation in the growth curves may be due to
mortality; as the size of a group diminishes, the mean body
weight may be subject to variation. No clinical signs other than
those of lowered body weights were reported.
B. Survival (Rats)
The Kaplan and Meier curves estimating the probabilities of
survival for male and female rats administered DCDD in the diet
at the doses of this bioassay, together with those of the
controls, are shown in figure 2. In male rats, the dosed groups
were started on study 4 weeks after the control group, and in
females, the dosed groups were started 17 weeks after the
17

D D D' 600 p a n
0 D D ° D
D U O O o o 0 0
D D ° 0 ° ° 0 ° 0500 D A A A0 ° ° ° A A A ^ A 5 * A A A A <a ° A A
A AH 0 A Z a0 400Ul
D °A A5 > O a OA § 300
AZ
Ul O5
200 | MALE RATS 3 A
a CONTROL
& o LOW DOSEj k 100 A HIGH DOSE
C 10 20 30 40 50 60 70 80 90 100 11
TIME ON STUDY (WEEKS) 700
600
500
3
t-X 2Ul
400 a a D ° D D a i
5 to cP cf o o o 0 0 0 0 ( > O A Q /fl
D ^^ $ A
A A A X 2S ** AA A A A ^
g 300
Z <
n jo S]O 7\ *•** A "
Ul
S 200
(P A
8 A FEMALE RATS
[ I D CONTROL
< t O LOW DOSE 100
A HIGH DOSE
100 110
TIME ON STUDY (WEEKS)
Figure 1. Growth Curves for Rats Administered OCOD in the Diet
18

PR
OB
AB
ILIT
Y O
F S
UR
VIV
AL
PR
OB
AB
ILIT
Y O
F S
UR
VIV
AL
p
p
p
p
p
I
->
O D
I
o m
N
> a
§ s
8 i
i % 30
..>"=
O-J
» I
CD
2!
2
3n.
en
^
O
o
o
3'
<D
p
a

controls; however, the Tarone test for dose-related trend in
mortality is applied as if the three groups of each sex were
started at the same time. The control and high-dose male rats
were terminated at 110 weeks while the low-dose males were
terminated at 112 weeks. In female rats, the differences in time
on study were more pronounced; the controls were terminated at
116 to 117 weeks, whereas the dosed groups were terminated at 110
weeks. All animals were censored at 110 weeks in the application
of the Cox and Tarone tests. The results of the Tarone tests are
not significant in either sex, although substantial mortality
occurred in the high-dose group from weeks 36 to 40 compared with
the other groups. The results of the Cox test comparing the
mortality of the control group with that of each dosed group also
are not significant in either sex.
In male rats, 29/35 (83%) of the high-dose animals, 26/35 (74%)
of the low-dose animals, and 30/35 (86%) of the controls were
still alive at week 78 on study. In females, 28/35 (80%) of the
high-dose animals, 30/35 (86%) of the low-dose animals, and 33/35
(94%) of the controls were still alive at week 78 on study.
Sufficient numbers of dosed and control rats of each sex were at
risk for the development of late-appearing tumors.
20

C. Pathology (Rats)
Histopathologic findings on neoplasms in rats are summarized in
Appendix A, tables Al and A2; findings on nonneoplastic lesions
are summarized in Appendix C, tables Cl and C2.
A variety of tumors were observed in both the control and dosed
rats, each of which has been previously seen in untreated aging
Osborne-Mendel rats.
Both low- and high-dose rats had toxic hepatic lesions
characterized by centribolular fatty metamorphosis (33-48%)
and/or necrosis (6-20%). Other nonneoplastic lesions were of the
types usually seen in aged Osborne-Mendel rats.
Based on the histopathologic examination, DCDD was not
carcinogenic in Osborne-Mendel rats of each sex under the
conditions of this bioassay.
D. Statistical Analyses of Results (Rats)
Tables El and E2 in Appendix E contain the statistical analyses
of the incidences of those primary tumors that occurred in at
21
least two animals of one group and at an incidence of at least 5%
in one or more than one group. In male rats, the control group
was started on study 4 weeks before the dosed groups, and in
females, the control group was started 17 weeks before the dosed
groups; however, the Cochran-Armitage test for dose-related trend
in the incidence of tumors is applied as if the three groups of
each sex were started at the same time.
The results of the Cochran-Armitage test and those of the Fisher
exact test are not significant in the positive direction in
either sex. Several significant results in the negative
direction are observed in each sex; in females, this may be due
to the earlier termination of the dosed groups compared with the
control group.
In all of the intervals shown in the tables, the value of one or
less than one is included; this indicates the absence of
significant positive results. It should also be noted that most
of the intervals have upper limits greater than one, indicating
the theoretical possibility of the induction of tumors by DCDD,
which could not be detected under the conditions of this test.
22

IV. RESULTS - MICE
A. Body Weights and Clinical Signs (Mice)
Among both male and female mice the mean body weights of both
dosed groups were lower than those of the corresponding controls
at the time the animals were placed on study. During the study,
mean body weights of dosed female mice were lower than those of
corresponding controls and were essentially the same in the low-
and high-dose groups (figure 3). Mean body weights of the male
mice were unaffected by administration of the test chemical.
Some fluctuation in the growth curves may be due to mortality; as
the size of a group diminishes, the mean body weight may be
subject to variation. No clinical signs other than those of
lowered body weights in the dosed females were reported.
B. Survival (Mice)
The Kaplan and Meier curves estimating the probabilities of
survival for male and female mice administered DCDD in the diet
at the doses of this bioassay, together with those of the
23

8O D AA
o: an a o
I 30 • D
n Q D
QO m
2°i,
AO
A
D
O
A
MALE MICE
CONTROL
LOW DOSE
HIGH DOSE
40 50 60 70
TIME ON STUDY (WEEKS)
100 110
Q D D D
o a £
A
AO
D D D D a D
ao D Am O
o 10
FEMALE MICE
O CONTROL
O LOW DOSE
A HIGH DOSE
TIME ON STUDY (WEEKS)
Figure 3. Growth Curves for Mice Administered DCOD in the Diet
100 no
24
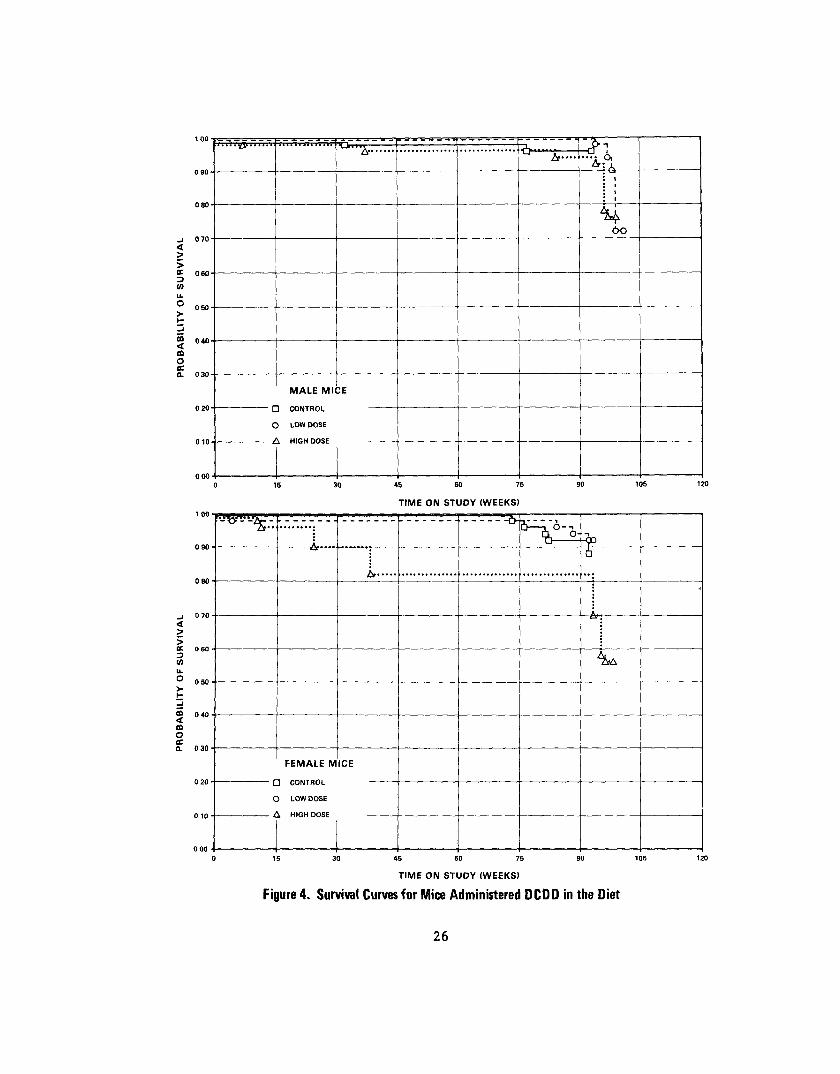
controls, are shown in figure 4. In each sex, the control group
was started on study 16 weeks before the dosed groups; however,
the Tarone test for dose-related trend in mortality is applied as
if the three groups of each sex were started at the same time.
There are substantial differences in the time on study for both
male and female groups. Control males were terminated at 92 to
93 weeks, while dosed males were terminated at 99 to 101 weeks.
Control and low-dose females were terminated at 91 to 93 weeks,
whereas the high-dose females were terminated at week 98. The
Cox and Tarone tests are applied only to the first 91 weeks on
study. The results of the Tarone test are not significant in
male mice but indicate a probability trend of P less than 0.001
in female mice.
In male mice, 38/50 (76%) of the high-dose animals, 36/50 (72%)
of the low-dose animals, and 48/50 (96%) of the controls lived to
the end of the study. In females, 28/50 (56%) of the high-dose
animals, 46/50 (92%) of the low-dose animals, and 45/50 (90%) of
the controls lived to the end of the study. Sufficient numbers
of dosed and control mice of each sex were at risk for the
development of late-appearing tumors.
25
PR
OB
AB
ILIT
Y O
F S
UR
VIV
AL
P
RO
BA
BIL
ITY
OF
SU
RV
IVA
L
SS
SS
SS
SS
SS
S
8
S8
8S
SS
SS
S8
o
•
1o
•
ji
rf
i]
(5*
tn
'
[>
0 C
] —
tn
' [ >
0
C
—
to
i si
- o
m
5 5
S
S
*»
i 1 |
S s
5 >
o
5
a
Em
</»
1 0
m
g
0
m
2
....
s
.<
0
-
S-
o—
S
0 m
m?!
0
c
»•
*!
1i
a'
1
._:m
m
m
S
o
O
M
5'
Z
Z
ON
»
0)
(O
^^
O
)
i" 5
o
11
m
CD
m
m
CA
(ji '
i. s
Ji
o
,JT
'
0
•r0
C
K
fr-;
1T
?J =9
O
J
:
1 o
•8J
iiLj
CD
0
N»
..
_ ,o
" ^~
S
* g
4
01

C. Pathology (Mice)
Histopathologic findings on neoplasms in mice are summarized in
Appendix B, tables Bl and B2; findings on nonneoplastic lesions
are summarized in Appendix D, tables Dl and D2.
A variety of tumors were observed in both the control and dosed
mice, each of which has been previously seen in untreated aging
B6C3F1 mice.
The incidence of hepatocellular carcinomas in male mice was 4/49
(8%) in the controls, 5/50 (10%) in the low-dose group, and 5/42
(12%) in the high-dose group; the incidence of hepatocellular
adenomas was 4/49 (8%) in the controls, 15/50 (30%) in the
low-dose group, and 12/42 (29%) in the high-dose group. In
contrast, the female mice administered DCDD in the diet did not
respond with an increased incidence of either hepatocellular
neoplasm. Both male and female mice, however, showed increased
incidences of focal necrosis of the liver in the dosed groups.
Based on the pathology examination, exposure to DCDD may have
been associated with an increased incidence of liver tumors in
male B6C3F1 mice under the conditions of this bioassay.
27

D. Statistical Analyses of Results (Mice)
Tables Fl and F2 in Appendix F contain the statistical analyses
of the incidences of those primary tumors that occurred in at
least two animals of one group and at an incidence of at least 5%
in one or more than one group.
In each sex, the control group was started on study 16 weeks
after the dosed groups; however, the Cochran-Armitage test for
dose-related trend in the incidence of tumors is applied as if
the three groups of each sex were started at the same time.
In male mice, the result of the Cochran-Armitage test for the
incidence of animals with either hepatocellular adenomas or
carcinomas is significant (P = 0.008). The Fisher exact
comparisons of the incidence in the control group with those in
the low- and high-dose groups show P values of 0.008 and 0.010,
respectively. In the current historical records at this
laboratory the incidence of such liver tumors in control groups
is 32/125 (26%), with individual group incidences of 8/49 (16%),
9/25(36%), and two groups with 7/25 (28%), compared with 17/42
(40%) in the high-dose group and 20/50 (40%) in the low-dose
group of this study.
28

The result of the Fisher exact test comparing the incidence of
animals with either lymphoma or leukemia of the hematopoietic
system in the low-dose male mice with that of the control group
is significant (P = 0.006), but a significant incidence is not
indicated in the high-dose group. The result of the
Cochran-Armitage test for this incidence of tumors is not
significant.
In the incidence of male mice with either hemangiosarcomas or
hemangiomas of all sites, the Fisher exact comparison of the
incidences in the low-dose and control groups shows a P value of
0.028, which is above the 0.025 level required for significance
when the Bonferroni inequality criterion is used for multiple
comparison. The high-dose group does not have a significant
incidence. The result of the Cochran-Armitage test for this
incidence of tumors is not significant.
In female mice, the results of the Cochran-Armitage test and
those of the Fisher exact test for tumor incidence at any site
are not significant. A significant trend in the negative
direction is observed in the incidence of squamous-cell
papillomas of the stomach in male mice.
29

In some of the intervals shown in the tables, the value of one or
less than one is included; this indicates the absence of
significant positive results. It should also be noted that each
of the intervals (except that for the incidence of squamous-cell
papilloma of the stomach in male mice) has an upper limit greater
than one, indicating the theoretical possibility of the induction
of tumors by DCDD, which could not be detected under the
conditions of this test.
30

V. DISCUSSION
The mean body weights of the dosed male rats and male and female
mice were lower than those of the corresponding controls at the
time the animals were placed on study. While the mean body
weights of the dosed male rats remained lower than those of their
corresponding controls throughout the study, the mean body
weights of the dosed female rats were lower than their
corresponding controls only after week 50. Mean body weights of
the dosed female, but not the male, mice were lowered throughout
the study. The survival in any of the dosed groups, however, was
not significantly affected by administration of the test
chemical. In the mice the tests for difference in survival were
applied only to the first 91 weeks on study since control males
were terminated at 92 to 93 weeks, while dosed males were
terminated at 99 to 101 weeks. Control and low-dose females were
terminated at 91 to 93 weeks, whereas the high-dose females were
terminated at week 98.
No tumors were induced in male or female rats or female mice at
incidences that were significantly higher in the dosed groups
than in the corresponding control groups.
31

In the male mice, hepatocellular adenomas or carcinomas occurred
at incidences that in direct comparisons were higher in the
low-dose group (P = 0.008) and the high-dose group (P = 0.010)
than in the control group (controls 8/49, low-dose 20/50,
high-dose 17/42). In recent findings at this laboratory the
incidence of such liver tumors in control groups is 32/125 (26%),
with individual group incidences of 8/49 (16%), 9/25 (36%), and
two groups with 7/25 (28%), compared with 17/42 (40%) in the
high-dose group and 20/50 (40%) in the low-dose group in this
study. The occurrence of increased incidences of hepatocellular
adenomas or carcinomas in the dosed groups of male mice cannot,
therefore, be clearly related to the administration of the test
chemical.
Leukemias or lymphomas occurred in the male mice at incidences
that were significant (P = 0.006) in a direct comparison of the
low-dose and control groups. Similarly, hemangiosarcomas or
hemangiomas at all sites occurred in male mice at incidences that
were significant (P = 0.028) in a direct comparison of the
low-dose and control groups. However, the incidences of these
hematopoietic tumors or vascular tumors did not show dose-related
trends and were not higher in high-dose groups than in
corresponding control groups. Thus, the occurrence of these
32

tumors in the dosed groups of male mice cannot be clearly related
to administration of the test chemical.
Unlike 2,3,7,8-tetrachlorodibenzo-p-dioxin, which has been
reported to be highly toxic when tested in Sherman rats (Schwetz
et al., 1973) and to be carcinogenic in Sprague-Dawley rats (Van
Miller et al., 1977), DCDD was observed in the present bioassay
to have a relatively low toxicity for Osborne-Mendel rats and
B6C3F1 mice. The necrosis observed in both rats and mice and the
fatty metamorphosis observed in the rats administered DCDD is
similar, however, to the liver damage observed in rats and mice
administered TCDD (International Agency for Research on Cancer,
1977).
It is concluded that under the conditions of this bioassay DCDD
was not carcinogenic for Osborne-Mendel rats of either sex or for
female B6C3F1 mice. The marginal increased incidences of
combinations of leukemias and lymphomas, of hemangiosarcomas and
hemangiomas, and of hepatocellular carcinomas and adenomas in
male B6C3F1 mice is considered as suggestive of a carcinogenic
effect of 2,7-dichlorodibenzo-p-dioxin in these animals.
33

34

VI. BIBLIOGRAPHY
Aniline, 0., Preparation of chlorodibenzo-p-dioxins for toxicological evaluation. In: Chlorodioxins - Origin and Fate, Advances vn Chemistry Series 120, Blair, E., ed., American Chemical Society, Washington, D.C., 1973, pp. 126-135.
Armitage, P., Statistical Methods in Medical Research, John Wiley & Sons, Inc., New York, 1971, pp. 362-365.
Berenblum. I., ed., Carcinogenicity Testing; A Report of the Panel £f_ Carcinogenicity o_f the Cancer Research Commission of the UICC, Vol. 2. International Union Against Cancer, Geneva, 1969.
Cox, D. R., Regression models and life tables. J_._ R_ Statist. Soc. B:187-220, 1972.
Cox, D. R., Analysis o£ Binary Data, Methuen and Co., Ltd., London, 1970, pp. 48-52.
Crosby, D. G., Wong, A. S., Plimmer, J. R., and Woolson, E. A., Photodecomposition of chlorinated dibenzo-p-dioxins. Science 173; 748-749, 1971.
Cross land, J. and Shea, K. P., The hazards of impurities, Environment 15 (5);35-38, 1973.
Environmental Protection Agency, EPA Compendium £f Registered Pesticides, Environmental Protection Agency, Washington, D.C., 1971, pp. I-T-28, I-D-29.1, I-D-29.7.
Gart, J. J., The comparison of proportions: a review of significance tests, confidence limits and adjustments for stratification. Rev. Int. Stat. Inst. 39:148-169, 1971.
International Agency for Research on Cancer, Chlorinated dibenzodioxins. In: IARC Monographs on the Evaluation of the Carcinogenic Risk o£ Chemicals to Man; Some Fumigants, the Herbicides 2,4-D and 2,4,5-T, Chlorinated Dibenzodioxins and Miscellaneous Industrial Chemicals, Vol. 15, IARC Working Group on the Evaluation of the Carcinogenic Risk of Chemicals to Man, Lyon, France, 1977, pp. 41-101.
Kaplan, E. L. and Meier, P., Nonparametric estimation from incomplete observations. J. Amer. Statist. Assoc. 53:457-481, 1958. ~
35

Kearney, P. C., Woolson, E. A., and Ellington, C. P., Jr., Persistence and metabolism of chlorodioxins in soils. Environ. Sci. & Tech. 6 (12):1017-1019, 1972.
King, M. E., Shefner, A. M., and Bates, R. R., Carcinogenesis bioassay of chlorinated dibenzodioxins and related chemicals. In: Environmental Health Perspectives, National Institute of Environmental Health Sciences, Research Triangle Park, N.C. 1973, pp. 163-170.
Linhart, M. S., Cooper, J. A., Martin, R. L., Page, N. P., and Peters, J. A., Carcinogenesis bioassay data system. J Comp. Biomed. Res. 7_:230-2U8, 1974.
Miller, R. G., Jr., Simultaneous Statistical Inference, McGraw-Hill Book Co., New York, 1966, pp. 6-10.
Saffiotti, U., Montesano, R., Sellakumar, A. R., Cefis, F., and Kaufman, D. G., Respiratory tract Carcinogenesis in hamsters induced by different numbers of administrations of benzo(a) pyrene and ferric oxide. Cancer Res. 32;1073-1081, 1972.
Schwetz, B. A., Norris, J. M., Sparschu, G. L., Rowe, V. K., Gehring, P. J., Emerson, J. L., and Gerbig, C. G., Toxicology of chlorinated dibenzo-p-dioxins. In: Environmental Health Perspectives, National Institute of Environmental Health Science, Research Triangle Park, N.C., 1973, pp. 87-99.
Stecher, P. G., ed., The Merck Index, Merck & Co., Inc., Rahway, N.J., 1968, p. 792.
Tarone, R. E., Tests for trend in life table analysis. Biometrika 62_ (3):679-682, 1975.
Van Miller, J. P. and Allen, J. R., Chronic toxicity of 2,3,7,8tetrachlorodibenzo-p-dioxin in rats. Fed. Proc. 36(3); 396, 1977.
36

APPENDIX A
SUMMARY OF THE INCIDENCE OF NEOPLASMS IN RATS ADMINISTERED DCDD IN THE DIET
37

38
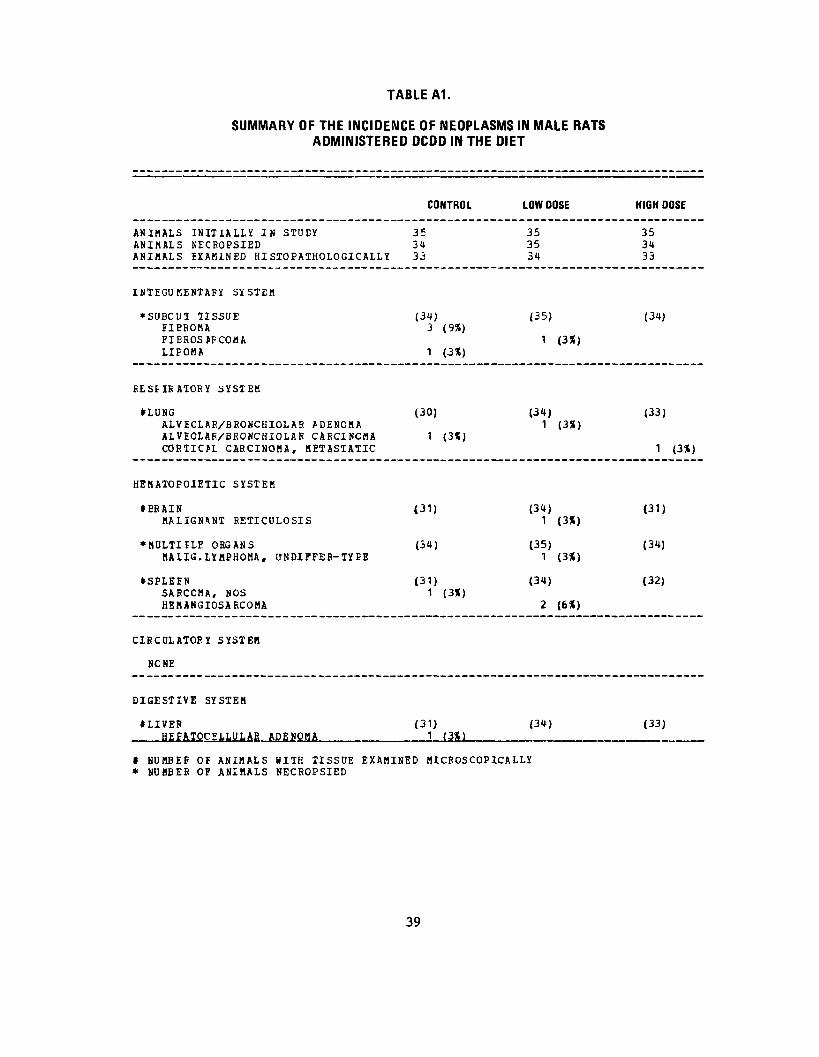
TABLE A1.
SUMMARY OF THE INCIDENCE OF NEOPLASMS IN MALE RATS ADMINISTERED DCDD IN THE DIET
CONTROL LOW DOSE HIGH DOSE
A N I M A L SA N I M A L SA N I M A L S
I N I T I A L L Y IN STUEY NECROPSIED E X A M I N E D HISIOPATHOLOGICALLY
35 34
33
35 35 34
35 34 33
I N T E G U M E N T A R Y S Y S T E M
*SUBCUT TISSUEF I B R O M AF I E R O S A F C O M AL I F O M A
(34) 3
1
(9»)
(3%)
(35)
1 (3X)
(34)
R E S P I R A T O R Y SYSTEM
* L U N GA L V E C L A R / B R O N C H I O L A R J D E N O M AALVF.OLAR/BRONCHIOLAR CARCINCMACORTIOL C A R C I N O M A , METASTATIC
(30)
1 (3%)
(34) 1 (3X)
(33)
1 (3*)
HEHATOPOIETIC SYSTEM
* B R A I NM A L I G N A N T RETICULOSIS
(31) (34) 1 (3X)
(31)
* M U L T I £ L E O R G A N SM A L I G . L Y B P H O M A ,
(34) tfNDIFFER-TYPE
(35) 1 (3X)
(34)
tSPLEENS A R C C M A , NOSHEMANGIOSARCOMA
(31) 1 (3«)
(34)
2 (6X)
(32)
C I R C U L A T O R Y SYSTEM
NCNE
DIGESTIVE SYSTEM
tLIVERHEFATOCgLLULAE A D E N O M A
(31) L_L3X1
(34) (33)
» N U M B E R* N U M B E R
OF A N I M A L S OF A N I M A L S
KITH TISSUE NECROPSIED
E X A M I N E D MICROSCOPICALLY
39
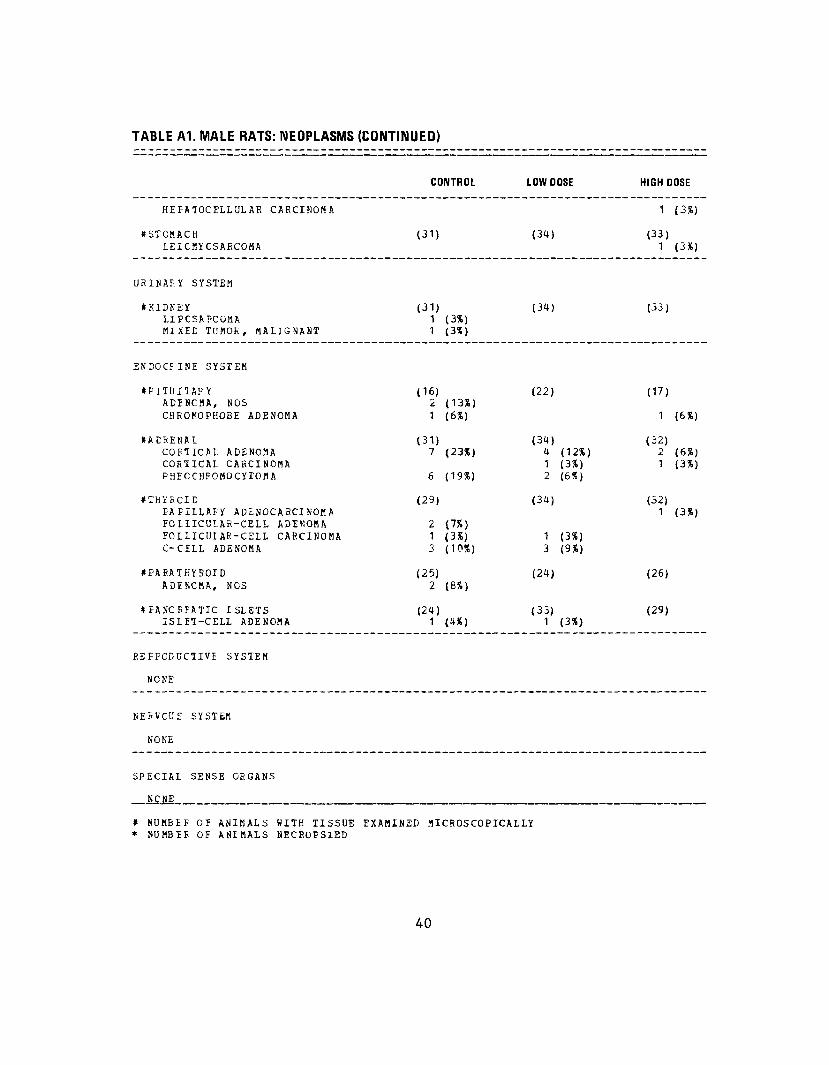
TABLE A1. MALE RATS: NEOPLASMS (CONTINUED)
H E F A T O C E L L U L A R C A R C I N O M A
* S T C M A C H L E I C K Y C S A R C O M A
U R I N A R Y SYSTEM
& K I D N E Y L IFCSAFCOMA M I X E D T U M O R , M A L I G N A N T
E N D O C F I N E S Y S T E M
frPITUITAP Y A D I N C M A , NOS C H R O M O P H O B E A D E N O M A
t A E R E N A L C O F T I C A L A D E N O M A CORTICAL C A R C I N O M A P H E C C H F O M O C Y T O M A
t T H Y R C I E F A F I L L A F Y A D E N O C A R C I N O M A FOLIICULAR-CELL A D E N O M A F O L L I C U L A R - C E L L C A R C I N O M A C - C E L L A D E N O M A
I P A R A T H Y R O I D A D E N C M A , N O S
t F A N C F E A T I C ISLETS ISLEt-CELL A D E N O M A
R E P R O D U C T I V E S Y S T E M
N O N E
N E R V C U S SYSTEM
N O N E
SPECIAL SENSE O R G A N S
_ N C N E
t N U M B E R O F A N I M A L S W I T H TISSUE* N U M B E R OF A N I M A L S NECROPSIED
CONTROL LOW DOSE
(31) (34)
(31) (34) 1 (3X> 1 (3S)
(16) (22) 2 (13%) 1 (6%)
(31) (34) 7 (23%) 4 (12%)
1 (3») 6 (19%) 2 ((>%)
(29) (34)
2 (7*) 1 (3%) 1 (3«) 3 (10S) 3 (9*)
(25) (24) 2 (8%)
(24) (33) 1 (4%) 1 (3«)
E X A M I N E D M I C R O S C O P I C A L L Y
HIGH DOSE
1 (3%)
(33) 1 ( 3 % )
(33)
(17)
1 (6«)
(32) 2 ( 6 % ) 1 (3%)
(32) 1 (3«)
(26)
(29)
40

TABLE A1. MALE RATS: NEOPLASMS (CONTINUED)
CONTROL LOW DOSE HIGH DOSE
M U S C U L O S K E L E T A L SYSTEM
N O N E
B O C Y CAVITIES
* A B D O H I N A L CAVITY (34) (35) (34) F I B F C S A F C O M A , HETASTATIC 1 (3%)
*TUNICA VAGINALIS (34) (35) (34) MESCTHELIOHA, NOS 2 (6X)
ALL O T H E R SYSTEMS
ADIPOSE TISSUE L I E C M A
ANIMAI EISPCSITION SUMMARY
ANIMAIS INITIALLY IN STUDY 35 35 35 NA1UFAI DEATHS 20 20 26 MOFIBUND SACRIFICE 3 1
**SCHEDUIED SACRIFICE 1 ACCIDENTALLY KILLEC TEFMINAL SACRIFICE 11 ANIHAl MISSING
* NUMBER OF ANIMALS HITH TISSUE EXAMINED MICROSCOPICALLY * NUMBER OF ANIMALS NECROPSIED ** Animals are in fact early terminal sacrifices, but appear as scheduled sacrifices due to system interpretation.
41

TABLE A1. MALE RATS: NEOPLASMS (CONTINUED)
CONTROL LOW DOSE HIGH DOSE
TUMOR SUMMARY
ICIAL ANIMALS WZTH PRIMARY TUMORS* 21 14 6 TOTAL PRIMARY TOMOES 37 18 7
TOTA1 ANIHALS WITH BENIGN TUMORS 17 10 3 TOTAL BFNIGN TUMORS 30 11 3
TOTAL ANIBALS WITH MALIGNAN3 TUBORS 5 7 4 TOTAL MALIGNANT TUMORS 5 7 4
TOTAL ANIMALS WITH SECONDARY TUHORS* 1 1 TOTAL SECONDARY TUMORS 1 1
TOTAL ANIMALS KITH TUMORS UNCERTAINBENIGN OE MALIGNANT 2
TOTAL UNCERTAIN TUMORS 2
TOTAL ANIMALS WITH TUMORS UNCERTAINEBIBABY OP METASTATIC
TOTAL UNCERTAIN TUMORS
* PFIMARY TUMORS: ALL TUMORS EXCEPT SECONDARY TUMORS # SECONDARY TUMORS: METASTAIIC TUMORS OR TUMORS INVASIVE INTO AN ADJACENT ORGAN
42
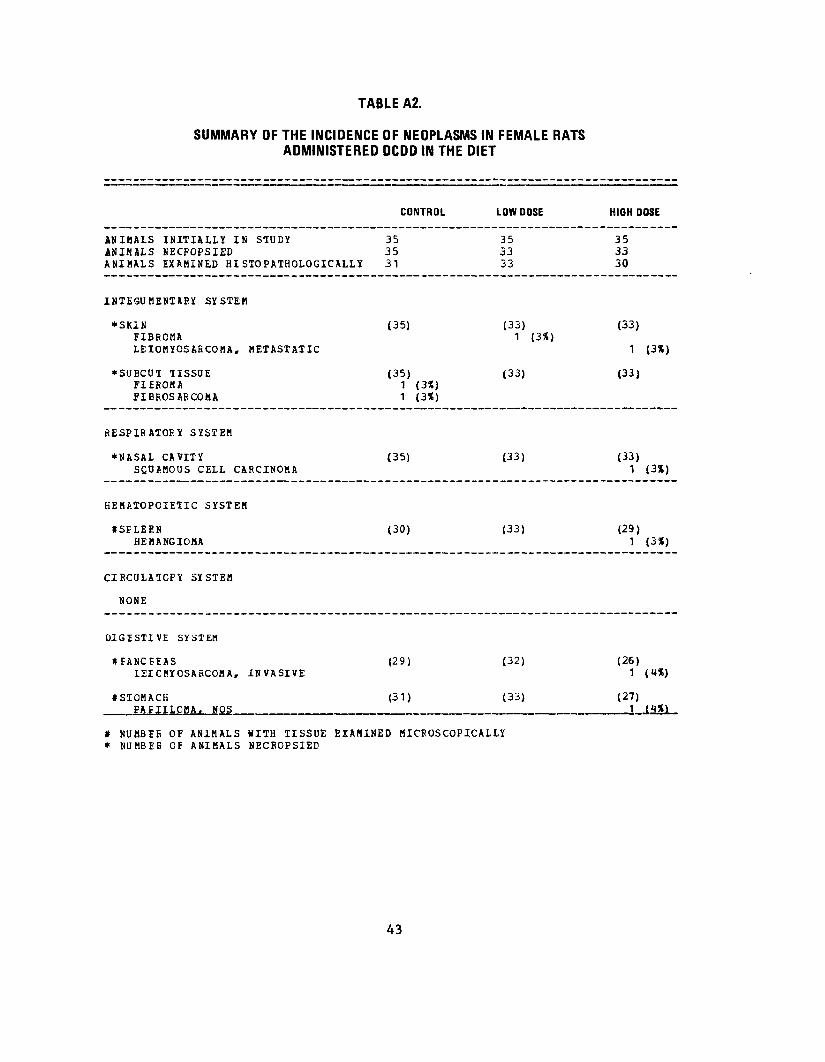
TABLE A2.
SUMMARY OF THE INCIDENCE OF NEOPLASMS IN FEMALE RATS ADMINISTERED DCDD IN THE DIET
CONTROL LOW DOSE HIGH DOSE
A N I M A L SANIMALSA N I M A L S
INITIALLY IN STUDY KECFOPSIED E X A M I N E D H I S T O P A T H O L O G I C A L L Y
35 35
31
35 33 33
35 33 30
I N T E G U M E N T A R Y SYSTEM
*SK1NFIBEOMALEIOMYOSARCOMA. METASTATIC
*SUBCUT TISSUEF1EROMAF I B R O S A R C O M A
R E S P I R A T O R Y S Y S T E M
* N A S A L CAVITYSQOtMOUS CELL CARCINOMA
HEMATOPOIETIC SYSTEM
I S P L E E NHEMANGIOMA
C I R C U L A 1 C P Y SYSTEM
NONE
D I G E S T I V E SYSTEM
# E A N C B E A S LEICMYOSARCOMA, INVASIVE
#S10MACK PAPILLOBA, NOS
(35)
(35) 1 (3%)
1 (3X)
(33) 1
(33)
(3X) (33)
1 (3X)
(33)
(35) (33) (33) 1 (3%)
(30) (33) (29) 1 (3%)
(29)
(31)
(32)
(33)
(26) 1 (H%)
* NUMBEE OF ANIMALS WITH TISSUE EXAMINED MICROSCOPICALLY * NUMBEE OF ANIMALS NECEOPSIED
43

TABLE A2. FEMALE RATS: NEOPLASMS (CONTINUED)
CONTROL LOW DOSE HIGH DOSE
L E I C K Y C S A & C O M A
U S I N A P , Y S Y S T E M
# K 1 D N E Y F I B F C S A F C O M A , METASTATIC
E N D O C R I N E SYSTEM
# F I T ( J I T A B Y C h F C M O P H O B E A D E N O M A
# A D H E N A L C O E T I C A L A D E N O M A
( f l h Y F O I D F O I I I C U L A E - C E L L C A E C I N O M A C-CEIL A D E N O M A C Y S T A D E N O M A , NOS
# T H Y P C i r FOLLICLE C Y S 1 A D E N O M A , NOS
# F A N C B E A T I C ' I S L E T S ISLIT-CELL A D E N O M A ISLIT-CFLL C A P C J N O M A
R t P E O D U C T I V E S Y S I E M
* M A M M A R Y G L A N D A D E N C M A , N O S A D E N C C A R C I N O M A , N O S F I E F C M A F I E F O A D E N O M A
t U T I E U S A D E N C C A P C I N O M A , NOS P A P I I L A F Y C Y S T A D E N C M A , N O S L E I C M Y O S A E C O M A
# O V A E Y G E A N U L O S A - C E L L T U B O F
* N U M 6 E F , OF A N I M A L S BITH TISSUE* N U M B E F OF A N I M A L S NECEOPSIED
(12*)
(21*)
(6*)
(38)
(3%)
(15%) (3X) (3*) (21*)
<6*)
1
(30)
(20) 7
(29)9
(25) 2
(25)
(26)
(33)
4
(30)
1
(26)
(«*)
(358)
(318)
(88)
(128)
(38)
(31) 1 (3%)
(18) H
(30) 11
(28)
4
(28) 2
(29) 1
(35)
(22%)
(31%)
(148)
(7*)
(3*)
3 (9%) 1 (3*) 1 (3S)
13 (37%)
(30) 1 (3%) 1 (3*)
(26)
(33)
(25) 3
(33; 7
(32) 2
1
(32)
(32)
1
(33) 5 1 1 7
(32)
(31) 2
E X A M I N E D MJCEOSCOPJCALLY
44

TABLE A2. FEMALE RATS: NEOPLASMS (CONTINUED)
T U E O L A R A D E N O M A
N E R V O U S SYSTEM
N C N E
SPECIAL SENSE O R G A N S
* H A R D E R I A N G L A N DA D E N C C A R C I N O H A , NOS
B U S C U L O S K E L E T A L S Y S T E M
N O N E
BODY C A V I T I E S
* A B D O « I N A L W A L LFIBF.OSAECOBA
ALL O T H E R SYSTEMS
N O N E
A N I M A L E1SP05ITION S ' l M K A R Y
A N I M A L S INITIALLY IN S T U D YN A T U R A L DEATHSN O R I E U N D S A C R I F I C E
**SCHEEULED SACRIFICEA C C I D E N T A L L Y KILLED T E R M I N A L SACRIFICEANIC.AL MISSING
a > _ I K C L U D E S A U I Q L Y Z E D _ A N I H A L £
CONTROL LOW DOSE HIGH DOSE
1 (4S) 1 (3»)
(35) (33) (33) 1 ( 3 X )
(35) (33) (33) 1 (3%)
35 35 35 14 10 14
1 4 1
17 25 19
* NUMBER OF ANIMALS WITH TISSUE EXAMINED MICROSCOPICALLY * NUMBER OF ANIMALS NECROPSIED
Animals are in fact early terminal sacrifices, but appear as scheduled sacrifices due to system interpretation.
45
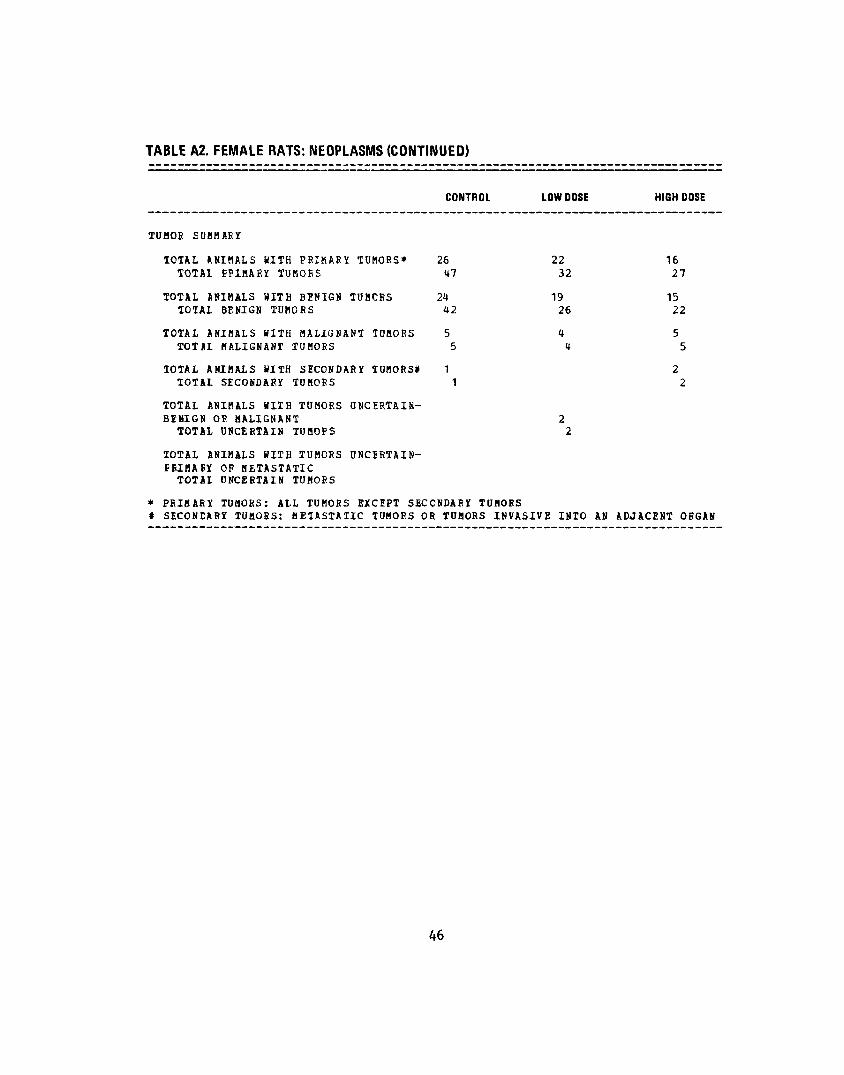
TABLE A2. FEMALE RATS: NEOPLASMS (CONTINUED)
CONTROL LOW DOSE HIGH DOSE
TUMOR SUMMARY
TOTAL ANIMALS WITH PRIMARY TUMORS* 26 22 16 TOTAL FPIMAEY TUMOES i*7 32 27
TOTAL ANIMALS HITH BENIGN TUMCES 2« 19 15 TOTAL BENIGN TUMORS U2 26 22
TOTAL ANIMALS HITH MALIGNANT TUMORS 5 U 5 TOTJL MALIGNANT TUMORS 5 U 5
TOTAL ANIMALS HITH SECONDARY TUMORS* 1 2 TOTAL SECONDARY TUM08S 1 2
TOTAL ANIHALS HITH TUMORS UNCERTAINBENIGN OR MALIGNANT 2 TOTAL UNCERTAIN TUMOFS 2
TOTAL ANIMALS HITH TUMOES UNCERTAINFKIHAEY OR METASTATIC TOTAL UNCERTAIN TUMORS
* PRIMARY TUMORS: ALL TUMORS EXCEPT SECONDARY TUMORS # SECONDARY TUMORS: HEIASTATIC TUMORS OR TUMORS INVASIVE INTO AN ADJACENT ORGAN
46

APPENDIX B
SUMMARY OF THE INCIDENCE OF NEOPLASMS IN MICE ADMINISTERED DCDD IN THE DIET
47

oo

TABLE B1.
SUMMARY OF THE INCIDENCE OF NEOPLASMS IN MALE MICE
ADMINISTERED DCDD IN THE DIET
CONTROL LOW DOSE HIGH DOSE
A N I M A L S INITIAL!! IN STCDY 50 50 50 A N I M A L S NECROPSIED 50 50 45 A N I M A L S E X A M I N E D H I S T O P A T H O L O G I C A L L Y 4 9 50 45
I N I E G U M E N T R F Y SYSTEM
*SKIN (50) (50) (45) PAPILLOMA, NOS 1 (2%) HEMANGIOSARCOMA, METASTATIC 1 (2%)
*SUBCUI TISSUE (50) (50) (45) SEEACEOUS ADENOMA 1 (2*) LEICMYOSAECOMA 1 (2%)
RESPIRATORY SYSTEM
»LUNG (49) ( 4 9 ) (44) ALVEOLAR/BRONCHIOLAR ADENOMA 8 (16S) 2 ( 4 % ) 5 (11%) ALVECLAE/BRONCHIOLAR CARCINOMA 3 (6X)
t iEKATOPOIETIC SYSTEM
*MULTIFLE ORGANS (50) (50) (45) M A L I G . L Y M P H O M A , ON EIFF ER-1YPE 1 (2%) MALIG. IYMPHOMA, HISTIOCYTIC TYPE 2 (4S) 2 (4%) U N D I F F E R E N T I A T E D L E U K E M I A 1 (2%) 1 ( 2 % ) M O N O C Y T I C L E U K E H I A 1 (2%) MAST-CEIL L E U K E M I A 1 (2X)
# S P L E E N (48) (48) (43) H E U A N G I O M A 1 ( 2 % ) h E M A N G I O S A R C O M A 4 (8X) 1 (2*)
t M E S E N T E P I C L. NODE (1) (42) (36) M A L I G . L Y M P h O M A , HISTIOCYTIC TYPE 1 ( 2 % )
C I B C U L A 1 C F Y S Y S T E M
N O N E
* N U M B E R O F A N I M A L S W I T H TISSUE E X A M I N E D M I C R O S C O P I C A L L Y * N U M B E F OJ A N I M A L S N E C R O P S I E D
49

TABLE B1. MALE MICE: NEOPLASMS (CONTINUED)
CONTROL LOW DOSE HIGH DOSE
D I G E S T I V E S Y S T E M
#L1VEF (50) (U2) HEFATOCELLULAR ADENOHA 4 (8X) 15 (30*) 12 (29%) HEPATOCELLULAR CARCINOMA 4 (8*) 5 (1C*) 5 (12X) HEMANGIOSARCOMA 1 (2%) HEMJNGIOSARCOMA, METASTATIC 1 (2*)
*EILE DUCT (49) (50) (<J2) BILi DUCT CARCINOMA 1 (2%)
#STCMACH (49) (47) (43) SQUAMCUS CELL PAPILIOMA 5 (1C*)
I C C L O N (37) (36) A D E N C C A E C I N O M A , NOS 1 (3*)
U R I N A R Y SYSTEM
N O N E
E N E C C R I N S SYSTEM
#IHYEOIC (39) (43) (43) PAFILLABY ADENOMA 1 (2*) PAPILLARY CYSTADENCMA, NOS 1 (3X)
HEPRODUCTIVE SYSTEM
NONE
NEBVCUS SYSTEM
NONE
SPECIAL SENSE ORGANS
*HARDERIAN Gi-ANl) (50) (50) (45) PAFILLAFY ADENOMA 1 (2X)
MUSCULCSKELETAL SYSTEM
_NONE
* NUMBER OF ANIMALS WITH TISSUE EXAMINED MICROSCOPICALLY * NUBBEE OF ANIMALS NECROPSIED
50

TABLE B1. MALE MICE: NEOPLASMS (CONTINUED)
CONTROL LOW DOSE HIGH DOSE
BOCY CAVITIES
NONE
ALL O T H E R SYSTEMS
N C N E
ANIMAL riSPOSITION SUMMARY
ANIMALS INITIALLY IN STUDY 50 50 50 NATURAL DEATHS 5 11 MORIEUND SACRIFICE 9 1 SCHEDULED SACRIFICE ACCIDENTALLY KILLED TERMINAL SACRIFICE 36 38 ANIMAL MISSING
d INCLUDES AUTOLYZED ANIMALS
TUMCF SUHMAFY
TOTAL ANIMALS WITH PRIMARY TUTOTAL PRIMARY TUMORS
MORS* 19 26
30 HO
25 27
TOTAL ANIMALS WITH BENIGN TUMTOTAL BENIGN TUMORS
ORS 17 20
19 19
17 18
TOTAL ANIMALS WITH MALIGNANT TOTAL MALIGNANT TUMORS
UMORS 17 21
TOTAL ANIMALS WITH SECONDARY TUMORS* 1 TOTAL SECONDARY TUMORS 2
TOTA1 ANIMALS WITH TUMORS UNCERTAINBENIGN OR MALIGNANT
TOTAL UNCERTAIN TUMORS
TOTAL ANIMALS WITH TUMORS UNCHBTAISEFIMAEY OF METASTATIC TOTA1 UNCERTAIN TUMORS
* PRIMARY TUMOHS: ALL TUMORS EXCEPT SECONDARY TUMORS f SECONDARY TUMORS: METASTA1IC TUMORS OK TUMORS INVASIVE INTO AN ADJACENT ORGAN
51

TABLE B2.
SUMMARY OF THE INCIDENCE OF NEOPLASMS IN FEMALE MICE ADMINISTERED DCDD IN THE DIET
CONTROL LOW DOSE HIGH DOSE
A N I M A L S INITIALLY IN SIUDY 50 50 50 ANIMALS NECPOPSIED 50 49 48 ANIMALS EXAMINED HISTOFATHOIOGICALLY 50 49 48
I N T E G U M E N T A R Y SYSTEM
*SKIN (50) (49) (48) SQDABOUS CELL CARCINOMA 1 (2%) FIERCSARCOMA 1 (2*) FIBROUS HISTIOCYTOMA, MALIGNANT 1 (2%) HEM8NGIOMA 1 (2%)
*SOBCUT TISSUE (50) (49) (48) FIEROSARCOMA 1 (2%)
RESPIRATORY SYSTEM
tLUNG (50) (47) (47) ALVECLAR/Bf iONCHIOLAE A D E N O M A 3 (6X) 2 (U%)
HEHATOFCIETIC SYSTEM
*MUITIF1E O R G A N S (50) (49) (48) B A L I G N A N T L Y M P H O M A , NOS 4 (8X) 1 (2%) MALIG.LYBPHOBA, LYMPHOCYTIC TYPE 1 (2*) M A L I G . L Y M P H O M A , HISTIOCYTIC T Y P E 2 (4S) 7 ( 1 4 % ) 3 (6%) LYMPHOCYTIC L E U K E M I A 2 (4*) GRANULOCYTIC LEUKEMIA 1 (2%)
*SPIEF.N (50) (48) (46) H E B A N G I O S A E C O M A 1 < 2 X )
t L Y B P H NODE (5) (37) (37) H E M A N G I O S A R C O M A , METASTA1IC 1 (20«)
C I R C U L A T O R Y SYSTEM
NOJE
# N U M B E R OF ANIMALS W I T H TISSUE E X A M I N E D M I C R O S C O P I C A L L Y * N U M B E B Of A N I M A L S NECEOPSIED
52

TABLE B2. FEMALE MICE: NEOPLASMS (CONTINUED)
CONTROL LOW DOSE HIGH DOSE
DIGESTIVE SYSTEM
t L I V E R (50) (48) (HI) H E E A T O C F L L U L A B C A R C I N O M A 1 (2%)
• S1CHACH (48) (48) (39) EAPIILCBA, NOS 2 (4X) 1 (3*) PAPIILCMATOSIS 1 (2%) SQUAHOOS CELL PAPILLOMA 1 (2*)
URINARY SYSTEM
tUF.INARY BLADDER (2) (36) (34) PAPIILCHATOSIS 2 (100%)
iNDOCRINE SYSTEM
•PARATHYROID (20) (25) (29) ADENOCAECINOMA, NOS 1 (3%)
_ _ _ _ . _ _ _ _ * — _ _ _ _ _ _ — _ -. ——-».^^.^_ _ ___ ^.^-^-~^^.~.^ __^.w.^^^.^_^ ^___ _^_ .^^^_^_.^^-_^ . _^ _-.-^^ _...-•
REPFODOC1IVE SYSTEM
* V A G I N A (50) (49) (48) H E M A N G I O S A R C O M A 1 (2X)
t D l E R O S (49) (46) (45) I E I C M Y C K A 1 (2X)
t C V A R Y (20) (43) (41) L U T E C M A 1 (2X)
N E R V O U S SYSTEM
N O N E
SPECIAL SENSE O R G A N S
NOSE
B U S C U L O S K E I F T A L S Y S T E M
N C N E
* NUMBEF OF ANIMALS WITH TISSUE EXAMINED MICROSCOPICALLY * NUMBEF OF ANIMALS NECFOPSIED
53
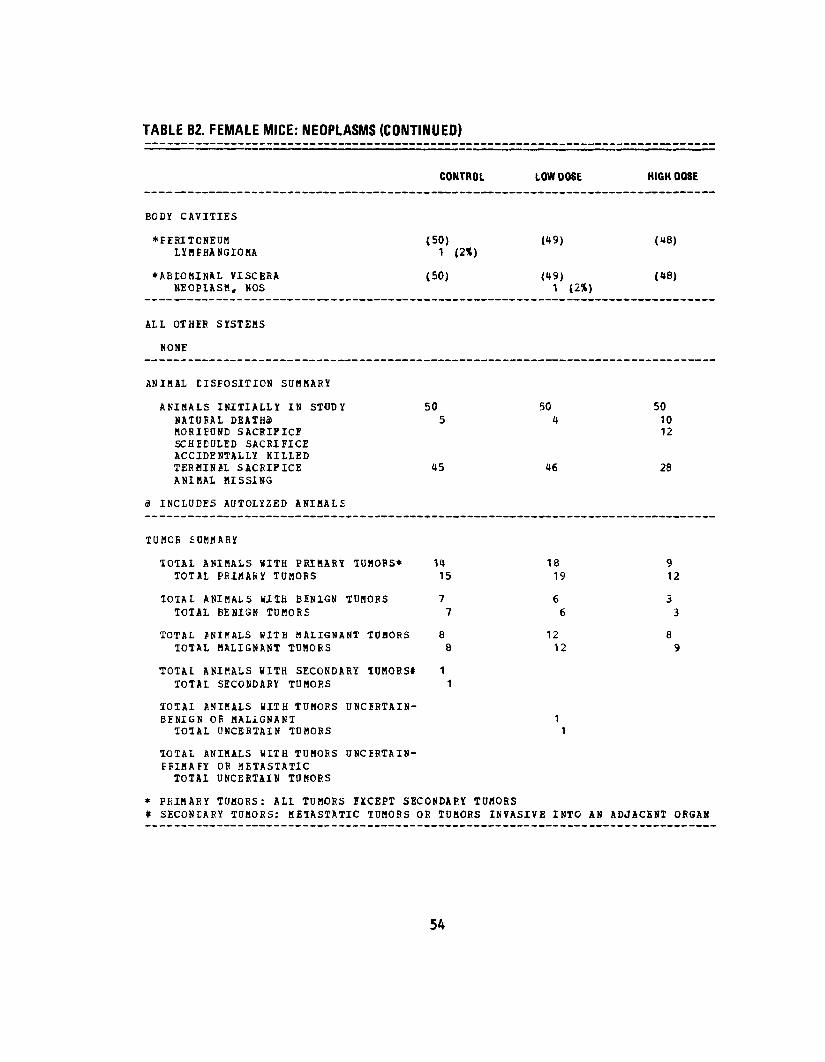
TABLE B2. FEMALE MICE: NEOPLASMS (CONTINUEO)
CONTROL LOW DOSE HIGH DOSE
BODY CAVITIES
*FERITCNEUM (50) (49) (48) L Y N F H A N G I O M A 1 12%)
* A B E O M I N A L VISCERA (50) (49) (48) NEOPIASM, NOS 1 12%)
ALL OTHER SYSTEMS
N O N E
ANIMAL DISPOSITION SUMMARY
ANIHALS INITIALLY IN STUDY 50 50 50 NATURAL DEATH3) 5 4 10 MORIEUND SACRIFICE 12 S C H E D U L E D SACRIFICE ACCIDENTALLY KILLED T E R M I N A L SACRIFICE 45 46 28 A N I M A L MISSING
I N C L U D E S A U T O L Y Z E D A N I M A L S
TUMCB SUMMARY
10TAL ANIMALS WITH PRIMARY TUMORS* 14 18 9 TOTAL PRIMARY TUMORS 15 19 12
TOTAL ANIMALS WITH BENIGN TUMORS 7 6 3 TOTAL BENIGN TUMORS 7 6 3
TOTAL ANIMALS WITH MALIGNANT TUMORS 8 12 8 TOTAL MALIGNANT TUMORS 8 12 9
TOTAL ANIMALS WITH SECONDARY TUMORSt 1 TOTAL SECONDARY TUMORS 1
TOTAL ANIMALS WITH TUMORS UNC1RTAINBENIGN OF MALIGNANT 1 TOTAL UNCERTAIN TUMORS 1
TOTAL ANIMALS WITH TUMORS UNCIRTAINEFIMAFY OR METASTATIC TOTAL UNCERTAIN TUMORS
* PRIMARY TUMORS: ALL TUMORS EXCEPT SECONDARY TUMORS # SECONDARY TUMORS: ME1ASTATIC TUMORS OR TUMORS INVASIVE INTO AN ADJACENT ORGAN
54

APPENDIX C
SUMMARY OF THE INCIDENCE OF NONNEOPLASTIC LESIONS IN RATS ADMINISTERED DCDD IN THE DIET
55

56

TABLE C1.
SUMMARY OF THE INCIDENCE OF NONNEOPLASTIC LESIONS IN MALE RATS ADMINISTERED DCDD IN THE DIET
CONTROL LOW DOSE HIGH DOSE
ANIMALS INITIALLY IN STUDY 35 35 35 ANIMALS NECEOPSIED 34 35 34 ANIMALS EXAMINED HISTOPATHOLOGICALLY 33 34 33
I N T E G U M E N T A R Y SYSTEM
*SKIN (34) (35) C34) SEEACEOOS CYST 1 (3X)
*SUBCUI TISSUE (34) (35) (34) G R A N U L O M A , N O S 1 (3X)
EESPIRATORY SYSTEM
*NASAL CAVITY (34) (35) (34) INFLAMMATION, CHRONIC 7 (20%) 1C (29X) INFLAMMATION, CHRONIC SUPP0BATIV 3 (9X)
*NASAL TUFBINATE (34) (35) (34) INFIAHMATION, ACUTE 5 (15X) INFL4HMATION, ACUTE SUPPURATIVE 6 (18X) INFLAMMATION, CHRONIC 2 (6X)
t T R A C H E A (30) (34) (33) I N F L A M M A T I O N , ACUTE- S U F F U R A T I V E 1 (3X) INFLAMMATION, CHRONIC 7 (23X) 10 (29X) 9 (27X) I N F L A H M A T I O N , CHRONIC S U P P U R A T I V 2 (7X) 1 (3X) 1 (3X)
I L U N G / B P O N C H I O L E (30) (34) (33) HYPEEPLASIA, FOCAL 1 (3X)
* L U N G (30) (34) (33) CONGESTION, NOS 1 (3X) 1 (3X) EDEMA, NOS 1 (3X) E E O N C H O P N E U H O N I A , NOS 1 (3X) 1 (3X) P N E U M O N I A , CHRONIC M U R I N E 8 (21%) 22 (65X) 21 (64X) INFLAMMATION,. CHRONIC 1 t3X)
« N U M B E R OF A N I H A L S WITH TISSUE E X A M I N E D MICROSCOPICALLY * N U M B E F OF A N I M A L S NECROPSIED
57

TABLE C1. MALE RATS: NONNEOPLASTIC LESIONS (CONTINUED)
HIGH DOSE
(31)
(32) 1 (3X) 3 (9*) 2 (6*) 3 (9*) 2 (6X) 3 (9*)
(32)
(28)
(28)
(28) 2 (7*)
(28)
(25)
(33) 1 (3*) 1 (3*)
(33) l_J3*i_
HEMATOECIETIC SYSTEM
*BONE HARROW ATRCEHY, NOS HYPEPPLAiilA, HEMATOPOIETIC
tSPLEEK INFAFCT HEHORRHAGIC HEKOSIDFROSIS ATPOPHY, NOS EEPLH1ION LYMPHOID DEPLETIOH HYPEEPIASXA, HEMATOPOIETIC HYPF.EPLASIA, ERYTHROID HEMATOPOIESIS
*SPLENIC FOLLICLES ATFCEHY, NOS
•LYMPH NODE INFLAMMATION, CHPONIC
tMANDIBULAR L. NODE HYFEEPLASIA, LYBPHOID
*CEEVICAL LYMPH NODE INFIAHKATION, CHRONIC HYPEFPLASIA, NOS
•BRONCHIAL LYMPH NOD! HEMCEEHAGE
t TH YB D £ ATRCPHY, NOS
CIBCOLA1CEY SYSTEM
tMYOCAEDIUH INF1AHMATION, CHRONIC INFLAMMATION, CHRONIC FOCAL INFIAHBATION. CHRONIC DIFFUSE
•ENDOCARDIUM DEGENERATION. MDCOID
CONTROL
(31)
a (13*)
(31)
3 (10%)
3 (10X)
(31) 1 (3*)
(22}
(22) 5 (23%)
(22)
(22) 1 (5»)
0) 3 (100*)
(30) H (13*)
(30)
LOW DOSE
(34) 1 (3*)
(34)
2 (6*)
« (12*) 1 (3*) 1 (3*)
(34)
(22) 1 (5*)
(22)
(22)
1 (5*)
(22)
(")
(34)
4 (12*) 1 (3*)
(34) 1 (3*)
* NOMBEE OF A N I M A L S WITH TISSUE EXAMINED MICROSCOPICALLY * N U M B E F OF A N I M A L S NECROPSIED
58

TABLE C1. MALE RATS: NONNEOPLASTIC LESIONS (CONTINUED)
CONTROL LOW DOSE HIGH DOSE
* AORTA (34) (35) (34) MINERALIZATION 1 (3%) 2 (6»)
*PULMCKARY ABTERY (34) (35) (34) CALCIFICATION, DYSTROPHIC 1 (3%)
DIGESTIVE SYSTEM
#LIVER (31) (34) (33) CYST. NOS 1 (3X) CONGESTION, CHRONIC PASSIVE 1 (3X) ABSCESS, NOS 1 (3X) CIRRHOSIS, CARDIAC 1 (3*) METAMORPHOSIS FATTY 2 (6X) FOCAL CELLULAR CHANGE 1 (3X) 1 (3X) HYPEEPLASIA, NOS 5 (16*) ANGIECTASIS 1 (3X)
*LIVEP/CENTRILOBULAR (31) (34) (33) CONGESTION, NOS 1 (3*) 1 (3*) NECROSIS, NOS 2 (6X) 2 (6%) METAMORPHOSIS FATTY 13 (38X) 16 (48X)
#BILE CUCl (31) (34) (33) CYST, NOS 2 (6X) HYPERPLASIA, NOS 8 (26X)
* PANCREAS (24) (33) (29) FEEIARTERITIS 1 (4S) 4 (12*) 1 (3X)
#EANCFEATIC ACINUS (24) (33) (29) ATRCEHY, NOS 1 (3X) ATROPHY, FOCAL 2 (7X)
tSTCMACH (31) (34) (33) DIVEETICULUH 1 (3X) INFLAMMATION, CHRONIC 1 (3X) ACANTHOSiS 1 (3%)
IGASTRIC SUBMUCOSA (31) (34) (33) MINERALIZATION 1 (3X)
*ANUS (34) (35) (34) INFLAMMATION. NECROTIZING 1 (3*)
* BOMBER OF ANIMALS HI1H TISSUE EXAMINED MICROSCOPICALLY * NUMBER OF ANIMALS NFCROPSIED
59
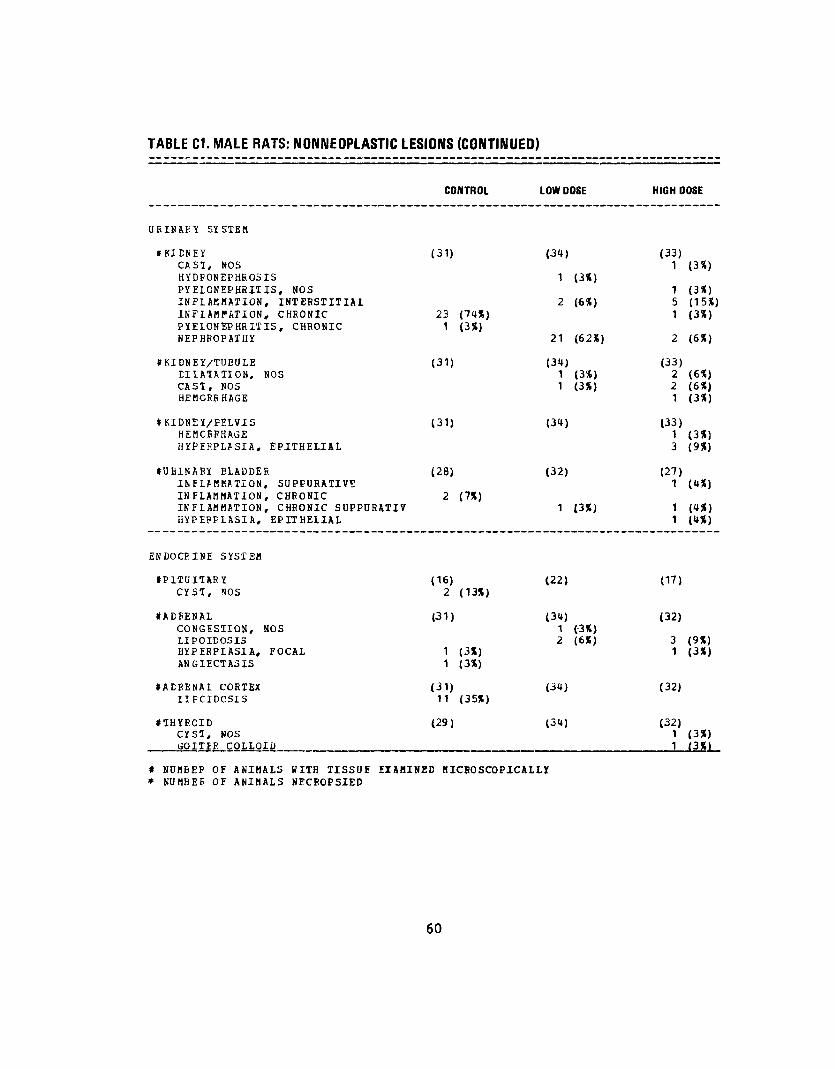
TABLE C1. MALE RATS: NONNEOPLASTIC LESIONS (CONTINUED)
CONTROL LOW DOSE
U R I N A E Y SYSTEM
• K I D N E Y (31) (34) CAST, NOS HYDFONEPHfiOSIS 1 (3X) P Y E L O N E P H R I T I S , NOS I N F L A M M A T I O N , I N T E R S T I T I A L 2 (6X) I N F L A M M A T I O N , CHRONIC 23 (74X) PYELONEPHRITIS, CHRONIC 1 (3X) N E P H R O P A T H Y 21 (62X)
# K I D N E Y / T U B O L E (31) (34) D I L A T A T I O N , NOS 1 (3*) CAST, NOS 1 (3X) H E M O R R H A G E
#KIDNEY/FELVIS (31) (34) H E M C E R H A G E H Y P Z R P L f S I A , EPITHELIAL
# U E I N A B Y BLADDER (28) (32) I N F L J M K A T I O N , SUPFUBATIVE I N F L A M M A T I O N , C H R O N I C 2 (7X) I N F L A M M A T I O N , C H R O N I C S O P P O R A T I V 1 (3X) HYPEPPLASIA, EPITHELIAL
E N D O C R I N E SYSTEM
*P1TUITAR Y (16) (22) C Y S T , NOS 2 (13X)
t A D E E N A L (31) (34) CONGESTION, NOS 1 (3X) LIPOIDOSIS 2 (6X) H Y P E R P L A S I A , FOCAL 1 (3X) ANGIECTASIS 1 (3X)
t A C R E N A L CORTEX (31) (34) LIFCIDOSIS 11 (35X)
tTHYRCID (29) (34) CYST, NOS GOITER COLLOID
# N O M B E P OF A N I M A L S WITH TISSUE EXAHINED BICHOSCOPICALLI * N U M B E E OF A N I M A L S NECROPSIED
HIGH DOSE
(33) 1 (3X)
1 (3X) 5 (15X) 1 (3%)
2 (6X)
(33) 2 (6%) 2 (6X) 1 (3X)
(33) 1 (3X) 3 (9X)
(27) 1 (4X)
1 (4X) 1 (4X)
(17)
(32)
3 (9X) 1 (3X)
(32)
(32) 1 (3X) 1 (3X)
60

TABLE C1. MALE RATS: NONNEOPLASTIC LESIONS (CONTINUED)
CONTROL LOW DOSE
HYEIFFLASIA, FOCAL
tEARAThYPOID (25) (24) HYFEKPLASIA, NOS 4 (16X) 1 (4%)
REPKODUCTIVE SYSTEM
*EENIS INFLAMMATION, CHROUIC SOPPURATIV
(34) (35) 1 (3%)
IEHOSTATE INFLAMMATION, SUPPURATIVE INFLAMMATION, ACUTE INFLAMMATION, CHRONIC INFLAMMATION, CHRONIC SOPFORATIV
(29)
2t (7X) (T**)
(31) 1
1
(3*)
(3X)
*SEMINAL VESICLE DILATATION, NOS INFLAMMATION, SUPPOPATIVE ABSCESS, NOS INFLAMMATION, CHRONIC INFLAMMATION, CHRONIC SUPPORATIV ATROPHY, NOS HYPERPLASIA, EPITHELIAL
(3>4) 1
1
(3%)
(3%)
(35)
11
1
(3%) (3X)
(3%)
#TESTIS ABSCISS, NOS PERIARTEKITIS ATPCPHY, NOS ATROPHY, FOCAL ASP J.FMJTOGENESIS
(32) 129
1
(3X) (6X) (28X)
(3%)
(33)
9 (27%)
ITESTIS/TUBULE MINERALIZATION
(32) (33) 1 (3%)
tSEERMAlOGENIC EPITHE ATPCEHY, NOS
(32) (33)
*£PIDICYMIS GRANULOMA, SPERMATIC
(3<«) (35) 1 (3%)
*MUSCULAPIS OF VAS DE MINERALIZATION
(34) (35) 1 (3X)
NERVOUS SYSTEM
. . NOKE ... „ _ „. _ .
* NUMEE5 OF ANIMALS WITH TISSUE EXAMINED MICROSCOPICALLY * NUMBIE OF ANIMALS NECROPSIEE
HIGH DOSE
1 (3X)
(26)
(34)
(27) 1 (4S)
(34)
1 (3X)
1 (3%)
(33)
10 (3C%) 1 (3%)
(33) 1 (3«)
(33) 1 (3»)
(34)
(34)
61

TABLE C1. MALE RATS: NONNEOPLASTIC
S P E C I A L SENSi O R G A N S
* Z Y M B A I ' S G L A N DHiPEFPLASIA, CYSTIC
M U S C C J L O S K E L E X A L S Y S T E M
"JOINT OF SRISII N F L A M M A T I O N , CHRONIC
BODY CAVITIES
* A E D O H I N A L C A V I T YF E B I A E T F R I T I S
*MESENTFPYPEEIAETERITIS
ALL OTHEF SYSTEMS
N C N E
SPECIAL C O P P H O L O G Y S U M B A t Y
AUTO/NECEOtSY/HISTO PE8FAUTC/NECROPSY/NO HISTOADTCLYSIS/NO NECROPSY
LESIONS (CONTINUED)
CONTROL LOW DOSE HIGH DOSE
(34) (35) (34) 1 (3*)
(34) (35) (34) 1 (3%)
(34) (35) (34) 1 (38)
(34) (35) (34) 1 (3X)
1 1 1 1 1 1
62

TABLE C2.
SUMMARY OF THE INCIDENCE OF NONNEOPLASTIC LESIONS IN FEMALE RATS
ADMINISTERED DCDD IN THE DIET
CONTROL LOW DOSE
ANIHALS INITIALLY IB STUDY 35 35 ANIMALS NECROPSIED 35 33 ANIHALS EXAMINED HI STO PATHOLOGIC ALLY 31 33
I N T E G U M E N T A F Y SYSTEM
*SKIN (35) (33) U L C E R , NOS 1 (3*) HYPERKEPATOSIS ACANTHOSIS
*SUBCUT TISSUE (35) (33) G P A N D L O M A , FOREIGN BODY 1 (3X)
RESPIRATORY SYSTEM
*NASAL CAVITYINFLAMMATION. SUPPURATIVE INFLAMMATION, HEMOREHAGIC INFLAMMATION, CHRONIC INFLAMMATION, CHRONIC DIFFUSE INFLAMMATION, CHRONIC SUPPURATIV INFLAMMATION PROLIFE8ATIVE
(35) (33) 1
12
13
(3X)
(3X) (6X)
(3») (9X)
*NASAL TUEBINATEINFLAMMATION, ACUTEINFLAMMATION, ACUTE SUPPURATIVE
(35) 1 (3*) 1 (3«)
(33)
tTRACHEAINFLAMMATION, NOSINFLAMMATION, SUPPUEAIIVE INFLJHHATION, ACUTE SUPPUEiTIVEINFLAMMATION, CHRONIC INFLAMMATION PROLIFERATIVE
(29) 5 (17«)
1 (3»)
(33)
1
93
(3%)
(27%) (9X)
• L U N GC O N G E S T I O N , NOSE P Q N C H O P N E U M Q N I A , N9S
(30) 2 (7%)
(33)
3 (9%)
t NUMBER OF ANIMALS HITH TISSUE EXAMINED MICROSCOPICALLY * NUMBER OF ANIMALS NECROPSIED
HIGH DOSE
35 33 30
(33)
3 (9X) 3 (9X)
(33)
(33)
1 (3X) 1 (3%)
(33)
(29)
1 (3X) 6 (21X)
(28)
3
63

TABLE C2. FEMALE RATS: NONNEOPLASTIC LESIONS (CONTINUED)
CONTROL LOW DOSE H I G H D
I N F L A M M A T I O N , INTERSTITIAL 1 (3«) INFLABMATION, ACUTE SUPPURATIVF. 1 (3*) ABSCESS, NOS 1 (3X) 2 P N E U M O N I A , CH RO N IC B U R I N E 6 (20X) M4 («2X) 10 P N E U M O N I A INTERSTITIAL C H R O N I C 1 G E A N U L O M A , NOS 1 (3X)
HEMATOPCIETIC SYSTEM
#EONE M A R R O W (31) (32) (26) HYFIRPIASIA, HEMATOPOIETIC <* (13X)
# S F L E E N (30) (33) (29) I N F L A M M A T I O N , ACUTE 1* (13X) I N F L A M M A T I O N , CHRONIC 1 (3X) HEMOSIDEROSIS 2 <7X) 5 (15*) 2 ATROPHY, NOS 1 (3X) DEPLETION 2 L Y M P H O I D DEPLETION 3 (9*) HEBATOPOIESIS 6 (20X) 3 (9X) 3
# M A N D I E U L A R L . NODE (25) (25) (25) H E B C F R H A G I C CYST 1 («*) INFLAMMATION, ACUTE 1 («) PLASMA-CELL INFILTRATE 3 (12*) HYPERPLASIA, LYHPHOID 5 (20X)
•CERVICAL LYMPH NODE (25) (25) (25) INFLAMMATION, CHRONIC 3 (12X) H Y P E R P L A S I A , L Y M P H O I D 1 (4X)
#MESENTFRIC L. N O D E (25) (25) (25) HYFJRPIASIA, L Y M P H O I D 1 (IX)
f T H Y M U E (9) (D CYS1, NOS 2 (22X) ATROPHY, NOS 9 (100X)
C I R C U L A T O R Y SYSTEM
t H E A R T (31) (29) (30) CALCIFICATION, DYSTSOPHIC 1 (3X)
I M Y O C A B D I U M (31) (29) (30) FIDEOSIS, FOCAL 1 (3X)
# NUMBER OF ANIMALS WITH TISSUE EXAMINED MICROSCOPICALLY * NUMBER OF ANIMALS NECFOPSIED
OSE
(7X)(36*) («*)
(7*)
(7*)
(10X)
64

TABLE C2. FEMALE RATS: NONNEOPLASTIC LESIONS (CONTINUED)
CONTROL LOW DOSE HIGH DOSE
#ENDOCAPDIUM (31) (29) (30) INFLAMMATION WITH FIBROSIS 1 (3%) DEGENERATION, MUCOID 1 (3%)
*AORTA (35) (33) (33) MEDIAL CALCIFICATION 1 (3%)
*MESENTEPIC ARTERY (35) (33) (33) THROMBOSIS, NOS 1 (3%) INFLAMMATION, CHRONIC 1 (3%)
DIGESTIVE SYSTEM
*IIV2R (31) (33) (30) CONGESTION, NOS 1 (3%) CIRRHOSIS, NOS 1 (3%) NECROSIS, NOS 1 (3%) 1 (3%) NECROSIS, FOCAL 1 (3%) 1 (3%) METAMOPFHOSIS FATTY 6 (18%) 10 (33%) L1PCIDOSIS 2 16%) HYPERPLASIA, NODULAR 1 (3%) HYPIRPLASIA, NOS 7 (23%) HEMATOPOIESIS 1 (3%) 2 (6%) 1 (3%)
*LIVER/CENTRILOBULAR (31) (33) (30) NECFCSIS, NOS 2 (6%) 6 (20%) METAMORPHOSIS FATTY 1 (3%) 13 (39%) 10 (33%)
»BILE EOCT (31) (33) (30) DILATATION, NOS 1 (3%) CYSI, NOS 2 (6%) 1 (3%) INFLAMMATION, CHRONIC 1 (3%) HYPERPLJSIA, NOS 13 (42%)
tFANCRHAS (29) (32) (26) INFLAMMATION WITH FIBROSIS 1 (3%) PERIART58ITIS 2 (8%)
tPANCFEATIC DUCT (29) (32) (26) HYPERPLASIA, NOS 3 (10%)
#EANCEEATIC ACINUS (29) (32) (26) ATROPHY, NOS 1 (3%) 1 (4%)
* N U M B E R OF A N I M A L S W I T H TISSUE E X A M I N E D MICROSCOPICALLY * N U M B E R OF A N I M A L S NECPOPSIED
65

TABLE C2. FEMALE RATS: NONNEOPLASTIC LESIONS (CONTINUED)
HIGH DOSE
(27)
(27)
(25) 1 <««>
(30)
7 (23 X) 1 (3X) 1 (3X)
9 (30*)
1 (3X)
(30)
(30) 7 (23X)
(23)
(20)
(29)
#STCflACH CALCIFICATION,
IGASTEIC MUCOSA CALCIFICATION,
tCECOH ULCER, NOS
U8INAKY SYSTEM
*KIDNEY MI NEFA LIZ ATI ON CAST, NOS CYST, NOS HEMOEEBAGE PYELONEPHRITIS,
DJSTROPHIC
NOS
HOSINFLAMHATION, INTERSTITIAI PYELONEPHRITIS, ACUTE INFLAMMATION, CHRONIC NEPHROPATHY
*KIDNEY/MFDULLA HINEPAIIZATION
#KIENEY/TOBOt£ CIIATATION, NOS CAST, NOS CYST, NOS
t U R I N A F Y BLADDER INFLAMMATION, NOS I N F L A M M A T I O N , HEHOfiRHAGIC INFLAMMATION, ACHTF.
E N D O C R I N E SYSTifl
#PITUITAKY CYS1, NOS COLLOID CYST HEMOFPHAGIC CYST
t A D R E N A L HEMCFRHAGIC CYST
# N U M B E F OF A N I M A L S BITE TISSUE* N U M B E E OF ANIMALS NECEOPSIED
CONTROL
(31) 1 (3*)
(31)
(19)
(31) 17 (55%)
1 <3X)
1 (3*) 5 (16X)
(31) 1 <3X)
(31)
4 (13*)
(25) 1 («X)
1 (i»X)
(18) 3 (17X)
(30)
LOW DOSE
(33)
(33) 1 (3X)
(27)
(33)
9 (27X)
5 (15X)
(33)
(33) 12 (36X) 3 (9X)
(29)
1 (3X)
(25)
1 (<*X) 1 (4X)
(33) 1 f3XJ
EXAMINED MICROSCOPICALLY
66

TABLE C2. FEMALE RATS: NONNEOPLASTIC LESIONS (CONTINUED)
CONTROL LOW DOSE HIGH DOSE
LIFCIDOSIS 2 (6X) ANGIECTASIS 8 (27X)
t A D B E N A L COBTEX (30) (33) (29) LIPCIDCSIS 9 (30%) HYPERPLASIA, NOS 1 (3X)
*THYPCIC (28) (32) (25) CYSTIC FOLLICLES 1 (4%) FOL1ICHLAR C Y S T , NOS 1 C*X) HYPERPLASI i , C-CELL 3 (11X) 1 ( O X )
E E P R O D O C T I V E S Y S T E M 0
* M A K M A P Y G L A N D (35) (33) (33) ABSCISS, NOS 1 (3X)
tOTERUS (30) (32) (30) E Y C M F T B A 1 (3X) 1 (3X) INFLAMMATION, ACUTE 2 (7X)
IUTERUS/ENDONETRIUM (30) (32) (30) CYS1, NOS 2 (7X) I N F L A M M A T I O N , ACUTE 2 (7X) HYPF.RPLASIA, NOS 1 (3X)
I O V A R Y (26) (31) (26) CYSTIC FOLLICLES 1 (US) FOL1ICULAS CYST. NOS 1 (4X) 1 (3X)
N E R V O U S SYSTEM
N O N E
SPECIAL SENSE O R G A N S
*EYE (35) (33) (33) I N F L A M M A T I O N , A C U T E 2 (6X) CATARACT 1 (3X)
*EYE/CCRNEA (35) (33) (33) I N F L A M M A T I O N , A C U T E 1 <3X)
# NUMBER OF ANIMALS WIIH TISSUE EXAMINED MICROSCOPICALLY * NUKBEB OF ANIMALS NECPOPSIED
67

TABLE C2. FEMALE RATS: NONNEOPLASTIC LESIONS (CONTINUED)
*EYE/RETINA INFLAMMATION, NOS
*EYE/LACEIMAL GLAND INFLAMMATION, ACUTE SUPFURA1IVE
*HARDF.EIAN GLAND ABSCESS, NOS
MUSCULOSKELETAL SYSTEM
*SKELETAL MUSCLE GEANULOMA, FOPEIGN BODY
BODY CAVITIES
*ABDOMINAI WALL INFLAMMATION, CHRONIC
*PEEITCNEUPl I N F L A M M A T I O N , CHRONIC
*«ESENTEFY PEEIAETEEITIS
ALL OTHIP SY3TEHS
NONE
SPECIAL HOFPHOLOGY S D M M A E Y
CONTROL LOW DOSE HIGH DOSE
(35) (33) (33) 21 (60S)
(35) (33) (33) 1 (3X)
(35) (33) (33) 1 (3*)
(35) (33) (33)
(35) (33) (33) 1 <3X)
(35) (33) (33) 1 (3*)
(35) (33) (33) 1 (3»)
68

APPENDIX D
SUMMARY OF THE INCIDENCE OF NONNEOPLASTIC LESIONS IN MICE ADMINISTERED DCDD IN THE DIET
69

70

TABLE 01.
SUMMARY OF THE INCIDENCE OF NONNEOPLASTIC LESIONS IN MALE MICE ADMINISTERED
A N I B A L S INITIALLY IN S T O E Y4NIBALS NECROPSISDA N I M A L S E X A H I N E D HISTOPATHOLOGICALLY
I N T E G U M E N T A R Y SYSTEM
NONE
R E S P I R A T O R Y S Y S T E M
t L U N GC O N G E S T I O N , NOSI N F L A M M A T I O N , NOSINF OHM AT ION, INTERSTITIAL HYPIRPLASIA, A L V E O L A R E P I T H E L I U M
HEBATOPOIETIC S Y S T E M
*ELOOD CFLLSLEOKCCYTOSIS, NOS
•BONE M A F R C WH Y P E R P L A S I A , G K A N O L O C Y T I C
t S f L E E NDEPLETION H Y P E P P L A S I A , L Y M P H O I D HEMJTOP01ESIS
f M E S E N T E R I C L. N O D EH Y P J R P L J S I A , NOSH Y P E E P L A S I A , L Y M P H O I D
C I R C U L A T O R Y SYSTEM
*AORTAI N P L A B M A I I O N , CHRONIC
DCDD IN THE DIET
CONTROL
50 50
49
(49)
1 (2%)
1 (2X)
(50)
(48)
(48)
(1)
(50)
LOW DOSE H I 6 H D
50 50 50 45 50 45
(49) (44) 1 (2*) 1
2 1 (2%)
(50) (45) 1
(43) (39) 1
(48) (43) 2 2 1
(42) (36) 2 (5X) 2 (5X) 5
(50) (45) 1
OSE
(2%)
(5X)
(2X)
(3«)
(5*) < 5 X ) (2X)
(14%)
12X1
f NUMBER OF ANIMALS HITH TISSOE EXAMINED MICROSCOPICALLY * NUMBER OF ANIMALS NECECFSIED
71

TABLE 01. MALE MICE: NONNEOPLASTIC LESIONS (CONTINUED)
CONTROL LOW DOSE HIGH DOSE
* C O R O N A F Y ? R T E K YI N F L A M M A T I O N , CHRONIC
(50) (50) (45) 1 (2%)
D I G E S T I V E SYSTEM
# L 1 V E KNECFCSIS, FOCALH Y P E P P L A S I A , N O D U L A RHEMATOP01BSIS
(US) (50) 1 (2*)
(42) 2
2 1
(5*) (5«)
(2%)
# E A N C B E A SABSCESS, NOS
(42) (48) (40) 1 (3»)
* E E Y E E £ PATCHH Y E E F P U S I A , L Y M P H O I D
(5) (45) 1 (2X)
(39) 2 (5X)
U R I N A R Y SYSTEM
tKIDNEYINF1AHKATION, INTE8STITIALPYELONEPHRITIS SUPPURATIVE
(49) (48)
1 (2J)
(42) 1 (2%)
4UR1NAFY BLADDERINFLAMMATION, CHRONIC
(47) 1 (2X)
(37) 1 (3X)
ENDOCRINE SYSTEM
NONE
REFECDDCTIVE SYSTEM
*EEEPD1IAL GLANDDILATATION, NOSCYST, NOSINFLAMMATION, CHRONIC SUPPURATIV
(50) 1 (2S)
1 (2%)
(50)
1 (2*)
(45)
1 (2%) 1 (2X)
tIESTISGRANULOMA, SPERMATICATROPHY, FOCAL
(49) 1 (2X)
(49)
1 (2%)
(44)
NERVOUS SYSTEM
NCNE ,
* NUMBEF OF ANIMALS WI1H TISSUE EXAMINED MICROSCOPICALLY * NUMBEF OF ANIMALS NECROPSIED
72

TABLE 01. MALE MICE: NONNEOPLASTIC LESIONS (CONTINUED)
CONTROL LOW DOSE HIGH DOSE
SPECIAL SENSE O R G A N S
* H A R D E B I A N G L A N DH Y P E R P I A S I A , P A P I L L A R Y
(50) (50) 1 (2«)
(45)
HUSCULOSKELETAL SYSTEM
N O N E
BODY CAVITIES
* P E R I T C N E U MI N F I A M B f l T I O N ,I N F L A H M A T I O N ,
CHRONIC C H R O N I C
FOCAL DIFFUSE
(50J (50)
1 (2%)
(45) 1 (2%)
ALL OTHER
N O N E
SYSTEMS
SPECIAL M O R P H O L O G Y S U B H A R Y
NO LESION R E P O R T E DAUTC/NECROPSY/HISTO PERF
26 15 8 1
73
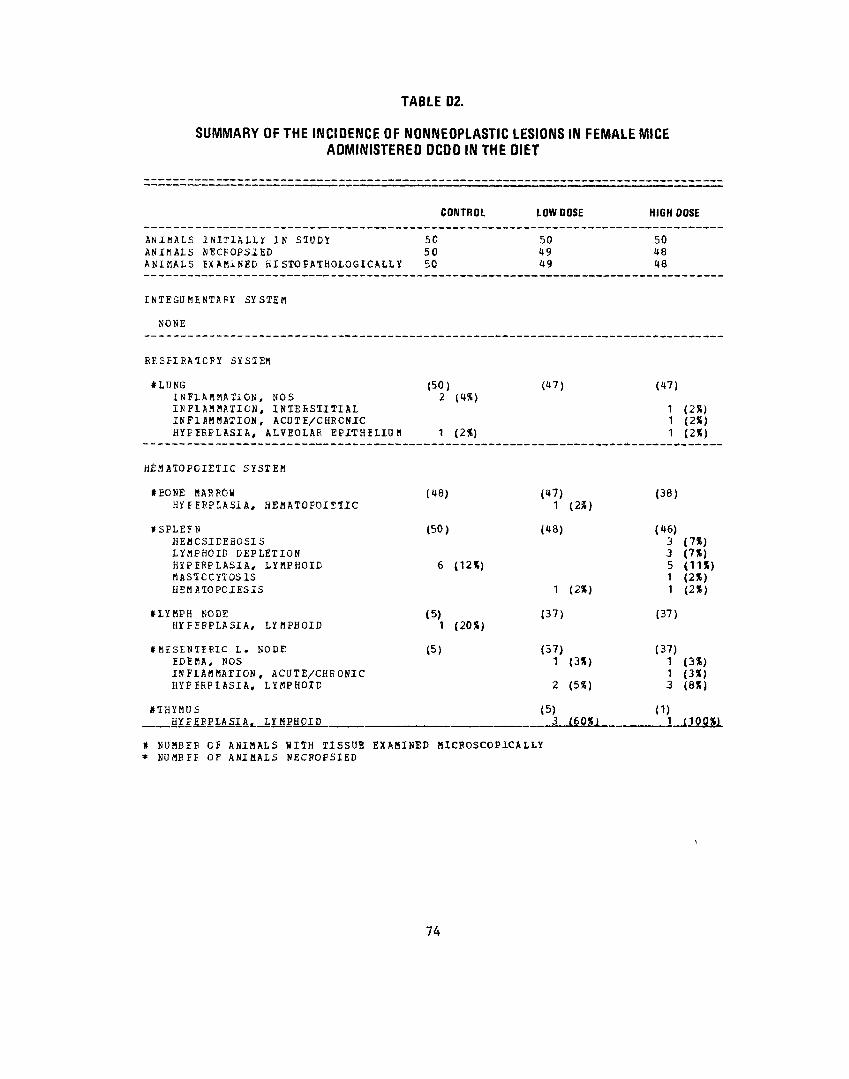
TABLE 02.
SUMMARY OF THE INCIDENCE OF NONNEOPLASTIC LESIONS IN FEMALE MICE ADMINISTERED DCDD IN THE DIET
CONTROL LOW DOSE HIGH DOSE
A N I H A L S INITIALLY IN STODY 50 50 50 A N I M A L S NECFOPSIED 50 49 48 A N I M A L S E X A M I N E D HISTOPATHOLOGICALLY 50 49 48
I N T E G U M E N T A P Y SYSTEM
NONE
R E S F I R A T C P Y SYSTEM
#LUNG (50) (47) (47) I N F L A M M A T I O N , NOS 2 (4X) I N F L A M M A T I O N , INTERSTITIAL 1 (2%) I N F L A M M A T I O N , A C U T E / C H R C N I C 1 (2S) HYPEBPLASIA, ALVEOLAE EPITHELIUM 1 (2%) 1 (2%)
HEMATOPCIETIC SYSTEM
#£ONE M A K R O H (48) (47) (38) H Y F E E P L A S 1 A , H E M A T O P O I E T I C
» S P L E F N (50) (48) (46) HEWCSIDEBOSIS 3 (7*) LYMPHOID DEPLETION HYPERPLASIA, LYMPHOID 6 (12*) 5 (11X) MASTCCYTOSIS 1 (2«) HEMATOPOJESIS 1 (2%) 1 (2%)
#1YMPH NODE (5) (37) (37) HYFEEPLASIA, L Y M P H O I D 1 (20X)
# M E S E N i r K I C L. NODE (5) (37) (37) EDF.KA, NOS 1 (3S) 1 (3X) I N F L A M M A T I O N , A C U T E / C H R O N I C 1 (3%) H Y P E R P I A S I A , LYHPHOID 2 (5*) 3 (8X)
flTHYMUS (5) d) HYF JF P LA SI A.__ L Y M P H O I D 3 f60XJ
# NUMBEE OF ANIMALS WITH TISSUE EXAMINED MICROSCOPICALLY * NUMBEE OF AN1HALS NECPOPSIED
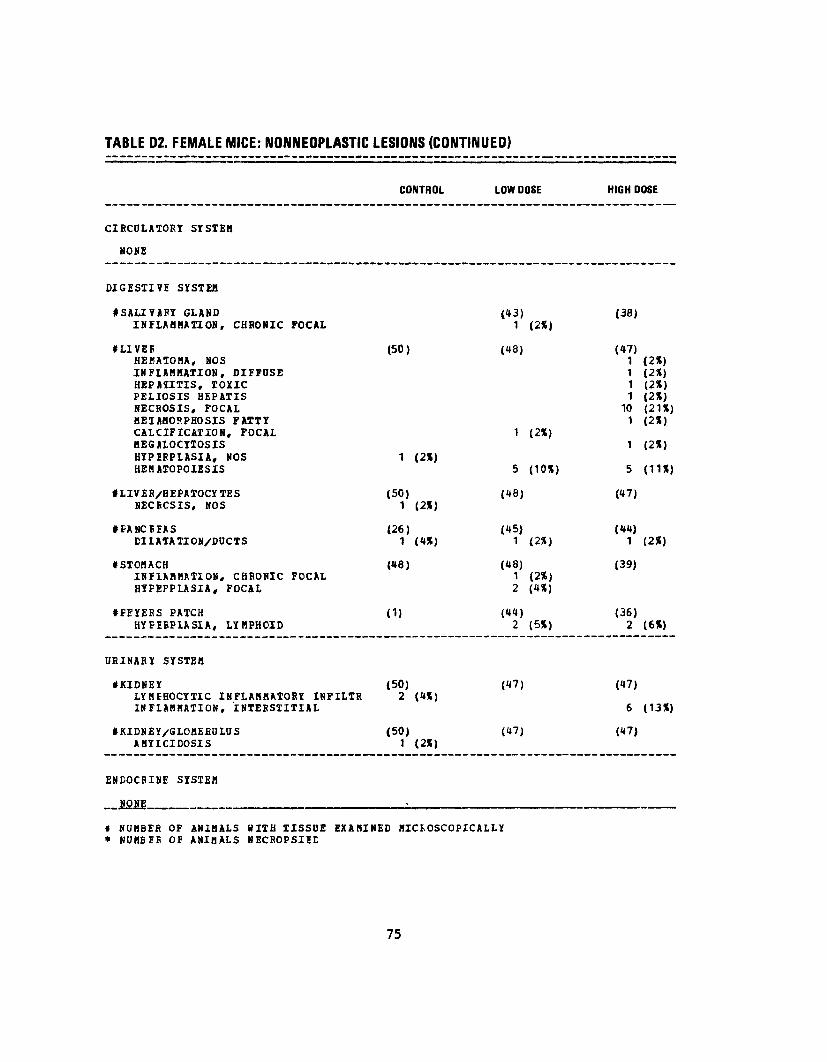
TABLE 02. FEMALE MICE: NONNEOPLASTIC LESIONS (CONTINUED)
CONTROL LOW DOSE HIGH DOSE
CIRC0LATORY SYSTEM
NONE
DIGESTIVE SYSTEM
#SALIVm G L A N D (43) I N F L A M M A T I O N , CHRONIC FOCAL 1 (2X)
*LIVEE (50) (48) HEHATOMA, NOS I N F L A M M A T I O N , DIFFUSE HEPATITIS, TOXIC PELIOSIS HEPATIS NECROSIS, FOCAL METAMORPHOSIS FATTY CALCIFICATION, FOCAL 1 (2X) HEGALOCYTOSIS HYPEFPLASIA, NOS 1 (2%) HEMATOPOIESIS 5 (10X)
•LIVER/HEPATOCYTES (50) (48) NECBCSIS, NOS 1 (2X)
*FANCBEAS (26) (45) DILATATION/DUCTS 1 (4X) 1 (2X)
f STOMACHINFIAHBATION, CHRONICHIPEFPLASIA, FOCAL
FOCAL (48) (48)
1 (2%) 2 (4X)
t E E Y E R S PATCH (1) (44) HYFEBPIASIA, LYMPHOID 2 (5X)
U R I N A R Y SYSTEM
i K I D N E Y (50) (47) LYMEHOCYTIC INFLAMMATORY INFILTR 2 (4X) I N F L A M M A T I O N , INTERSTITIAL
tKIDNEY/GLOMEEULOS (50) (47) AHYICIDOSIS 1 (2%)
E N D O C R I N E SYSTEM
NONE
* N U M B E R OF ANIMALS WITH TISSUE E X A M I N E D MICROSCOPICALLY * N U M B E f i OF A N I M A L S NECROPSIEE
(38)
(47) 1111
101
1
5
(47)
(44) 1
(39)
(36) 2
(47)
6
(47)
(2*) (2X) (2X) (2X) (21X) (2X)
(2X)
(11X)
(2X)
(6X)
(13X)
75

TABLE 02. FEMALE MICE: NONNEOPLASTIC LESIONS (CONTINUED)
CONTROL LOW DOSE
R E P F G D U C T I V F SYSTEM
*CLJTCFIS (50) (49)INFLAMMATION, CHRONIC SUPPUR4IIV
#U1ERUS (49) (46)HYCECHETRA 4 (8%) ATRCPHY, NQS
*UTERUS/ENDOMETRIDM (49) (46)HYPEFPLASIA, DIFFUSE 1 (2%) HYPERP1ASIA, CYSTIC 48 (9855) 20 (43X)
#07ARY (20) (43)CYST, NOS 5 (25%) FOLIIC0LAR CYST, NOS 5 (25X) 1 (2%)ABSCFSS, NOS 2 (5X)
NERVOUS SYSTEM
NCNE
SPECIAL SENSE ORGANS
NONE
MUSCULCSKELETAL SYSTEM
NONE
BODY CAVITIES
*PERITCNEOM (50) (49)JNFLAMHATION, CBRONICINFLAMMATION, CHRONIC FOCAL
ALL OTHER SYSTEMS
ADIPOSE TISSUE LIfCGEANOLOMA 1
t NOMBEf OF ANIMALS KITH TISSUE EXAMINED MICROSCOPICALLY * NUBBEE OF ANIMALS NECROPSIED
HIGH DOSE
(48) 1 (2%)
(45)
1 (2%)
(45)
10 (22%)
(41)
6 (1531) 3 (7«)
(48) 1 (2%) 1 (2%)
76

TABLE D2. FEMALE MICE: NONNEOPLASTIC LESIONS (CONTINUED)
CONTROL LOW DOSE HIGH DOSE
SPECIAL M O R P H O L O G Y S U M M A R Y
NO IF.SION R E P O R T E DAUTC/NFCROPSY/HISTO PEBFAUICLYSIS/JiO NECROPSY
1 10
1
10 1 2
t S U H B E B O F A N I M A L S W I T H TISSUE* N U B B E E OF A N I M A L S NECROPSIED
E X A M I N E D M I C R O S C O P I C A L L Y
77

78

APPENDIX E
ANALYSES OF THE INCIDENCE OF PRIMARY TUMORS IN RATS ADMINISTERED DCDD IN THE DIET
79

80

Table El. Analyses of the Incidence of Primary Tumors in Male Rats Administered DCDD in the Diet (a)
Low Topography; Morphology Control Dose
Integumentary System: Fibroma of the Subcutaneous Tissue (b) , 3/34 (9) 0/35 (0)
P Values (c,d) P = 0.036 (N) N.S.
Relative Risk (f) 0.000 Lower Limit 0.000 Upper Limit 1.594
Weeks to First Observed Tumor 96
oo Spleen: Hemangios arcoma (b) 0/31 (0) 2/34 (6)
P Values (c ,d) N.S. N.S.
Relative Risk (f) Infinite Lower Limit 0.274 Upper Limit Infinite
Weeks to First Observed Tumor 112
High Dose
0/34 (0)
N.S.
0.000 0.000 1.639
0/32 (0)
—
— — —

Table El. Analyses of the Incidence of Primary Tumors in Male Rats Administered DCDD in the Diet (a)
(continued)
Low Topography; Morphology Control Dose
Adrenal: Cortical Adenoma or Carcinoma (b) 7/31 (23) 5/34 (15)
P Values (c,d) N.S. N.S.
Relative Risk (f) 0.651 Lower Limit 0.182 Upper Limit 2.133
Weeks to First Observed Tumor 91 104
oo Adrenal: Pheo ch romo cy toma (b) 6/31 (19) 2/34 (6)
P Values (c,d) P = 0.006 (N) N.S.
Relative Risk (f) 0.304 Lower Limit 0.032 Upper Limit 1.554
Weeks to First Observed Tumor 86 104
High Dose
3/32 (9)
N.S.
0.415 0.076 1.638
109
0/32 (0)
P = 0.011 (N)
0.000 0.000 0.593

Table El. Analyses of the Incidence of Primary Tumors in Male Rats Administered DCDD in the Diet (a)
(continued)
Topography: Morphology
Thyroid: Follicular-cell Adenoma or Carcinoma (b)
P Values (c,d)
Relative Risk (f) Lower Limit Upper Limit
Weeks to First Observed Tumor
oo
Thryoid: Papillary Adenocarcinoma, Follicular-cell Adenoma, or Follicular-cell Carcinoma (b)
P Values (c,d)
Relative Risk (f) Lower Limit Upper Limit
Weeks to First Observed Tumor
Control
3/29 (10)
P = 0.048 (N)
97
3/29 (10)
N.S.
97
Low Dose
1/34 (3)
N.S.
0.284 0.006 3.321
77
1/34 (3)
N.S.
0.284 0.006 3.321
77
High Dose
0/32 (0)
N.S.
0.000 0.000 1.480
—
1/32 (3)
N.S.
0.302 0.006 3.518
101

00
Table El. Analyses of the Incidence of Primary Tumors in Male Rats Administered DCDD in the Diet (a)
(continued)
Low Topography: Morphology Control Dose
Thyroid: C-cell Adenoma (b) 3/29 (10) 3/34 (9)
P Values (c,d) N.S. N.S.
Relative Risk (f) 0.853 Lower Limit 0.124 Upper Limit 5.927
Weeks to First Observed Tumor 110 95
Parathyroid: Adenoma, NOS (b) 2/25 (8) 0/24 (0)
P Values (c,d) N.S. N.S.
Relative Risk (f) 0.000 Lower Limit 0.000 Upper Limit 3.421
Weeks to First Observed Tumor 110
High Dose
0/32 (0)
N.S.
0.000 0.000 1.480
—
0/26 (0)
N.S.
0.000 0.000 3.170
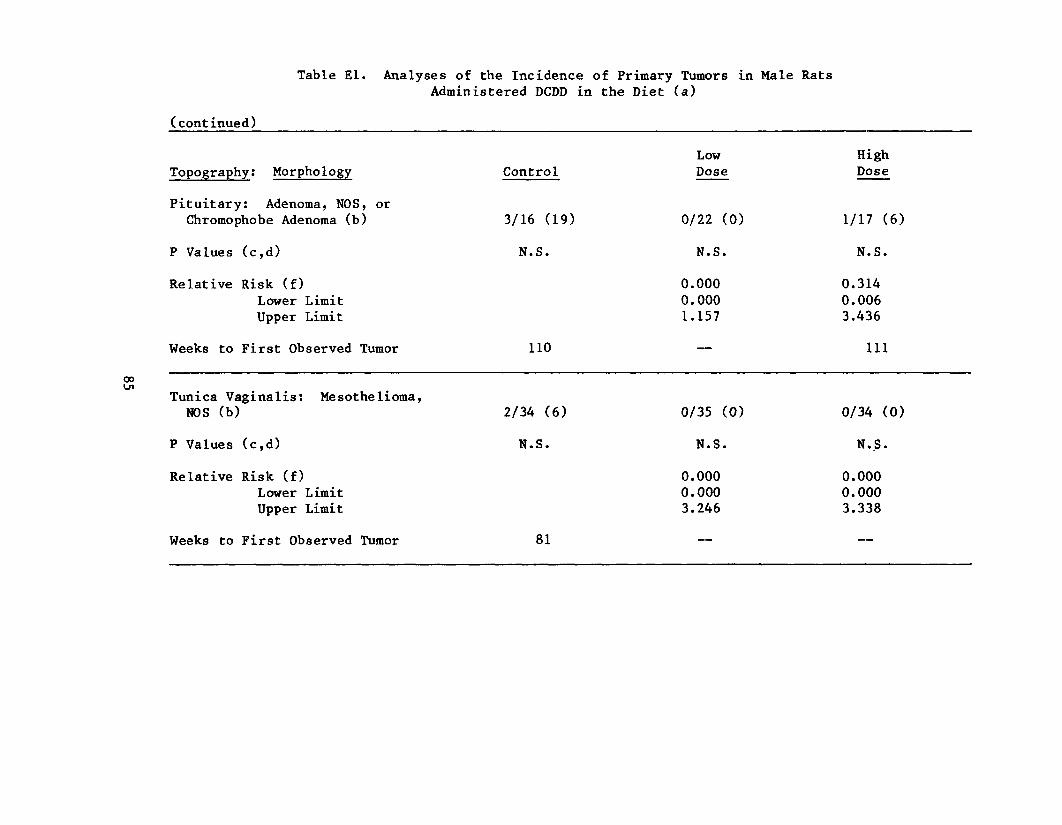
Table El. Analyses of the Incidence of Primary Tumors in Male Rats Administered DCDD in the Diet (a)
(continued)
Low Topography: Morphology Control Dose
Pituitary: Adenoma, NOS, or Chromophobe Adenoma (b) 3/16 (19) 0/22 (0)
P Values (c,d) N.S. N.S.
Relative Risk (f) 0.000 Lower Limit 0.000 Upper Limit 1.157
Weeks to First Observed Tumor 110 —
OO
Tunica Vaginalis: Mesothelioma, NOS (b) 2/34 (6) 0/35 (0)
P Values (c,d) N.S. N.S.
Relative Risk (f) 0.000 Lower Limit 0.000 Upper Limit 3.246
Weeks to First Observed Tumor 81
High Dose
1/17 (6)
N.S.
0.314 0.006 3.436
0/34 (0)
N.S.
0.000 0.000 3.338
111

Table El. Analyses of the Incidence of Primary Tumors in Male Rats Administered DCDD in the Diet (a)
(continued)
(a) Dosed groups received 5,000 or 10,000 ppm.
(b) Number of tumor-bearing animals/number of animals examined at site (percent).
(c) Beneath the incidence of tumors in the control group is the probability level for the Cochran-Armitage test when P is less than 0.05; otherwise, not significant (N.S.) is indicated. Beneath the incidence of tumors in a dosed group is the probability level for the Fisher exact test for the comparison of that dosed group with the control group when P is less than 0.05; otherwise, not significant (N.S.) is indicated.
(d) A negative trend (N) indicates a lower incidence in a dosed group than in a control group.
(e) The probability level for the departure from linear trend is given when P is less than 0.05 for any comparison,
oo
(f) The 95% confidence interval of the relative risk between each dosed group and the control group.

Table E2. Analyses of the Incidence of Primary Tumors in Female Rats Administered DCDD in the Diet (a)
Low High Topography: Morphology Control Dose Dose
Pituitary: Chromophobe Adenoma (b) 4/18 (22) 3/25 (12) 7/20 (35)
P Values (c,d) N.S. N.S. N.S.
Relative Risk (f) 0.540 1.575 Lower Limit 0.091 0.488 Upper Limit 2.825 6.098
Weeks to First Observed Tumor 116 110 103 oo
Adrenal: Cortical Adenoma (b) 11/30 (37) 7/33 (21) 9/29 (31)
P Values (c,d) N.S. N.S. N.S.
Relative Risk (f) 0.579 0.846 Lower Limit 0.222 0.368 Upper Limit 1.415 1.894
Weeks to First Observed Tumor 115 110 90

Table E2. Analyses of the Incidence of Primary Tumors in Female Rats Administered DCDD in the Diet (a)
(continued)
Low High Topography: Morphology Control Dose Dose
Thyroid: Follicular-cell Carcinoma (b) 0/28 (0) 2/32 (6) 2/25 (8)
P Values (c,d) N.S. N.S. N.S.
Relative Risk (f) Infinite Infinite Lower Limit 0.264 0.339 Upper Limit Infinite Infinite
Weeks to First Observed Tumor 110 108 CO 00
Thyroid: C-cell Adenoma (b) 4/28 (14) 0/32 (0) 0/25 (0)
P Values (c,d) P = 0.015 (N) P = 0.042 (N) N.S.
Relative Risk (f) 0.000 0.000 Lower Limit 0.000 0.000 Upper Limit 0.925 1.171
Weeks to First Observed Tumor 115

Table E2. Analyses of the Incidence of Primary Tumors in Female Rats Administered DCDD in the Diet (a)
(continued)
Low Topography: Morphology Control Dose
Thyroid or Thyroid Follicle: Cystadenoma, NOS (b) 2/28 (7) 1/32 (3)
P Values (c,d) N.S. N.S.
Relative Risk (f) 0.437 Lower Limit 0.008 Upper Limit 7.961
oo VO
Weeks to First Observed Tumor 116 110
Thyroid or Thyroid Follicle: Follicular-cell Carcinoma or Cystadenoma, NOS (b) 2/28 (7) 3/32 (9)
P Values (c,d) N.S. N.S.
Relative Risk (f) 1.312 Lower Limit 0.163 Upper Limit 14.810
Weeks to First Observed Tumor 116 110
High Dose
0/25 (0)
N.S.
0.000 0.000 3.688
—
2/25 (8)
N.S.
1.120 0.087 14.392
106
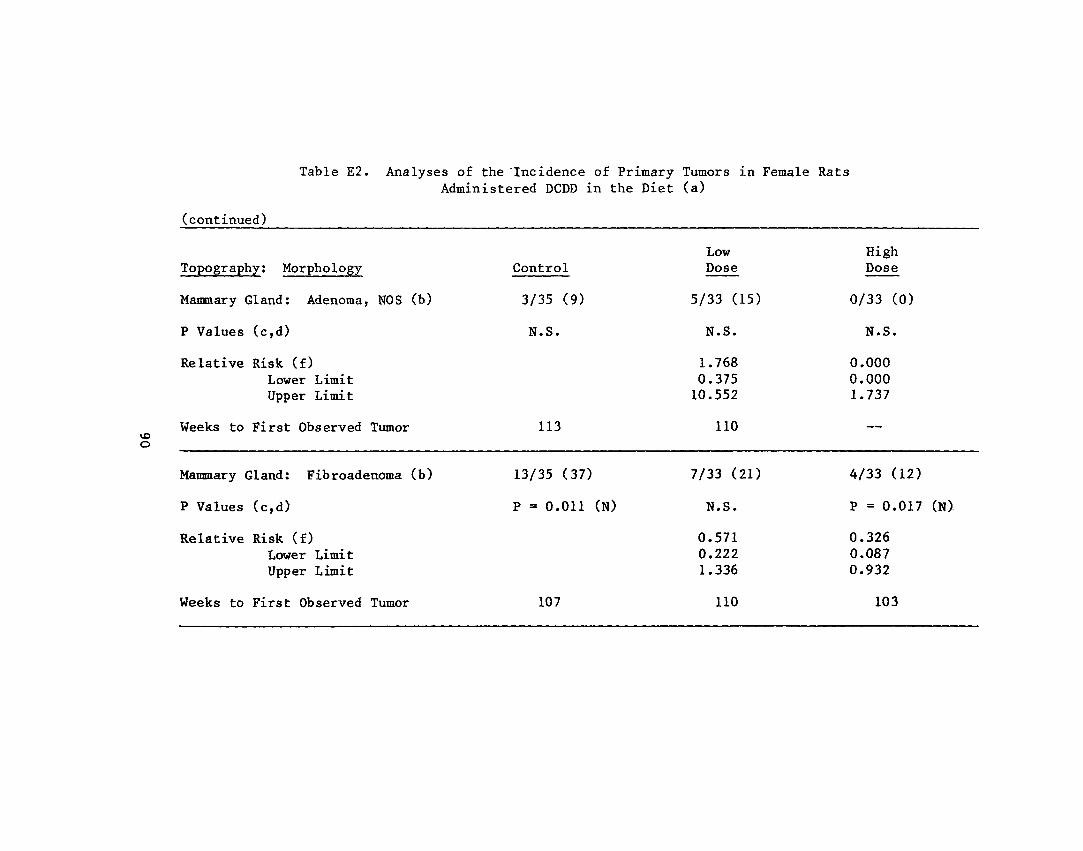
Table E2. Analyses of the 'Incidence of Primary Tumors in Female Rats
(continued)
Topography; Morphology
Mammary Gland: Adenoma, NOS (b)
P Values (c,d)
Relative Risk (f) Lower Limit Upper Limit
Weeks to First Observed Tumor \o o
Mammary Gland: Fib road enoma (b)
P Values (c,d)
Relative Risk (f) Lower Limit Upper Limit
Weeks to First Observed Tumor
Administered DCDD in the Diet (a)
Low High Control Dose Dose
3/35 (9) 5/33 (15) 0/33 (0)
N.S. N.S. N.S.
1.768 0.000 0.375 0.000 10.552 1.737
113 110 —
13/35 (37) 7/33 (21) 4/33 (12)
P = 0.011 (N) N.S. P = 0.017 (N)
0.571 0.326 0.222 0.087 1.336 0.932
107 110 103

Table E2. Analyses of the Incidence of Primary Tumors in Female Rats Administered DCDD in the Diet (a)
(continued)
Topography: Morphology
Mammary Gland: Adenoma, NOS, or Fibroadenoma (b)
P Values (c,d)
Relative Risk (f) Lower Limit Upper Limit
VO Weeks to First Observed Tumor
Mammary Gland: Adenoma, NOS, Fibroadenoma, or Adenocarcinoma, NOS (b)
P Values (c,d)
Relative Risk (f) Lower Limit Upper Limit
Low Control Dose
14/35 (40) 12/33 (36)
P = 0.009 (N) N.S.
0.909 0.455 1.783
107 110
15/35 (43) 12/33 (36)
P = 0.005 (N) N.S.
0.848 0.432 1.630
High Dose
4/33 (12)
P = 0.009 (N)
0.303 0.082 0.849
103
4/33 (12)
P = 0.005 (N)
0.283 0.077 0.779
Weeks to First Observed Tumor 93 110 103

Table E2. Analyses of the Incidence of Primary Tumors in Female Rats Administered DCDD in the Diet (a)
(continued)
Low High Topography: Morphology Control Dose Dose
Ovary: Granules a-ce 11 Tumor (b) 0/26 (0) 2/31 (6) 0/26 (0)
P Values (c,d) N.S. N.S. —
Relative Risk (f) Infinite — Lower Limit 0.254 — Upper Limit Infinite —
Weeks to First Observed Tumor 110
(a) Dosed groups received 5,000 or 10,000 ppm.
(b) Number of tumor-bearing animals/number of animals examined at site (percent).
(c) Beneath the incidence of tumors in the control group is the probability level for the Cochran-Armitage test when P is less than 0.05; otherwise, not significant (N.S.) is indicated. Beneath the incidence of tumors in a dosed group is the probability level for the Fisher exact test for the comparison of that dosed group with the control group when P is less than 0.05; otherwise, not significant (N.S.) is indicated.
(d) A negative trend (N) indicates a lower incidence in a dosed group than in a control group.
(e) The probability level for the departure from linear trend is given when P is less than 0.05 for any comparison.
(f) The 95% confidence interval of the relative risk between each dosed group and the control group.

APPENDIX F
ANALYSES OF THE INCIDENCE OF PRIMARY TUMORS IN MICE ADMINISTERED DCDD IN THE DIET
93

94

Table Fl. Analyses of the Incidence of Primary Tumors in Male Mice Administered DCDD in the Diet (a)
Low Topography! Morphology Control Dose
Lung: Alveolar/Bronchiolar Carcinoma (b) 0/49 (0) 3/49 (6)
P Values (c,d) N.S. N.S.
Departure from Linear Trend (e) P = 0.016
Relative Risk (f) Infinite Lower Limit 0.602 Upper Limit Infinite
vo Ui Weeks to First Observed Tumor 97
Lung: Alveolar/Bronchiolar Adenoma or Carcinoma (b) 8/49 (16) 5/49 (10)
P Values(c,d) N.S. N.S.
Relative Risk (f) 0.625 Lower Limit 0.172 Upper Limit 2.007
Weeks to First Observed Tumor 92 97
High Dose
0/44 (0)
5/44 (11)
N.S.
0.696 0.192 2.222
97

Table Fl. Analyses of the Incidence of Primary Tumors in Male Mice Administered DCDD in the Diet (a)
(continued) Low High
Topography: Morphology Control Dose Dose
Hematopoietic System: Leukemia (b) 0/50 (0) 3/50 (6) 1/45 (2)
P Values (c,d) N.S. N.S. N.S.
Relative Risk (f) Infinite Infinite Lower Limit 0.601 0.060 Upper Limit Infinite Infinite
Weeks to First Observed Tumor — 98 94
Hematopoietic System: Lymphoma (b) 0/50 (0) 4/50 (8) 2/45 (4)
P Values (c,d) N.S. N.S. N.S.
Relative Risk (f) Lower Limit Upper Limit
Infinite 0.927 Infinite
Infinite 0.329 Infinite
Weeks to First Observed Tumor 99 99

Table Fl. Analyses of the Incidence of Primary Tumors in Male Mice Administered DCDD in the Diet (a)
(continued) Low
Topography: Morphology Control Dose
Hematopoietic System: Leukemia or Lymphoma (b) 0/50 (0) 7/50 (14)
P Values(c,d) N.S. P = 0.006
Departure from Linear Trend (e) P = 0.016
Relative Risk (f) Infinite Lower Limit 1.941 Upper Limit Infinite
VO
Weeks to First Observed Tumor — 98
All Sites: Hemangiosarcoma (b) 0/50 (0) 4/50 (8)
P Values (c,d) N.S. N.S.
Departure from Linear Trend (e) P=0.031
Relative Risk (f) Infinite Lower Limit 0.927 Upper Limit Infinite
Weeks to First Observed Tumor 97
High Dose
3/45 (7)
N.S.
Infinite 0.669 Infinite
94
1/45 (2)
N.S.
Infinite 0.060 Infinite
99

Table Fl. Analyses of the Incidence of Primary Tumors in Male Mice Administered DCDD in the Diet (a)
(continued) Low
Topography: Morphology Control Dose
All Sites: Hemangiosarcoma or Hemangioma (b) 0/50 (0) 5/50 (10)
P Values(c,d) N.S. P = 0.028
Departure from Linear Trend (e) P = 0.011
Relative Risk (f) Infinite Lower Limit 1.261 Upper Limit Infinite
VD OO Weeks to First Observed Tumor 97
Liver: Hepatocellular Carcinoma (b) 4/49 (8) 5/50 (10)
P Values (c,d) N.S. N.S.
Relative Risk (f) 1.225 Lower Limit 0.280 Upper Limit 5.833
Weeks to First Observed Tumor 93 99
High Dose
1/45 (2)
N.S.
Infinite 0.060 Infinite
99
5/42 (12)
N.S.
1.458 0.335 6.884
99

Table Fl. Analyses of the Incidence of Primary Tumors in Male Mice Administered DCDD in the Diet (a)
(continued) Low
Topography: Morphology Control Dose
Liver: Hepatocellular Carcinoma or Adenoma (b) 8/49 (16) 20/50 (40)
P Values (c,d) P = 0.008 P = 0.008
Relative Risk (f) 2.450 Lower Limit 1.156 Upper Limit 5.757
Weeks to First Observed Tumor 92 97 VO vo
Stomach: Squamous-cell Papilloma (b) 5/49 (10) 0/47 (0)
P Values(c,d) P = 0.008 (N) P = 0.031 (N)
Relative Risk (f) 0.000 Lower Limit 0.000 Upper Limit 0.825
Weeks to First Observed Tumor 92
High Dose
17/42 (40)
P = 0.010
2.479 1.138 5.862
99
0/43 (0)
P = 0.039 (N)
0.000 0.000 0.900
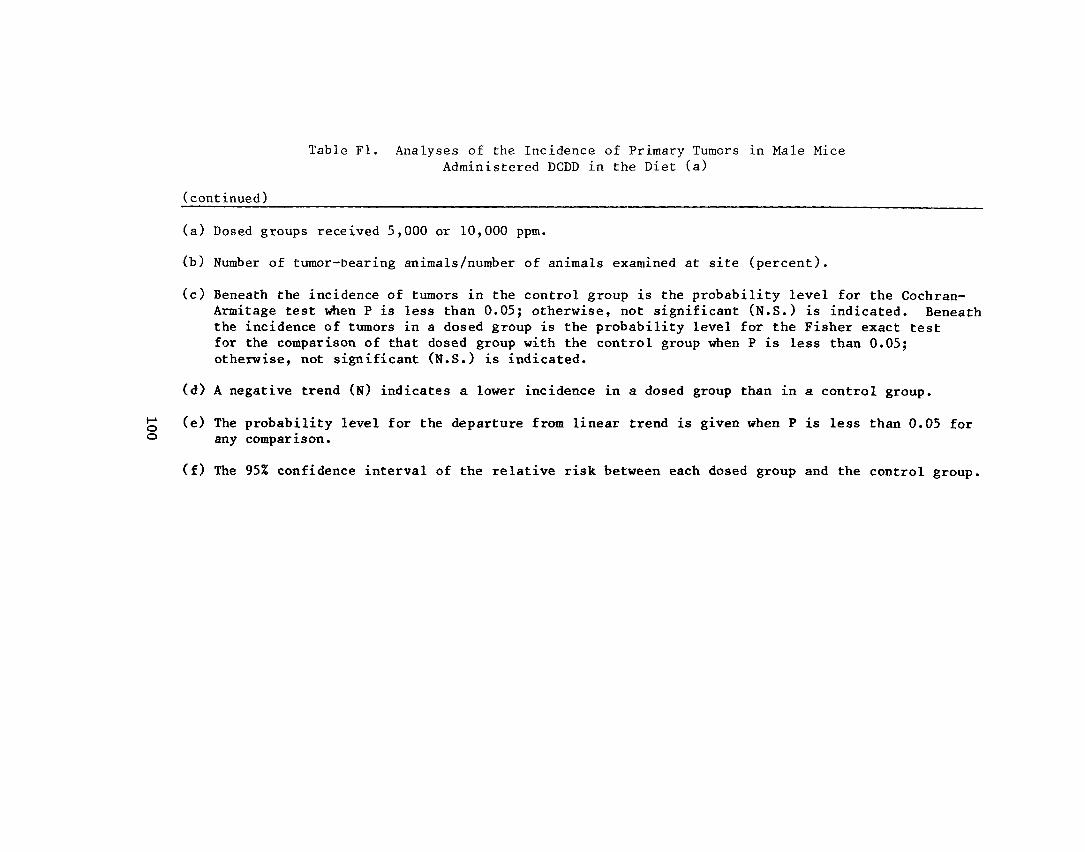
Table Fl. Analyses of the Incidence of Primary Tumors in Male Mice Administered DCDD in the Diet (a)
(continued)
(a) Dosed groups received 5,000 or 10,000 ppm.
(b) Number of tumor-bearing animals/number of animals examined at site (percent).
(c) Beneath the incidence of tumors in the control group is the probability level for the Cochran-Armitage test when P is less than 0.05; otherwise, not significant (N.S.) is indicated. Beneath the incidence of tumors in a dosed group is the probability level for the Fisher exact test for the comparison of that dosed group with the control group when P is less than 0.05; otherwise, not significant (N.S.) is indicated.
(d) A negative trend (N) indicates a lower incidence in a dosed group than in a control group.
(e) The probability level for the departure from linear trend is given when P is less than 0.05 for any comparison.
(f) The 95% confidence interval of the relative risk between each dosed group and the control group.

Table F2. Analyses of the Incidence of Primary Tumors in Female Mice Administered DCDD in the Diet (a)
Topography: Morphology
Lung: Alveo lar /Bronch io lar Adenoma (b)
P Values (c,d)
Relative Risk (f) Lower Limit Upper Limit
Weeks to First Observed Tumor
Stomach: Papilloma, NOS, Papillomatosis, or Squamouscell Papilloma (b)
P Values (c,d)
Relative Risk (f) Lower Limit Upper Limit
-Weeks to First Observed Tumor
Control
3/50 (6)
N.S.
91
1/48 (2)
N.S.
91
Low Dose
2/47 (4)
N.S.
0.709 0.061 5.913
92
3/48 (6)
N.S.
3.000 0.252
154.112
92
High Dose
0/47 (0)
N.S.
0.000 0.000 1.766
—
1/39 (3)
N.S.
1.231 0.016 94.143
93

Table F2. Analyses of the Incidence of Primary Tumors in Female Mice Administered DCDD in the Diet (a)
(continued)
Topography: Morphology Control Low Dose
High Dose
Hematopoietic System: Leukemia or Lymphoma (b) 6/50 (12) 11/49 (22) 4/48 (8)
P Values (c,d) N.S. N.S. N.S.
Departure from Linear Trend (e) P = 0.044
Relative Risk (f) Lower Limit Upper Limit
1.871 0.692 5.683
0.694 0.153 2.739
Weeks to First Observed Tumor 76 88 93
(a) Dosed groups received 5,000 or 10,000 ppm.
(b) Number of tumor-bearing animals/number of animals examined at site (percent).
(c) Beneath the incidence of tumors in the control group is the probability level for the Cochran-Armitage test when P is less than 0.05; otherwise, not significant (N.S.) is indicated. Beneath the incidence of tumors in a dosed group is the probability level for the Fisher exact test for the comparison of that dosed group with the control group when P is less than 0.05; otherwise, not significant (N.S.) is indicated.
(d) A negative trend (N) indicates a lower incidence in a dosed group than in a control group.
(e) The probability level for the departure from linear trend is given when P is less than 0.05 for any comparison.
(f) The 95% confidence interval of the relative risk between each dosed group and the control group.

Review of the Bioassay of 2,7-Dichlorodibenzo-p-Dioxin (DCDD)* for Carcinogenicity by the Data Evaluation/Risk Assessment Subgroup
of the Clearinghouse on Environmental Carcinogens
October 25, 1978
The Clearinghouse on Environmental Carcinogens was established in May, 1976, in compliance with DREW Committee Regulations and the Provisions of the Federal Advisory Committee Act. The purpose of the Clearinghouse is to advise the Director of the National Cancer Institute (NCI) on its bioassay program to identify and to evaluate chemical carcinogens in the environment to which humans may be exposed. The members of the Clearinghouse have been drawn from academia, industry, organized labor, public interest groups, and State health officials. Members have been selected on the basis of their experience in carcinogenesis or related fields and, collectively, provide expertise in chemistry, biochemistry, biostatistics, toxicology, pathology, and epidemiology. Representatives of various Governmental agencies participate as ad hoc members. The Data Evaluation/Risk Assessment Subgroup of the Clearinghouse is charged with the responsibility of providing a peer review of reports prepared on NCI-sponsored bioassays of chemicals studied for carcinogenicity. It is in this context that the below critique is given on the bioassay of 2,7-Dichlorodibenzo-p-Dioxin (DCDD) for carcinogenicity.
The reviewer for the report on the bioassay of DCDD said that, under the conditions of test, the compound was not carcinogenic in either sex of treated rats or female mice. An increased incidence of a variety of tumors, including hepatocellular neoplasms and leukemias, were observed among treated male mice. These findings led the Program staff to conclude that the evidence was suggestive of a carcinogenic effect in male mice. There was no objection to a recommendation that the report on the bioassay of DCDD be accepted as written.
Clearinghouse Members present;
Arnold L. Brown (Chairman), University of Wisconsin Medical School Joseph Highland, Environmental Defense Fund William Lijinsky, Frederick Cancer Research Center Henry Pitot, University of Wisconsin Medical Center Verne A. Ray, Pfizer Medical Research Laboratory Kenneth Wilcox, Michigan State Health Department
Subsequent to this review, changes may have been made in the bioassay report either as a result of the review or other reasons. Thus, certain comments and criticisms reflected in the review may no longer be appropriate.
103
f c U . S . G O V E R N M E N T P R I N T I N G O F F I C E : 1978-281-217/3299


DHEW Publication No. (NIH) 79-1378


![GC/MS/MS Dioxin and Dioxin-like PCBs in Feed and Food · GC/MS/MS is now a confirmatory technique in Dioxin/Furan/PCB analysis! European Market for Dioxin analysis in [Animal] Feed](https://img.pdfslide.us/doc/110x75/5ed3e5dbe6b26c678153332b/gcmsms-dioxin-and-dioxin-like-pcbs-in-feed-and-food-gcmsms-is-now-a-confirmatory.jpg)
![Company introducing[PDF, 2,7 MB]](https://img.pdfslide.us/doc/110x75/58a2cfcc1a28abbe5a8bc6d4/company-introducingpdf-27-mb.jpg)