Embed Size (px)
Citation preview
ETSI TR 103 055 V1.1.1 (2011-09)
Electromagnetic compatibility and Radio spectrum Matters (ERM);
System Reference document (SRdoc): Spectrum Requirements for Short Range Device,
Metropolitan Mesh Machine Networks (M3N) and Smart Metering (SM) applications
Technical Report
ETSI
ETSI TR 103 055 V1.1.1 (2011-09) 2
Reference DTR/ERM-TG28-0430
Keywords RFID, SRD, UHF
ETSI
650 Route des Lucioles F-06921 Sophia Antipolis Cedex - FRANCE
Tel.: +33 4 92 94 42 00 Fax: +33 4 93 65 47 16
Siret N° 348 623 562 00017 - NAF 742 C
Association à but non lucratif enregistrée à la Sous-Préfecture de Grasse (06) N° 7803/88
Important notice
Individual copies of the present document can be downloaded from: http://www.etsi.org
The present document may be made available in more than one electronic version or in print. In any case of existing or perceived difference in contents between such versions, the reference version is the Portable Document Format (PDF).
In case of dispute, the reference shall be the printing on ETSI printers of the PDF version kept on a specific network drive within ETSI Secretariat.
Users of the present document should be aware that the document may be subject to revision or change of status. Information on the current status of this and other ETSI documents is available at
http://portal.etsi.org/tb/status/status.asp
If you find errors in the present document, please send your comment to one of the following services: http://portal.etsi.org/chaircor/ETSI_support.asp
Copyright Notification
No part may be reproduced except as authorized by written permission. The copyright and the foregoing restriction extend to reproduction in all media.
© European Telecommunications Standards Institute 2011.
All rights reserved.
DECTTM, PLUGTESTSTM, UMTSTM and the ETSI logo are Trade Marks of ETSI registered for the benefit of its Members. 3GPPTM and LTE™ are Trade Marks of ETSI registered for the benefit of its Members and
of the 3GPP Organizational Partners. GSM® and the GSM logo are Trade Marks registered and owned by the GSM Association.
ETSI
ETSI TR 103 055 V1.1.1 (2011-09) 3
Contents
Intellectual Property Rights ................................................................................................................................ 5
Foreword ............................................................................................................................................................. 5
Introduction ........................................................................................................................................................ 5
1 Scope ........................................................................................................................................................ 6
2 References ................................................................................................................................................ 6
2.1 Normative references ......................................................................................................................................... 6
2.2 Informative references ........................................................................................................................................ 6
3 Definitions and abbreviations ................................................................................................................... 7
3.1 Definitions .......................................................................................................................................................... 7
3.2 Abbreviations ..................................................................................................................................................... 8
4 Comments on the System Reference Document ...................................................................................... 9
5 Executive Summary ................................................................................................................................. 9
5.1 Context ............................................................................................................................................................... 9
5.1.1 From cellular to dedicated Machine-to-Machine Network ........................................................................... 9
5.1.2 From Smart Metering to Smart Cities ........................................................................................................... 9
5.1.3 Metropolitan Mesh Machine Network and& the Internet of Things (IOT) .................................................. 9
5.2 Metropolitan Mesh Machine Network ............................................................................................................... 9
5.2.1 Sensors and Actuators ................................................................................................................................. 10
5.2.2 Routers and Gateway .................................................................................................................................. 10
5.3 Summary of M3N applications requirements ................................................................................................... 10
5.4 Summary of current SRD regulation ................................................................................................................ 10
5.5 The Issues ......................................................................................................................................................... 11
5.6 Summary of requirements ................................................................................................................................ 11
5.7 Summary of requested ETSI/EC/ECC actions ................................................................................................. 11
6 Spectrum consideration .......................................................................................................................... 12
6.1 Current SRD Regulation .................................................................................................................................. 12
6.1.1 Overview of SRD regulation on the 863 MHz to 870 MHz band ............................................................... 12
6.1.2 Overview of published performance requirements for specific SRDs using the frequency band 870 MHz to 876 MHz ........................................................................................................................................ 13
6.1.2.1 Overview of the TR102 649-1 and TR 102 649-2 ................................................................................ 13
6.1.2.2 Overview of Draft ES 202 630 .............................................................................................................. 14
6.2 Performances requirements for upcoming M3N devices ................................................................................. 15
6.2.1 Power .......................................................................................................................................................... 15
6.2.2 Duty cycle ................................................................................................................................................... 15
6.2.3 Bandwidth and Channelization ................................................................................................................... 16
7 Conclusion .............................................................................................................................................. 16
8 Proposed regulation and justification ..................................................................................................... 17
Annex A: Range estimation and link budget ....................................................................................... 19
A.1 Introduction and path loss model ........................................................................................................... 19
A.2 Gateway - router and router - router link................................................................................................ 19
A.3 Router to endpoint or access router to router ......................................................................................... 20
Annex B: Synchronization rate / Preamble length trade-off ............................................................. 22
B.1 Introduction ............................................................................................................................................ 22
B.1.1 Preamble Sampling Technique ......................................................................................................................... 22
B.1.2 Preamble Length vs Synchronisation Interval .................................................................................................. 22
B.2 Hypotheses ............................................................................................................................................. 23
ETSI
ETSI TR 103 055 V1.1.1 (2011-09) 4
B.3 End-point case ........................................................................................................................................ 24
B.4 Router case ............................................................................................................................................. 24
B.5 Conclusions ............................................................................................................................................ 26
Annex C: Technical Requirements ....................................................................................................... 27
C.1 Applications description ......................................................................................................................... 27
C.1.1 Water/gas metering........................................................................................................................................... 27
C.1.2 Electricity smart metering ................................................................................................................................ 28
C.1.3 Waste management........................................................................................................................................... 28
C.1.4 Pollution monitoring......................................................................................................................................... 28
C.1.4.1 Monitoring to feed numerical models ......................................................................................................... 29
C.1.4.2 Alerting ....................................................................................................................................................... 29
C.1.5 Public lighting .................................................................................................................................................. 29
C.1.6 Parking management system ............................................................................................................................ 30
C.1.7 Self service bike renting ................................................................................................................................... 30
C.2 Application requirement summary ......................................................................................................... 31
C.3 Performances requirements .................................................................................................................... 32
C.3.1 Resource Constraints ........................................................................................................................................ 32
C.3.2 Link Range and reliability ................................................................................................................................ 32
C.3.3 Transaction latency........................................................................................................................................... 33
C.3.4 Conclusion ........................................................................................................................................................ 34
C.4 M3N traffic model .................................................................................................................................. 34
C.4.1 Typical network architecture ............................................................................................................................ 34
C.4.2 Network dimensioning ..................................................................................................................................... 35
C.4.2.1 Geographical distribution of gateways ....................................................................................................... 35
C.4.2.2 Core network dimensioning ........................................................................................................................ 35
C.4.2.3 Access network dimensioning .................................................................................................................... 36
C.4.3 Duty cycle requirements estimate .................................................................................................................... 36
C.4.3.1 Introduction................................................................................................................................................. 36
C.4.3.2 MAC Layer hypotheses .............................................................................................................................. 37
C.4.3.3 Duty cycle estimates ................................................................................................................................... 37
C.4.4 Traffic model conclusions ................................................................................................................................ 38
C.5 Technical requirement conclusion .......................................................................................................... 38
History .............................................................................................................................................................. 39
ETSI
ETSI TR 103 055 V1.1.1 (2011-09) 5
Intellectual Property Rights IPRs essential or potentially essential to the present document may have been declared to ETSI. The information pertaining to these essential IPRs, if any, is publicly available for ETSI members and non-members, and can be found in ETSI SR 000 314: "Intellectual Property Rights (IPRs); Essential, or potentially Essential, IPRs notified to ETSI in respect of ETSI standards", which is available from the ETSI Secretariat. Latest updates are available on the ETSI Web server (http://ipr.etsi.org).
Pursuant to the ETSI IPR Policy, no investigation, including IPR searches, has been carried out by ETSI. No guarantee can be given as to the existence of other IPRs not referenced in ETSI SR 000 314 (or the updates on the ETSI Web server) which are, or may be, or may become, essential to the present document.
Foreword This Technical Report (TR) has been produced by ETSI Technical Committee Electromagnetic compatibility and Radio spectrum Matters (ERM).
Introduction Short Range Device (SRD) technology is technology of growing use to interconnect sensors, actuators and remote control and monitoring systems. With time, technological progress and higher awareness of environment related questions will promote widespread use of sensor networks able to gather data at the scale of a city.
Consequently, SRD technology will be used to interconnect all of those sensors, actuators and infrastructures.
The present document examines whether the performance requirements, access mechanism and transmitted power currently in use for SRDs are adequate for Metropolitan Mesh Machine Network (M3N) and opens a discussion on further work required to establish the magnitude of any compatibility issues in sharing the 870 MHz to 876 MHz frequency band.
The present document identifies a relevant set of M3N applications that will transmit data over the M3N network. This permits to model a typical M3N deployment in term of number of devices, infrastructures and density. The same applications set also identify the key service requirements which will impact the volume of traffic to be transmitted between endpoints and network infrastructure. A structured mesh network is assumed as it accommodates the limited power available for data transmission and minimises the number of gateways. The mesh traffic is modelled and the expected network performance established. This is then compared with the current SRD regulatory limits.
The present document then discusses required changes in SRD rules to enable reliable and economically viable M3N operations. The discussion on compatibility assumes that the military services will be displaced by E-GSM-R and that it is with this service that the SRDs will share the frequency band. Intersystem interferences have already been addressed in TR 102 649-2 [i.7] and TR 102 886 [i.1], and is not repeated here.
ETSI
ETSI TR 103 055 V1.1.1 (2011-09) 6
1 Scope The present document applies to a new class of SRD devices specifically for Smart City applications operating in the UHF frequency band from 870 MHz to 876 MHz. It extends the discussion from Smart Metering Requirements discussed in TR 102 886 [i.1] and TR 102 649-2 [i.7] to a wider set of applications that are presented. Particular performance and compatibility parameters needed for the successful operation of SRD devices used in smart cities application are also identified.
2 References References are either specific (identified by date of publication and/or edition number or version number) or non-specific. For specific references, only the cited version applies. For non-specific references, the latest version of the reference document (including any amendments) applies.
Referenced documents which are not found to be publicly available in the expected location might be found at http://docbox.etsi.org/Reference.
NOTE: While any hyperlinks included in this clause were valid at the time of publication, ETSI cannot guarantee their long term validity.
2.1 Normative references The following referenced documents are necessary for the application of the present document.
Not applicable.
2.2 Informative references The following referenced documents are not necessary for the application of the present document but they assist the user with regard to a particular subject area.
[i.1] ETSI TR 102 886: "Electromagnetic compatibility and Radio spectrum Matters (ERM); Technical characteristics of Smart Metering (SM) Short Range Devices (SRD) in the UHF Band; System Reference Document, SRDs, Spectrum Requirements for Smart Metering European access profile Protocol (PR-SMEP)".
[i.2] M/441 EN: "Standardisation Mandate to CEN, CENELEC and ETSI in the field of measuring instruments for the development of an open architecture for utility meters involving communication protocols enabling interoperability".
[i.3] ETSI EN 300 220 (all parts): "Electromagnetic compatibility and Radio spectrum Matters (ERM); Short Range Devices (SRD); Radio equipment to be used in the 25 MHz to 1 000 MHz frequency range with power levels ranging up to 500 mW".
[i.4] ERC/REC 70-03: "Relating to the use of short-range devices (SRD)".
[i.5] CEPT ECC Report 37: "Compatibility of planned SRD applications with currently existing radiocommunication applications in the frequency band 863-870MHz", Granada, February 2004.
[i.6] ETSI TR 102 649-1 (V1.1.1): "Electromagnetic compatibility and Radio spectrum Matters (ERM); Technical characteristics of RFID in the UHF band; System Reference Document for Radio Frequency Identification (RFID) equipment; Part 1: RFID equipment operating in the range from 865 MHz to 868 MHz".
[i.7] ETSI TR 102 649-2 (V1.2.1): "Electromagnetic compatibility and Radio spectrum Matters (ERM); Technical characteristics of Short Range Devices (SRD) and RFID in the UHF Band; System Reference Document for Radio Frequency Identification (RFID) and SRD equipment; Part 2: Additional spectrum requirements for UHF RFID, non-specific SRDs and specific SRDs".
ETSI
ETSI TR 103 055 V1.1.1 (2011-09) 7
[i.8] ETSI ES 202 630: "Electromagnetic compatibility and Radio spectrum Matters (ERM); Short Range Devices (SRD); Radio equipment to be used in parts of the frequency range 870 MHz to 876 MHz and 915 MHz to 921 MHz, with Transmitter Duty Cycle (TDC) restriction and power levels up to 25 mW; Technical characteristics and test methods".
[i.9] COST 231 final report: "Digital mobile radio towards future generation systems".
NOTE: Available at http://www.lx.it.pt/cost231/final_report.htm.
[i.10] Analysis Mason: "Internet 3.0: the Internet of Things", October 2010.
NOTE: Available at http://www.analysysmason.com/Research/Content/Reports/RRY04_Internet_of_Things_Oct2010/.
[i.11] Open Metering System Specification, Volume 1, General Part, Issue 1.2.0/2009-07-17.
[i.12] OMS, Open Metering System Specification, Volume 2, Primary Communication, Issue 2.0.0/2009-07-20.
[i.13] Netherlands Technical Agreement NTA 8130:2007: "Basic functions for metering systems for electricity, gas and thermal energy for small-scale consumers".
[i.14] "Application characteristics: An applicative framework for the research work conducted in ARESA2" ARESA2 - Deliverable 1.1 version 1 - sept 2010 - ANR 2009 VERSO 017-01.
[i.15] IETF RFC 5548 (May 2009): "Routing Requirements for Urban Low-Power and Lossy Networks.
NOTE: Available at http://tools.ietf.org/html/rfc5548.
[i.16] "Urban Sensor Network" IEEE 802.15.4g call for applications - J.Schwoerer - doc 15-04-0042-01-004g.
[i.17] "Battery operated application" IEEE 802.15.4g call for applications - Hirohito Nishiyama, Ryoji Ono, Seiichi Hiraoka - doc 15-09-00113-01-004g.niko.
[i.18] "Senscity services specification" - Senscity research project - Pole de competitivité Minalogic - December 2010.
NOTE: Available at http://senscity.minalogic.net/.
[i.19] "Definition of needs and usage scenarios" - Deliverable 1.1 - WP1 - RNRT research project ARESA, may 2007.
NOTE: Available at http://aresa-project.insa-lyon.fr/.
[i.20] draft-ietf-6lowpan-hc-15: "Compression Format for IPv6 Datagrams in Low Power and Lossy Networks (6LoWPAN)".
[i.21] EN 13757-4:2005: "Communication systems for meters and remote reading of meters - Part 4: Wireless meter readout (Radio meter reading for operation in the 868 MHz to 870 MHz SRD band)".
3 Definitions and abbreviations
3.1 Definitions For the purposes of the present document, the following terms and definitions apply:
access router: routers that connect a core router or a gateway to an endpoint
channel: small frequency sub-band within the operating frequency band into which a Radio Signal fits
NOTE: Commonly, a frequency band is divided into contiguous channels.
ETSI
ETSI TR 103 055 V1.1.1 (2011-09) 8
core router: routers that are needed to connect a gateway to an access router or another core router
duty cycle: for the purposes of ERC/REC 70-03 [i.4], the duty cycle is defined as the ratio, expressed as a percentage, of the maximum transmitter cumulative "on" time on one carrier frequency, relative to a one hour period
NOTE 1: For frequency agile devices the duty cycle limit applies to the total transmission.
NOTE 2: For specific applications with very low duty cycles and very short periods of transmissions, the definition of duty cycle should be subject to study.
endpoint: network device associated with a sensors or actuator
gateway: network point of attachment for a node collecting node traffic and routing it through dedicated WAN connection
listen before talk: action taken by a device to detect an unoccupied sub-band or channel prior to transmitting
metering: transmission of metrology information (electricity, gas water and energy) by radio communication
Short Range Devices (SRDs): radio devices which provide either unidirectional or bi-directional communication and which have low capability of causing interference to other radio equipment
NOTE: SRDs use either integral, dedicated or external antennas and all modes of modulation can be permitted subject to relevant standards. SRDs are normally "license exempt".
specific SRDs: SRDs that are used in specific applications (e.g. Applications of ERC/REC 70-03 [i.4], annexes 2 to 13)
3.2 Abbreviations For the purposes of the present document, the following abbreviations apply:
(x)DSL Digital Subscriber Line AFA Adaptive Frequency Agility AR Access Router CEPT European Conference of Postal and Telecommunications Administrations COFDM Coded Orthogonal Frequency Division Multiplex CR Core Router e.r.p. effective radiated power EC European Community ECC Electronic Communications Committee E-GSM-R Extended GSM for Railways EIRP Effective Isotropic Radiated Power EN European Norm ERC European Radio communication Committee FHSS Frequency Hopping Spread Spectrum GPRS General Packet Radio Service GSM Global System for Mobile IOT Internet of Things IP Internet Protocol LBT Listen Before Talk LDC Low Duty Cycle LOS Line of Sight LTE Long Term Evolution M2M Machine-to-Machine M3N Metropolitan Mesh Machine Network MAC Medium Access Control NLOS Non-Line of Sight PHY PHYsical layer QoS Quality of Service REC Recommendation RFID Radio Frequency Identification SRD Short Range Devices TPC Transmit Power Control
ETSI
ETSI TR 103 055 V1.1.1 (2011-09) 9
TR Technical Report UHF Ultra High Frequency UMTS Universal Mobile Telecomunication Systems WAN Wide Area Network WLAN Wireless Local Area Network
4 Comments on the System Reference Document Few comments were received through an ETSI coordinated enquiry procedure and were satisfactorily resolved.
5 Executive Summary
5.1 Context
5.1.1 From cellular to dedicated Machine-to-Machine Network
GSM has previously been used to connect remote devices to private control network. As long as the interconnected devices have a high value such as town information display and parking meters the cost of GSM modules is a small proportion of the overall cost.
Now, Machine-to-Machine (M2M) devices are often low cost, battery powered and transmit only small amounts of data. GSM modules are consequently too expensive and consume too much power for such applications.
Hence new wireless techniques have been developed for Machine-to-Machine devices operating under SRD rules to provide suitable low cost, low power connectivity.
5.1.2 From Smart Metering to Smart Cities
Smart Metering has developed from early 'walk-by' meter reading systems to fully bi-directional communications systems constructed as large scale networks. The benefits of improved communications capabilities are seen in lower operating costs, user-centric consumption information and improved energy production with reduced carbon emissions. Similar benefits can be gained in gas, heat and water supply as well as electricity.
The communications techniques developed for Smart Metering can be applied to other remote sensing and management applications. Their use in urban applications is called Smart Cities.
5.1.3 Metropolitan Mesh Machine Network and& the Internet of Things (IOT)
Owing to its design and use of open access mechanism [i.15], Metropolitan Mesh Machine Network (M3N) brings improved capacity (link reliability, real bi-directionality, human acceptable latency) to every device. The sharing of several services on a single network, allows the interaction between devices of different services as well as amortising network costs.
It is almost impossible today to discuss machine networks without considering the "Internet of Things". A recent report concluded there may be as many as 16 billion connected objects by the year 2020. As M3N is able to connect various devices implied on different cities automation & monitoring services over a single network, M3N is a first step toward the Internet of Things.
5.2 Metropolitan Mesh Machine Network A M3N is a network composed of the following of elements: Endpoints (Sensors and Actuators), Routers and Gateways.
ETSI
ETSI TR 103 055 V1.1.1 (2011-09) 10
5.2.1 Sensors and Actuators
Sensing nodes measure a wide range of physical data, including:
• Municipal consumption of gas, water, electricity, etc.
• Municipal generation of waste.
• Meteorological such as temperature, pressure, humidity, UV index, strength and direction of wind, etc.
• Pollution such as gases (sulphur dioxide, nitrogen oxide, carbon monoxide, ozone), heavy metals (e.g. mercury), pH, radioactivity, etc.
• Environment data, such as levels of allergens (pollen, dust), electromagnetic pollution (solar activity), noise, etc.
Sensor nodes run applications that typically gather the measurement data and send it to data collection and processing application(s) on other node(s) (often outside the Network). Sensor nodes are capable of forwarding data.
Actuator nodes are capable of controlling devices such as street or traffic lights. They run applications that receive instructions from control applications on other nodes. There are generally fewer Actuator nodes than Sensor nodes.
5.2.2 Routers and Gateway
Routers form a meshed network over which traffic between endpoints and gateways is dynamically routed. Routers are generally not mobile and need to be small and low cost. They differ from Actuator and Sensor nodes in that they neither control nor sense. However, a Sensor node or Actuator node may also be a router within the M3N.
A Gateway is a Router node which also provides access to a wider infrastructure and may also run applications that communicate with Sensor and Actuator nodes.
5.3 Summary of M3N applications requirements Existing services for local authorities and utilities have available services requirements, [i.11], [i.12] and [i.13]. Some forward looking requirements have been identified through research [i.14], [i.15], [i.18] and [i.19] or standardization projects [i.15], [i.16] and [i.17].
Annex C presents a set of applications and their associated service requirements for a mid-sized European city of 150 000 inhabitants spread over an area of 20 km². This typical case allows an estimate of the amount of data per application as well as the volume of data handled by the M3N equipments. The key findings are:
• The daily data volume is approximately 600 Mbytes.
• Traffic is predominantly in the uplink direction.
• Ability to operate on battery is mandatory.
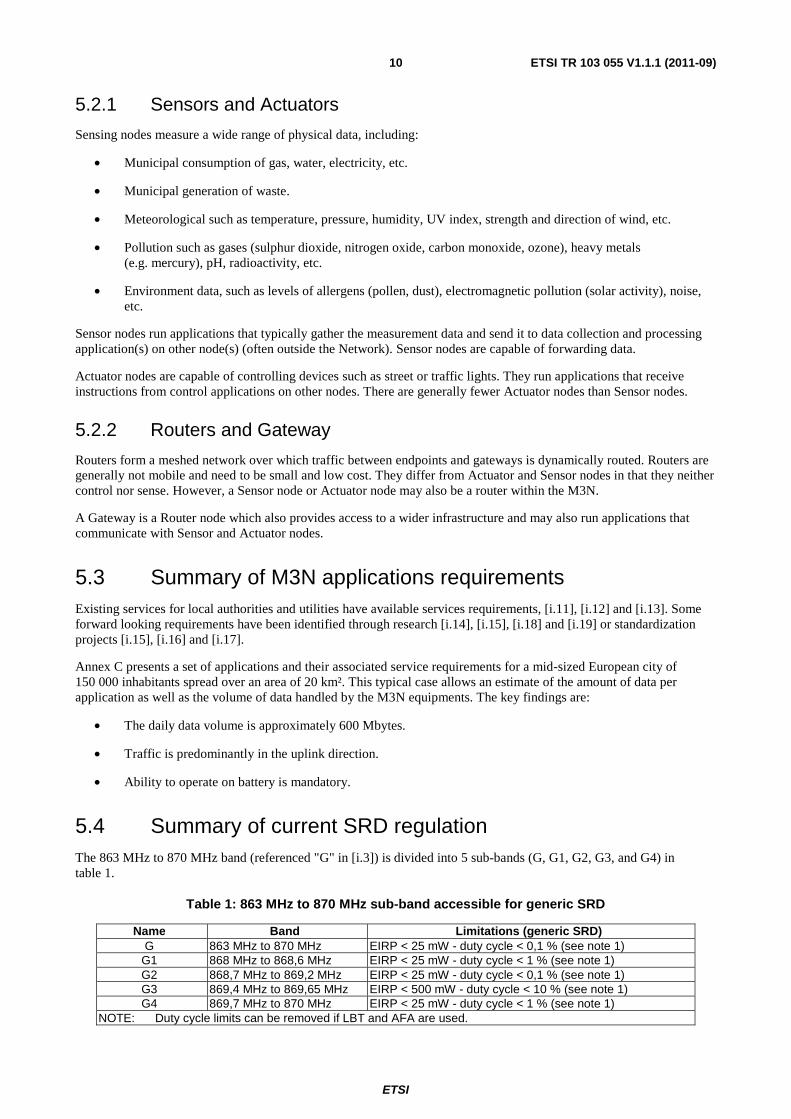
5.4 Summary of current SRD regulation The 863 MHz to 870 MHz band (referenced "G" in [i.3]) is divided into 5 sub-bands (G, G1, G2, G3, and G4) in table 1.
Table 1: 863 MHz to 870 MHz sub-band accessible for generic SRD
Name Band Limitations (generic SRD) G 863 MHz to 870 MHz EIRP < 25 mW - duty cycle < 0,1 % (see note 1)
G1 868 MHz to 868,6 MHz EIRP < 25 mW - duty cycle < 1 % (see note 1) G2 868,7 MHz to 869,2 MHz EIRP < 25 mW - duty cycle < 0,1 % (see note 1) G3 869,4 MHz to 869,65 MHz EIRP < 500 mW - duty cycle < 10 % (see note 1) G4 869,7 MHz to 870 MHz EIRP < 25 mW - duty cycle < 1 % (see note 1)
NOTE: Duty cycle limits can be removed if LBT and AFA are used.

ETSI
ETSI TR 103 055 V1.1.1 (2011-09) 11
For now, existing M3N applications can only operate as non-specific SRD.
5.5 The Issues The present document investigates the use of M3N in the UHF Band.
• 0,1 % duty cycle is very low for M3N operation (see clause C.4.3).
• Co-existence with permanently transmitting high powered RFID equipment will harm M3N reliability and battery lifetime.
• The distance between M3N devices in some deployments may be greater than the radio range achievable with 25 mW EIRP (see annex A).
• M3N application may require data rates up to 100 kbps [i.1] and see clauses C.2 and C.4.3.2.
• Human acceptable / IP acceptable latency (see clause C.3.4).
• A 25 ms transmit time limitation (Ton) is too short to comply with MAC mechanism needed by battery powered devices to prevent idle listening (see annex B).
• A 200 kHz channelization scheme (sub-divisible into 100 kHz or 50 kHz) consistent with E-GSM-R (between 873 MHz and 876 MHz), is required for spectrum efficiency and coexistence with Smart Metering (see annex A, [i.1], [i.7] and [i.8]).
5.6 Summary of requirements From the comparison of the published performance requirements of SRDs in the frequency band 870 MHz to 876 MHz with the M3N requirements developed in annex C, the following operating parameters have been derived and are summarized in table 2.
Table 2: Summary of requirement for M3N application and services
Parameter Value Power 100 mW EIRP Channelization 200 kHz (with 50 kHz and 100 kHz sub channel) Duty Cycle Overall 1,25 % measured over a specified interval without peak limit in any
sub-interval,†, when required for coexistence with existing services Overall 1 % measured over a specified interval without peak limit in any sub-interval and without transmit time limitation† (outside 873 MHz to 876 MHz band to avoid coexistence issue with E-GSM-R)
Bandwidth As Smart Metering is a part of M3N, requirement identified in 102 MHz to 886 MHz between 873 MHz to 876 MHz band, in co-existence with E-GSM-R † 800 kHz outside E-GSM-R band for M3N devices requiring transmit time longer than 25 ms, situated as close as possible of the 873 MHz to 876 MHz Band †
† Subject to the outcome of compatibility studies.
5.7 Summary of requested ETSI/EC/ECC actions ECC is requested to:
• Undertake studies on the proposals for new spectrum for high performance UHF SRD systems for M3N.
• Complete these studies within a time frame of 12 months.
EC is requested to:
• Harmonize European conditions for the availability and use of the radio spectrum for such SRDs.
See clause 8 for details.
ETSI
ETSI TR 103 055 V1.1.1 (2011-09) 12
It is recommended that ETSI ERM_TG28:
• Finalize the ES 202 630 [i.8] that would then be a good basis then for a new harmonised standard for such SRDs.
See clause 6.1.2.2 for details.
6 Spectrum consideration
6.1 Current SRD Regulation Existing SRD regulation is complex. Most M3N devices in Europe currently operate in the 868 MHz band. Spectrum access (maximum power levels, channel spacing and duty cycle) for this band is governed by ECC/REC 70/03 [i.4], backed by national regulations and using EN 300 220 [i.3] for verification.
SRDs are presently not designated to the frequency band 870 MHz to 876 MHz. Of the limited reference documents available, [i.4], [i.5], [i.6] and [i.7], it is possible to extract some information on the likely performance parameters which would be used in this band. The most important of these, addressing operational parameters and test methodology, are TR 102 649-1 [i.6], TR 102 649-2 [i.7] and ES 202 630 [i.8]. An overview of their contents is given in the following clause.
6.1.1 Overview of SRD regulation on the 863 MHz to 870 MHz band
SRD, either specific or not, are currently designated to the 863 MHz to 870 MHz band. From reference [i.3] and [i.4] it can be seen that those 7 MHz are shared amongst many applications, some of them having specific needs:
• RFID require high EIRP and 100 % duty cycle to be able to supply remotely powered tag. Given the required protection distances (918 m and 3,6 km respectively for indoor and rural outdoor environments) this in practice, prevents the M3N devices co-existing with RFID devices.
• Alarms applications require only a narrow band, but also need a high level of protection to avoid unwanted alarm behaviour. This limits the ability for an alarm wireless device to co-exist with other SRD users.
Consequently, the 863 MHz to 870 MHz band (band "G" in [i.3]) is divided into 4 sub-bands, numbered G1, G2, G3 and G4. Each of them has different constraints in term of EIRP, duty cycle, and channel bandwidth, as revealed in figure 1 and table 1.
ETSI
ETSI TR 103 055 V1.1.1 (2011-09) 13
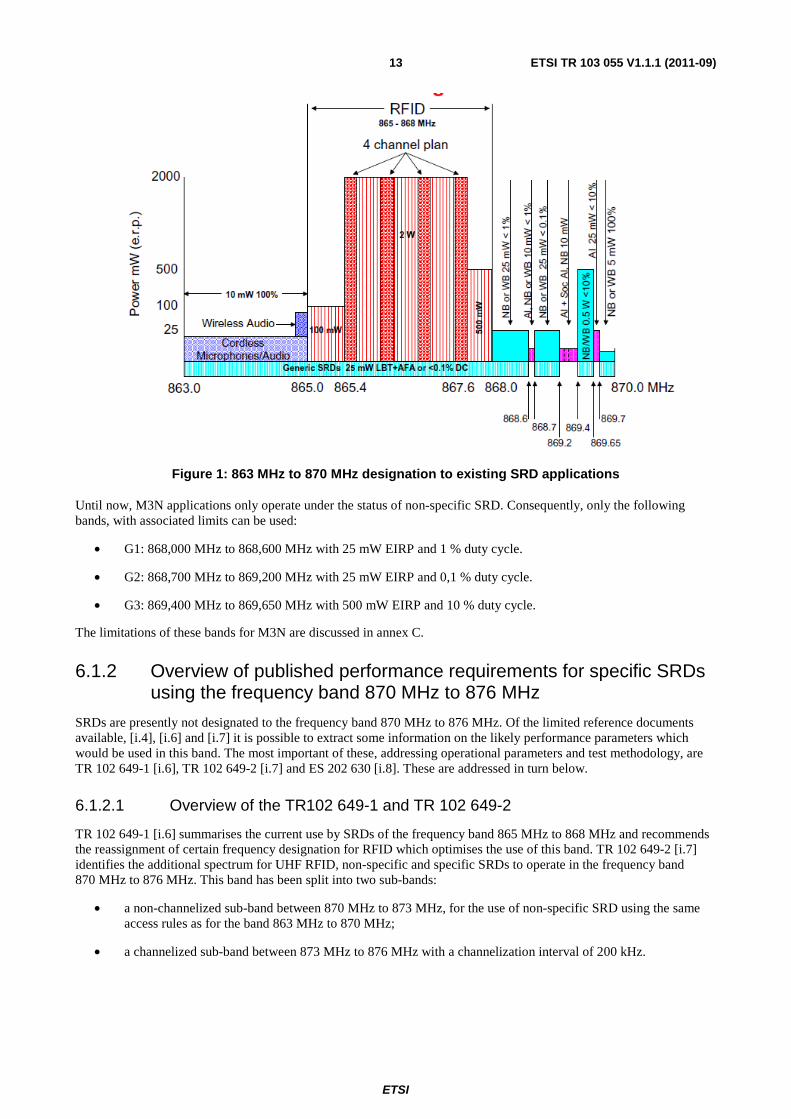
Figure 1: 863 MHz to 870 MHz designation to existing SRD applications
Until now, M3N applications only operate under the status of non-specific SRD. Consequently, only the following bands, with associated limits can be used:
• G1: 868,000 MHz to 868,600 MHz with 25 mW EIRP and 1 % duty cycle.
• G2: 868,700 MHz to 869,200 MHz with 25 mW EIRP and 0,1 % duty cycle.
• G3: 869,400 MHz to 869,650 MHz with 500 mW EIRP and 10 % duty cycle.
The limitations of these bands for M3N are discussed in annex C.
6.1.2 Overview of published performance requirements for specific SRDs using the frequency band 870 MHz to 876 MHz
SRDs are presently not designated to the frequency band 870 MHz to 876 MHz. Of the limited reference documents available, [i.4], [i.6] and [i.7] it is possible to extract some information on the likely performance parameters which would be used in this band. The most important of these, addressing operational parameters and test methodology, are TR 102 649-1 [i.6], TR 102 649-2 [i.7] and ES 202 630 [i.8]. These are addressed in turn below.
6.1.2.1 Overview of the TR102 649-1 and TR 102 649-2
TR 102 649-1 [i.6] summarises the current use by SRDs of the frequency band 865 MHz to 868 MHz and recommends the reassignment of certain frequency designation for RFID which optimises the use of this band. TR 102 649-2 [i.7] identifies the additional spectrum for UHF RFID, non-specific and specific SRDs to operate in the frequency band 870 MHz to 876 MHz. This band has been split into two sub-bands:
• a non-channelized sub-band between 870 MHz to 873 MHz, for the use of non-specific SRD using the same access rules as for the band 863 MHz to 870 MHz;
• a channelized sub-band between 873 MHz to 876 MHz with a channelization interval of 200 kHz.
ETSI
ETSI TR 103 055 V1.1.1 (2011-09) 14
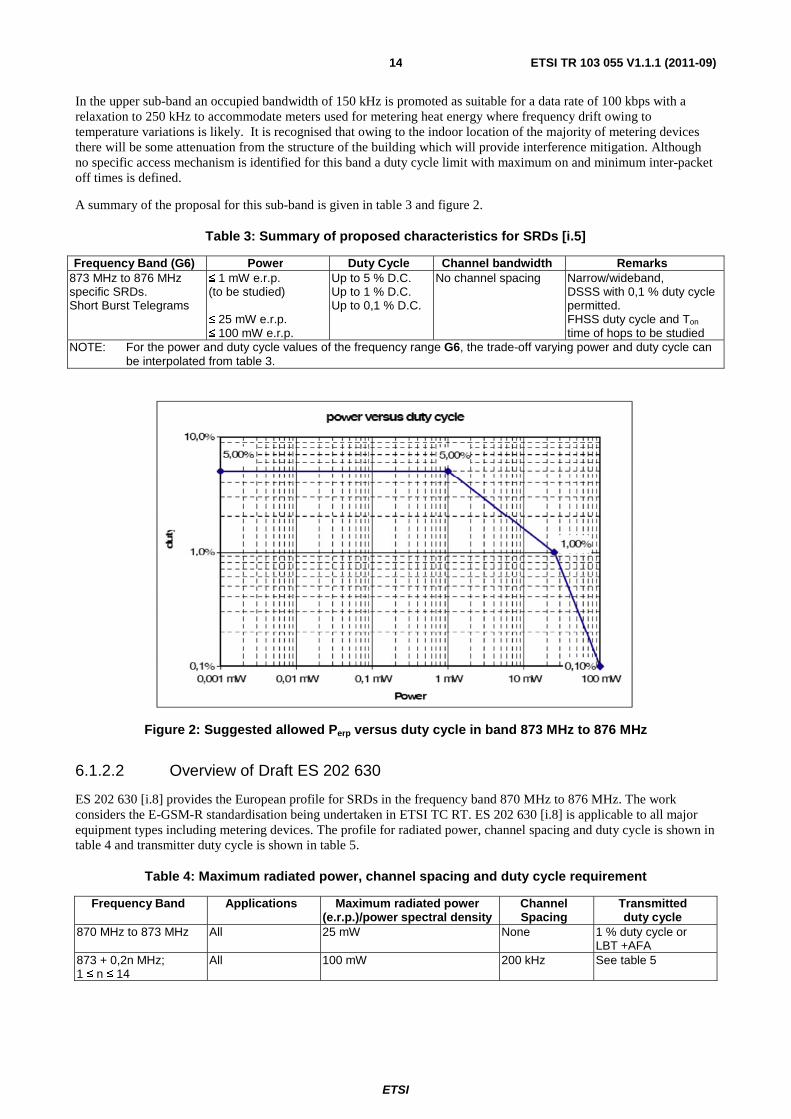
In the upper sub-band an occupied bandwidth of 150 kHz is promoted as suitable for a data rate of 100 kbps with a relaxation to 250 kHz to accommodate meters used for metering heat energy where frequency drift owing to temperature variations is likely. It is recognised that owing to the indoor location of the majority of metering devices there will be some attenuation from the structure of the building which will provide interference mitigation. Although no specific access mechanism is identified for this band a duty cycle limit with maximum on and minimum inter-packet off times is defined.
A summary of the proposal for this sub-band is given in table 3 and figure 2.
Table 3: Summary of proposed characteristics for SRDs [i.5]
Frequency Band (G6) Power Duty Cycle Channel bandwidth Remarks 873 MHz to 876 MHz specific SRDs. Short Burst Telegrams
≤ 1 mW e.r.p. (to be studied) ≤ 25 mW e.r.p. ≤ 100 mW e.r.p.
Up to 5 % D.C. Up to 1 % D.C. Up to 0,1 % D.C.
No channel spacing Narrow/wideband, DSSS with 0,1 % duty cycle permitted. FHSS duty cycle and Ton time of hops to be studied
NOTE: For the power and duty cycle values of the frequency range G6, the trade-off varying power and duty cycle can be interpolated from table 3.
Figure 2: Suggested allowed Perp versus duty cycle in band 873 MHz to 876 MHz
6.1.2.2 Overview of Draft ES 202 630
ES 202 630 [i.8] provides the European profile for SRDs in the frequency band 870 MHz to 876 MHz. The work considers the E-GSM-R standardisation being undertaken in ETSI TC RT. ES 202 630 [i.8] is applicable to all major equipment types including metering devices. The profile for radiated power, channel spacing and duty cycle is shown in table 4 and transmitter duty cycle is shown in table 5.
Table 4: Maximum radiated power, channel spacing and duty cycle requirement
Frequency Band Applications Maximum radiated power (e.r.p.)/power spectral density
Channel Spacing
Transmitted duty cycle
870 MHz to 873 MHz All 25 mW None 1 % duty cycle or LBT +AFA
873 + 0,2n MHz; 1 ≤ n ≤ 14
All 100 mW 200 kHz See table 5

ETSI
ETSI TR 103 055 V1.1.1 (2011-09) 15
Table 5: Transmitter duty cycle
TDC parameter Value Maximum Tx on ≤ 25 ms Minimum Tx off ≥ 500 ms Maximum accumulated transmission time (Tx on) 18 s in one (1) hour NOTE: The maximum accumulated transmission time takes into account the presence of 10 simultaneous
SRD TDC devices and is needed to avoid aggregated interference effects.
It is recommended that Sub-Technical Committee ETSI ERM TG28 finalise the ES 202 630 [i.8] that would then be a good basis for a new harmonised standard for Specific SRDs.
6.2 Performances requirements for upcoming M3N devices
6.2.1 Power
Annex A shows some typical link budgets in an urban situation and give the reliable radio range for each situation. It clearly highlights that a node able to use 100 mW EIRP have an increased range that allow to drastically simplify network deployment for application like gas and water meter reading and control, for which the huge majority of endpoints are in hard to reach location. The increased range due to increased EIRP allows to save non negligible access routers that were needed only to extend network coverage to the most hard to reach endpoints.
The fact that new building construction technique do an increased use of re-enforced concrete and external insulation with metal shielding (Zinc, Aluminium) make recently constructed buildings, who are the most likely to be equipped with M3N devices the most difficult to cover efficiently. For a reasonable deployment to perform successfully, 100 mW EIRP are required.
6.2.2 Duty cycle
Core routers are the most solicited devices (gateways excluded) in the network and are the most likely to reach the duty cycle limitations. Annex B gives an accurate estimation of each network infrastructure load, in terms of amount of data and required transmit time.
Moreover, gateways have to handle the upcoming traffic of several core routers and all the associated endpoints. As it is common practice to acknowledge each received frame at the MAC layer, the implied spectrum usage is even more critical for gateways than for core routers in most of the cases. This fact should not be underestimated as the duty cycle limitation will directly impact the maximum number of devices and the maximum amount of data that a single gateway will be able to manage without even considering the applications downlink traffic and the network management traffic.
Putting all together, use cases analysis shows that M3N applications won't lead to a duty cycle higher than 1,25 %. Consequently, the already required 2,5 % duty cycle TR 102 886 [i.1] would fit with all targeted applications and the expected architecture of M3N networks. From [i.7], it has been shown that this duty cycle allows co-existence with existing E-GSM-R services within the 873 MHz to 876 MHz band only if assorted of the time transmission limits below
• TX-on time that will not exceed a Max transmit time : 25 ms.
• TX off, which is the minimal silence time between two consecutive transmissions: 500 ms.
Those short transmission windows (less than 25 ms) are usable in a synchronized network, or when addressing permanently listening devices. Such conditions cannot always been met by very low power devices (low cost battery powered sensor). However, bi-directionality as well as "almost" real time reactivity is needed features, even for those battery powered applications. In the current state of the art, such features can only be achieved through the usage of the well known preamble sampling technique:
• With an asynchronous MAC layer, it implies the usage of long wake-up preambles that will exceed by far the allowed TX-on time.
ETSI
ETSI TR 103 055 V1.1.1 (2011-09) 16
• With a synchronous MAC layer, a compromise has to be found between the wake-up preamble duration used and the frequency of synchronization beacons transmission. As highly accurate clocks usage is not realistic for low-cost low power-sensors, a high beacon transmission rate is mandatory for making it possible using wake-up preambles shorter than 25 ms, even when considering state of the art temperature and clock compensation mechanisms. However, this method will clearly not meet energy saving requirements for this kind of receivers (understand here battery operated endpoints or routers).
In a nutshell, as soon as battery operated receivers with a few seconds real time constraints are considered, the wake-up preamble duration will necessarily exceed the 25 ms TX-on limit. As a consequence of this incompatibility, M3N applications will need to access a band that will allow the reasonable duty cycle (1 %) and EIRP (100 mW) but also longer transmission time. As it, this band will be able to host long preamble length longer than 25 ms, without preventing usual burst traffic to rely on the whole 873 MHz to 876 MHz band. To avoid coexistence issue with E-GSM-R, this band won't be located in the 873 MHz to 876 MHz band, but rather close to it.
6.2.3 Bandwidth and Channelization
[i.1] and [i.7] present several key arguments leading to 200 kHz channel bandwidth requirement:
• Numerous applications require data rates higher or equal than 100 kbps and it is technically feasible to constrain these data rates into 200 kHz channels.
• The current channelization scheme of E-GSM-R is established at 200 kHz and as coexistence with this channelization scheme is necessary, coherency between the two schemes is expected.
• A few applications (e.g. heat meters) require 250 kHz channel bandwidth which can be reached by aggregating multiple 200 kHz channels without resulting in a loss of valuable spectrum in the most common case.
However, a large number of applications of the M3N do not require such high data rates as the quantity of data to be sent is really small. It is thus possible reducing the channel bandwidth for these applications. Such a reduction in the channel bandwidth allows reaching better sensitivity performances by narrowing the reception filter for decreasing the noise power seen on the receiver side. At the end, this allows increasing the expected range and reliability for a given link budget. As a consequence, the ability to subdivide these 200 kHz into two 100 kHz or four 50 kHz channels would allow all at once these applications:
• Improving the communication performances.
• Improving the spectrum usage.
• Using valuable channel diversity mechanisms.
From [i.18], [i.19] and [i.14] situations where different and independent M3N networks, either privately or publically operated have to co-exist will likely exist. Four signalisation channels accessible to every M3N device, including battery powered ones, allow them to harmlessly coexist. As a consequence, a total bandwidth of 800 kHz without any transmit time limitation, is required in addition to requirement previously identified in [i.1].
7 Conclusion In TR 102 649-2 [i.7] the duty cycle and power requirements of a single metering device were considered. TR 102 886 [i.1] has considered the deployment of a large numbers of Smart Metering devices. The present document now adds to the "smart metering" uses cases a full set of related applications able to take benefit of a single wireless infrastructure network able to gather data from smart meter but also from a lot of other sensors deployed in a urban area.
In clause C.1, a full set of application, their benefits as well as their associated traffic load and additional technical requirements (latency, periodicity, power consumption) were presented. It allows to model the traffic load of a network aggregating all of those applications.
ETSI
ETSI TR 103 055 V1.1.1 (2011-09) 17
Clause C.4.2 has illustrated an average deployment able to cover a typical mid-sized city. It has allowed to demonstrate the ability of such a network to provide reliable low power connectivity to hundred of thousand of endpoint operating as SRD devices. In this model, a Gateway is able, thanks to two different layers of router (core routers and access router) to handle an average of 1 000 endpoint and connect them to a services platform. The mesh structure of the network, the number of router as well as dynamic routing algorithms allows a fair sharing of this traffic load through the network infrastructure. This representative deployment was then used to calculate an accurate estimation of the total traffic on the M3N network and it's spreading across it.
Clause 5 gives a summary of current SRD regulation and the related work currently carried about within ECC FM and ETSI. It is shown that Smart Metering and Smart Power Grid are emerging applications who currently operate as generic SRD, as do M3N equipment's. Thanks to M/441 [i.2] and EC actions, this situation, which is clearly not reliable for such critical system, is currently addressed by European spectrum regulation authorities. This work do mainly address Smart Power Grid and smart electric meter, who are the most demanding applications in term of amount of data to transmit as well as latency and transmission period. Beside this, it can be noted that M3N smart meter reading have comparable coverage area, deployment constraints, and network scale.
As awaited from this last point, a comparison between M3N estimated traffic, and electric smart metering requirement show that a M3N network, aggregating every envisioned smart city applications can operate with similar EIRP and duty cycle constraint.
Consequently, given the close similarity between Smart metering, remote meter reading, smart grid network, and all the M3N applications, it is recommended to designate the 873 MHz to 876 MHz band not only to smart metering devices but also to the more generic M3N devices and sensor (who include some meters).
In addition to that, M3N applications requires numbers of endpoints and sensors who will not be able to gather electric energy from the main power grid and consequently will operate only on battery power while still having to exhibit low cost and lifetime longer than ten years. This last point make inevitable the uses of long signalisation preamble (up to 2 s) (either wake-up preamble in asynchronous network, or long spaced synchronisation beacon in synchronous network). As the mechanism suggested in [i.8] to ensure coexistence between E-GSM-R and SRD in the 873-876 (g6) do limit the continuous transmission time of a given devices to 25 ms, the implementation of such battery powered sensor in this bands is made impossible.
Given the huge awaited benefit, in term of usability, of long lifetime battery powered sensor in most M3N applications, we recommend to designate a 800 kHz band for M3N devices and sensors, located outside the 873 MHz to 876 MHz band to avoid coexistence issue with E-GSM-R, that will allow long signalisation preamble as needed by battery powered sensor. For the sake of consistency, this band will have similar EIRP, duty cycle and channelization characteristic, leading to four 200 kHz channels able to host signalisation and wake up traffic for battery power M3N sensor. In order of simplifying design issue and avoid unnecessary complexity, this band will be located as close as possible of the band designated to smart metering and M3N devices and sensors.
8 Proposed regulation and justification ETSI requests ECC to consider the present document, which includes the necessary information and justification to support the co-operation under the MoU between ETSI and the Electronic Communications Committee (ECC) of the European Conference of Post and Telecommunications Administrations (CEPT).
ECC is requested to undertake further studies on the proposals for the frequency band 873 MHz to 876 MHz (band G6 in [i.7] for high performance UHF SRD systems for Smart Metering and Mesh Metropolitan Machine Network. In particular the following parameters should be studied:
• a duty cycle of 1,25 %;
• a power limit of not less than 100 mW EIRP;
• the 200 kHz channelization scheme proposed for SRD devices to correspond to the E-GSM-R scheme.
ETSI
ETSI TR 103 055 V1.1.1 (2011-09) 18
ECC is requested to undertake further studies on the proposal for a frequency band of 800 kHz immediately below 873 MHz (depending on the exact boundary with G5 and G6 band) for high performance UHF SRD systems for Smart Metering and Mesh Metropolitan Machine Network. In particular the following parameters should be studied:
• a duty cycle of 1 % without transmit time limitation;
• a power limit of not less than 100 mW EIRP;
• 200 kHz channelization, sub-divisible in 100 kHz or 50 kHz channel.
It is requested that these studies are performed within a time frame of 12 months.
It is recognized that some European countries have military use in the bands which are proposed for these SRD applications whilst in other frequency bands they are being used by railway operators. As part of the requested action, the ECC is therefore invited to consider with these existing users the possibility of SRD use in these bands. It is requested that ERC/REC 70-03 [i.4] be amended to include designated spectrum for the new frequency ranges and applications.
In parallel with an amendment to ERC/REC 70-03 [i.4] and as part of the annual update of the technical annex of the Commission Decision on the technical harmonisation of radio spectrum for use by short-range devices, the SRDMG is requested to seek harmonisation of the band at a European level.
ETSI
ETSI TR 103 055 V1.1.1 (2011-09) 19
Annex A: Range estimation and link budget
A.1 Introduction and path loss model M3N endpoints are by construction, low power devices, often battery powered and owing to the limited available power transmitting at high power is not generally possible. Moreover, a significant proportion of these M3N devices will be deployed in 'hard to reach' radio locations in basements or underground. Consequently, the majority of M3N endpoints will have to handle significant path loss, which will directly limit their radio range. As a consequence, this situation will lead to a very dense network of access routers (layer 3) to make sure that even range-limited nodes are able to reach the network with a correct reliability.
Access routers, for their part, are planned to be deployed in a situation where they receive clear signals from the core network (layer 2). They will most likely be installed on external building walls, on public lightning or urban furniture. Deployment in such public spaces will likely imply significant antenna constraints, at least in urban environment, that will forbid access routers to take advantage of high-gain antennas to help them receive weak signals from an endpoint.
In this annex, two radio links are modelled:
• Link between gateway and core router, or between core router and core router.
• Link between endpoint and access router or access router to core router.
The propagation model used is the well known COST-Wallfisch - Ikegami model (COST-WI) established by COST 231 [i.9] final report and used as a reference for GSM deployment in Europe.
Both of those use cases were applied in a medium sized city with the following hypotheses, which are considered as relevant to model radio propagation and path loss in small urban cell, and microcell. Those hypotheses are:
• Router height: 1m above top of building roof.
• Average roof building height: 20 m.
• Mobile height: 1 m above ground lever.
• Street width: 13 m.
• Building separation distance: 26 m.
A.2 Gateway - router and router - router link In this clause, we consider a Line of Sight (LOS) and a Non-Line of Sight (NLOS) situation, both in urban area. Gateway and router antenna are assumed to be installed at building roof level, or just above (gateway) or below (core router). Antenna used by those devices are considered as omni-directional (G = 0 dBi). Other receiver parameters are relevant when compared to existing devices with similar cost and energy constraint.
As gateways and some of the core routers are expected to be installed at the roof level or above, urban LOS situations are perfectly possible. This situation is modelled by the Wallfisch Ikegami model for Urban LOS, which is just 4 dB worse than regular free space model. Antennas are considered as omni-directional, (0 dBi). As expected, it leads to a very comfortable link margin (+44 dB) for a typical 75 m range, whatever the EIRP limit is.
When it comes to the NLOS situation, that can occur when a taller building sits between the devices, or when the router is installed below roof level (as installation at the top of the roof is often impossible), we classically consider an increased but reasonable attenuation factor (3.5) and add a 10 dB of shadowing. All other hypotheses remain similar to the LOS case. Under these conditions and despite the short range used (75 m), the situation is far less comfortable. The link margin is reduced to 9 dB which is below the commonly accepted value of 15 dB for a reliable link. A margin of 15 dB can only be achieved with 100 mW EIRP.
ETSI
ETSI TR 103 055 V1.1.1 (2011-09) 20
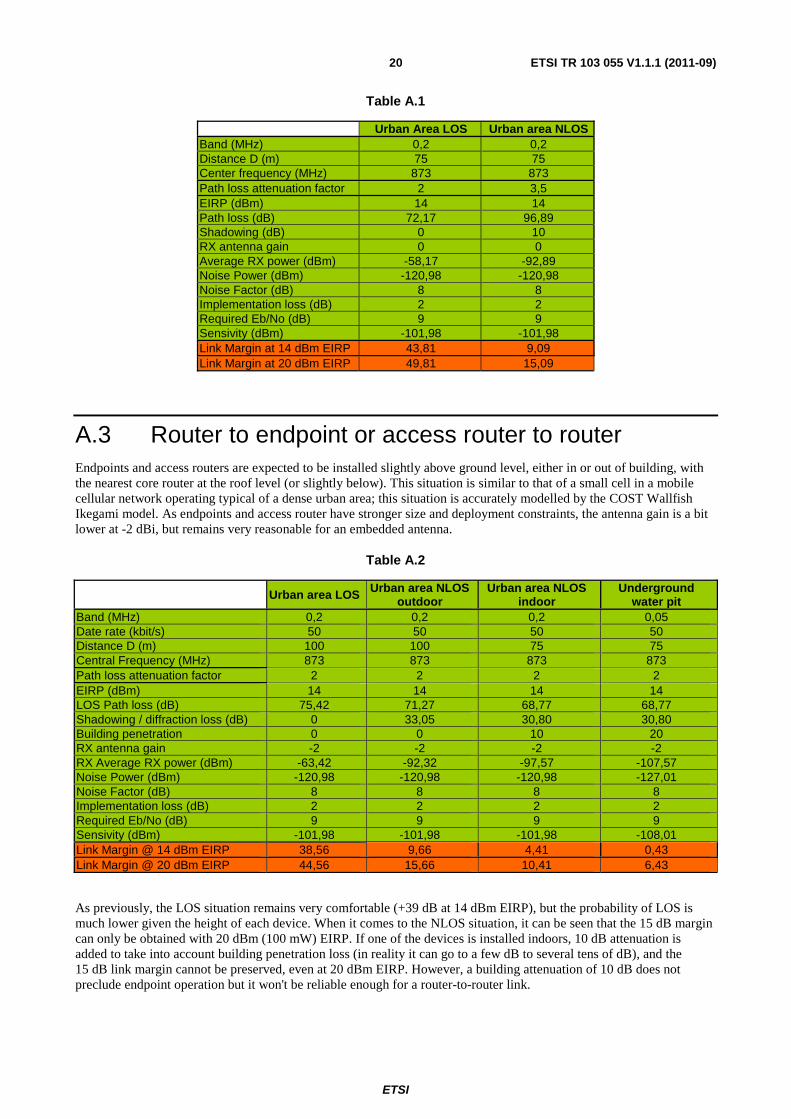
Table A.1
Urban Area LOS Urban area NLOS Band (MHz) 0,2 0,2 Distance D (m) 75 75 Center frequency (MHz) 873 873 Path loss attenuation factor 2 3,5 EIRP (dBm) 14 14 Path loss (dB) 72,17 96,89 Shadowing (dB) 0 10 RX antenna gain 0 0 Average RX power (dBm) -58,17 -92,89 Noise Power (dBm) -120,98 -120,98 Noise Factor (dB) 8 8 Implementation loss (dB) 2 2 Required Eb/No (dB) 9 9 Sensivity (dBm) -101,98 -101,98 Link Margin at 14 dBm EIRP 43,81 9,09 Link Margin at 20 dBm EIRP 49,81 15,09
A.3 Router to endpoint or access router to router Endpoints and access routers are expected to be installed slightly above ground level, either in or out of building, with the nearest core router at the roof level (or slightly below). This situation is similar to that of a small cell in a mobile cellular network operating typical of a dense urban area; this situation is accurately modelled by the COST Wallfish Ikegami model. As endpoints and access router have stronger size and deployment constraints, the antenna gain is a bit lower at -2 dBi, but remains very reasonable for an embedded antenna.
Table A.2
Urban area LOS Urban area NLOS outdoor
Urban area NLOS indoor
Underground water pit
Band (MHz) 0,2 0,2 0,2 0,05 Date rate (kbit/s) 50 50 50 50 Distance D (m) 100 100 75 75 Central Frequency (MHz) 873 873 873 873 Path loss attenuation factor 2 2 2 2 EIRP (dBm) 14 14 14 14 LOS Path loss (dB) 75,42 71,27 68,77 68,77 Shadowing / diffraction loss (dB) 0 33,05 30,80 30,80 Building penetration 0 0 10 20 RX antenna gain -2 -2 -2 -2 RX Average RX power (dBm) -63,42 -92,32 -97,57 -107,57 Noise Power (dBm) -120,98 -120,98 -120,98 -127,01 Noise Factor (dB) 8 8 8 8 Implementation loss (dB) 2 2 2 2 Required Eb/No (dB) 9 9 9 9 Sensivity (dBm) -101,98 -101,98 -101,98 -108,01 Link Margin @ 14 dBm EIRP 38,56 9,66 4,41 0,43 Link Margin @ 20 dBm EIRP 44,56 15,66 10,41 6,43
As previously, the LOS situation remains very comfortable (+39 dB at 14 dBm EIRP), but the probability of LOS is much lower given the height of each device. When it comes to the NLOS situation, it can be seen that the 15 dB margin can only be obtained with 20 dBm (100 mW) EIRP. If one of the devices is installed indoors, 10 dB attenuation is added to take into account building penetration loss (in reality it can go to a few dB to several tens of dB), and the 15 dB link margin cannot be preserved, even at 20 dBm EIRP. However, a building attenuation of 10 dB does not preclude endpoint operation but it won't be reliable enough for a router-to-router link.

ETSI
ETSI TR 103 055 V1.1.1 (2011-09) 21
Endpoints situated below ground e.g. water pit with a cast manhole cover, present particularly difficult transmission conditions. Here, without taking advantage of the better reception possible with narrowband receivers and the increased EIRP of 100 mW it would not be possible to overcome the additional 20 dB of loss for this type of installation and maintain a reliable link. This bandwidth reduction automatically implies a reduction of the available throughput on the link between the endpoint and his access router. This throughput reduction will only affect this single link, and not the whole data path in the mesh network, and will happen only on link affected by a very important path loss, such as end-point installed in very hard to reach location like water pit. This represents only a small amount of endpoint (see clause C.2). Consequently, the impact of this data rate reduction will not have a strong impact on the network organisation.
ETSI
ETSI TR 103 055 V1.1.1 (2011-09) 22
Annex B: Synchronization rate / Preamble length trade-off
B.1 Introduction The goal of this annex is to study the impact of the synchronization rate on the mean energy consumption of devices in synchronized networks. Preamble sampling techniques are often used to assure the requirements of real-time bi-directional communication and low-power are achieved. These are discussed below.
B.1.1 Preamble Sampling Technique One of the main challenges of MAC layers is to avoid the consequences of Idle Listening which results in wasted energy. Idle Listening occurs when a node is actively receiving but there is no communication on the channel. The energy consumption is the same whether communication happens or not.
Preamble sampling is a well-known technique for eliminating Idle Listening. It is based on Active/Idle low-duty cycles ranging from below 0,1 % to over 1 % and dramatically shifts the cost of coping with Idle Listening from the receiver to the transmitter by using long wake-up preambles. This technique is acceptable for the M3N applications which require only a few transmissions per day.
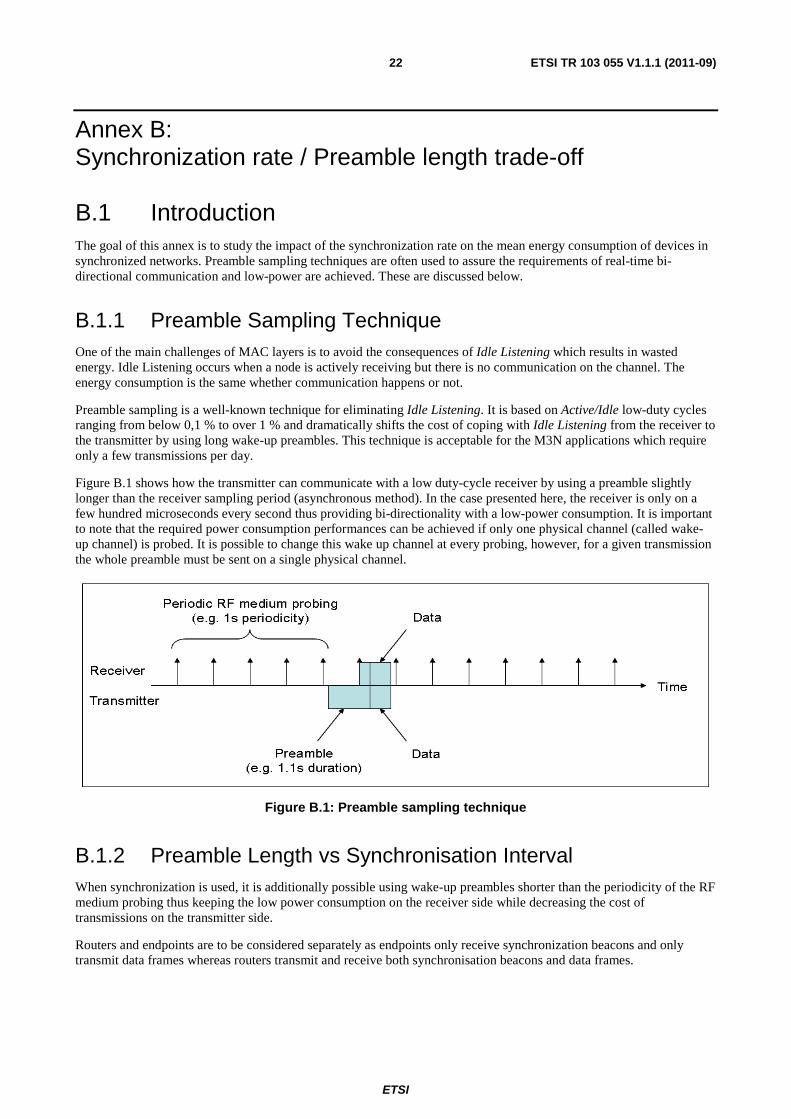
Figure B.1 shows how the transmitter can communicate with a low duty-cycle receiver by using a preamble slightly longer than the receiver sampling period (asynchronous method). In the case presented here, the receiver is only on a few hundred microseconds every second thus providing bi-directionality with a low-power consumption. It is important to note that the required power consumption performances can be achieved if only one physical channel (called wake-up channel) is probed. It is possible to change this wake up channel at every probing, however, for a given transmission the whole preamble must be sent on a single physical channel.
Figure B.1: Preamble sampling technique
B.1.2 Preamble Length vs Synchronisation Interval When synchronization is used, it is additionally possible using wake-up preambles shorter than the periodicity of the RF medium probing thus keeping the low power consumption on the receiver side while decreasing the cost of transmissions on the transmitter side.
Routers and endpoints are to be considered separately as endpoints only receive synchronization beacons and only transmit data frames whereas routers transmit and receive both synchronisation beacons and data frames.

ETSI
ETSI TR 103 055 V1.1.1 (2011-09) 23
To minimise the energy associated with network traffic, a compromise has to be made between the beacon transmission rate and the length of the packet preamble. Synchronisation overhead is the transmission/reception of synchronisation beacons and higher synchronisation beacon transmission rates allow the use of shorter wake-up preambles. For a given traffic load and number of devices it is possible to find an optimal synchronisation beacon rate and wake up preamble length which minimises energy consumption.
The preamble duration required is tightly linked to the stability of the crystal oscillator used as time reference on the devices. This stability is determined by the precision of the oscillator but also by its dynamic behaviour in temperature. This second point is of primary importance in the M3N context as two devices submitted to drastically different temperatures (one at 25 °C and the other at -20 °C represent a worst case) must be able to communicate during the complete interval between two synchronization beacons.
The study was performed assuming 20 ppm crystal oscillators as a compromise between stability and cost. It is also considered that crystal oscillator is calibrated in production on a single temperature. Better results could be obtained by calibrating over two temperatures but would lead to technical issues and prohibitive production costs. As a consequence, the turnover temperature error and the frequency vs temperature curve error are not corrected.
Table B.1 shows the expected preamble length for various synchronisation periods. A synchronisation period of N minutes is represented as MAC-N.
Table B.1: MAC (N) Synchronisation interval vs Preamble length
Synchronization interval (mn) Preamble length (ms) MAC 90 90 240 MAC 45 45 120 MAC 15 15 40 MAC 9 9 24 MAC 3 3 8 MAC 1 1 3
B.2 Hypotheses The considered parameters used are:
• Tx current: 45 mA.
• Rx current: 20 mA.
• Standby current: 3 µA.
• Synchronization beacon duration: 25 ms.
• Sampling period: 1 s.
• Sampling duration: 500 µs.
Table B.2 presents the mean current consumption implied by the transmission and the reception of synchronization beacons. These consumptions are independent of the number of transmissions but it is to be noted that an endpoint only receives beacons and a router transmits and receives beacons.
Table B.2: Mean beacon current consumption (µA)
Synchronization beacon transmission mean current (µA)
Synchronization beacon reception mean current (µA)
MAC 90 0,21 0,27 MAC 45 0,42 0,36 MAC 15 1,25 0,73 MAC 9 2,08 1,10 MAC 3 6,25 2,96 MAC 1 18,75 8,53
ETSI
ETSI TR 103 055 V1.1.1 (2011-09) 24
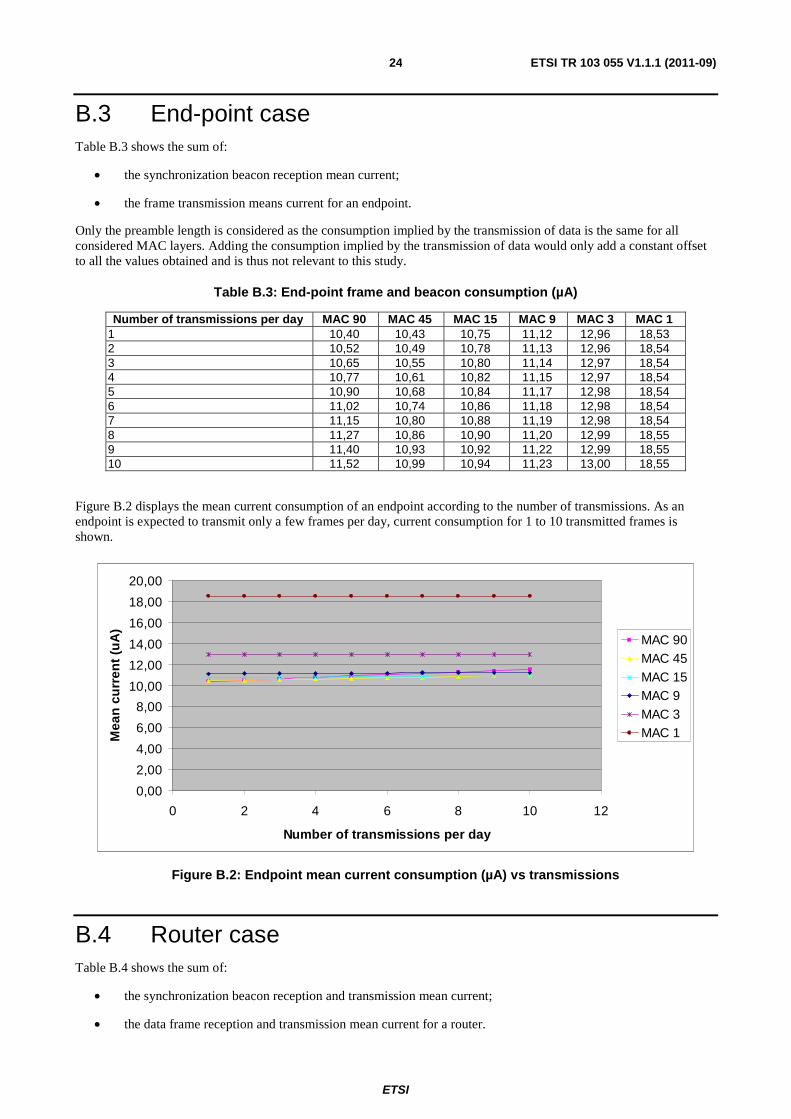
B.3 End-point case Table B.3 shows the sum of:
• the synchronization beacon reception mean current;
• the frame transmission means current for an endpoint.
Only the preamble length is considered as the consumption implied by the transmission of data is the same for all considered MAC layers. Adding the consumption implied by the transmission of data would only add a constant offset to all the values obtained and is thus not relevant to this study.
Table B.3: End-point frame and beacon consumption (µA)
Number of transmissions per day MAC 90 MAC 45 MAC 15 MAC 9 MAC 3 MAC 1 1 10,40 10,43 10,75 11,12 12,96 18,53 2 10,52 10,49 10,78 11,13 12,96 18,54 3 10,65 10,55 10,80 11,14 12,97 18,54 4 10,77 10,61 10,82 11,15 12,97 18,54 5 10,90 10,68 10,84 11,17 12,98 18,54 6 11,02 10,74 10,86 11,18 12,98 18,54 7 11,15 10,80 10,88 11,19 12,98 18,54 8 11,27 10,86 10,90 11,20 12,99 18,55 9 11,40 10,93 10,92 11,22 12,99 18,55 10 11,52 10,99 10,94 11,23 13,00 18,55
Figure B.2 displays the mean current consumption of an endpoint according to the number of transmissions. As an endpoint is expected to transmit only a few frames per day, current consumption for 1 to 10 transmitted frames is shown.
0,00
2,00
4,00
6,00
8,00
10,00
12,00
14,00
16,00
18,00
20,00
0 2 4 6 8 10 12
Number of transmissions per day
Mea
n c
urr
ent
(uA
)
MAC 90MAC 45MAC 15MAC 9MAC 3MAC 1
Figure B.2: Endpoint mean current consumption (µA) vs transmissions
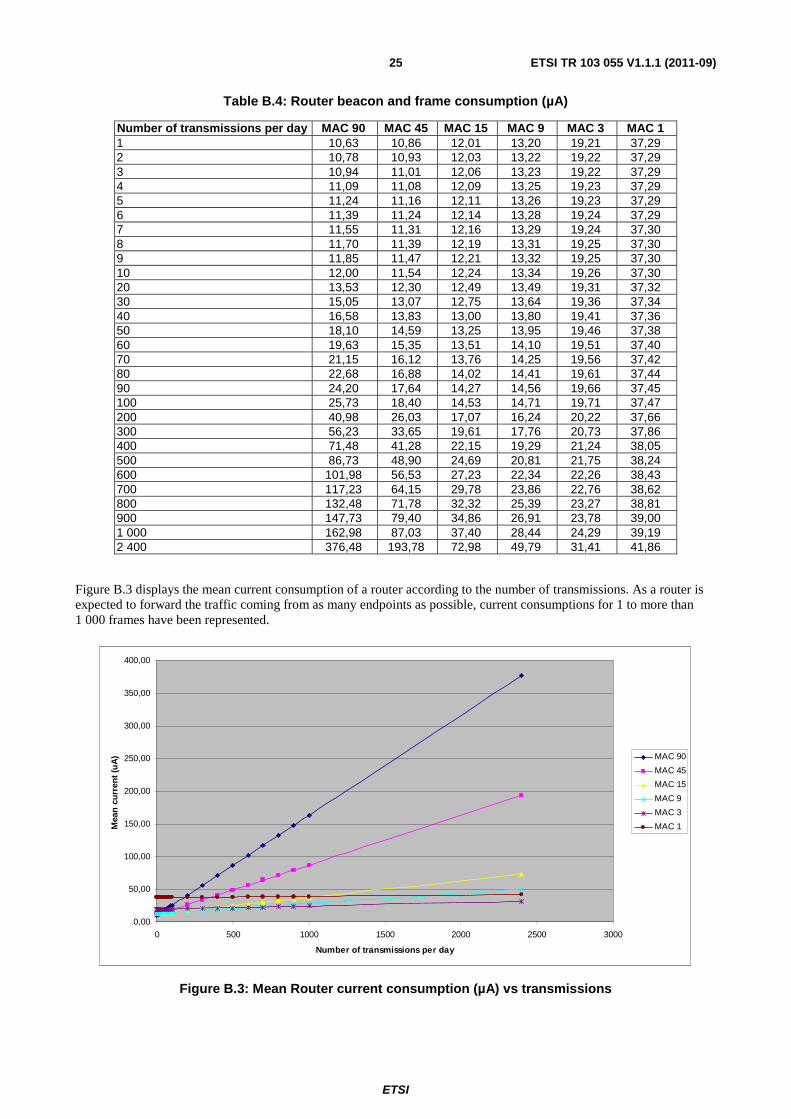
B.4 Router case Table B.4 shows the sum of:
• the synchronization beacon reception and transmission mean current;
• the data frame reception and transmission mean current for a router.
ETSI
ETSI TR 103 055 V1.1.1 (2011-09) 25
Table B.4: Router beacon and frame consumption (µA)
Number of transmissions per day MAC 90 MAC 45 MAC 15 MAC 9 MAC 3 MAC 1 1 10,63 10,86 12,01 13,20 19,21 37,29 2 10,78 10,93 12,03 13,22 19,22 37,29 3 10,94 11,01 12,06 13,23 19,22 37,29 4 11,09 11,08 12,09 13,25 19,23 37,29 5 11,24 11,16 12,11 13,26 19,23 37,29 6 11,39 11,24 12,14 13,28 19,24 37,29 7 11,55 11,31 12,16 13,29 19,24 37,30 8 11,70 11,39 12,19 13,31 19,25 37,30 9 11,85 11,47 12,21 13,32 19,25 37,30 10 12,00 11,54 12,24 13,34 19,26 37,30 20 13,53 12,30 12,49 13,49 19,31 37,32 30 15,05 13,07 12,75 13,64 19,36 37,34 40 16,58 13,83 13,00 13,80 19,41 37,36 50 18,10 14,59 13,25 13,95 19,46 37,38 60 19,63 15,35 13,51 14,10 19,51 37,40 70 21,15 16,12 13,76 14,25 19,56 37,42 80 22,68 16,88 14,02 14,41 19,61 37,44 90 24,20 17,64 14,27 14,56 19,66 37,45 100 25,73 18,40 14,53 14,71 19,71 37,47 200 40,98 26,03 17,07 16,24 20,22 37,66 300 56,23 33,65 19,61 17,76 20,73 37,86 400 71,48 41,28 22,15 19,29 21,24 38,05 500 86,73 48,90 24,69 20,81 21,75 38,24 600 101,98 56,53 27,23 22,34 22,26 38,43 700 117,23 64,15 29,78 23,86 22,76 38,62 800 132,48 71,78 32,32 25,39 23,27 38,81 900 147,73 79,40 34,86 26,91 23,78 39,00 1 000 162,98 87,03 37,40 28,44 24,29 39,19 2 400 376,48 193,78 72,98 49,79 31,41 41,86
Figure B.3 displays the mean current consumption of a router according to the number of transmissions. As a router is expected to forward the traffic coming from as many endpoints as possible, current consumptions for 1 to more than 1 000 frames have been represented.
0,00
50,00
100,00
150,00
200,00
250,00
300,00
350,00
400,00
0 500 1000 1500 2000 2500 3000
Number of transmissions per day
Mea
n c
urr
ent
(uA
) MAC 90
MAC 45
MAC 15
MAC 9
MAC 3
MAC 1
Figure B.3: Mean Router current consumption (µA) vs transmissions
ETSI
ETSI TR 103 055 V1.1.1 (2011-09) 26
B.5 Conclusions First of all, this study highlights the fact that MAC-15 has a satisfactory behaviour in terms of power consumption in both the endpoint and router cases.
However, the optimal choice of synchronization interval will be application dependent and the resulting preamble length may exceed the 40 ms of MAC 15. Such flexibility would allow better power consumption performance to be achieved from battery powered devices.
Nevertheless, in both cases, preamble duration, on a single physical channel, has to last more than 25 ms.
As a conclusion, the Ton limitation to 25 ms which allows coexistence with GSM-R on the 873 MHz to 876 MHz band forbids the usage of preamble sampling in synchronized networks optimized for the expected M3N traffic load. Consequently, implementation of low-power real-time bi-directional networks is not compatible with this Ton limitation.
This conclusion is reinforced by the facts that:
• data transmission duration has not yet been taken into account;
• relaxed hypothesis about the quartz stability would lead to longer preambles.

ETSI
ETSI TR 103 055 V1.1.1 (2011-09) 27
Annex C: Technical Requirements
C.1 Applications description Urban sensor networks support a wide range of applications including:
• Water and gas smart metering.
• Electric smart metering.
• Waste management.
• Air pollution monitoring and alerting.
• Acoustic noise monitoring.
• Public lighting monitoring and control.
• Parking Management System.
• Self service bike renting.
Today, a dedicated proprietary network is usually used to support each of these applications. Here we consider a multipurpose network able to support many or even all of these diverse applications.
The traffic carried by the network will be the superimposition of that required by each application. The network must be designed and managed such that energy-limited nodes are not depleted by non-essential traffic.
Quality of Service (QoS) must be designed in such that critical applications are not perturbed by non-critical ones.
Energy-rich nodes can contribute to the common network by lending their resources.
We will first enumerate the requirements of these various applications, as well as some of the characteristics of the networks that currently support these applications, when applicable. All application examples below are given for an average mid-sized city: 150 000 inhabitants, 20 km².
The descriptions of the applications and the associated figures presented below are taken from a compilation of documents, describing services requirements, [i.11], [i.12], [i.13] or projections coming from research projects [i.14] or standardization projects [i.15], [i.16], [i.17].
C.1.1 Water/gas metering Traffic from Water/Gas Metering applications is mostly data collection for billing purposes.
However, there are several other requirements on a very infrequent basis for:
• alarms (e.g. leakage detection in water metering or fraud detection);
• control data pushed to the nodes including actuators for closing valves or credit-based systems;
• on-demand reading of the meter in a real-time manner.
The essential parameters are recorded in table C.1.
ETSI
ETSI TR 103 055 V1.1.1 (2011-09) 28
Table C.1: Water Gas Metering requirements
Bi-directional Communication
Required
Sensing rate 1/hour to 4/hour Sensor transmission rate 1/day to 4/hour, periodic and occasional alarm
Several/hours: 10 bytes per report Once /day: 200 bytes + wake up preamble (optional) Tolerated latency 300 s
On-demand read and actuation
1 cycle/week maximum, 1/year expected 10 bytes per transmission Tolerated loss 10E-2 Tolerated latency 30 s
P2MP traffic Wall clock adj 1/day (this is a max) Key management 1/year
NOTE: Non-electrical utilities do not like to rely on electrical utility link. Nor do they like to rely on (x)DSL line.
C.1.2 Electricity smart metering This topic is already comprehensively addressed in TR 102 886 [i.1].
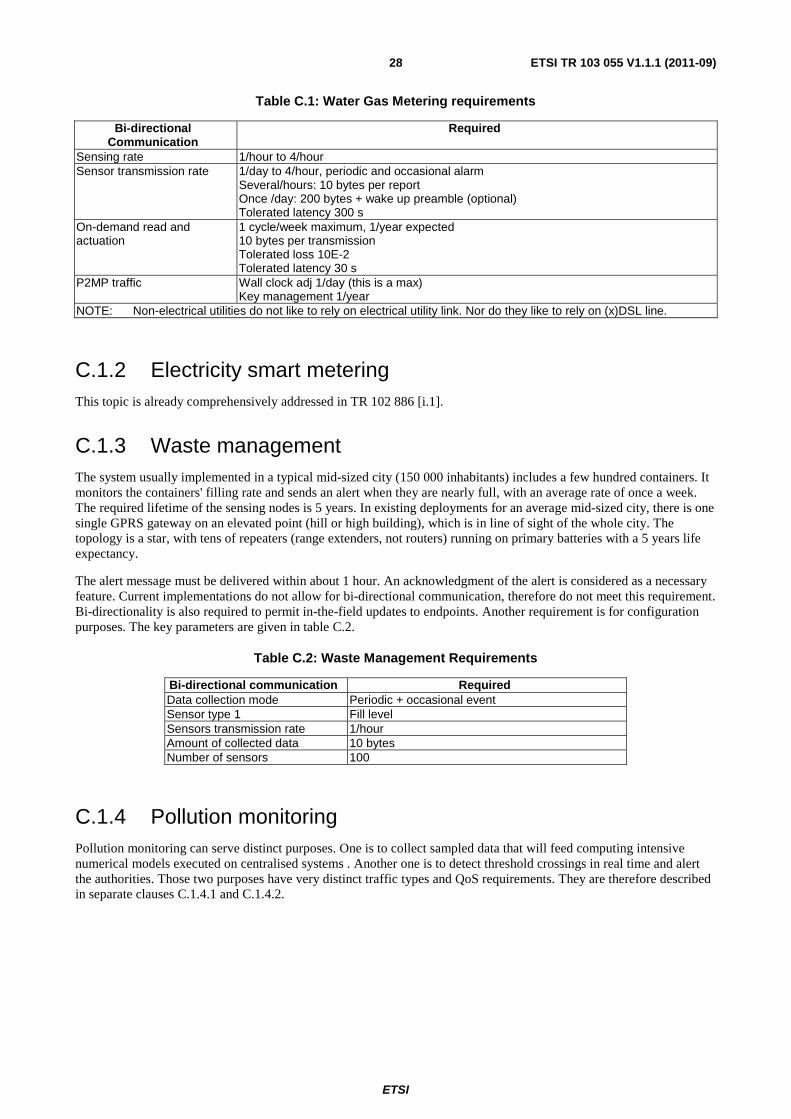
C.1.3 Waste management The system usually implemented in a typical mid-sized city (150 000 inhabitants) includes a few hundred containers. It monitors the containers' filling rate and sends an alert when they are nearly full, with an average rate of once a week. The required lifetime of the sensing nodes is 5 years. In existing deployments for an average mid-sized city, there is one single GPRS gateway on an elevated point (hill or high building), which is in line of sight of the whole city. The topology is a star, with tens of repeaters (range extenders, not routers) running on primary batteries with a 5 years life expectancy.
The alert message must be delivered within about 1 hour. An acknowledgment of the alert is considered as a necessary feature. Current implementations do not allow for bi-directional communication, therefore do not meet this requirement. Bi-directionality is also required to permit in-the-field updates to endpoints. Another requirement is for configuration purposes. The key parameters are given in table C.2.
Table C.2: Waste Management Requirements
Bi-directional communication Required Data collection mode Periodic + occasional event Sensor type 1 Fill level Sensors transmission rate 1/hour Amount of collected data 10 bytes Number of sensors 100
C.1.4 Pollution monitoring Pollution monitoring can serve distinct purposes. One is to collect sampled data that will feed computing intensive numerical models executed on centralised systems . Another one is to detect threshold crossings in real time and alert the authorities. Those two purposes have very distinct traffic types and QoS requirements. They are therefore described in separate clauses C.1.4.1 and C.1.4.2.
ETSI
ETSI TR 103 055 V1.1.1 (2011-09) 29
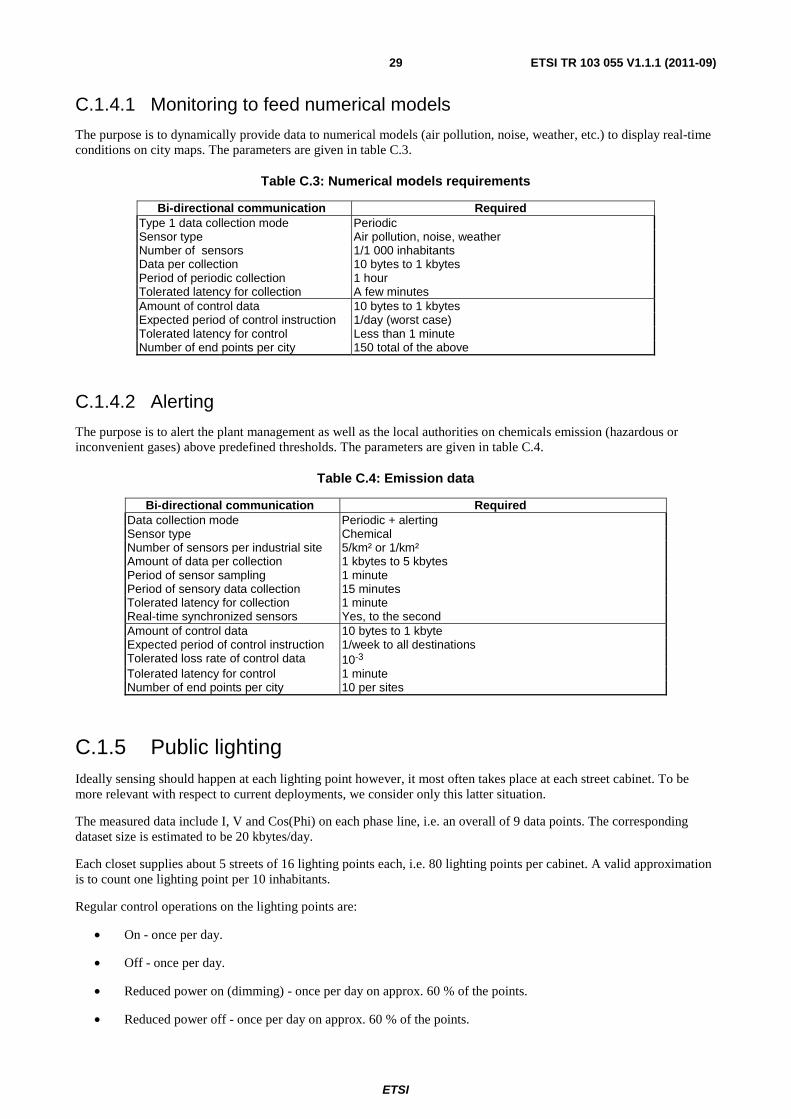
C.1.4.1 Monitoring to feed numerical models
The purpose is to dynamically provide data to numerical models (air pollution, noise, weather, etc.) to display real-time conditions on city maps. The parameters are given in table C.3.
Table C.3: Numerical models requirements
Bi-directional communication Required Type 1 data collection mode Periodic Sensor type Air pollution, noise, weather Number of sensors 1/1 000 inhabitants Data per collection 10 bytes to 1 kbytes Period of periodic collection 1 hour Tolerated latency for collection A few minutes Amount of control data 10 bytes to 1 kbytes Expected period of control instruction 1/day (worst case) Tolerated latency for control Less than 1 minute Number of end points per city 150 total of the above
C.1.4.2 Alerting
The purpose is to alert the plant management as well as the local authorities on chemicals emission (hazardous or inconvenient gases) above predefined thresholds. The parameters are given in table C.4.
Table C.4: Emission data
Bi-directional communication Required Data collection mode Periodic + alerting Sensor type Chemical Number of sensors per industrial site 5/km² or 1/km² Amount of data per collection 1 kbytes to 5 kbytes Period of sensor sampling 1 minute Period of sensory data collection 15 minutes Tolerated latency for collection 1 minute Real-time synchronized sensors Yes, to the second Amount of control data 10 bytes to 1 kbyte Expected period of control instruction 1/week to all destinations Tolerated loss rate of control data 10-3 Tolerated latency for control 1 minute Number of end points per city 10 per sites
C.1.5 Public lighting Ideally sensing should happen at each lighting point however, it most often takes place at each street cabinet. To be more relevant with respect to current deployments, we consider only this latter situation.
The measured data include I, V and Cos(Phi) on each phase line, i.e. an overall of 9 data points. The corresponding dataset size is estimated to be 20 kbytes/day.
Each closet supplies about 5 streets of 16 lighting points each, i.e. 80 lighting points per cabinet. A valid approximation is to count one lighting point per 10 inhabitants.
Regular control operations on the lighting points are:
• On - once per day.
• Off - once per day.
• Reduced power on (dimming) - once per day on approx. 60 % of the points.
• Reduced power off - once per day on approx. 60 % of the points.
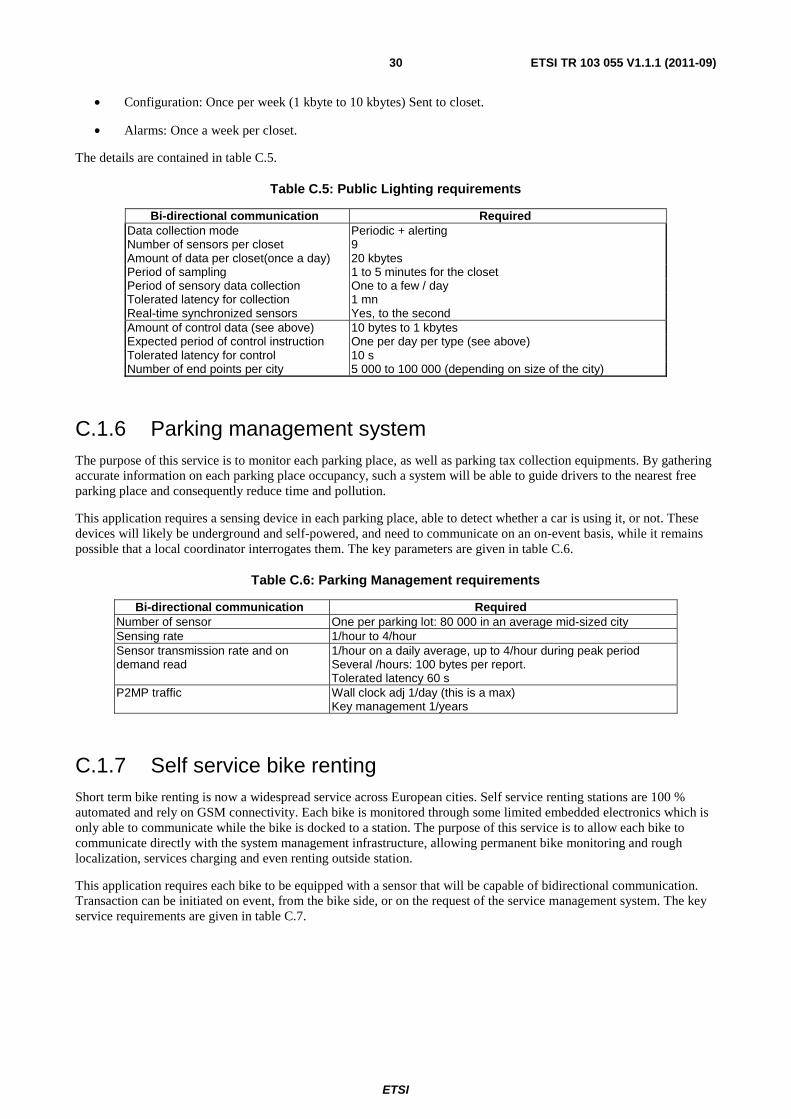
ETSI
ETSI TR 103 055 V1.1.1 (2011-09) 30
• Configuration: Once per week (1 kbyte to 10 kbytes) Sent to closet.
• Alarms: Once a week per closet.
The details are contained in table C.5.
Table C.5: Public Lighting requirements
Bi-directional communication Required Data collection mode Periodic + alerting Number of sensors per closet 9 Amount of data per closet(once a day) 20 kbytes Period of sampling 1 to 5 minutes for the closet Period of sensory data collection One to a few / day Tolerated latency for collection 1 mn Real-time synchronized sensors Yes, to the second Amount of control data (see above) 10 bytes to 1 kbytes Expected period of control instruction One per day per type (see above) Tolerated latency for control 10 s Number of end points per city 5 000 to 100 000 (depending on size of the city)
C.1.6 Parking management system The purpose of this service is to monitor each parking place, as well as parking tax collection equipments. By gathering accurate information on each parking place occupancy, such a system will be able to guide drivers to the nearest free parking place and consequently reduce time and pollution.
This application requires a sensing device in each parking place, able to detect whether a car is using it, or not. These devices will likely be underground and self-powered, and need to communicate on an on-event basis, while it remains possible that a local coordinator interrogates them. The key parameters are given in table C.6.
Table C.6: Parking Management requirements
Bi-directional communication Required Number of sensor One per parking lot: 80 000 in an average mid-sized city Sensing rate 1/hour to 4/hour Sensor transmission rate and on demand read
1/hour on a daily average, up to 4/hour during peak period Several /hours: 100 bytes per report. Tolerated latency 60 s
P2MP traffic Wall clock adj 1/day (this is a max) Key management 1/years
C.1.7 Self service bike renting Short term bike renting is now a widespread service across European cities. Self service renting stations are 100 % automated and rely on GSM connectivity. Each bike is monitored through some limited embedded electronics which is only able to communicate while the bike is docked to a station. The purpose of this service is to allow each bike to communicate directly with the system management infrastructure, allowing permanent bike monitoring and rough localization, services charging and even renting outside station.
This application requires each bike to be equipped with a sensor that will be capable of bidirectional communication. Transaction can be initiated on event, from the bike side, or on the request of the service management system. The key service requirements are given in table C.7.
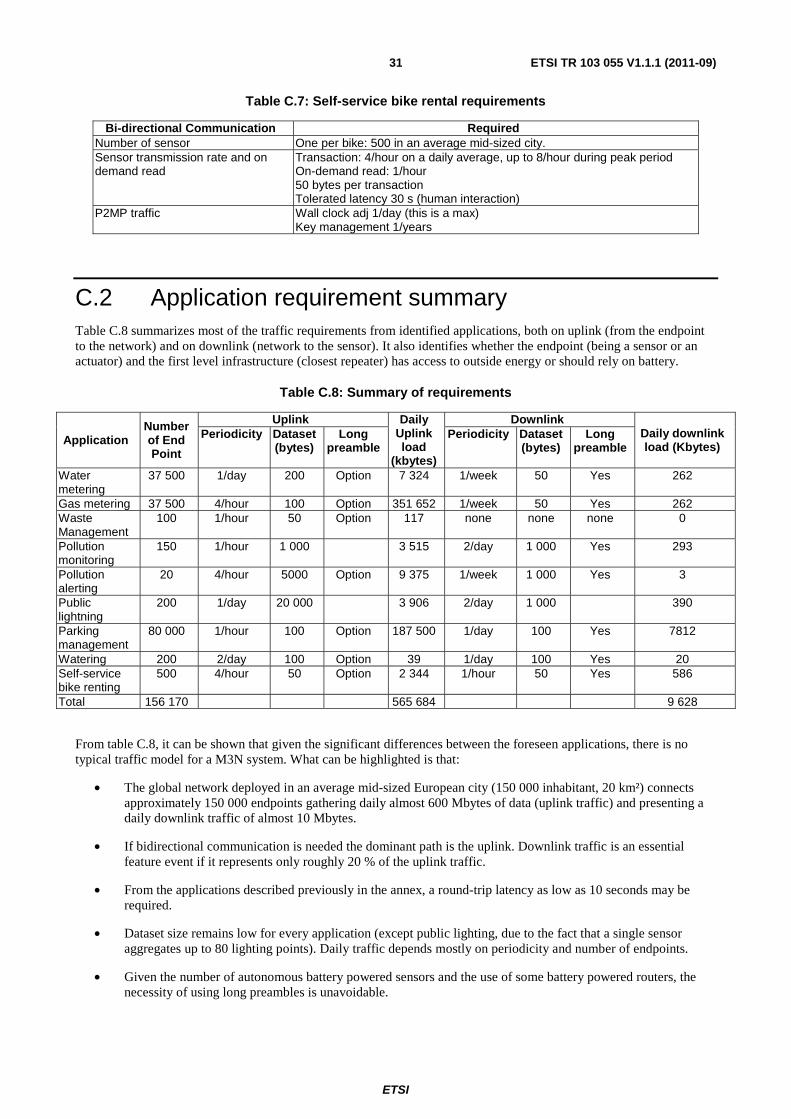
ETSI
ETSI TR 103 055 V1.1.1 (2011-09) 31
Table C.7: Self-service bike rental requirements
Bi-directional Communication Required Number of sensor One per bike: 500 in an average mid-sized city. Sensor transmission rate and on demand read
Transaction: 4/hour on a daily average, up to 8/hour during peak period On-demand read: 1/hour 50 bytes per transaction Tolerated latency 30 s (human interaction)
P2MP traffic Wall clock adj 1/day (this is a max) Key management 1/years
C.2 Application requirement summary Table C.8 summarizes most of the traffic requirements from identified applications, both on uplink (from the endpoint to the network) and on downlink (network to the sensor). It also identifies whether the endpoint (being a sensor or an actuator) and the first level infrastructure (closest repeater) has access to outside energy or should rely on battery.
Table C.8: Summary of requirements
Application Number of End Point
Uplink Daily Uplink load
(kbytes)
Downlink Daily downlink load (Kbytes)
Periodicity Dataset (bytes)
Long preamble
Periodicity Dataset (bytes)
Long preamble
Water metering
37 500 1/day 200 Option 7 324 1/week 50 Yes 262
Gas metering 37 500 4/hour 100 Option 351 652 1/week 50 Yes 262 Waste Management
100 1/hour 50 Option 117 none none none 0
Pollution monitoring
150 1/hour 1 000 3 515 2/day 1 000 Yes 293
Pollution alerting
20 4/hour 5000 Option 9 375 1/week 1 000 Yes 3
Public lightning
200 1/day 20 000 3 906 2/day 1 000 390
Parking management
80 000 1/hour 100 Option 187 500 1/day 100 Yes 7812
Watering 200 2/day 100 Option 39 1/day 100 Yes 20 Self-service bike renting
500 4/hour 50 Option 2 344 1/hour 50 Yes 586
Total 156 170 565 684 9 628
From table C.8, it can be shown that given the significant differences between the foreseen applications, there is no typical traffic model for a M3N system. What can be highlighted is that:
• The global network deployed in an average mid-sized European city (150 000 inhabitant, 20 km²) connects approximately 150 000 endpoints gathering daily almost 600 Mbytes of data (uplink traffic) and presenting a daily downlink traffic of almost 10 Mbytes.
• If bidirectional communication is needed the dominant path is the uplink. Downlink traffic is an essential feature event if it represents only roughly 20 % of the uplink traffic.
• From the applications described previously in the annex, a round-trip latency as low as 10 seconds may be required.
• Dataset size remains low for every application (except public lighting, due to the fact that a single sensor aggregates up to 80 lighting points). Daily traffic depends mostly on periodicity and number of endpoints.
• Given the number of autonomous battery powered sensors and the use of some battery powered routers, the necessity of using long preambles is unavoidable.
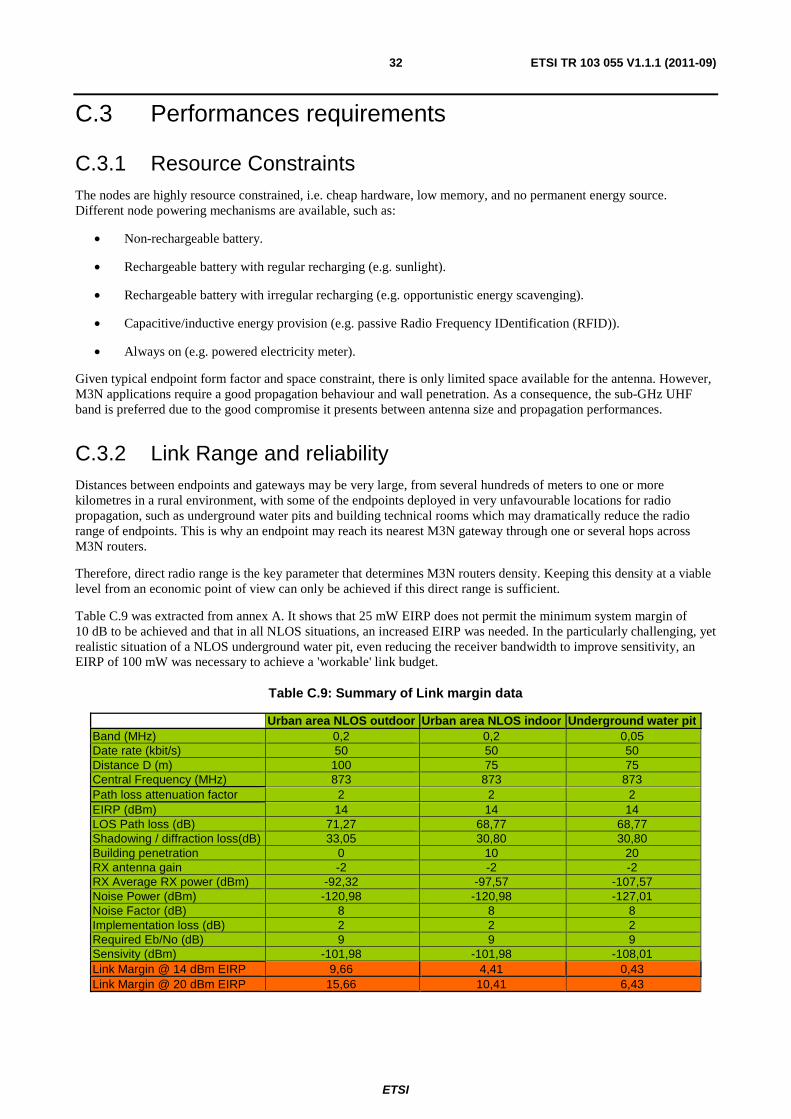
ETSI
ETSI TR 103 055 V1.1.1 (2011-09) 32
C.3 Performances requirements
C.3.1 Resource Constraints The nodes are highly resource constrained, i.e. cheap hardware, low memory, and no permanent energy source. Different node powering mechanisms are available, such as:
• Non-rechargeable battery.
• Rechargeable battery with regular recharging (e.g. sunlight).
• Rechargeable battery with irregular recharging (e.g. opportunistic energy scavenging).
• Capacitive/inductive energy provision (e.g. passive Radio Frequency IDentification (RFID)).
• Always on (e.g. powered electricity meter).
Given typical endpoint form factor and space constraint, there is only limited space available for the antenna. However, M3N applications require a good propagation behaviour and wall penetration. As a consequence, the sub-GHz UHF band is preferred due to the good compromise it presents between antenna size and propagation performances.
C.3.2 Link Range and reliability Distances between endpoints and gateways may be very large, from several hundreds of meters to one or more kilometres in a rural environment, with some of the endpoints deployed in very unfavourable locations for radio propagation, such as underground water pits and building technical rooms which may dramatically reduce the radio range of endpoints. This is why an endpoint may reach its nearest M3N gateway through one or several hops across M3N routers.
Therefore, direct radio range is the key parameter that determines M3N routers density. Keeping this density at a viable level from an economic point of view can only be achieved if this direct range is sufficient.
Table C.9 was extracted from annex A. It shows that 25 mW EIRP does not permit the minimum system margin of 10 dB to be achieved and that in all NLOS situations, an increased EIRP was needed. In the particularly challenging, yet realistic situation of a NLOS underground water pit, even reducing the receiver bandwidth to improve sensitivity, an EIRP of 100 mW was necessary to achieve a 'workable' link budget.
Table C.9: Summary of Link margin data
Urban area NLOS outdoor Urban area NLOS indoor Underground water pit Band (MHz) 0,2 0,2 0,05 Date rate (kbit/s) 50 50 50 Distance D (m) 100 75 75 Central Frequency (MHz) 873 873 873 Path loss attenuation factor 2 2 2 EIRP (dBm) 14 14 14 LOS Path loss (dB) 71,27 68,77 68,77 Shadowing / diffraction loss(dB) 33,05 30,80 30,80 Building penetration 0 10 20 RX antenna gain -2 -2 -2 RX Average RX power (dBm) -92,32 -97,57 -107,57 Noise Power (dBm) -120,98 -120,98 -127,01 Noise Factor (dB) 8 8 8 Implementation loss (dB) 2 2 2 Required Eb/No (dB) 9 9 9 Sensivity (dBm) -101,98 -101,98 -108,01 Link Margin @ 14 dBm EIRP 9,66 4,41 0,43 Link Margin @ 20 dBm EIRP 15,66 10,41 6,43
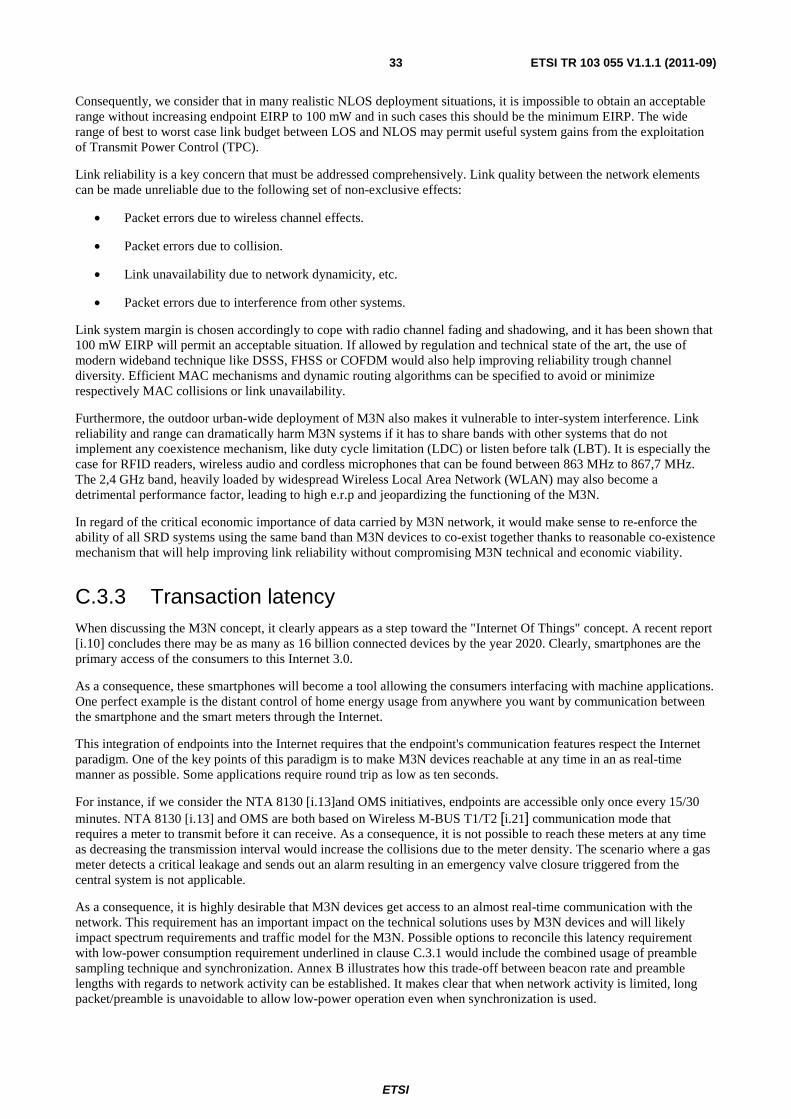
ETSI
ETSI TR 103 055 V1.1.1 (2011-09) 33
Consequently, we consider that in many realistic NLOS deployment situations, it is impossible to obtain an acceptable range without increasing endpoint EIRP to 100 mW and in such cases this should be the minimum EIRP. The wide range of best to worst case link budget between LOS and NLOS may permit useful system gains from the exploitation of Transmit Power Control (TPC).
Link reliability is a key concern that must be addressed comprehensively. Link quality between the network elements can be made unreliable due to the following set of non-exclusive effects:
• Packet errors due to wireless channel effects.
• Packet errors due to collision.
• Link unavailability due to network dynamicity, etc.
• Packet errors due to interference from other systems.
Link system margin is chosen accordingly to cope with radio channel fading and shadowing, and it has been shown that 100 mW EIRP will permit an acceptable situation. If allowed by regulation and technical state of the art, the use of modern wideband technique like DSSS, FHSS or COFDM would also help improving reliability trough channel diversity. Efficient MAC mechanisms and dynamic routing algorithms can be specified to avoid or minimize respectively MAC collisions or link unavailability.
Furthermore, the outdoor urban-wide deployment of M3N also makes it vulnerable to inter-system interference. Link reliability and range can dramatically harm M3N systems if it has to share bands with other systems that do not implement any coexistence mechanism, like duty cycle limitation (LDC) or listen before talk (LBT). It is especially the case for RFID readers, wireless audio and cordless microphones that can be found between 863 MHz to 867,7 MHz. The 2,4 GHz band, heavily loaded by widespread Wireless Local Area Network (WLAN) may also become a detrimental performance factor, leading to high e.r.p and jeopardizing the functioning of the M3N.
In regard of the critical economic importance of data carried by M3N network, it would make sense to re-enforce the ability of all SRD systems using the same band than M3N devices to co-exist together thanks to reasonable co-existence mechanism that will help improving link reliability without compromising M3N technical and economic viability.
C.3.3 Transaction latency When discussing the M3N concept, it clearly appears as a step toward the "Internet Of Things" concept. A recent report [i.10] concludes there may be as many as 16 billion connected devices by the year 2020. Clearly, smartphones are the primary access of the consumers to this Internet 3.0.
As a consequence, these smartphones will become a tool allowing the consumers interfacing with machine applications. One perfect example is the distant control of home energy usage from anywhere you want by communication between the smartphone and the smart meters through the Internet.
This integration of endpoints into the Internet requires that the endpoint's communication features respect the Internet paradigm. One of the key points of this paradigm is to make M3N devices reachable at any time in an as real-time manner as possible. Some applications require round trip as low as ten seconds.
For instance, if we consider the NTA 8130 [i.13]and OMS initiatives, endpoints are accessible only once every 15/30 minutes. NTA 8130 [i.13] and OMS are both based on Wireless M-BUS T1/T2 [i.21] communication mode that requires a meter to transmit before it can receive. As a consequence, it is not possible to reach these meters at any time as decreasing the transmission interval would increase the collisions due to the meter density. The scenario where a gas meter detects a critical leakage and sends out an alarm resulting in an emergency valve closure triggered from the central system is not applicable.
As a consequence, it is highly desirable that M3N devices get access to an almost real-time communication with the network. This requirement has an important impact on the technical solutions uses by M3N devices and will likely impact spectrum requirements and traffic model for the M3N. Possible options to reconcile this latency requirement with low-power consumption requirement underlined in clause C.3.1 would include the combined usage of preamble sampling technique and synchronization. Annex B illustrates how this trade-off between beacon rate and preamble lengths with regards to network activity can be established. It makes clear that when network activity is limited, long packet/preamble is unavoidable to allow low-power operation even when synchronization is used.
ETSI
ETSI TR 103 055 V1.1.1 (2011-09) 34
C.3.4 Conclusion In conclusion, performances requirement that M3N devices have to observe are very specific. This is due to operational constraints (outdoor or challenging environment, battery powered devices) but also specific applications and traffic characteristics:
• From clause C.3.1 it turns out that power saving is a fundamental characteristic that need to be preserved at all cost.
• From clause C.3.3 it turns out that bi-directionality, with a short latency (tens of seconds) in uplink as well as downlink is another fundamental characteristic.
In the current state of the art, reconciling those two requirements can be achieved through the combined usage of preambles sampling techniques and synchronisation, which, in some energy critical situations, requires usage of long preambles.
In addition, clause C.3.2 has shown that:
• In a realistic deployment situation, it is impossible to obtain an acceptable direct range without increasing endpoint EIRP to 100 mW.
• Even with this power increase, some situations do require the ability for some M3N devices to sub-divide 200 kHz channels into narrower 100 kHz or 50 kHz sub-channels to increase direct range.
• There will be a real coexistence issue if M3N devices have to share bandwidth with other devices that do not have similar coexistence mechanism or are susceptible to harm M3N critical traffic while transmitting higher volume of less critical data.
C.4 M3N traffic model This clause will introduce a model of a typical M3N infrastructure network and use this model and previously identified applications to estimate traffic across the network and associated duty cycle. This clause extends the work performed in clause C.2 which described a global network deployed in an average mid-sized European city (150 000 inhabitants, 20 km²). Clause C.2 concluded that we can expect that such a network connects approximately 150 000 endpoints gathering daily almost 600 Mbytes of data not including electricity meters.
C.4.1 Typical network architecture A city wide sensor network can be organized into Gateways, Core Routers and Access Routers.
Gateways are the "sink" of the M3N network. A gateway is powered by the grid and has a broadband connectivity ((x)DSL, UMTS, LTE, other) to the WAN and M3N services platform.
Core Routers (CR) are needed to make each of these gateways reachable from Access Routers (AR) with features to counter individual gateway failure. If CRs are deployed sparsely over a large area several layers of CR (CRb, CRc, etc.) may be needed to extend the gateway radio range. Routing through these CRs is provided by the associated mesh routing algorithm which ensures network robustness and minimises the number of hops, latency and network energy consumption.
Access routers which are often battery powered, connect endpoints, including those installed in hard to reach locations to the M3N network. Access routers are deployed in endpoints, bringing ad hoc connectivity and extending the network coverage provided by the CRs.
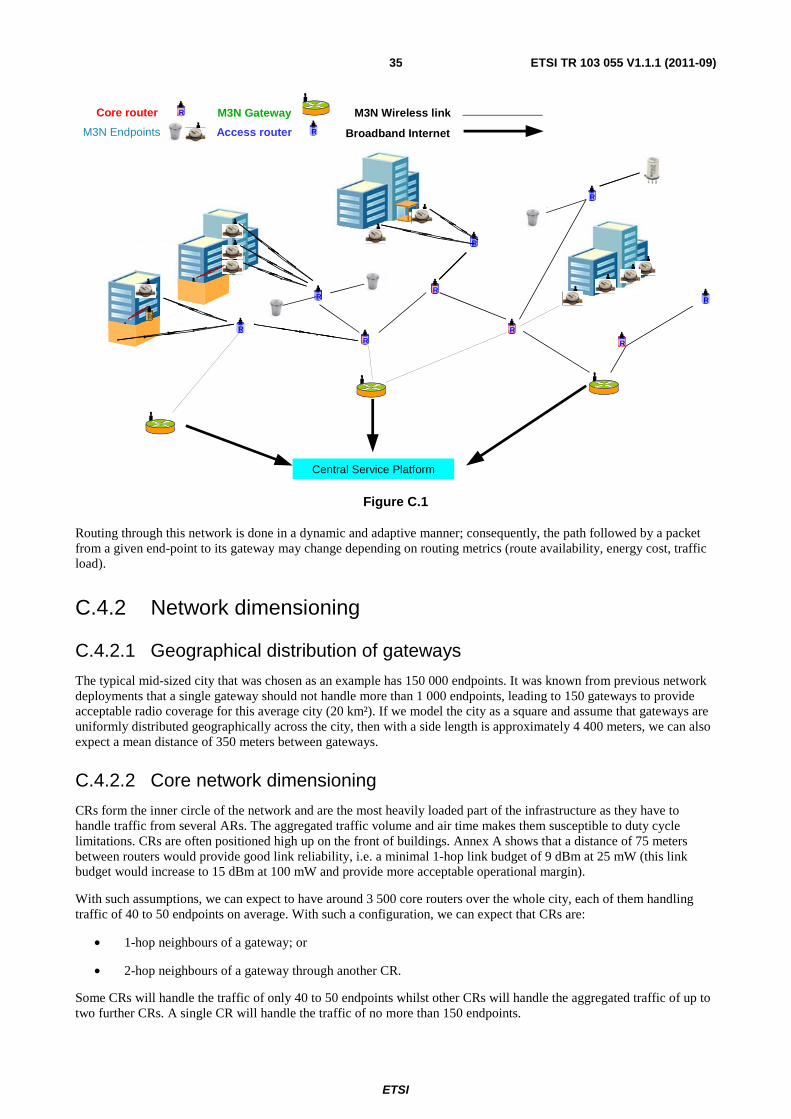
ETSI
ETSI TR 103 055 V1.1.1 (2011-09) 35
Central Service Platform
R
R
R
R
R
M3N Endpoints Access router
R
R
Core router R
R
R
R
M3N Gateway
Access router Broadband Internet
M3N Wireless link
R
Figure C.1
Routing through this network is done in a dynamic and adaptive manner; consequently, the path followed by a packet from a given end-point to its gateway may change depending on routing metrics (route availability, energy cost, traffic load).
C.4.2 Network dimensioning
C.4.2.1 Geographical distribution of gateways
The typical mid-sized city that was chosen as an example has 150 000 endpoints. It was known from previous network deployments that a single gateway should not handle more than 1 000 endpoints, leading to 150 gateways to provide acceptable radio coverage for this average city (20 km²). If we model the city as a square and assume that gateways are uniformly distributed geographically across the city, then with a side length is approximately 4 400 meters, we can also expect a mean distance of 350 meters between gateways.
C.4.2.2 Core network dimensioning
CRs form the inner circle of the network and are the most heavily loaded part of the infrastructure as they have to handle traffic from several ARs. The aggregated traffic volume and air time makes them susceptible to duty cycle limitations. CRs are often positioned high up on the front of buildings. Annex A shows that a distance of 75 meters between routers would provide good link reliability, i.e. a minimal 1-hop link budget of 9 dBm at 25 mW (this link budget would increase to 15 dBm at 100 mW and provide more acceptable operational margin).
With such assumptions, we can expect to have around 3 500 core routers over the whole city, each of them handling traffic of 40 to 50 endpoints on average. With such a configuration, we can expect that CRs are:
• 1-hop neighbours of a gateway; or
• 2-hop neighbours of a gateway through another CR.
Some CRs will handle the traffic of only 40 to 50 endpoints whilst other CRs will handle the aggregated traffic of up to two further CRs. A single CR will handle the traffic of no more than 150 endpoints.
ETSI
ETSI TR 103 055 V1.1.1 (2011-09) 36
C.4.2.3 Access network dimensioning
Access routers are the last capillarity branch of the M3N network. They can be deployed close to the end-points to bring them reliable radio connectivity, even if some end-points are installed in challenging radio situation position (basement, underground, antenna constraint). Access network dimensioning is heavily depending on sensors location and density but, from field deployment experience, an average of 5 % to 15 % of installed endpoint is needed to deliver a reliable ad-hoc wireless M3N connection to every end-point. In every case, it is considered that access router will aggregate only a limited number of endpoints, and therefore, will not reach any strong limitation.
Number of endpoint per access router is rather a consequence of end-point radio range than L3 router traffic routing capacity. Consequently:
• L3 routers will not be impacted by heavy traffic load.
• L3 routers may have to transmit long wake-up preambles when a transaction toward a battery powered end-point is initiated (see clause 3.4).
C.4.3 Duty cycle requirements estimate
C.4.3.1 Introduction
Routing is done in an adaptive and dynamic manner to allow optimal use of the mesh structure of the network. Traffic load is spread over the whole network and not concentrated on the highest hierarchical level. In a typical deployment, a given gateway is always served by tens of CRs that will share the traffic load according to their routing table and metrics. This sharing is dynamically enforced by the routing algorithm to ensure that a given CR will never handle a traffic load higher than a gateway is able to accept.
To determine likely operating duty cycle we only examine gateway and CR traffic since both are larger than AR traffic. The total application uplink traffic (ignoring smart metering data) from an endpoint is approximately 4 kbytes/day. The application downlink traffic is less than 100 bytes/day per endpoint.
According to the network dimensioning analysis exposed in clause C.4.2:
• The average uplink traffic load of a core router will be from 200 up to 600 kbytes/day. The downlink (from a core router to an access router) will be from 3,5 Kbytes/day to 10 Kbytes/day of application data, acknowledgment and network management frames.
• Gateways will aggregate a significant amount of data that will be re-transmitted to an information centre trough a cellular or landline link. Consequently, the most significant traffic transmitted by the gateway will very likely be constituted by acknowledgment and network management frames. A given gateway will manage an average of 1 000 end-points generating an average 4 Mbytes of daily traffic. Moreover, Gateways will also handle 64 Kbytes of downward traffic and network management frames.
The routing protocol considered for the Smart City is a relaxed mesh maintaining protocol implying the transmission of only a few tens of frames per day. The overhead implied by the usage of such a protocol can be neglected when compared to the application and MAC layer traffic load.
In order to deduce the duty cycle limits for these two categories of devices we need to determine transmission times. For this purpose, assumptions concerning the values of the following MAC layer parameters are needed:
• maximum frame size;
• synchronization rate;
• wake-up period;
• control packets duration (acknowledgements, synchronization beacons);
• wakeup preamble length and effective data rate.
ETSI
ETSI TR 103 055 V1.1.1 (2011-09) 37
C.4.3.2 MAC Layer hypotheses
MAC Layer frame number
According to clause C.2 the majority of M3N data traffic consists in 100 bytes application payload. As a consequence:
• a CR will transmit 6 100 frames at maximum (typically 2 030 frames);
• a typical gateway will need to acknowledge 40 000 frames and to transmit less than 700 application frames.
MAC Layer frame size
It is considered that this data traffic is carried using UDP over IPv6 protocols, thus leading to a transport and routing overhead of typically 20 bytes (while considering header compression techniques as specified in [i.20]. The MAC layer overhead is considered to be also 20 bytes (two EUI-64 addresses, two bytes for frame control and two bytes for checksum). We can thus consider that a MAC Layer frame contains typically 140 bytes.
MAC Layer synchronization rate
According to annex B, concerning the compromise between synchronization beacons rate and wakeup preamble that can safely be used in M3N, a synchronized MAC layer with a 15 minutes synchronization period seems to be a good compromise. This result has been obtained with the following parameters:
• a beacon duration of 25 ms;
• a wakeup period of 100 ms.
It results in the usage of a wakeup preamble of 40 ms.
MAC Layer additional parameters
It is considered that an acknowledgement frame lasts 25 ms.
Effective data rate
When considering a two states modulation at a rate of 50 kbps, a 2/3 FEC efficiency and the protocol overhead details in the above "Mac Layer Frame Size" analysis, we can expect an effective data rate of 20 kbits/s at the application layer. This critical reduction of the data rate is obtained after applying several features at different layers:
• channel coding at the PHY layer;
• protocol overhead at all the layers (PHY, MAC, network and transport, etc.);
• security overhead:
- typically at the MAC layer for Authentication and integrity;
- at the MAC layer and/or upper layers for Confidentiality (encryption).
C.4.3.3 Duty cycle estimates
From the data above we can compute the duration of any transmission. It is assumed throughout that all transmissions are at 20 kbps. The total transmits time per day and duty cycle is shown in table C.10.
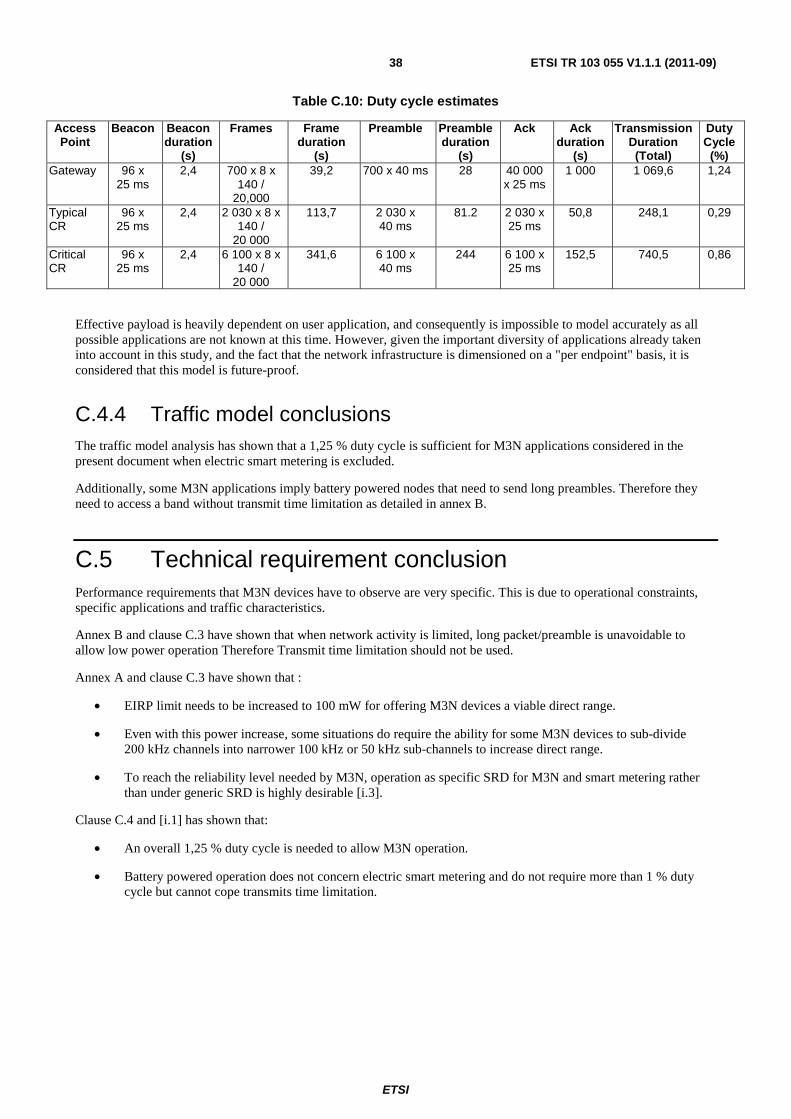
ETSI
ETSI TR 103 055 V1.1.1 (2011-09) 38
Table C.10: Duty cycle estimates
Access Point
Beacon Beacon duration
(s)
Frames Frame duration
(s)
Preamble Preamble duration
(s)
Ack Ack duration
(s)
Transmission Duration (Total)
Duty Cycle
(%) Gateway 96 x
25 ms 2,4 700 x 8 x
140 / 20,000
39,2 700 x 40 ms 28 40 000 x 25 ms
1 000 1 069,6 1,24
Typical CR
96 x 25 ms
2,4 2 030 x 8 x 140 /
20 000
113,7 2 030 x 40 ms
81.2 2 030 x 25 ms
50,8 248,1 0,29
Critical CR
96 x 25 ms
2,4 6 100 x 8 x 140 /
20 000
341,6 6 100 x 40 ms
244 6 100 x 25 ms
152,5 740,5 0,86
Effective payload is heavily dependent on user application, and consequently is impossible to model accurately as all possible applications are not known at this time. However, given the important diversity of applications already taken into account in this study, and the fact that the network infrastructure is dimensioned on a "per endpoint" basis, it is considered that this model is future-proof.
C.4.4 Traffic model conclusions The traffic model analysis has shown that a 1,25 % duty cycle is sufficient for M3N applications considered in the present document when electric smart metering is excluded.
Additionally, some M3N applications imply battery powered nodes that need to send long preambles. Therefore they need to access a band without transmit time limitation as detailed in annex B.
C.5 Technical requirement conclusion Performance requirements that M3N devices have to observe are very specific. This is due to operational constraints, specific applications and traffic characteristics.
Annex B and clause C.3 have shown that when network activity is limited, long packet/preamble is unavoidable to allow low power operation Therefore Transmit time limitation should not be used.
Annex A and clause C.3 have shown that :
• EIRP limit needs to be increased to 100 mW for offering M3N devices a viable direct range.
• Even with this power increase, some situations do require the ability for some M3N devices to sub-divide 200 kHz channels into narrower 100 kHz or 50 kHz sub-channels to increase direct range.
• To reach the reliability level needed by M3N, operation as specific SRD for M3N and smart metering rather than under generic SRD is highly desirable [i.3].
Clause C.4 and [i.1] has shown that:
• An overall 1,25 % duty cycle is needed to allow M3N operation.
• Battery powered operation does not concern electric smart metering and do not require more than 1 % duty cycle but cannot cope transmits time limitation.

ETSI
ETSI TR 103 055 V1.1.1 (2011-09) 39
History
Document history
V1.1.1 September 2011 Publication