Embed Size (px)
Citation preview

April 2018
TPU and TACOMA RAIL 2019 - 2020
BUDGET PREVIEW

AGENDA
1. Budget Timeline – Linda McCrea
2. TPU Budget Preview– Linda McCrea
3. Tacoma Rail Budget Preview– Dale King
2

BUDGET TIMELINES PUB Budget Preview Sessions
April 11 – TPU and Rail
April 25 – Tacoma Water
May 09 – Customer Service
May 23 – Tacoma Power
PUB Budget Reviews
August 22 – Service Divisions
September 12 – Water & Rail
September 26 - Power
3

BUDGET TIMELINES
4
Joint Study Sessions, Readings, Votes and Delivery
October 16 – Joint study session - Preliminary Biennial Budget & Rates
October 24 – Public Utility Board vote on Preliminary Budget & Rates
October 31 – Preliminary Budget to City Clerk
November 13 and 20 – City Council 1st and 2nd Readings and City Council Vote

UNDERLYING BUDGET PRINCIPLES –Maintain a long-term outlook and a customer focus –Minimize rate increases while pursuing rate stability, financial
health and operational priorities –Continue to enhance the customer experience –Be strategically aligned with the communities we serve –Focus on safety and reliability –Meet regulatory requirements –Seek innovative solutions –Recognize the vital role of employees in our success
5
6
CONSIDERATIONS FOR NEXT BIENNIUM –Customer attentiveness
• Low Income assistance programs • Increased community engagement • Communication and transparency
–Our people • Leadership development • Safety and Culture
–Technology • AMI and other upgrades • Cyber security

7
CONSIDERATIONS FOR NEXT BIENNIUM –Regulatory requirements
–Aging infrastructure and asset management
–Challenges and opportunities lie ahead
–Anticipate low to moderate rate increases

TACOMA RAIL BUDGET PREVIEW
Dale King, Superintendent
2015 – 2016 BUDGET OVERVIEW

TODAY’S DISCUSSION • State of the Utility
• Strategy
• Primary Budget Drivers
• Budget/Rate Impacts
• Next Steps
9

STATE OF THE UTILITY: DEMAND
ILWU/PMA
US Oil
GA
10
Seattle

STATE OF THE UTILITY: CUSTOMERS
11
Top 8 line haul revenue customers in 2017 Contributed 85% of total line haul revenue
Intermodal Commercial
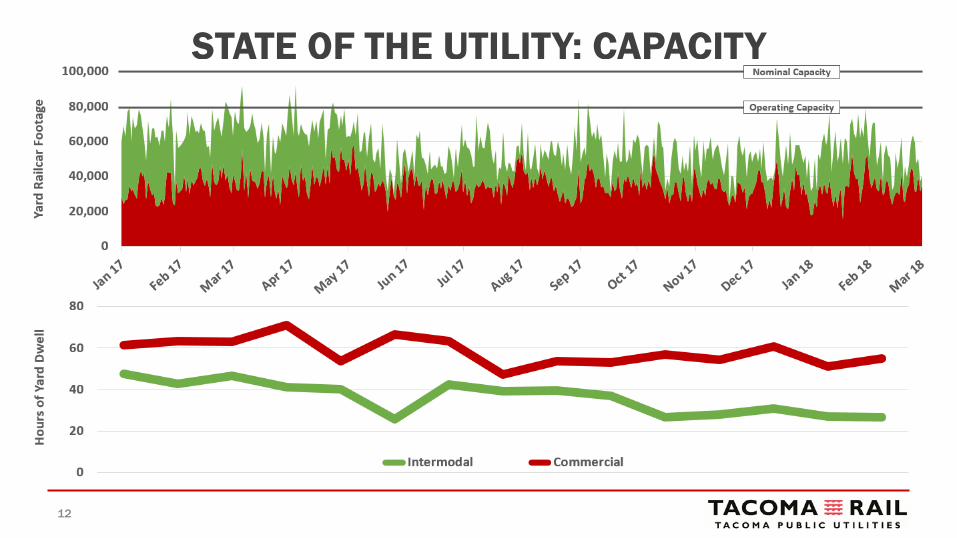
STATE OF THE UTILITY: CAPACITY
12

STATE OF THE UTILITY: FINANCIAL
13
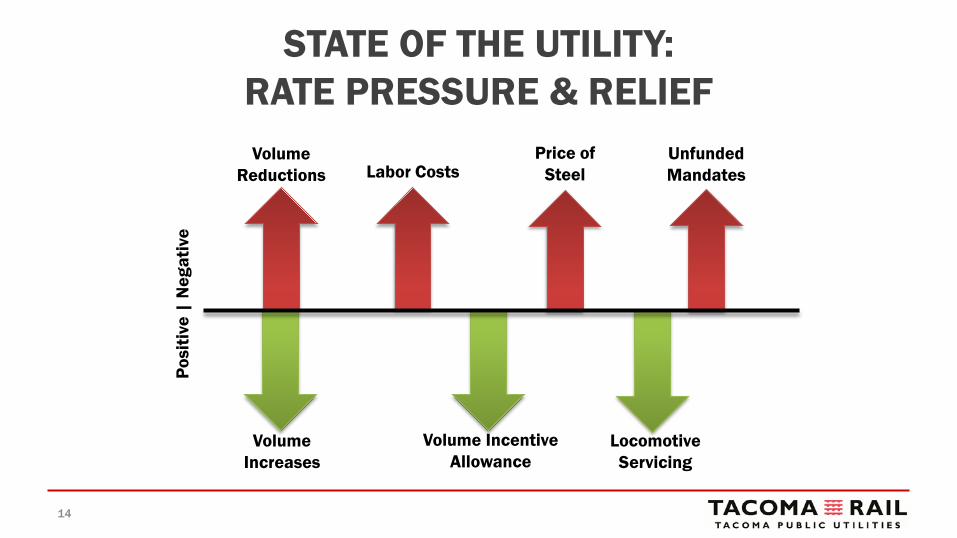
Price of Steel
STATE OF THE UTILITY: RATE PRESSURE & RELIEF
Volume Incentive Allowance
Labor Costs Po
sitiv
e |
Neg
ativ
e
Locomotive Servicing
Volume Reductions
Volume Increases
Unfunded Mandates
14

TACOMA RAIL STRATEGY • Safety
– Positive Train Control – Reinvigorated Safety Committee
• Strategic Partnerships – Customers: Port of Tacoma, U.S.
Oil Refining – Railroads & Industry
Organizations: BNSF, UP, ASLRRA
• Strengthen Financial Position – Control costs & prioritize projects – Rates & fuel surcharge
• Employee, Leadership & Organizational Development – Safety training – Leadership training – Training & succession planning – Right sizing
• Environmental Responsibility – Locomotive modernization
15

PRIMARY BUDGET DRIVERS • Railcar Traffic
– Northwest Seaport Alliance – Commercial Customers
• US Oil • AWC • Targa Sound • Parcel 77
• Infrastructure – Parcel 77 – Marine View Drive grade
crossing protection
• Locomotive Assets – Engine replacements &
modernization – Leased locomotives
• Compliance & Other – Oil Spill Contingency Plan drills
• Includes worst case scenario
– Replenish Self Insurance Fund
16

PROJECTED RATE IMPACTS • Primary Rate Payers
– BNSF – Union Pacific – U.S. Oil Refining
• Rate Policy
– Rates should be cost based and adequate to recover Tacoma Rail’s costs.
– Rates should be stable. – Rates should ensure sufficient resource planning and acquisition for
reliable service while being as competitive as possible. – Rates should have a customer involvement and review process.
17

• Current Tariff Rates – Intermodal Platforms
• $50
– Commercial Railcars • $300 • $350 Hazmat
– Unit Trains • $220 full train facility • $295 partial train facility
Budget Drivers & Projected Rate Impacts
Positive Budget Drivers
Negative Budget Drivers
18

NEXT STEPS • Budget Development
– Revenue requirements – Volume forecasts – Capital program
• September 12th – TPU Board Study Session Budget Presentation
• October 16th – Joint Study Session Budget Presentation
• October 24th – Consideration of preliminary budget
19

UTILITY ASSISTANCE PROGRAMS BOARD STUDY SESSION APRIL 11, 2018
Francine Artis Customer Services

DISCUSSION • History of Utility Assistance Programs • Drivers for Change • Goal of Utility Assistance • A Holistic Approach to Assistance • Alleviate –
• Seek Customer Solutions • Educate –
• Discount Rate Program • Bill Credit Assistance Plan (BCAP) • Financial Education Credit
• Connect – • Tacoma 2025 Strategic • Community Resources
• Community Demographics • Increase BCAP Participation • Marketing & Communications • Next Steps
2

HISTORY OF UTILITY ASSISTANCE PROGRAMS
Utility Assistance Programs
1983: Discount Rate
1983 - 2017 Project Need (Family Need)
2006 - 2017 Water
Assistance 2006 - 2017
Environmental Services
2009 - 2017 Power Aid
3

DRIVERS FOR CHANGE
6%
Total customers disconnected
GRANT PROGRAMS
21% of Water Assistance customers disconnected
27% of Family Need customers disconnected
DISCOUNT RATE
6% of discount customers disconnected
Many customers who received grants also experienced disconnections – some multiple times.
4

GOAL OF UTILITY ASSISTANCE
Provide education and resources to empower customers seeking
assistance so they can successfully manage their utility services.
5

A HOLISTIC APPROACH TO ASSISTANCE
Alleviate Educate
Connect
6
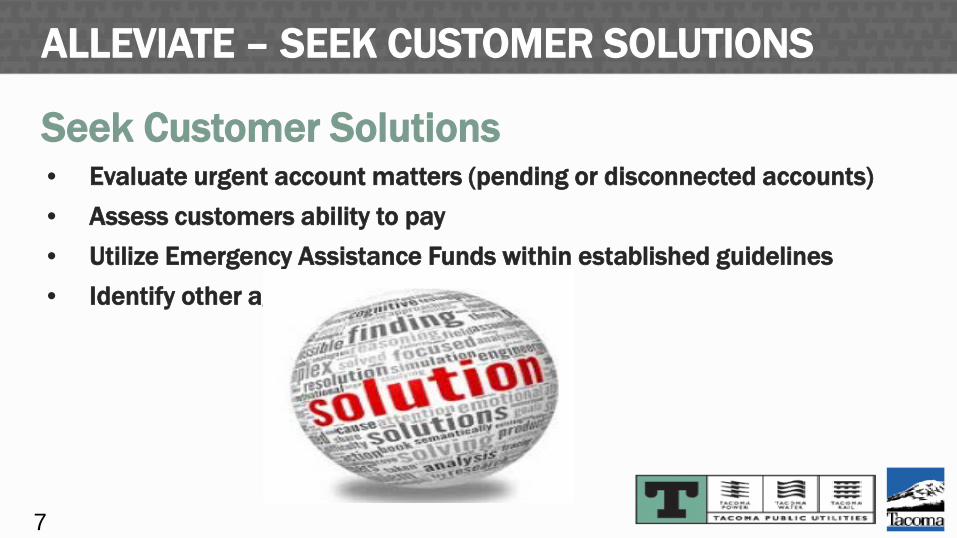
ALLEVIATE – SEEK CUSTOMER SOLUTIONS
Seek Customer Solutions • Evaluate urgent account matters (pending or disconnected accounts) • Assess customers ability to pay • Utilize Emergency Assistance Funds within established guidelines • Identify other agency resources
7

EDUCATE - DISCOUNT RATE PROGRAM Discount Rate Program Criteria • Household income up to 150% of federal poverty guidelines • Customers 62 years or older or receiving qualifying disability income • 30 Percent discount for all services billed directly through TPU
8

EDUCATE - BILL CREDIT ASSISTANCE PLAN Bill Credit Assistance Plan Criteria • Household income up to 150% of federal poverty guidelines • Monthly credits based on full, on-time payments • Credit amount depends on number of services billed through TPU
9

EDUCATE - BILL CREDIT ASSISTANCE PLAN Benefits of Bill Credits • Monthly & bi-monthly credits achievable throughout the year
• Power credit available regardless of permanent heat source
• Additional pledges from other agencies can help achieve bill credits
• Two-year enrollment
Maximum monthly credit = $39 Maximum annual credit = $468 *Percentage of average monthly bill Maximum annual amount of former grant programs = $355
Power $21/mo
nth $252/ye
ar 20%*
Water $7/mont
h $84/year
20%* Wastewa
ter $4/mont
h $48/year
10%*
Surface Water
$2/month
$24/year 10%*
Solid Waste
$5/month
$60/year 10%*
10
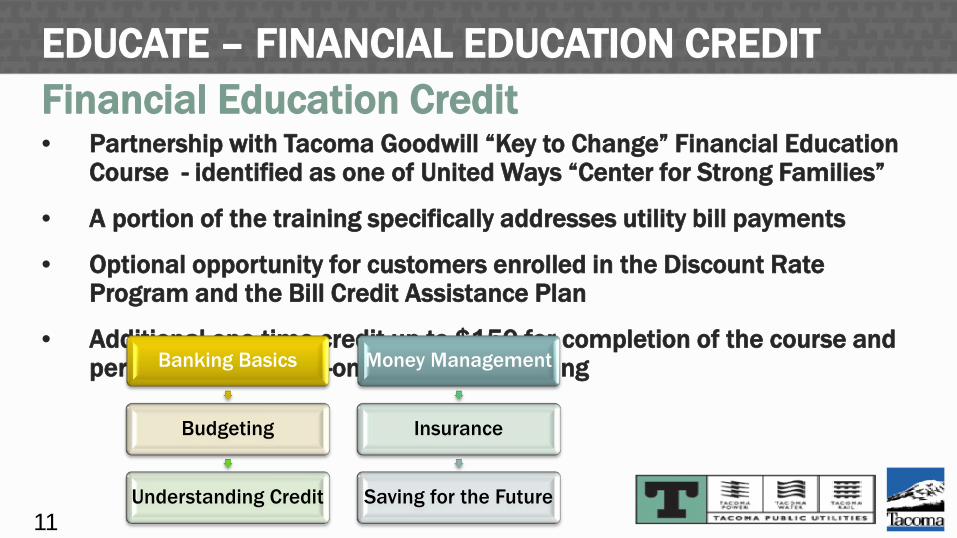
EDUCATE – FINANCIAL EDUCATION CREDIT Financial Education Credit • Partnership with Tacoma Goodwill “Key to Change” Financial Education
Course - identified as one of United Ways “Center for Strong Families”
• A portion of the training specifically addresses utility bill payments
• Optional opportunity for customers enrolled in the Discount Rate Program and the Bill Credit Assistance Plan
• Additional one-time credit up to $150 for completion of the course and personalized, one-on-one financial coaching
Banking Basics
Budgeting
Understanding Credit
Money Management
Insurance
Saving for the Future 11

CONNECT - TACOMA 2025 STRATEGIC PLAN Increase interdepartmental collaboration to promote - Opportunity/Equity/Partnerships/Accountability
• Tacoma Power • Energy-efficiency products and services
• Apprenticeships & Internship Programs
• Parks & Recreation
• Tacoma Water
• Water-efficiency products and services
• Apprenticeships & Internship Programs
• Environmental Services
• Side-Sewer Loan Program
• TAGRO
• Neighborhood and Community Services
• Home repair programs
• Services for seniors & persons with disabilities
• Self-sufficiency programs
12

Current Resources & Partnerships
• Catholic Community Services • Department of Social and Health Services • Greater Tacoma Community Foundation • HopeSparks • Living Access Support Alliance • Metropolitan Development Council • Pierce County Human Services (Energy Assistance & Disability Resources) • Pierce County Veterans Bureau • Puyallup Tribe of Indians • Salvation Army • Sound Outreach • St. Rita / St. Vincent DePaul • Tacoma Head Start • Tacoma/Pierce County Housing Authorities • Tacoma Urban League • United Way of Pierce County - Centers for Strong Families
CONNECT – COMMUNITY RESOURCES
13

Expanded Resources & Partnerships
• Asian Pacific Cultural Center • Boys & Girls Clubs • Centro Latino • Churches • Community Colleges • Comprehensive Life Resources • Employment Security • Korean Women’s Association • Lutheran Community Services • Mercy Housing • School Districts • Senior Centers / Senior Housing • Tacoma Community House • YWCA
14
CONNECT – COMMUNITY RESOURCES

COMMUNITY DEMOGRAPHICS
Estimates based on 2014 American Community Survey (US Census Bureau)
Division Estimated Eligible Households
Households Served in 2017
Power 8,800 6,355 (72.2%)
Water 5,300 2,830 (53.4%)
Wastewater 3,800 2,446 (64.4%)
Surface Water 4,200 2,389 (59.9%)
Solid Waste 3,636 2,535 (69.7%)
Discount Rate Program • Household income up to 150% of federal poverty guidelines One person/$18,210 or less Four people/$37,650 or less
15

Bill Credit Assistance Plan • Household income up to 150% of federal poverty guidelines One person/$18,210 or less Four people/$37,650 or less
COMMUNITY DEMOGRAPHICS
Division Estimated Eligible Households
Households Served in 2017
Power 47,000 1,925 (4.1%)
Water 21,000 1,072 (5.1%)
Wastewater 18,000 993 (5.5%)
Surface Water 20,000 942 (4.7%)
Solid Waste 17,000 1,011 (5.9%)
Estimates based on 2014 American Community Survey (US Census Bureau)
16

Short-Term Goal • Increase household participation in the Bill Credit Assistance Plan over
the 2018-2020
INCREASE BCAP PARTICIPATION
Power 7,143
Water 3,274
Wastewater 3,125
Surface Water 2,917
Solid Waster 3,167
17
MARKETING & COMMUNICATIONS
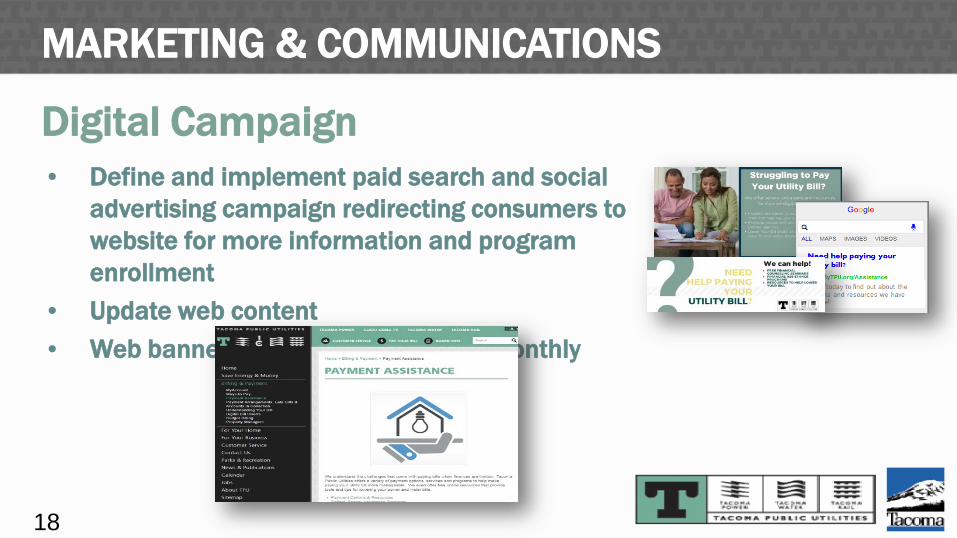
Digital Campaign • Define and implement paid search and social
advertising campaign redirecting consumers to website for more information and program enrollment
• Update web content • Web banners (MyTPU.org) – rotate monthly
18

MARKETING & COMMUNICATIONS Agency Partnership Awareness & Resources • “Lower My Bill” Resource Kit
• Develop a new lower your bill resource kit for partners to provide customers in their facilities
• Banners/Displays • Program overview – pull-up banners for display at agency with tear sheets for
more information • Program brochures and flyers
• Program FAQs & Talking Points for Staff
• Online • Reciprocal links on TPU and partner agency websites to relevant
programs/resources
19

MARKETING & COMMUNICATIONS
Direct to Consumer Awareness • Posters/Flyers
• Pull-up banners and flyers in TPU lobby and targeted partner agencies
• TPU lobby screens – (rotates monthly)
• Advertising • Print ads in local community newsletters and/or papers that meet key
demographics
• Collateral • Program flyers and brochures created and distributed in high-traffic
community gathering areas
20

MARKETING & COMMUNICATIONS • Newsletters
• Quarterly article in U*
• Provide articles to partner agencies for inclusion in their newsletters
• Direct Mail
• 1st – all income-eligible households
• Quarterly trigger program based on events (unpaid bills, late pays, etc.)
• Bill inserts (quarterly)
• Promotional giveaway
• 12 month calendar with TPU pen to mark when bills are due
• Public Service Announcement (PSA)
• Tacoma Reporter, social media channels
21
NEXT STEPS • Present to the Committee of the Whole on May 1, 2018.
• Launch Financial Education Credit component. • Create a strategic plan that improves utility programs, identifies resources
and develops priorities within Tacoma Public Utilities service territory. • Reorganize the Customer Solutions Office to optimize outreach and
engagement with low-income community. • Conduct program evaluations at the end of each calendar year and report
findings to the board and council.
22

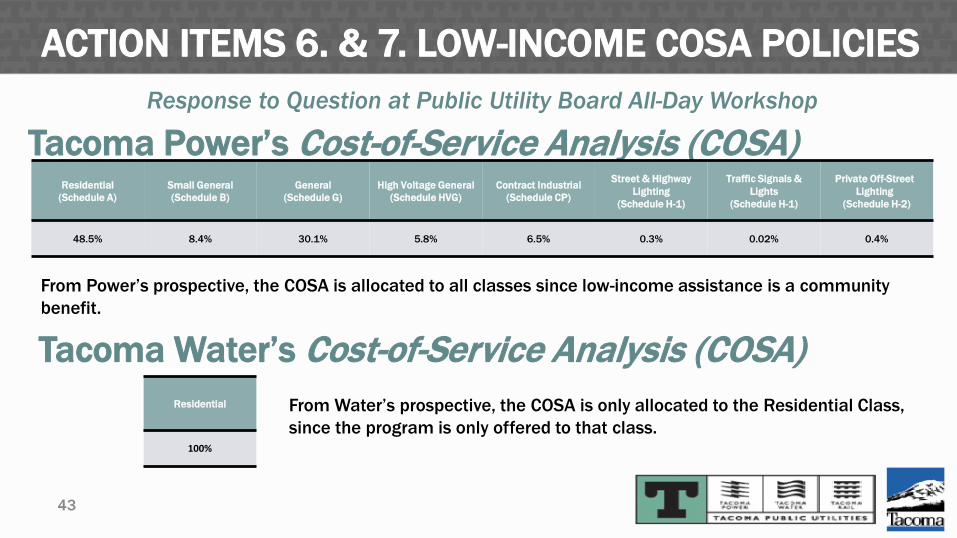
ACTION ITEMS 6. & 7. LOW-INCOME COSA POLICIES Response to Question at Public Utility Board All-Day Workshop
Tacoma Power’s Electric Rate & Financial Policy * • IV.B.1.b.
“The level of annual funding for low-income assistance will be determined by the Public Utility Board.” • IV.B.2.a.1.
“A modified electric rate will be considered to help low-income senior or low-income disabled electric customers pay their bills.”
• IV.B.3.g. “The costs and benefits of the current discounted rate for the low-income/senior and low-income/disabled, together with other low-income programs, will be evaluated, along with an analysis of other utility programs that provide assistance to the low-income customer. The low-income rate may be discontinued at the discretion of the Public Utility Board if it is determined that the rate discount is not an effective method of providing assistance to the low-income customers.”
Tacoma Water’s Water Rate & Financial Policy * • III.C.16
“A discounted water rate will be considered to help low-income/elderly and low-income/ handicapped water customers.”
42 * Both Rate & Financial Policies will be discussed side-by-side on May 9, 2018.
ACTION ITEMS 6. & 7. LOW-INCOME COSA POLICIES
43
Tacoma Power’s Cost-of-Service Analysis (COSA) Residential
(Schedule A) Small General (Schedule B)
General (Schedule G)
High Voltage General (Schedule HVG)
Contract Industrial (Schedule CP)
Street & Highway Lighting
(Schedule H-1)
Traffic Signals & Lights
(Schedule H-1)
Private Off-Street Lighting
(Schedule H-2)
48.5% 8.4% 30.1% 5.8% 6.5% 0.3% 0.02% 0.4%
Tacoma Water’s Cost-of-Service Analysis (COSA) Residential
100%
From Water’s prospective, the COSA is only allocated to the Residential Class, since the program is only offered to that class.
Response to Question at Public Utility Board All-Day Workshop
From Power’s prospective, the COSA is allocated to all classes since low-income assistance is a community benefit.

44
Tacoma Power Preliminary Long-Range Financial Plan Including Preliminary Revenue Requirement Forecast for 2019/20 Biennium
April 6, 2018

Rates and Budget Timeline 1 AGENDA
Long-Range Financial Plan Update 2
3
• New Base Case and Financial Metrics • Methodology and Assumptions • Debt Management and Capital Funding • Managing Risks
Potential Changes to the Electric Rate and Financial Policy
4 Appendix • New Load Forecast • Preliminary Long-Range Financial Plan Executive Summary

Rates and Budget
Timeline

47
2019/2020 Budget and Rate Timeline Timeline
Jan 2018 Apr 2019
10/10PUB Budget
& RatesPublic Review
4/1Rates Effective
10/31GPFC
4/11Draft LRFP &
Revenue Requirement Forecast
6/27PUB COSA &
Class Rates Review
Public Outreach
2/7Rates & Financial Planning
Workshop
5/23PUB Budget Preview
& Final LRFP /Rev Rqmt
7/25PUB Water & Power
Rates & Financial Policy SS& Potential Action
9/26PUB SS Review of Budget & Rates 11/20
City Council FinalizeRates & Budget
7/2Participation
Protocol Begins5/9
Water & Power Rates & Financial Policy
Review
We are here.

L O N G - R A N G E F I N A N C I A L P L A N Rates, Planning & Analysis
May 23, 2018

49
Before we start, a reminder… This is a snapshot in time.
The amount of revenue we will receive each year is uncertain.
The amount of power that will be consumed by our customers is uncertain.
Actual rate increases may fall outside of this range and are dependent upon market conditions, financial performance, and the actions we may take in future years.
As has happened before -
These projections will change.
50
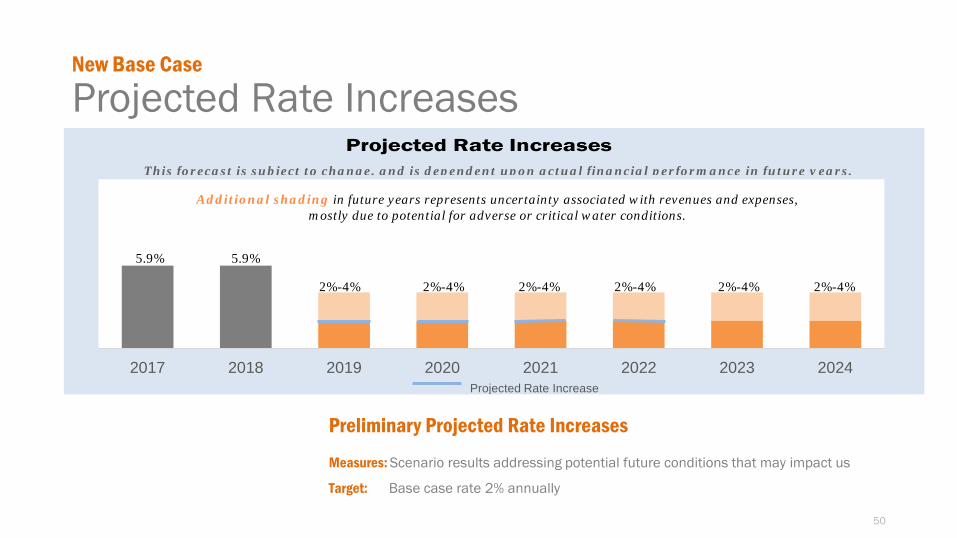
Projected Rate Increases New Base Case
2017 2018 2019 2020 2021 2022 2023 2024Projected Rate Increase
5.9% 5.9%
2%-4% 2%-4% 2%-4% 2%-4% 2%-4% 2%-4%
Additional shading in future years represents uncertainty associated with revenues and expenses, mostly due to potential for adverse or critical water conditions.
This forecast is subject to change, and is dependent upon actual financial performance in future years.
Preliminary Projected Rate Increases
Measures: Scenario results addressing potential future conditions that may impact us
Target: Base case rate 2% annually

51
Financial Metrics
New Base Case and Financial Metrics
Tacoma Power Metrics 2013 2014 2015 2016 20171
Days of Liquidity 312 335 215 236 210 (Target: >180 Days)
Debt Service Coverage Ratio 1.88x 1.90x 2.01x 2.31x 2.82x (Target: >2.0x)
Debt Ratio 39% 37% 29% 26% 29% (Target: <50%)
Moody’s* S&P Fitch
Aaa AAA AAA Aa1 AA+ AA+ Aa2 AA AA Aa3 AA- AA- A1 A+ A+ A2 A A A3 A- A- Baa1 BBB+ BBB+ Baa2 BBB BBB Baa3 BBB- BBB-
Ba1 BB+ BB+ Ba2 BB BB Ba3 BB- BB- B1 B+ B+ B2 B B B3 B- B- Caa1 CCC+ Caa2 CCC Caa3 CCC- CCC Ca CCC C DDD
D DD D
Investment Grade
Non-Investment Grade Speculative
* Moody’s current rating for Tacoma Power only applies to Bonds issued before 2017.
1 Based on unaudited financial results

52
Debt Service Coverage Ratio New Base Case Financial Metrics
Debt Service Coverage Ratio
Measures: How many times we can pay the annual interest and principal payments on our debt annually with net revenue.
Target: 2.0x
Policy: 1.5x Adverse Water 1.8x Average Water
Bond Covenant Minimum: 1.25x
0
1
2
3
2017 2018 2019 2020 2021 2022 2023 2024 2025 2026 2027 2028
Aa Target Debt Service Coverage (2.0x) Debt Service Coverage RatioPolicy Minimum (1.5x) Bond Covenant Minimum (1.25x)
Refer to Montague DeRose memo in 4/6 Board packet (ACTION ITEM 23).
DSCR is above target as a result of debt retirements.
.

53
Liquidity Ratio New Base Case Financial Metrics
Days of Liquidity
Measures: The number of days cash we have available to operate the utility
Target: 180 Days
Rating: 150 Days
Policy Minimum: 90 Days 1
1 90 days of Total Expenses equals approximately 103 days of Operating Expenses as used by rating agencies.
AA Range
150 to 250 Days of
Cash
Liquidity is within the AA range, although above our target. Additional liquidity is used to pay for capital expenses and future debt restructuring.
. Refer to Montague DeRose memo in 4/6 Board packet (ACTION ITEM 23).
0
100
200
300
2017 2018 2019 2020 2021 2022 2023 2024 2025 2026 2027 2028Days Liquidity Enhanced Days LiquidityAa Target Liquidity (180 Days) Aa Minimum Liquidity (150 Days)

Methodology and
Assumptions

55
2019/2020 Revenue
Requirement
Projected expenses at
forecasted rates
Revenue Requirement Calculation
New Base Case and Financial Metrics
Forecasted revenues at current rates
Retail Revenue
Wholesale Revenue
Click!
Purchased Power
Personnel + Other O&M +
New & Different Capital
Load Forecast

56
Long-Range Financial Plan Assumption Differences Methodology and Assumptions
Text Here
Click!
Purchased Power
Personnel
Other O&M
Wholesale Revenue
Retail Revenue
New 2018 load forecast
Updated pricing & load forecast
Updated pricing & load forecast
Forecast based on historical actuals (2.4% annual increase)
Click! Status Quo
Forecast based on historical actuals (3.7% annual increase)
2/7/2018 Draft LRFP 4/11/2018 Preliminary LRFP 2017 load forecast
2017 pricing & load forecast
Click! Status Quo
2017 pricing & load forecast
$10 million biennium vacancy rate
3% discount based on budget
New & Different
Estimated spending X probability factor ($18.7 million)
Capital 2018 historical actuals forecast &
future capital spending plans Capital Spending Plan
57
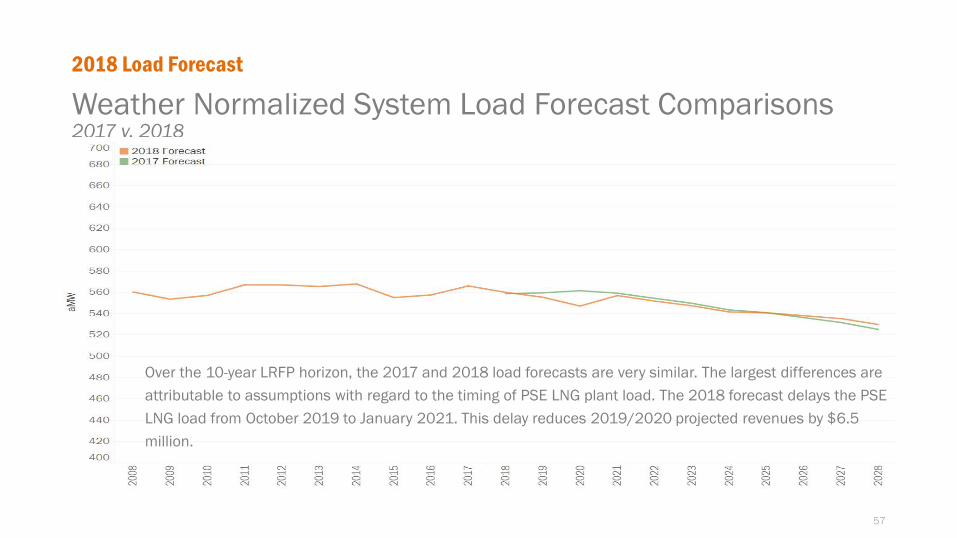
2018 Load Forecast
Weather Normalized System Load Forecast Comparisons 2017 v. 2018
Over the 10-year LRFP horizon, the 2017 and 2018 load forecasts are very similar. The largest differences are attributable to assumptions with regard to the timing of PSE LNG plant load. The 2018 forecast delays the PSE LNG load from October 2019 to January 2021. This delay reduces 2019/2020 projected revenues by $6.5 million.

58
Wholesale Revenue Assumption Impacts for 2019/2020
Methodology and Assumptions
$12.3 Million Reduced Revenue
Load Forecast Update
$4.7 million Wholesale Revenue
Enhancements $9.1 million
Wholesale Prices
–$21.9 million Generation Resources
–$4.2 million

59
Purchased Power Assumption Impacts for 2019/2020
Methodology and Assumptions
Transmission Purchases for
Wholesale Revenue Enhancement $2.6 million
Other Transmission
Purchases $3.9 million
Purchased Power from BPA
–$11.3 million Other Power Costs
–$2.0 million $6.7 Million Reduced Expenses

60
Actual Historical Spending on Personnel Methodology and Assumptions
Personnel
Average Annual Increase: 2.4%
$78.7 $85.6 $86.7 $87.2 $89.3 $91.4 $93.6 $95.9
$90.7 $94.9 $93.7 $96.2 $97.5
$0
$20
$40
$60
$80
$100
$120
2013 2014 2015 2016 2017 2018 2019 2020
Mill
ions
Personnel Expenses
Projected Expenses Budget Expenses Actual Expenses
2.4%

61
Actual Historical Spending on Other O&M Methodology and Assumptions
Other Operations & Maintenance
Average Annual Increase: 3.7%
$64.9 $76.2 $78.9 $82.7 $80.0 $83.0 $86.0 $89.2
$74.9 $86.2 $87.4 $89.8
$0
$20
$40
$60
$80
$100
$120
2013 2014 2015 2016 2017 2018 2019 2020
Mill
ions
Other O&M Expenses
Projected Expenses Actual Expenses
$73.9
Budget Expenses
3.7%

62
New and Different Spending Methodology and Assumptions
Section Forecast
New & Different Power Management $4,217,619 Generation $5,374,955 UTS $5,156,076 Rates, Planning & Analysis $2,820,872 Transmission & Distribution $1,193,519 Click! $0 Total $18,763,041
Financially Significant
Tacoma Power Strategic Initiative
Section Strategic Initiative
Operational Mandate
2019/20 estimated forecast of Other O&M and Personnel + New & Different is $7.5 million less than the 2017/2018 Budget for those same items.

63
Preliminary Capital Spending Assumptions Debt Management and Capital Funding
$44.6 $75.7 $77.9 $81.5
$51.3 $58.4 $90.7 $90.7
$78.5 $78.5 $87.0
$95.7 $95.2
$0
$20
$40
$60
$80
$100
$120
2013 2014 2015 2016 2017 2018 2019 2020
Mill
ions
Capital Expenses
Projected Expenses Actual Expenses Budget Expenses

64
Click! Revenues Methodology and Assumptions
Revenues forecasted as if Click! continues to operate in Status Quo until further direction is provided. Click! expenses are included in Power Personnel and Other O&M.
$26.3 $27.2 $27.3 $26.7 $26.5 $26.0 $24.5 $23.7
$0$5
$10$15$20$25$30$35$40
2013 2014 2015 2016 2017 2018 2019 2020
Mill
ions
Projected Revenues Actual Revenues Budget Revenues

Debt Management
and Capital Funding

66
Capital Spending Assumptions Debt Management and Capital Funding
Revenue-Funded Capital Spending Average Annual Increase: 8.7%
Bond-Funded Capital Spending Average Annual Increase: 11%
$23.8 $21.8 $19.6 $30.6 $20.9
$22.7
$20.8
$53.9 $58.3 $50.9
$30.5 $33.8
$0
$20
$40
$60
$80
$100
2013 2014 2015 2016 2017 2018
Mill
ions
Capital Expenses
Revenue-Funded Projected Expenses Revenue-Funded Actual Expenses Bond-Funded Projected Expenses paid from the Current Fund Bond-Funded Actual Expenses
8.7%
11%

67
Funding Guidelines Major projects: 100% bond funded Remaining projects: 50% bond funded & 50% revenue funded Budgeted Actual
Biennium Revenue
Funded Bond
Funded Total
Capital Revenue
Funded Bond
Funded Total
Capital
2013/2014 37.1% 62.9% $157,043,000 37.9% 62.1% $120,439,200
2015/2016 36.9% 63.1% $182,660,440 31.5% 68.5% $159,437,900
2017/2018* 43% 57% $190,474,000 100% 0% $138,887,000
2019/2020** 68% 32% $181,450,000
2021/2022** 50% 50% $163,387,000
Average Funding* 46.6% 53.4%
Cash and Bond Funding Ratios
* 2017 Actuals plus 2018 projections ** Biennium projections
Budgeted vs. Actual Capital Spending
Debt Management and Capital Funding

68
This chart shows the combined principal and interest payments due by Bond and arranged by year. Debt Service Overview
$0M$10M$20M$30M$40M$50M$60M
2015
2016
2017
2018
2019
2020
2021
2022
2023
2024
2025
2026
2027
2028
2029
2030
2031
2032
2033
2034
2035
2036
2037
2038
2039
2040
2041
2042
2043
2044
2045
2046
2010B 2010C 2013A 2013B 2015 2017
* Debt Portfolio shown on an accrual basis.
Tacoma Power called the remaining $122.1 million of 2005B Bonds on July 1, 2015
Debt Management and Capital Funding
Using Cash to Reduce Debt Service
Tacoma Power plans to call $33 million of the 2013B Bonds in 2023
Tacoma Power plans to defease $15 million of the 2010C Bonds in 2025

69
$0
$10
$20
$30
$40
$50
$60
$Mill
ions
2009-2016 Actuals 2010B 2010C 2013A 2013B 2017 2020 2023 2026
Base Case Debt Service with Future Bonds
Debt Management and Capital Funding

70
Wells Fargo Drawdown Direct Purchase Agreement Commitment Amount: $100,000,000 Drawn Amount: $250,000
Start Date: May 2015 Extension through 2020
Term: 2 years
Purpose: Interim Financing of Capital Projects
Our variable rate Note Purchase Agreement with Wells Fargo allows us to fund capital projects on an interim basis.
Short-term Debt: Wells Fargo Proposed Two-Year Extension from 2018 to 2020
Debt Management and Capital Funding
Refer to Bill Berry memo in 4/6 Board packet (ACTION ITEM 24).
Policy Decision

71
Key Bank Revolving Credit Facility Commitment Amount: $25,000,000 (with ability to increase to $50,000,000)
Drawn Amount: $0 Expiration Date: May 1, 2018
Term: 3 years
Purpose: Enhanced Liquidity
Short-term Debt: Key Bank Plan to let lapse
Debt Management and Capital Funding
Refer to Bill Berry memo in 4/6 Board packet (ACTION ITEM 24).

Managing Risk

73
Unpredictable Factors affect Revenue and Expenses
Managing Risk
External Weather Wholesale price volatility Economic downturn Regulatory changes Environmental regulations Energy efficient load impact Technology changes Aging infrastructure Aging workforce
Internal
Projected Rate Increases
Revenues and Expense Forecasts for 2019–2028
Strategic Investment
Weather Conditions
+ Water
Forecasts
Economic Influences

74
Options to Preserve Financial Flexibility Managing Risk
e.g., Seattle City Light BPA Cost Increase Pass Through Rate Stabilization Fund Revenue
Adjustment Mechanism
Automatic Rate Adjustment Mechanism
Strategic Initiatives Asset Management Capital Portfolio Management Office Wholesale Revenue Enhancement
Debt Service Management
Reduce Capital Spending Establish a separate capital fund
Considering In Progress

Electric Rate & Financial
Policy

76
Electric Rate & Financial Policy What’s in the Policy? This policy provides guidance for managing the financial performance of the utility. I. Rate Setting Objectives II. Rate Review Process III. Rate Setting Policies IV. Financial Targets and Rate Setting Practices V. Rate Stabilization Fund
Managing Risk
Refer to Electric Rate & Financial Policy received in the 4/6 packet.
77
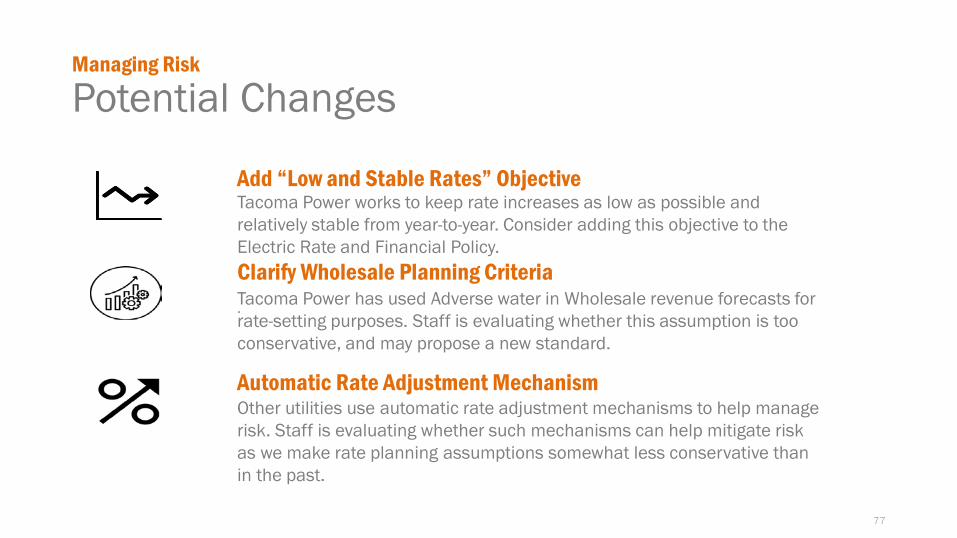
Potential Changes Managing Risk
Automatic Rate Adjustment Mechanism
Add “Low and Stable Rates” Objective
Clarify Wholesale Planning Criteria
Tacoma Power works to keep rate increases as low as possible and relatively stable from year-to-year. Consider adding this objective to the Electric Rate and Financial Policy.
. Tacoma Power has used Adverse water in Wholesale revenue forecasts for rate-setting purposes. Staff is evaluating whether this assumption is too conservative, and may propose a new standard.
. Other utilities use automatic rate adjustment mechanisms to help manage risk. Staff is evaluating whether such mechanisms can help mitigate risk as we make rate planning assumptions somewhat less conservative than in the past.

78
Reserve Accounts
The fund contains a combination of cash, investments, and surety policies and the size of the fund must remain sufficient to meet the Reserve Account requirements until the bonds are paid for.
Tacoma Power’s Bond Reserve Fund is sufficiently funded through 2020 when an existing surety policy will expire. Further analysis on this issue will be included in future versions of the LRFP.
Tacoma Power issued its Series 2017 Bonds without a Reserve Requirement because it is no longer required by the market.
NEW Springing Amendment Staff will propose a technical amendment to Tacoma Power’s Bond Ordinance, reducing the Bond Reserve Requirement by approximately $2.8 million.
Rate Stabilization Fund Bond Reserve Fund
Historical Rate Stabilization Fund Balance 2009 2010 2011 2012-2017
$0 $10,000,000 $36,000,000 $48,000,000
NEW Staff is considering adding probabilistic rigor to the Rate Stabilization Fund calculation and may propose policy changes.
Managing Risk

79
Recovery of Fixed Costs
Amounts for Click! underrecovery included as a fixed customer item.
Managing Risk
Customer (fixed) Customer
($/month)
Demand (semi-fixed)
Demand ($/kW)
Energy (variable)
Energy ($/kWh)
0%
10%
20%
30%
40%
50%
60%
70%
80%
90%
100%
COSTS REVENUES
Perc
ent o
f Tot
al
System Cost Structure 2017/2018 Rate Period
Most of the total Tacoma Power system costs are fixed. At the same time, most of the total Tacoma Power revenues are variable.
Policy Decision
by 5/23/18

Appendix

2018 Load Forecast

82
High-Level Trends & Results Introduction & Overview of Results
Results • Load is projected to gradually decline over the next twenty years
Drivers • Non-Industrial customer load is declining • Number of non-industrial customers is inclining • Existing industrial loads are flat • Conservation programs/codes and standards further reduce load

83

84

85

86
Customer Forecast General Discussion This year, and in past years, customer growth estimates were based on Pierce County Population forecasts purchased from Woods & Poole.
Small World GIS.
The majority of developable land within Pierce County is outside the Tacoma Power service area.
87

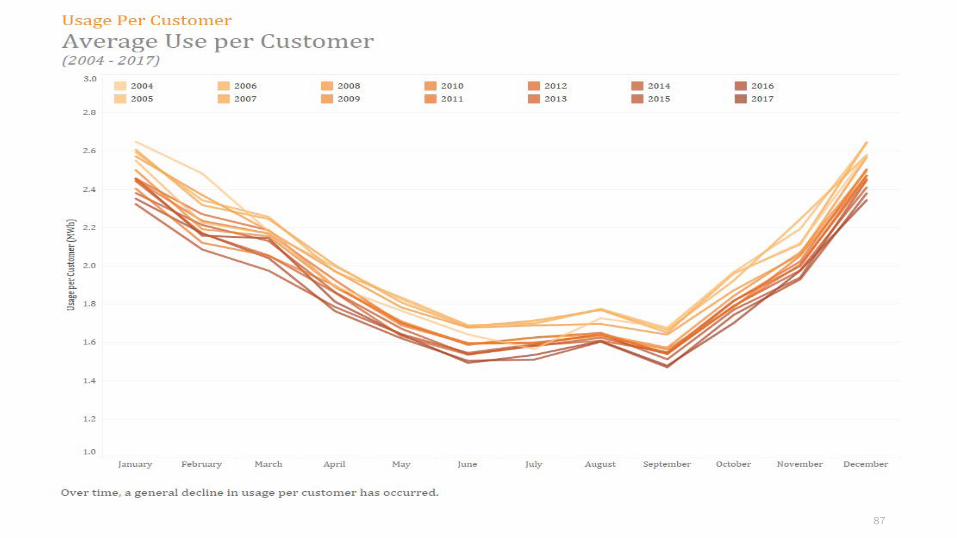
88
Downward Trend Drivers Usage per Customer
Trend • General decline over the forecast history
Drivers • Increase in natural gas penetration • Increase in energy efficient technologies and construction materials • Increase in high(er) density dwellings
Section 1 The Highlights
An executive summary* of the 2018 Long-Range Financial Plan
*Maybe not enough to make you an expert, but if you already know your way around an LRFP, this is definitely the place to start.

Highlights
Before you start The electric utility business is complicated
On the first page you learned that this document more simply describes a number
of complicated subjects. We hope to make them easier to understand and
demonstrate their unique relationship to one another. Before we get into any of the
details, here is a quick overview of how our business operates.
Our mission is to provide safe, reliable, and environmentally responsible
electric and telecommunications services now and into the future.
To fulfill this mission, we sell electric and telecommunications services to
customers in the City of Tacoma and Pierce County. Selling these services provides
us with revenue. As a cost-of-service utility, we charge our customers based on what
it costs to provide the services they need. We generally match our revenues to our
expenses when we set budgets. When we collect more revenue in a given year, we
use that surplus to reduce the amount collected from customers in future years. We
also take proactive steps to account for the risks inherent in our business and
develop strategies to plan for the future. This LRFP helps us with that.
Many customers don’t know that whenever they turn on a light or plug in an
appliance, a generator connected to the electric grid must increase its output to
provide the needed electricity This happens in real-time Providing these services is
The amount of revenue we will receive each year is uncertain. We can’t
predict how often you will turn your lights on and off or how much electricity
you will use. Section 3 has more detail about how we try to plan for this
uncertainty in revenue.
Our customer’s power comes from hydroelectric dams that we operate and
maintain, or power we purchase through contracts with other power
providers. Almost all of our generators create electricity by passing water
through a generator. The water comes from rainfall or snow that melts and
drains into reservoirs or lakes behind a dam. Trying to predict how often and
when it will rain adds another layer of complexity to our business. See
Section 5 for more detail on how we plan for this uncertainty.
In providing power services the utility incurs a number of expenses. These
are such things as the staff that work here or the trucks and tools used to
maintain the electric system. The electric utility business is capital intensive.
This means we have large assets that are expensive to construct, operate,
and maintain. Tacoma Power has over $1 billion in assets and some have
been around for a long time. To fund repairs and replacement, we use a
combination of cash and bonds. This allows us to spread the payments over

Highlights
Financial metrics What are financial metrics? The word ”metrics” refers to measurement. Financial metrics are one way to measure how well we are managing our resources. Each financial metric conveys a message about one aspect of the utility from a financial perspective. Metrics can be used to compare performance across utilities, identify strengths or weaknesses, and set targets for financial strength. Tacoma Power primarily looks at the three metrics below when projecting future rate increases and has targets, listed in the chart to the right, for maintaining our financial strength. You can find more detail about them in Section 4.
Days of Liquidity
Liquidity is another way to describe the amount of operating cash we have available. We measure this by the number of days cash we have available to operate the utility. This helps determine Tacoma Power’s ability to cover necessary expenses.
Debt Service Coverage Ratio
The debt service coverage ratio measures how many times we can pay the annual interest and principal payments on our debt, or bonds, with our available cash flow for a given year. We target having at least twice as much cash flow needed to pay our annual debt obligations each year.
Debt Ratio
The debt ratio is the proportion of our assets that are financed by debt, or bonds. The lower the percentage, the lower the amount of debt service payments we are required to make. This provides us with financial flexibility.
Tacoma Power Metrics 2013 2014 2015 2016 2017*
Days of Liquidity 312 335 215 236 210 (Target: >180 Days)
Debt Service Coverage Ratio 1.88x 1.90x 2.01x 2.31x 2.82x
(Target: >2.0x)
Debt Ratio 39% 37% 29% 26% 29% (Target: <50%) * Based on unaudited year-end results.

Highlights
Financial metrics Why are financial metrics important?
Financial metrics, such as our debt service coverage ratio and days liquidity ratio are important because they indicate our
ability to meet our financial obligations as a business. Financial metrics are comparable across other utilities and are used by rating agencies as part of their rating process when they rate
us. Some rating agencies have more stringent requirements than others and we adjust our calculations to be better than the minimum levels. We target metrics that keep us in the AA
rating category.
We use these ratings when we issue bonds to help pay for capital improvements. Investors buy Tacoma Power Bonds and
we pay those bonds back over a period of up to 30 years. (See our existing debt repayment profile on page 41.) To get the best interest rates possible when we issue bonds, we must
maintain healthy financial metrics. The better our credit rating is, the less we will pay when we issue debt. Being financially healthy, like we currently are, benefits customers and provides
flexibility to address unexpected challenges
Debt Service Coverage Ratio Target = 2.0x
0.00.51.01.52.02.53.03.5
201720182019202020212022202320242025202620272028Aa Target DSCR (2.0x) Debt Service Coverage Ratio
Liquidity Projections Target = 180 Days
Enhanced Days Liquidity Days Liquidity Aa Target Liquidity (180 Days)
050
100150200250300350
2017 2018 2019 2020 2021 2022 2023 2024 2025 2026 2027 2028

Before explaining anything else, we’ve put our current
projections of rate increases for the next five years here, right up front. This document explains how we
came up with these projections.
Highlights
* If you are not familiar with any of these terms, there is a Glossary in the back that defines some of these key concepts
2017 2018 2019 2020 2021 2022 2023 2024Expected Rate
2%-4% 2%-4%
The light shading in future years represents uncertainty associated with revenues and expenses, mostly due to potential for adverse* or
critical water conditions, changes to sales projections, and future debt service.
Historical & Projected Rate Increases
5.9% 5.9%
2%-4% 2%-4%
The further out in time we forecast, the more uncertainty
there is. We have modeled some scenarios addressing potential future conditions that may impact
us. The results of these scenarios indicate that doing a 0% rate increase in the next biennium
would place upward pressure on future rate increases. The results of several scenarios can be found
later in the document, in Section 6.
These projections like other parts
of this plan will change. Actual rate increases may fall outside of this range and are dependent
upon market conditions, financial
2%-4% 2%-4%
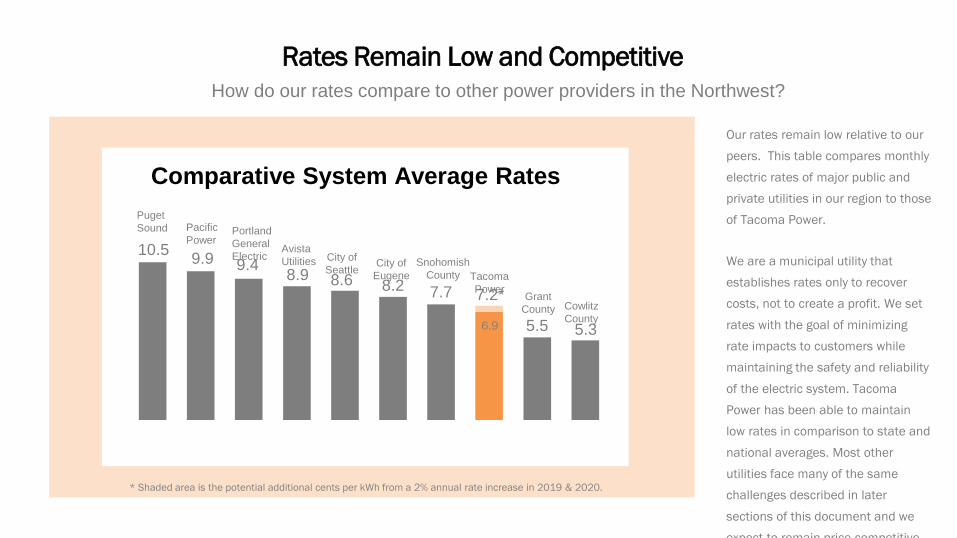
Rates Remain Low and Competitive
Our rates remain low relative to our peers. This table compares monthly
electric rates of major public and private utilities in our region to those of Tacoma Power.
We are a municipal utility that establishes rates only to recover costs, not to create a profit. We set
rates with the goal of minimizing rate impacts to customers while maintaining the safety and reliability
of the electric system. Tacoma Power has been able to maintain low rates in comparison to state and
national averages. Most other utilities face many of the same challenges described in later
sections of this document and we
expect to remain price competitive
How do our rates compare to other power providers in the Northwest?
10.5 9.9 9.4 8.9 8.6 8.2 7.7 7.2*
5.5 5.3
Puget Sound Pacific
Power Portland General Electric
Avista Utilities City of
Seattle
City of Eugene
Snohomish County Tacoma
Power Grant
County Cowlitz County
Comparative System Average Rates
* Shaded area is the potential additional cents per kWh from a 2% annual rate increase in 2019 & 2020.
6.9

Highlights
Why must rates go up? How did you get those increases?
Your next logical question might be, “how did you come up with those rate increases?” Or perhaps, “Why would the rates need to go up at all?”
These are great questions. We can’t just point to one factor. Determining what a rate increase needs to be takes a thorough understanding of how the utility works and what it needs to operate successfully.
Here are a few of the many factors that impact future rates. These examples and others need to be considered when determining what the rate increases need to be:
Increases in Operating Expenses and Purchased Power Expenses See Section 3 on the Background to get a better understanding of these. Decreases in Wholesale Revenue due to changing market conditions See Section 5 on the Risks to get a better
d t di f f th thi
This is a picture of the 1926 commissioning of the transmission lines connecting to our Cushman hydro project. Our utility has operated since 1893 and has a lot of infrastructure to maintain. We maintain and replace our assets with steady capital investments. You can find out more about that those capital investments in capital expenses of Section

pag
Highlights
The charts to the left show two major impacts to our revenue: declining retail and wholesale revenue. (Read more about each of them in the explanation on revenues in Section 3.) The top chart illustrates how our most recent load forecast has changed in the last year. We see increases in conservation and declines in customer consumption, driving a decrease in our expectations for overall load.
The bottom chart illustrates the declining value for each MWh of electricity sold in the wholesale electric markets. The
Declining Retail and Wholesale Revenue
This chart shows a downward trend in the value for each MWh sold, from $49.57/MWh in 2007 to $20.12/MWh in 2017.
This chart shows a downward projection for our load. Load refers to energy consumption. Our system average load is projected to decline at a rate of approximately 0.8% per year.
Load Forecast with Conservation
$49.57
$20.12
$0
$20
$40
$60
2007
2008
2009
2010
2011
2012
2013
2014
2015
2016
2017
$/M
Wh
Annual Value of Wholesale Electric Sales ($/MWh)
Unit Value of Sales ($/MWh)
0
500
1,000aM
W
Actual Load 2018 Forecast

Highlights
Can we change the projected rate increases? Managing the future
The cost of electricity in Washington is just about the lowest of any state in the nation. Additionally, our customers have access to clean, renewable, and reliable electric service at a cost lower than many of our local peers (see page 11 and page 22 for a comparison).
Despite the low rates we currently have, we don’t feel any better about the projected rate increases than you do. We devote a lot of time and effort into developing and executing strategies to mitigate risk, reduce expenses, and increase revenues.
The data in this Plan feeds directly into Tacoma Power’s Strategic Plan. The picture on the right is our Strategy Map – a high level summary of our Strategic Plan. In that plan, we are working on executing strategies we believe will help us reduce future rate increases. A few of the objectives that directly relate to these t t i O ti i Wh l l

Highlights
Active Debt Management Managing Debt Service has produced significant savings
$0
$20
$40
$60
$Mill
ions
2009-2016 Actuals 2010B 2010C 2013A 2013B 2017
Tacoma Power used $122 million in cash to call the 2005B Bonds. You can read more about this on page 43. In fact, in 2010 our debt service payment in 2017 was projected to be over $66 million. After the many changes we have implemented in the last few years, our debt service payments this year will be less than $32 million.
This represents significant savings for Tacoma Power’s customers. In 2016, we were able to not have a rate increase at all and this is largely because of the reduced debt service payments.
Tacoma Power sells bonds to help fund capital improvements. Much like a home mortgage, we can structure this debt to pay it back over 30 years or other intervals. You can see from our existing profile below that bonds we have issued in different years has been structured in different ways. We actively manage this debt profile and have made a number of changes since 2009.
Between 2009 and 2013, Tacoma Power defeased $79 million and refunded $137 million in outstanding bonds. In 2015,
Historical and Scheduled Debt Service
Debt Service as scheduled in 2010

Highlights
The development of a Capital Project Portfolio Management Office will provide utility project managers with centralized data and common tools regarding capital projects. We will use common project management techniques to facilitate more informed decision making at Tacoma Power
Capital Portfolio Management Office (in progress)
Tacoma Power is launching a strategic asset management program to lower the overall cost of managing our physical infrastructure. The objective is data driven and risk-based asset spending decisions with a focus on whole life cost planning. The results of the program include optimized maintenance programs and infrastructure replacement plans developed with objective, repeatable analysis. The strategic asset management program will provide input for both O&M and Capital spending programs. We expect the Asset Management Program will help reduce the size of our Capital budgets and future O&M.
.
Strategic Asset Management (in progress)
Actions The Strategic Plan mentioned previously includes initiatives to manage expenses, such as our Strategic Asset Management Initiative and our Capital Project Portfolio Management Office Initiative.
Other initiatives, such as our O&M Cost Savings Initiative and the development of a debt service management plan, are things we are doing now to find efficiencies and reduce expenses. A brief summary of these and other actions we
Page 81
Page 82
Tacoma Power will develop a new process for the concurrent adoption of rates and the 2019/2020 budget. Our previous process involved adoption of a budget first, and then receiving approval of the rates to support the budget at a later date. There are many steps involved in the budget and rates approval process that will need to be adjusted moving forward.
Concurrent Consideration and Approval of Budget and Rates (in progress)
Page 83
Tacoma Power’s Rates, Planning, and Analysis group has established a process to meet with every section and identify a list of cost savings initiatives the utility can implement. The list of cost saving opportunities will be prioritized and executed according to a developed timeline.
O&M Cost Savings Initiative (in progress)
Page 84


![Indoor supporting current transformers TPU 4xdjang.co.kr/download/abb/a) TPU 4x.xx.pdfIndoor supporting current transformers TPU 4x.xx Highest voltage for equipment [kV] 3,6 up to](https://img.pdfslide.us/doc/110x75/5ea4b6cf10d57b71ba379190/indoor-supporting-current-transformers-tpu-tpu-4xxxpdf-indoor-supporting-current.jpg)