Embed Size (px)
Citation preview

arX
iv:h
ep-l
at/9
6030
03v1
4 M
ar 1
996
TPI-MINN-96/03NUC-MINN-96/5-T
hep-lat/9603003
A STUDY OF THE BULK PHASE TRANSITIONSOF THE SU(2) LATTICE GAUGE THEORY WITH
MIXED ACTION
Rajiv V. Gavai1
Theoretical Physics InstituteSchool of Physics and Astronomy
University of MinnesotaMinneapolis, MN 55455, U.S.A.
ABSTRACT
Using the finite size scaling theory, we re-examine the nature of the bulk phasetransition in the fundamental-adjoint coupling plane of the SU(2) latticegauge theory at βA = 1.25 where previous finite size scaling investigations ofthe deconfinement phase transition showed it to be of first order for temporallattices with four sites. Our simulations on N4 lattices with N=6, 8, 10, 12and 16 show an absence of a first order bulk phase transition. We find thediscontinuity in the average plaquette to decrease approximately linearly withN . Correspondingly, the plaquette susceptibility grows a lot slower with the4-volume of the lattice than expected from a first order bulk phase transition.
1On sabbatical leave from the Tata Institute of Fundamental Research, Homi
Bhabha Road, Mumbai 400005, India. E-Mail: [email protected] and
1

1. INTRODUCTION
The lattice regularization of quantum field theories is a gauge invariantnon-perturbative tool to investigate long distance phenomenon, such as theconfinement of quarks, and to extract the various low energy properties ofquantum chromodynamics, such as the hadronic spectrum. As with otherregularizations, there is a lot of freedom in defining a lattice field theory.In particular, a variety of different choices of the lattice action correspondto the same quantum field theory in the continuum. While most of thenumerical simulations are performed for the Wilson action[1] for the gaugetheories, other choices, some motivated by the desire to find a smoothercontinuum limit, have also been used. Indeed, since these actions differmerely by irrelevant terms in the parlance of the renormalization group, theymust give rise to the same physical results. In view of the necessity of usingfinite lattices and the not-so-small lattice spacings in computer simulations,investigations with different actions can provide an independent check on thecut-off independence of the physical results.
From a more theoretical point of view, investigations with different lat-tice actions could provide clues in understanding the physics of confinement.Since confinement of quarks can be explicitly shown on the lattice in thestrong coupling region, one naively expects a smooth passage to the weakcoupling regime without any phase transitions in order for confinement topersist in the continuum limit. Bhanot and Creutz [2], extending the form ofthe action proposed by Wilson by adding an adjoint coupling term , showedthat confinement could survive even though the phase diagram of the mixedaction, shown in Fig. 1, has the so-called bulk phase transitions along thesolid lines. The termination of the lower line at a finite adjoint coupling, βA,in Fig. 1 allows a smooth path between the confining and the asymptoticallyfree phases. The proximity of this end point to the βA = 0 line, which definesthe Wilson action, has commonly been held responsible for the abrupt changefrom the strong coupling region to the scaling region for the Wilson action.Its relative closeness to the βA = 0 line for the SU(2) theory compared tothe SU(3) theory has been thought of as a possible reason for the shallowerdip in the corresponding non-perturbative β-function obtained[3] by MonteCarlo Renormalization Group methods. In view of the fact that rather smalllattices were used to obtain the phase diagram in Fig. 1, it therefore appears
2

necessary to re-examine the phase diagram on bigger lattices and with betterstatistics. The work reported in this manuscript is a step in that direction.
Another major motivation for re-examining the phase diagram comesfrom our work[4, 5, 6] on the same mixed action at non-zero temperatures.Along the βA = 0.0 axis, several finite temperature investigations have shownthe presence of a second order deconfinement phase transition. Its criticalexponents have been shown[7] to be in very good agreement with those ofthe three dimensional Ising model. Effective field theory arguments for theorder parameter were used by Svetitsky and Yaffe[8] to conjecture the finitetemperature SU(2) gauge theory and the three dimensional Ising model to bein the same universality class. The verification of this universality conjecturethus strengthened our analytical understanding of the deconfinement phasetransition. However, following the deconfinement phase transition into theextended coupling plane by simulating the extended action at finite temper-ature, we surprisingly found that:
a] The deconfinement transition was of second order, and in agreementwith the universality conjectured exponents, only up to βA ≈ 1.0. Itbecame definitely of first order for large enough βA(≥ 1.25).
b] There was no evidence of an another separate bulk transition at largerβA, as suggested by Fig. 1.
Using asymmetric lattices, N3
σ × Nβ , with Nβ = 2-8 and Nσ = 8-16, weobtained the following key results which lead us to the conclusions above:
a] Only one transition was found on all the lattices studied. The decon-finement order parameter acquired nonzero large value at the transitionand showed a clear co-existence of both phases at the transition pointfor larger βA.
b] The same critical exponent which established the transition to be inthe Ising model universality class for 0.0 ≤ βA ≤ 1.0 became equalto the space dimensionality (=3), as a first order deconfinement phasetransition would have, for larger βA.
As argued in Ref. [4] already, the apparent coincidence of the trajectoryof the deconfinement phase transition for Nβ = 4 with the lower arm of
3

the bulk phase diagram of Fig. 1 itself suggests a possible explanation ofthese results: The first order bulk transition overshadows the second orderdeconfinement phase transition. It is therefore mandatory to confirm theexistence of the first order bulk transition on bigger symmetric lattices andwith better statistics than that of Ref. [2]. In this paper, we undertakethis task by simulating the mixed action on symmetric N4 lattices, withN = 6-16. The organization of the paper is as follows: In section 2 we definethe action we investigate and briefly recapitulate the definitions of variousobservables used and their scaling laws. We present the detailed results of oursimulations in the next section and the last section contains a brief summaryof our results and their discussion.
2. THE MODEL AND THE OBSERVABLES
The lattice action is constrained only by a) the gauge invariance and b)the limit of zero lattice spacing which must coincide with the continuumform of the action. Infinitely many different forms satisfying these criteriacan be written down. Bhanot and Creutz extended the Wilson action to aform described by the action,
S =∑
P
(
β(
1 − 1
2TrFUP
)
+ βA
(
1 − 1
3TrAUP
))
. (1)
Here UP denotes the directed product of the basic link variables whichdescribe the gauge fields, Uµ(x), around an elementary plaquette P . F andA denote that the respective traces are evaluated in the fundamental andadjoint representations respectively. We use the formula TrAU = |TrFU |2 −1.
Comparing the naive classical continuum limit of eq. (1) with the stan-dard SU(2) Yang-Mills action, one obtains
1
g2u
=β
4+
2βA
3. (2)
Here gu is the bare coupling constant of the continuum theory. Since theasymptotic scaling equation for the mixed action can be easily written down
4

in terms of gu with a Λ-parameter that depends on the ratio of β and βA, itis clear that the introduction of a non-zero βA does not affect the continuumlimit: the theory for each βA, including the usual Wilson theory for βA = 0.0flows to the same critical fixed point, gc
u = 0, in the continuum limit and hasthe same scaling behavior near the critical point.
As mentioned already in the introduction, Bhanot and Creutz[2] foundthat the lattice theory defined by the extended action of eq.(1) has a richphase structure (Fig. 1). Along the β = 0 axis, it describes the SO(3)model which has a first order phase transition at βcrit
A ∼ 2.5. At βA =∞, it describes the Z2 lattice gauge theory again with a first order phasetransition at βcrit = 1
2ℓn(1 +
√2) ≈ 0.44 [9]. Ref. [2] found that these
first order transitions extend into the (β,βA) plane, ending at an apparentcritical point located at (1.5,0.9). These transition lines are shown in Fig.1 by continuous lines. The qualitative aspects of this phase diagram werealso later reproduced by mean field theory [10] and large N[11] and strongcoupling[12] expansions.
We simulated the mixed action above on N4 lattices, with N = 6, 8, 10,12, and 16. Periodic boundary conditions were used in all the four directions.The partition function is, as usual, given by,
Z =∫
∏
x,µ
dUµ(x) exp(−S) . (3)
We used the simple Metropolis algorithm and tuned it to have an acceptancerate ∼ 30-40 %. The expectation values of the observables were recordedevery 20 iterations to reduce the autocorrelations. Errors were determinedby correcting for the autocorrelations and also by binning. The observablesmonitored were the average plaquette, P, defined as the average of TrFUP /2over all independent plaquettes, and the average of L(~n) over the three di-mensional lattice spanned by ~n, where L is defined by
L(~n) =1
2TrF
N∏
τ=1
U0(~n, τ) . (4)
Here U0(~n, τ) is the timelike link at the lattice site (~n, τ) and due to the sym-metry of our lattices any direction could be identified as the time direction.One sees that the L corresponds to the usual order parameter[13] for thedeconfinement transition on a lattice with N temporal sites but with also
5

N spatial sites. We will comment later on the utility of such an observableon symmetric lattices. In order to monitor the nature of the bulk phasetransition, we also define the plaquette susceptibility:
χN = 6N4(〈P 2〉 − 〈P 〉2) . (5)
According to the finite size scaling theory[14], the peak of the plaquettesusceptibility at the location of the bulk transition we wish to study shouldgrow on an Nd lattice like
χmaxN ∝ Nω . (6)
For a second order transition, ω = α/ν, where α and ν characterize thegrowth of the plaquette susceptibility and the correlation length near thecritical coupling (temperature) on an infinite lattice. If the phase transitionwere to be of first order instead, then one expects the exponent ω = d = 4,corresponding to the dimensionality of the space [15]. In addition, of course,the average plaquette is expected to exhibit a sharp, or even discontinuous,jump and the corresponding probability distribution should show a doublepeak structure in case of a first order phase transition.
3. RESULTS OF THE SIMULATIONS
Our Monte Carlo simulations were done using the Metropolis algorithmon N4 lattices with N= 6, 8, 10, 12 and 16. The many different values ofN were chosen to study the finite size scaling behavior of the theory andto compute the critical exponent ω. For verifying the nature of the lowerarm of the phase diagram in Fig. 1, any value of βA between 0.9 and 2.0would be suitable. Considering, however, the results of Ref. [6], where thedeconfinement transition at βA = 1.25 was shown to be of first order usingN3 × 4 lattices with N = 8, 10, and 12, we chose βA = 1.25 although we alsoattempted additional simulations at βA = 1.5. Histogramming techniques[16]were used to extrapolate to nearby β values for estimating the height andlocation of the peak of the plaquette susceptibility.
Figs. 2 and 3 display the distributions of the average plaquette P atβA = 1.25 on 64, 84, 104 and 124, 164 lattices respectively. The values of thefundamental coupling β at which these runs were made are 1.2147, 1.2179,
6

1.2182, 1.2183 and 1.2184 respectively and the corresponding number of mea-surements, each separated by 20 iterations, are 135000, 107000, 109000, 32500and 13250. Thus Fig. 2 is based on equally high statistics runs. While oneobserves a double peak structure on each of the lattices used, it is clear thatthe distance between the peaks, i.e., the discontinuity in the plaquette, ∆P ,decreases with increasing lattice size. Furthermore, one can also concludefrom Fig. 2 that the valley between the peaks becomes shallower with theincrease in lattice size. Both these observations are, of course, precisely op-posite of what one expects for a first order bulk phase transition. The resultsin Fig. 3 for the bigger lattices are also in accord with both these trendsestablished in Fig. 2, although they are based on rather modest statistics.Indeed, we have actually displayed the results for two neighboring couplingsβ = 1.2183 and 1.2184 on the 164 lattice to highlight any possible doublepeak structures in these runs. If one disregarded the smaller peaks in theseruns as statistically marginal, then the actual discontinuity in ∆P on the 164
is most likely smaller than that suggested by Fig. 3. In Fig. 4, we show thecorresponding plaquette histograms for the finite temperature case of Ref.[6] where a first order deconfinement phase transition was established at thesame βA = 1.25. This was based on the determination of the critical expo-nent for the Polyakov loop (L) susceptibility which was found to be equal tothe space dimensionality, three, in that case. Note that the relative increasein (spatial) volume in going from the smallest to the biggest lattice in Fig.4 is comparable to that for the two smaller lattices in Fig. 2. However, onesees that the peaks in Fig. 4 hardly move and moreover, the valley structuredeepens as the spatial volume is increased. Both these observations are infull accord with the expectations for a first order phase transition. Of course,the key difference in these figures is that the temporal extent is kept fixedfor Fig. 4 whereas it too is increased along with the spatial extent in Figs.2 and 3. Thus the deconfinement phase transition does exhibit the behaviorexpected of a first order phase transition while the bulk phase transition atthe same βA does not.
The above qualitative observation of a lack of a bulk first order-like be-havior can be made quantitatively more firm by using conventional ideas andmethods. Using smooth curves to approximate the peaks in Figs. 2-4, onecan estimate the location of each peak and deduce the size of the disconti-nuity, ∆P , in the average plaquette in each case. These results are givenin Table 1 and are also shown in Fig. 5 as a function of 1/N , where the
7

simulations were done on an N4 lattice. Also listed in Table 1 are the resultsfor the finite temperature case of Fig. 4. The errors reflect the bin sizes inFigs. 2-4. While the ∆P in the finite temperature case is constant, the dataon symmetric N4 lattices are consistent with a linear fall off with 1/N andseem to suggest a zero discontinuity in the average plaquette on a finite butlarge lattice, of the O(704). A linear extrapolation to infinite lattice predictsa ∆P (∞) = −0.011 ± 0.006, which too suggests a lack of any transition al-though a second or higher order transition will be difficult to rule out. Fig.6 exhibits the plaquette susceptibility as a function of β for the 64, 84 and104 lattices. The data point in each case corresponds to the runs shown inFig. 2 and the error bars reflect the increase in the autocorrelation lengthwith lattice size. One can see the that our long runs on each of the latticesare indeed very close to the location of the peak. Thus minimal systematicerrors are expected from the histogramming extrapolation in the locationand the heights of the peaks listed in Table 2. Noting that the increase inthe 4-volume, N4, is respectively a factor of 3.16 and 7.72 compared to thesmallest lattice, it is clear that the increase in plaquette susceptibility is farshort of that needed for a first order bulk transition. A fit of the peak heightsto eq. (6) yields an ω = 2.09± 0.31 which is to be contrasted with the spacedimensionality, 4. The fitted value of ω is consistent with a linear decreasein the discontinuity ∆P seen in Fig. 5, as can be seen from eq. (5). Onecan use this exponent to predict the peak heights for the N = 12 and 16lattices. As can be seen from Table 2, these values, 89 and 163 respectively,compare favorably with the Monte Carlo results. A better determination ofthese peak heights is computationally very hard due to both the large latticesizes and the increase in autocorrelations. Nevertheless, it seems clear thatthe bulk transition at βA = 1.25, if there is one, is not a first order transition.At the very least, this suggests the endpoint of the lower arm in Fig. 1 to beat (β, βA) = (1.2184, 1.25), although a still higher βA and correspondinglysmaller β seems more likely. In view of the results shown in Fig. 4, anddiscussed in more details in Ref. [6], a first order deconfinement phase tran-sition does seem to exist at βA = 1.25, indicating that the deconfinementtransition (for Nβ = 4 but infinite spatial volume) turns first order beforeβA is large enough for a first order bulk phase transition to exist. One istherefore lead to conclude that the change in the order of the deconfinementphase transition is indeed a real finite temperature effect at large βA.
We have also studied the histograms of the average Polyakov loop, L de-
8

fined above, to look for a possible deconfinement phase transition on theselattices and at βA = 1.25 . One expects large corrections due to finite vol-ume since V T 3 is unity in stead of being very large compared to one. Anexpected consequence thus is significantly wider distributions for L, makingthe critical coupling, where the distribution develops a lot flatter peak or amulti-peak structure, shift. We found that the histograms for L were peakedat zero for all the β values discussed above. Increasing β a little, the peakflattened and developed a three peak structure which was however not assharp as the plaquette histograms. As an example, let us quote that such adetermination lead to βc(N = 6) ≃ 1.2179, which should be compared withthe βc obtained from the peak of the plaquette susceptibility and given inTable 2. One may be tempted to interpret this as a sign that the decon-finement transition is splitting away from the bulk transition and moving tolarger β. On the other hand, it is not uncommon for different observablesand thus different definitions to yield different estimates for the location ofthe same transition on a finite lattice. Only in the thermodynamic limit isit necessary for all the estimates to coincide. As argued already, such differ-ences are all the more natural since V T 3 = 1. It therefore appears to us thateven on these symmetric lattices either the deconfinement phase transition isthe only transition or at least it is coincident with a (second or higher order)bulk transition signaled by the rapid changes in the average action. It shouldbe noted that a decrease in the plaquette discontinuity, as seen in Fig. 5,would be naively consistent with the first option since an increase in N for aconstant critical temperature would amount to decreasing the lattice spacingin that case and a decrease in plaquette discontinuity could then be a wayto hold the corresponding latent heat constant. In that case, the bulk finitesize scaling arguments, involving a scaling with the 4-volume N4 would notapply. In stead, it would be necessary to check the scaling by holding Nβ
fixed and with a large V T 3. Precisely such an exercise was carried out inRef. [6] and it did establish a first order deconfinement phase transition.
We have also attempted to repeat the above exercise at a larger βA = 1.5to find out whether a first order bulk phase transition exists there. As thesize of discontinuity on the smaller lattices, 64 and 84, also increases with theincrease in βA, it became difficult to perform any meaningful finite size scalinganalysis. In particular, we found that the ordered and random starts atβ = 1.045 on these lattices remained separate even after 50000 measurements,corresponding to 1 million sweeps. This calls for a use of better algorithms
9

which will encourage tunnelings between the two states and thus permita reliable finite size scaling study. The plaquette discontinuities from ourruns were found to be 0.22352 (15) and 0.22291 (12), showing a minisculedecrease of 0.00061 (19). While this is an encouraging sign for the existenceof a first order bulk phase transition, the results of Fig. 7 show an amusingcorrelation of the deconfinement phase transition with it. Fig. 7 shows thehysteresis effects in the average plaquette P and the Polyakov loop L onN4 lattices with N = 4, 6, 8, 10 and 12 at βA = 1.5. Starting from aβ = 0.95 with a disordered start for the gauge variables, 2000 iterations wereperformed at each β at an interval of δβ = 0.01 to thermalize and then theobservables were recorded over the next 8000 iterations. Similarly a run wasbegun from β = 1.15 with an ordered start to obtain the other branch. Agood agreement between the two curves outside the metastable area is anindication that the metastabilities are real. In spite of the large fluctuationsin L for larger β, it appears that both L and P on all the lattices undergostrong changes at about the same β. The size of plaquette discontinuitysuggested by Fig. 7 is approximately the same as mentioned above and itseems to remain unchanged even on a 124 lattice. It should perhaps benoted that the decrease in the discontinuity in L is related to the well knownobservation of the decrease of L in the high temperature phase with N (or temporal lattice size). Unfortunately, the big metastable region in Fig.7, related to the large discontinuity in P , makes it very hard to ascertainwhether one is dealing with two transitions here or one and what finite sizescaling properties they have (or it has).
4. SUMMARY AND DISCUSSION
The phase diagram of the mixed action of eq. (1) in the fundamental andadjoint couplings, β and βA, has been a crucial input in understanding manyproperties of the SU(2) and SU(3) lattice theories and their continuum limit.The cross-over to the scaling region from the strong coupling region, as wellas the dip in the non-perturbative β-function have been attributed to thelocation of the end point of the line of bulk first order phase transition. Infact, even the relative shallowness of the dip for the SU(2) case compared tothe SU(3) case is thought to be due to the closeness of the corresponding endpoint to the βA = 0 Wilson axis. The recently observed change of the order
10

of the deconfinement phase transition for the SU(2) lattice gauge theory forlattices with four (and two) temporal sites could also be due to the seeminglypuzzling coincidence of the bulk first order line with the deconfinement linefor large enough βA.
The phase diagram of Fig.1, taken from Ref. [2], was obtained on smallerlattices, 54-74, and with modest statistics. We simulated the extended actionon N4 lattices with N = 6, 8, 10, 12, and 16 at βA = 1.25 and 1.5. The choiceof these adjoint couplings was based on the results of Ref. [4, 6] where thedeconfinement transition was shown to be of first order for Nβ = 4 using finitesize scaling theory. In particular, the susceptibility for the order parameter,the Polyakov loop, was shown to increase linearly with spatial volume atβA=1.25; it grew approximately as the two-third power of the spatial volumefor small βA which is similar to the Ising model in three dimensions which hasa second order phase transition. We found that the plaquette distributions doexhibit a double peak structure on the symmetric lattices as well. However,the major difference was that the peaks appear to approach each other andthe intervening valley appears to become shallower as the lattice size N isincreased at the same βA = 1.25. Quantitatively, this was reflected in amuch slower increase in the plaquette susceptibility with the 4-volume thanwould be expected for a first order bulk phase transition and a linear decreasein the size of the discontinuity of the plaquette, ∆P , with N . The criticalexponent ω, defined in eq. (6), was found to be 2.09 ± 0.31 in contrast tothe expected value of 4 for a first order bulk phase transition. While a linearextrapolation of our data on ∆P suggests that it vanishes already on finite,O(704) lattices, we are unable to rule out a second or higher order bulkphase transition at βA = 1.25. We conclude that the endpoint of the bulkline in Fig. 1 is most likely at a βA ≥ 1.25 with a correspondingly smallerβ = 1.2184 or lesser. It also seems therefore that the change of the order ofthe deconfinement phase transition for Nβ = 4 at βA ≃ 1.25 is unlikely tobe influenced by any (first order) bulk phase transition. As argued in Ref.[6], strong coupling arguments do suggest precisely this, namely, the increasein βA changes the effective potential for the order parameter to allow a firstorder deconfinement phase transition at sufficiently large βA and thus thebulk dynamics need not play any role in such a change.
Our simulations at the larger βA = 1.5 were inadequate to test in asimilar manner using finite size scaling theory whether the transition thereis a first order bulk phase transition or not. The large size of the plaquette
11

discontinuity on the smaller lattices meant that the Metropolis algorithm wasinefficient in effectively sampling both the states, thus aborting our attemptsto check whether ω = 4. On the other hand, the decrease in ∆P with Nappeared to be much smaller than at βA = 1.25. Hysteresis runs on a varietyof lattice sizes showed that the deconfinement order parameter too jumps atthe transition rather abruptly, suggesting that the deconfinement transitionis either very close to the bulk transition or even coincident. It would bevery interesting to decipher the finite size scaling behavior at these largerβA to distinguish the two very different transitions. Indeed, even in thecase of the SU(3) gauge theory, where simulations[17] with the mixed actionhave yielded a separation of the line of the deconfinement phase transitionsfrom the line of bulk phase transitions with increasing Nβ, a convincingdemonstration of such a separation would really come from similar finite sizescaling investigations.
6. ACKNOWLEDGMENTS
The computations reported here were performed on the DEC Alpha ma-chines of the Tata Institute of Fundamental Research, Mumbai and theTheoretical Physics Institute, University of Minnesota, Minneapolis and theCRAY-2 of the Minnesota Supercomputer Institute, Minneapolis. I wouldlike to thank the staff at these institutes for their support. I gratefully ac-knowledge the hospitality I received in TPI, Minneapolis, especially fromProfs. J. Kapusta and L. McLerran. This work was supported by the U. S.Department of Energy under the grant DE-FG02-87ER40328.
12

References
[1] K. Wilson, Phys. Rev. D10, 2445 (1974).
[2] G. Bhanot and M. Creutz, Phys. Rev. D24, 3212 (1981).
[3] A. Patel, S. Otto and R. Gupta, Phys. Lett. 159B, 143 (1985);U. Heller and F. Karsch, Phys. Rev. Lett. 54, 1765 (1985).
[4] R. V. Gavai, M. Grady and M. Mathur Nucl. Phys. B423, 123(1994).
[5] M. Mathur, R. V. Gavai, Nucl. Phys. B448, 399 (1995); Nucl.Phys. B (PS) 42, 490 (1995).
[6] R. V. Gavai and M. Mathur, hep-lat/9512015, TPI-MINN-95/33,NUC-MINN-95/27-T, IFUP-TH 72/95.
[7] J. Engels, J. Fingberg and M. Weber, Nucl. Phys. B332, 737(1990);J. Engels, J. Fingberg and D. E. Miller, Nucl. Phys. B387, 501(1992).
[8] B. Svetitsky and L. G. Yaffe, Nucl. Phys. B210[FS6], 423 (1982).
[9] F. J. Wegner , J. Math. Phys. 12, 2259 (1971).
[10] J. M. Alberty, H. Flyvbjerg and B. Lautrup, Nucl. Phys.B220[FS8], 61 (1983).
[11] M. C. Ogilvie, A. Horowitz, Nucl. Phys. B215[FS7], 249 (1983).
[12] R. Dashen, Urs M. Heller and H. Neuberger, Nucl. Phys.B215[FS7], 360 (1983).
[13] L. McLerran and B. Svetitsky, Phys. Rev. D24, 450 (1981).
[14] M. N. Barber, in Phase Transitions and Critical Phenomena, vol.8, Ed. C. Domb and J. L. Lebowitz (Academic Press, New York,1983) p. 146.
13

[15] M. S. Challa, D. P. Landau and K. Binder, Phys. Rev. B34, 1841(1986).
[16] A. M. Ferrenberg and R. H. Swendsen, Phys. Rev. Lett. 61, 2635(1988).
[17] T. Blum, C. DeTar, U. M. Heller, L. Karkkainen and D. Tous-saint, Nucl. Phys. B442, 301 (1995).
14

FIGURE CAPTIONS
Fig. 1 The phase diagram of the extended SU(2) lattice gauge theory. Takenfrom Ref. [2].
Fig. 2 Probability distribution of the average Plaquette P at βA = 1.25 onN4 lattices with N=6, 8, and 10 The values of β for these runs are given inthe text.
Fig. 3 Same as in Fig. 2 but for N = 12 and 16.
Fig. 4 Same as in Fig. 2 but for the asymmetric lattices N3 × 4 with N =8, 10, and 12. lattices.
Fig. 5 The discontinuity in the average Plaquette, ∆P , on N4 lattices as afunction of 1/N for βA = 1.25. The line denotes a simple linear fit.
Fig. 6 Plaquette susceptibility as a function of β on N4 lattices with N=6,8, and 10 for βA = 1.25.
Fig. 7 The hysteresis in the average plaquette P and the order parameterfor deconfinement, L, as a function of β. All the results were obtained onN4 lattices for N=8, 10, and 12 and at βA = 1.25.

Table 1
The average values of the plaquette discontinuity ∆Pat βA = 1.25 on symmetric N4 lattices and asymmetricN3 × 4 lattices. The data for latter are takenfrom Ref. [6]
Lattice Size ∆P
64 0.111(4)
84 0.081(4)
104 0.060(4)
124 0.0495(40)
164 0.036(4)
83 × 4 0.102(4)
103 × 4 0.099(4)
123 × 4 0.096(4)
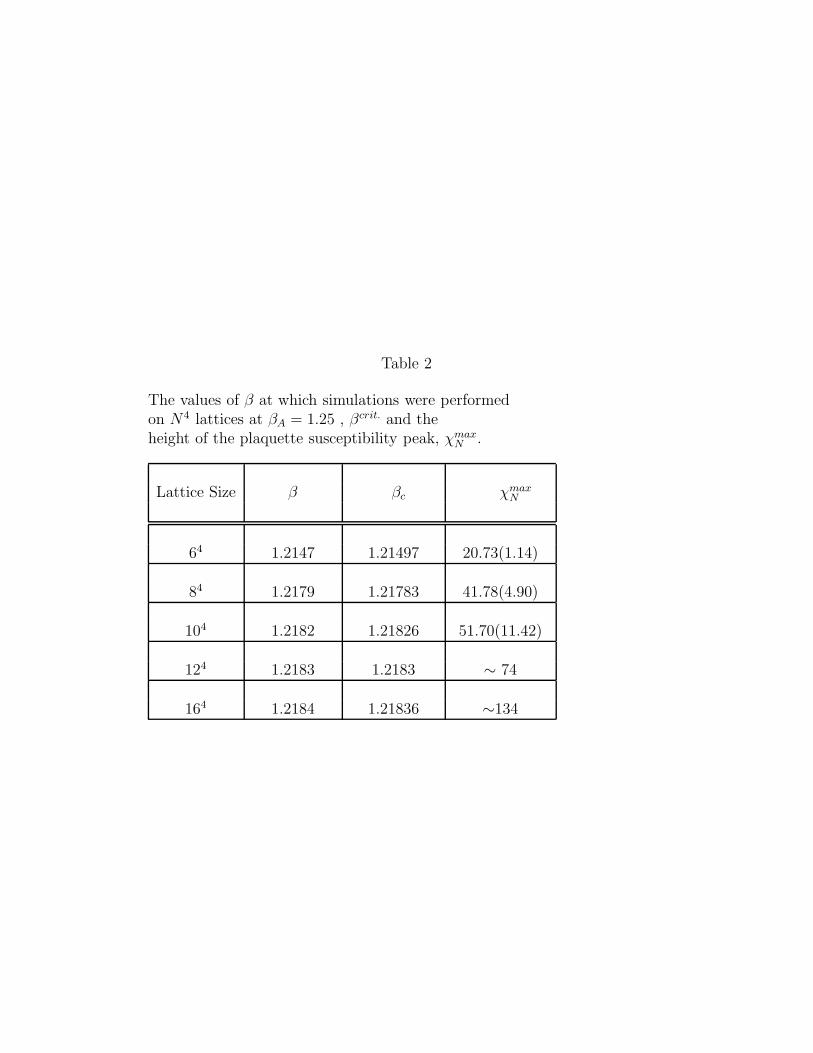
Table 2
The values of β at which simulations were performedon N4 lattices at βA = 1.25 , βcrit. and theheight of the plaquette susceptibility peak, χmax
N .
Lattice Size β βc χmaxN
64 1.2147 1.21497 20.73(1.14)
84 1.2179 1.21783 41.78(4.90)
104 1.2182 1.21826 51.70(11.42)
124 1.2183 1.2183 ∼ 74
164 1.2184 1.21836 ∼134

0
0.5
1
1.5
2
2.5
3
3.5
0 0.5 1 1.5 2 2.5
Bet
a_A
Beta

0
1000
2000
3000
4000
5000
6000
0.5 0.55 0.6 0.65 0.7 0.75 0.8
N(P
)
P
’6^4’’8^4’
’10^4’

0
200
400
600
800
1000
1200
1400
1600
1800
0.5 0.55 0.6 0.65 0.7 0.75 0.8
N(P
)
P
’Beta=1.2183 (12^4)’’Beta=1.2183 (16^4)’’Beta=1.2184 (16^4)’

0
1000
2000
3000
4000
5000
6000
7000
8000
9000
10000
0.5 0.55 0.6 0.65 0.7 0.75 0.8
N(P
)
P
’8^3 X 4’’10^3 X 4’’12^3 X 4’

0
0.05
0.1
0.15
0.2
0 0.05 0.1 0.15 0.2
Del
ta P
1/N
N^4 Lattices
Beta_A = 1.25
N = 6, 8, 10, 12, 16

0
10
20
30
40
50
60
70
1.2 1.205 1.21 1.215 1.22 1.225 1.23
Pla
q. S
usc.
Beta
Beta_A =1.25
’6^4’’8^4’
’10^4’’M.C.’

0
0.1
0.2
0.3
0.4
0.5
0.6
0.7
0.8
0.94 0.96 0.98 1 1.02 1.04 1.06 1.08 1.1 1.12 1.14 1.16
<L>
, <P
>
Beta
Beta_A = 1.5; N^4 lattices
N=12
N=10
N=8
N=6
N=4