Embed Size (px)
Citation preview
Investor Presentation
June 2018
Alaskan Way Viaduct (SR 99) Replacement Project, Seattle
Forward-Looking StatementsStatements contained in this presentation that are not purely historical are forward-looking statements within the meaning of the Private Securities Litigation Reform Act of 1995, including without limitation, statements regarding the Company’s expectations, hopes, beliefs, intentions or strategies regarding the future and statements regarding future guidance or estimates and non-historical performance. These forward-looking statements are based on the Company’s current expectations and beliefs concerning future developments and their potential effects on the Company. While the Company’s expectations, beliefs and projections are expressed in good faith and the Company believes there is a reasonable basis for them, there can be no assurance that future developments affecting the Company will be those that we have anticipated. These forward-looking statements involve a number of risks, uncertainties (some of which are beyond the control of the Company) or other assumptions that may cause actual results or performance to be materially different from those expressed or implied by such forward-looking statements. These risks and uncertainties include, but are not limited to, inaccurate estimates of contract risks, revenue or costs, the timing of new awards or the pace of project execution; the requirement to perform extra, or change order, work resulting in disputes or claims, which may adversely affect our working capital, profits and cash flows; unfavorable outcomes of existing or future litigation or dispute resolution proceedings against project owners, subcontractors or suppliers, as well as failure to promptly recover significant working capital invested in projects subject to such matters; a significant slowdown or decline in economic conditions; increased competition and failure to secure new contracts; client cancellations of, or reductions in scope under, contracts reported in our backlog; actual results could differ from the assumptions and estimates used to prepare financial statements; failure to meet contractual schedule requirements, which could result in higher costs and reduced profits or, in some cases, exposure to financial liability for liquidated damages and/or damages to customers; failure of our joint venture partners to perform their venture obligations, which could impose additional financial and performance obligations on us, resulting in reduced profits or losses; decreases in the level of government spending for infrastructure and other public projects; inability to retain key members of our management, to hire and retain personnel required to complete projects or implement succession plans for key officers; failure to meet our obligations under our debt agreements; possible systems and information technology interruptions; failure to comply with laws and regulations related to government contracts; inclement weather; conversion of our outstanding Convertible Notes that could dilute ownership interests of existing stockholders and could adversely affect the market price of our common stock; the potential dilutive impact of our Convertible Notes in our diluted earnings per share calculation; economic, political and other risks, including civil unrest, security issues, labor conditions, corruption and other unforeseeable events in countries where we do business, resulting in unanticipated losses; impairment of our goodwill or other indefinite-lived intangible assets; and other risks and uncertainties discussed under the heading “Risk Factors” in our Annual Report on Form 10-K for the year ended December 31, 2017 filed with theSecurities and Exchange Commission on February 27, 2018. The Company undertakes no obligation to publicly update or revise any forward-looking statements, whether as a result of new information, future events or otherwise, except as may be required under applicable securities laws.
2
Company Overview
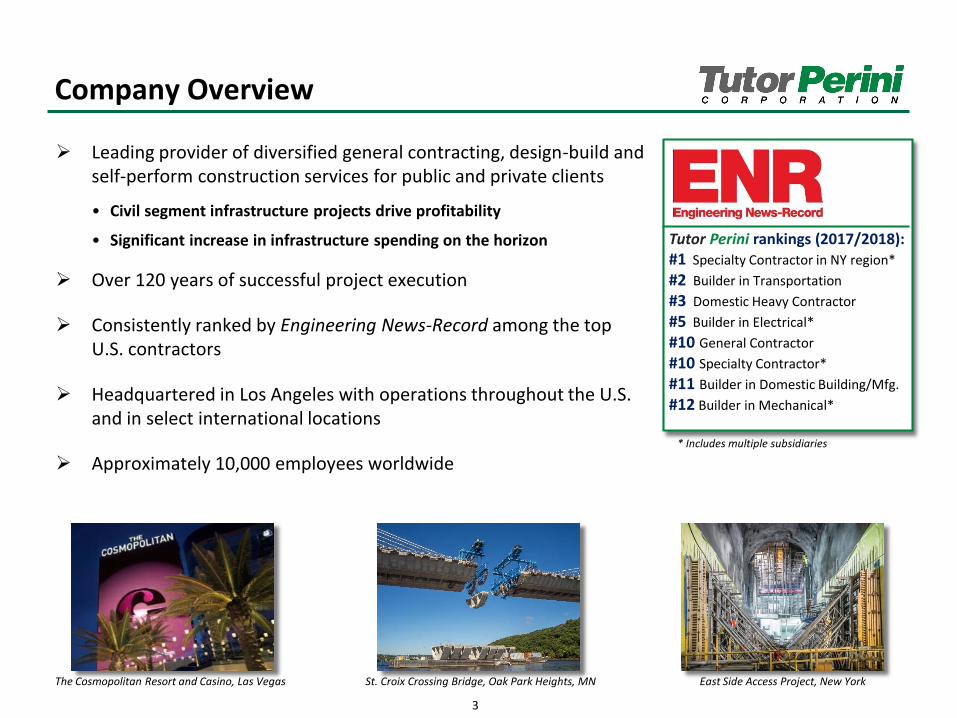
Leading provider of diversified general contracting, design-build and self-perform construction services for public and private clients
• Civil segment infrastructure projects drive profitability
• Significant increase in infrastructure spending on the horizon
Over 120 years of successful project execution
Consistently ranked by Engineering News-Record among the top U.S. contractors
Headquartered in Los Angeles with operations throughout the U.S. and in select international locations
Approximately 10,000 employees worldwide
3
Tutor Perini rankings (2017/2018):#1 Specialty Contractor in NY region*
#2 Builder in Transportation
#3 Domestic Heavy Contractor
#5 Builder in Electrical*
#10 General Contractor
#10 Specialty Contractor*
#11 Builder in Domestic Building/Mfg.
#12 Builder in Mechanical*
* Includes multiple subsidiaries
The Cosmopolitan Resort and Casino, Las Vegas St. Croix Crossing Bridge, Oak Park Heights, MN East Side Access Project, New York
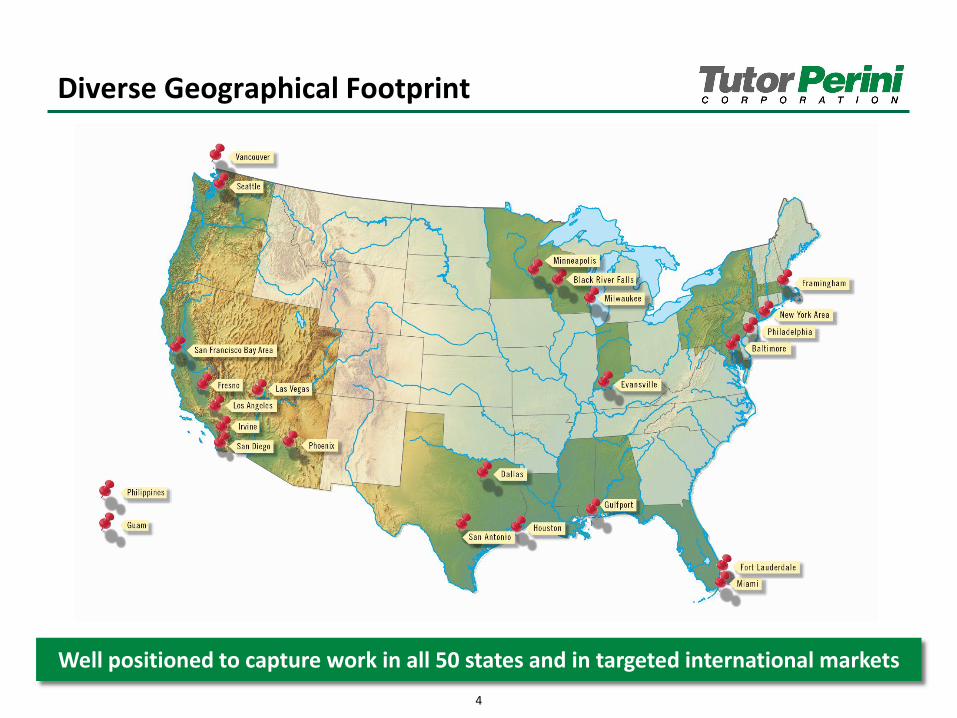
Diverse Geographical Footprint
Well positioned to capture work in all 50 states and in targeted international markets
4
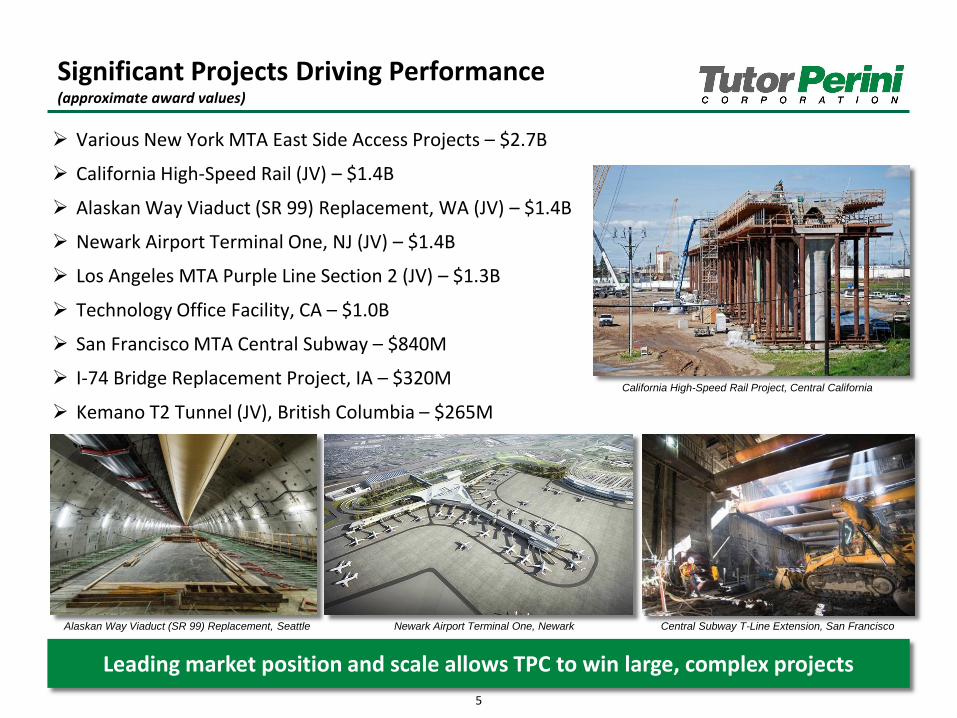
Significant Projects Driving Performance(approximate award values)
Leading market position and scale allows TPC to win large, complex projects
5
Various New York MTA East Side Access Projects – $2.7B
California High-Speed Rail (JV) – $1.4B
Alaskan Way Viaduct (SR 99) Replacement, WA (JV) – $1.4B
Newark Airport Terminal One, NJ (JV) – $1.4B
Los Angeles MTA Purple Line Section 2 (JV) – $1.3B
Technology Office Facility, CA – $1.0B
San Francisco MTA Central Subway – $840M
I-74 Bridge Replacement Project, IA – $320M
Kemano T2 Tunnel (JV), British Columbia – $265M
California High-Speed Rail Project, Central California
Alaskan Way Viaduct (SR 99) Replacement, Seattle Newark Airport Terminal One, Newark Central Subway T-Line Extension, San Francisco
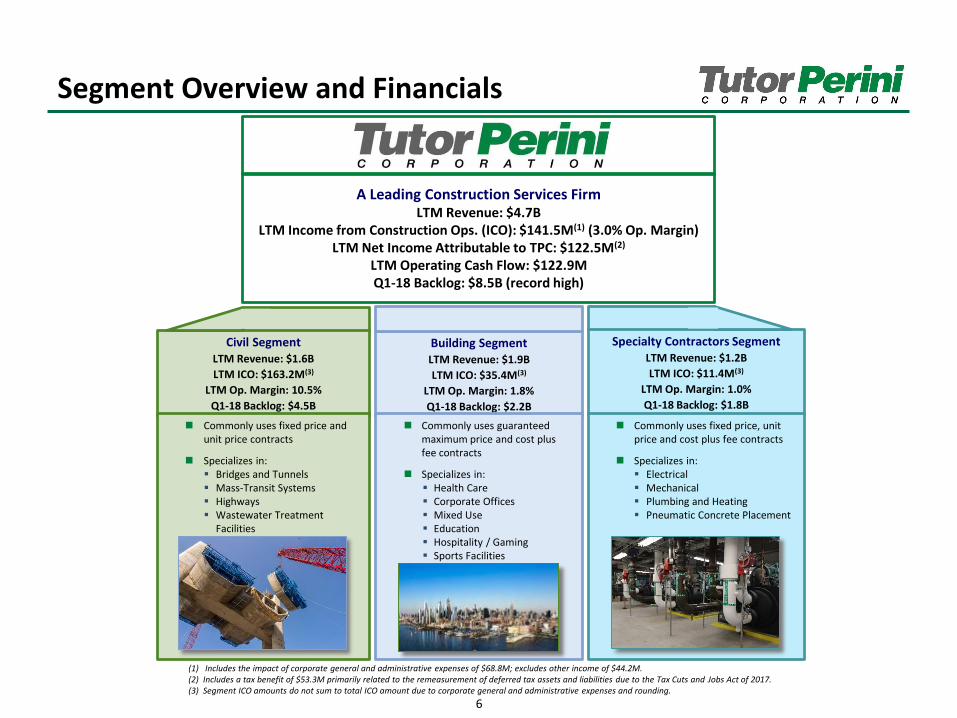
Segment Overview and Financials
A Leading Construction Services FirmLTM Revenue: $4.7B
LTM Income from Construction Ops. (ICO): $141.5M(1) (3.0% Op. Margin)LTM Net Income Attributable to TPC: $122.5M(2)
LTM Operating Cash Flow: $122.9MQ1-18 Backlog: $8.5B (record high)
Building SegmentLTM Revenue: $1.9B
LTM ICO: $35.4M(3)
LTM Op. Margin: 1.8%
Q1-18 Backlog: $2.2B
Civil SegmentLTM Revenue: $1.6B
LTM ICO: $163.2M(3)
LTM Op. Margin: 10.5%
Q1-18 Backlog: $4.5B
Commonly uses guaranteed maximum price and cost plus fee contracts
Specializes in: Health Care Corporate Offices Mixed Use Education Hospitality / Gaming Sports Facilities
Commonly uses fixed price and unit price contracts
Specializes in: Bridges and Tunnels Mass-Transit Systems Highways Wastewater Treatment
Facilities
Specialty Contractors SegmentLTM Revenue: $1.2B
LTM ICO: $11.4M(3)
LTM Op. Margin: 1.0%
Q1-18 Backlog: $1.8B
Commonly uses fixed price, unit price and cost plus fee contracts
Specializes in: Electrical Mechanical Plumbing and Heating Pneumatic Concrete Placement
6
(1) Includes the impact of corporate general and administrative expenses of $68.8M; excludes other income of $44.2M.(2) Includes a tax benefit of $53.3M primarily related to the remeasurement of deferred tax assets and liabilities due to the Tax Cuts and Jobs Act of 2017.(3) Segment ICO amounts do not sum to total ICO amount due to corporate general and administrative expenses and rounding.
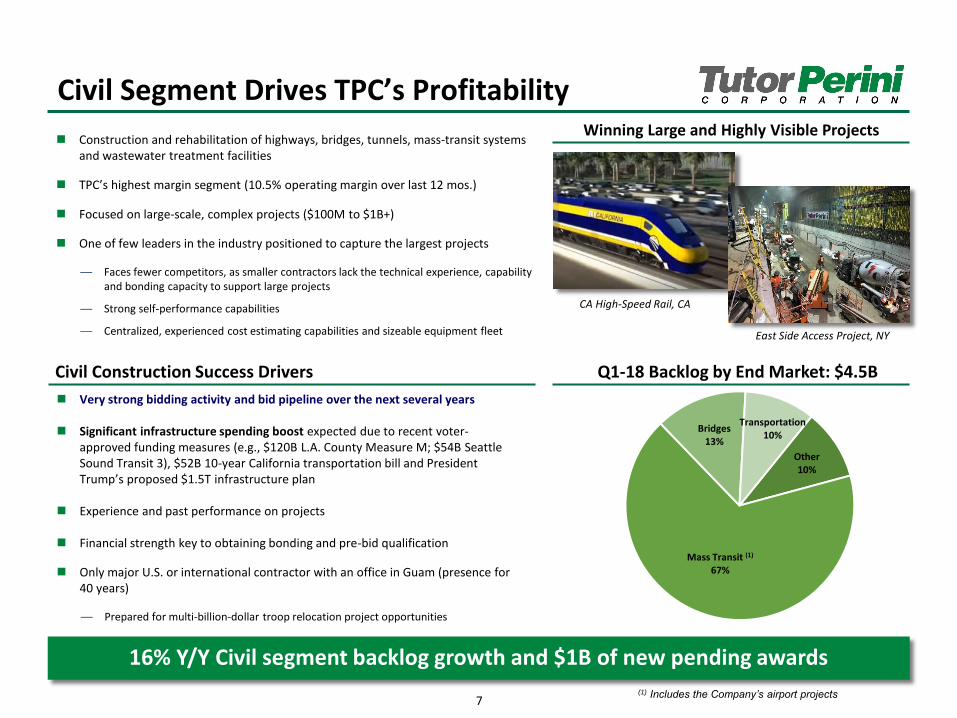
Civil Segment Drives TPC’s Profitability
16% Y/Y Civil segment backlog growth and $1B of new pending awards
Construction and rehabilitation of highways, bridges, tunnels, mass-transit systems and wastewater treatment facilities
TPC’s highest margin segment (10.5% operating margin over last 12 mos.)
Focused on large-scale, complex projects ($100M to $1B+)
One of few leaders in the industry positioned to capture the largest projects
— Faces fewer competitors, as smaller contractors lack the technical experience, capability and bonding capacity to support large projects
— Strong self-performance capabilities
— Centralized, experienced cost estimating capabilities and sizeable equipment fleet
Civil Construction Success Drivers Q1-18 Backlog by End Market: $4.5B
Very strong bidding activity and bid pipeline over the next several years
Significant infrastructure spending boost expected due to recent voter-approved funding measures (e.g., $120B L.A. County Measure M; $54B Seattle Sound Transit 3), $52B 10-year California transportation bill and President Trump’s proposed $1.5T infrastructure plan
Experience and past performance on projects
Financial strength key to obtaining bonding and pre-bid qualification
Only major U.S. or international contractor with an office in Guam (presence for 40 years)
— Prepared for multi-billion-dollar troop relocation project opportunities
CA High-Speed Rail, CA
7
East Side Access Project, NY
Winning Large and Highly Visible Projects
(1) Includes the Company’s airport projects
(1)
Other10%
Mass Transit (1)
67%
Bridges13%
Transportation10%
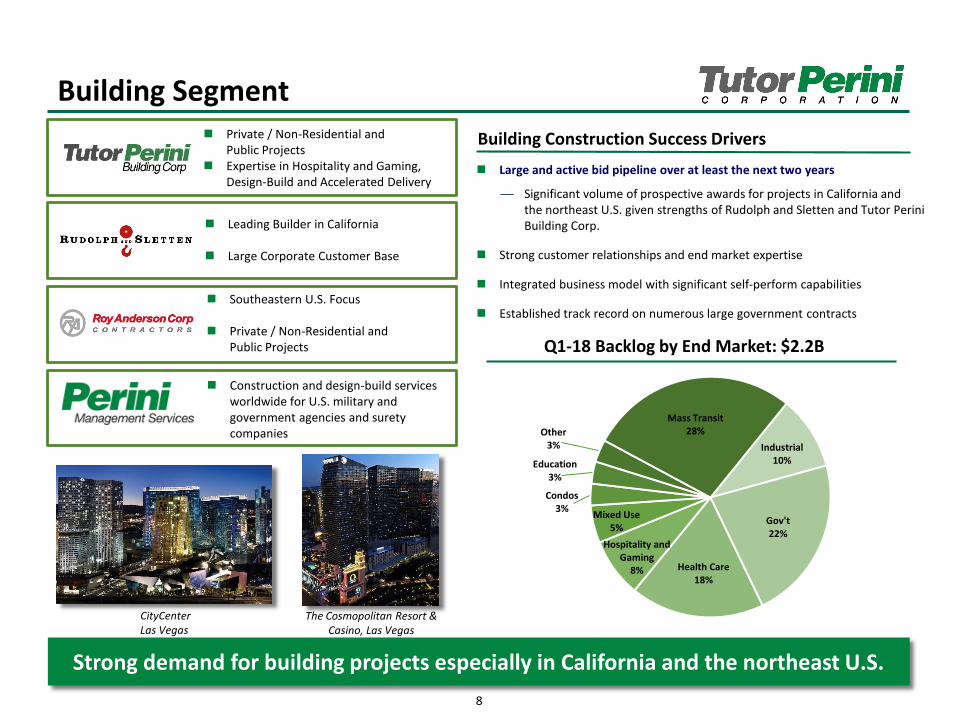
Building Segment
Strong demand for building projects especially in California and the northeast U.S.
Building Construction Success Drivers
Large and active bid pipeline over at least the next two years
— Significant volume of prospective awards for projects in California andthe northeast U.S. given strengths of Rudolph and Sletten and Tutor Perini Building Corp.
Strong customer relationships and end market expertise
Integrated business model with significant self-perform capabilities
Established track record on numerous large government contracts
Q1-18 Backlog by End Market: $2.2B
Leading Builder in California
Large Corporate Customer Base
Private / Non-Residential andPublic Projects
Expertise in Hospitality and Gaming,Design-Build and Accelerated Delivery
Southeastern U.S. Focus
Private / Non-Residential andPublic Projects
Construction and design-build services worldwide for U.S. military and government agencies and surety companies
CityCenterLas Vegas
8
The Cosmopolitan Resort & Casino, Las Vegas
Industrial10%
Gov't22%
Health Care18%
Hospitality and Gaming
8%
Mixed Use5%
Condos3%
Education3%
Other3%
Mass Transit28%
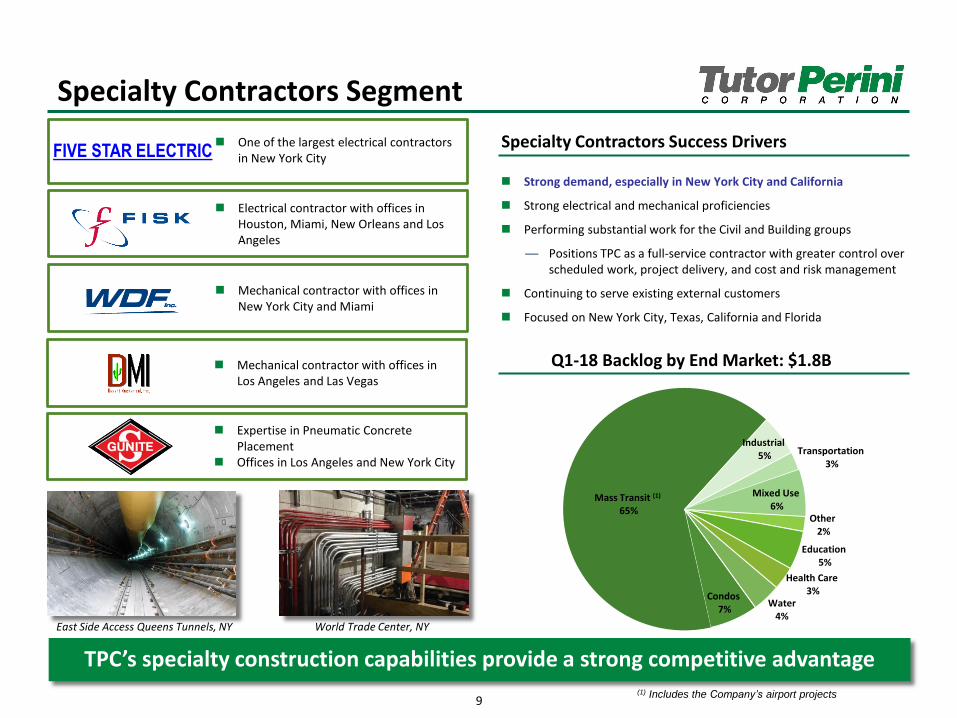
Specialty Contractors Segment
TPC’s specialty construction capabilities provide a strong competitive advantage
Q1-18 Backlog by End Market: $1.8B
Specialty Contractors Success Drivers
Strong demand, especially in New York City and California
Strong electrical and mechanical proficiencies
Performing substantial work for the Civil and Building groups
— Positions TPC as a full-service contractor with greater control over scheduled work, project delivery, and cost and risk management
Continuing to serve existing external customers
Focused on New York City, Texas, California and Florida
9
East Side Access Queens Tunnels, NY World Trade Center, NY
One of the largest electrical contractors in New York City
Electrical contractor with offices in Houston, Miami, New Orleans and Los Angeles
Mechanical contractor with offices in New York City and Miami
Mechanical contractor with offices in Los Angeles and Las Vegas
Expertise in Pneumatic Concrete Placement
Offices in Los Angeles and New York City
FIVE STAR ELECTRIC
Condos7%
Mass Transit (1)
65%
Industrial5% Transportation
3%
Mixed Use6%
Other2%
Education5%
Health Care3%
Water4%
(1) Includes the Company’s airport projects
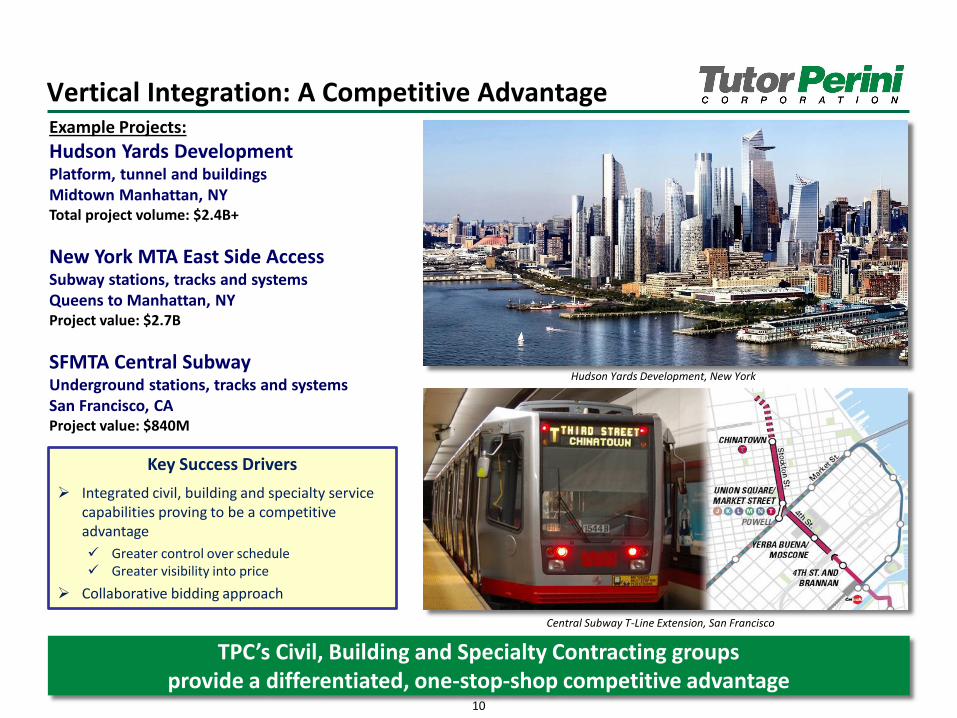
Vertical Integration: A Competitive Advantage
Key Success Drivers
Integrated civil, building and specialty service capabilities proving to be a competitive advantage
Greater control over schedule Greater visibility into price
Collaborative bidding approach
10
Example Projects:
Hudson Yards DevelopmentPlatform, tunnel and buildingsMidtown Manhattan, NYTotal project volume: $2.4B+
New York MTA East Side AccessSubway stations, tracks and systemsQueens to Manhattan, NYProject value: $2.7B
SFMTA Central SubwayUnderground stations, tracks and systemsSan Francisco, CAProject value: $840M
Hudson Yards Development, New York
Central Subway T-Line Extension, San Francisco
TPC’s Civil, Building and Specialty Contracting groupsprovide a differentiated, one-stop-shop competitive advantage
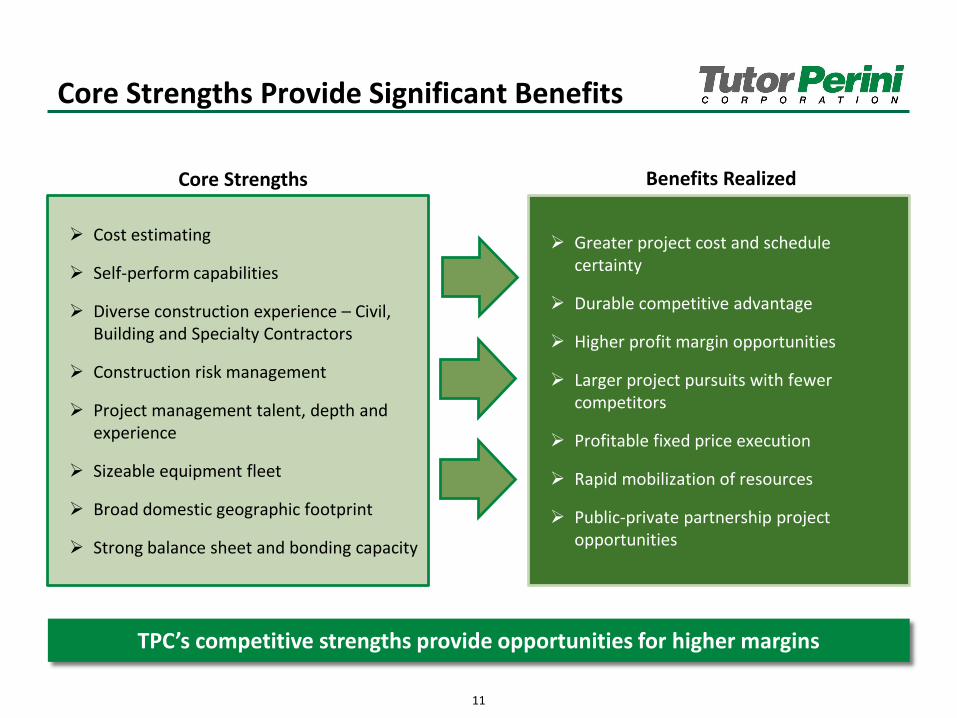
Core Strengths Provide Significant Benefits
Core Strengths
Greater project cost and schedule certainty
Durable competitive advantage
Higher profit margin opportunities
Larger project pursuits with fewer competitors
Profitable fixed price execution
Rapid mobilization of resources
Public-private partnership project opportunities
11
Cost estimating
Self-perform capabilities
Diverse construction experience – Civil, Building and Specialty Contractors
Construction risk management
Project management talent, depth and experience
Sizeable equipment fleet
Broad domestic geographic footprint
Strong balance sheet and bonding capacity
TPC’s competitive strengths provide opportunities for higher margins
Benefits Realized
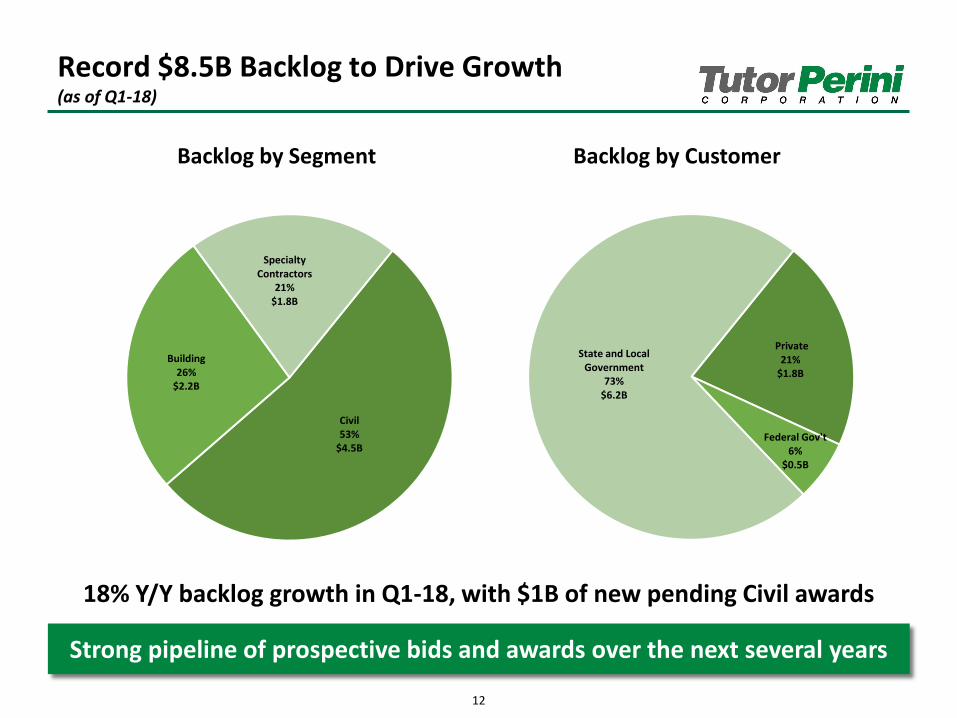
Record $8.5B Backlog to Drive Growth(as of Q1-18)
Strong pipeline of prospective bids and awards over the next several years
12
Backlog by Segment Backlog by Customer
18% Y/Y backlog growth in Q1-18, with $1B of new pending Civil awards
Civil53%
$4.5B
Building26%
$2.2B
Specialty Contractors
21%$1.8B
Private21%
$1.8B
Federal Gov't6%
$0.5B
State and Local Government
73%$6.2B
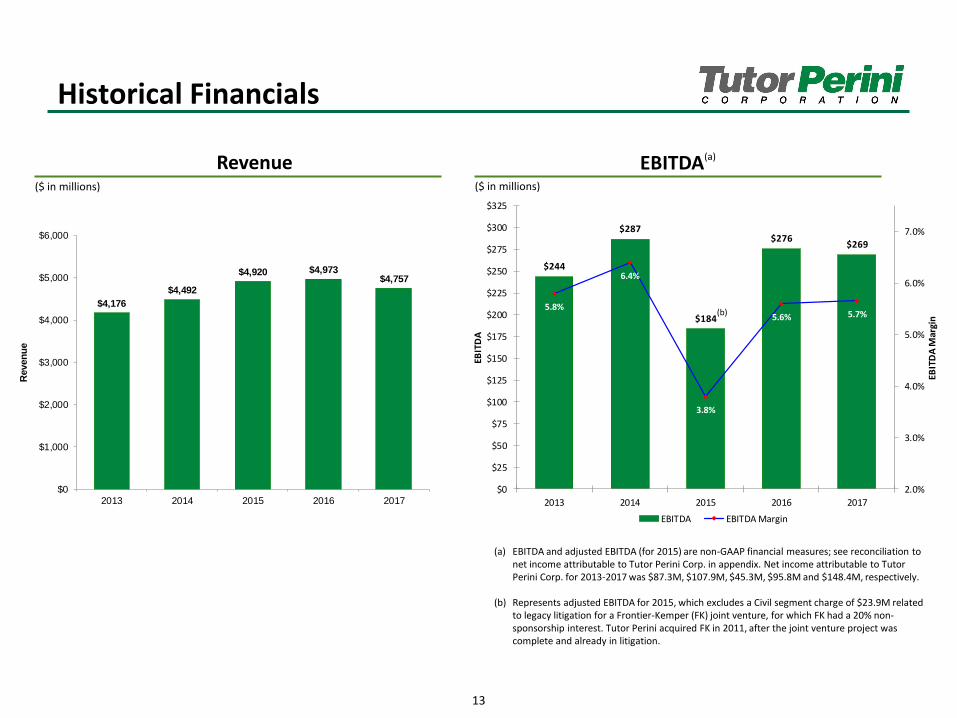
$4,176
$4,492
$4,920 $4,973 $4,757
$0
$1,000
$2,000
$3,000
$4,000
$5,000
$6,000
2013 2014 2015 2016 2017
Reven
ue
$244
$287
$184
$276 $269
5.8%
6.4%
3.8%
5.6% 5.7%
2.0%
3.0%
4.0%
5.0%
6.0%
7.0%
$0
$25
$50
$75
$100
$125
$150
$175
$200
$225
$250
$275
$300
$325
2013 2014 2015 2016 2017
EBIT
DA
Mar
gin
EBIT
DA
EBITDA EBITDA Margin
Revenue EBITDA(a)
Historical Financials
($ in millions)
13
(a) EBITDA and adjusted EBITDA (for 2015) are non-GAAP financial measures; see reconciliation to net income attributable to Tutor Perini Corp. in appendix. Net income attributable to Tutor Perini Corp. for 2013-2017 was $87.3M, $107.9M, $45.3M, $95.8M and $148.4M, respectively.
(b) Represents adjusted EBITDA for 2015, which excludes a Civil segment charge of $23.9M related to legacy litigation for a Frontier-Kemper (FK) joint venture, for which FK had a 20% non-sponsorship interest. Tutor Perini acquired FK in 2011, after the joint venture project was complete and already in litigation.
($ in millions)
(b) **
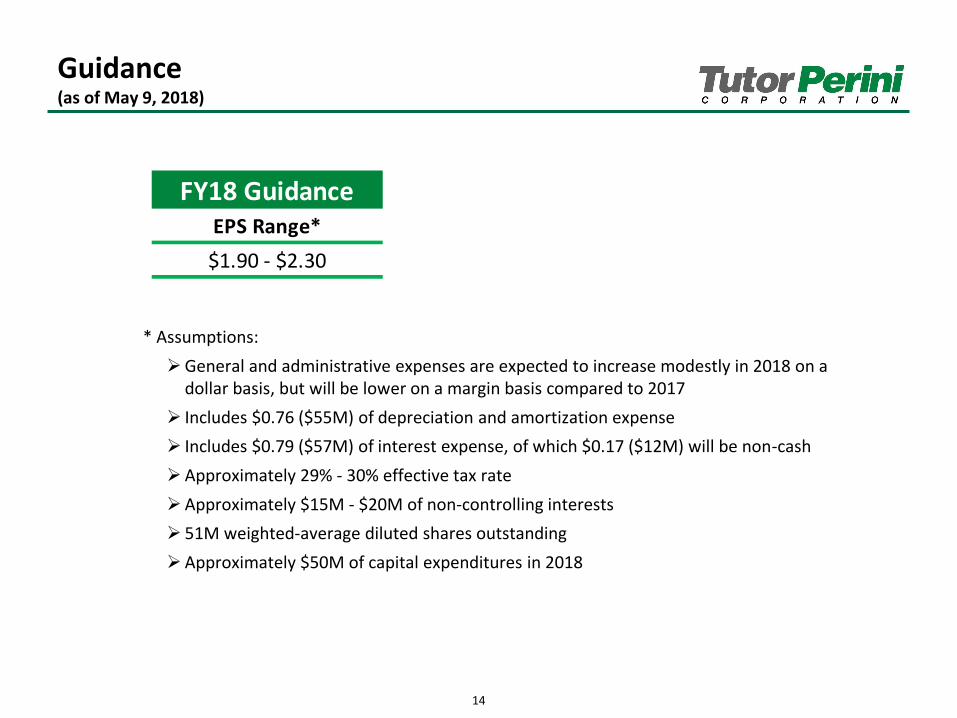
Guidance(as of May 9, 2018)
* Assumptions:
General and administrative expenses are expected to increase modestly in 2018 on a dollar basis, but will be lower on a margin basis compared to 2017
Includes $0.76 ($55M) of depreciation and amortization expense
Includes $0.79 ($57M) of interest expense, of which $0.17 ($12M) will be non-cash
Approximately 29% - 30% effective tax rate
Approximately $15M - $20M of non-controlling interests
51M weighted-average diluted shares outstanding
Approximately $50M of capital expenditures in 2018
14
FY18 GuidanceEPS Range*
$1.90 - $2.30
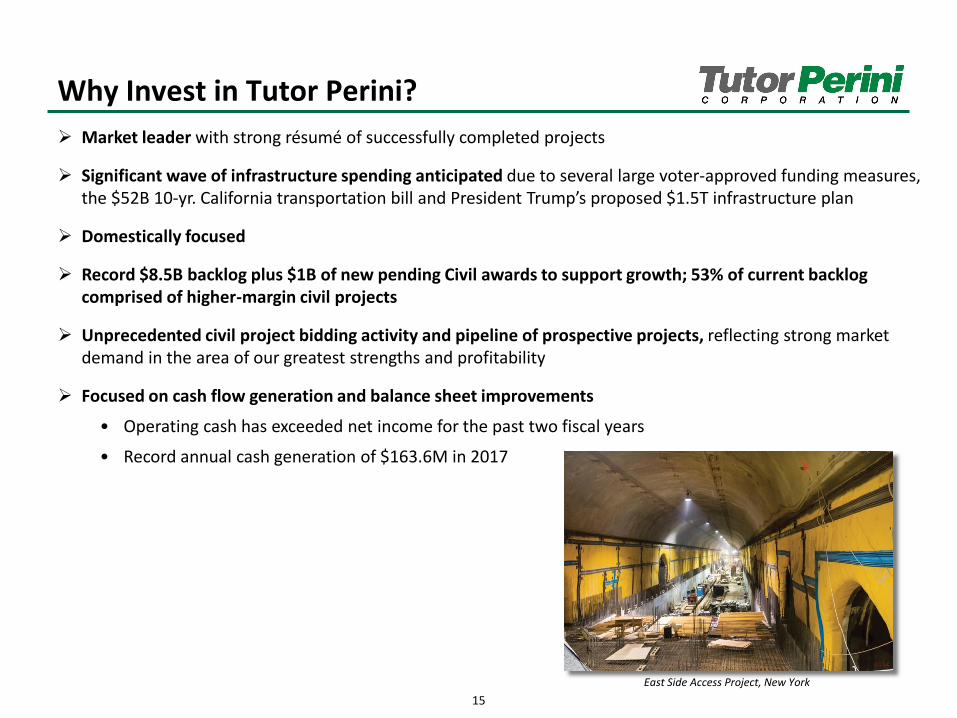
Why Invest in Tutor Perini?
15
Market leader with strong résumé of successfully completed projects
Significant wave of infrastructure spending anticipated due to several large voter-approved funding measures, the $52B 10-yr. California transportation bill and President Trump’s proposed $1.5T infrastructure plan
Domestically focused
Record $8.5B backlog plus $1B of new pending Civil awards to support growth; 53% of current backlog comprised of higher-margin civil projects
Unprecedented civil project bidding activity and pipeline of prospective projects, reflecting strong market demand in the area of our greatest strengths and profitability
Focused on cash flow generation and balance sheet improvements
• Operating cash has exceeded net income for the past two fiscal years
• Record annual cash generation of $163.6M in 2017
East Side Access Project, New York

Contact:Jorge CasadoVice President, Investor Relations(818) [email protected]

Appendix:Reconciliation to Net Income
17
(1) Net income for 2017 includes a tax benefit of $53.3M primarily related to the remeasurement of deferred tax assets and liabilities due to the Tax Cuts and Jobs Act of 2017.(2) Includes amortization of discounts and debt issuance costs. Historical amortization and interest expense have been restated to reflect the adoption of Accounting Standards Update 2015-03.(3) Legal charge in Q3 2015 related to legacy litigation for a Frontier-Kemper (FK) joint venture, for which FK had a 20% non-sponsorship interest. Tutor Perini acquired FK in 2011, after the joint venture project was complete and already in litigation.
($ in thousands) 2013A 2014A 2015A 2016A 2017A
Net Income Attributable to Tutor Perini Corp.(1)
$87,296 $107,936 $45,292 $95,822 $148,382
Interest Expense(2) 47,515 46,035 45,143 59,782 69,384
Income Tax Expense 52,319 79,502 28,547 53,293 (569)
Depreciation 43,383 40,216 37,919 63,759 48,387
Amortization(2)
13,082 13,486 3,715 3,543 3,543
EBITDA 243,595 287,175 160,616 276,199 269,127
Litigation-Related Charge (pre-tax)(3)- - 23,860 - -
Adjusted EBITDA $243,595 $287,175 $184,476 $276,199 $269,127