Embed Size (px)
Citation preview

TPC BenchmarkTM E
Full Disclosure Report
for
Lenovo® ThinkSystemTM SR665
using
Microsoft® SQL Server® 2019
Enterprise Edition
and
Microsoft Windows Server® 2019
Standard Edition
TPC-ETM Version 1.14.0
First Edition
Submitted for Review
August 17, 2021

© Lenovo August 2021 TPC-E Benchmark Full Disclosure Report 2
First Edition – August 2021
THE INFORMATION CONTAINED IN THIS DOCUMENT IS DISTRIBUTED ON AN AS IS BASIS WITHOUT ANY WARRANTY EITHER EXPRESSED OR IMPLIED. The use of this information or the implementation of any of these techniques is the customer’s responsibility and depends on the customer’s ability to evaluate and integrate them into the customer’s operational environment. While each item has been reviewed by Lenovo for accuracy in a specific situation, there is no guarantee that the same or similar results will be obtained elsewhere. Customers attempting to adapt these techniques to their own environment do so at their own risk.
In this document, any references made to a Lenovo licensed program are not intended to state or imply that only Lenovo’s licensed program may be used; any functionally equivalent program may be used.
This publication was produced in the United States. Lenovo may not offer the products, services, or features discussed in this document in other countries, and the information is subject to change without notice. Consult your local Lenovo representative for information on products and services available in your area.
© Copyright Lenovo 2021. All rights reserved.
Permission is hereby granted to reproduce this document in whole or in part, provided the copyright notice as printed above is set forth in full text on the title page of each item reproduced.
Trademarks
Lenovo, ServeRAID, ThinkSystem, and the Lenovo logo are trademarks or registered trademarks of Lenovo in the United States, other countries, or both. These and other Lenovo trademarked terms are marked on their first occurrence in this information with the appropriate symbol (® or ™), indicating US registered or common law trademarks owned by Lenovo at the time this information was published. Such trademarks may also be registered or common law trademarks in other countries. A current list of Lenovo trademarks is available on the Web at http://www3.lenovo.com/us/en/legal/copytrade/.
The following terms used in this publication are trademarks of other companies as follows: TPC Benchmark, TPC-E, and tpsE are trademarks of the Transaction Processing Performance Council; Intel and Xeon are trademarks of Intel Corporation in the U.S. and/or other countries; Microsoft, Windows Server, and SQL Server are registered trademarks of Microsoft Corporation in the United States and/or other countries; AMD, AMD EPYC, and EPYC are trademarks or registered trademarks of Advanced Micro Devices, Inc. Other company, product, or service names, which may be denoted by two asterisks (**), may be trademarks or service marks of others.
Notes
1 GHz and MHz only measures microprocessor internal clock speed, not application performance. Many factors affect application performance.
2 When referring to hard disk capacity, GB, or gigabyte, means one thousand million bytes. Total user-accessible capacity may be less.

© Lenovo August 2021 TPC-E Benchmark Full Disclosure Report 3
Abstract
Lenovo conducted the TPC Benchmark E (TPC-E) on the Lenovo ThinkSystem SR665. This report documents the full disclosure information required by the TPC Benchmark E Standard Specification, Revision 1.14.0, including the methodology used to achieve the reported results. All testing fully complied with this revision level.
The software used on the Lenovo ThinkSystem SR665 system included Microsoft Windows Server 2019 Standard Edition and Microsoft SQL Server 2019 Enterprise Edition.
Standard metrics, transactions per second-E (tpsETM), price per tpsE ($/tpsE) and Availability Date, are reported as required by the TPC Benchmark E Standard Specification.
The benchmark results are summarized in the following table:
Hardware Software Total
System Cost ($USD)
tpsE $ USD /
tpsE Total Solution
Availability Date
Lenovo ThinkSystem
SR665
Microsoft SQL Server
2019 Enterprise Edition
Microsoft
Windows Server 2019
Standard Edition
$176,954 2,579.00 $68.62 August 17, 2021
The benchmark implementation and results were audited by Doug Johnson for InfoSizing (www.sizing.com). The auditor’s attestation letter is contained in this report.
Executive Summary
The TPC Executive Summary Statement must be included near the beginning of the Report.
The Executive Summary is included on the next several pages.

© Lenovo August 2021 TPC-E Benchmark Full Disclosure Report 4
Lenovo® ThinkSystemTM SR665
TPC-ETM 1.14.0 TPC Pricing 2.7.0
Report Date: August 17, 2021 Revision Date: August 17, 2021
TPC-E Throughput
2,579.00 tpsETM
Price/Performance
$68.62 USD per tpsE
Availability Date
August 17, 2021
Total System Cost
$176,954 USD
Database Server Configuration
Operating System
Microsoft® Windows Server® 2019
Standard Edition
Database Manager
Microsoft SQL Server® 2019
Enterprise Edition
Processors/Cores/Threads
2/16/32
Memory
1024GB
TIER A (Client) TIER B (Database Server and Storage)1 x Lenovo ThinkSystem SR650, with: 1 x Lenovo ThinkSystem SR665, with: 1 x Lenovo Storage D1224 - 2 x Intel Xeon Gold - 2 x AMD EPYC 72F3 8-Core DAS Enclosure, with: 6248R Processor 3.00GHz Processor 3.7GHz - 21 x 800GB 2.5" SAS SSD (2 Procs/48 Cores/96 Threads) (2 Procs/16 Cores/32 Threads) (1 x 21-drive RAID-5) - 96GB Memory - 1024GB Memory - 2 x 300GB 10K SAS HDD (RAID-1) - 2 x 480GB SATA SSD (RAID-1) - 1 x ThinkSystem RAID 930-8i - 4 x 800GB SAS SSD (RAID-10) - 1 x Onboard Dual Gb Ethernet - 3 x 1200GB 10K SAS HDD (RAID-5) - 1 x Intel x550 Dual 10Gb-T Ethernet - 1 x ThinkSystem RAID 940-16i - 2 x Broadcom NX-E Dual 10Gb-T Enet - 1 x ThinkSystem RAID 930-8e
- 1 x Onboard Quad 10Gb-T Ethernet - 1 x Broadcom NX-E Dual 10Gb-T Enet 21 Total External Drives
�
12Gb SAS
�
10Gb Ethernet
1 x
Initial Database Size
11,479 GB
Redundancy Level: 1
RAID-10 Log, tempdb RAID-5 Data
Storage
25x 800GB 2.5” SAS SSD 2x 480GB 2.5” SAS SSD
3x 1200GB 2.5” 10K SAS HDD
© Lenovo August 2021 TPC-E Benchmark Full Disclosure Report 5
Lenovo ThinkSystem SR665
TPC-E 1.14.0 TPC Pricing 2.7.0
Report Date: August 17, 2021 Revision Date: August 17, 2021
Availability Date: August 17, 2021
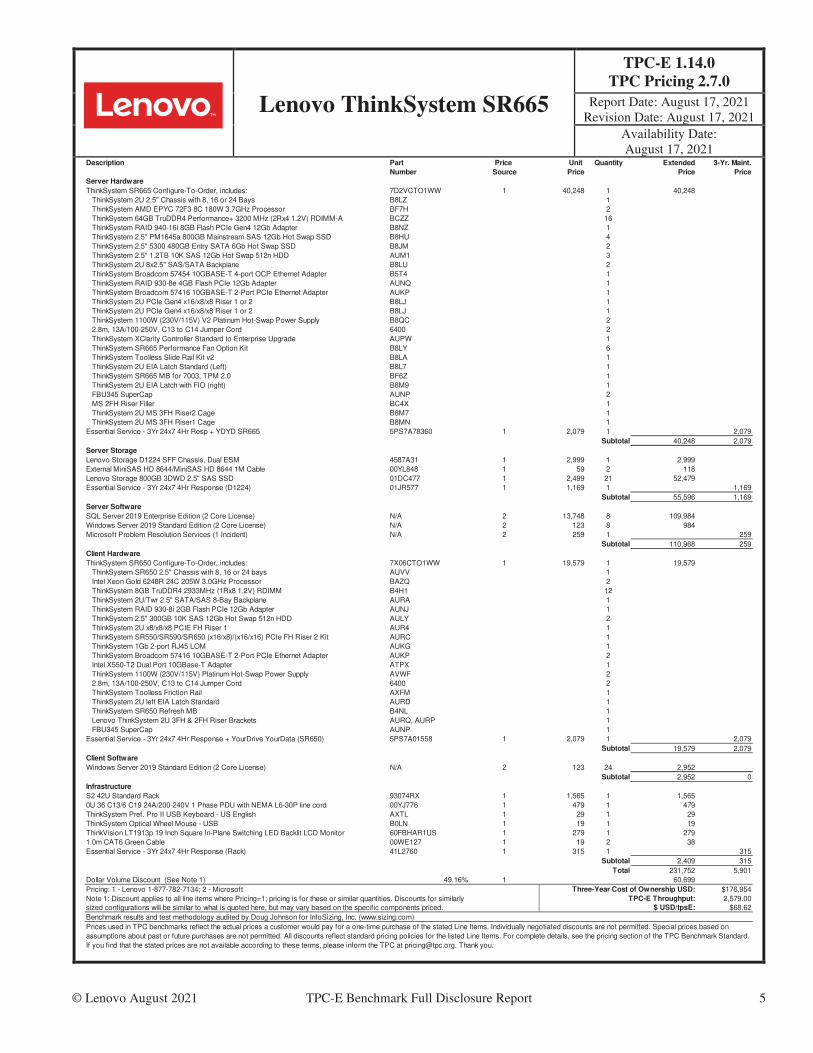
Description Part Price Unit Quantity Extended 3-Yr. Maint.
Number Source Price Price Price
Server Hardware
ThinkSystem SR665 Configure-To-Order, includes: 7D2VCTO1WW 1 40,248 1 40,248
ThinkSystem 2U 2.5" Chassis with 8, 16 or 24 Bays B8LZ 1
ThinkSystem AMD EPYC 72F3 8C 180W 3.7GHz Processor BF7H 2
ThinkSystem 64GB TruDDR4 Performance+ 3200 MHz (2Rx4 1.2V) RDIMM-A BCZZ 16
ThinkSystem RAID 940-16i 8GB Flash PCIe Gen4 12Gb Adapter B8NZ 1
ThinkSystem 2.5" PM1645a 800GB Mainstream SAS 12Gb Hot Swap SSD B8HU 4
ThinkSystem 2.5" 5300 480GB Entry SATA 6Gb Hot Swap SSD B8JM 2
ThinkSystem 2.5" 1.2TB 10K SAS 12Gb Hot Swap 512n HDD AUM1 3
ThinkSystem 2U 8x2.5" SAS/SATA Backplane B8LU 2
ThinkSystem Broadcom 57454 10GBASE-T 4-port OCP Ethernet Adapter B5T4 1
ThinkSystem RAID 930-8e 4GB Flash PCIe 12Gb Adapter AUNQ 1
ThinkSystem Broadcom 57416 10GBASE-T 2-Port PCIe Ethernet Adapter AUKP 1
ThinkSystem 2U PCIe Gen4 x16/x8/x8 Riser 1 or 2 B8LJ 1
ThinkSystem 2U PCIe Gen4 x16/x8/x8 Riser 1 or 2 B8LJ 1
ThinkSystem 1100W (230V/115V) V2 Platinum Hot-Swap Power Supply B8QC 2
2.8m, 13A/100-250V, C13 to C14 Jumper Cord 6400 2
ThinkSystem XClarity Controller Standard to Enterprise Upgrade AUPW 1
ThinkSystem SR665 Performance Fan Option Kit B8LY 6
ThinkSystem Toolless Slide Rail Kit v2 B8LA 1
ThinkSystem 2U EIA Latch Standard (Left) B8L7 1
ThinkSystem SR665 MB for 7003, TPM 2.0 BF6Z 1
ThinkSystem 2U EIA Latch with FIO (right) B8M9 1
FBU345 SuperCap AUNP 2
MS 2FH Riser Filler BC4X 1
ThinkSystem 2U MS 3FH Riser2 Cage B8M7 1
ThinkSystem 2U MS 3FH Riser1 Cage B8MN 1
Essential Service - 3Yr 24x7 4Hr Resp + YDYD SR665 5PS7A78360 1 2,079 1 2,079
Subtotal 40,248 2,079
Server Storage
Lenovo Storage D1224 SFF Chassis, Dual ESM 4587A31 1 2,999 1 2,999
External MiniSAS HD 8644/MiniSAS HD 8644 1M Cable 00YL848 1 59 2 118
Lenovo Storage 800GB 3DWD 2.5" SAS SSD 01DC477 1 2,499 21 52,479
Essential Service - 3Yr 24x7 4Hr Response (D1224) 01JR577 1 1,169 1 1,169
Subtotal 55,596 1,169
Server Software
SQL Server 2019 Enterprise Edition (2 Core License) N/A 2 13,748 8 109,984
Windows Server 2019 Standard Edition (2 Core License) N/A 2 123 8 984
Microsoft Problem Resolution Services (1 Incident) N/A 2 259 1 259
Subtotal 110,968 259
Client Hardware
ThinkSystem SR650 Configure-To-Order, includes: 7X06CTO1WW 1 19,579 1 19,579
ThinkSystem SR650 2.5" Chassis with 8, 16 or 24 bays AUVV 1
Intel Xeon Gold 6248R 24C 205W 3.0GHz Processor BAZQ 2
ThinkSystem 8GB TruDDR4 2933MHz (1Rx8 1.2V) RDIMM B4H1 12
ThinkSystem 2U/Twr 2.5" SATA/SAS 8-Bay Backplane AURA 1
ThinkSystem RAID 930-8i 2GB Flash PCIe 12Gb Adapter AUNJ 1
ThinkSystem 2.5" 300GB 10K SAS 12Gb Hot Swap 512n HDD AULY 2
ThinkSystem 2U x8/x8/x8 PCIE FH Riser 1 AUR4 1
ThinkSystem SR550/SR590/SR650 (x16/x8)/(x16/x16) PCIe FH Riser 2 Kit AURC 1
ThinkSystem 1Gb 2-port RJ45 LOM AUKG 1
ThinkSystem Broadcom 57416 10GBASE-T 2-Port PCIe Ethernet Adapter AUKP 2
Intel X550-T2 Dual Port 10GBase-T Adapter ATPX 1
ThinkSystem 1100W (230V/115V) Platinum Hot-Swap Power Supply AVWF 2
2.8m, 13A/100-250V, C13 to C14 Jumper Cord 6400 2
ThinkSystem Toolless Friction Rail AXFM 1
ThinkSystem 2U left EIA Latch Standard AURD 1
ThinkSystem SR650 Refresh MB B4NL 1
Lenovo ThinkSystem 2U 3FH & 2FH Riser Brackets AURQ, AURP 1
FBU345 SuperCap AUNP 1
Essential Service - 3Yr 24x7 4Hr Response + YourDrive YourData (SR650) 5PS7A01558 1 2,079 1 2,079
Subtotal 19,579 2,079
Client Software
Windows Server 2019 Standard Edition (2 Core License) N/A 2 123 24 2,952
Subtotal 2,952 0
Infrastructure
S2 42U Standard Rack 93074RX 1 1,565 1 1,565
0U 36 C13/6 C19 24A/200-240V 1 Phase PDU with NEMA L6-30P line cord 00YJ776 1 479 1 479
ThinkSystem Pref. Pro II USB Keyboard - US English AXTL 1 29 1 29
ThinkSystem Optical Wheel Mouse - USB B0LN 1 19 1 19
ThinkVision LT1913p 19 Inch Square In-Plane Switching LED Backlit LCD Monitor 60FBHAR1US 1 279 1 279
1.0m CAT6 Green Cable 00WE127 1 19 2 38
Essential Service - 3Yr 24x7 4Hr Response (Rack) 41L2760 1 315 1 315
Subtotal 2,409 315
Total 231,752 5,901
Dollar Volume Discount (See Note 1) 49.16% 1 60,699
Pricing: 1 - Lenovo 1-877-782-7134; 2 - Microsoft $176,954
Note 1: Discount applies to all line items where Pricing=1; pricing is for these or similar quantities. Discounts for similarly 2,579.00sized configurations will be similar to what is quoted here, but may vary based on the specific components priced. $68.62
Benchmark results and test methodology audited by Doug Johnson for InfoSizing, Inc. (www.sizing.com)
Prices used in TPC benchmarks reflect the actual prices a customer would pay for a one-time purchase of the stated Line Items. Individually negotiated discounts are not permitted. Special prices based on
assumptions about past or future purchases are not permitted. All discounts reflect standard pricing policies for the listed Line Items. For complete details, see the pricing section of the TPC Benchmark Standard.
If you find that the stated prices are not available according to these terms, please inform the TPC at [email protected]. Thank you.
Three-Year Cost of Ownership USD:
TPC-E Throughput:
$ USD/tpsE:

© Lenovo August 2021 TPC-E Benchmark Full Disclosure Report 6
Lenovo ThinkSystem SR665
TPC-E 1.14.0 TPC Pricing 2.7.0
Report Date: August 17, 2021 Revision Date: August 17, 2021
Availability Date: August 17, 2021
Numerical Quantities Summary
Reported Throughput:
2,579.00 tpsE
Configured Customers:
1,400,000
Response Time (in seconds) Minimum Average 90Th
Percentile Maximum
Broker-Volume 0.01 0.01 0.02 0.05
Customer-Position 0.01 0.01 0.02 0.07
Market-Feed 0.01 0.01 0.02 0.09
Market-Watch 0.01 0.01 0.01 0.09
Security-Detail 0.01 0.01 0.01 0.06
Trade-Lookup 0.01 0.03 0.05 0.16
Trade-Order 0.01 0.02 0.03 0.11
Trade-Result 0.01 0.02 0.04 0.11
Trade-Status 0.01 0.01 0.01 0.09
Trade-Update 0.01 0.04 0.05 0.12
Data-Maintenance 0.01 0.01 N/A 0.02
Transaction Mix Transaction Count Mix %
Broker-Volume 9,099,753 4.900%
Customer-Position 24,142,322 13.000%
Market-Feed 1,856,887 1.000%
Market-Watch 33,427,944 18.000%
Security-Detail 25,999,456 14.000%
Trade-Lookup 14,856,847 8.000%
Trade-Order 18,756,695 10.100%
Trade-Result 18,568,844 9.999%
Trade-Status 35,284,790 19.000%
Trade-Update 3,714,176 2.000%
Data-Maintenance 120 N/A
Test Duration and Timings
Ramp-up Time (hh:mm:ss) 00:28:59
Measurement Interval (hh:mm:ss) 02:00:00
Business Recovery Time (hh:mm:ss) 00:19:08
Total Number of Transactions Completed in Measurement Interval 185,707,714

© Lenovo August 2021 TPC-E Benchmark Full Disclosure Report 7
Table of Contents
Abstract ............................................................................................................................................................................................. 3�
Executive Summary .......................................................................................................................................................................... 3�
Table of Contents .............................................................................................................................................................................. 7�
Clause 0 – Preamble ......................................................................................................................................................................... 9�
Introduction .................................................................................................................................................................................... 9�
Goal of the TPC-E Benchmark ...................................................................................................................................................... 9�
Restrictions and Limitations .......................................................................................................................................................... 9�
Clause 1 – Introduction .................................................................................................................................................................. 11�
Benchmark Sponsor ..................................................................................................................................................................... 11�
Configuration Diagrams ............................................................................................................................................................... 11�Measured Configuration .......................................................................................................................................................... 11�Figure 1-1. Measured Configuration ....................................................................................................................................... 11�Priced Configuration ............................................................................................................................................................... 11�Differences between the Priced and Measured Configurations ............................................................................................... 12�Substitution ............................................................................................................................................................................. 12�
Hardware and Software Configuration Steps ............................................................................................................................... 12�
Clause 2- Database Design, Scaling, and Population ................................................................................................................... 13�
Database Creation and Table Definitions .................................................................................................................................... 13�
Database Physical Organization................................................................................................................................................... 13�
Horizontal/Vertical Partitioning ................................................................................................................................................... 14�
Replication ................................................................................................................................................................................... 14�
Table Attributes ........................................................................................................................................................................... 14�
Cardinality of Tables.................................................................................................................................................................... 14�Table 2-1. Initial Cardinality of Tables ................................................................................................................................... 15�
Distribution of Tables, Partitions and Logs ................................................................................................................................. 16�Table 2-2. Data Distribution for the Measured and Priced Configurations ............................................................................. 16�
Database Interface and Data Model Implemented ....................................................................................................................... 17�
Database Load Methodology ....................................................................................................................................................... 17�
Clause 3 – Transaction Related Items ........................................................................................................................................... 18�
Vendor-Supplied Code................................................................................................................................................................. 18�
Database Footprint ....................................................................................................................................................................... 18�
Clause 4 – SUT, Driver, and Network ........................................................................................................................................... 19�
Network Configuration ................................................................................................................................................................ 19�
Clause 5 – EGen .............................................................................................................................................................................. 20�
EGen Version ............................................................................................................................................................................... 20�
EGen Code and Modifications ..................................................................................................................................................... 20�
EGen Files ................................................................................................................................................................................... 20�
Clause 6 – Performance Metrics and Response Time .................................................................................................................. 21�

© Lenovo August 2021 TPC-E Benchmark Full Disclosure Report 8
EGen Driver Instances ................................................................................................................................................................. 21�
Reported Throughput ................................................................................................................................................................... 21�
Throughput vs. Elapsed Time for Trade-Result Transaction ....................................................................................................... 21�Figure 6-1. Test Run Graph ..................................................................................................................................................... 21�
Steady State Methodology ........................................................................................................................................................... 22�
Work Performed During Steady State ......................................................................................................................................... 22�
Transaction Statistics ................................................................................................................................................................... 22�Table 6-1. Transaction Statistics ............................................................................................................................................. 23�
Clause 7 – Transaction and System Properties ............................................................................................................................ 24�
Atomicity Requirements .............................................................................................................................................................. 24�
Consistency Requirements ........................................................................................................................................................... 24�
Isolation Requirements ................................................................................................................................................................ 25�
Durability Requirements .............................................................................................................................................................. 25�Data Accessibility ................................................................................................................................................................... 25�Table 7-1. Combinations of Durable Media Technologies Tested for Data Accessibility ...................................................... 25�Figure 7-1. Data Accessibility Graph ...................................................................................................................................... 26�Business Recovery .................................................................................................................................................................. 27�Figure 7-2. Business Recovery Time Graph ........................................................................................................................... 28�
Clause 8 – Pricing ........................................................................................................................................................................... 29�
60-Day Space ............................................................................................................................................................................... 29�Table 8-1. Disk Space Requirements ...................................................................................................................................... 29�
Configuration Components .......................................................................................................................................................... 30�
Pricing Methodology ................................................................................................................................................................... 30�
Pricing Locale .............................................................................................................................................................................. 30�
Currency Conversions .................................................................................................................................................................. 30�
Pricing Calculations ..................................................................................................................................................................... 30�
Total Price .................................................................................................................................................................................... 31�
Availability Date .......................................................................................................................................................................... 31�
Supporting Files Index ................................................................................................................................................................. 31�
Auditor’s Attestation Letter ......................................................................................................................................................... 31�
Appendix A – Price Quotes ............................................................................................................................................................ 34�
© Lenovo August 2021 TPC-E Benchmark Full Disclosure Report 9
Clause 0 – Preamble
Introduction
TPC Benchmark E (TPC-E) is an On-Line Transaction Processing (OLTP) workload. It is a mixture of read-only and update intensive transactions that simulate the activities found in complex OLTP application environments. The database schema, data population, transactions, and implementation rules have been designed to be broadly representative of modern OLTP systems. The benchmark exercises a breadth of system components associated with such environments, which are characterized by:
• The simultaneous execution of multiple transaction types that span a breadth of complexity
• Moderate system and application execution time
• A balanced mixture of disk input/output and processor usage
• Transaction integrity (ACID properties)
• A mixture of uniform and non-uniform data access through primary and secondary keys
• Databases consisting of many tables with a wide variety of sizes, attributes, and relationships with realistic content
• Contention on data access and update
The TPC-E operations are modeled as follows: The database is continuously available 24 hours a day, 7 days a week, for data processing from multiple sessions and data modifications against all tables, except possibly during infrequent (e.g., once a month) maintenance sessions. Due to the worldwide nature of the application modeled by the TPC-E benchmark, any of the transactions may be executed against the database at any time, especially in relation to each other.
Goal of the TPC-E Benchmark
The TPC-E benchmark simulates the OLTP workload of a brokerage firm. The focus of the benchmark is the central database that executes transactions related to the firm’s customer accounts. In keeping with the goal of measuring the performance characteristics of the database system, the benchmark does not attempt to measure the complex flow of data between multiple application systems that would exist in a real environment.
The mixture and variety of transactions being executed on the benchmark system is designed to capture the characteristic components of a complex system. Different transaction types are defined to simulate the interactions of the firm with its customers as well as its business partners. Different transaction types have varying run-time requirements.
The benchmark defines:
• Two types of transactions to simulate Consumer-to-Business as well as Business-to-Business activities
• Several transactions for each transaction type
• Different execution profiles for each transaction type
• A specific run-time mix for all defined transactions
For example, the database will simultaneously execute transactions generated by systems that interact with customers along with transactions that are generated by systems that interact with financial markets as well as administrative systems. The benchmark system will interact with a set of driver systems that simulate the various sources of transactions without requiring the benchmark to implement the complex environment.
The performance metric reported by TPC-E is a "business throughput” measure of the number of completed Trade-Result transactions processed per second. Multiple transactions are used to simulate the business activity of processing a trade, and each transaction is subject to a response time constraint. The performance metric for the benchmark is expressed in transactions-per-second-E (tpsE). To be compliant with the TPC-E standard, all references to tpsE results must include the tpsE rate, the associated price-per-tpsE, and the availability date of the priced configuration.
TPC-E uses terminology and metrics that are similar to other benchmarks, originated by the TPC and others. Such similarity in terminology does not imply that TPC-E results are comparable to other benchmarks. The only benchmark results comparable to TPC-E are other TPC-E results that conform to a comparable version of the TPC-E specification.
Restrictions and Limitations
Despite the fact that this benchmark offers a rich environment that represents many OLTP applications, this benchmark does not reflect the entire range of OLTP requirements. In addition, the extent to which a customer can achieve the results reported by a vendor is highly dependent on how closely TPC-E approximates the customer application. The relative performance of systems derived from this benchmark does not necessarily hold for other workloads or environments. Extrapolations to any other environment are not recommended.
© Lenovo August 2021 TPC-E Benchmark Full Disclosure Report 10
Benchmark results are highly dependent upon workload, specific application requirements, and systems design and implementation. Relative system performance will vary because of these and other factors. Therefore, TPC-E should not be used as a substitute for specific customer application benchmarking when critical capacity planning and/or product evaluation decisions are contemplated.

© Lenovo August 2021 TPC-E Benchmark Full Disclosure Report 11
Clause 1 – Introduction
Benchmark Sponsor
A statement identifying the benchmark Sponsor(s) and other participating companies must be reported in the Report.
This benchmark was sponsored by Lenovo.
Configuration Diagrams
Diagrams of both Measured and Priced Configurations must be reported in the Report, accompanied by a description of the
differences.
Measured Configuration
The measured configuration is shown in Figure 1-1.
Figure 1-1. Measured Configuration
TIER A (Client) TIER B (Database Server and Storage)1 x Lenovo ThinkSystem SR650, with: 1 x Lenovo ThinkSystem SR665, with: 2 x Lenovo Storage D1224 - 2 x Intel Xeon Gold - 2 x AMD EPYC 72F3 8-Core DAS Enclosures, with: 6248R Processor 3.00GHz Processor 3.7GHz - 21 x 800GB 2.5" SAS SSD (2 Procs/48 Cores/96 Threads) (2 Procs/16 Cores/32 Threads) (1 x 21-drive RAID-5) - 96GB Memory - 1024GB Memory - 24 x 900GB 2.5" 10K SAS - 2 x 300GB 10K SAS HDD (RAID-1) - 2 x 480GB SATA SSD (RAID-1) (1 x 24-drive RAID-5) - 1 x ThinkSystem RAID 930-8i - 4 x 800GB SAS SSD (RAID-10) - 1 x Onboard Dual Gb Ethernet - 3 x 1200GB 10K SAS HDD (RAID-5) - 1 x Intel x550 Dual 10Gb-T Ethernet - 1 x ThinkSystem RAID 940-16i - 2 x Broadcom NX-E Dual 10Gb-T Enet - 1 x ThinkSystem RAID 930-8e
- 1 x Onboard Quad 10Gb-T Ethernet - 1 x Broadcom NX-E Dual 10Gb-T Enet 45 Total External Drives
�
12Gb SAS
�
10Gb Ethernet
2 x
Priced Configuration
The priced configuration is shown above in the Executive Summary.

© Lenovo August 2021 TPC-E Benchmark Full Disclosure Report 12
Differences between the Priced and Measured Configurations
Compared to the priced configuration, the measured configuration contained one extra external enclosure and drives used strictly for database backup files and flat file space used during the benchmark database load process. This extra enclosure and drives were not used at all during the benchmark runs.
Substitution
Some hardware components of the Priced Configuration may be substituted after the Test Sponsor has demonstrated to the
Auditor's satisfaction that the substituting components do not negatively impact the Reported Throughput. All Substitutions must
be reported in the Report and noted in the Auditor's Attestation Letter. Any information and/or measurement results used to prove
the validity of a Component substitution must be included in the section of the FDR that describes the differences between the
Measured Configuration and Priced Configuration. Original and substituted Components must be clearly identified.
No components were substituted.
Hardware and Software Configuration Steps
A description of the steps taken to configure all of the hardware and software must be reported in the Report.
Any and all configuration scripts or step by step GUI instructions are reported in the Supporting Files (see Clauses 9.4.1 and
9.4.1.2). The description, scripts and GUI instructions must be sufficient such that a reader knowledgeable of computer systems
and the TPC-E specification could recreate the hardware and software environments.
Detailed instructions for installing and configuring the SUT hardware and software are included in the supporting files:
• Information specific to the Tier A client can be found in: SupportingFiles\Introduction\TierA\TierA_SR650_Setup.pdf
• Information specific to the Tier B database server and storage can be found in: SupportingFiles\Introduction\TierB\TierB_SR665_Setup.pdf

© Lenovo August 2021 TPC-E Benchmark Full Disclosure Report 13
Clause 2- Database Design, Scaling, and Population
Database Creation and Table Definitions
A description of the steps taken to create the database for the Reported Throughput must be reported in the Report. Any and all
scripts or step by step GUI instructions are reported in the Supporting Files (see Clause 9.4.2). The description, scripts and GUI
instructions must be sufficient such that a reader knowledgeable of database software environments and the TPC-E specification
could recreate the database.
The database was created and populated using the Microsoft TPC-E benchmark kit. Instructions for doing so are included in the supporting files. See SupportingFiles\Clause2\MSTPCE Database Setup Reference.pdf.
Changes and customizations were made to some of the kit files. First, the filegroups the database was loaded onto were changed in number from three filegroups to two. Second, several scripts were modified to customize the load to the specific hardware configuration of this SUT.
The default kit files create the database on three filegroups: fixed_fg, scaling_fg, and growing_fg. That was changed so that only two filegroups were used, fixed_fg and growing_fg. All of the items that would have been loaded onto scaling_fg were loaded instead onto fixed_fg.
The modified files are included as part of SupportingFiles\Clause2:
• Utility\Create_TID_Ranges_Table.sql
• DDL\ Create_Indexes_Scaling_Tables.sql
• DDL\ Create_Tables_Scaling.sql
The files that were customized for this specific SUT hardware are included in the folder SupportingFiles\Clause2\1400000.Cust\Database:
• Tempdb_load.sql specifies the tempdb files to use when loading the database
• Tempdb_run.sql specifies the tempdb files to use when running the benchmark
• Shrinktempdb.sql removes tempdb files
• Backupdev.sql creates SQL Server database backup devices
• Dropbackupdev.sql removes those database backup devices
• Backup_Database.sql backs up the tpce database to the specified device names
• Restore_Database.sql restores the tpce database from the specified device names
• Create_Database.sql maps the database filegroups and log to physical storage
• Flatfile.txt defines the locations of the flat files during the database load
• Remove_Database.sql drops the current tpce database
Database Physical Organization
The physical organization of tables and User-Defined Objects, within the database, must be reported in the Report.
The following tables and related indexes were on the growing_fg filegroup:
• CASH_TRANSACTION
• SETTLEMENT
• TRADE
• TRADE_HISTORY
• TRADE_REQUEST
• HOLDING
• HOLDING_HISTORY
• HOLDING_SUMMARY
The remaining tables and their related indexes were all on the fixed_fg filegroup.
© Lenovo August 2021 TPC-E Benchmark Full Disclosure Report 14
Horizontal/Vertical Partitioning
While few restrictions are placed upon horizontal or vertical partitioning of tables and rows in the TPC-E benchmark (see Clause
2.3.3), any such partitioning must be reported in the Report.
Partitioning was not used for this benchmark.
Replication
Replication of tables, if used, must be reported in the Report (see Clause 2.3.4).
Replication was not used for this benchmark.
Table Attributes
Additional and/or duplicated columns in any table must be reported in the Report along with a statement on the impact on
performance (see Clause 2.3.5).
No additional attributes were used for this benchmark.
Cardinality of Tables
The cardinality (e.g. the number of rows) of each table, as it existed after database load (see Clause 2.6), must be reported in the
Report.
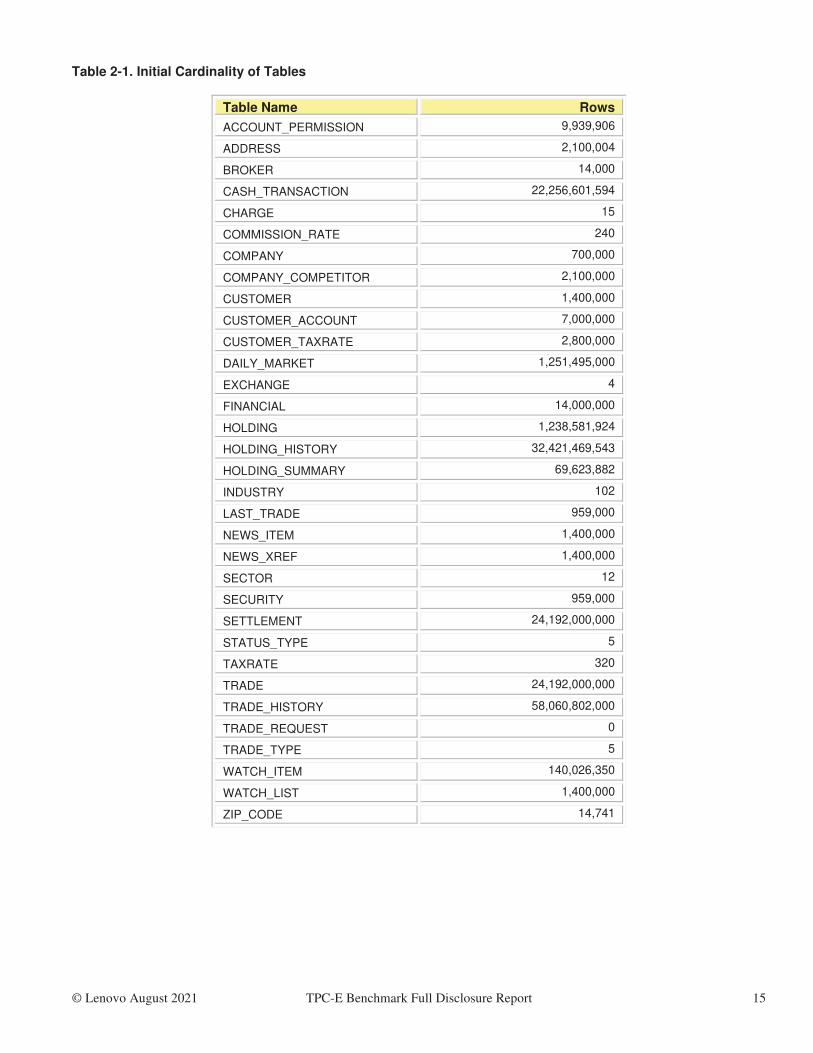
The database was built with 1,400,000 customers. The cardinality is shown in Table 2-1.
© Lenovo August 2021 TPC-E Benchmark Full Disclosure Report 15
Table 2-1. Initial Cardinality of Tables
Table Name Rows
ACCOUNT_PERMISSION 9,939,906
ADDRESS 2,100,004
BROKER 14,000
CASH_TRANSACTION 22,256,601,594
CHARGE 15
COMMISSION_RATE 240
COMPANY 700,000
COMPANY_COMPETITOR 2,100,000
CUSTOMER 1,400,000
CUSTOMER_ACCOUNT 7,000,000
CUSTOMER_TAXRATE 2,800,000
DAILY_MARKET 1,251,495,000
EXCHANGE 4
FINANCIAL 14,000,000
HOLDING 1,238,581,924
HOLDING_HISTORY 32,421,469,543
HOLDING_SUMMARY 69,623,882
INDUSTRY 102
LAST_TRADE 959,000
NEWS_ITEM 1,400,000
NEWS_XREF 1,400,000
SECTOR 12
SECURITY 959,000
SETTLEMENT 24,192,000,000
STATUS_TYPE 5
TAXRATE 320
TRADE 24,192,000,000
TRADE_HISTORY 58,060,802,000
TRADE_REQUEST 0
TRADE_TYPE 5
WATCH_ITEM 140,026,350
WATCH_LIST 1,400,000
ZIP_CODE 14,741

© Lenovo August 2021 TPC-E Benchmark Full Disclosure Report 16
Distribution of Tables, Partitions and Logs
The distribution of tables, partitions and logs across all media must be explicitly depicted for the Measured and Priced
Configurations.
The OS was stored on one RAID-1 array created on two 480GB 2.5” SATA SSDs in the server accessed by the internal ThinkSystem RAID 940-16i SAS/SATA controller. The OS partition was formatted NTFS.
The database log and run-time tempdb were both stored on one RAID-10 array created on four 800GB 2.5” SAS SSDs in the server accessed by the internal ThinkSystem RAID 940-16i SAS/SATA controller. This array was broken into three partitions, one RAW for the database log and two NTFS, including the run-time tempdb partition.
The database data was stored on one 21-drive RAID-5 array created on 21 800GB 2.5” SAS SSDs in one Lenovo Storage D1224 enclosure accessed by one ThinkSystem RAID 930-8e SAS/SATA controller. This data array was broken into three partitions: one for fixed_fg (RAW), one for growing_fg (RAW), and one for extra space (NTFS).
The 60-day space requirements were met by including one RAID-5 array created on three 1200GB 2.5” 10K SAS HDDs in the server accessed by the internal ThinkSystem RAID 940-16i SAS/SATA controller. This array was partitioned and formatted NTFS. This array was not used during benchmark runs.
In addition to the priced configuration described above, the measured configuration included additional hardware that was used during the database load process and to hold database backup files. This hardware performed no function during benchmark runs:
• One Lenovo Storage D1224 enclosure holding 24 900GB 2.5” 10K SAS HDDs, creating one 24-drive RAID-5 array, partitioned in half and formatted NTFS
Adapter write caching was disabled for all controllers and arrays.
Further details on the storage configuration are available in the supporting files. See the files in the directory SupportingFiles\Introduction\TierB.
Table 2-2 depicts the database configuration of the measured and priced systems to meet the 8-hour steady state requirement.
Table 2-2. Data Distribution for the Measured and Priced Configurations
Disk #
Controller
Drives Enclosure RAID Level
(Pricing)
Partition (File System)
Size Use
0 930-8e 21 x 800GB SAS SSD Lenovo D1224
RAID-5
c:\mp\fx1 (RAW) c:\mp\gw1 (RAW) c:\mp\xt1 (NTFS)
301.27GB 14,453.13GB
128.00GB
fixed_fg growing_fg
Extra Space
1 930-8e 24 x 900GB SAS HDD Lenovo D1224
RAID-5 (Measured)
c:\mp\bk9 (NTFS) c:\mp\bk10 (NTFS)
9,209.78GB 9,209.78GB
Backup & Load Space
2 940-16i 3 x 1200GB SAS HDD internal RAID-5
S: (NTFS) 2,233.29GB
60-Day Space
3 940-16i 4 x 800GB SAS SSD internal
RAID-10
E: (RAW) F: (NTFS) T: (NTFS)
585.94GB 24.41GB
877.88GB
tpce log MDF
tempdb
4 940-16i 2 x 480GB SATA SSD internal RAID-1
C: (NTFS)
445.50GB OS

© Lenovo August 2021 TPC-E Benchmark Full Disclosure Report 17
Database Interface and Data Model Implemented
A statement must be provided in the Report that describes:
• The Database Interface (e.g., embedded, call level) and access language (e.g., SQL, COBOL read/write) used to
implement the TPC-E Transactions. If more than one interface / access language is used to implement TPC-E, each
interface / access language must be described and a list of which interface /access language is used with which
Transaction type must be reported.
• The data model implemented by the DBMS (e.g., relational, network, hierarchical).
Microsoft SQL Server 2019 Enterprise Edition is a relational database. The interface used was Microsoft SQL Server stored procedures accessed with Remote Procedure Calls embedded in C++ code using the Microsoft ODBC interface.
Database Load Methodology
The methodology used to load the database must be reported in the Report.
The database was loaded using the flat files option on the EGenLoader command line. This will generate flat files first, then bulk insert the data into the tables. A further description is provided in SupportingFiles\Clause2\MSTPCE Database Setup Reference.pdf.

© Lenovo August 2021 TPC-E Benchmark Full Disclosure Report 18
Clause 3 – Transaction Related Items
Vendor-Supplied Code
A statement that vendor-supplied code is functionally equivalent to Pseudo-code in the specification (see Clause 3.2.1.6) must be
reported in the Report.
The stored procedure code for the transactions was functionally equivalent to the pseudo-code. The stored procedures can be seen in SupportingFiles\Clause3\StoredProcedures.
The code to interface the stored procedures can be found in:
• SupportingFiles\Clause3\BaseServer
• SupportingFiles\Clause3\TransactionsSP
• SupportingFiles\Clause3\TxnHarness
Database Footprint
A statement that the database footprint requirements (as described in Clause 3.3) were met must be reported in the Report.
The database footprint requirements were met.

© Lenovo August 2021 TPC-E Benchmark Full Disclosure Report 19
Clause 4 – SUT, Driver, and Network
Network Configuration
The Network configurations of both the Measured and Priced Configurations must be described and reported in the Report. This
includes the mandatory Network between the Driver and Tier A (see Clause 4.2.2) and any optional Database Server interface
networks (see Clause 4.1.3.12).
The network configurations of the measured and priced configurations were the same. Refer to Figure 1-1 for a diagram of the network connections.
The Tier A client had eight Ethernet ports. Two of these were provided by the onboard dual-port Gb Ethernet solution and the remaining six were provided by three dual-port 10Gb PCI-e Ethernet adapters.
The Tier B database server had six Ethernet ports. Four of these were provided by the onboard quad-port 10Gb OCP Ethernet solution and the remaining two were provided by a dual-port 10Gb PCI-e Ethernet adapter.
The Tier A client and Tier B database server were connected by two 10Gb Ethernet crossover connections. On one side, these cables were plugged into two of the 10Gb ports in the Tier A client, one per 10Gb PCI-e adapter. On the other side, these cables were plugged into one port of the 10Gb quad-port OCP adapter and one port of the 10Gb dual-port PCI-e adapter in the Tier B database server. These crossover networks, all running at 10Gb, handled all of the network traffic between Tier A and Tier B while a measurement was underway.
Two crossover connections were setup between the Tier A client and the Driver. On the client, these cables were both plugged into one dual-port 10Gb PCI-e adapter. These networks, which fulfill the mandatory network between the Driver and Tier A, were used by the client to report its results to the Driver as a benchmark run was underway.
Another network connected the Driver, the Tier B database server, the Tier A client, and a time server. This network, which was connected via a Gb Ethernet switch, used one of the onboard Ethernet ports on the Tier A client and on the Tier B database server. It was used for miscellaneous file sharing and time syncing. It was not used during a benchmark run.

© Lenovo August 2021 TPC-E Benchmark Full Disclosure Report 20
Clause 5 – EGen
EGen Version
The version of EGen used in the benchmark must be reported in the Report (see Clause 5.3.1).
EGen v1.14.0 was used in the benchmark.
EGen Code and Modifications
A statement that all required TPC-provided EGen code was used in the benchmark must be reported in the Report.
If the Test Sponsor modified EGen, a statement EGen has been modified must be reported in the Report. All formal waivers from
the TPC documenting the allowed changes to EGen must also be reported in the Report (see Clause 5.3.7.1). If any of the changes
to EGen do not have a formal waiver that must also be reported in the Report.
If the Test Sponsor extended EGenLoader (as described in Appendix A.6), the use of the extended EGenLoader and the audit of
the extension code by an Auditor must be reported in the Report (see Clause 5.7.4).
All required TPC-provided EGen code was used in the benchmark.
EGen was not modified for this benchmark.
EGenLoader was not extended for this benchmark.
EGen Files
The make/project files used to compile/link EGenLoader and EGenValidate must be reported in the Supporting Files. The
compiler/linker options and flags used to compile/link EGen Objects for the SUT must be reported in the Supporting Files.
See the supporting files directory SupportingFiles\Clause3\prj for the files related to EGenLoader and EGenValidate.
See the supporting files directory SupportingFiles\Clause3\SUT_CE_Server for the files related to the SUT_CE_Server.
See the supporting files directory SupportingFiles\Clause3\SUT_MEE_Server for the files related to the SUT_MEE_Server.

© Lenovo August 2021 TPC-E Benchmark Full Disclosure Report 21
���������–���� ��������������������������� �
EGen Driver Instances
The number of EGenDriverMEE and EGenDriverCE instances used in the benchmark must be reported in the Report (see Clause
6.2.5).
There were 16 EGenDriverCEs with a total of 208 EGenDriverCE instances used in the benchmark.
There were 16 EGenDriverMEEs with a dynamic number of instances used in the benchmark.
Reported Throughput
The Reported Throughput must be reported in the Report (see Clause 6.7.1.2).
The Reported Throughput was 2,579.00 tpsE.
Throughput vs. Elapsed Time for Trade-Result Transaction
A Test Run Graph of throughput versus elapsed wall clock time must be reported in the Report for the Trade-Result Transaction
(see Clause 6.7.2).
Figure 6-1. Test Run Graph
© Lenovo August 2021 TPC-E Benchmark Full Disclosure Report 22
Steady State Methodology
The method used to determine that the SUT had reached a Steady State prior to commencing the Measurement Interval must be
reported in the Report.
During the run, Steady State was determined by observation of the Trade-Result transactions per second. After the run, Steady State was confirmed by:
1. Looking at the Test Run Graph and verifying that the Trade-Result transactions per second was steady prior to commencing the Measurement Interval.
2. Calculating the average Trade-Result transactions per second over 60-minute windows during Steady State, with the start of each window 10 minutes apart. Then it was confirmed that the minimum 60-minute average Trade-Result transactions per second was not less than 98% of the Reported Throughput, and that the maximum 60-minute average Trade-Result transactions per second was not greater than 102% of the Reported Throughput.
3. Calculating the average Trade-Result transactions per second over 10-minute windows during Steady State, with the start of each window 1 minute apart. Then it was confirmed that the minimum 10-minute average Trade-Result transactions per second was not less than 80% of the Reported Throughput, and the maximum 10-minute average Trade-Result transactions per second was not greater than 120% of the Reported Throughput.
Work Performed During Steady State
A description of how the work normally performed during a Test Run, actually occurred during the Measurement Interval must be
reported in the Report (for example checkpointing, writing Undo/Redo Log records, etc.).
Checkpoints had a duration of 430 seconds and were scheduled to run every 447 seconds.
Data-Maintenance was run every 60 seconds.
Transaction Statistics
The recorded averages over the Measurement Interval for each of the Transaction input parameters specified by clause 6.4.1
must be reported in the Report.
Table 6-1 contains the transaction statistics.

© Lenovo August 2021 TPC-E Benchmark Full Disclosure Report 23
Table 6-1. Transaction Statistics
Input Parameter Value Actual
Percentage Required Range
Customer-Position
By Tax ID 1 50.00% 48% to 52%
Get History 1 50.00% 48% to 52%
Market-Watch
Securities chosen by
Watch List 59.99% 57% to 63%
Account ID 35.01% 33% to 37%
Industry 5.01% 4.5% to 5.5%
Security-Detail
Access LOB 1 1.00% 0.9% to 1.1%
Trade-Lookup
Frame to execute
1 29.99% 28.5% to 31.5%
2 30.01% 28.5% to 31.5%
3 30.01% 28.5% to 31.5%
4 9.99% 9.5% to 10.5%
Trade-Order
Transactions requested by a third party 9.99% 9.5% to 10.5%
By Company Name 40.00% 38% to 42%
Buy On Margin 1 8.01% 7.5% to 8.5%
Rollback 1 0.99% 0.94% to 1.04%
LIFO 1 35.00% 33% to 37%
Trade Quantity
100 25.00% 24% to 26%
200 25.00% 24% to 26%
400 25.00% 24% to 26%
800 25.00% 24% to 26%
Trade Type
Market Buy 30.01% 29.7% to 30.3%
Market Sell 29.98% 29.7% to 30.3%
Limit Buy 20.01% 19.8% to 20.2%
Limit Sell 10.00% 9.9% to 10.1%
Stop Loss 10.00% 9.9% to 10.1%
Trade-Update
Frame to execute
1 32.99% 31% to 35%
2 32.98% 31% to 35%
3 34.02% 32% to 36%

© Lenovo August 2021 TPC-E Benchmark Full Disclosure Report 24
Clause 7 – Transaction and System Properties
The ACID (Atomicity, Consistency, Isolation, and Durability) properties of transaction processing systems must be supported by
the System Under Test during the running of this benchmark. It is the intent of this section to define the ACID properties
informally and to specify a series of tests that must be performed to demonstrate that these properties are met.
The results of the ACID tests must be reported in the Report along with a description of how the ACID requirements were met,
and how the ACID tests were run.
Atomicity Requirements
The System Under Test must guarantee that Database Transactions are atomic; the system will either perform all individual
operations on the data, or will ensure that no partially completed operations leave any effects on the data.
All ACID tests were conducted according to specification. The following steps were performed to verify the Atomicity of the Trade-Order transactions:
• Perform a market Trade-Order Transaction with the roll_it_back flag set to 0. Verify that the appropriate rows have
been inserted in the TRADE and TRADE_HISTORY tables.
• Perform a market Trade-Order Transaction with the roll_it_back flag set to 1. Verify that no rows associated with the
rolled back Trade-Order have been added to the TRADE and TRADE_HISTORY tables.
The procedure for running the atomicity tests is documented in the file SupportingFiles\Clause7\MSTPCE ACID Procedures.pdf.
The atomicity scripts and outputs are located in the directory SupportingFiles\Clause7\Atomicity.
Consistency Requirements
Consistency is the property of the Application that requires any execution of a Database Transaction to take the database from
one consistent state to another. A TPC-E database when first populated by EGenLoader must meet these consistency conditions.
These three consistency conditions must be tested after initial database population and after any Business Recovery tests.
Consistency condition 1
Entries in the BROKER and TRADE tables must satisfy the relationship:
B_NUM_TRADES = count(*)
For each broker defined by:
(B_ID = CA_B_ID) and (CA_ID = T_CA_ID) and (T_ST_ID = “CMPT’).
Consistency condition 2
Entries in the BROKER and TRADE tables must satisfy the relationship:
B_COMM_TOTAL = sum(T_COMM)
For each broker defined by:
(B_ID = CA_B_ID) and (CA_ID = T_CA_ID) and (T_ST_ID = “CMPT’).
Consistency condition 3
Entries in the HOLDING_SUMMARY and HOLDING tables must satisfy the relationship:
HS_QTY = sum(H_QTY)
For each holding summary defined by:
(HS_CA_ID = H_CA_ID) and (HS_S_SYMB = H_S_SYMB).
Consistency conditions 1, 2, and 3 were tested using a batch file to issue queries to the database after the database was loaded and after the Business Recovery Test. The results of the queries demonstrated that the database was consistent for all three tests.
The procedure for running the consistency tests is documented in the file SupportingFiles\Clause7\MSTPCE ACID Procedures.pdf.
The consistency scripts and outputs are located in the directory SupportingFiles\Clause7\Consistency.

© Lenovo August 2021 TPC-E Benchmark Full Disclosure Report 25
Isolation Requirements
The isolation property of a Transaction is the level to which it is isolated from the actions of other concurrently executing
Transactions.
Systems that implement Transaction isolation using a locking and/or versioning scheme must demonstrate compliance with the
isolation requirements by executing the tests described in Clause 7.4.2. These isolation tests are designed to verify that the
configuration and implementation of the System Under Test provides the Transactions with the required isolation levels defined in
Clause 7.4.1.3.
Isolation tests 1 through 4 were successfully done following the procedure documented in the file SupportingFiles\Clause7\MSTPCE ACID Procedures.pdf.
The isolation scripts and outputs are located in the directory SupportingFiles\Clause7\Isolation.
Durability Requirements
The SUT must provide Durability. In general, state that persists across failures is said to be Durable and an implementation that
ensures state persists across failures is said to provide Durability. In the context of the benchmark, Durability is more tightly
defined as the SUT’s ability to ensure all Committed data persist across any Single Point of Failure.
Data Accessibility
The System Under Test must be configured to satisfy the requirements for Data Accessibility. Data Accessibility is demonstrated
by the SUT being able to maintain database operations with full data access after the permanent irrecoverable failures of any
single Durable Medium containing database tables, recovery log data, or Database Metadata. Data Accessibility tests are
conducted by inducing failures of Durable Media within the SUT. The failures of Clause 7.6.3 test the ability of the SUT to
maintain access to the data. The specific failures addressed in Clause 7.6.3 are defined sufficiently significant to justify
demonstration of Data Accessibility across such failures. However, the limited nature of the tests listed must not be interpreted to
allow other unrecoverable single points of failure.
The Test Sponsor must report in the Report the Redundancy Level (see Clause 7.6.3.4) and describe the Data Accessibility test(s)
used to demonstrate compliance. A list of all combinations of Durable Media technologies tested in Clause 7.6.3.5 must be
reported in the Report.
A Data Accessibility Graph for each run demonstrating a Redundancy Level must be reported in the Report (see Clause 7.6.4.2).
This benchmark result used Redundancy Level 1. The test for Redundancy Level 1 is the test for permanent irrecoverable failure of any single Durable Medium.
The combinations of Durable Media technologies that were tested are shown in table 7-1. All unique combinations that contained database data, the database log, and/or the tempdb database were tested.
Table 7-1. Combinations of Durable Media Technologies Tested for Data Accessibility
Contents Durable Media
Type Bus Type
Array Redundancy
Controller
Database Data SSD SAS RAID-5 930-8e
Database Log & tempdb SSD SAS RAID-10 940-16i
To prove Redundancy Level 1, the following steps were successfully performed:
1. Restored the database to its freshly-loaded, proven-consistent state.
2. Determined the current number of completed trades in the database, count1.
3. Started a run, using the profile from the measured run, with checkpoints, and met the Data Accessibility Throughput Requirements for at least 5 minutes.
4. Induced the first failure, which in this case was failing a drive in the array containing the database log and tempdb by

© Lenovo August 2021 TPC-E Benchmark Full Disclosure Report 26
physically removing it from the server. Since the array was RAID protected, transaction processing continued.
5. Waited until the Data Accessibility Throughput Requirements were met again for at least 5 minutes.
6. Induced the second failure, which in this case was failing a drive in the database data array by physically removing it from its enclosure. Since the database data array was RAID protected, transaction processing continued.
7. After a few minutes passed, a new drive was inserted into the data enclosure to replace the failed data drive. The array rebuilding process was started.
8. After a few minutes passed, a new drive was inserted into the server to replace the failed log/tempdb drive. The array rebuilding process was started.
9. Continued running the benchmark for at least 20 minutes.
10. Terminated the run gracefully.
11. Retrieved the new number of completed trades in the database by running select count(*) as count2 from
SETTLEMENT.
12. Verified that (count2 – count1), which is the number of actual completed Trade-Result Transactions done during the run, equaled the number of successful Trade-Result transactions reported by the Driver.
13. Allowed the recovery process to complete.
Figure 7-1 is a graph of the measured throughput versus elapsed time for Data Accessibility. The timings of the induced failures as well as the recovery process are indicated.
Figure 7-1. Data Accessibility Graph
The files related to this data accessibility test are located in SupportingFiles\Clause7\Durability\DataAccessibility.
© Lenovo August 2021 TPC-E Benchmark Full Disclosure Report 27
Business Recovery
Business Recovery is the process of recovering from a Single Point of Failure and reaching a point where the business meets
certain operational criteria.
The Test Sponsor must describe in the Report the test(s) used to demonstrate Business Recovery.
The Business Recovery Time must be reported on the Executive Summary Statement and in the Report. If the failures described in
Clauses 7.5.3.1, 7.5.3.2 and 7.5.3.3 were not combined into one Durability test (usually powering off the Database Server during
the run), then the Business Recovery Time for the failure described for instantaneous interruption is the Business Recovery Time
that must be reported in the Executive Summary Statement. All the Business Recovery Times for each test requiring Business
Recovery must be reported in the Report.
The Business Recovery Time Graph (see Clause 7.5.8.2) must be reported in the Report for all Business Recovery tests.
The tests for “Loss of Processing,” “Loss of Vulnerable Storage Component,” and “Loss of all External Power to the SUT” were combined.
The following steps were successfully performed to test Business Recovery:
1. Restored the database to its freshly-loaded, proven-consistent state.
2. Determined the current number of completed trades in the database, count1.
3. Started a run, using the profile from the measured run, with checkpoints, and met the Durability Throughput Requirements for at least 20 minutes.
4. Pulled the power cords from the database server, causing it to immediately cease functioning. All the contents of the server’s main memory and caches were lost. All the disk controllers were inside the server, and none of their batteries were present, so all disk controller cache contents were lost.
5. Stopped submitting Transactions.
6. Plugged in and restarted the database server. It booted a fresh copy of the OS from the OS array.
7. Deleted all of the data and log files for tempdb.
8. Started SQL Server on the database server. It automatically began recovery of the tpce database. The timestamp in the SQL Server ERRORLOG of the first message related to database tpce is considered the start of Database Recovery.
9. Waited for SQL Server to finish recovering the database. The timestamp in the SQL Server ERRORLOG of the message indicating “Recovery is complete” is considered the end of Database Recovery.
10. Since there was a time gap between the end of Database Recovery and the start of Application Recovery, and the Drivers and Transactions needed to be started again (not just continued), the Trade-Cleanup Transaction was executed during this time gap.
11. Started a run, using the profile from the measured run, with checkpoints. The time when the first transaction is submitted to the database is considered the start of Application Recovery.
12. Let the run proceed until a 20 minute window existed such that the first minute of the window and the entire window both scored at least 95% of the Reported Throughput. The time of the beginning of that 20-minute window is considered the end of Application Recovery.
13. Terminated the run gracefully.
14. Verified that no errors were reported during steps 8 through 13.
15. Retrieved the new number of completed trades in the database by running select count(*) as count2 from SETTLEMENT.
16. Verified that (count2 – count1), which is the number of actual completed Trade-Result Transactions done during the two runs, was greater than or equal to the combined number of successful Trade-Result Transactions reported by the Driver for both runs. In the case of an inequality, verified that the difference was less than or equal to the maximum number of transactions that could be simultaneously in-flight from the Driver to the SUT.
17. Verified database consistency.
The Database Recovery Time was 00:05:56. The Application Recovery Time was 00:13:12. The Business Recovery Time, which is the sum of the Database Recovery Time and the Application Recovery Time, was 00:19:08.

© Lenovo August 2021 TPC-E Benchmark Full Disclosure Report 28
Figure 7-2 is a graph of the measured throughput versus elapsed time for Business Recovery.
Figure 7-2. Business Recovery Time Graph
The files related to this business recovery test are located in SupportingFiles\Clause7\Durability\BusinessRecovery.
© Lenovo August 2021 TPC-E Benchmark Full Disclosure Report 29
Clause 8 – Pricing
60-Day Space
Details of the 60-Day Space computations (see Clause 6.6.6.6) along with proof that the database is configured to sustain a
Business Day of growth (see Clause 6.6.6.1) must be reported in the Report.
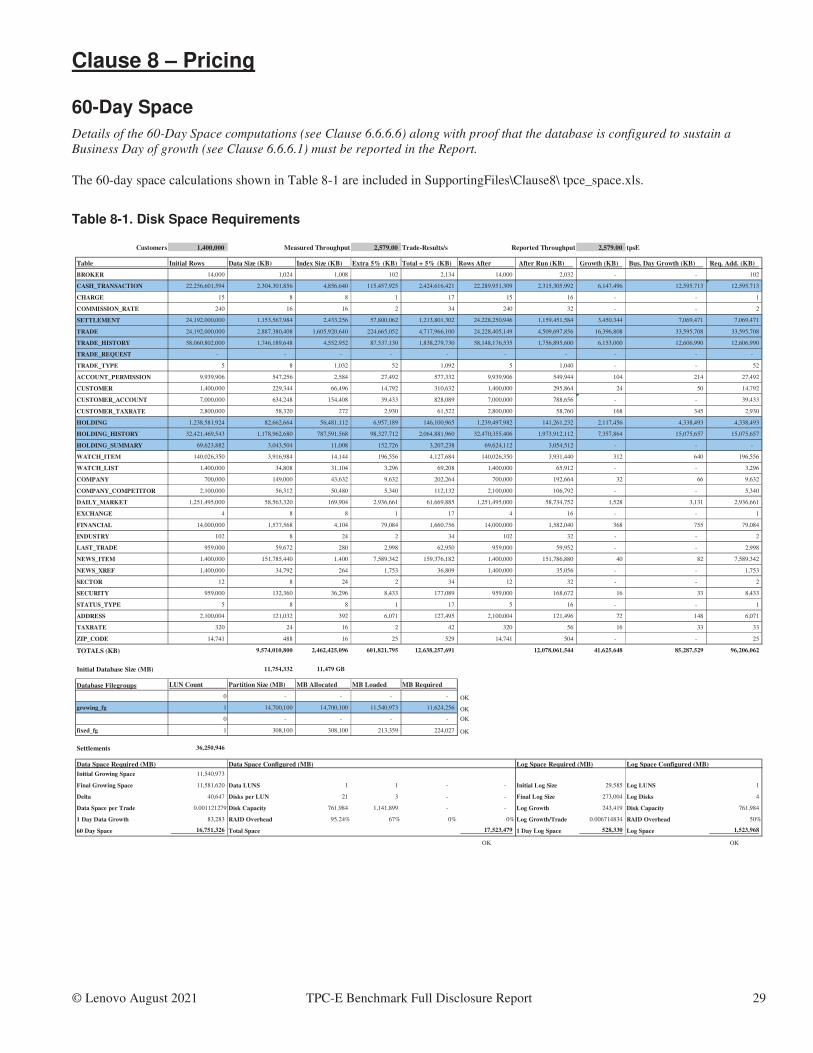
The 60-day space calculations shown in Table 8-1 are included in SupportingFiles\Clause8\ tpce_space.xls.
Table 8-1. Disk Space Requirements
Customers 1,400,000 Measured Throughput 2,579.00 Trade-Results/s Reported Throughput 2,579.00 tpsE
Table Initial Rows Data Size (KB) Index Size (KB) Extra 5% (KB) Total + 5% (KB) Rows After After Run (KB) Growth (KB) Bus. Day Growth (KB) Req. Add. (KB)
BROKER 14,000 1,024 1,008 102 2,134 14,000 2,032 - - 102
CASH_TRANSACTION 22,256,601,594 2,304,301,856 4,856,640 115,457,925 2,424,616,421 22,289,951,309 2,315,305,992 6,147,496 12,595,713 12,595,713
CHARGE 15 8 8 1 17 15 16 - - 1
COMMISSION_RATE 240 16 16 2 34 240 32 - - 2
SETTLEMENT 24,192,000,000 1,153,567,984 2,433,256 57,800,062 1,213,801,302 24,228,250,946 1,159,451,584 3,450,344 7,069,471 7,069,471
TRADE 24,192,000,000 2,887,380,408 1,605,920,640 224,665,052 4,717,966,100 24,228,405,149 4,509,697,856 16,396,808 33,595,708 33,595,708
TRADE_HISTORY 58,060,802,000 1,746,189,648 4,552,952 87,537,130 1,838,279,730 58,148,176,535 1,756,895,600 6,153,000 12,606,990 12,606,990
TRADE_REQUEST - - - - - - - - - -
TRADE_TYPE 5 8 1,032 52 1,092 5 1,040 - - 52
ACCOUNT_PERMISSION 9,939,906 547,256 2,584 27,492 577,332 9,939,906 549,944 104 214 27,492
CUSTOMER 1,400,000 229,344 66,496 14,792 310,632 1,400,000 295,864 24 50 14,792
CUSTOMER_ACCOUNT 7,000,000 634,248 154,408 39,433 828,089 7,000,000 788,656 - - 39,433
CUSTOMER_TAXRATE 2,800,000 58,320 272 2,930 61,522 2,800,000 58,760 168 345 2,930
HOLDING 1,238,581,924 82,662,664 56,481,112 6,957,189 146,100,965 1,239,497,982 141,261,232 2,117,456 4,338,493 4,338,493
HOLDING_HISTORY 32,421,469,543 1,178,962,680 787,591,568 98,327,712 2,064,881,960 32,470,355,406 1,973,912,112 7,357,864 15,075,657 15,075,657
HOLDING_SUMMARY 69,623,882 3,043,504 11,008 152,726 3,207,238 69,624,112 3,054,512 - - -
WATCH_ITEM 140,026,350 3,916,984 14,144 196,556 4,127,684 140,026,350 3,931,440 312 640 196,556
WATCH_LIST 1,400,000 34,808 31,104 3,296 69,208 1,400,000 65,912 - - 3,296
COMPANY 700,000 149,000 43,632 9,632 202,264 700,000 192,664 32 66 9,632
COMPANY_COMPETITOR 2,100,000 56,312 50,480 5,340 112,132 2,100,000 106,792 - - 5,340
DAILY_MARKET 1,251,495,000 58,563,320 169,904 2,936,661 61,669,885 1,251,495,000 58,734,752 1,528 3,131 2,936,661
EXCHANGE 4 8 8 1 17 4 16 - - 1
FINANCIAL 14,000,000 1,577,568 4,104 79,084 1,660,756 14,000,000 1,582,040 368 755 79,084
INDUSTRY 102 8 24 2 34 102 32 - - 2
LAST_TRADE 959,000 59,672 280 2,998 62,950 959,000 59,952 - - 2,998
NEWS_ITEM 1,400,000 151,785,440 1,400 7,589,342 159,376,182 1,400,000 151,786,880 40 82 7,589,342
NEWS_XREF 1,400,000 34,792 264 1,753 36,809 1,400,000 35,056 - - 1,753
SECTOR 12 8 24 2 34 12 32 - - 2
SECURITY 959,000 132,360 36,296 8,433 177,089 959,000 168,672 16 33 8,433
STATUS_TYPE 5 8 8 1 17 5 16 - - 1
ADDRESS 2,100,004 121,032 392 6,071 127,495 2,100,004 121,496 72 148 6,071
TAXRATE 320 24 16 2 42 320 56 16 33 33
ZIP_CODE 14,741 488 16 25 529 14,741 504 - - 25
TOTALS (KB) 9,574,010,800 2,462,425,096 601,821,795 12,638,257,691 12,078,061,544 41,625,648 85,287,529 96,206,062
11,754,332 11,479 GB
Database Filegroups LUN Count Partition Size (MB) MB Allocated MB Loaded MB Required
0 - - - - OK
growing_fg 1 14,700,100 14,700,100 11,540,973 11,624,256 OK
0 - - - - OK
fixed_fg 1 308,100 308,100 213,359 224,027 OK
Settlements 36,250,946
Initial Growing Space 11,540,973
Final Growing Space 11,581,620 Data LUNS 1 1 - - Initial Log Size 29,585 Log LUNS 1
Delta 40,647 Disks per LUN 21 3 - - Final Log Size 273,004 Log Disks 4
Data Space per Trade 0.001121279 Disk Capacity 761,984 1,141,899 - - Log Growth 243,419 Disk Capacity 761,984
1 Day Data Growth 83,283 RAID Overhead 95.24% 67% 0% 0% Log Growth/Trade 0.006714834 RAID Overhead 50%
60 Day Space 16,751,326 Total Space 17,523,479 1 Day Log Space 528,330 Log Space 1,523,968
OK OK
Initial Database Size (MB)
Log Space Required (MB) Log Space Configured (MB)Data Space Configured (MB)Data Space Required (MB)
© Lenovo August 2021 TPC-E Benchmark Full Disclosure Report 30
Configuration Components
A detailed list of hardware, software, and/or Licensed Compute Services used in the Priced Configuration must be reported. The
listing for each separately Orderable item must have: vendor Part Number, description and applicable release/revision level,
Pricing Source, List Price including the ISO Currency Code, quantity, extended price including the ISO Currency Code,
applicable Discounted price including the ISO Currency Code, 3-year maintenance price including the ISO Currency Code.
If package-pricing is used, the vendor Part Number of the package and a description uniquely identifying each of the Components
of the package must be disclosed to a sufficient level of detail to meet the requirements of Clause 5.2.
A detailed list of all hardware, software, and maintenance is provided in the Executive Summary at the front of this report. Price quotations are included in Appendix A.
Pricing Methodology
If the Benchmark Standard does not specify the allowed Pricing Methodology, then the Default Pricing Methodology will apply.
The price of the entire Priced Configuration must be used, including all hardware (purchase price), software (license charges),
Licensed Compute Services, and hardware maintenance/Software Maintenance Update charges over a period of 3 years (36
months).
The default 3-year Pricing Methodology was used.
Pricing Locale
The Priced Locale and Priced Currency of the Priced Configuration must be disclosed. All Line Items of the system must be
Generally Available in the Priced Locale by the Availability Date.
The configuration was priced in $USD for the United States of America.
Currency Conversions
The date, rate(s), and source of any Currency Conversions must be reported. Documentation of all Currency Conversions from
the Currency Conversion Source, including the date of the conversion, must be included in the FDR.
No currency conversions were done.
Pricing Calculations
The following items must be included in the Full Disclosure Report and Executive Summary:
• the benchmark performance metric
• respective calculations for the Pricing Methodology pricing time period (See Clauses 1.7 through 1.10)
• price/performance
• Availability Date
Pricing may use packages and Discounts that are Generally Available (see Clause 1.5). The priced items over which a Discount
applies must be specified (see Clause 5.1.2). The percentage, amount, and basis (including type and justification) of all allowed
Discounts listed must be disclosed (see Clause 5.1.2).
The benchmark performance metric, pricing calculations, discount information, price/performance, and Availability Date are all included in the Executive Summary at the front of this report.

© Lenovo August 2021 TPC-E Benchmark Full Disclosure Report 31
Total Price
The Total Price, including the ISO Currency Code, of the entire Priced Configuration and the Price/Performance metric must be
reported.
The Total Price and Price/Performance are both included in the Executive Summary at the front of this report.
Availability Date
The committed Availability Date of Line Items used in the price calculations must be reported. The Availability Date must be
reported on the first page of the Executive Summary and with a precision of one day. When the priced system includes products
and/or Licensed Compute Services with different Availability Dates, the reported Availability Date for the priced system must be
a date at which all Line Items are committed to be Generally Available. Each Line Item used in the Priced Configuration is
considered to be Available on the Availability Date unless an earlier date is specified.
For each of the Line Items that are not Orderable on the report date of the FDR, the following information must be included in
the FDR:
• Name and Part Number of the item that is not Orderable
• The date when the Line Item can be ordered (on or before the Availability Date)
• The method to be used to order the Component (at or below the quoted price) when the order date arrives
• The method for verifying the price
The total solution as priced will be generally available August 17, 2021.
Supporting Files Index
An index for all files required by Clause 9.4 Supporting Files must be provided in the Report.
An index of the files contained in the supporting files is here: SupportingFiles\SupportingFilesIndex.pdf
Auditor’s Attestation Letter
The Auditor’s Attestation Letter, which indicates compliance, must be included in the Report.
The auditor’s Attestation Letter is on the next two pages.

63 Lourdes Dr. | Leominster, MA 01453 | 978-343-6562 | www.sizing.com
Michael Crutcher
Manager - ISG Performance Development
7001 Development Drive
Morrisville, NC 27560
August 12, 2021
I verified the TPC Benchmark™ E v1.14.0 performance of the following configuration:
Platform: Lenovo ThinkSystem SR665
Operating System: Microsoft Windows Server 2019 Standard Edition
Database Manager: Microsoft SQL Server 2019 Enterprise Edition
The results were:
Performance Metric 2,579.00 tpsE
Trade-Result 90th %-tile 0.04 Seconds
Tier B (Server) Lenovo ThinkSystem SR665
CPUs 2 x AMD EPYC 72F3 8-Core Processor (3.7 GHz)
Memory 1,024 GB
Storage Qty Size Type
2 480 GB SATA SSD
4 800 GB SAS SSD
3 1,200 GB 10K rpm SAS HDD
21 800 GB SAS SSD
Tier A (Client) Lenovo ThinkSystem SR650 CPUs 2 x Intel Xeon Gold 6248R (3.00 GHz, 24-core, 35.75 MB L3)
Memory 96 GB
Storage 2 x 300 GB 10K rpm SAS HDD
In my opinion, these performance results were produced in compliance with the TPC
requirements for the benchmark.
The following verification items were given special attention:
· All EGen components were verified to be v1.14.0.
· The transactions were correctly implemented.
· The database was properly scaled and populated for 1,400,000 customers.
63 Lourdes Dr. | Leominster, MA 01453 | 978-343-6562 | www.sizing.com
· The mandatory network between the driver and the SUT was configured.
· The ACID properties were met.
· Input data was generated according to the specified percentages.
· The reported response times were correctly measured.
· All 90% response times were under the specified maximums.
· The measurement interval was 120 minutes.
· The implementation used Redundancy Level 1.
· The Business Recovery Time of 00:19:08 was correctly measured.
· The 60-day storage requirement was correctly computed.
· The system pricing was verified for major components and maintenance.
Additional Audit Notes:
None.
Respectfully Yours,
Doug Johnson, Certified TPC Auditor

© Lenovo August 2021 TPC-E Benchmark Full Disclosure Report 34
Appendix A – Price Quotes
Written price quotations from all Third Party Pricing Sources must be included as the final appendix in the FDR.
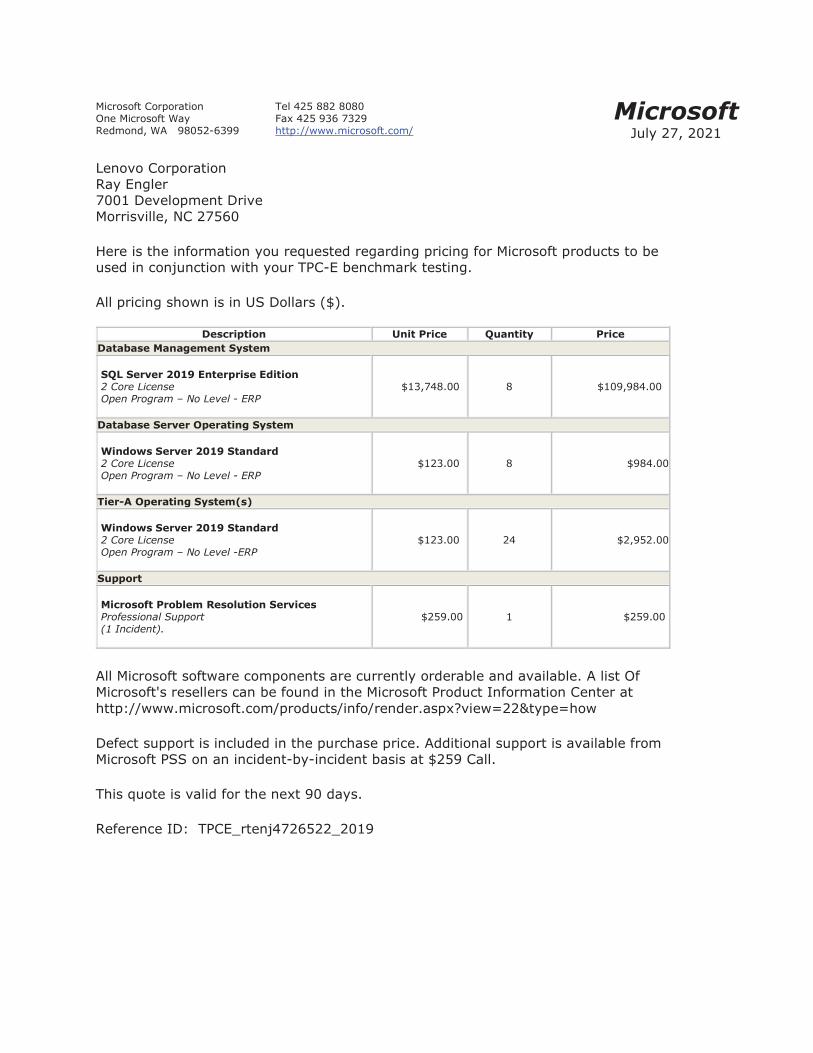
������������������ � ������������������ ��������������
�� !���������"�#!�����$���%���&''((()���������)���'
���������*+ ��$����,
-� �.���������� ���/ 0 �� $��,1�.� ���� �1��.� ������.� ��2�$���
3������%�� �������� ��+��4+�������0���� 0����� 0����������������+�����5�+���� �� 6+ ���� (��%��+��7�/5� �%���8����� 0)
� ����� 0�%�( ��� 9:1� ���;<=)
��������� ���� ���� ������� ���� ������������������������ �������������������������������� ���������������� ��������������������������
<,��$!�)�� � <,�����!)��
������������������������������� � ��!��������������������� ���������������� �����������������������������
<,��)�� � <��!)��
"���#$����������������%�& � ��!��������������������� �������������� �� ������������������������� ��
<,��)�� �! <�����)��
������ ������'�� ��(���)��(������������ ��������������� ��� ������ ��!"
<���)�� , <���)��
� �������������(�������� � ������+��� � �������5 �� ��.�� �5 �)� ��������������>����� ����� 5���+ �� �%����������7���+��? �������� � �����
%���&''((()���������)���'����+���'� ��'�� ���)���#@.��(A��B����A%�(
1������+�������� � +���� �%��+��%��������)������� � �+��������.�� �5 ��������������7::� � � ���� ��5��� ���� �5������<���� )
�%��4+�����.� ������%� �#�������)
������ ��?1&�7/C��� 6!$�����C��,�