Embed Size (px)
Citation preview
- 1 -
Toyota Tsusho Corporation
Financial Highlights
for the Three Months Ended June 30, 2021
[IFRS basis] (Consolidated) July 30, 2021
(Amounts rounded down to the nearest million yen)
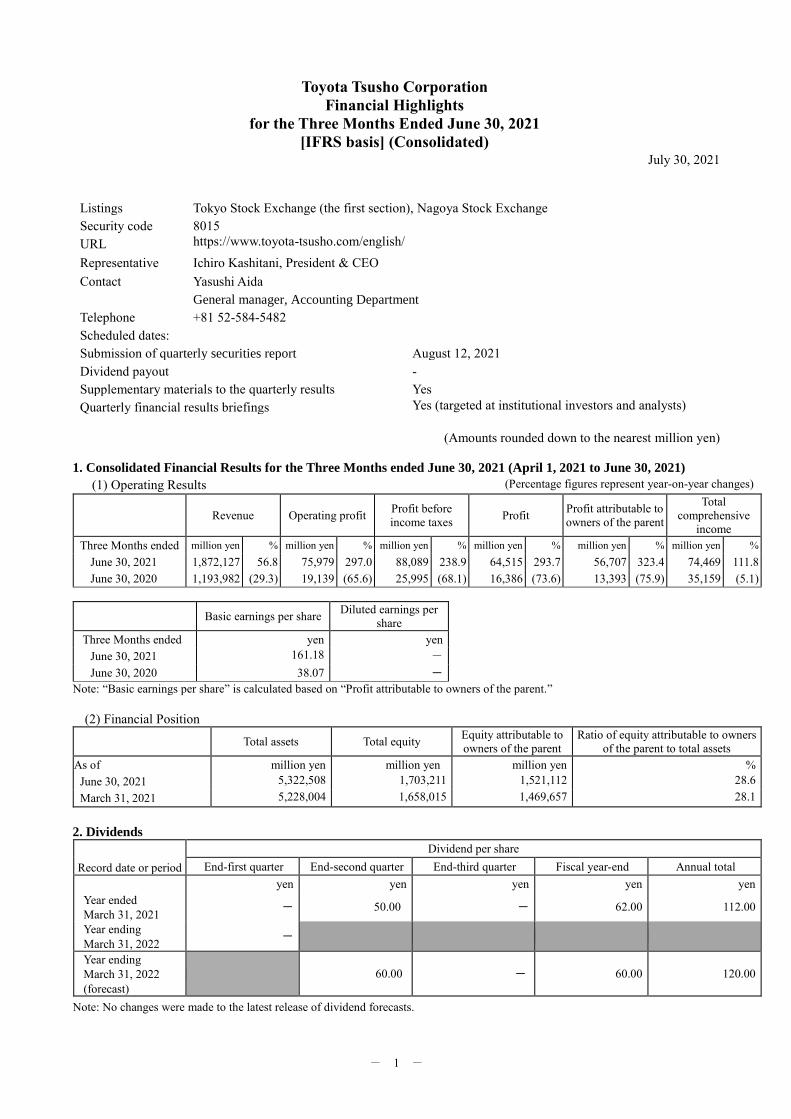
1. Consolidated Financial Results for the Three Months ended June 30, 2021 (April 1, 2021 to June 30, 2021)
(1) Operating Results (Percentage figures represent year-on-year changes)
Revenue Operating profit Profit before
income taxes Profit
Profit attributable to
owners of the parent
Total
comprehensive
income
Three Months ended million yen % million yen % million yen % million yen % million yen % million yen %
June 30, 2021 1,872,127 56.8 75,979 297.0 88,089 238.9 64,515 293.7 56,707 323.4 74,469 111.8
June 30, 2020 1,193,982 (29.3) 19,139 (65.6) 25,995 (68.1) 16,386 (73.6) 13,393 (75.9) 35,159 (5.1)
Basic earnings per share Diluted earnings per
share
Three Months ended yen yen
June 30, 2021 161.18 -
June 30, 2020 38.07 -
Note: “Basic earnings per share” is calculated based on “Profit attributable to owners of the parent.”
(2) Financial Position
Total assets Total equity Equity attributable to
owners of the parent
Ratio of equity attributable to owners
of the parent to total assets
As of million yen million yen million yen %
June 30, 2021 5,322,508 1,703,211 1,521,112 28.6
March 31, 2021 5,228,004 1,658,015 1,469,657 28.1
2. Dividends
Record date or period
Dividend per share
End-first quarter End-second quarter End-third quarter Fiscal year-end Annual total
yen yen yen yen yen
Year ended
March 31, 2021 - 50.00 - 62.00 112.00
Year ending
March 31, 2022 -
Year ending
March 31, 2022
(forecast)
60.00 - 60.00 120.00
Note: No changes were made to the latest release of dividend forecasts.
Listings Tokyo Stock Exchange (the first section), Nagoya Stock Exchange
Security code 8015
URL https://www.toyota-tsusho.com/english/
Representative Ichiro Kashitani, President & CEO
Contact Yasushi Aida
General manager, Accounting Department
Telephone +81 52-584-5482
Scheduled dates:
Submission of quarterly securities report August 12, 2021
Dividend payout -
Supplementary materials to the quarterly results Yes
Quarterly financial results briefings Yes (targeted at institutional investors and analysts)
- 2 -
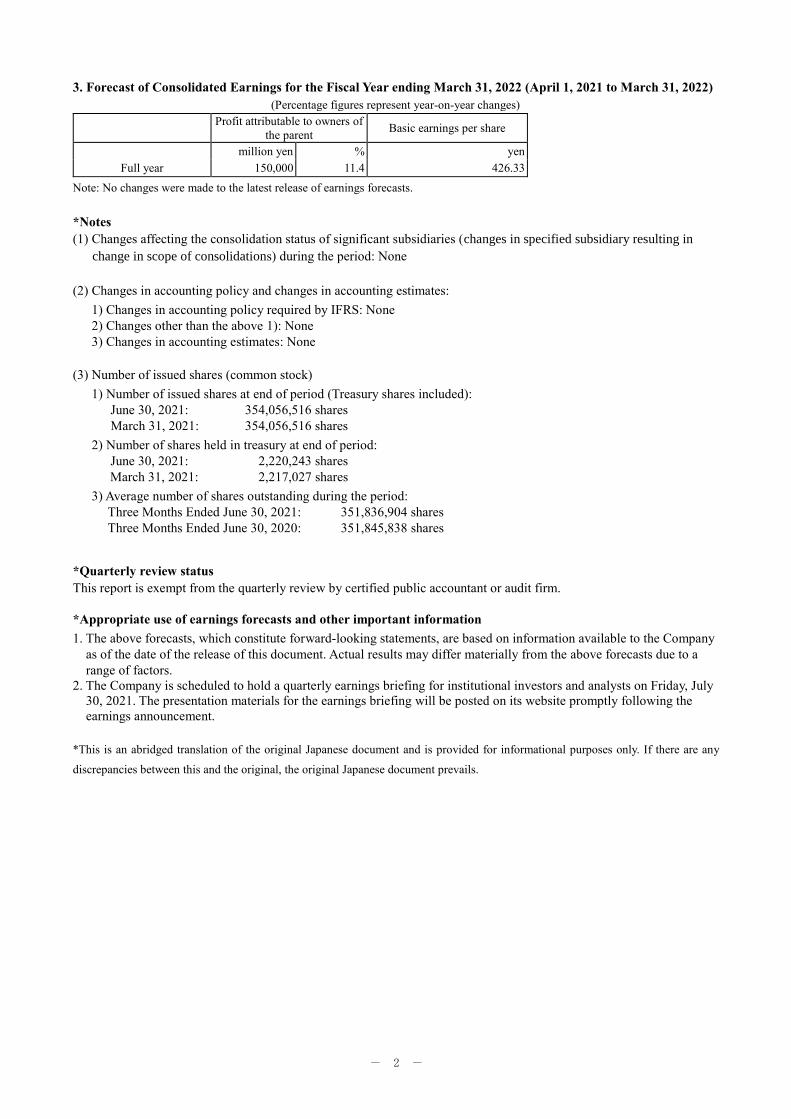
3. Forecast of Consolidated Earnings for the Fiscal Year ending March 31, 2022 (April 1, 2021 to March 31, 2022)
(Percentage figures represent year-on-year changes)
Profit attributable to owners of
the parent Basic earnings per share
million yen % yen
Full year 150,000 11.4 426.33
Note: No changes were made to the latest release of earnings forecasts.
*Notes
(1) Changes affecting the consolidation status of significant subsidiaries (changes in specified subsidiary resulting in
change in scope of consolidations) during the period: None
(2) Changes in accounting policy and changes in accounting estimates:
1) Changes in accounting policy required by IFRS: None
2) Changes other than the above 1): None
3) Changes in accounting estimates: None
(3) Number of issued shares (common stock)
1) Number of issued shares at end of period (Treasury shares included):
June 30, 2021: 354,056,516 shares
March 31, 2021: 354,056,516 shares
2) Number of shares held in treasury at end of period:
June 30, 2021: 2,220,243 shares
March 31, 2021: 2,217,027 shares
3) Average number of shares outstanding during the period:
Three Months Ended June 30, 2021: 351,836,904 shares
Three Months Ended June 30, 2020: 351,845,838 shares
*Quarterly review status
This report is exempt from the quarterly review by certified public accountant or audit firm.
*Appropriate use of earnings forecasts and other important information
1. The above forecasts, which constitute forward-looking statements, are based on information available to the Company
as of the date of the release of this document. Actual results may differ materially from the above forecasts due to a
range of factors.
2. The Company is scheduled to hold a quarterly earnings briefing for institutional investors and analysts on Friday, July
30, 2021. The presentation materials for the earnings briefing will be posted on its website promptly following the
earnings announcement.
*This is an abridged translation of the original Japanese document and is provided for informational purposes only. If there are any
discrepancies between this and the original, the original Japanese document prevails.
- 3 -
1. Consolidated Results of Operations
(1) Overview of Operating Performance
1) Business Environment
In the first three months of the fiscal year (April 1, 2021 – June 30, 2021), the global economy staged a recovery
as COVID-19 infections abated to some extent, particularly in Europe and North America, but the degree of
improvement in each country varied depending on progress with the vaccination rollout.
The U.S. economy made progress towards economic normalization with business activity rebounding sharply
thanks to a rising vaccination rate and large-scale economic stimulus measures. The recovery in service industries
was brisk, whilst the employment environment also improved significantly. In Europe, lockdowns were eased in
each country after infection numbers peaked out and consumer spending and the employment and income
environments started to recover. In contrast, the recovery of the U.K. economy was beset by a growing sense of
stagnation because a resurgence in infections further delayed the complete lifting of lockdown restrictions. The
Chinese economy returned to pre-pandemic levels driven by a sustained recovery in business activity,
improvement in the employment and income environments, expanding consumer spending, and growth in both
imports and exports. In emerging market economies, business activity remained lackluster owing to the ongoing
spread of infections and vaccination rollout delays.
Against this backdrop, the Japanese economy continued to see a recovery in exports, as well as manufacturing
industry production activity, but the recovery of business activities was limited because the announcement of a
third state of emergency prolonged the downturn in consumer spending and inbound tourism demand.
2) Business Activities by Segment
(I) Metals
Maruti Suzuki Toyotsu India Private Limited, a vehicle dismantling and recycling joint venture established in
October 2019 for the purpose of reducing illegal disposal and appropriately disposing of end-of-life vehicles in
India, had largely completed construction of its plant by June 2021, and began making final preparations for
bringing operations online.
(II) Global Parts & Logistics
For the purpose of streamlining operations in the logistics industry and minimizing the industry’s environmental
footprint, in April 2021 we concluded a capital and business alliance with Hacobu Co., Ltd., which operates a
platform for centrally managing logistics information. The partnership will continue to propose solutions aimed at
achieving smart logistics and optimizing transport, delivery, and logistics operations.
(III) Automotive
To further promote our mobility services business, in April 2021 we invested in Purdy Motor S.A., a Toyota and
Lexus dealership in Costa Rica. We will aim to help further enhance the value of the Toyota and Lexus brands and
contribute to “mobility society” development in Costa Rica as well as the country’s economy.
(IV) Machinery, Energy & Projects
With the aim of helping to decarbonize the maritime transport industry, Toyota Tsusho Petroleum Private Limited
conducted a trial in June 2021 involving supplying marine biodiesel to NYK Line’s oceangoing vessels at the Port
of Singapore. We intend to undertake initiatives that encourage shipping vessels to switch to alternative fuels with
a view to helping to establish the regular usage of biofuels.
(V) Chemicals & Electronics
To help achieve decarbonization of commodity plastics, in May 2021 we concluded a bio-naphtha procurement
agreement with Mitsui Chemicals, Inc. and Finnish biomass fuel supplier Neste Oyj. We will work towards
developing applications and creating new markets in Japan for domestically produced biomass plastics.
(VI) Food & Consumer Services
For the purpose of building a system through which the necessary medical and pharmaceutical products can be
delivered to hospitals and pharmacies in a timely fashion, in March 2021 we invested in the Indian pharmaceutical
distributor Skites Pharma Private Ltd. Through our management of Sakra World Hospital in India, we intend to
leverage our know-how relating to gauging the needs of hospitals—i.e., the buyers of pharmaceuticals—in an
effort to centralize and streamline the distribution of drugs.
(VII) Africa
With the aim of locally producing automobiles in line with automotive market demand, Toyota Tsusho
Manufacturing Ghana Co. Limited became the first Japanese company to establish a vehicle assembly plant in
Ghana. It commenced assembly production of the Toyota Hilux in June 2021 and announced that production of
the Swift, a compact car model of Suzuki Motor Corporation, will begin at the plant in 2022. In promoting the
production of high-quality vehicles, we seek to contribute to the development of Ghana’s automotive industry and
economy.
3) Operating Results
- 4 -
The Toyota Tsusho Group’s consolidated revenue for the three months ended June 30, 2021 increased 678.2
billion yen (56.8%) year on year to 1,872.1 billion yen, largely as a result of increases in trading volume of
automobile production-related products and automotive sales volume.
Consolidated operating profit increased 56.8 billion yen (297%) year on year to 75.9 billion yen, mainly due to an
increase in gross profit. Profit for the period (attributable to owners of the parent) increased 43.4 billion yen
(323.4%) year on year to 56.7 billion yen, largely owing to an increase in operating profit, as well as a higher
share of profit (loss) of investments accounted for using the equity method.
Segment Information
(I) Metals
Profit for the period (attributable to owners of the parent) increased 12.7 billion yen (481.5%) year on year to 15.3
billion yen, largely as a result of an increase in trading volume of automobile production-related products.
(II) Global Parts & Logistics
Profit for the period (attributable to owners of the parent) increased 6.6 billion yen (641.9%) year on year to 7.6
billion yen, largely as a result of an increase in trading volume of automotive parts.
(III) Automotive
Profit for the period (attributable to owners of the parent) increased 4.7 billion yen year on year to 5.0 billion yen,
largely due to an increase in sales volume handled by overseas automotive dealerships.
(IV) Machinery, Energy & Projects
Profit for the period (attributable to owners of the parent) increased 0.4 billion yen (7.6%) year on year to 5.8
billion yen, largely as a result of an increase in share of profit (loss) of investments accounted for using the equity
method in the electric power business.
(V) Chemicals & Electronics
Profit for the period (attributable to owners of the parent) increased 8.5 billion yen (198.6%) year on year to 12.7
billion yen, largely due to an increase in trading volume in the electronics business.
(VI) Food & Consumer Services
Profit for the period (attributable to owners of the parent) increased 0.8 billion yen (39.9%) year on year to 2.8
billion yen, largely due to higher market prices in the food business and an increase in trading volume in the
lifestyle business.
(VII) Africa
Profit for the period (attributable to owners of the parent) increased 9.3 billion yen year on year to 6.4 billion yen,
largely as a result of growth in automotive sales volume.
(2) Consolidated Financial Condition
At June 30, 2021, consolidated assets totaled 5,322.5 billion yen, a 94.5 billion yen increase from March 31, 2021.
The increase is attributable in part to a 77.4 billion yen increase in inventories. Consolidated equity at June 30,
2021 totaled 1,703.2 billion yen, a 45.2 billion yen increase from March 31, 2021. The increase is attributable in
part to a 33.4 billion yen increase in retained earnings accruing from consolidated profit for the period
(attributable to owners of the parent).
(3) Outlook for Fiscal Year Ending March 31, 2022
The consolidated earnings forecast issued on April 28, 2021 remains unchanged.
- 5 -
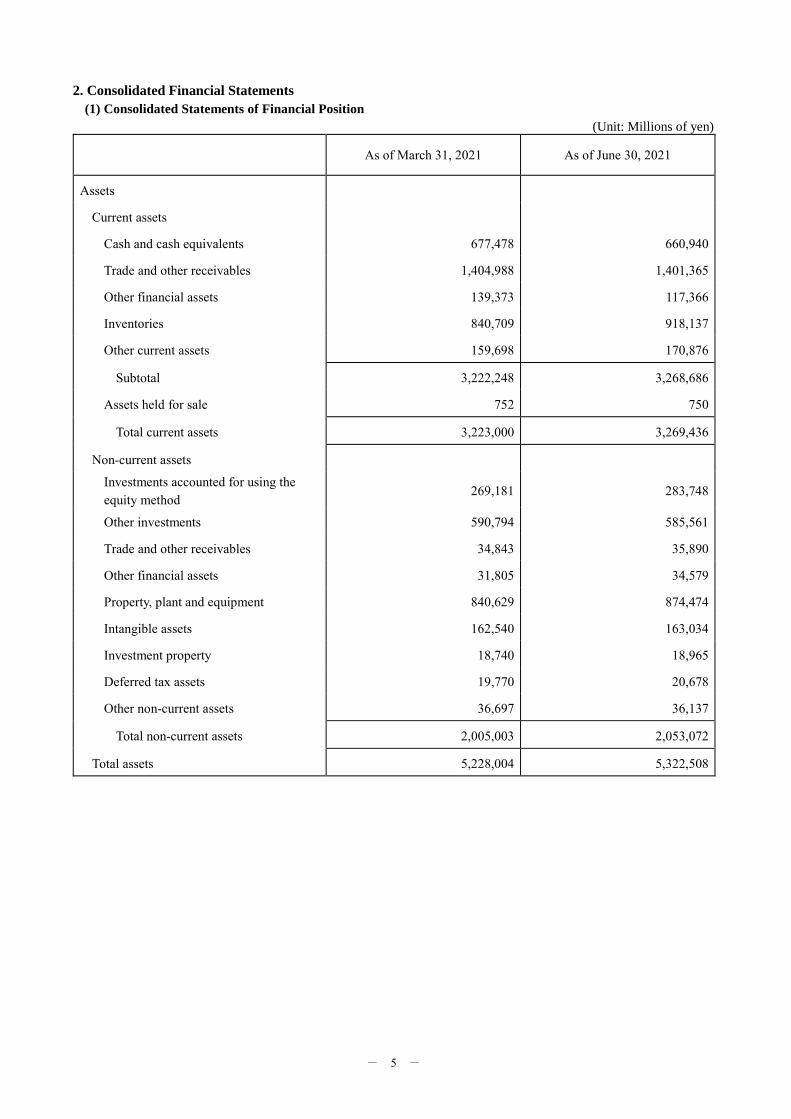
2. Consolidated Financial Statements
(1) Consolidated Statements of Financial Position
(Unit: Millions of yen)
As of March 31, 2021 As of June 30, 2021
Assets
Current assets
Cash and cash equivalents 677,478 660,940
Trade and other receivables 1,404,988 1,401,365
Other financial assets 139,373 117,366
Inventories 840,709 918,137
Other current assets 159,698 170,876
Subtotal 3,222,248 3,268,686
Assets held for sale 752 750
Total current assets 3,223,000 3,269,436
Non-current assets
Investments accounted for using the
equity method 269,181 283,748
Other investments 590,794 585,561
Trade and other receivables 34,843 35,890
Other financial assets 31,805 34,579
Property, plant and equipment 840,629 874,474
Intangible assets 162,540 163,034
Investment property 18,740 18,965
Deferred tax assets 19,770 20,678
Other non-current assets 36,697 36,137
Total non-current assets 2,005,003 2,053,072
Total assets 5,228,004 5,322,508
- 6 -
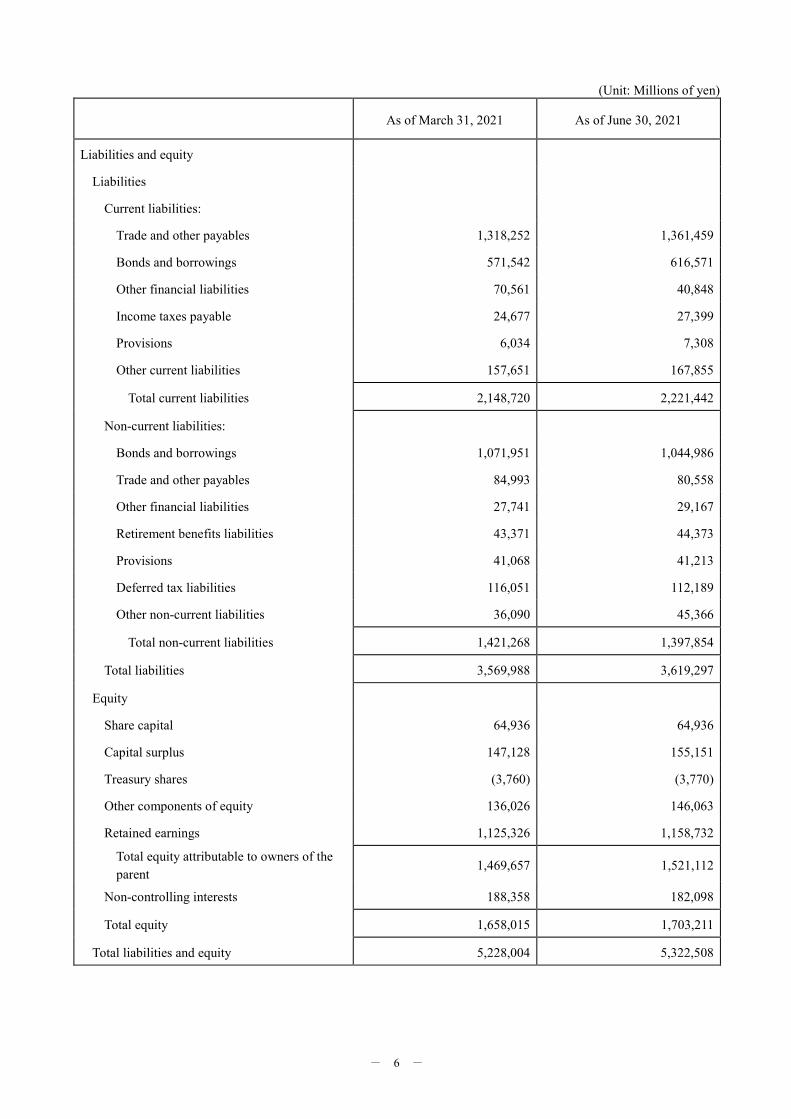
(Unit: Millions of yen)
As of March 31, 2021 As of June 30, 2021
Liabilities and equity
Liabilities
Current liabilities:
Trade and other payables 1,318,252 1,361,459
Bonds and borrowings 571,542 616,571
Other financial liabilities 70,561 40,848
Income taxes payable 24,677 27,399
Provisions 6,034 7,308
Other current liabilities 157,651 167,855
Total current liabilities 2,148,720 2,221,442
Non-current liabilities:
Bonds and borrowings 1,071,951 1,044,986
Trade and other payables 84,993 80,558
Other financial liabilities 27,741 29,167
Retirement benefits liabilities 43,371 44,373
Provisions 41,068 41,213
Deferred tax liabilities 116,051 112,189
Other non-current liabilities 36,090 45,366
Total non-current liabilities 1,421,268 1,397,854
Total liabilities 3,569,988 3,619,297
Equity
Share capital 64,936 64,936
Capital surplus 147,128 155,151
Treasury shares (3,760) (3,770)
Other components of equity 136,026 146,063
Retained earnings 1,125,326 1,158,732
Total equity attributable to owners of the
parent 1,469,657 1,521,112
Non-controlling interests 188,358 182,098
Total equity 1,658,015 1,703,211
Total liabilities and equity 5,228,004 5,322,508
- 7 -
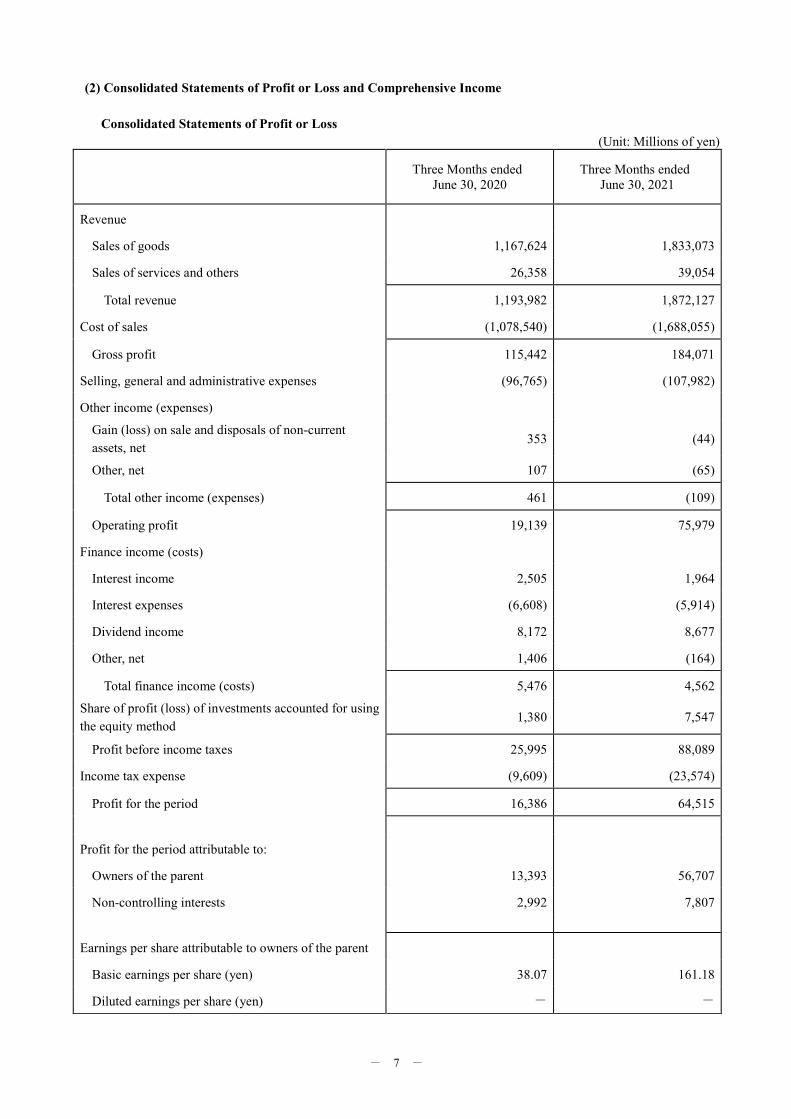
(2) Consolidated Statements of Profit or Loss and Comprehensive Income
Consolidated Statements of Profit or Loss
(Unit: Millions of yen)
Three Months ended
June 30, 2020
Three Months ended
June 30, 2021
Revenue
Sales of goods 1,167,624 1,833,073
Sales of services and others 26,358 39,054
Total revenue 1,193,982 1,872,127
Cost of sales (1,078,540) (1,688,055)
Gross profit 115,442 184,071
Selling, general and administrative expenses (96,765) (107,982)
Other income (expenses)
Gain (loss) on sale and disposals of non-current
assets, net 353 (44)
Other, net 107 (65)
Total other income (expenses) 461 (109)
Operating profit 19,139 75,979
Finance income (costs)
Interest income 2,505 1,964
Interest expenses (6,608) (5,914)
Dividend income 8,172 8,677
Other, net 1,406 (164)
Total finance income (costs) 5,476 4,562
Share of profit (loss) of investments accounted for using
the equity method 1,380 7,547
Profit before income taxes 25,995 88,089
Income tax expense (9,609) (23,574)
Profit for the period 16,386 64,515
Profit for the period attributable to:
Owners of the parent 13,393 56,707
Non-controlling interests 2,992 7,807
Earnings per share attributable to owners of the parent
Basic earnings per share (yen) 38.07 161.18
Diluted earnings per share (yen) - -
- 8 -
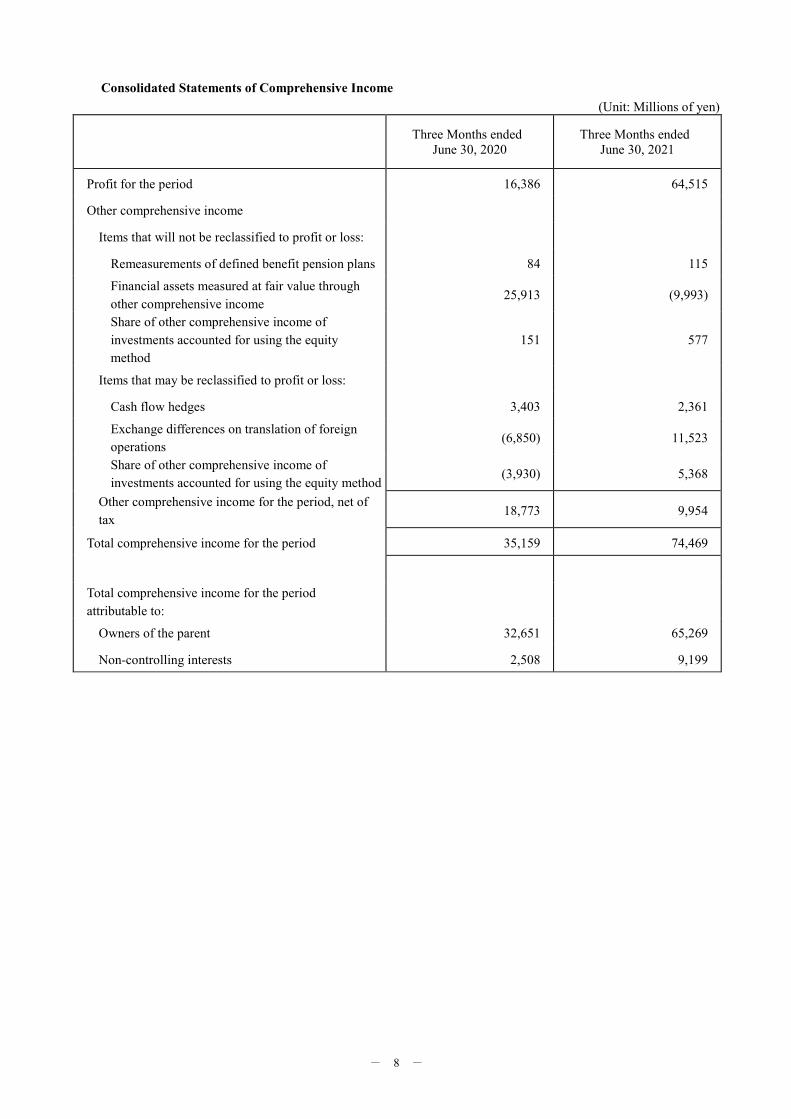
Consolidated Statements of Comprehensive Income
(Unit: Millions of yen)
Three Months ended
June 30, 2020
Three Months ended
June 30, 2021
Profit for the period 16,386 64,515
Other comprehensive income
Items that will not be reclassified to profit or loss:
Remeasurements of defined benefit pension plans 84 115
Financial assets measured at fair value through
other comprehensive income 25,913 (9,993)
Share of other comprehensive income of
investments accounted for using the equity
method
151 577
Items that may be reclassified to profit or loss:
Cash flow hedges 3,403 2,361
Exchange differences on translation of foreign
operations (6,850) 11,523
Share of other comprehensive income of
investments accounted for using the equity method (3,930) 5,368
Other comprehensive income for the period, net of
tax 18,773 9,954
Total comprehensive income for the period 35,159 74,469
Total comprehensive income for the period
attributable to:
Owners of the parent 32,651 65,269
Non-controlling interests 2,508 9,199
- 9 -
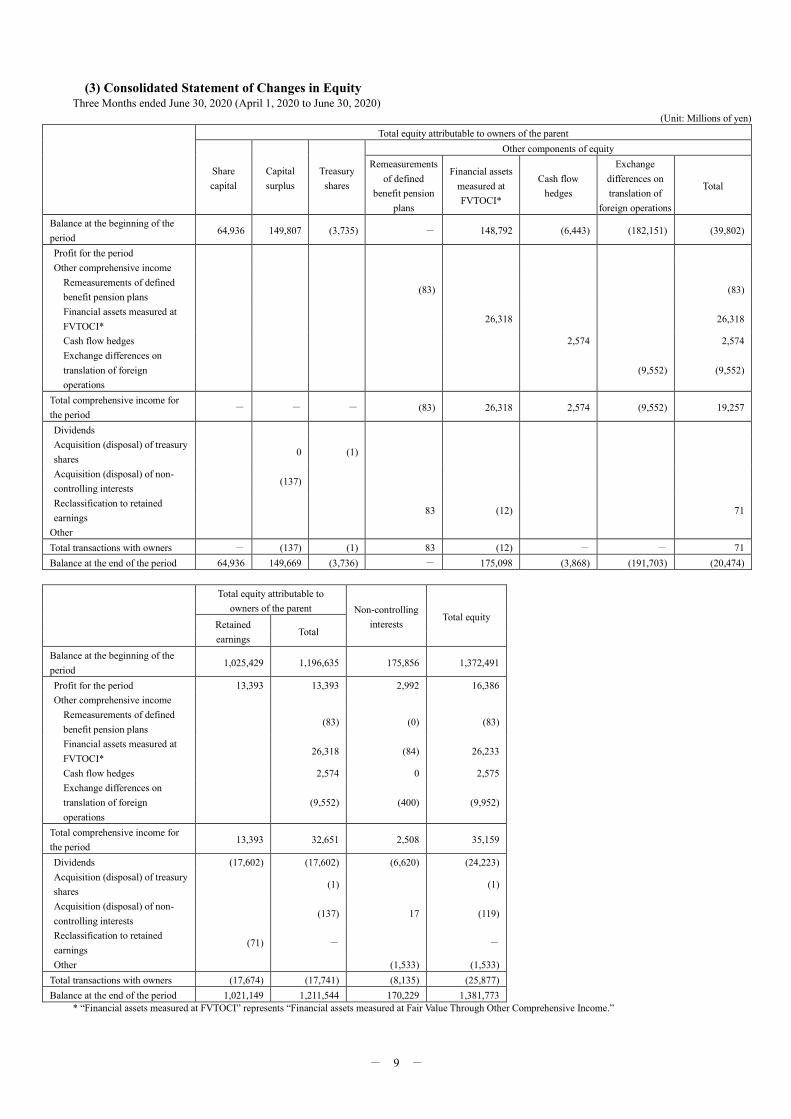
(3) Consolidated Statement of Changes in Equity Three Months ended June 30, 2020 (April 1, 2020 to June 30, 2020)
(Unit: Millions of yen)
Total equity attributable to owners of the parent
Share
capital
Capital
surplus
Treasury
shares
Other components of equity
Remeasurements
of defined
benefit pension
plans
Financial assets
measured at
FVTOCI*
Cash flow
hedges
Exchange
differences on
translation of
foreign operations
Total
Balance at the beginning of the
period 64,936 149,807 (3,735) - 148,792 (6,443) (182,151) (39,802)
Profit for the period
Other comprehensive income
Remeasurements of defined
benefit pension plans (83) (83)
Financial assets measured at
FVTOCI* 26,318 26,318
Cash flow hedges 2,574 2,574
Exchange differences on
translation of foreign
operations
(9,552) (9,552)
Total comprehensive income for
the period - - - (83) 26,318 2,574 (9,552) 19,257
Dividends
Acquisition (disposal) of treasury
shares 0 (1)
Acquisition (disposal) of non-
controlling interests (137)
Reclassification to retained
earnings 83 (12) 71
Other
Total transactions with owners - (137) (1) 83 (12) - - 71
Balance at the end of the period 64,936 149,669 (3,736) - 175,098 (3,868) (191,703) (20,474)
Total equity attributable to
owners of the parent Non-controlling
interests Total equity
Retained
earnings Total
Balance at the beginning of the
period 1,025,429 1,196,635 175,856 1,372,491
Profit for the period 13,393 13,393 2,992 16,386
Other comprehensive income
Remeasurements of defined
benefit pension plans (83) (0) (83)
Financial assets measured at
FVTOCI* 26,318 (84) 26,233
Cash flow hedges 2,574 0 2,575
Exchange differences on
translation of foreign
operations
(9,552) (400) (9,952)
Total comprehensive income for
the period 13,393 32,651 2,508 35,159
Dividends (17,602) (17,602) (6,620) (24,223)
Acquisition (disposal) of treasury
shares (1) (1)
Acquisition (disposal) of non-
controlling interests (137) 17 (119)
Reclassification to retained
earnings (71) - -
Other (1,533) (1,533)
Total transactions with owners (17,674) (17,741) (8,135) (25,877)
Balance at the end of the period 1,021,149 1,211,544 170,229 1,381,773
* “Financial assets measured at FVTOCI” represents “Financial assets measured at Fair Value Through Other Comprehensive Income.”
- 10 -
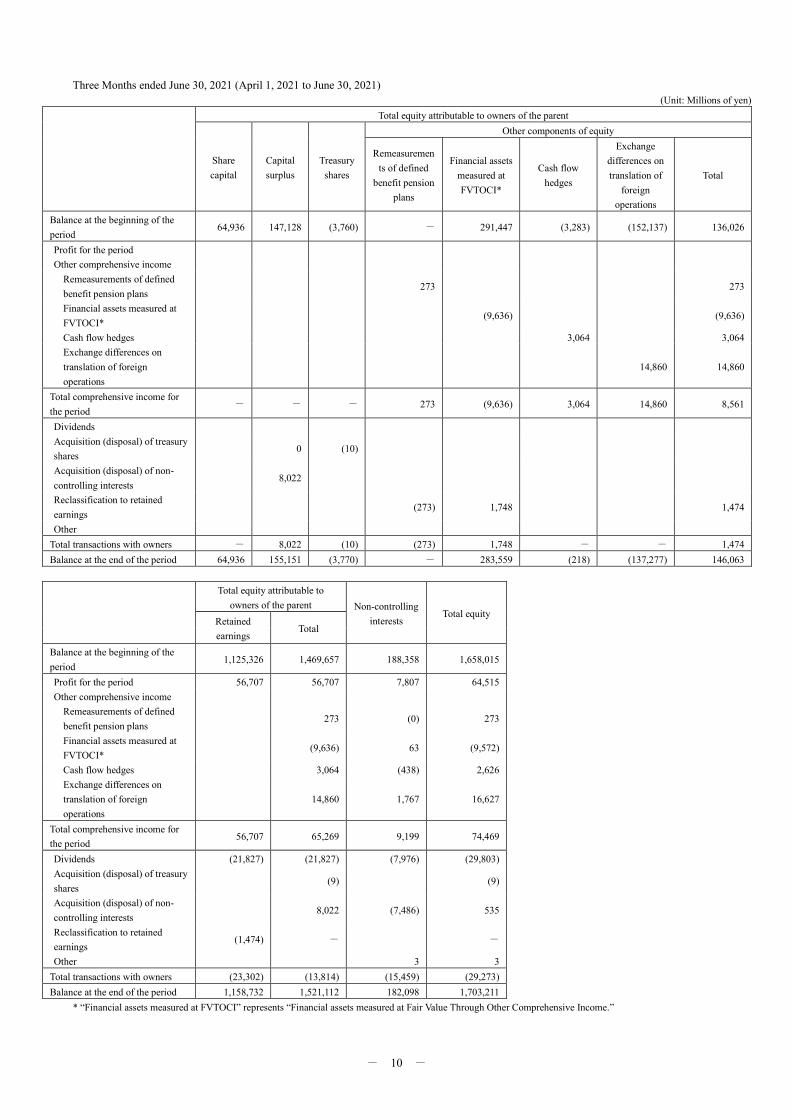
Three Months ended June 30, 2021 (April 1, 2021 to June 30, 2021)
(Unit: Millions of yen)
Total equity attributable to owners of the parent
Share
capital
Capital
surplus
Treasury
shares
Other components of equity
Remeasuremen
ts of defined
benefit pension
plans
Financial assets
measured at
FVTOCI*
Cash flow
hedges
Exchange
differences on
translation of
foreign
operations
Total
Balance at the beginning of the
period 64,936 147,128 (3,760) - 291,447 (3,283) (152,137) 136,026
Profit for the period
Other comprehensive income
Remeasurements of defined
benefit pension plans 273 273
Financial assets measured at
FVTOCI* (9,636) (9,636)
Cash flow hedges 3,064 3,064
Exchange differences on
translation of foreign
operations
14,860 14,860
Total comprehensive income for
the period - - - 273 (9,636) 3,064 14,860 8,561
Dividends
Acquisition (disposal) of treasury
shares 0 (10)
Acquisition (disposal) of non-
controlling interests 8,022
Reclassification to retained
earnings (273) 1,748 1,474
Other
Total transactions with owners - 8,022 (10) (273) 1,748 - - 1,474
Balance at the end of the period 64,936 155,151 (3,770) - 283,559 (218) (137,277) 146,063
Total equity attributable to
owners of the parent Non-controlling
interests Total equity
Retained
earnings Total
Balance at the beginning of the
period 1,125,326 1,469,657 188,358 1,658,015
Profit for the period 56,707 56,707 7,807 64,515
Other comprehensive income
Remeasurements of defined
benefit pension plans 273 (0) 273
Financial assets measured at
FVTOCI* (9,636) 63 (9,572)
Cash flow hedges 3,064 (438) 2,626
Exchange differences on
translation of foreign
operations
14,860 1,767 16,627
Total comprehensive income for
the period 56,707 65,269 9,199 74,469
Dividends (21,827) (21,827) (7,976) (29,803)
Acquisition (disposal) of treasury
shares (9) (9)
Acquisition (disposal) of non-
controlling interests 8,022 (7,486) 535
Reclassification to retained
earnings (1,474) - -
Other 3 3
Total transactions with owners (23,302) (13,814) (15,459) (29,273)
Balance at the end of the period 1,158,732 1,521,112 182,098 1,703,211
* “Financial assets measured at FVTOCI” represents “Financial assets measured at Fair Value Through Other Comprehensive Income.”
- 11 -
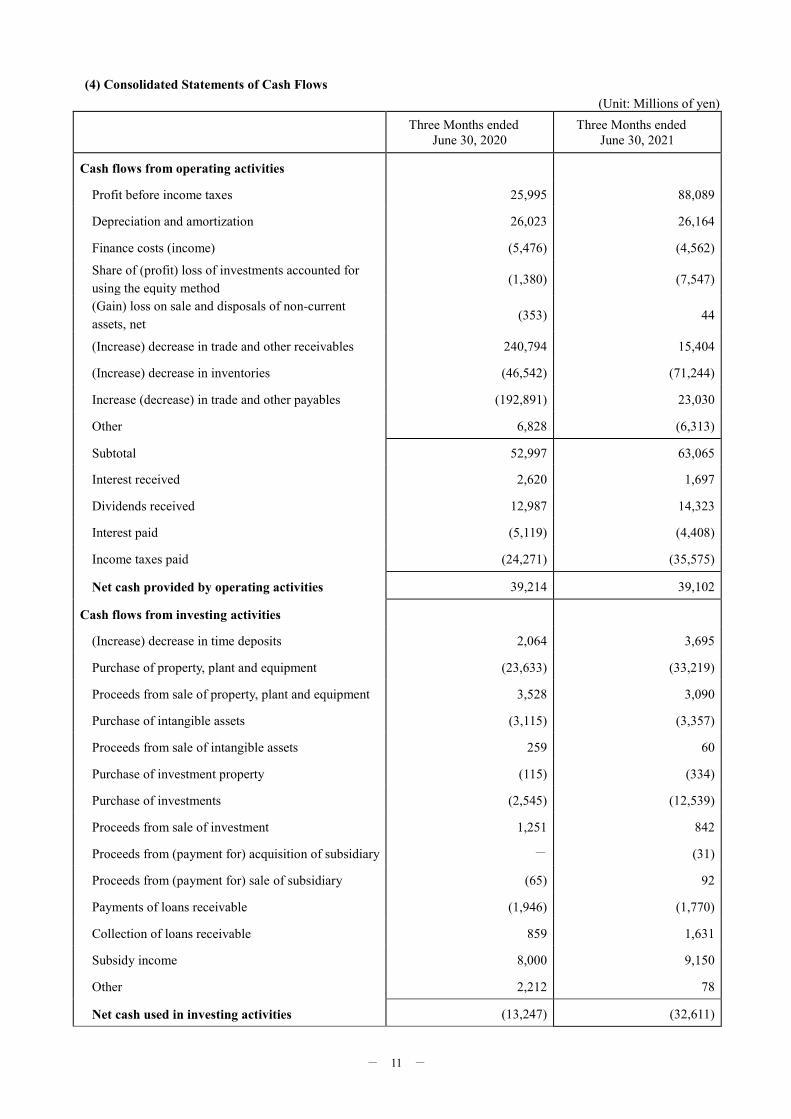
(4) Consolidated Statements of Cash Flows
(Unit: Millions of yen)
Three Months ended
June 30, 2020
Three Months ended
June 30, 2021
Cash flows from operating activities
Profit before income taxes 25,995 88,089
Depreciation and amortization 26,023 26,164
Finance costs (income) (5,476) (4,562)
Share of (profit) loss of investments accounted for
using the equity method (1,380) (7,547)
(Gain) loss on sale and disposals of non-current
assets, net (353) 44
(Increase) decrease in trade and other receivables 240,794 15,404
(Increase) decrease in inventories (46,542) (71,244)
Increase (decrease) in trade and other payables (192,891) 23,030
Other 6,828 (6,313)
Subtotal 52,997 63,065
Interest received 2,620 1,697
Dividends received 12,987 14,323
Interest paid (5,119) (4,408)
Income taxes paid (24,271) (35,575)
Net cash provided by operating activities 39,214 39,102
Cash flows from investing activities
(Increase) decrease in time deposits 2,064 3,695
Purchase of property, plant and equipment (23,633) (33,219)
Proceeds from sale of property, plant and equipment 3,528 3,090
Purchase of intangible assets (3,115) (3,357)
Proceeds from sale of intangible assets 259 60
Purchase of investment property (115) (334)
Purchase of investments (2,545) (12,539)
Proceeds from sale of investment 1,251 842
Proceeds from (payment for) acquisition of subsidiary - (31)
Proceeds from (payment for) sale of subsidiary (65) 92
Payments of loans receivable (1,946) (1,770)
Collection of loans receivable 859 1,631
Subsidy income 8,000 9,150
Other 2,212 78
Net cash used in investing activities (13,247) (32,611)
- 12 -
(Unit: Millions of yen)
Three Months ended
June 30, 2020
Three Months ended
June 30, 2021
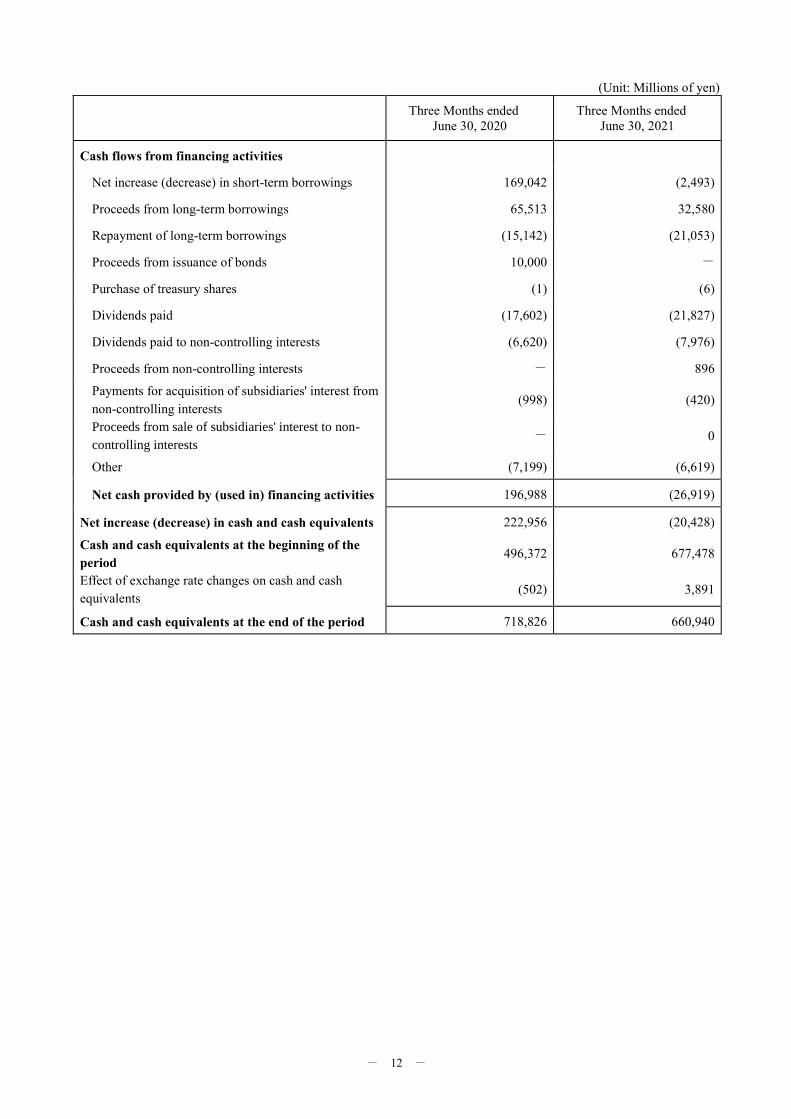
Cash flows from financing activities
Net increase (decrease) in short-term borrowings 169,042 (2,493)
Proceeds from long-term borrowings 65,513 32,580
Repayment of long-term borrowings (15,142) (21,053)
Proceeds from issuance of bonds 10,000 -
Purchase of treasury shares (1) (6)
Dividends paid (17,602) (21,827)
Dividends paid to non-controlling interests (6,620) (7,976)
Proceeds from non-controlling interests - 896
Payments for acquisition of subsidiaries' interest from
non-controlling interests (998) (420)
Proceeds from sale of subsidiaries' interest to non-
controlling interests - 0
Other (7,199) (6,619)
Net cash provided by (used in) financing activities 196,988 (26,919)
Net increase (decrease) in cash and cash equivalents 222,956 (20,428)
Cash and cash equivalents at the beginning of the
period 496,372 677,478
Effect of exchange rate changes on cash and cash
equivalents (502) 3,891
Cash and cash equivalents at the end of the period 718,826 660,940
- 13 -
(5) Notes on the Consolidated Financial Statements
(Notes on the Going-concern Assumption)
Not applicable
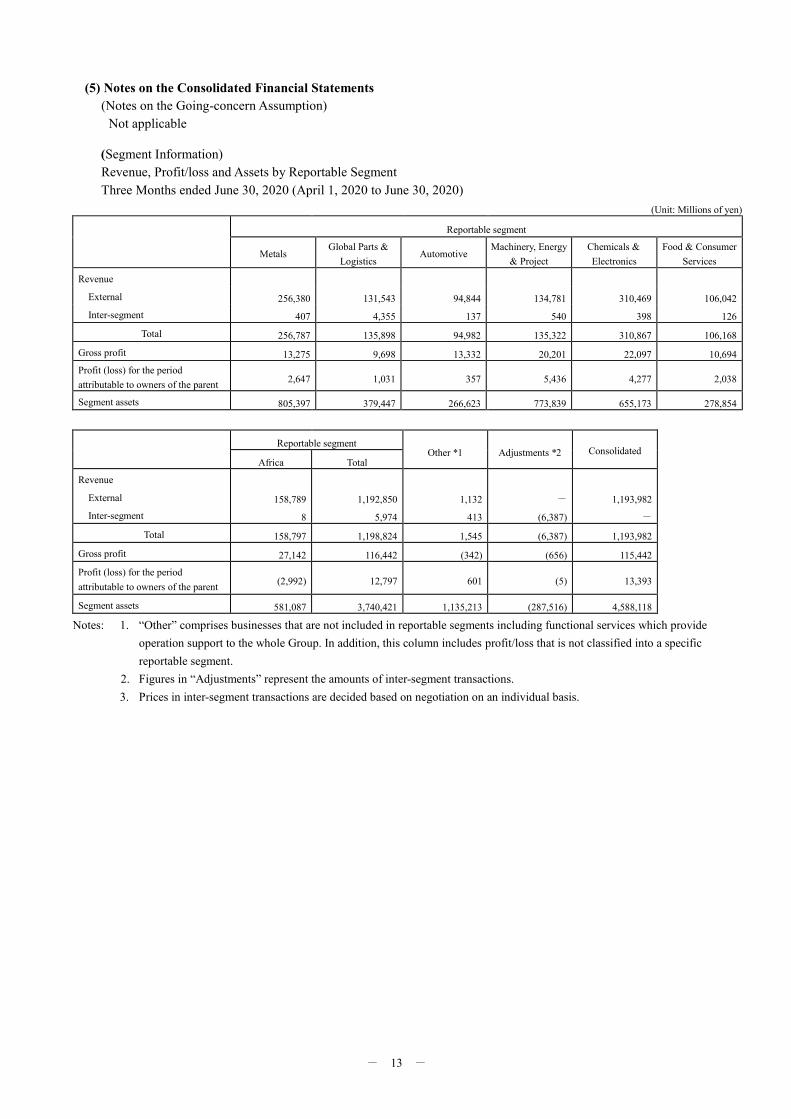
(Segment Information)
Revenue, Profit/loss and Assets by Reportable Segment
Three Months ended June 30, 2020 (April 1, 2020 to June 30, 2020)
(Unit: Millions of yen)
Reportable segment
Metals Global Parts &
Logistics Automotive
Machinery, Energy
& Project
Chemicals &
Electronics
Food & Consumer
Services
Revenue
External 256,380 131,543 94,844 134,781 310,469 106,042
Inter-segment 407 4,355 137 540 398 126
Total 256,787 135,898 94,982 135,322 310,867 106,168
Gross profit 13,275 9,698 13,332 20,201 22,097 10,694
Profit (loss) for the period
attributable to owners of the parent 2,647 1,031 357 5,436 4,277 2,038
Segment assets 805,397 379,447 266,623 773,839 655,173 278,854
Reportable segment Other *1 Adjustments *2 Consolidated
Africa Total
Revenue
External 158,789 1,192,850 1,132 - 1,193,982
Inter-segment 8 5,974 413 (6,387) -
Total 158,797 1,198,824 1,545 (6,387) 1,193,982
Gross profit 27,142 116,442 (342) (656) 115,442
Profit (loss) for the period
attributable to owners of the parent (2,992) 12,797 601 (5) 13,393
Segment assets 581,087 3,740,421 1,135,213 (287,516) 4,588,118
Notes: 1. “Other” comprises businesses that are not included in reportable segments including functional services which provide
operation support to the whole Group. In addition, this column includes profit/loss that is not classified into a specific
reportable segment.
2. Figures in “Adjustments” represent the amounts of inter-segment transactions.
3. Prices in inter-segment transactions are decided based on negotiation on an individual basis.
- 14 -
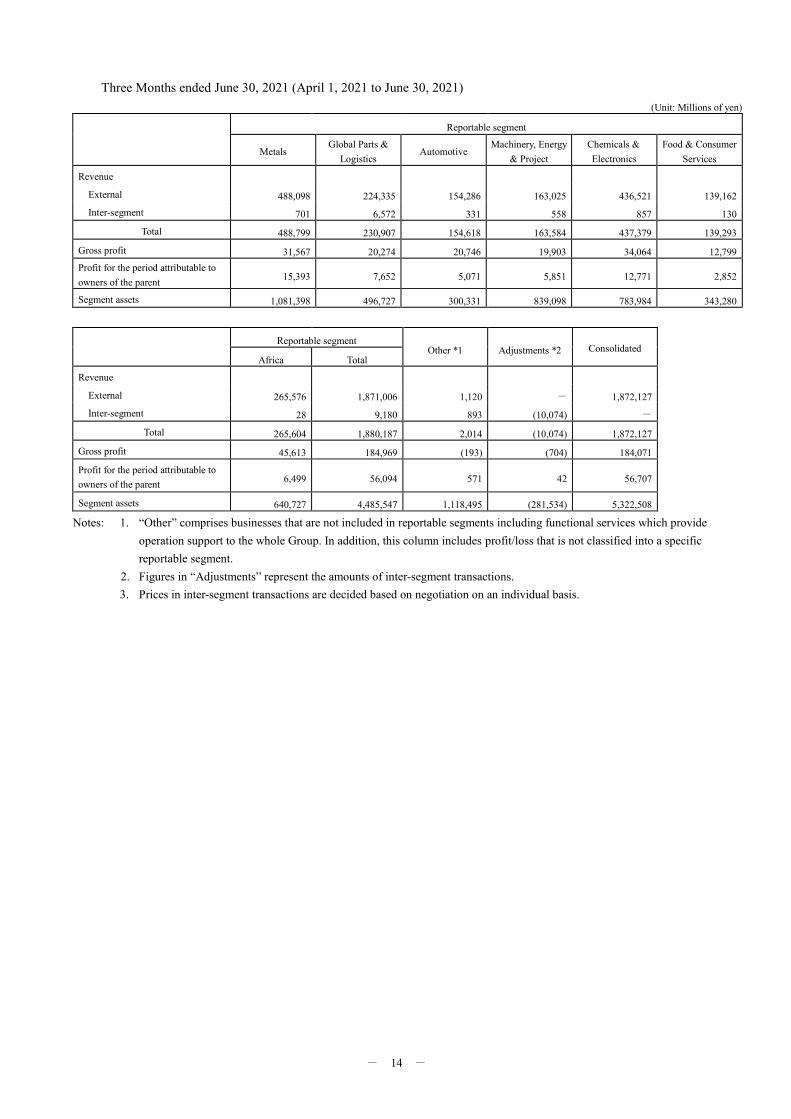
Three Months ended June 30, 2021 (April 1, 2021 to June 30, 2021)
(Unit: Millions of yen)
Reportable segment
Metals Global Parts &
Logistics Automotive
Machinery, Energy
& Project
Chemicals &
Electronics
Food & Consumer
Services
Revenue
External 488,098 224,335 154,286 163,025 436,521 139,162
Inter-segment 701 6,572 331 558 857 130
Total 488,799 230,907 154,618 163,584 437,379 139,293
Gross profit 31,567 20,274 20,746 19,903 34,064 12,799
Profit for the period attributable to
owners of the parent 15,393 7,652 5,071 5,851 12,771 2,852
Segment assets 1,081,398 496,727 300,331 839,098 783,984 343,280
Reportable segment Other *1 Adjustments *2 Consolidated
Africa Total
Revenue
External 265,576 1,871,006 1,120 - 1,872,127
Inter-segment 28 9,180 893 (10,074) -
Total 265,604 1,880,187 2,014 (10,074) 1,872,127
Gross profit 45,613 184,969 (193) (704) 184,071
Profit for the period attributable to
owners of the parent 6,499 56,094 571 42 56,707
Segment assets 640,727 4,485,547 1,118,495 (281,534) 5,322,508
Notes: 1. “Other” comprises businesses that are not included in reportable segments including functional services which provide
operation support to the whole Group. In addition, this column includes profit/loss that is not classified into a specific
reportable segment.
2. Figures in “Adjustments” represent the amounts of inter-segment transactions.
3. Prices in inter-segment transactions are decided based on negotiation on an individual basis.
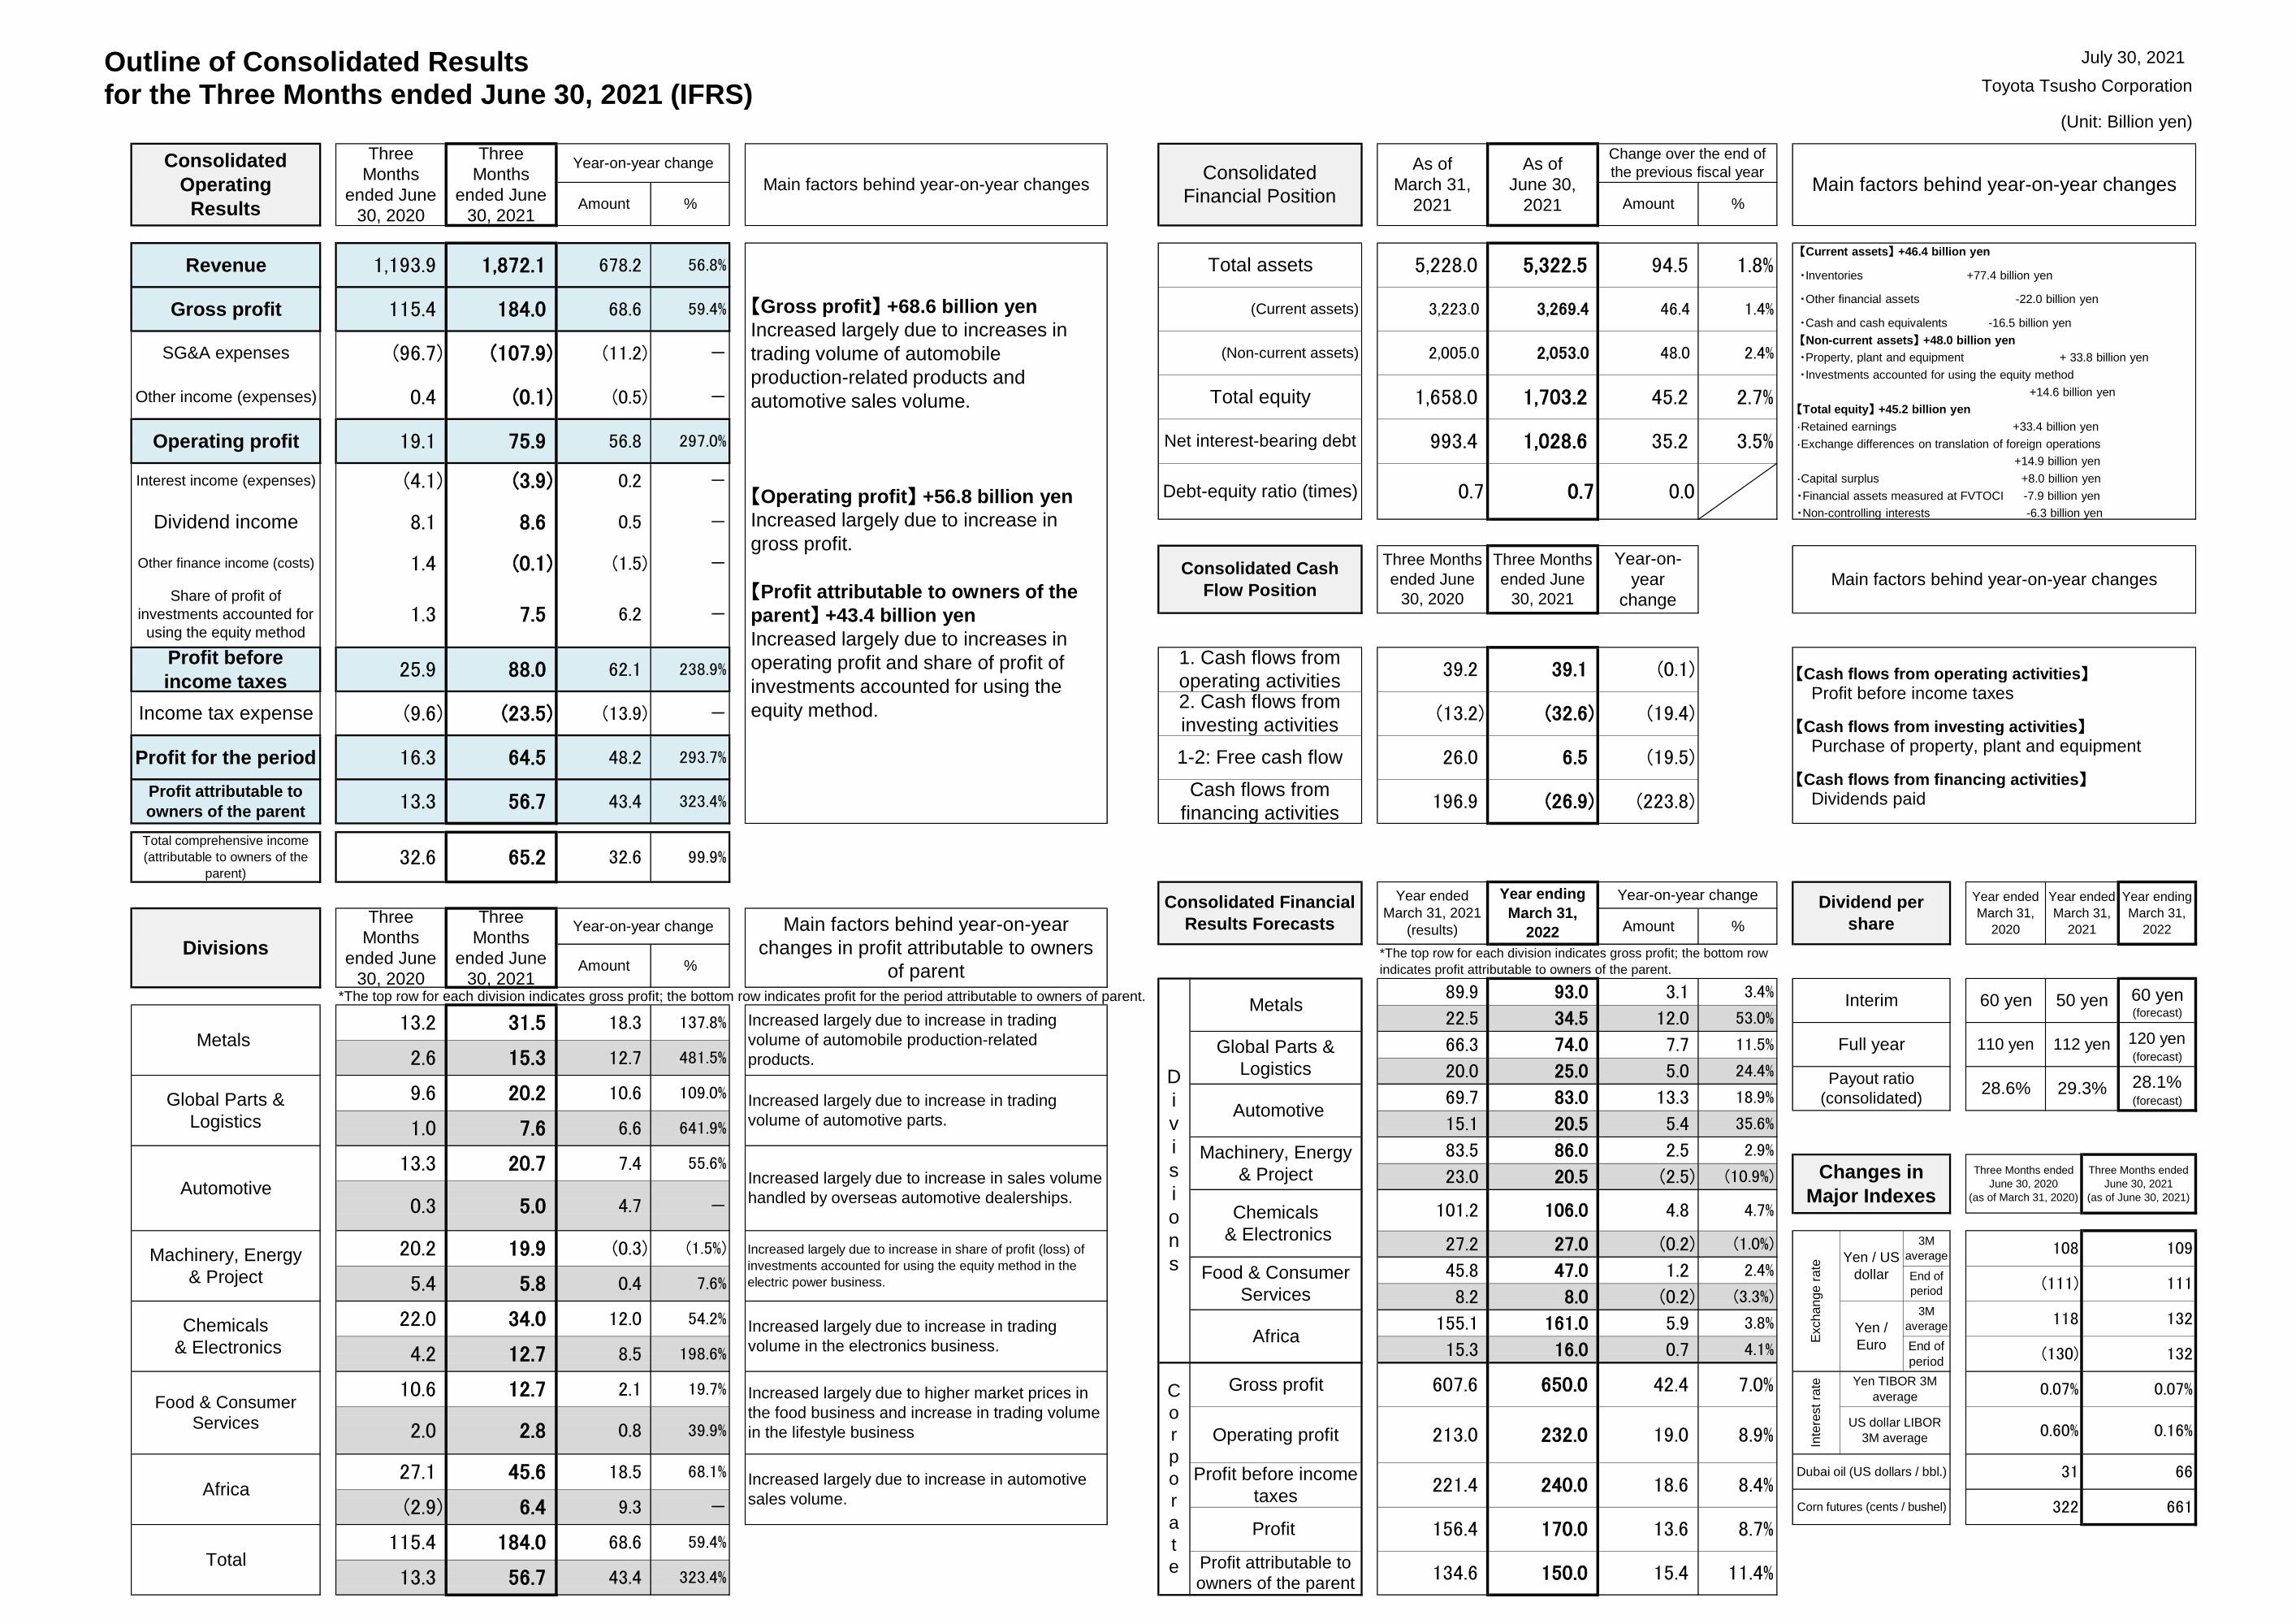
Outline of Consolidated Resultsfor the Three Months ended June 30, 2021 (IFRS) Toyota Tsusho Corporation
(Unit: Billion yen)
×
112 yen
Year ending
March 31,
2022
60 yen 50 yen
Payout ratio
(consolidated)28.6%
End of
period15.3
93.0 3.4%
7.7
12.0
(0.2)
(111) 111
(130) 132
108 109
16.0 0.7Yen /
Euro
3M
average
Dividend per
share
July 30, 2021
106.0
20.5
120 yen(forecast)
28.1%(forecast)
11.5%
24.4%
53.0%
35.6%
18.9%
2.5
5.4
13.329.3%
Three Months ended
June 30, 2020
(as of March 31, 2020)
Three Months ended
June 30, 2021
(as of June 30, 2021)
4.8
(2.5)
2.9%
4.7%
Changes in
Major Indexes(10.9%)
Total115.4 184.0 68.6 59.4%
13.3 56.7 43.4 323.4% 11.4%134.6
156.4
221.4
213.0
607.6
15.4
13.6
18.6
19.0
42.4
Profit attributable to
owners of the parent
Gross profit
150.0
170.0
240.0
232.0
650.0
Profit before income
taxes
Operating profit
8.7%
C
o
r
p
o
r
a
t
e
7.0%
322 661
Profit
Corn futures (cents / bushel)
118161.0 132
Dubai oil (US dollars / bbl.) 31 66
Yen TIBOR 3M
average0.07% 0.07%
8.4%
Inte
rest
rate
8.9%US dollar LIBOR
3M average 0.60% 0.16%
155.1
8.2
5.9
(0.2)
4.1%198.6%
54.2%
Increased largely due to increase in share of profit (loss) of
investments accounted for using the equity method in the
electric power business.
Africa
2.4%
8.5
Africa27.1 45.6 18.5 68.1% Increased largely due to increase in automotive
sales volume.(2.9) 6.4 9.3 -
Yen / US
dollar
3M
average
End of
period8.0
47.0
27.027.2
45.8 1.2
(1.0%)
Exchange r
ate
3.8%
(3.3%)
101.2
23.0
Chemicals
& Electronics
83.5
0.3 5.0
Increased largely due to increase in sales volume
handled by overseas automotive dealerships.
Machinery, Energy
& Project
20.2 19.9 (0.3)
5.4 5.8
7.6 6.6 641.9%
Food & Consumer
Services
(1.5%)
0.4 7.6%
83.0
25.0
Global Parts &
Logistics
Metals 13.2 31.5
Divisions
Food & Consumer
Services
10.6 12.7 2.1 19.7% Increased largely due to higher market prices in
the food business and increase in trading volume
in the lifestyle business
Chemicals
& Electronics
22.0 34.0 12.0
2.0 2.8 0.8 39.9%
Increased largely due to increase in trading
volume in the electronics business.4.2 12.7
Profit attributable to
owners of the parent
66.3
22.5
15.1
69.7
20.0
Machinery, Energy
& Project
9.6 20.2
Total comprehensive income
(attributable to owners of the
parent)32.6 65.2 32.6 99.9%
Metals
Global Parts &
Logistics 1.0 Automotive
10.6
-Automotive
13.3 20.7 7.4
Year ended
March 31,
2020
Year ended
March 31,
2021Amount
Year ended
March 31, 2021
(results)Year-on-year change Main factors behind year-on-year
changes in profit attributable to owners
of parent
Consolidated Financial
Results Forecasts
Year ending
March 31,
2022
Interim
%
Year-on-year change
*The top row for each division indicates gross profit; the bottom row
indicates profit attributable to owners of the parent.
3.1
Amount %
D
i
v
i
s
i
o
n
s
12.7 481.5%
109.0% Increased largely due to increase in trading
volume of automotive parts.
86.0
4.7
55.6%
20.5
60 yen(forecast)
18.3 137.8%
13.3 56.7 43.4 323.4%Cash flows from
financing activities196.9 (26.9) (223.8)
*The top row for each division indicates gross profit; the bottom row indicates profit for the period attributable to owners of parent.
Increased largely due to increase in trading
volume of automobile production-related
products.
89.9
74.0
34.5
Full year 110 yen
5.0
Three
Months
ended June
30, 2020
Three
Months
ended June
30, 2021
2.6 15.3
(13.2) (32.6) (19.4)Income tax expense (9.6) (23.5) (13.9) -2. Cash flows from
investing activities
Profit before
income taxes25.9 88.0 62.1 238.9%
1. Cash flows from
operating activities
Profit for the period 16.3 64.5 48.2 293.7% 1-2: Free cash flow 26.0 6.5 (19.5)
Three Months
ended June
30, 2021
Year-on-
year
change
39.2 39.1 (0.1)
Three Months
ended June
30, 2020
Main factors behind year-on-year changesShare of profit of
investments accounted for
using the equity method1.3 7.5 6.2 -
Other finance income (costs) 1.4 (0.1) (1.5) - Consolidated Cash
Flow Position
Net interest-bearing debt 993.4 1,028.6
Interest income (expenses) (4.1) (3.9) 0.2 -Debt-equity ratio (times) 0.7 0.7
Dividend income 8.1 8.6 0.5 -
Operating profit 19.1 75.9 56.8 297.0%
0.4 (0.1) (0.5) - Total equity 1,658.0 1,703.2 45.2
SG&A expenses (96.7) (107.9) (11.2) - (Non-current assets) 2,005.0 2,053.0 48.0
Other income (expenses)
Amount % Amount %
Consolidated
Operating
Results
Three
Months
ended June
30, 2020
Three
Months
ended June
30, 2021
Year-on-year change
Main factors behind year-on-year changesConsolidated
Financial Position
Gross profit 115.4 184.0 68.6 59.4% (Current assets)
Revenue 1,193.9 1,872.1 678.2 56.8% Total assets
【Cash flows from investing activities】
【Cash flows from financing activities】
Purchase of property, plant and equipment
Profit before income taxes
Dividends paid
As of
March 31,
2021
As of
June 30,
2021
Change over the end of
the previous fiscal yearMain factors behind year-on-year changes
3.5%
5,228.0 5,322.5 94.5 1.8%
3,223.0 3,269.4 46.4 1.4%
2.4%
2.7%
0.0
35.2
【Cash flows from operating activities】
【Gross profit】 +68.6 billion yen
Increased largely due to increases in
trading volume of automobile
production-related products and
automotive sales volume.
【Operating profit】 +56.8 billion yen
Increased largely due to increase in
gross profit.
【Profit attributable to owners of the
parent】 +43.4 billion yen
Increased largely due to increases in
operating profit and share of profit of
investments accounted for using the
equity method.
【Current assets】 +46.4 billion yen
・Inventories +77.4 billion yen
・Other financial assets -22.0 billion yen
・Cash and cash equivalents -16.5 billion yen
【Non-current assets】 +48.0 billion yen
・Property, plant and equipment + 33.8 billion yen
・Investments accounted for using the equity method
+14.6 billion yen
【Total equity】 +45.2 billion yen
・Retained earnings +33.4 billion yen
・Exchange differences on translation of foreign operations
+14.9 billion yen
・Capital surplus +8.0 billion yen
・Financial assets measured at FVTOCI -7.9 billion yen
・Non-controlling interests -6.3 billion yen