Embed Size (px)
Citation preview
Analytica Chimica Acta 426 (2001) 289–301
Toxicity of pesticides in wastewater: a comparativeassessment of rapid bioassays
Amadeo R. Fernández-Albaa,∗, Loli Hernando Guila,Gema Dıaz Lópezb, Yusuf Chistic
a Department of Analytical Chemistry, University of Almerıa, E-04071 Almerıa, Spainb Ito Carlos III, Centro Nacional de Sanidad Ambiental, Ministerio de Sanidad y Consumo, E-28220 Majadahonda, Madrid, Spain
c Department of Chemical Engineering, University of Almerıa, E-04071 Almerıa, Spain
Received 13 December 1999; received in revised form 15 March 2000; accepted 15 March 2000
Abstract
Acute toxicity of pesticides in water was assessed singly and in mixtures using various responses of the luminescentbacteriumVibrio fischeri, the aquatic invertebrateDaphnia magna, and the MitoScanTM assay. The latter utilized fragmentedmitochondria to enzymatically convert oxidizedb-nicotinamide adenine dinucleotide (NAD+) to its reduced form, NADH.The rate of the conversion being sensitive to the type and concentration of toxicants. The pesticides tested were carbofuran,cyromazine, fenamiphos, formetanate, and propamocarb. The aqueous solubility of all compounds exceeded 320 mg l−1. Allthe toxicity bioassays were characterized in terms of relative sensitivity and complementarity. Synergistic and antagonistictoxicity effects were observed with pesticide cocktails relative to pure compound toxicities. TheD. magnaassay was themost sensitive and best able to detect toxic interactions of mixtures. Cyromazine was the least toxic of the pesticides tested.© 2001 Elsevier Science B.V. All rights reserved.
Keywords:Carbofuran; Cyromazine;Daphnia magna; Fenamiphos; Formetanate; MitoScanTM; Pesticides; Propamocarb; Toxicity;Vibriofischeri
1. Introduction
Many tones of pesticides are used annually in agri-culture and horticulture. Consequently, wastewaterfrom greenhouses and runoff from agricultural landare nearly always contaminated with pesticides. Be-cause of their toxicity, pesticides affect the ecologyof the receiving bodies of water and contaminatedrinking water supplies. Some pesticides bioaccu-mulate, affecting fish, birds, and other animals, andappearing in human food sources. Depending on thelocal cultivation practices, a waterbody may receive a
∗ Corresponding author.
single pesticide or a varying cocktail of compounds.Toxicity of pesticides contaminated effluent dependson the amounts and types of the individual pesti-cides present; however, even for pure compounds,concentration–toxicity relationships are generallynonlinear. Cocktails of compounds pose bigger prob-lems because toxicity of a mixture is not easily linkedto individual toxicities of components in the mix-ture. Thus, for predicting the impact of a wastewaterstream on the ecology of a receiving body such asa biological wastewater treatment facility, or a lake,the toxicity of the contaminated water needs to bedetermined with single and multiple contaminants.Few such data exist.
0003-2670/01/$ – see front matter © 2001 Elsevier Science B.V. All rights reserved.PII: S0003-2670(00)00874-6
290 A.R. Fernandez-Alba et al. / Analytica Chimica Acta 426 (2001) 289–301
An additional complicating factor is the absenceof a precise definition of ‘toxicity’. Toxicity is a bi-ological response. A variety of toxicity measurementsystems exist, including those based on bacteria [1,2]and algae, animal cells, small mammals, fish fly, andzooplankton. Some of these systems, e.g., animalsand fish larvae, are difficult to handle and they donot provide a rapid response. Also, use of some ofthese systems may raise ethical objections. Othersystems, such as mammalian cells are expensive andnot always consistent. In addition, the response ofa single toxicity assay is an insufficient measure ofthe adverse biological impact of a compound in agenerally diverse receiving ecosystem. Different toxi-cants act differently and not all life-forms are equallysusceptible. Consequently, several assays need to beused simultaneously to assess toxicity adequately.Careful selection of assays is essential with regardto complimentarity. This work provides such multi-faceted toxicity data and a comparative evaluationof some toxicity bioassays. An attempt is madeto correlate toxicities of mixtures to those of theirconstituents.
Acute toxicity was evaluated for water samplescontaminated with various amounts of the follow-ing pesticides: carbofuran, cyromazine, fenamiphos,formetanate, and propamocarb. All these compoundsare significant specially in greenhouse-based pro-duction of vegetables and fruits in southern Europe,particularly Spain. Pesticides were tested singly andas cocktails of two or more. Use of pesticide combi-nations ensured that any synergistic toxicity effectswere identified. Three rapid and relatively inexpen-sive toxicity bioassays were used: (i) the luminescentbacteriumVibrio fischerias being relevant to assess-ing a compound’s impact on the microbial ecologyof biological wastewater treatment facilities; (ii) theaquatic invertebrateDaphnia magna(a microscopicshrimp), a preferred test system for aquatic toxicology[3]; and (iii) the MitoScanTM mitochondria-derivedassay [4,5] for comparison. The toxicity was char-acterized as EC50, i.e. the toxicant’s concentrationcausing a 50% change in the response parameter,calculated from the relevant dose–response curves.Use of multiple assays allowed a comprehensive andcomparative assessment of the assay methods andprovided data that could be potentially combinedinto a single weighted toxicity index which would
more realistically correlate the expected impact of thepollutants on a receiving ecosystem.
2. Materials and methods
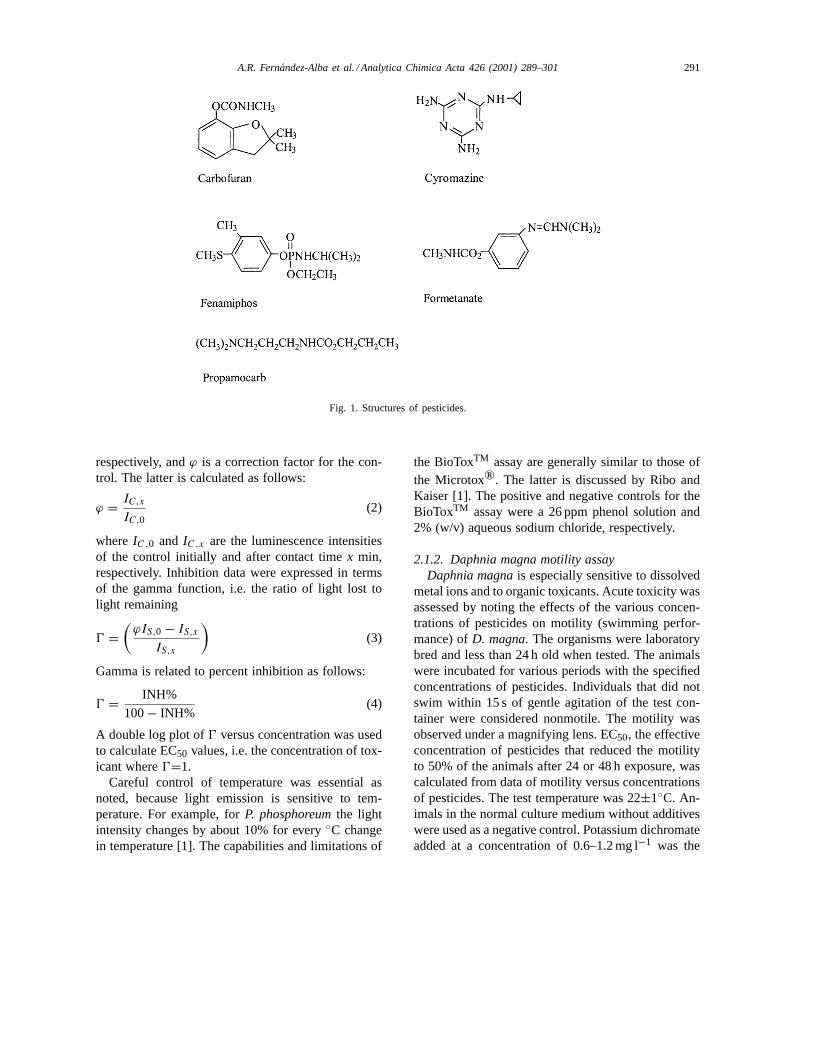
Following pesticides were tested singly and inmixtures: carbofuran, cyromazine, fenamiphos,formetanate, and propamocarb (Fig. 1). The pesti-cides, purchased as pure compounds and not com-mercial formulations, were made into standard stocksolutions by dissolving in ultrapure water that con-tained 5% (v/v) of methanol. The stock solutionswere diluted with ultrapure water as needed. Pesticidemixtures were produced by combining various stocksolutions of pure components. The water solubility ofpesticides always exceeded 320 mg l−1 (25◦C). Theamounts of pesticides in stock solutions and mixtureswere confirmed by LC-MS. When using pesticidemixtures, the concentration of the toxicant was de-fined as the sum of concentrations of all the pesticidesin the test vial or solution. Three toxicity assays wereused as explained.
2.1. Toxicity analyses
2.1.1. Vibrio fischeri bioluminescence assayA commercial assay marketed as BioToxTM
(Bio-Orbit Oy, Turku, Finland) was used. The assay,based on the luminescent bacteriumV. fischeriNRRLB-1117, is similar in principle to the better knownMicrotox® test that uses the marine bacteriumPhoto-bacterium phosphoreum[1,2,6–8]. Bioluminescenceof V. fischeriwas inhibited by toxicants. To monitorthe inhibition, different dilutions of the test samplewere mixed with the bacterial suspension made in 2%(w/v) aqueous sodium chloride. The decline in lightemission was measured after contact periods of 5 and15 min in separate experiments. The test was carriedout at 15±1◦C.
The inhibition effect of the dilutions was comparedwith a toxicant-free control to obtain percent inhibition(INH%); thus
INH% =(
1 − IS,x
ϕIS,0
)× 100 (1)
where IS,0 and IS,x are the luminescence intensitiesof the sample initially and after contact timex min,
A.R. Fernandez-Alba et al. / Analytica Chimica Acta 426 (2001) 289–301 291
Fig. 1. Structures of pesticides.
respectively, andϕ is a correction factor for the con-trol. The latter is calculated as follows:
ϕ = IC,x
IC,0(2)
whereIC,0 and IC,x are the luminescence intensitiesof the control initially and after contact timex min,respectively. Inhibition data were expressed in termsof the gamma function, i.e. the ratio of light lost tolight remaining
0 =(
ϕIS,0 − IS,x
IS,x
)(3)
Gamma is related to percent inhibition as follows:
0 = INH%
100− INH%(4)
A double log plot of0 versus concentration was usedto calculate EC50 values, i.e. the concentration of tox-icant where0=1.
Careful control of temperature was essential asnoted, because light emission is sensitive to tem-perature. For example, forP. phosphoreumthe lightintensity changes by about 10% for every◦C changein temperature [1]. The capabilities and limitations of
the BioToxTM assay are generally similar to those ofthe Microtox®. The latter is discussed by Ribo andKaiser [1]. The positive and negative controls for theBioToxTM assay were a 26 ppm phenol solution and2% (w/v) aqueous sodium chloride, respectively.
2.1.2. Daphnia magna motility assayDaphnia magnais especially sensitive to dissolved
metal ions and to organic toxicants. Acute toxicity wasassessed by noting the effects of the various concen-trations of pesticides on motility (swimming perfor-mance) ofD. magna. The organisms were laboratorybred and less than 24 h old when tested. The animalswere incubated for various periods with the specifiedconcentrations of pesticides. Individuals that did notswim within 15 s of gentle agitation of the test con-tainer were considered nonmotile. The motility wasobserved under a magnifying lens. EC50, the effectiveconcentration of pesticides that reduced the motilityto 50% of the animals after 24 or 48 h exposure, wascalculated from data of motility versus concentrationsof pesticides. The test temperature was 22±1◦C. An-imals in the normal culture medium without additiveswere used as a negative control. Potassium dichromateadded at a concentration of 0.6–1.2 mg l−1 was the

292 A.R. Fernandez-Alba et al. / Analytica Chimica Acta 426 (2001) 289–301
positive control and it killed all the animals. In somecases, the toxicity data were expressed as percent mor-tality defined as 100 (percent of motile animals).
2.1.3. MitoScanTM mitochondrial assayMitoScanTM toxicity assay utilizes fragmented
mitochondria or submitochondrial particles that arefunctionally equivalent to the whole organelle. Mito-chondria, occurring in all eukaryotic cells, are essen-tial to survival as they are the cell’s principal energygenerators. Mitochondrial energy generation fromglucose and other compounds depends on concertedaction of several dozen mitochondrial enzymes. Anytoxicant that interferes with the action of one or moreof these enzymes potentially disrupts the generationcascade and, hence, has a toxic effect. Because ofthe large array of enzyme needed for mitochondrialfunction, the likelihood that a toxicant will affectone or more is high and, consequently, mitochondrialbiochemistry is responsive to a variety of toxicants.Mitochondrial enzymes serve a vital function. As a re-sult, they have been conserved across species, largelyunaltered by the evolutionary process. Thus, a com-pound that is toxic in a mitochondrial assay is likelyto be broadly toxic to all kinds of eukaryotes, includ-ing higher animals. Compared to assays that measurea response of prokaryotic cells (e.g., MicrotoxTM),mitochondrial toxicity assays have better correlatedwith a substance’s toxicity toward fish [4,5,9,10].
The test as used here monitors the appearance ofNADH via reduction of NAD+. The rate of reactionand therefore the appearance of NADH are affectedrelative to controls when an interfering toxicant ispresent. The appearance of NADH is monitored spec-trophotometrically (340 nm) as a function of time.Reduction of NAD+ requires a source of energy andelectrons. These needs are met respectively by pro-viding adenosine triphosphate (ATP) and succinatein the reaction mixture. In addition, antimycin A isadded to prevent enzymatic oxidation of the gener-ated b-nicotinamide adenine dinucleotide (NADH)back to the oxidized form of NADH (NAD+ )through another existing pathway in mitochondrialfragments. Antimycin A also prevents electron si-phoning to oxygen. In the MitoScanTM assay, theEC50 value corresponds to a concentration of tox-icant that causes a 50% inhibition of the enzymeactivity.
For each test vial containing a given dilution ofthe toxicant, the appearance of NADH was monitoredwith time. A least-square fit of the linear portion ofthe data provided the slope, i.e. the rate of generationof NADH. The rates obtained in the various vials wereplotted against the concentration of the pesticide toobtain a dose–response curve. The positive and nega-tive controls were 15 ppm aqueous sodium azide andultrapure water, respectively.
3. Results and discussion
A proper assessment of a compound’s toxicity mustnecessarily use a battery of assays especially if the in-dividual tests are based on simplified biochemistriesor a narrow range of possible interactions of the tox-icities with the test system. The latter would be thecase with tests using purified enzymes and subcellularentities. Even whole organisms assays based on a sin-gle prokaryote, e.g. theV. fischeriBioToxTM and theP. phosphoreumbased Microtox®, are not sufficientlyrepresentative of possible toxicological impact of acompound at various levels of the ecosystem. Somesimplified toxicity determinations may not satisfac-torily detect synergistic and antagonistic phenomena.To cover a broad range of life biochemistries, whileretaining simplicity and speed of analysis, this workused two whole organism assays and a multienzymeassay based on mitochondria, a subcellular organelle.The organisms used included the marine bacteriumV. fischeri, a prokaryote, andD. magna, a multicellu-lar eukaryote.D. magnawas biochemically the mostcomplex test system used and it was also the most sen-sitive. The pesticides used (Fig. 1) covered differentclasses of compounds with different modes of pesti-cidal action, thus the various toxicity assays could beassessed for ability to respond to a range of possibleinteractions of the toxicant with the assay system.
Fig. 2 shows representative curves of changes inBioToxTM light emission (expressed as INH%) withconcentration of toxicant, a pure pesticide and variousmixtures (binary, ternary, and quaternary). Light emis-sion or bioluminescence declined and, correspond-ingly, percent inhibition increased with increasing con-centration of toxicant (Fig. 2). The pattern of changewas similar for the other compounds and mixturestested. The EC50 values were calculated from double

A.R. Fernandez-Alba et al. / Analytica Chimica Acta 426 (2001) 289–301 293
Fig. 2. Changes inVibrio fischeri light emission (INH%) as a function of toxicant concentration for various constant incubation times:(a) pure propamocarb (5 min incubation); (b) formetanate and propamocarb 1:3 (5 min incubation); (c) formetanate, propamocarb, andcyromazine 1:2:1 (15 min incubation); and (d) formetanate, propamocarb, fenamiphos, and cyromazine 1:1:1:1 (5 min incubation).
log plots of the0 function (Eq. (3)) versus concen-tration and these plots were linear as shown in Fig. 3for some representative cases. The only exception wascyromazine. No toxic effect was observed for thatcompound with the BioToxTM test. Thus, as shown inFig. 4, there was no loss of light emission with time.In fact, the light emission was measurably enhancedduring contact with cyromazine, possibly because itwas being consumed as a nutrient by the cells. Be-cause the highest cyromazine concentration in the in-cubation vial was 50 ppm, it may be concluded thatthe EC50 value for cyromazine exceeds 50 ppm.
Pure compound toxicities determined with theBioToxTM test are noted in Table 1, as EC20, EC50,and EC80 values for 5 and 15 min incubation. Gener-ally the ECxx values for 5 min incubation are greaterthan for 15 min incubation (Table 1). This is sensible,as a larger amount of a toxicant is needed to producethe same response over a shorter incubation period.
The pattern of increasing toxicity with theBioToxTM was cyromazine, fenamiphos, carbofuran,
propamocarb, and formetanate. This pattern was con-sistent with that of the Daphnia assay (Table 2) wherethe order of increasing toxicity of compounds wascyromazine, formetanate, and carbofuran, using both24 and 48 h variants of the test. However, the 48 h testperiod always showed a substantially higher toxicityof a compound than the 24 h test. This is expected,as a chronic toxicity effect probably comes into playover longer durations. TheD. magnaassay was muchmore sensitive than the BioToxTM (Tables 1 and 2).For example, theD. magnaEC50 (24 h incubation) forcarbofuran was less than 0.1 ppm (Table 2) whereasthe corresponding BioToxTM value (5 min incubation)was about a 100-fold greater (Table 1). Similarly, aspreviously noted, cyromazine up to 50 ppm failed toshow a toxic response with the BioToxTM system, butthe same compound was clearly toxic toD. magnaat<25 ppm (24 h test) level (Table 2).
There is little published data on the BioToxTM testto allow a direct comparison with other work. For theD. magnaassay, the measurements reported here were

294 A.R. Fernandez-Alba et al. / Analytica Chimica Acta 426 (2001) 289–301
Fig. 3. Representative double log plots of0 values vs. concentration for the BioToxTM assay: (a) pure propamocarb (5 min incubation);(b) formetanate and propamocarb 1:3 (5 min incubation); (c) formetanate, propamocarb, and cyromazine 1:2:1 (15 min incubation); and (d)formetanate, propamocarb, fenamiphos, and cyromazine 1:1:1:1 (5 min incubation).
Fig. 4. BioToxTM light emission vs. cyromazine concentration (5 min incubation).

A.R. Fernandez-Alba et al. / Analytica Chimica Acta 426 (2001) 289–301 295
Table 1BioToxTM toxicity of pure pesticides
Pesticide EC20 (mg l−1) EC50 (mg l−1) EC50 (mg l−1)
Incubation time (min) Incubation time (min) Incubation time (min)
5 15 5 15 5 15
Carbofuran 2.4 2.8 9.8 9.6 41.5 39.7Cyromazine None None None None None NoneFenamiphos 6.1 3.6 15.8 11.2 41.7 38.9Formetanate 1.4 0.8 4.5 4.5 49.7 21.3Propamocarb 3.9 7.8 8.5 8.2 27.0 14.1
generally consistent with similar values in the litera-ture when available. For example, an EC50 (48 h test)value of 9.1 ppm has been previously reported for cy-romazine in theD. magnaassay and this is consistentwith 5.1 ppm observed in this work (Table 2).
Because the principle of the BioToxTM system isquite similar to that of the better known Microtox®
test, and both assays use luminescent marine bacte-ria (although different species), the reproducibilityand susceptibility to systematic error are likely tobe similar for the two test systems. Compared to anEC50 value of about 10 mg l−1 for carbofuran in theBioToxTM test (Table 1), a significantly greater valueof 203±43 mg l−1 (15◦C, 15 min incubation) has beenreported [2] using the Microtox® system, suggestingthat for carbofuran at least the BioToxTM method ismore sensitive. The Microtox® value was for techni-cal grade carbofuran. Carbofuran was the least toxicof the 10 pesticides tested [2]. For all pesticides, theEC50 value was sensitive to the incubation tempera-ture, declining as the temperature was reduced from20 to 10◦C [2]. The maximum change in EC50 was∼60%. At a fixed temperature, the calculated EC50depended also on the length of incubation period.
Table 2Toxicity of pure pesticides using theDaphnia assay
Pesticide EC50 (mg l−1)
Incubation time
24 h test 48 h test
Carbofuran 0.092 0.03Cyromazine 23.59 5.08Formetanate 0.685 0.392
The EC50 values were consistently lower for shorterincubations over the range of 5 to 30 min [2]. Thelatter observation differs with the behavior of theBioToxTM system, as noted earlier.
For carbofuran, EC50 (15◦C, 15 min) reportedby Ruiz et al. [8] using the Microtox® assay was24±2 mg l−1, or about 12% of the value measured byGhosh et al. [2] using the same procedure. The repro-ducibility of the Microtox® test is better than 25%,therefore the discrepancy is not explained by statisti-cal variation alone. Ruiz et al. [8] used relatively pure(>97% pure) standards of pesticides whereas Ghoshet al. [2] used ‘technical grade’. A lower toxicityfor the poorer grade is surprising, but impurities canproduce both synergistic and antagonistic changes toobserved toxicity, as discussed in a later section ofthis paper. Other similar discrepancies in Microtox®
EC50 values (15◦C, 5 min) are noted in Table 3 forseveral pesticides. Obviously, the Microtox® assayand, by analogy, other similar ones are susceptibleto a lot of systematic variation. This could arise forexample, the way the bacterial culture was preparedand the age of the lyophilized culture prior to use.
Table 3Discrepancies in Microtox® EC50 values (15◦C, 5 min) for somepesticides
Pesticide EC50 values (15◦C, 5 min) (mg l−1)
Chang et al. [6] Ruiz et al. [8] Ghosh et al. [2]
Carbaryl 2 0.6 –DDT 7 – 33±4Diazinon 1.7 83.7 –Malathion 10 33.6 –Paraquat 780 2322.7 –

296 A.R. Fernandez-Alba et al. / Analytica Chimica Acta 426 (2001) 289–301
Fig. 5. NADH production rate vs. concentration of formetanate in a representative MitoScanTM assay. The EC50 value was 5.3 ppm.
In contrast to Ghosh et al. [2], Ruiz et al. [8]reported for various pesticides generally higher EC50(15◦C) values for the shorter incubation time (5 min)compared to values at 15 min incubation. This concurswith our observations for the BioToxTM pure com-pound test. As in our work (Table 1), Ruiz et al. [8] didnot see a substantial effect of incubation period on theEC50 value for carbofuran; thus, the values at 5 and15 min incubation differed at most by about 16% [8].
In the MitoScanTM assay, the rate of appearance ofNADH declined as the concentration of the toxicantwas increased in separate vials. Consequently, thespectrophotometric absorption (340 nm) was lowerin vials with greater amounts of pesticides. Plots ofthe rate versus concentration were linear, as shown inFig. 5 for one representative case. From Fig. 5, theEC50 value for formetanate was 5.3 ppm. The purecompound EC50 values obtained with the MitoScanTM
assay were generally consistent with those of theBioToxTM system, as noted in Table 4 where resultsof the three assays are summarized. The MitoScanTM
assay was substantially less sensitive than theD.magnatest system (Table 4).
Unless assays are selected to include biochemicalvariety and complexity, they may produce mutuallyconsistent toxicity values but such values would behighly biased and could not be considered realisticfor practical ecotoxicological purposes. For example,
one study with three bioassays and 10 pesticides notedthat all three assays yielded the same relative orderof toxicities of the compounds, even though the spe-cific EC50 values depended on the test system [2]. Therather similar results were not surprising: all three as-says utilized bacteria; consequently, the biochemicaldiversity was lower than if widely different assay sys-tems had been used.
3.1. Toxicities of mixtures
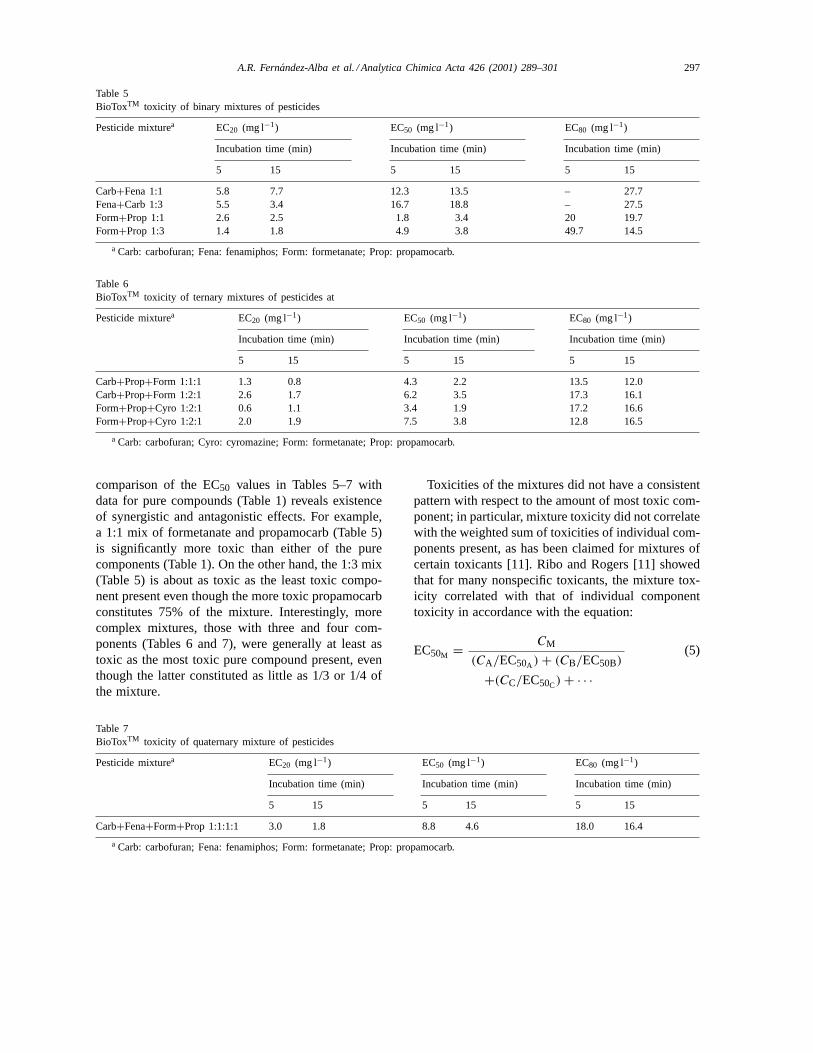
The BioToxTM toxicity data for various binary,ternary, and quaternary mixtures of pesticides arenoted in Tables 5, 6 and 7, respectively. The ratiosof toxicants’ concentrations in mixtures listed inTables 5–7 were based on mass concentrations. A
Table 4Summary of the pure compound EC50 values for the various testsystems
Pesticide EC50 (mg l−1)
Daphnia magna BioToxTM MitoScanTM
24 h test 48 h test 5 min 15 min
Carbofuran 0.092 0.03 9.8 9.6 7.6Cyromazine 23.59 5.08 None None NoneFormetanate 0.685 0.392 4.5 4.5 5.3
A.R. Fernandez-Alba et al. / Analytica Chimica Acta 426 (2001) 289–301 297
Table 5BioToxTM toxicity of binary mixtures of pesticides
Pesticide mixturea EC20 (mg l−1) EC50 (mg l−1) EC80 (mg l−1)
Incubation time (min) Incubation time (min) Incubation time (min)
5 15 5 15 5 15
Carb+Fena 1:1 5.8 7.7 12.3 13.5 – 27.7Fena+Carb 1:3 5.5 3.4 16.7 18.8 – 27.5Form+Prop 1:1 2.6 2.5 1.8 3.4 20 19.7Form+Prop 1:3 1.4 1.8 4.9 3.8 49.7 14.5
a Carb: carbofuran; Fena: fenamiphos; Form: formetanate; Prop: propamocarb.
Table 6BioToxTM toxicity of ternary mixtures of pesticides at
Pesticide mixturea EC20 (mg l−1) EC50 (mg l−1) EC80 (mg l−1)
Incubation time (min) Incubation time (min) Incubation time (min)
5 15 5 15 5 15
Carb+Prop+Form 1:1:1 1.3 0.8 4.3 2.2 13.5 12.0Carb+Prop+Form 1:2:1 2.6 1.7 6.2 3.5 17.3 16.1Form+Prop+Cyro 1:2:1 0.6 1.1 3.4 1.9 17.2 16.6Form+Prop+Cyro 1:2:1 2.0 1.9 7.5 3.8 12.8 16.5
a Carb: carbofuran; Cyro: cyromazine; Form: formetanate; Prop: propamocarb.
comparison of the EC50 values in Tables 5–7 withdata for pure compounds (Table 1) reveals existenceof synergistic and antagonistic effects. For example,a 1:1 mix of formetanate and propamocarb (Table 5)is significantly more toxic than either of the purecomponents (Table 1). On the other hand, the 1:3 mix(Table 5) is about as toxic as the least toxic compo-nent present even though the more toxic propamocarbconstitutes 75% of the mixture. Interestingly, morecomplex mixtures, those with three and four com-ponents (Tables 6 and 7), were generally at least astoxic as the most toxic pure compound present, eventhough the latter constituted as little as 1/3 or 1/4 ofthe mixture.
Table 7BioToxTM toxicity of quaternary mixture of pesticides
Pesticide mixturea EC20 (mg l−1) EC50 (mg l−1) EC80 (mg l−1)
Incubation time (min) Incubation time (min) Incubation time (min)
5 15 5 15 5 15
Carb+Fena+Form+Prop 1:1:1:1 3.0 1.8 8.8 4.6 18.0 16.4
a Carb: carbofuran; Fena: fenamiphos; Form: formetanate; Prop: propamocarb.
Toxicities of the mixtures did not have a consistentpattern with respect to the amount of most toxic com-ponent; in particular, mixture toxicity did not correlatewith the weighted sum of toxicities of individual com-ponents present, as has been claimed for mixtures ofcertain toxicants [11]. Ribo and Rogers [11] showedthat for many nonspecific toxicants, the mixture tox-icity correlated with that of individual componenttoxicity in accordance with the equation:
EC50M = CM
(CA/EC50A ) + (CB/EC50B)
+(CC/EC50C) + · · ·
(5)

298 A.R. Fernandez-Alba et al. / Analytica Chimica Acta 426 (2001) 289–301
Fig. 6. Parity plot of mixture toxicities (BioToxTM assay) predicted with Eq. (5) vs. measured data. Solid line represents exact agreement.
where EC50M is the toxicity of the mixture,C isconcentration (mmol l−1), and subscripts A, B, etc.,denote individual components. All EC50 values inEq. (5) are molar values (mmol l−1). Eq. (5) considersa mixture’s toxicity as a weighted sum of toxicitiesof individual components, with the weighting factorbeing the mole fraction of the component in the mix-ture. As shown in Fig. 6, for the pesticides tested,the toxicities were not additive, hence the mixturetoxicity predicted with Eq. (5) failed to match exper-
Fig. 7. Effects of various concentrations of pure pesticides and binary mixtures on mortality ofDaphnia magna. Concentrations (mg l−1)of pure pesticides are shown above or below each bar. The concentration in any binary mixture was the sum of the concentrations of thetwo pure pesticides for a given group of data.
imental data. For the two ternary mixtures with cy-romazine (Table 6), the estimations of mixture EC50values according to Eq. (5) disregarded the contri-bution of cyromazine. This was satisfactory becausethe concentration of cyromazine in the mixture wassmall compared to its toxicity (EC50>50 ppm), thusthe (C/EC50)cyromazinewas negligibly small comparedto the other terms in the denominator of Eq. (5).As shown in Fig. 6, for most mixtures, the pre-dicted toxicity was substantially greater than actually
A.R. Fernandez-Alba et al. / Analytica Chimica Acta 426 (2001) 289–301 299
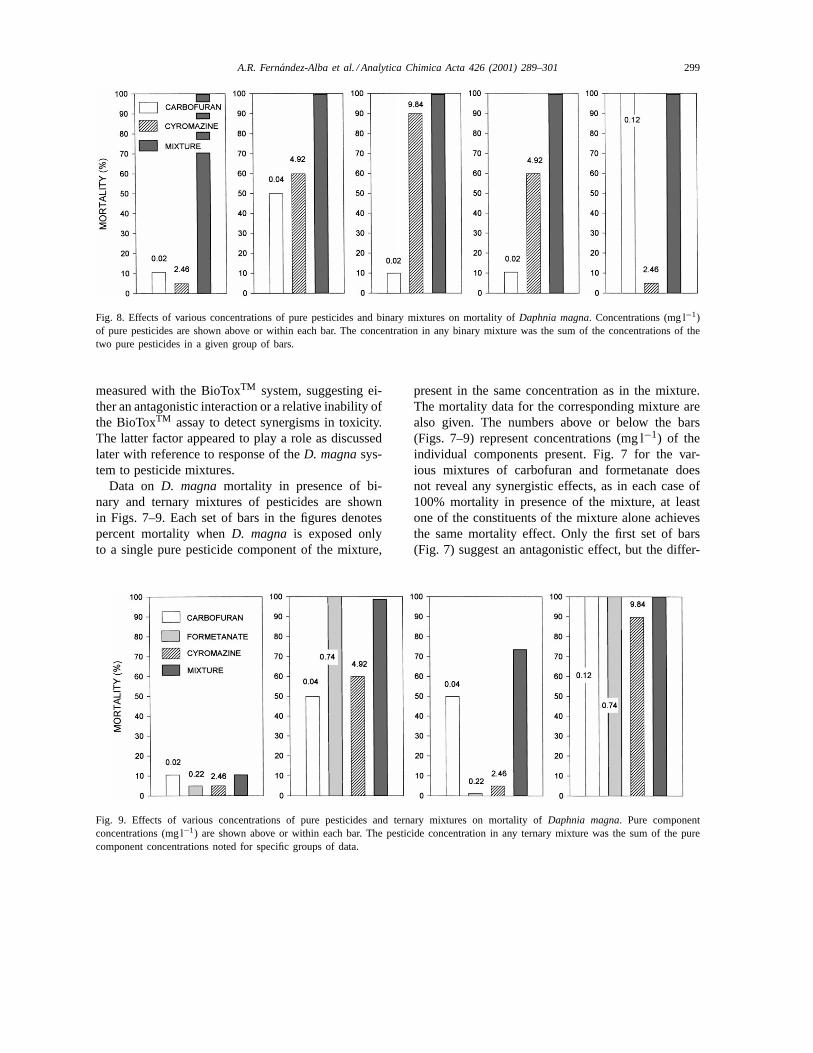
Fig. 8. Effects of various concentrations of pure pesticides and binary mixtures on mortality ofDaphnia magna. Concentrations (mg l−1)of pure pesticides are shown above or within each bar. The concentration in any binary mixture was the sum of the concentrations of thetwo pure pesticides in a given group of bars.
measured with the BioToxTM system, suggesting ei-ther an antagonistic interaction or a relative inability ofthe BioToxTM assay to detect synergisms in toxicity.The latter factor appeared to play a role as discussedlater with reference to response of theD. magnasys-tem to pesticide mixtures.
Data on D. magna mortality in presence of bi-nary and ternary mixtures of pesticides are shownin Figs. 7–9. Each set of bars in the figures denotespercent mortality whenD. magna is exposed onlyto a single pure pesticide component of the mixture,
Fig. 9. Effects of various concentrations of pure pesticides and ternary mixtures on mortality ofDaphnia magna. Pure componentconcentrations (mg l−1) are shown above or within each bar. The pesticide concentration in any ternary mixture was the sum of the purecomponent concentrations noted for specific groups of data.
present in the same concentration as in the mixture.The mortality data for the corresponding mixture arealso given. The numbers above or below the bars(Figs. 7–9) represent concentrations (mg l−1) of theindividual components present. Fig. 7 for the var-ious mixtures of carbofuran and formetanate doesnot reveal any synergistic effects, as in each case of100% mortality in presence of the mixture, at leastone of the constituents of the mixture alone achievesthe same mortality effect. Only the first set of bars(Fig. 7) suggest an antagonistic effect, but the differ-
300 A.R. Fernandez-Alba et al. / Analytica Chimica Acta 426 (2001) 289–301
ences in mortalities are small to argue for such aneffect. However, the situation is quite different withbinary mixtures of carbofuran and cyromazine, asshown in Fig. 8. Certain proportions of carbofuranand cyromazine achieve far greater kill than do themixtures’ constituents singly. A similar substantialenhancement in toxicity is seen in Fig. 9 for theternary mixture containing carbofuran, formetanateand cyromazine in the concentrations of 0.04, 0.22and 2.46 mg l−1, respectively.
The MitoScanTM assay also provided mixture tox-icity values that could not be accounted for as aweighted sum of toxicities of individual componentspresent. The MitoScanTM EC50 values were (in ppm):4.2 for 1:1 mix of formetanate and carbofuran; 16.0for formetanate, cyromazine, and carbofuran (1:1:1);and 7.6 for 1:3:3 mix of formetanate, cyromazine andcarbofuran. No toxicity was detected for a 1:1 mixof carbofuran and cyromazine. The pure componentEC50 values for the same test are noted in Table 4.
4. Concluding remarks
Toxicity is a biological response and this needs to betaken into account in formulating realistic guidelineson acceptable upper limits on pesticide contaminationof wastewater discharges to the environment. Existingdischarge limits such as 1–10 mg l−1 for individualpesticides are arbitrary. As documented here, differentpesticides in mixtures interact to produce synergisticand antagonistic effects on toxic response. To as-sure adequate environmental safeguards, antagonisticeffects must be necessarily disregard in designing dis-charge limits because such effects cannot be predictedfor all possible combinations of components in aneffluent. However, synergistic enhancements in toxic-ity cannot be ignored. Therefore, as a safer dischargepractice, an effluent ought to simultaneously satisfytwo strength criteria with respect to toxicity: 1. Thetotal concentration of the components present shouldremain below a threshold value, e.g. 0.16xiEC50iwherexi is the mole fraction of the componenti inthe mixture and EC50 is its toxicity value; and 2. Thetotal concentration of all toxic constituents shouldnot exceed a certain fraction of the EC50 value forthe mixture. In cases where the components do notinfluence toxic response of other constituents and the
toxicity depends linearly on concentration, criteria 1and 2 converge.
A sound EC50 value to use in establishing the dis-charge limit is one obtained with the well-knownD.magnastandard test procedure. While the BioToxTM
and the MitoScanTM assays are easier to use andfaster, the EC50 values they provide are meaninglessin the context of assessing a toxicant’s impact on thebiosphere. EC50 values from a given test are undoubt-edly useful in assessing relative toxicities of differentsamples tested with the same assay. Also, within lim-its, BioToxTM and MitoScanTM assay results may becorrelated with the EC50 values of theD. magnatest;nevertheless, so far as absolute EC50 values are con-cerned, theD. magnawhole organism assay has nosubstitute. TheD. magnaEC50 values are consistentlyand considerably lower than ones obtained with theother tests.D. magnais sensitive to a great variety oftoxicants and because of its substantially more com-plex biochemistry than the other two test systems,D.magnabetter detects synergisms in toxicity. A com-bination of theD. magnaand the BioToxTM assayscovers a broad range of possible toxic responses; how-ever,D. magnatoxicity indices are more directly rel-evant to toxicity of a compound in higher animals, in-cluding humans and other mammals, marine life, andbirds. MitoScanTM test provides complimentary infor-mation and its broader usefulness needs to be furtherevaluated. The lower sensitivity of the MitoScanTM
and the BioToxTM tests may be compensated for bytheir ease of use and the potential for implementingas portable field devices. In addition, modified testformats with a minicolumn preconcentration step mayimprove toxicity detection threshold of these tests.
Acknowledgements
This study is founded by FEDER Project No.1FD98-428. One of us (M.L. Hernando) acknowl-edges the CICYT for a Ph.D. fellowship.
References
[1] D.M. Ribo, K.L.E. Kaiser, Toxic Assess 2 (1987) 305–323.[2] S.K. Ghosh, P.B. Bhatnagar, V.K. Yadav, S. Derasri, A.
Kulkarni, P.K. Kashyap, Response of three microbial test

A.R. Fernandez-Alba et al. / Analytica Chimica Acta 426 (2001) 289–301 301
systems to pesticides, Bull. Environ. Contam. Toxicol. 58(1997) 482–488.
[3] S.A. Mansour, Perspective on the use ofDaphnidsin aquatictoxicology of pesticides, in: S.A. Mansour (Ed.), Proceedingsof the third Congress of Toxicology in DevelopingCountries, Vol. 1, National Research Council, Cairo, 1996,pp. 43–74.
[4] G.A. Blondin, L.M. Knobeloch, H.W. Read, J.M. Harkin,Mammalian mitochondria as in vitro monitors of waterquality, Bull Environ. Contam. Toxicol. 38 (1987) 467–474.
[5] G.A. Blondin, L.M. Knobeloch, H.W. Read, J.M. Harkin,An in vitro submitochondrial bioassay for predicting acutetoxicity in fish, Aquatic Toxicol. Environ. Fate 11 (1989)551–563.
[6] J.C. Chang, P.B. Taylor, F.R. Leach, Use of the Microtox®
assay system for environmental samples, Bull Environ.Contam. Toxicol. 26 (1981) 150–156.
[7] A.H. Ringwood, M.E. DeLorenzo, P.E. Ross, A.F. Holland,Interpretation of Microtox® solid-phase toxicity tests: theeffects of sediment composition, Environ. Toxicol. Chem. 16(1997) 1135–1140.
[8] M.J. Ruiz, L. López-Jaranillo, M.J. Redondo, G. Font,Toxicity assessment of pesticides using the Microtox test: app-lications to environmental samples, Bull. Environ. Contam.Toxicol. 59 (1997) 619–625.
[9] L.M. Knobeloch, G.A. Blondin, H.W. Read, J.M. Harkin,Assessment of chemical toxicity using mammalian mito-chondrial electron transport particles, Arch. Environ. Contam.Toxicol. 19 (1990) 828–835.
[10] L.M. Knobeloch, G.A. Blondin, J.M. Harkin, Use ofsubmitochondrial particles for prediction of chemical toxicityin man, Environ. Contam. Toxicol. 44 (1990) 661–668.
[11] J.M. Ribo, F. Rogers, Toxicity of mixtures of aquatic conta-minants using the luminescent bacteria bioassay, Toxic.Assess 5 (1990) 135–152.